Embed Size (px)
Citation preview
TESIS DOCTORAL
Firm Strategies behind the Establishment of Licensing Agreements
Autor:
Goretti Cabaleiro Cerviño
Director:
Andrea Fosfuri
DEPARTMENTO DE ECONOMÍA DE LA EMPRESA
Universidad Carlos III de Madrid
Getafe, Abril 2014.
TESIS DOCTORAL
FIRM STRATEGIES BEHIND THE ESTABLISHMENT OF LICENSING AGREEMENTS
Autor: Goretti Cabaleiro
Director: Andrea Fosfuri
Firma del Tribunal Calificador:
Firma
Presidente:
Vocal:
Secretario:
Calificación:
Getafe, de de

I
Acknowledgements
This dissertation is the result of three years of research at the Department of Business
Administration in Universidad Carlos III de Madrid, six months visiting the Department of
Strategy and Innovation in Boston University and other six months visiting the Department of
Management and Technology in Bocconi University.
During my PhD, I was funded by the Spanish Ministry of Science and Innovation and by the
Spanish Ministry of Economy and Competitiveness. I gratefully acknowledge the financial
support from these sources, which made my research, as well my visiting periods, possible.
The people that I thank here are just a few of the many who have helped and encouraged me in making this dissertation possible. Any errors contained herein are mine.
In the first place, I would like to express my most sincere thanks to my advisor Andrea Fosfuri,
who has guided me through the last four years. I am truly grateful to him for believing in my
work, supporting my research enthusiastically, devoting his time and efforts in training me and
also for helping me to overcome academic difficulties as well challenging times. It has been a
real privilege to be his advisee. I cannot imagine a better advisor than the one that I had.
I am also indebted to Marco Giarratana for his guidance. I very much appreciated his insightful
comments on early versions of the papers in this dissertation, his support and his useful advice
regarding the job market process.
Looking a little further back in time, another very important person during my academic
journey has been Professor Maria Jose Freire Serén. She deserves special mention for her
encouragement, understanding and mentoring since I began studying my degree.
I would also like to thank to the Department of Business Administration at Universidad Carlos
III de Madrid. I am very obliged to the valuable faculty members, Eduardo Melero, Neus
Palomeras, Afyer Ali, Jose Marín, Alicia Barroso, Jordi Surroca, David Martinez, Juan Manuel
García, María Gutierrez and Pablo Ruiz for their insightful comments and suggestions on my
dissertation. Also, I want to express my gratitude to María Jose Montes who has guided and
encouraged me during my whole master-PhD period and to Josep Tribó for having provided me
with great help during all these years. I would like to thank Marié, one of the secretaries of the
department, for being so helpful and for making things so much easier when I was abroad. I
would also like to express my deepest gratitude to my colleagues Patricia, Hang, Alberto,
Mariano and Gilberto. During these last six years, we have shared many happy, but also

II
difficult moments, always supporting and caring for each other. I must also thank them for
finding the time to cheer me up whenever I needed it, despite our very busy schedules.
I would like to express my gratitude to the Department of Strategy and Innovation at Boston
University, U.S. In particular, I am specially thankful to Jeffrey Furman for having dealt with
the tedious visa's paperwork, for sharing with me his past experiences and for giving me a lot of
cherished moments to remember. Also, I would like to thank Fernando Suarez and Tim Simcoe
for giving me the possibility to give a seminar there and for their kind hospitality. Finally, I
truly thank the PhD students that I met there: Marketa Sonkova, Diego Zunigo, Cesare Righi
and Jacqueline Kirtley for making everything easier and for helping me so much to integrate in
the department and to enjoy Boston.
In addition, I would like to show my appreciation to the Department of Management and
Technology in Bocconi University, Milan. Specifically, I am very thankful to Marco Giarratana
for dealing with all the paperwork and for his great advice to improve my dissertation as well to
enjoy Italy. Esther Roca also deserves special mention for having helped me so much to
integrate in the department and for listening to me in my lonely days. Finally, I would also like
to thank Maryam Zehtabchi for being so nice and helpful and for having shown me the best
places to eat sweets in Milan.
Furthermore, I would like to thank the professors from University of Vigo: Begoña Álvarez,
Xosé H.Vázquez, Jaime Alonso, Eduardo Ximénez, Fidel Castro, Xulia González, Daniel Miles
and Rosa Loveira for their comments on my dissertation, their support and their trust in my
research capabilities.
I am also grateful to my co-authors Ana Luiza de Araújo Burcharth and Christian Helmers for
being so patient and understanding during the completion of this dissertation. I appreciate all the
comments and suggestions that Christian has made about the preliminary version of my papers
and all the support and positive energy that Ana has given to me. From now, I promise them to
devote more time to our respective projects.
I would like also to thank Juan Santaló, Eduardo Melero and Elena Novelli for accepting to be
part of my PhD committee.
I am also grateful to my non-academic friends Lorena, Olalla, Verónica, Laura, María, Anahí,
and Raquel who have always struggled to understand exactly what I have been doing. I have
really appreciated their positive energy at all times, their understanding of my absence in some
important occasions and for their endless support even across oceans.

I do not have words to express my gratitude to my husband, Gonzalo. He is the person who has
suffered most the consequences of the my PhD: having to move several times, uncertain future,
periods far away from each other, the typical ups and downs of the academic life and their
consequent impact in my mood. Thank you so much for being there, for your patience and
understanding and for giving me the energy and support to finish this dissertation.
Likewise, words are not enough to transmit my gratitude to my family. I thank my parents for
being so supportive, for their caring and their kindness, for always believing in me, for being so
positive regarding my future and for understanding the long periods of absence. I also wish to
thank my brother, Pablo, for sharing with me his engineering computer skills, for his patience
while he was doing it and for his availability to help and listen to me at any moment.
Finally, I want to thank myself for not having given up during these four years and for keeping
the energy and the enthusiasm to continuously challenge myself and to learn more everyday.
Goretti Cabaleiro
8th April, 2014

Contents
Introducción ................................................................................................................................. 1
Introduction ................................................................................................................................. 6
CHAPTER 1 - Licensing Out as a Real Activity to engage in Myopic Management ......... 13
1.1. Introduction .......................................................................................................................... 13
1.2. Theory .................................................................................................................................. 15
1.2.1. Licensing Theory ........................................................................................................... 15
1.2.2. Myopic Management Theory ......................................................................................... 17
1.3. Hypotheses Development ..................................................................................................... 18
1.4. Data, Variables and Methodology ........................................................................................ 20
1.4.1. Sample and data ............................................................................................................ 20
1.4.2.Variables ........................................................................................................................ 21
1.4.3. Methodology .................................................................................................................. 23
1.5. Results .................................................................................................................................. 23
1.6. Summary, Discussion and Conclusion ................................................................................. 28
1.7. References ............................................................................................................................ 32
1.8. Tables ................................................................................................................................... 37
CHAPTER 2 - Understanding the Rent Dissipation Effect in Technology Licensing
Contracts. ................................................................................................................................... 49
2.1. Introduction .......................................................................................................................... 49
2.2. Theory and Hypotheses ........................................................................................................ 53
2.2.1. Licensing ....................................................................................................................... 53
2.2.2. Licensing Out Core Technologies ................................................................................. 56
2.2.3. Licensing Out Core Technologies and Licensee Size .................................................... 58
2.2.4. Technological Overlap between partners .................................................................... 59
2.3. Data, Methodology & Variables .......................................................................................... 62
2.3.1. Sample Selection and Data ............................................................................................ 62
2.3.2. Method ........................................................................................................................... 65
2.3.3. Variables ....................................................................................................................... 66
2.4. Results .................................................................................................................................. 71
2.4.1. Descriptive Statistics ..................................................................................................... 71
2.4.2. Supplementary Analysis ................................................................................................ 73
2.5. Discussion and Conclusions ................................................................................................. 75
2.6. References ............................................................................................................................ 78
2.7. Appendix .............................................................................................................................. 85
2.8. Tables ................................................................................................................................... 86
CHAPTER 3 - Sources of Appropriation Capacity in Licensing Agreements .................... 89
3.1. Introduction .......................................................................................................................... 89
3.2. Theory and Hypotheses Development ................................................................................. 92
3.2.1. Bargaining Power: Cash Constraints ........................................................................... 93
3.2.2. Bargaining Power: Information Asymmetries .............................................................. 94
3.2.3. Costs of Imitation: Leader/ Follower ............................................................................ 96
3.3. Data, Variables and Methodology ........................................................................................ 97
3.3.1. Sample Selection and Data ............................................................................................ 97
3.3.2. Variables ....................................................................................................................... 98
3.3.3. Methodology ................................................................................................................ 101
3.4. Results ................................................................................................................................ 103
3.4.1. Descriptive Statistics and Main Results ...................................................................... 103
3.4.2. Robustness Checks ...................................................................................................... 104
3.4.3. Interaction Effects ....................................................................................................... 105
3.5. Summary and Conclusion .................................................................................................. 106
3.6. References .......................................................................................................................... 110
3.7. Appendix ............................................................................................................................ 119
3.7.1. Figure 1 ............................................................................................................................ 119
3.7.2. Tests ............................................................................................................................. 119
3.8.Tables .................................................................................................................................. 122
1
Introducción
Los contratos de licencia son acuerdos entre empresas a través de los cuales el propietario de la
tecnología (licenciante) permite a otra empresa (licenciatario) producir, vender y utilizar una
tecnología sin transferir su propiedad a cambio de una compensación económica (Granstrand,
1999).
En las últimas dos décadas, los acuerdos de licencia han experimentado un crecimiento sin
precedentes (Kamiyama , Sheehan, y Martínez, 2006; Zuniga y Guellec , 2009). Hoy en día,
representan una de las opciones disponibles más importantes para la transferencia de tecnología
(Anand y Khanna, 2000b; Arora y Fosfuri , 2003) .
Debido a la creciente importancia de los contratos de licencia he considerado que entender sus
determinantes y consecuencias, así como las situaciones en las cuales las empresas tienen más
probabilidades de beneficiarse/salir perjudicadas con su concesión resulta fundamental para
tomar una decisión de licencia informada.
Los acuerdos de licencia se caracterizan por tres peculiaridades que permiten a las empresas
utilizarlas de forma estratégica y que, a la vez, hacen interesante su estudio.
En primer lugar, la mayoría de las veces la concesión de licencias implica un trade-off entre sus
beneficios y sus costes potenciales. Por un lado, la empresa licenciante aumenta sus beneficios
en la cantidad establecida en el contrato (Efecto Beneficio, efecto a corto plazo). Por otro lado,
las empresas licenciantes pueden perder cuota de mercado o ver reducidos sus márgenes de
beneficio debido a la mayor competencia en el mercado del producto creada por el nuevo
licenciatario (Efecto Disipación del Beneficio, efecto a largo plazo) (Arora y Fosfuri, 2003;
Fosfuri, 2006). Por lo tanto, las decisiones de concesión de licencias exigen cautela: requiere
sopesar las ganancias en el corto plazo frente a posibles daños en el largo plazo y sólo conceder
una licencia si el Efecto Beneficio supera el Efecto Disipación del Beneficio. Las empresas que
subestiman los efectos negativos de largo plazo están poniendo sus ventajas competitivas en
riesgo. Un ejemplo que evidencia lo anterior es Hitachi. Antes de 2003, Hitachi era una de las
empresas que más tecnología licenciaba. De hecho, en 2002 la compañía presentó ingresos por
licencias por un valor de 43 millones de yenes japoneses (414.474 dólares1 americanos). Sin
embargo, esta estrategia permitió que sus licenciatarios en China y Corea mejoraran su
tecnología rápidamente, amenazando de ese modo su ventaja competitiva. De esta forma, en el
año 2003, Hitachi se vio obligada a restringir su política de licencias (Kamiyama et al. 2006).
1 Tipo de cambio a 5 de abril, 2014
2
En segundo lugar, los contratos de licencia son privados y confidenciales y las normas contables
no exigen a las empresas reconocer los ingresos por licencias de manera separada en su cuenta
de resultados. De hecho, en la mayoría de los casos, los ingresos por licencias se contabilizan
bajo el nombre de "otros ingresos", lo que hace imposible distinguir el beneficio económico
generado por las mismas. En consecuencia, cuando una empresa recibe ingresos por la
concesión de licencias, los observadores externos sólo perciben un aumento en los ingresos.
Esta incapacidad para identificar de manera inmediata la concesión de licencias proporciona a
las empresas la oportunidad de inflar sus ganancias actuales y de beneficiarse de ellas durante
algún tiempo. Por ejemplo, IBM consiguió retrasar el reconocimiento de su crisis financiera
hasta finales del año 1991 porque llevaban "aumentando" sus ingresos a través de la concesión
de licencias desde 1988 (Teece, 2003).
Por último, los mercados donde se transfiere la tecnología se caracterizan por asimetrías de
información entre las partes, dificultades de negociación, la falta de un mecanismo establecido
para fijar los precios de la tecnología y la incertidumbre sobre la validez y la aplicabilidad de la
tecnología en otra empresa (Arora y Gambardella, 2010). En consecuencia, la mayor parte de
las veces, las partes implicadas en el acuerdo no de manera igualitaria los beneficios totales que
han sido generados. Por lo tanto, el resultado de la negociación dependerá de las características
específicas de la empresas, del sector, y de la industria en la que se firma cada acuerdo de
licencia.
Motivado por la diferente naturaleza de estas características a lo largo de esta tesis he decidido
analizar las estrategias empresariales que podrían estar detrás de la firma de los acuerdos de
licencia. En particular, esta tesis se centra en entender los factores determinantes y las
consecuencias detrás de la concesión de licencias a otras empresas. Durante los tres ensayos, un
tema recurrente ha sido la relación entre la concesión de licencias y los resultados empresariales
(tanto antes como después de su firma). Además, también he tratado de clarificar los factores
que afectan a los beneficios y costes asociados con la decisión de licenciar (licensing trade-off)
y he analizado cómo el poder de negociación del que licencia afecta a sus beneficios obtenidos.
El primer ensayo demuestra de manera empírica que los directivos, bajo la presión de alcanzar
las previsiones de los analistas financieros respecto a los beneficios, firman contratos de
licencias con otras empresas como un medio para aumentar las ganancias a corto plazo. Sin
embargo, como los contratos de licencia implican siempre un trade-off, las empresas que han
aumentado el número de contratos de licencias para aumentar sus beneficios en el corto plazo
(Efecto Beneficio) también ven reducida su cuota de mercado en el largo plazo (Efecto
Disipación del Beneficio). Para testar las hipótesis he utilizado una muestra de 107 empresas
americanas durante el período 1998-2009. Los resultados de este estudio son principalmente
3
tres. En primer lugar, se confirma que las empresas tienen más probabilidades de aumentar la
venta de sus contratos de licencias cuando no fueron capaces de alcanzar las previsiones de los
analistas financieros en el ejercicio anterior. En segundo lugar, se pone en evidencia que las
empresas que han aumentado el número de contratos de licencias con respecto al año anterior,
presentan una cuota de mercado decreciente en los dos años siguientes al de la venta de la
licencia. Finalmente, se muestra que esta tendencia decreciente de la cuota de mercado es más
fuerte para las empresas que habían firmado contratos de licencia y no fueron capaces de
alcanzar las previsiones de los analistas financieros en el año anterior que para las empresas que
han incrementado el número de contratos de licencia y que habían superado el umbral previsto
por los analistas financieros.
El segundo ensayo propone y prueba empíricamente un modelo que explica cómo la concesión
de licencias tecnológicas a otra empresa afecta a la cuota de mercado del licenciante. Mientras
que varios estudios han analizado el llamado “Efecto Disipación del Beneficio”, no hemos
podido encontrar en la literatura ninguna aplicación empírica. Para testar nuestras hipótesis nos
hemos centrado en una muestra de 163 licenciantes dentro de la industria farmacéutica
americana durante el período 1984-2004. Los resultados de este estudio demuestran que las
empresas que conceden licencias de tecnología que pertenecen a la actividad principal de la
empresa experimentan un mayor “Efecto Disipación del Beneficio”. Además hemos demostrado
que esta relación se encuentra moderada por el tamaño del licenciatario (mayor tamaño, mayor
efecto disipación resultante de licenciar tecnología clave) y por la superposición tecnológica
entre el licenciante y el licenciatario (menor superposición, menor efecto disipación resultante
de licenciar tecnología clave).
El tercer ensayo analiza cómo el valor de mercado de las empresas licenciantes varía en el
momento en el que se anuncia un acuerdo de licencia. En este estudio propongo que la
capacidad del licenciante para apropiar beneficios es una función de su poder de negociación
(determinado por su situación financiera y por las asimetrías de información en el momento de
la firma del contrato ) y por el coste potencial de imitación al que se enfrenta tras haber
licenciado (determinado por su posición en el sector). Como el poder de negociación en cada
situación determina el éxito del licenciante a la hora de imponer requisitos, asumo que éste
también debería influir positivamente en la capacidad de apropiación de la empresa en términos
de valor de mercado. Sin embargo, el coste de imitación debería tener un efecto negativo en la
capacidad de apropiación de la empresa licenciante. Para testar las hipótesis de este ensayo me
he centrado en una muestra de 260 acuerdos de licencia que fueron anunciados en prensa
durante el periodo 1998-2009. Los resultados sugieren, en primer lugar que las empresas que
tienen problemas de liquidez en el corto plazo generan un impacto menor en su cotización
bursátil que las empresas que no tienen limitaciones financieras. Además, las empresas
4
licenciantes que firman un contrato de licencia en una situación de reducida asimetría de
información (mismo sector) generan un mayor impacto en el mercado de valores que las
empresas que lo hacen en condiciones donde hay más asimetrías de información (distinto
sector). Finalmente, las empresas licenciantes que son líderes en su sector generan un impacto
menor en bolsa que las que no son líderes (seguidoras).
Con todo lo comentado, las principales contribuciones académicas y prácticas de los tres
ensayos son las siguientes:
El primer ensayo contribuye a la literatura de innovación, demostrando que la presión para
alcanzar las previsiones de los analistas financieros puede ser también un factor que explique la
concesión de contratos de licencia. Asimismo, este estudio también contribuye a la teoría de la
gestión miope de dos maneras. Por un lado, demuestra que la concesión de licencias podría ser
utilizada como una actividad para aumentar los ingresos actuales en detrimento de la reducción
de la cuota de mercado en los años siguientes. Por otro lado, amplia el horizonte temporal de las
actividades miopes, es decir, las actividades que inflan los beneficios en el corto plazo a costa
de los beneficios a largo plazo.. Basándome en la literatura que conozco en este campo, los
investigadores se han centrado en analizar las estrategias que los directivos siguieron en el
período anterior a no alcanzar las previsiones. Sin embargo, este estudio sugiere que los
directivos de las empresas también pueden seguir estrategias que no tienen un efecto inmediato.
Desde un punto de vista práctico, este ensayo menciona varias ideas que las empresas deberían
de tener en cuenta. En primer lugar, advierte de que es necesario educar a los directivos acerca
de las posibles consecuencias a largo plazo de la concesión de licencias. Es importante analizar
la decisión de conceder licencias con precaución, centrándose en los beneficios netos de la
estrategia. Además, sugiere que el diseño de la remuneración de los directivos debería ser
establecido de forma que les motivase a participar en proyectos eficientes en el largo plazo (que
maximicen la suma de los beneficios futuros descontados). Asimismo, los resultados también
ponen en evidencia las consecuencias negativas de una estructura empresarial centralizada. Si
las empresas tuvieran un departamento de licencias independiente que se encargara de tomar
esas decisiones y cuyos incentivos fueran diferentes a los del departamento económico, los
directivos no podrían firmar contratos de licencias sólo para beneficiarse de las ganancias a
corto plazo. Por último, sería necesario que la sociedad meditara acerca de las consecuencias
negativas de imponer un objetivo de ganancias a los directivos. Claramente, esta presión no
permite que los directivos se concentren en estrategias de largo plazo y lo único que consigue es
que se que ponga en juego la productividad de las empresas a largo plazo y, a su vez, la de toda
la sociedad.
5
La principal contribución del segundo ensayo reside en el desarrollo de un modelo respecto a
uno de los supuestos centrales de los mercados de la tecnología (el efecto de disipación del
beneficio), que no ha sido probado de manera empírica. Por otra parte, este ensayo integra ideas
clave de estudios anteriores de una manera novedosa para desarrollar y refrendar las hipótesis.
En primer lugar, nos basamos en la idea de que el efecto de la disipación de los beneficios
tiende a ser mayor para las empresas con activos complementarios en el mercado de productos.
Posteriormente, incorporamos en nuestro modelo el supuesto de que los licenciatarios difieren
en su capacidad para explotar comercialmente la tecnología licenciada afectando, en
consecuencia, al efecto disipación de los licenciantes. En tercer lugar, aplicamos la idea de la
proximidad tecnológica entre las partes contratantes. Igualmente, con el objetivo de superar la
falta de información con respecto a los ingresos generados por cada contrato de licencia, este
estudio propone utilizar la cláusula de “mínimo royalty garantizado” como una proxy para el
“Efecto Beneficio”. Esta cláusula garantiza que la empresa que concede la licencia recibirá
compensación monetaria independientemente de los resultados del licenciatario al explotar la
tecnología.
Finalmente, el último ensayo mejora la comprensión sobre la capacidad de los licenciantes para
apropiar los beneficios resultantes. Mediante el análisis de las situaciones que generan
mayores/menores impactos en el mercado de valores, este estudio ofrece a los directivos una
orientación en sus decisiones estratégicas. En primer lugar, este estudio evidencia que el
mercado de valores responde mejor a una concesión de licencias cuando el licenciante no tiene
problemas de liquidez. En segundo lugar, muestra que el mercado de valores responde mejor a
una decisión de concesión de licencias si el licenciatario pertenece al mismo sector que el
licenciante, pero también que este aumento de la cotización bursátil sólo se produce si el riesgo
de imitación resultante de la concesión de licencias no es demasiado alto. Para los directivos de
las empresas que son líderes de su sector, este estudio revela que la concesión de licencias tiene
un impacto casi inexistente en el mercado de valores. En cambio, este estudio sugiere que los
directivos de las empresas que son seguidoras aumentarán notablemente su valor de mercado si
conceden licencias, especialmente si además pertenece al mismo sector que el licenciatario. Por
último, este ensayo revela que la mejor situación para apropiar los beneficios resultantes de
conceder licencias, en términos de valor de mercado, es licenciar a una empresa que pertenece
al mismo sector, mientras el licenciante sea un seguidor.
6
Introduction
Licensing contracts are agreements between companies through which the owner of the
technology (licensor) allows another company (licensee) to make, sell and use a technology in
exchange of an economic compensation, without transferring its ownership rights (Granstrand,
1999).
Over the last two decades, licensing agreements have experienced an unprecedented growth
(Kamiyama, Sheehan, & Martínez, 2006; Zuniga & Guellec, 2009; Conti et al. 2013).
Nowadays, they represent one of the most important options available to transfer technology
(Anand & Khanna, 2000b; Arora & Fosfuri, 2003).
Due to the increasing importance of the licensing phenomenon, it has become more and more
crucial to understand its determinants and consequences, as well as the contingencies under
which companies are more likely to benefit/lose from licensing. There are three complex
peculiarities that characterize licensing agreements and that make them not only a valuable
strategic tool, but also a challenging endeavor that calls for informed decision.
First of all, most of the times licensing implies a trade off. On one hand, companies expect to
reap benefits by increasing the licensing revenues (Revenue Effect, short term effect). On the
other hand, they might lose market share or suffer from lower price margins because of the
additional competition in the product market created by the new licensee (Rent Dissipation
Effect, long term effect) (Arora & Fosfuri, 2003; Fosfuri, 2006). Therefore, licensing decisions
demand caution to balance short-term earnings against possible long-term harms. Firms that
underestimate the negative effects put their competitive advantages at risk. An example that
puts this argument in evidence is the one of Hitachi. Before 2003, it was one of the companies
that most actively licensed out technologies. It presented licensing revenues of JPY43 billion
(414.474 US dollars2) in 2002. But this aggressive licensing strategy helped licensees in China
and Korea improve their technology rapidly, threatening Hitachi’s competitive advantage. As a
result, Hitachi had to restrict its licensing policy by 2003 (Kamiyama et al. 2006).
Secondly, licensing contracts are private and confidential, and accounting rules do not require
companies to recognize licensing revenues as a separate item in corporate reports. In fact, most
of the times, licensing revenues appear in the income statement under the name “other income”,
what makes difficult to disentangle their economic benefit. In consequence, when a company
7
receives licensing revenues, external observers and stakeholders only perceive an increase in
earnings. The inability to immediately identify licensing practices provides managers with an
opportunity to inflate current earnings and benefit from it for some time. For instance, IBM
delayed the recognition of a crisis until the end 1991 because they were “increasing” earnings
through licensing since 1988 (Teece, 2003).
Finally, markets for technology are characterized by information asymmetries between parties
that lead to incomplete contracts, bargaining difficulties (due to the risk of sharing information
before signing the contract), lack of any established mechanism for pricing technologies and
uncertainty about the validity and applicability of the traded technology (Arora & Gambardella,
2010). As a consequence, most of the times the parties do not equally appropriate the profits
generated by the agreement. The output of any licensing negotiation typically depends on the
specific characteristics of the company, sector, and industry in which it takes place.
Motivated by these complexities, I have decided to focus on the study of the strategies
companies potentially use behind the signing of licensing agreements. This thesis consists of
three essays that aim to understand the determinants and the consequences behind a company’s
decision to license out its intellectual property to other companies. Throughout the three essays,
a recurrent theme is the relationship between licensing strategy and firm performance (both
before and after licensing). Furthermore, I investigate the factors affecting the licensing trade-
off (i.e. the balance between benefits and costs associated with a licensing decision) and how
the licensor’s bargaining power affects the returns from licensing.
The first essay empirically considers whether managers, under the pressure to attain the
analyst’s forecasts, license out intellectual property as a means of increasing short-term
earnings. It also assesses the trade-offs implied in this decision: companies that license out their
technology in order to increase their benefits in the short term (Revenue Effect) are likely to
harm their market share in the long run (Dissipation Effect). The hypotheses have been tested
through the study of a sample of 107 U.S. companies during the period 1998-2009 (1,281
observations). The findings of this study are three-fold. In the first place, results confirm that
companies are more likely to license out their intellectual property when they were not able to
achieve analyst’s forecasts. Secondly, companies that have increased the number of licensing
out contracts with respect to the previous year present a decreasing market share trend in the
following two years. Finally, the decreasing market share’s trend is stronger for companies that
license out their technology and are not able to achieve analyst’s forecasts than for companies
that overcome the earnings threshold.
8
The second essay proposes and tests in an empirical manner a model to explain the effect of
technology licensing on the licensor’s market-share. While several studies have discussed the
so-called dissipation effect related to technology licensing in theoretical terms, few have
examined it empirically. This essay examines this effect on a sample of 163 licensors involved
in licensing contracts within the U.S. pharmaceutical industry during the period of 1984 – 2004.
This study finds that licensing core technologies generates an increase in competition in the
product market, resulting in a rent dissipation for the licensor. In addition, it demonstrates that
this relationship is moderated by the licensee’s size and by the technological overlap between
the licensor and the licensee. The essay thus finds broad support for the theoretical arguments.
The third essay investigates how a licensor’s market value varies at the time it announces a
licensing agreement. It states that licensors’ appropriation capacity (proxied by licensors’
market value) is a function of their bargaining power (determined by their financial situation
and information asymmetries at the time of contract signing) and the potential cost of imitation
faced by licensors (determined by their position in the sector). As bargaining power in each
situation should determine licensors’ success, it should also enhance licensors’ appropriation
capacity in terms of market value. However, the cost of imitation should have a negative effect
on licensors’ appropriation capacity. These hypotheses were tested on a novel dataset that
captures the stock market responses to 260 licensing agreements in press releases over a twelve-
year period: 1998-2009. The results of the event study suggest three key findings: 1) companies
with cash constraints appropriate fewer benefits from licensing than companies that have no
cash flow limitations; 2) companies that license out under low information asymmetries (same
sector) appropriate more benefits from licensing than companies facing high information
asymmetries (different sector) and 3) licensors that are industry leaders achieve fewer benefits
than those that are followers.
Regarding the academic and practical contributions of the thesis, I would like to point out the
following:
The first essay contributes to the innovation literature by extending the range of antecedents and
outcomes of outward licensing. First, it shows that the pressure to achieve analysts’ forecasts is
also a potential determinant of the decision to license-out technology. Second, it provides first
empirical evidence of the negative long-term consequences of licensing (Rent Dissipation
Effect). In addition, it contributes to the Myopic Management Theory in two ways. On one
hand, it demonstrates that licensing out technology could be used as a real activity that increases
current earnings at the expense of reducing market share in the incoming years. On the other, it
amplifies the temporal horizon of the real activities. To the best of my knowledge, researchers
have focused on the strategies that managers took in the period previous to the negative
9
earnings surprise. However, this paper suggests that managers can also follow strategies that do
not have an immediate effect. From a practical point of view, this study gives some insights into
what companies should take into account when designing their technology strategies. It
establishes that it is necessary to educate managers about the potential long-term consequences
of outward licensing. It is important that they analyze the decision to license with caution,
focusing on the net benefits of the strategy. Furthermore, caution is required to the way in which
managerial compensation is established in order to motivate managers to engage in projects that
maximize the sum of discounted future profits. In addition, the results also highlight the
negative consequences of a centralized licensing structure. If companies had an independent
licensing department in charge of making such decisions and whose incentives were different to
those of the economic department, managers could not license out their technology just to
benefit from the inflated current earnings. Finally, this study invites for a critical reflection
about the negative consequences of imposing an earnings target on managers. Clearly, this
pressure does not allow managers to focus on long term strategies, putting at stake the long term
productivity of companies and, in turn, that of the whole society.
The main contribution of the second essay lies in the development of an empirically testable
model concerning one of the central assumptions of the literature on markets for technology (the
dissipation effect), which had not been previously tested against empirical data. Furthermore,
this essay integrates the insights from various theoretical streams in a novel way. First, we draw
on the existing proposition that the dissipation effect tends to be higher for firms with
downstream assets in the product market. Subsequently, we incorporate in our model the aspect
that licensees differ in their capacity to commercially exploit the licensed technology, which
naturally impacts in the licensor’s rent dissipation. Finally, we apply the idea of technological
proximity to conclude that the dissipation effect resulting from licensing out core technologies
will be weaker in a context where the technological overlap between the parties is low.
Furthermore, in an attempt to overcome the lack of information regarding the revenue generated
by each deal, this study proposes to use the minimum guarantee royalty clause as a proxy for the
revenue effect. This clause ensures that the licensor will receive monetary compensation
regardless of licensee’s performance and it is also a way to guarantee that the licensee will not
use the licensing agreement to avoid or delay the introduction of a competitive technology to
the market.
Finally, the last essay improves the understanding of licensors’ appropriation capacity through
an analysis of company, sector, and industry factors. By analyzing the situations that generate
stronger/weaker impacts in the stock market, this study offers managers some guidance in their
strategic decisions. First, this study shows that the stock market responds better to a licensing
decision when the licensor has not cash constraints than when the company is having financial
10
limitations. Second, it evidences that the stock market responds better to a licensing decision if
the licensee belongs to the same sector than the licensor but that this significant stock market
increase occurs only if the risk of imitation resulting from licensing out is not too high. For
managers of firms that are leaders of their sector, this study reveals that the impact of licensing
out on the stock market is almost nonexistent. Consequently, for leading companies, it is better
not to license out unless the licensing payments overcome the potential cost of imitation. On
contrary, this study suggests to the managers of companies that are followers that they will have
a strong impact in the stock market as a consequence of licensing out their technology. Finally,
this essay reveals that the best situation to appropriate benefits in terms of market value is to
license out the technology to a company that belongs to the same sector while being a follower.
References
Anand, B. N. & Khanna, T., 2000b. Do firms learn to create value? The case of alliances. Strategic Management Journal 21(3): 295-315.
Arora, A. & Fosfuri, A., 2003. Licensing the Market for Technology. Journal of Economic Behavior & Organization 52(2): 277.
Arora, A. & Gambardella, A. 2010. Ideas for Rent: an Overview of Markets for Technology. Industrial & Corporate Change 19(3): 775-803.
Conti, R., Gambardella, A. & Novelli, E., 2013. Research on Markets for Inventions and Implications for R&D Allocation Strategies. Academy of Management Annals, 7, 717-774.
Fosfuri, A., 2006. The Licensing Dilemma: Understanding the Determinants of the Rate of Technology Licensing. Strategic Management Journal 27 (12):1141-1158.
Granstrand, O., 1999. The Economics and Management of Intellectual Property: Towards Intellectual Capitalism: Edward Elgar Cheltenham, UK.
Kamiyama, S., Sheehan, J., & Martínez, C., 2006. Valuation and Exploitation of Intellectual Property. OECD Publishing.
Teece, D.J. 2003. Essays in Technology Management and Policy: Selected Papers of David J. Teece. World Scientific.
Zuniga, M. & Guellec, D. 2009. Who Licenses out Patents and Why? Lessons from a Business Survey, STI Working Paper 2009/5.
13
CHAPTER 1 -‐ Licensing Out as a Real Activity to engage in Myopic Management
1.1. Introduction
In the past two decades, licensing agreements have grown at an unprecedented rate, making
their management a core competence issue, especially for high-tech companies (Kamiyama et
al., 2006; Zuniga & Guellec, 2009; Conti et al. 2013). To facilitate knowledge transfers,
companies thus establish licensing departments or publish the technology available for license
online.3 The main reason for these expanded activities is the revenue that licensing generates. In
one survey, 51% of European companies and 53.6% of Japanese companies noted that their
main motivation for licensing out their technology in the previous three years was revenue
(Zuniga & Guellec, 2009). However, licensing has negative effects too; companies might
increase their revenues (net of transaction costs), but they might lose market share or suffer
from lower price margins because of the additional competition in the product market created
by the new licensees (Arora & Fosfuri, 2003; Fosfuri, 2006). Therefore, licensing decisions
demand caution to balance short-term earnings against possible long-term harms. Firms that
underestimate the negative effects put their competitive advantages at risk.4
At the same time, financial analysts exert increasing influences on companies’ strategies,
leading to disproportionate consequences for firms that miss forecasts, even by a small amount.5
In turn, managers face extra pressure and incentives to manipulate current earnings. A survey of
CFO (Graham et al., 2005) reveals that they attend carefully to meeting earnings thresholds and
are willing to inflate current earnings to achieve them, mainly using real activities rather than
accruals.
Motivated by these two seemingly unrelated trends, this article sheds light on the relationship
between a company’s financial situation and its licensing strategy, by examining whether
managers license out technology to inflate current earnings and determining the long-term
3 See, for example, Dow Chemical: http://www.dow.com/licensing/; Kimberly Clark: http://www.merck.com/licensing/home.html; and Merck & Co: http://www.merck.com/licensing/home.html. 4 Before 2003, Hitachi licensed out a lot of technology; in 2002, the company earned licensing revenues of JPY43 billion. But this aggressive licensing strategy helped licensees in China and Korea improve their technology rapidly, threatening Hitachi’s competitive advantage. Thus by 2003, Hitachi chose to restrict its licensing policy (Kamiyama et al. 2006).
5 Oracle’s stock price declined by 29% in December 1997 when it failed to achieve analysts’ forecasts by a mere $.04 (though its results were 4% above EPS for the same quarter in the previous year) (Skinner & Sloan, 2002). Procter & Gamble lost 30% of its stock price when it warned that it would not beat analysts’ forecasts in the first quarter of 2000. A similar warning before the second quarter led to another 10% reduction in the stock price, as well as the CFO’s dismissal (Duncan, 2001).
14
consequences for companies that make licensing decisions in response to the pressure to meet
analysts’ forecast. Managers who feel pressured to attain analysts’ forecasts have incentives to
inflate current earnings and thus likely engage in myopic management. These myopic managers
put more emphasis on the short term than the long run, such that when they make their licensing
decisions, myopic managers likely overestimate the revenue (short-term) effect while
underestimating the dissipation (long-term) effect. Such overestimates are common, as
exemplified in a declaration by Daniel M. McGavock, the managing director of the intellectual
property consulting firm Intercap: “On one hand, you don’t want to abandon your patents’
ability to exclude competitors from your market. But, on the other hand, you could be talking
about hundreds of millions of dollars in new revenue from strategic licensing, not to mention a
host of strategic benefits” (Kline, 2003, p.90 ). This distortion leads managers, already under
pressure to inflate short-term earnings, to license out more technology than is optimal, offer
inappropriate technology, or accept inappropriate conditions, all of which may have negative
long-term consequences.
The tests of these predictions rely on a panel of 107 U.S. high-tech companies during 1998–
2009 (1,281 observations). The licensing data came from four sources: Prompt Database,
Google, Highbeam Research, and SDC Platinum. Through an extensive search, I identified
1,729 licensing agreements,6 including 840 licensing in, 716 licensing out, and 173 cross
licensing contracts. Following Bushee (1998), I estimated a logit model to explain the
probability of increasing the number of licensing out contracts from period t – 1 to period t,
using as the main independent variable a dummy that captures whether the company achieved
analysts’ forecasts in t – 1. These results show that companies tend to license out their
intellectual property when they failed to achieve analysts’ forecasts in the previous year.
In addition, I created five different groups and compared the market share evolution of each
group for two years after licensing out, versus the market share evolution of the rest of the
sample. When companies increased the number of their licensing out contracts compared with
the previous year, they suffered decreasing market share trends in the following two years. This
decreasing market share trend was stronger among companies that licensed out their technology
and still failed to achieve analysts’ forecast than it was among companies that licensed out and
thereby achieved the earnings threshold. However, the market share decrease is independent of
companies’ financial situation.
With these findings, this study contributes to innovation literature that examines the strategic
drivers of technology licensing. Prior research cites economic and strategic motivations for
licensing (Gallini, 1984; Katz & Shapiro, 1985; Rockett, 1990; Shepard, 1987); I show that the
6 Only 154 licensing agreements were collected from SDC Platinum during the period of study for this sample.
15
pressure to achieve analysts’ forecasts is another potential determinant. In relation to myopic
management theory, I also propose a new activity that can inflate current earnings. Prior
research had identified other activities that managers adopt to engage in myopic management
(Aaker, 1991; Chapman & Steenburgh, 2009; Moorman & Spencer, 2008; Roychowdhury,
2006); the present study shows that licensing out technology offers a real activity that increases
current earnings, at the expense of reducing market share in subsequent years.
The next section thus presents the theoretical background for myopic management and
licensing. Section 2 develops the hypotheses; Section 3 describes the methodological analysis.
After discussing the results in Section 4, I conclude in Section 5.
1.2. Theory
Previous research into markets for technology has shown that licensing agreements have
increased remarkably in recent decades, mainly due to the revenue they generate (Gambardella
et al., 2007; Robbins, 2009; Zuniga & Guellec, 2009). Myopic management literature also has
demonstrated that the severe consequences of missing analysts’ forecasts have altered the way
managers run companies: They are short-term minded and have incentives to manipulate
earnings, even at the expense of long-term performance (Degeorge et al. 1999; Graham et al.
2005; Mizik, 2010). The combination of these two apparently unrelated trends suggests that
licensing out offers a real activity used to inflate current earnings and achieve analysts’
forecasts, despite its negative long-term consequences in terms of market share.
1.2.1. Licensing Theory
Modern companies have moved from protecting their knowledge completely to licensing it
(Vishwasrao, 2004; Yanagisawa & Guellec, 2009). Licensing represents a critical route for
technology transfer, and companies increasingly seek efficient corporate structures that can
facilitate such knowledge transfer (Arora et al., 2013). Yet the most important motivation for
licensing out technology is the revenue it generates, equal to the present value of the fixed fee or
the royalties that licensees pay to the licensor. Gambardella et al. (2007), Robbins (2009), and
Zuniga and Guellec (2009) confirm that earnings revenue is the main motivation for companies
that license-out technology.
However, the importance of licensing revenues actually depends on two features. First,
transaction costs could make licensing less profitable. In general, licensing contracts are
distinguished by high search costs, incurred as the firm searches for suitable licensees and/or
licensors, as well as information asymmetries between parties that lead to incomplete contracts,
16
bargaining difficulties reflecting the risk of sharing information before signing the contract, and
a lack of any established mechanism for pricing technologies. Second, the rent profit dissipation
effect seemingly could overwhelm licensing revenues and even produce negative long-term
consequences for the company licensing out the technology. Through licensing, licensors grant
access to secrets about their technology and allow licensees to use it. By internalizing and
understanding how the licensed technology works, licensees can invent around the technology,
imitate licensors, and compete directly with them in the product market, which would reduce
the licensor’s market share and price–cost margin. The rent profit dissipation effect reflects the
reduction in the licensor’s benefits, as a consequence of additional competition in the product
market created by the licensee (Arora & Fosfuri, 2003; Fosfuri, 2006). To really generate
benefits from licensing, companies thus should license their technology if the revenue effect
(net of transaction costs) is greater than the rent profit dissipation effect.
To limit the extent of the latter effect, previous research suggests licensing out technology based
on scientific knowledge (Arora & Gambardella, 1994), intellectual property related to non-core
technologies and targeted toward geographically separated markets (Granstrand et al. 1997), and
intellectual property that refers to general technologies (Bresnahan & Gambardella, 1998), as
well as when patent protections are strong (Arora & Ceccagnoli, 2006; Cohen et al., 2000),
competition in the product market is high (Arora & Fosfuri, 2003), and the firm’s market share
is small (Fosfuri, 2006). However, additional competition is nearly always a threat for a
company (Fosfuri, 2006).
Prior research has also suggested some strategic incentives for licensing. Gallini (1984)
demonstrates that licensing can lead to technology leadership, because if an established
company licenses out its technology to potential entrants, it reduces their incentives to develop
their own, potentially competing technology. Shapiro (1985) further argue that licensing can
support collusive agreements. If the licensor chooses an appropriate royalty rate for the licensee,
prices increase and can stimulate the formation of a cartel (Shapiro, 2001). Farrel and Gallini
(1988) also note that licensing might establish a second source mechanism and thus encourage
purchase. If the new technology is complex and produced by only one company, potential
buyers may be reluctant to buy it, for fear that the company cannot fully meet demand. Finally,
Rockett (1990) shows that through licensing, a company can choose its competitors. If an
established firm licenses its technology to a weak rival, it can crowd the market and block entry
by a stronger competitor.
17
1.2.2. Myopic Management Theory
Effective management requires a long-term focus, prioritizing projects that generate the greatest
net present value (Mizik, 2010). However, the importance the market grants to current earnings
forces managers to adopt strategies that result in immediate pay-offs (Dechow, 1994; Degeorge
et al., 1999). Usually managers’ compensation and evaluations are based on the company’s
current stock price (Mizik, 2010), which in turn depends on whether the firm achieves three
earnings benchmarks: zero earnings, prior comparable period’s earnings, or analysts’ forecasts
(Degeorge et al., 1999). The pressure to meet these thresholds gives managers incentives to
manipulate their results to inflate current earnings. The pressure even has changed the
distribution of earnings reported: Few firms report losses, and the majority cite small profits
(Dechow et al., 2003). In a survey conducted by Graham et al. (2005), financial executives
declared that to avoid negative surprises, they were willing to inflate current earnings and
preferred to do so through real activities rather than accruals. The objective of both strategies is
to inflate current earnings, but the implications and costs differ greatly. Manipulating
discretionary accruals aims to adjust the time at which the firm realizes its earnings, not to
modify the quantity or temporal flow of profits. Real activities instead entail engaging in
myopic management, which means undertaking activities to inflate current earnings at the
expense of long-term firm value. Managers prefer to manipulate earnings through real activities
for two main reasons. First, auditors can detect accrual earnings management more easily than
real activities manipulation, in that “While auditors can second-guess the firm’s accounting
policies, they cannot readily challenge real economic actions to meet earnings targets that are
taken in the ordinary course of business” (Graham et al., 2005, p. 17). Second, inflating
earnings with accrual manipulation alone is risky, because the amount of potential manipulation
after the end of the fiscal period is limited: “If reported income falls below the threshold and all
accrual based strategies to meet it are exhausted, managers are left with no options because real
activities cannot be adjusted at or after the end of the fiscal reporting period” (Cohen &
Zarowin, 2010, p. 7). Therefore, to inflate current earnings and meet analysts’ forecast,
managers use the “safest” method, but also the one that can lead to more negative consequences
in the long run.
Prior research on myopic management mainly concentrates on ways to reduce R&D
investments and which factors determine this practice. In particular, managers reduce their
R&D expenditures when they cannot ensure positive earnings for the next year (Baber et al.,
1991), when their retirement is impending (Cheng, 2004; Dechow & Sloan, 1991), when
institutional ownership is not very high (Bushee, 1998), and when managers must repurchase
stock to avoid dilution of their earnings per share (Bens et al. 2002, 2003). But managers also
18
engage in other real activities to increase short-term earnings. As Aaker (1991) shows,
companies reduce their marketing expenditures to inflate their profits temporarily; Cohen and
Zarowin (2010) specify that managers reduce their advertising spending. Bartov (1993) and
Herrmann et al. (2003) also find managers who sell fixed assets strategically, to benefit from
acquisition cost principles. Jackson and Wilcox (2000) cite examples of managers who provide
sale price reductions in fourth quarters, whereas Hribar et al. (2006) note firms that use stock
repurchases. According to Roychowdhury (2006), managers use price discounts and zero
financing strategies, overproduce and reduce their discretionary expenses. Moorman and
Spencer (2008) show that managers delay the introduction of innovations; Dechow and
Shakespeare, (2009) find that companies record securitizations as collateralized borrowings at
the end of the month.
Despite such established evidence of myopic management practices, few studies quantify their
financial impacts. Pauwels (2004) finds that sales promotions imply negative long-term effects
for firm value, and Gunny (2005) links myopic practices to lower returns on assets in the
subsequent year. In Mizik and Jacobson’s (2007) study, two years after reducing their
marketing expenditures, companies suffered negative earnings, such that by the fifth year, their
market value had fallen by 25%. Mizik (2010) similarly notes that companies that have reduced
their marketing expenditures suffer greater negative abnormal returns in the future than other
companies. Chapman and Steenburgh (2009) also show that companies can use marketing to
increase quarterly net income by up to 5% but that this strategy will invoke a 7.5% reduction of
the next period quarterly net income. Such evidence emphasizes the trade-off associated with
myopic management: The use of real activities increases short-term earnings and helps
managers beat analysts’ forecasts but also has negative long-term consequences for firm
performance.
1.3. Hypotheses Development
As financial analysts become more influential and the consequences of missing forecasts grow
more severe for companies (Skinner & Sloan, 2002), managers willingly engage in inefficient
projects that threaten long-term firm performance but also help them avoid reductions in stock
prices, keep their job, and enhance their reputation (Degeorge et al., 1999). Licensing out could
be one such inefficient project, because companies must balance the increased revenue against
the profit-dissipation effect. However, when managers confront pressures to beat analysts’
forecasts, they likely place more emphasis on the short term and inflate current earnings at the
expense of long-term performance.
19
Stein (1989) argues that for managers interested in manipulating short-term earnings, the easiest
method is to reduce intangible asset expenditures, which are not separately recorded in the
balance sheet and do not relate directly to production. These two characteristics also apply for
licensing agreements. Usually, contracts are private and confidential, and accounting rules do
not require companies to recognize licensing revenues as a separate item in corporate reports.
When a company receives licensing revenues, external observers only perceive an increase in
earnings; they cannot know if the reported earnings offer a valid proxy of future performance or
if the earnings actually are coming at the expense of future profits. Licensing out intellectual
property also does not affect short-term production. Even if companies license out their core
technology to competitors, it takes time before they can observe any reduction in market share.
This inability to identify licensing out practices immediately provides managers with an
opportunity to inflate current earnings and benefit from it for some time.
Therefore, companies under pressure to beat analysts’ forecasts likely overestimate the revenue
effect and fail to make an efficient licensing decision. This distortion leads to licensing out more
technology, without accounting for the negative long-term consequences. In other words, at the
margin, licensing decisions that would not be undertaken in normal conditions seem attractive
to managers under pressure, because they discount the future more.
H1. Companies are more likely to license out their intellectual property when they failed to
achieve analysts’ forecasts in the previous year.
Many researchers have studied motivations to license out technology, but few focus on its
consequences. Theoretically, researchers agree on the existence of a negative, long-term,
dissipation effect (Arora & Fosfuri, 2003; Gambardella et al., 2007; Zuniga & Guellec, 2009),
though it has never been proven empirically. In general though, when companies license out
their technology, they increase competition in the market and put their reputation at stake, with
the risk of eroding market share and price margins (Arora & Fosfuri, 2003; Fosfuri, 2006). Prior
research had proposed some strategies to limit this profit-dissipation effect (Arora & Fosfuri,
2003; Granstrand et al., 1997), but additional competition is inherently a threat to a company
(Fosfuri, 2006).
Although licensing out might imply some negative consequences per se, companies that
undertake the decision under pressure likely face even stronger consequences than other
companies. That is, companies that increased their licensing out agreements in response to
pressures to meet analysts’ forecast suffer a greater market share reduction than companies that
did not.
20
H2. Companies that have increased the number of licensing out contracts in a pressurized
situation experience a stronger reduction in their market share in subsequent years than
companies that have increased the number of licensing out contracts but not because of
earnings pressure.
1.4. Data, Variables and Methodology
1.4.1. Sample and data
The empirical analysis is based on a sample of innovative U.S. companies. First, I focused on
companies with many patents granted through the U.S. Patent and Trademark Office (USPTO)
during 1990–2009.7 Licensing is not an established practice for all companies and sectors, but
because the main objective of this study is to analyze if companies license out their technology
to inflate current earnings, I focus on 140 companies that possess the raw material (i.e.,
technological assets) to undertake such actions. Second, because of their rich information
environment and the size of their market for technology, I narrowed the sample to U.S.
companies. Licensing data is difficult to find, but this search process would be even more
challenging in countries with inaccessible information about companies or small markets for
technology. Third, I used annual data; many companies present quarterly losses, because of the
intrinsic seasonality of their business, but I focus on yearly analysts’ forecasts, which impose
more pressure on managers, giving them more incentive to manage earnings.
The licensing data came from four sources: Prompt database, HighBeam Research, Google, and
SDC Platinum. The first three sources use press news; the latter is an established licensing
database. In Prompt, Google News, and HighBeam Research, I looked for licensing agreements
through a keyword search for “licensing agreement” and the company name. In Prompt and
HighBeam Research, I read all the resulting news; in Google I checked them until the twentieth
page of results. After reading the news, I codified the agreements as “licensing out,” “licensing
in,” or “cross licensing.” Next, I matched these licensing agreements with those that I obtained
from SCD Platinum. The final output was 1,729 licensing agreements: 840 license in, 716
license out, and 173 cross-licensing agreements. Finally, I matched the licensing data with
7 I choose this nearly 20-year period in accordance with the normal length of a granted patent. If the USPTO granted a patent to a company in 1990, it would still be valid at the end of the study period.

21
Compustat financial data and analysts’ forecast data from DataStream. These matches reduced
the sample to 107 companies (1,281 observations8).
1.4.2.Variables
Dependent variable: increased licensing out
The dependent variable (INCLICOUT) is binary, equal to 1 if the firm increases its number of
licensing contracts relative to the prior year and 0 if the firm maintains or decreases this
number. Considering the distribution of the variable and its low variation, a binary approach can
better capture the discrete change in the variable rather than a magnitude change. It also is
unlikely that the magnitude of the change in the number of licensing agreements is a linear
function of the difference between actual earnings per share and analysts’ forecast earnings per
share. Finally, the magnitude of the change is somewhat meaningless for this study: A company
increasing its licensing contracts by x + 4 does not necessarily inflate its current benefits more
than a company that increases the number of licensing out contracts by just x + 1.
Independent variable: earnings pressure
The independent variable (EARNINGS_PRESSURE) is an indicator, equal to 1 if the company
did not beat analysts’ forecasts in the previous year (or reaches exactly the same results the
analysts predict) and 0 if the company surpassed analysts’ forecasts in the previous year. To
develop this variable, I first calculated the difference between the actual earnings per share and
the mean of the consensus of analysts’ forecasts during the fiscal year, before the results
presentation. If this difference equaled 0 or was negative, managers experience more pressure to
attain analysts’ forecasts in the following year. I also created a dummy variable that equals 1 if
the difference between the actual earnings per share and the mean of the consensus of analysts’
forecast is null or negative, and 0 otherwise. The consequences of missing analysts’ forecasts
have become disproportionately severe, so an important distinction refers to achieving versus
not achieving them.
Next, I measured earnings pressure in the previous year, because writing and executing a
reliable licensing contract takes time. If a company wants to license out its technology, it must
find an interested licensee, understand that licensee’s technological base, figure out how to
implement its technology, and negotiate in a context marked by asymmetric information, lack of
experience, and technology that is difficult to describe or value. Establishing a licensing
contract is not an easy task; as Razgaitis (2004) shows, 75% of the companies that want to
license out their technology could not find licensees, and Gambardella et al. (2007) finds that 8 1,281 = 105 companies × 12-year period +1 company × 11-year period + 1 company × 10-year period.
22
7% of the technologies available remain unlicensed. Patenting companies also acknowledge that
they would like to license out more but that it is difficult to achieve a successful licensing
agreement (Zuniga & Guellec, 2009). According to Ali (2012), once licensing negotiations have
begun, only 75% of companies successfully sign a contract. Thus licensing contracts as a real
activity likely do not have immediate impacts on earnings. In addition, managers use multiple
activities to inflate current earnings. When they first realize that they will fail to meet analysts’
forecast, they use strategies that immediately inflate short-term earnings, such as decreasing
R&D expenditures or offering price discounts. When these options become quickly exhausted,
managers then turn to other activities for the next year. I anticipate that managers use licensing
out to inflate current earnings after they have realized that immediate real activities are not
enough to help them reach analysts’ forecasts.
Control variables
In line with previous literature regarding myopic management, I define INCCL as a dummy
variable that reflects the change in the current liabilities (CL) with respect to the prior year. This
variable equals 1 if current liabilities9 increase with respect to the previous year and 0
otherwise. When the ability to pay creditors and other short-term liabilities are at stake,
managers worry more about the negative reactions of suppliers. Following Roychowdhury
(2006), I thus expect that companies that increase (decrease) their liabilities with short-term
suppliers sense more (less) incentive to increase the number of licensing agreements they enter
to inflate current earnings. Next, I include INCGO, a dummy variable that reflects the change in
the company’s growth opportunities (GO) with respect to the previous year. This variable
equals 1 if opportunities for growth increase from the previous year and 0 otherwise. Similar to
Skinner and Sloan (2002), Hribar and Jenkins (2004), and Roychowdhury (2006), I define this
variable as the ratio between the market value of equity10 and the book value of equity.11
Companies with more opportunities for growth suffer greater punishments from financial
markets if they fail to meet their objectives and likely have more incentives to increase their
licensing out contracts to inflate their short-term earnings.
To control for accumulated innovation capabilities, I use INCACCPATGR, a binary variable that
reflects the change in the number of patents granted to a company compared with the previous
year. Accumulated patents granted (ACCPATGR) is the number of patents accumulated over the
years, at a depreciation rate equal to 15%. This variable equals 1 if the number of patents has
increased over time and 0 otherwise. Companies with more accumulated patents seemingly
should license out more technology.
9 Compustat item 5. 10 Compustat item 199 × Compustat item 25. 11 Compustat item 60 × Compustat item 25.
23
To control for company size, I followed Bushee (1998) and used the logarithm of market value
(LOGMV).12 In general, size proxies for the amount of information available about the firm and
the likelihood that it faces cash constraints. Larger companies may have fewer opportunities to
manage their earnings, because of the richer information environment and the relative lack of
cash flow shortages. That is, large companies should license out less technology. To account for
economic fluctuations, I include INCGDPUS as a dummy variable that reflects the change in
the U.S. gross domestic product (GDPUS) with respect to the previous year, equal to 1 if U.S.
GDP increased from the previous year and 0 otherwise.13 As Bushee (1998) indicates, changes
in GDP suggest growth in the overall economy and can proxy for increases in the level of
technological progress. If GDP is increasing (decreasing), firms thus should have more (fewer)
opportunities to license out their technology. In addition, I created seven sector dummy
variables (SIC), six of which correspond to common SIC2 codes in the data and a seventh that
represents the rest of the SIC2 codes. Table 3 provides a detailed description. Finally YEART
corresponds to the year trend.
1.4.3. Methodology
To test the first hypothesis, I used a pooled logit model and estimated the effect of earnings
pressure on the probability of increasing the number of licensing agreements; I also corrected
for correlations among observations by clustering the standard errors at the firm level. For H2, I
compared the market share evolution of several groups in two subsequent years with the
remainder of the sample: (1) companies that increased their number of licensing out agreements
but still were not able to achieve analysts’ forecasts from the previous year, (2) companies that
increased their number of licensing out contracts and thus achieved analysts’ forecasts, (3)
companies that did not increase their number of licensing out contracts and still achieved
analysts’ forecasts, (4) companies that did not increase their number of licensing out contracts
and were not able to achieve analysts’ forecasts, and (5) companies that had not achieved
analysts’ forecasts in previous years.
1.5. Results
Table 1 shows the main descriptive statistics and correlations. To offer deeper information, I
report the variables in this table as levels, not binary variables. Thus companies establish an
average of 0.502 licensing out contracts per year and are involved in a maximum of 13 licensing
out contracts.
12 The results remained invariant when using the logarithm of the number of employees. 13 I tested for multicollinearity between the INGGDPUSA and YEART and found none.
24
[Insert Table 1 around here]
Tables 2 and 3 contain more detailed information about the licensing out contracts entered into
by companies in the sample. In particular, Table 2 shows that most firms (73.77%) did not
participate in any licensing out contracts; 10.62% engage in fewer than six per year. This
finding corroborates the view of markets for technology as underdeveloped (Arora &
Gambardella, 2010; Gambardella et al. 2007). Table 3 also provides evidence that companies in
the electronic & other electrical equipment, machinery, and chemical & allied products
industries license out more technology, such that 22.33% of the contracts in the sample refer to
electronic companies, 19.59% belong to machinery firms, and 14.05% come from the chemical
industry.
[Insert Table 2 and Table 3 around here]
Tables 4 and 5 contain descriptions of the differences between actual earnings per share and the
mean of analysts’ forecasts in the year before the result presentation. To clarify the distribution
of the variable, I report it as a level and not as a binary variable. In Table 4, 55.89% of
companies achieve positive results; 44.11% report losses. Table 5 shows that companies that
surpass analysts’ forecasts report maximum earnings per share that are 4.82 points higher than
the threshold; companies that fail to beat them report maximum earnings per share that are 13.7
points lower. Similarly, Dechow et al. (2003) report that many firms report small profits and
only a few admit losses.
[Insert Table 4 and Table 5 around here]
I also divided the sample into four categories, according to whether they (1) increased their
licensing out contracts with respect to the previous year and (2) achieved analysts’ forecasts in
the previous year. As Table 6 shows, the percentage of companies that increased their number
of licensing out contracts was greater among the group of companies that did not attain
analysts’ forecasts in the previous year (29.3%) than among companies that had met them
(23.10%).
[Insert Table 6 around here]
The pooled logit regression in Table 7 includes the baseline Model 1 with only control variables
and Model 2 with the earnings pressure variable. The interpretation of these logit coefficients is
not straightforward, so in Table 8 I report the corresponding marginal effects, evaluated at the
sample mean, and their standard errors. For example, in support of H1, Model 2 indicates that
greater earning pressure in the previous year leads companies to increase the number of
licensing out contracts, according to the positive, significant (at 1% level) coefficient of
25
earnings pressure. The probability of licensing out increases from 22.75% (no earnings
pressure) to 29.66% (earnings pressure).14 The introduction of this variable also increases the
pseudo R2 value, from 0.117 to 0.128.
[Insert Table 7 and Table 8 around here]
Most control variables are significantly associated with the probability of greater licensing out.
Increasing current liabilities (INCCL) with respect to the previous year relates positively to the
probability of increasing the number of licensing out contracts, consistent with Roychowdhury’s
(2006) findings that when liabilities with short-term suppliers increase, managers have
incentives to engage in myopic management. Increasing growth opportunities (INCGO) also
relates positively to the probability of increasing licensing out contracts, in accordance with
Skinner and Sloan’s (2004) findings that companies with more growth opportunities have more
myopic management incentives. Contrary to Bushee’s (1999) findings though, the logarithm of
market value (LOGMV) relates positively and significantly to the probability of increasing
licensing-out contracts.15 That is, companies with more market value likely increase the number
of licensing out contracts they enter. Gross domestic product (INCGDPUSA) showed a positive
relation with the probability of licensing out; when GDP is increasing, companies probably
license out their technology. Finally, licensing out increases over time, corroborating the
evidence that licensing has increased in recent years.
As a robustness check I also applied two alternative methods. First, the results of the conditional
logit model remained significant when I used a binary variable (Table 9). Second, when I
included the magnitude of the change in the number of licensing agreements as the dependent
variable, the earnings pressure variable was significant, according to the ordinary least squares
method (Table 10).16
[Insert Table 9 and Table 10 around here]
To corroborate previous findings (Bushee, 1998) and check the validity of proxy for earnings
pressure, I next ran a pooled logit regression with “decrease R&D intensity” as the dependent
variable. The only difference with the “increase licensing out” regression is that I measured
earnings pressure in the current year. When managers suspect that they will fail to reach
earnings thresholds, they often begin by cutting discretionary expenses (Mizik, 2010; Stein,
1989). Because cutting R&D expenditures has an immediate effect on earnings, I expect that
14 The marginal effect after applying the logit model is 0.2275; the discrete change in EARNINGSPRESSURE from 0 to 1 is equal to 0.06909. 15 If I use the logarithm of the number of employees as a proxy of size, the association is still positive. The coefficient is 0.127 in Model 1 and 0.133 in Model 2. 16 The earnings pressure variable also was significant in the fixed effect model. This regression is available on request.
26
managers decrease R&D intensity to inflate current earnings and meet analysts’ forecast. That
is, they likely cut R&D before failing to meet analyst’ forecasts.
Table 11 reports the coefficients that result from the logit regression; to facilitate their
interpretation, Table 12 presents their marginal effects. These tables reveal that earnings
pressure is positive and significant at the 5% level. The probability of decreasing R&D intensity
increases by 0.0636 when I introduce the earnings pressure variable. That is, the probability that
managers decrease R&D intensity jumps, from 45.6% to 52%. This analysis suggest two main
findings: The proxy for earnings pressure is a appropriate measure to capture the pressure faced
by managers, and reducing R&D intensity and increasing licensing out have different temporal
effects, so managers might use both to inflate current earnings and improve the financial
appearance of the firm.
[Insert Table 11 and Table 12 around here]
The main objective of my second hypothesis was to determine the market share evolution of
companies that face earnings pressure and, in response, increased their number of licensing out
contracts. Therefore, I distinguished observations in the sample that satisfy these two conditions
(SUSPECT) from all other firms (NO_SUSPECT). Table 13 details the differences between
these two subsamples, including the size of the companies, their investments in R&D, and their
financial situations. This table thus reveals several insights: (1) suspect firms are larger on
average than no suspect ones; (2) suspect firms invest more in R&D and have more patents
available to license; (3) suspect firms establish 5 licensing out agreements at a maximum,
whereas no suspect firms establish 13 at a maximum; (4) suspect firms have lower mean market
value, book value, earnings before interest and taxes, total assets, net income, returns on assets,
returns on earnings, returns on investments, common equity, cash flow from operations, and
long-term debt than no suspect firms; and (5) suspect firms are characterized by higher mean
current liabilities and short-term debt than no suspect ones. This description matches prior
findings that show that larger companies invest more in own research and engage in less
licensing out (i.e., with their higher market share, the profit dissipation effect would be worse
for them). The no suspect firms enjoy a better financial situation, higher market value, and more
cash flow from operations; suspect companies confront more short-term liabilities.
[Insert Table 13 around here]
Using these distinctions, I compared the evolution of market shares17 for both subsamples over
the subsequent two years, after the firms licensed out and increased the number of licensing out
17 To compute market shares, I identified each sector by three-digit SIC code. The DECREASEMARKETSHARE dummy variable equals 1 if the market share decreased from the previous year and 0 otherwise.
27
contracts. As Table 14 shows, the percentage of no suspect observations that decreased their
market shares was constant over the study period (57%), but it increased among the group of
suspect companies (from 52% to 61%). In period t, suspect companies performed better than no
suspect firms, such that 52% of suspect companies suffered decreased market shares, whereas
57% of the no suspect firms did. In period t + 1, suspect companies began to perform worse
than no suspect ones though, with market shares of 58.6% versus 57.1%. Finally, in period t +
2, suspect firms suffered much worse performance than no suspect ones: 61% of suspect
companies lost market share, but only 57% of no suspect companies did so.
[Insert Table 14 around here]
To detail the evolution of market share in subsequent years, I distinguished several groups.
First, I compared the evolution of market share for companies that increased the number of
licensing out contracts and achieved analysts’ forecasts in previous year (INC_NOPRESSURE
= 1) with the rest of the sample. As Table 15 shows, the percentage of observations with
decreased market share grew over the three-year period (44.44% to 52.87%), whereas this trend
remained quite stable (58%) for the rest of the sample. Second, I compared the evolution of the
market share of companies that had not increased their number of licensing out contracts and
still achieved analysts’ forecasts (NOINC_NOPRESSURE = 1) with the rest of the sample. In
Table 16, the percentage of observations with decreased market share in the focal group was
stable during the three-year period (58%), but it increased slightly (55.28% to 57.29%) among
the rest of the sample. Third, I compared the market share evolution for companies that had not
increased their number of licensing out contracts and also did not achieve the analysts’ forecasts
(NOINC_PRESSURE = 1) with the rest of the sample. In Table 17, the percentage of
observations in the group with lower market share in the three-year period fell (60.91% to
57.62%), whereas the trend was slightly increasing for the rest of the sample (54.86% to
57.79%). Fourth, to analyze if the decreasing trend in market share stemmed from financial
problems, not the increase of licensing out contracts, I compared the evolution of market shares
for companies that were not and those that were able to achieve analysts’ forecasts. Table 18
shows that the percentage of observations with decreased market share was stable and similar
for both groups (57% for companies that met analysts’ forecast and 58% for the ones that did
not).
From these comparisons, I can extract several conclusions. Companies with more licensing out
contracts, compared with the previous year, suffer a decreasing market share trend in the
subsequent two years, independent of whether their decision was made under pressure or not.
This finding reflects the conventional wisdom that additional competition in the product market
always can pose a threat (Fosfuri, 2006). However, this reduction in the market share does not
28
necessarily mean that managers failed to make an efficient decision; it could be compensated
for by revenue effects. Furthermore, the percentage of observations with decreased market share
is greater (8% over three years) for companies that license out technology and still could not
achieve analysts’ forecasts than for companies that reached their earnings threshold. In line with
H2, companies that increased their number of licensing out agreements under pressure
experienced a greater reduction in their market share in the following years compared with
companies that did not. The decrease of market share was independent of companies’ previous
financial situation though; it was unrelated to their meeting or not meeting analysts’ forecasts.
Thus I can eliminate the potential argument that the decrease in the market share is a
consequence of the company’s existing financial situation, rather than a negative consequence
of licensing out. Figure 1 presents the main results regarding the evolution of market share over
two subsequent years.
[Insert Figure 1 around here]
1.6. Summary, Discussion and Conclusion
The main objective of this study was to shed light on the relationship between the company
financial’s situation and its licensing strategy. In recent years, financial analysts have changed
the way managers run their businesses. The consequences of failing to meet analysts’
expectations have been so severe that managers increasingly focus on the short term, with
greater creativity, such that they employ real activities to inflate current earnings, even if those
activities come at the expense of long-term firm performance (Aaker, 1991; Bartov, 1993;
Herrmann et al., 2003; Moorman & Spencer, 2008; Roychowdhury, 2006). As its main
contribution, this article proposes that licensing out technology is one such creative, real
activity. On the one hand, licensing out technology increases current benefits for companies by
enhancing their licensing revenues (net of transaction costs); on the other hand, these companies
could suffer from reduced market share or price margins, because they increase competition in
the product market. By definition myopic managers emphasize the short term (revenue effect)
rather than the long term (dissipation effect), so I predicted that managers under pressure to beat
analysts’ forecasts would license out their technology, overestimating the revenue effect. Stein
(1989) argues that for managers interested in inflating short-term earnings, the easiest method is
to reduce intangible asset expenditures, which are not separately recorded in balance sheets and
do not relate directly to production. Licensing out technology satisfies these conditions too.
Companies are not obligated to record licensing revenues separately, nor do they affect
production in the short term. Licensing out intellectual property thus could provide managers
29
with opportunities to inflate current earnings and take advantage of them for some period. But
companies that engage in such practices eventually will face negative consequences.
To begin my study, I predicted that managers would be more likely to increase the number of
licensing out contracts when they failed to attain analysts’ forecasts in the previous year and
that companies that did so also would face greater market share reductions in subsequent years
than companies that did not. The tests of these two hypotheses relied on a panel of 107 U.S.
companies over a twelve-year period (1,281 observations). My results confirm the hypotheses
and also align with previous findings that show that managers decrease R&D expenditures
when they suspect that they will not be able to achieve earnings thresholds in the next period
(Bushee, 1998).
This study contributes to innovation literature by revealing that pressure to achieve analysts’
forecasts is a potential determinant of licensing out technology; it also offers the first empirical
test of the negative long-term consequences of licensing out (dissipation effect). Furthermore,
this research contributes to myopic management theory by showing that licensing out
technology constitutes a real activity that increases current earnings, at the expense of market
share in subsequent years. Moreover, this activity takes place over a different temporal horizon.
Previous researchers have focused on managerial strategies adopted in the period previous to
negative earnings surprises; my investigation suggests that managers also adopt strategies that
do not have immediate effects.
Several limitations of this study also emerge. With regard to the proxy for earnings pressure,
based on whether companies failed to meet analysts’ forecasts in the previous year, I
acknowledge that it is not very precise. An ideal measure would reveal the exact moment
managers realize that they will not meet analysts’ forecasts, which is when they start deciding
whether and how to inflate current earnings. In addition, firms that miss analysts’ forecast might
have been manipulating their results and dealing with financial difficulties for some time. It is
thus impossible to determine exactly when companies decide to behave myopically and
differentiate their real from their inflated earnings. In addition, in terms of the licensing data, I
suspect that most licensing contracts relate to a patent (i.e., patent protection encourages
licensing), but I cannot confirm this prediction; the agreements also might entail know-how,
copyrights, or trade secrets. Furthermore, I noted any increase in the number of licensing out
agreements, without specific information about each contract. Suspect companies were those
that missed analysts’ forecasts in the previous year and also increased their number of licensing
contracts, but I could not confirm that the contracts related to a core technology, involved direct
competitors, or featured parties operating in the same geographical area, for example. The test
of H2 also included some imprecision: The results reflect a comparison of market share
30
evolutions over a three-year period. The lack of significant results in the regression might stem
from a couple of causes. First, the companies in the sample are large and diversified, and even
though I identified the main sector in which each company operated (three-digit SIC code), I
could not specify the exact sector in which the technology was applied, which makes it difficult
to capture the dissipation effect. Second, I lacked information about the stage of the licensed
technology when the company licensed it. The dissipation effect thus might arise in the next two
years, or a longer period might be required. Finally, the results cannot generalize to all
companies without further confirmation. Licensing out is not a common practice in all
industries. Instead, the companies in this sample all (1) have intellectual assets that they can
trade in markets for technology, (2) belong to industries in which licensing agreements are
relatively common, (3) operate in the most developed environment (U.S.) for markets for
technology, and (4) operate in a country where analysts’ forecasts impose great pressure. The
results cannot apply to companies that do not match these descriptions.
Further research could add to the data presented here regarding the economic conditions of
licensing contracts. For example, myopic management might be measured by the fixed fee and
royalties. I expect that firms engaged in myopic management establish greater fixed fees and
lower royalties than optimal, to borrow earnings from the future. It also would be interesting to
identify specific subsectors in which technology gets applied or the technological proximity
between companies. Such an analysis could reveal precautions that managers might take to limit
the dissipation extent. Companies that confront earnings pressure likely license out technology
to other companies operating in the same subsector or that are technologically similar. Another
extension might identify the investors of each company. Institutional investors (e.g., banks,
insurance companies, pension funds) act as traders more than owners and are very sensitive to
negative news. I thus expect a stronger propensity to license out technology when the investors
are institutional investors. Finally, an interesting direction for further research is the application
of grant-back clauses in licensing contracts, which require licensees to disclose and transfer all
improvements in the licensed technology back to the licensor. These provisions limit the
dissipation effect and should motivate companies to license out technology, but licensees tend
to try to avoid them. Because companies that face pressure to meet earnings benchmarks need to
conclude negotiations quickly, they might not insist on grant-back clauses.
This article also offers practical insights for companies. First, managers need to learn about the
potential long-term consequences of licensing, so that they can analyze their licensing decision
carefully and with consideration of the net harms and benefits. Second, managerial
compensation plans should encourage managers to undertake projects that maximize discounted
future profits, rather than immediate results. Third, a centralized licensing structure might be
helpful; companies with an independent licensing department, with incentives that differ from

31
those motivating managers, can prevent managers from simply licensing out technology to
benefit from inflated current earnings. Fourth, for society in general, it would be beneficial to
mitigate the negative consequences of imposing earnings pressures on managers. This pressure
prevents managers from focusing on long-term strategies, such that it puts firms’ survival at risk
and thus may limit the level of productivity in society as a whole.
32
1.7. References
Aaker, D., 1991. Managing Brand Equity: Capitalizing on the Value of a Brand Name. New
York: The Free Press
Ali, A., 2012. Buyer Behavior in Markets for Technology: Technology Proximity Between Firm
Portfolio and In-Licensed Patents. In From Idea to Product: Translating Knowledge
between the Lab and the Clinic. http://nrs.harvard.edu/urn3:HUL.InstRepos:9547938
Arora, A. & Ceccagnoli, M., 2006. Patent Protection, Complementary Assets, and Firms’
Incentives for Technology Licensing. Management Science 52: 293-308.
Arora, A. & Fosfuri, A., 2003. Licensing the Market for Technology. Journal of Economics
Behavior & Organization 52: 277-295.
Arora, A., Fosfuri, A., & Ronde, T., 2013. Managing Licensing in a Market for Technology.
Management Science, 59(5): 1092-1106.
Arora, A., & Gambardella, A., 1994. The Changing Technology of Technical Change: General
and Abstract Knowledge and the Division of Innovative Labour. Research Policy 23:
523-532.
Arora, A. & Gambardella, A., 2010. Ideas for Rent: An Overview of Markets for Technology.
Industrial and Corporate Change 19 (3): 775-803.
Baber, W.R., Fairfield, P.M., & Haggard, J.A., 1991. The Effect of Concern about Reported
Income on Discretionary Spending Decisions: the Case of Research and Development.
Accounting Review 66: 818–829.
Bartov, E., 1993. The Timing of Assets Sales and Earnings Manipulation. Accounting Review
68 (4): 840-855.
Bens, D., Nagar, V., & Franco Wong, M.H., 2002. Real Investment Implications of Employee
Stock Option Exercises. Journal of Accounting Research 40, 359-393.
Bens, D., Nagar, V., Skinner, D.J., & Franco Wong, M.H., 2003. Employee Stock Options, EPS
Dilution and Stock Repurchases. Journal of Accounting and Economics 36: 51-90.
33
Bresnahan, T. & Gambardella, A.,1998. The Division of Inventive Labor and the Extent of the
Market. In Helpman, E. (ed.) General Purpose Technologies and Economic Growth,
Cambridge, MA: MIT Press.
Bushee, B.J., 1998. The Influence of Institutional Investors on Myopic R&D Investment
Behavior. Accounting Review 73 (3):305-333.
Chapman, C. & Steenburgh, T., 2009. An Investigation of Earnings Management Through
Marketing Actions. Harvard Business School Working Paper, No. 08-073.
Cheng, S., 2004. R&D Expenditures and CEO Compensation. Accounting Review 79 (2): 305-
328.
Chesbrough, H. W. 2003. Open Innovation : The New Imperative for Creating and Profiting
from Technology. Boston, Mass.: Harvard Business School Press.
Cohen, W.M., Nelson, R.R. & Walsh, J.P., 2000. Protecting Their Intellectual Assets:
Appropriability Conditions and Why U.S. Manufacturing Firms Patent (or Not). NBER
Working Paper No.7552: 1-50.
Cohen, D.A. and Zarowin, P., 2010. Accrual-Based and Real Earnings Management Activities
Around Seasoned Equity Offerings. Journal of Accounting and Economics 50(1):2-19.
Conti, R., Gambardella, A. & Novelli, E., 2013. Research on Markets for Inventions and Implications for R&D Allocation Strategies. Academy of Management Annals, 7, 717-774.
Dechow, P. & Sloan, R., 1991. Executive Incentives & the Horizon Problem: An Empirical
Investigation. Journal of Accounting & Economics 14 (1): 51-89.
Dechow, P.M., 1994. Accounting Earnings and Cash Flows as Measures of Firm Performance.
The Role of Accounting Accruals. Journal of Accounting and Economics 18: 3-42.
Dechow, P.M., Richardson, S.A., & Tuna, I., 2003. Why Are Earnings Kinky? An Examination
of the Earnings Management Explanation. Review of Accounting Studies 8: 355-384.
Dechow, P.M. & Shakespear,C., 2009. Do Managers Time Securitization Transactions to
Obtain Accounting Benefits? The Accounting Review 84(1):99-132.
Degeorge, F., Patel, J., & Zeckhauser, R., 1999. Earnings Management to Exceed Thresholds.
Journal of Business 72 (1):1-33.
Duncan, J.R., 2001. Twenty Pressures to Manage Earnings. CPA Journal 71 (1): 33.
34
Farrel, J. & Gallini, N., 1988. Second-Sourcing as a Commitment: Monopoly Incentives to
Attract Competition. Quarterly Journal of Economics 103 (4): 673-694.
Fosfuri, A., 2006. The Licensing Dilemma: Understanding the Determinants of the Rate of
Technology Licensing. Strategic Management Journal 27 (12): 1141-1158.
Gallini, N., 1984. Deterrence by Market Sharing: A Strategic Incentive for Licensing. American
Economic Review 74 (5): 930-941.
Gambardella, A., Giuri, P., & Luzzi, A., 2007. The Market for Patents in Europe. Research
Policy 36(8):1163-1183
Graham, J.R., Harvey, C.R., & Rajgopal, S., 2005. The Economic Implications of Corporate
Financial Reporting. Journal of Accounting and Economics 40 (1-3): 3–73.
Granstrand, O., Patel, P., & Pavitt, K., 1997. Multi Technology Corporations: Why They Have
“Distributed” Rather than “Distinctive Core” Competencies? California Management
Review 39 (4):8-25.
Gunny, K., 2005. What Are the Consequences of Real Earnings Management? Working Paper,
University of Colorado at Boulder.
Herrmann, T., T. Inoue, & W. B. Thomas., 2003. The Sale of Assets to Manage Earnings in
Japan. Journal of Accounting Research 41 (1): 89–108.
Hribar, P. & Jenkins, N.T., 2004. The Effect of Accounting Restatements on Earnings Revisions
and the Estimated Cost of Capital. Review of Accounting Studies 9 (2-3): 337-356.
Hribar, P., Jenkins, N.T. and Johnson, W.B., 2006. Stock Repurchases as an Earnings
Management Device. Journal of Accounting and Economics 41(1-2):3-27.
Jackson, S., & W. Wilcox, 2000. Do Managers Grant Sales Price Reductions to Avoid Losses
and Declines in Earnings and Sales? Quarterly Journal of Business and Economics 39
(4): 3-20.
Kamiyama, S., J. Sheehan, & C. Martinez, 2006. Valuation and Exploitation of Intellectual
Property, OECD Science, Technology and Industry Working Papers, 2006/2005,
OECD Publishing.
Katz, M. & Shapiro, C., 1985. On the Licensing of Innovations. RAND Journal of Economics
16 (4):504-520.
35
Kline, D., 2003. Sharing the Corporate Crown Jewels. MIT Sloan Management Review Spring,
44 (3):89-94.
Mizik, N., 2010. The Theory and Practice of Myopic Management. Journal of Marketing
Research 47(4): 594-611.
Mizik, N. & Jacobson, R., 2007. Myopic Marketing Management: Evidence of the Phenomenon
and Its Long-Term Performance Consequences in the SEO Context. Marketing Science
26 (3): 361-379.
Moorman, C. & Spencer, F., 2008. Firm Innovation and the Ratchet Effect: How Firms Trade
Off Value Creation in Financial and Products Markets. MSI, “Marketing Meets Wall
Street,” 8-116.
Pauwels, K., 2004. How Dynamic Consumer Response, Competitor Response, Company
Support, and Company Inertia Shape Long-Term Marketing Effectiveness. Marketing
Science 23 (4): 596-610.
Razgaitis, R., 2004. U.S./ Canadian Licensing In 2005- Survey Results. Licensing Foundation of
Les (USA and Canada). Les Nouvelles.
Robbins, 2009. Measuring Payments for the Supply and Use of Intellectual Property. NBER
Chapter in NBER Book International Trade in Services and Intangibles in the Era of
Globalization, 139-171.
Rockett, K., 1990. Choosing the Competition and Patent Licensing. RAND Journal of
Economics 21: 161–171.
Roychowdhury, S., 2006. Earnings Management Though Real Activities Manipulation. Journal
of Accounting and Economics 42: 335-370.
Shapiro, C., 1985. Patent Licensing and R&D Rivalry. American Economic Review 75 (2): 25-
30.
Shapiro, C., 2001. Navigating the Patent Thicket: Cross Licenses, Patent Pools, and Standard
Setting. Innovation Policy and the Economy 1: 119-150.
Shepard, A., 1987. Licensing to Enhance Demand for New Technologies. RAND Journal of
Economics, 18(3):360-368.
36
Skinner, D.J. & Sloan, R.G., 2002. Earnings Surprises, Growth Expectations and Stock
Returns: Don’t Let an Earnings Torpedo Sink Your Portfolio. Review of Accounting
Studies 7: 289-312.
Stein, J., 1989. Efficient Capital Markets, Inefficient Firms: A Model of Myopic Corporate
Behavior. Quarterly Journal of Economics 104: 655-669.
Vishwasrao, S., 2007. Royalties vs. Fees: How Do Firms Pay for Foreign Technology?
International Journal of Industrial Organization 25: 741-759.
Yanagisawa,T. & Guellec, D. 2009. The Emerging Patent Marketplace. OECD Science,
Technology and Industry Working Papers. 2009/09. OCDE Publishing.
Zuniga M.P. & Guellec, D. 2009. Who Licenses Out Patents and Why? Lessons From a
Business Survey. STI Working Paper 2009/5. Statistical Analysis of Science,
Technology and Industry.
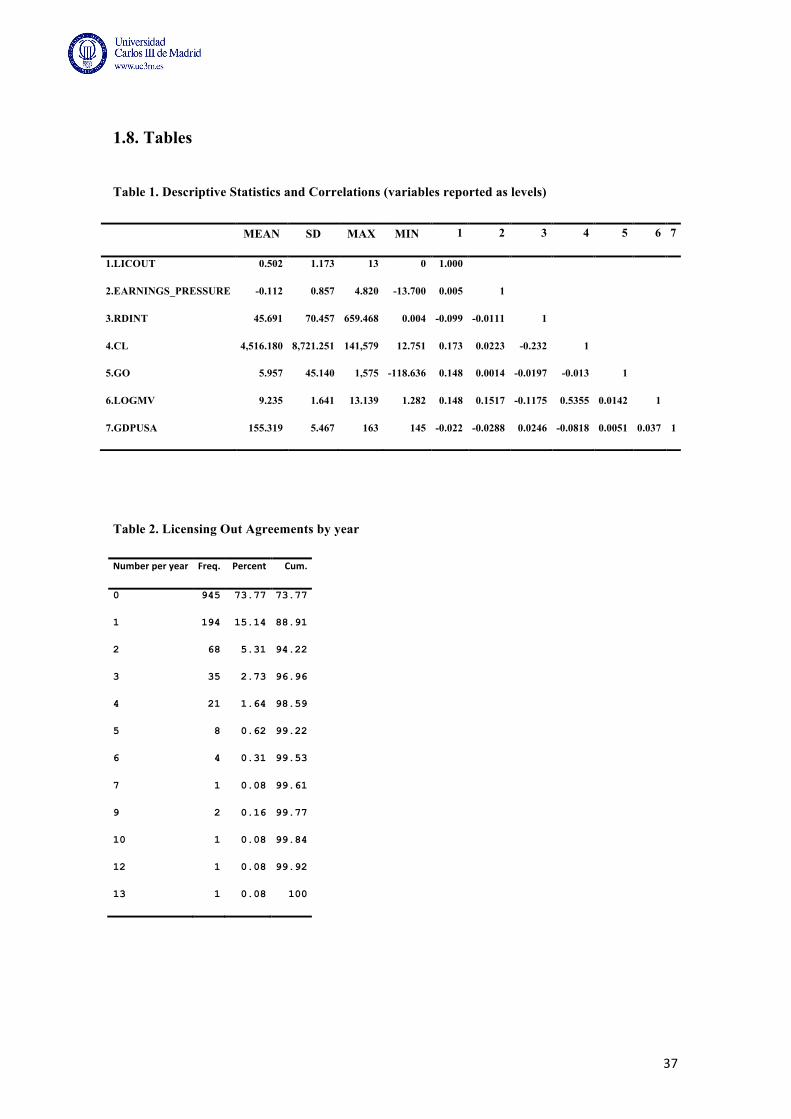
37
1.8. Tables
Table 1. Descriptive Statistics and Correlations (variables reported as levels)
Table 2. Licensing Out Agreements by year
Number per year Freq. Percent Cum.
0 945 73.77 73.77
1 194 15.14 88.91
2 68 5.31 94.22
3 35 2.73 96.96
4 21 1.64 98.59
5 8 0.62 99.22
6 4 0.31 99.53
7 1 0.08 99.61
9 2 0.16 99.77
10 1 0.08 99.84
12 1 0.08 99.92
13 1 0.08 100
MEAN SD MAX MIN 1 2 3 4 5 6 7
1.LICOUT 0.502 1.173 13 0 1.000
2.EARNINGS_PRESSURE -0.112 0.857 4.820 -13.700 0.005 1
3.RDINT 45.691 70.457 659.468 0.004 -0.099 -0.0111 1
4.CL 4,516.180 8,721.251 141,579 12.751 0.173 0.0223 -0.232 1
5.GO 5.957 45.140 1,575 -118.636 0.148 0.0014 -0.0197 -0.013 1
6.LOGMV 9.235 1.641 13.139 1.282 0.148 0.1517 -0.1175 0.5355 0.0142 1
7.GDPUSA 155.319 5.467 163 145 -0.022 -0.0288 0.0246 -0.0818 0.0051 0.037 1
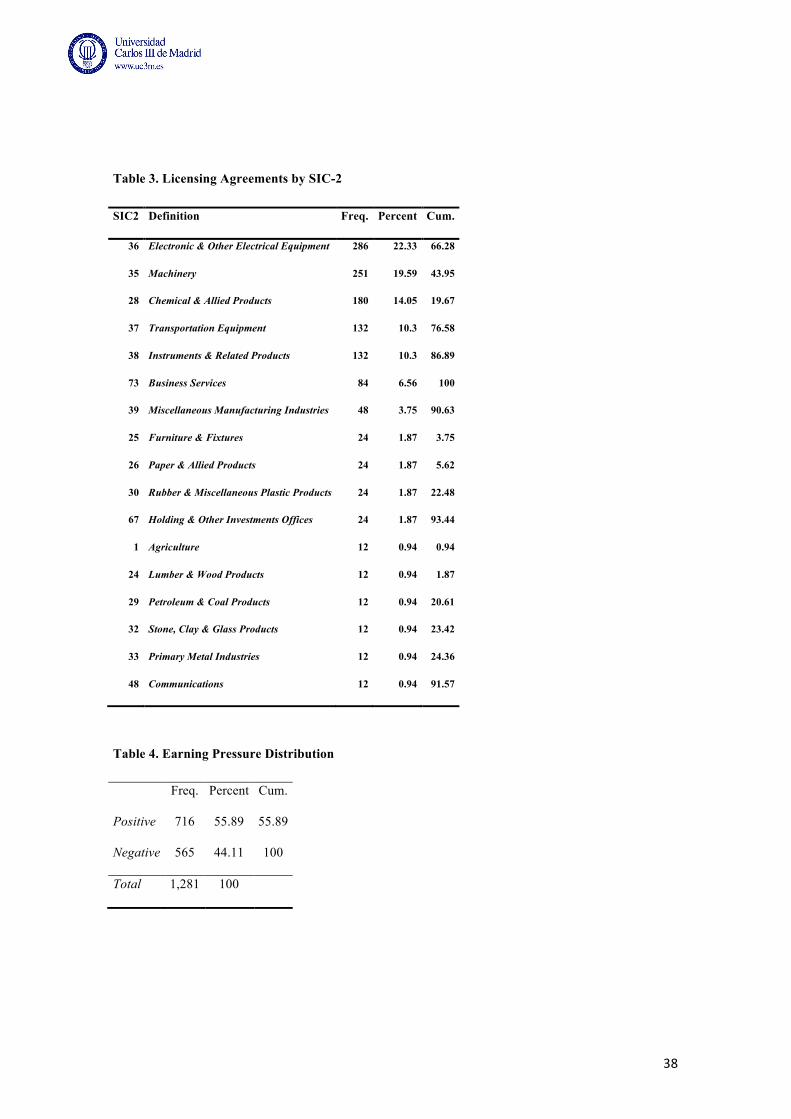
38
Table 3. Licensing Agreements by SIC-2
SIC2 Definition Freq. Percent Cum.
36 Electronic & Other Electrical Equipment 286 22.33 66.28
35 Machinery 251 19.59 43.95
28 Chemical & Allied Products 180 14.05 19.67
37 Transportation Equipment 132 10.3 76.58
38 Instruments & Related Products 132 10.3 86.89
73 Business Services 84 6.56 100
39 Miscellaneous Manufacturing Industries 48 3.75 90.63
25 Furniture & Fixtures 24 1.87 3.75
26 Paper & Allied Products 24 1.87 5.62
30 Rubber & Miscellaneous Plastic Products 24 1.87 22.48
67 Holding & Other Investments Offices 24 1.87 93.44
1 Agriculture 12 0.94 0.94
24 Lumber & Wood Products 12 0.94 1.87
29 Petroleum & Coal Products 12 0.94 20.61
32 Stone, Clay & Glass Products 12 0.94 23.42
33 Primary Metal Industries 12 0.94 24.36
48 Communications 12 0.94 91.57
Table 4. Earning Pressure Distribution
Freq. Percent Cum.
Positive 716 55.89 55.89
Negative 565 44.11 100
Total 1,281 100
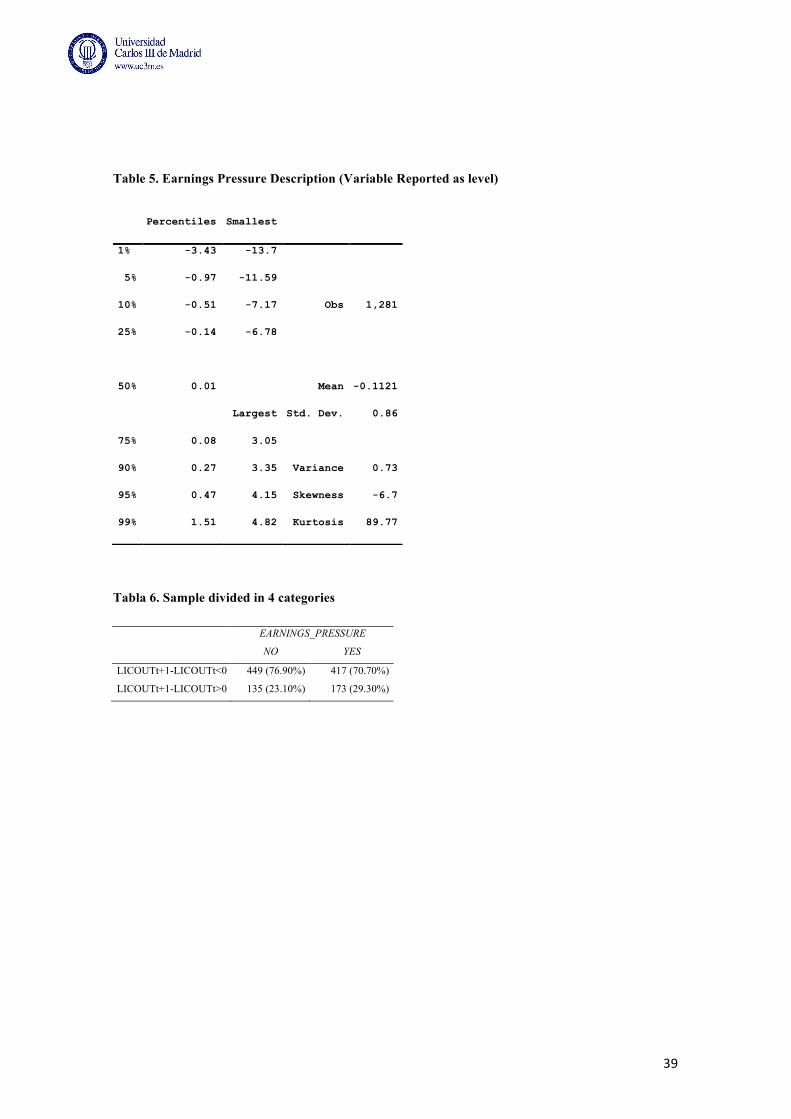
39
Table 5. Earnings Pressure Description (Variable Reported as level)
Tabla 6. Sample divided in 4 categories
EARNINGS_PRESSURE
NO YES
LICOUTt+1-LICOUTt<0 449 (76.90%) 417 (70.70%)
LICOUTt+1-LICOUTt>0 135 (23.10%) 173 (29.30%)
Percentiles Smallest
1% -3.43 -13.7
5% -0.97 -11.59
10% -0.51 -7.17 Obs 1,281
25% -0.14 -6.78
50% 0.01 Mean -0.1121
Largest Std. Dev. 0.86
75% 0.08 3.05
90% 0.27 3.35 Variance 0.73
95% 0.47 4.15 Skewness -6.7
99% 1.51 4.82 Kurtosis 89.77
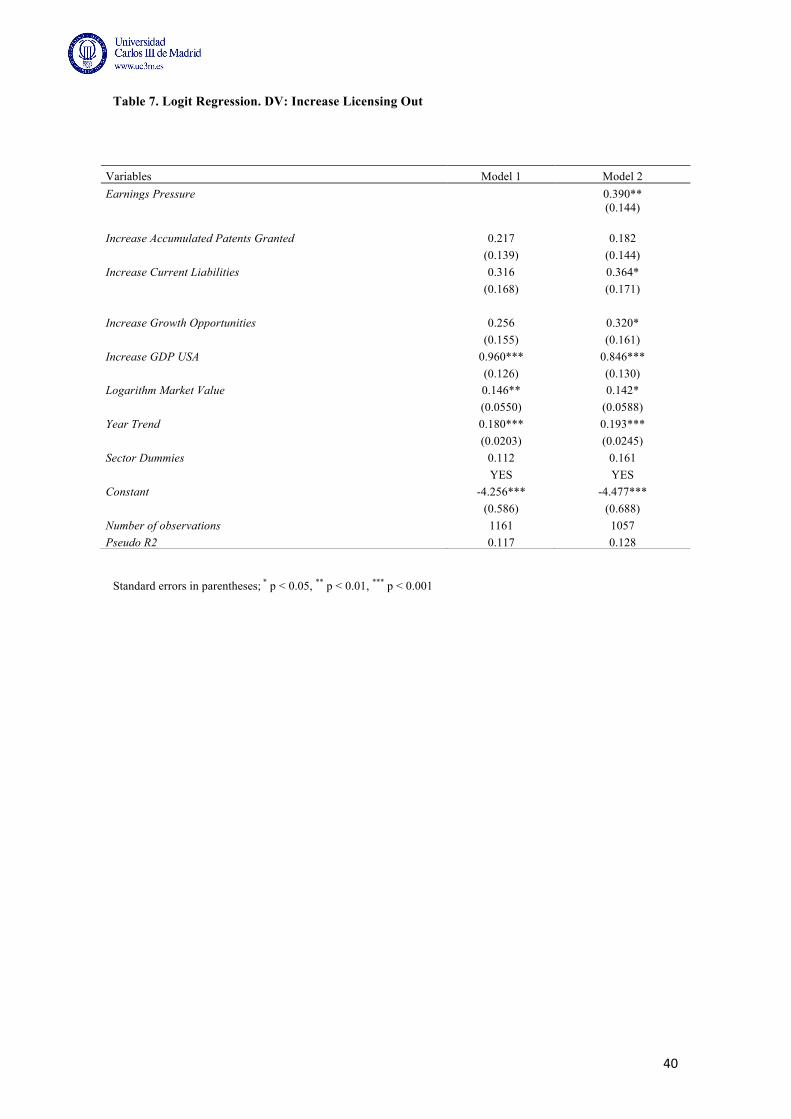
40
Table 7. Logit Regression. DV: Increase Licensing Out
Standard errors in parentheses; * p < 0.05, ** p < 0.01, *** p < 0.001
Variables Model 1 Model 2 Earnings Pressure
0.390**
(0.144)
Increase Accumulated Patents Granted 0.217 0.182
(0.139) (0.144)
Increase Current Liabilities 0.316 0.364*
(0.168) (0.171)
Increase Growth Opportunities 0.256 0.320*
(0.155) (0.161)
Increase GDP USA 0.960*** 0.846***
(0.126) (0.130)
Logarithm Market Value 0.146** 0.142*
(0.0550) (0.0588)
Year Trend 0.180*** 0.193***
(0.0203) (0.0245)
Sector Dummies 0.112 0.161
YES YES
Constant -4.256*** -4.477***
(0.586) (0.688)
Number of observations 1161 1057 Pseudo R2 0.117 0.128
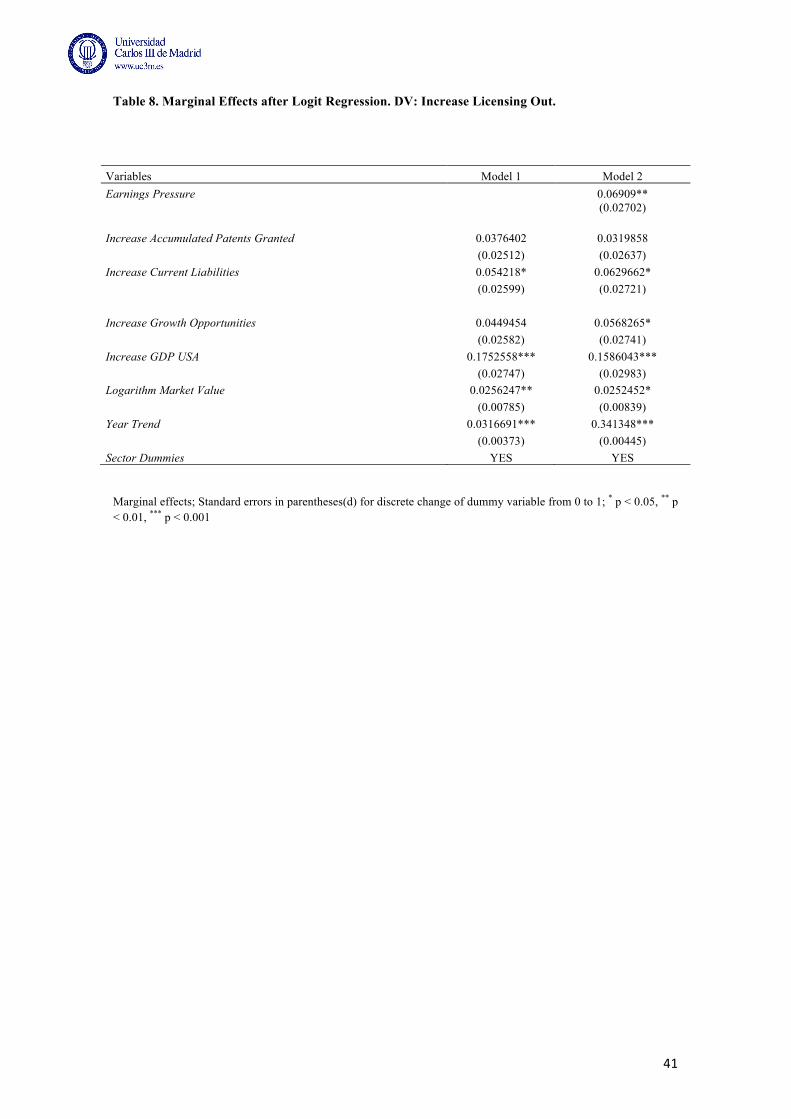
41
Table 8. Marginal Effects after Logit Regression. DV: Increase Licensing Out.
Marginal effects; Standard errors in parentheses(d) for discrete change of dummy variable from 0 to 1; * p < 0.05, ** p < 0.01, *** p < 0.001
Variables Model 1 Model 2 Earnings Pressure
0.06909**
(0.02702)
Increase Accumulated Patents Granted 0.0376402 0.0319858
(0.02512) (0.02637)
Increase Current Liabilities 0.054218* 0.0629662*
(0.02599) (0.02721)
Increase Growth Opportunities 0.0449454 0.0568265*
(0.02582) (0.02741)
Increase GDP USA 0.1752558*** 0.1586043***
(0.02747) (0.02983)
Logarithm Market Value 0.0256247** 0.0252452*
(0.00785) (0.00839)
Year Trend 0.0316691*** 0.341348***
(0.00373) (0.00445)
Sector Dummies YES YES
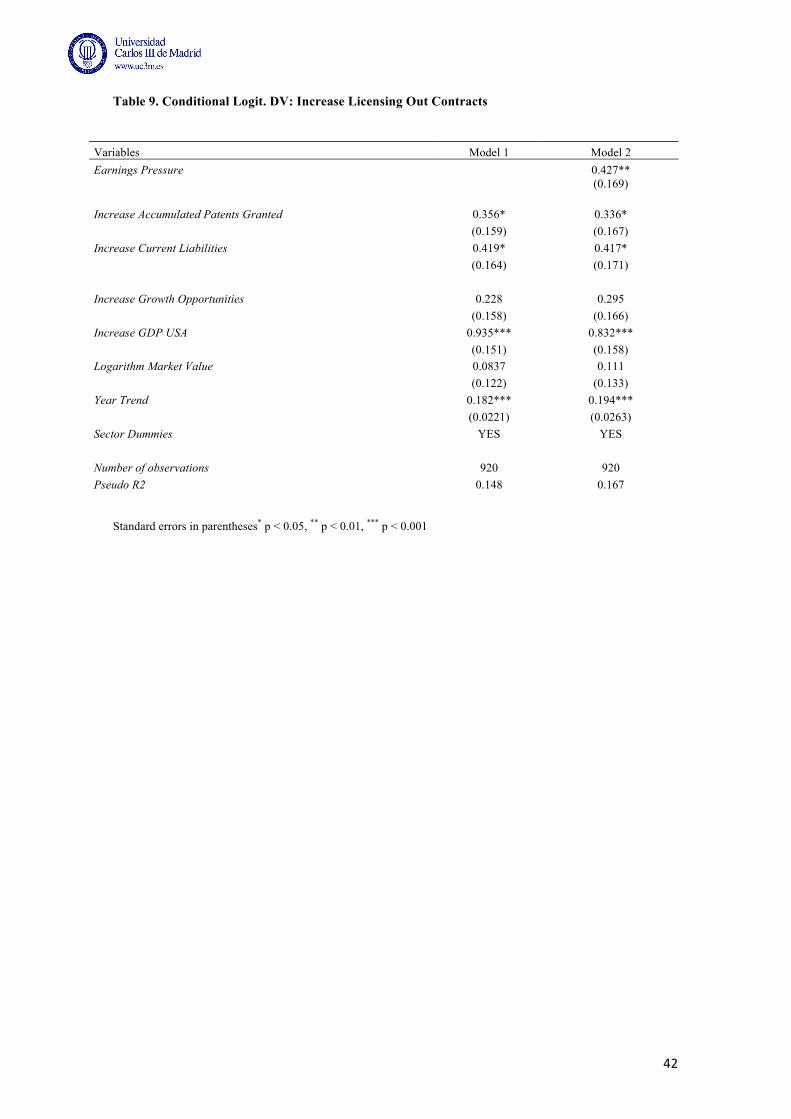
42
Table 9. Conditional Logit. DV: Increase Licensing Out Contracts
Standard errors in parentheses* p < 0.05, ** p < 0.01, *** p < 0.001
Variables Model 1 Model 2 Earnings Pressure
0.427**
(0.169)
Increase Accumulated Patents Granted 0.356* 0.336*
(0.159) (0.167)
Increase Current Liabilities 0.419* 0.417*
(0.164) (0.171)
Increase Growth Opportunities 0.228 0.295
(0.158) (0.166)
Increase GDP USA 0.935*** 0.832***
(0.151) (0.158)
Logarithm Market Value 0.0837 0.111
(0.122) (0.133)
Year Trend 0.182*** 0.194***
(0.0221) (0.0263)
Sector Dummies YES YES
Number of observations 920 920 Pseudo R2 0.148 0.167
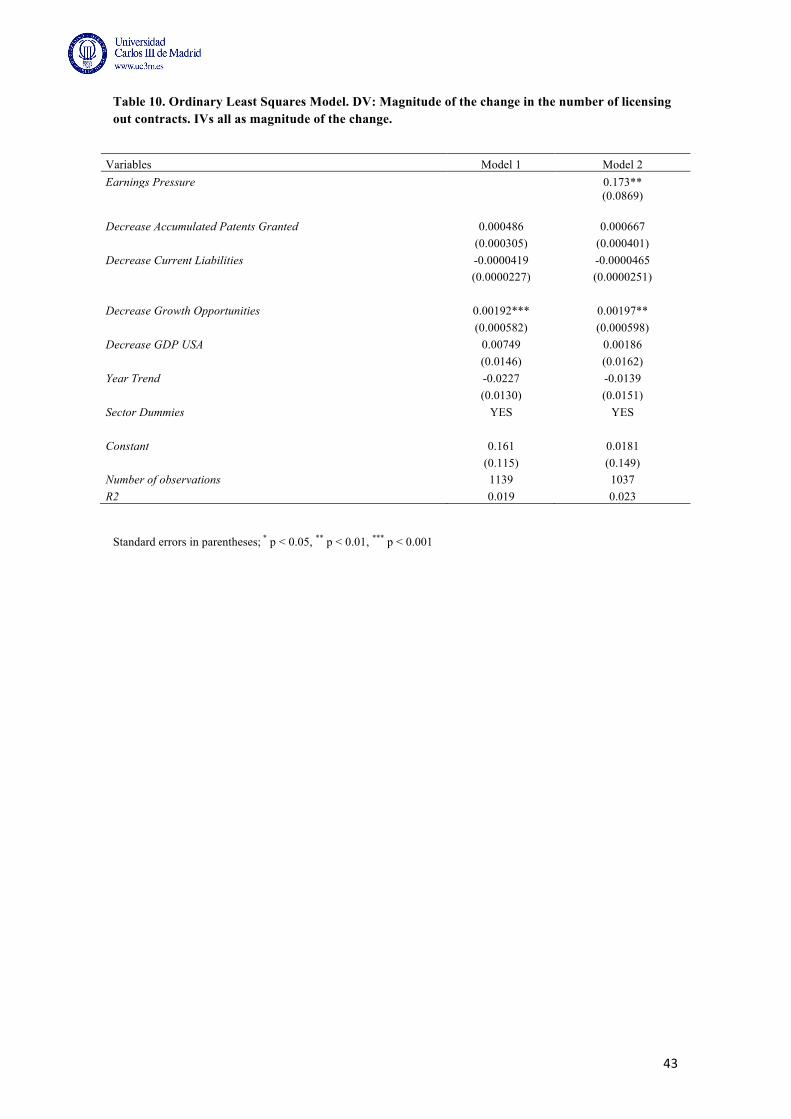
43
Table 10. Ordinary Least Squares Model. DV: Magnitude of the change in the number of licensing out contracts. IVs all as magnitude of the change.
Standard errors in parentheses; * p < 0.05, ** p < 0.01, *** p < 0.001
Variables Model 1 Model 2 Earnings Pressure
0.173**
(0.0869)
Decrease Accumulated Patents Granted 0.000486 0.000667
(0.000305) (0.000401)
Decrease Current Liabilities -0.0000419 -0.0000465
(0.0000227) (0.0000251)
Decrease Growth Opportunities 0.00192*** 0.00197**
(0.000582) (0.000598)
Decrease GDP USA 0.00749 0.00186
(0.0146) (0.0162)
Year Trend -0.0227 -0.0139
(0.0130) (0.0151)
Sector Dummies YES YES
Constant 0.161 0.0181
(0.115) (0.149)
Number of observations 1139 1037 R2 0.019 0.023
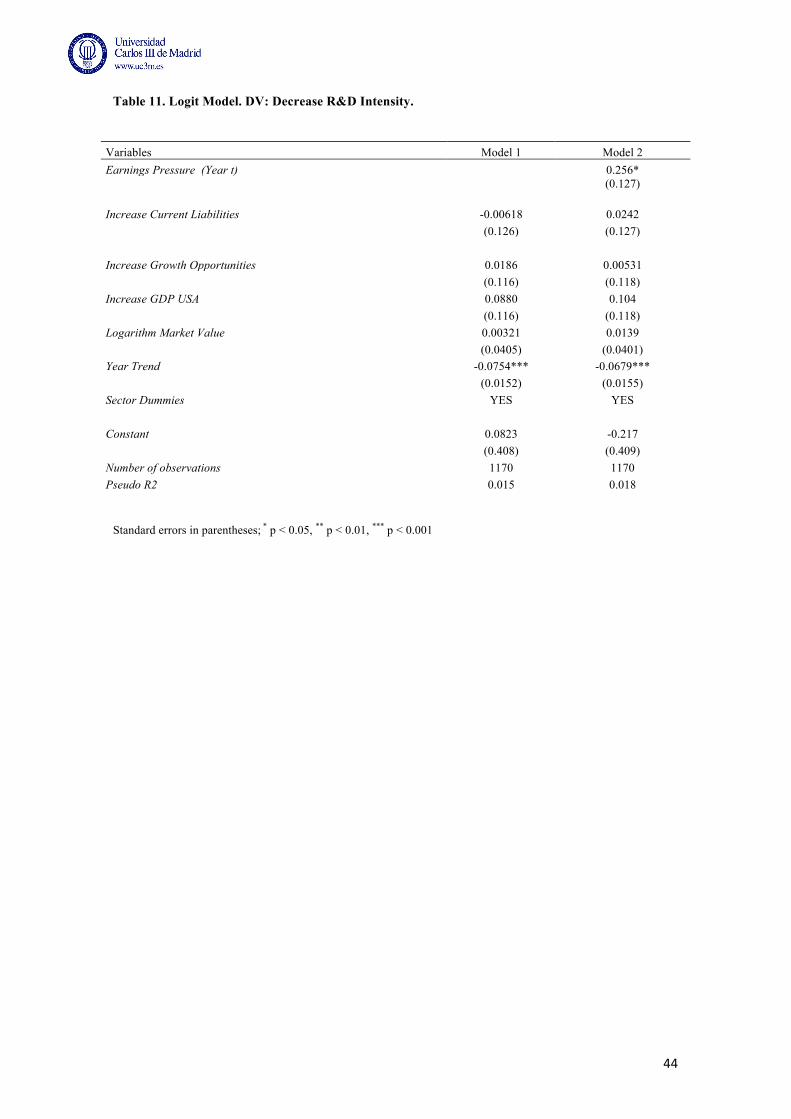
44
Table 11. Logit Model. DV: Decrease R&D Intensity.
Standard errors in parentheses; * p < 0.05, ** p < 0.01, *** p < 0.001
Variables Model 1 Model 2 Earnings Pressure (Year t)
0.256*
(0.127)
Increase Current Liabilities -0.00618 0.0242
(0.126) (0.127)
Increase Growth Opportunities 0.0186 0.00531
(0.116) (0.118)
Increase GDP USA 0.0880 0.104
(0.116) (0.118)
Logarithm Market Value 0.00321 0.0139
(0.0405) (0.0401)
Year Trend -0.0754*** -0.0679***
(0.0152) (0.0155)
Sector Dummies YES YES
Constant 0.0823 -0.217
(0.408) (0.409)
Number of observations 1170 1170 Pseudo R2 0.015 0.018
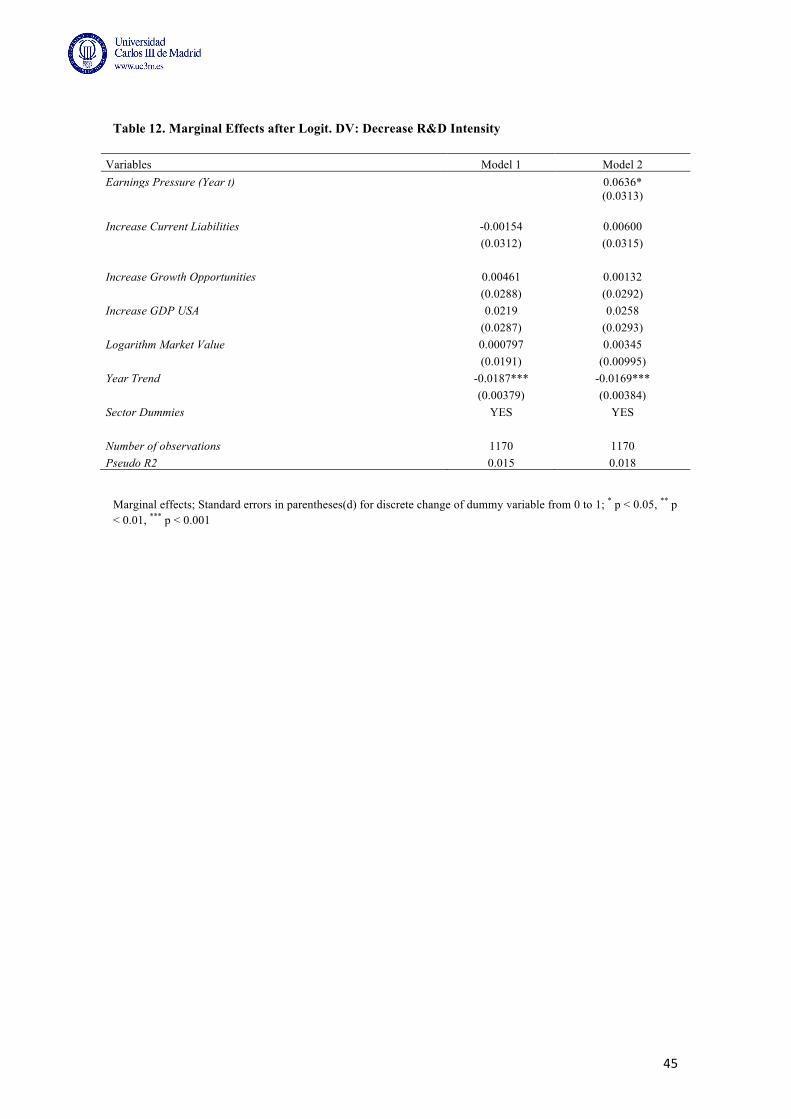
45
Table 12. Marginal Effects after Logit. DV: Decrease R&D Intensity
Marginal effects; Standard errors in parentheses(d) for discrete change of dummy variable from 0 to 1; * p < 0.05, ** p < 0.01, *** p < 0.001
Variables Model 1 Model 2 Earnings Pressure (Year t)
0.0636*
(0.0313)
Increase Current Liabilities -0.00154 0.00600
(0.0312) (0.0315)
Increase Growth Opportunities 0.00461 0.00132
(0.0288) (0.0292)
Increase GDP USA 0.0219 0.0258
(0.0287) (0.0293)
Logarithm Market Value 0.000797 0.00345
(0.0191) (0.00995)
Year Trend -0.0187*** -0.0169***
(0.00379) (0.00384)
Sector Dummies YES YES
Number of observations 1170 1170 Pseudo R2 0.015 0.018
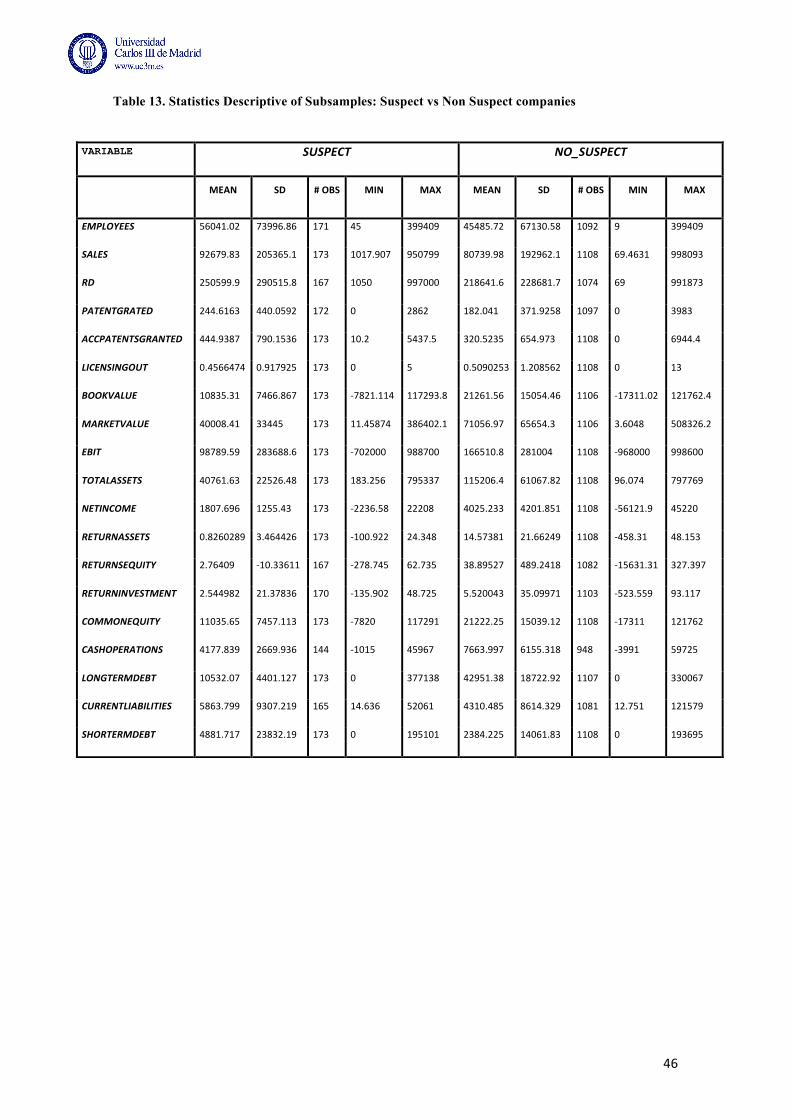
46
Table 13. Statistics Descriptive of Subsamples: Suspect vs Non Suspect companies
VARIABLE SUSPECT NO_SUSPECT
MEAN SD # OBS MIN MAX MEAN SD # OBS MIN MAX
EMPLOYEES 56041.02 73996.86 171 45 399409 45485.72 67130.58 1092 9 399409
SALES 92679.83 205365.1 173 1017.907 950799 80739.98 192962.1 1108 69.4631 998093
RD 250599.9 290515.8 167 1050 997000 218641.6 228681.7 1074 69 991873
PATENTGRATED 244.6163 440.0592 172 0 2862 182.041 371.9258 1097 0 3983
ACCPATENTSGRANTED 444.9387 790.1536 173 10.2 5437.5 320.5235 654.973 1108 0 6944.4
LICENSINGOUT 0.4566474 0.917925 173 0 5 0.5090253 1.208562 1108 0 13
BOOKVALUE 10835.31 7466.867 173 -‐7821.114 117293.8 21261.56 15054.46 1106 -‐17311.02 121762.4
MARKETVALUE 40008.41 33445 173 11.45874 386402.1 71056.97 65654.3 1106 3.6048 508326.2
EBIT 98789.59 283688.6 173 -‐702000 988700 166510.8 281004 1108 -‐968000 998600
TOTALASSETS 40761.63 22526.48 173 183.256 795337 115206.4 61067.82 1108 96.074 797769
NETINCOME 1807.696 1255.43 173 -‐2236.58 22208 4025.233 4201.851 1108 -‐56121.9 45220
RETURNASSETS 0.8260289 3.464426 173 -‐100.922 24.348 14.57381 21.66249 1108 -‐458.31 48.153
RETURNSEQUITY 2.76409 -‐10.33611 167 -‐278.745 62.735 38.89527 489.2418 1082 -‐15631.31 327.397
RETURNINVESTMENT 2.544982 21.37836 170 -‐135.902 48.725 5.520043 35.09971 1103 -‐523.559 93.117
COMMONEQUITY 11035.65 7457.113 173 -‐7820 117291 21222.25 15039.12 1108 -‐17311 121762
CASHOPERATIONS 4177.839 2669.936 144 -‐1015 45967 7663.997 6155.318 948 -‐3991 59725
LONGTERMDEBT 10532.07 4401.127 173 0 377138 42951.38 18722.92 1107 0 330067
CURRENTLIABILITIES 5863.799 9307.219 165 14.636 52061 4310.485 8614.329 1081 12.751 121579
SHORTERMDEBT 4881.717 23832.19 173 0 195101 2384.225 14061.83 1108 0 193695
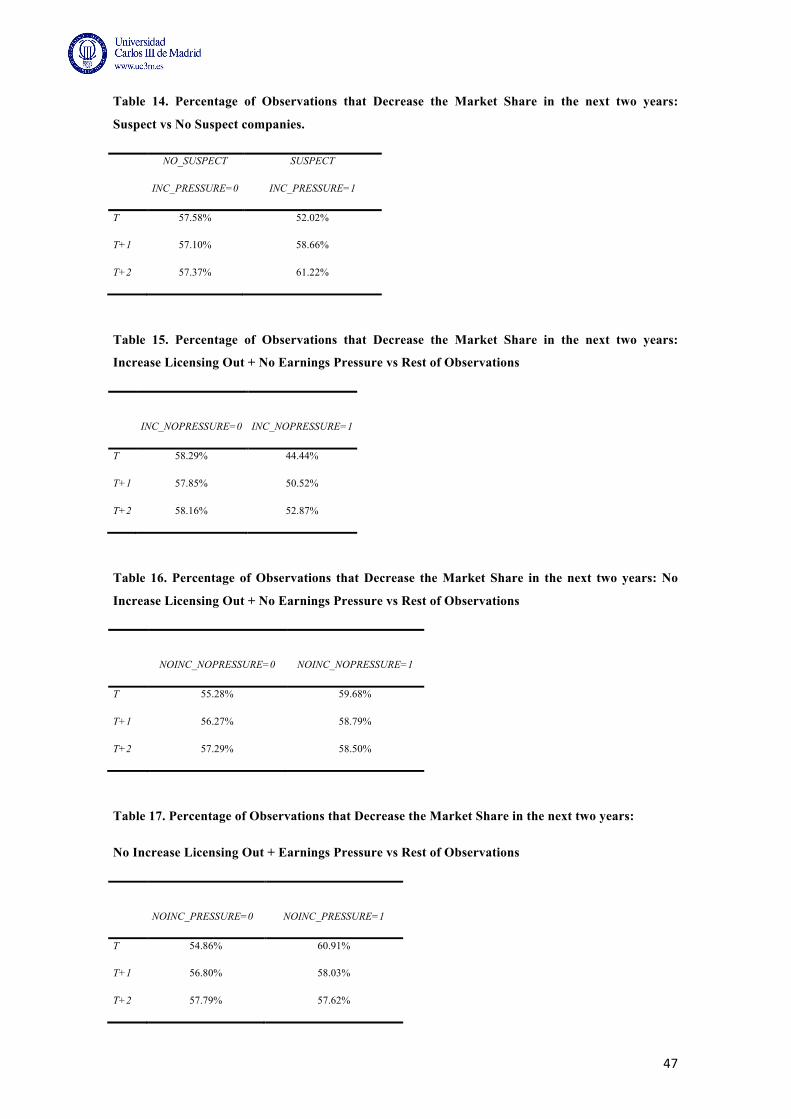
47
Table 14. Percentage of Observations that Decrease the Market Share in the next two years:
Suspect vs No Suspect companies.
NO_SUSPECT
INC_PRESSURE=0
SUSPECT
INC_PRESSURE=1
T 57.58% 52.02%
T+1 57.10% 58.66%
T+2 57.37% 61.22%
Table 15. Percentage of Observations that Decrease the Market Share in the next two years:
Increase Licensing Out + No Earnings Pressure vs Rest of Observations
INC_NOPRESSURE=0
INC_NOPRESSURE=1
T 58.29% 44.44%
T+1 57.85% 50.52%
T+2 58.16% 52.87%
Table 16. Percentage of Observations that Decrease the Market Share in the next two years: No
Increase Licensing Out + No Earnings Pressure vs Rest of Observations
NOINC_NOPRESSURE=0
NOINC_NOPRESSURE=1
T 55.28% 59.68%
T+1 56.27% 58.79%
T+2 57.29% 58.50%
Table 17. Percentage of Observations that Decrease the Market Share in the next two years:
No Increase Licensing Out + Earnings Pressure vs Rest of Observations
NOINC_PRESSURE=0
NOINC_PRESSURE=1
T 54.86% 60.91%
T+1 56.80% 58.03%
T+2 57.79% 57.62%
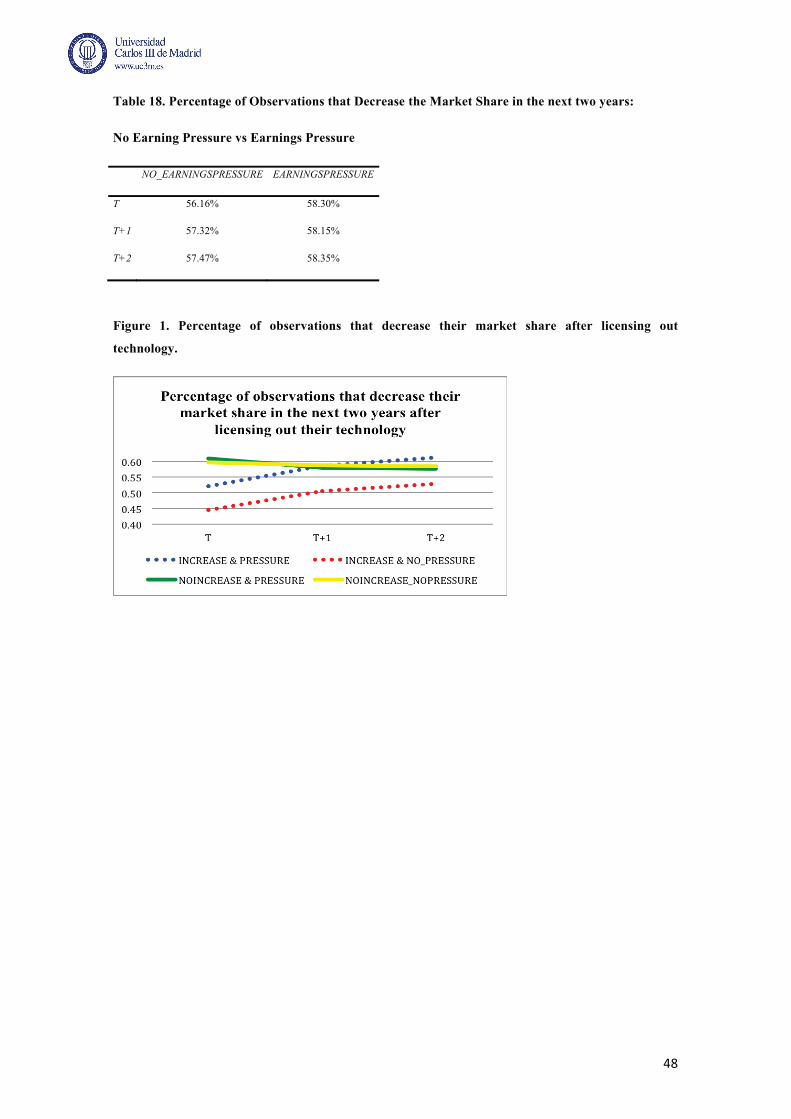
Table 18. Percentage of Observations that Decrease the Market Share in the next two years:
No Earning Pressure vs Earnings Pressure
NO_EARNINGSPRESSURE EARNINGSPRESSURE
T 56.16% 58.30%
T+1 57.32% 58.15%
T+2 57.47% 58.35%
Figure 1. Percentage of observations that decrease their market share after licensing out
technology.
49
CHAPTER 2 -‐ Understanding the Rent Dissipation Effect in Technology Licensing Contracts.
Co-authored with Solon Moreira (CBS)
2.1. Introduction
Over the last years it has been observed substantial changes in the way firms organize their
activities related to the production of new technologies (Cassiman & Veugelers, 2006). Given
the strong competition in the product market, the shorter product life cycles and the increase in
the use of information and communication technologies firms are continuously adopting
business models that allow for more strategic flexibility (Chesbrough, 2003). Accordingly,
firms rely on networks, new entrants and technology based organizations in order to generate
and sustain competitive advantages (Arora & Ceccagnoli, 2011). As licensing is a less
integrated alternative and the most direct way to acquire technologies developed by other
companies (Fosfuri, 2006), these agreements have dramatically increased in importance and in
volume over the last decades (Anand & Khanna, 2000a; Hagedoorn, 2002; Somaya, Kim, &
Vonortas, 2011). Accordingly, in several industries the use of royalty payments and licensing
fees have become an important mechanism for firms to profit from their investments in
innovation (Arora & Gambardella, 2010).
Surveys conducted by Gambardella, Giuri, & Luzzi (2007) and Zuniga & Guellec (2009) show
that among the main motivations for companies to license-out technologies is the revenue that it
generates. That is, the present value of the fixed fee and/or the royalties that the licensee has to
pay to the licensor (Arora & Fosfuri, 2003). Actually, in several industries it is common to
observe, even large established companies, actively engaging in licensing to generate revenues
(Shepard, 1987). Some notable example of firms profiting from licensing can be found in the
chemical industry, computer industry and semiconductors (Arora & Fosfuri, 2003). While the
50
generation of revenues is an important incentive for firms to license-out, granting other firms
access to relevant technologies can also produce negative implications for the licensor
competitiveness (Choi, 2002). Indeed, as a consequence of licensing out a technology licensors
may also experience a reduction in their market-share or price cost margin as a result of the
additional competition in the product market (Fosfuri, 2006). This reduction in the licensor’s
market-share caused by increased competition has been named rent dissipation effect. While
several studies have examined questions related to the revenue generated from technology
licensing (e.g., Choi, 2002; Sakakibara, 2010; Wang, 1998), empirical research focused at
explaining the rent dissipation effect is still scarce.
The central role that the rent dissipation effect plays in licensing contracts is evident in
comments from the managing director of an intellectual property consulting company called
Intercap: ‘On one hand, you don’t want to abandon your patents’ ability to exclude competitors
from your market. But, on the other hand, you could be talking about hundreds of millions of
dollars in new revenue from strategic licensing’ (Rivette & Kline, 2000). In this regard, firms’
decisions to license a technology has been shown to be grounded on the interplay between the
revenues generated by the licensing deal and the negative effects resulting from additional
competition in the downstream product market (Fosfuri, 2006). Despite this potential negative
effect, prior studies have indicated that not only firms lacking the necessary resources to
generate commercial value out of their innovations, but also large established ones use licensing
as an strategic alternative to profit from investment in inventive activities (Arora & Fosfuri,
2003).
In one of the few studies examining the rent dissipation effect, Arora & Fosfuri (2003) develop
a model in which firms with downstream assets decide if a technology will be licensed based on
the comparison between the rent dissipation caused by a new competitor (the licensee) and the
revenues generated from the licensing deal. Arora & Fosfuri findings suggest that firms selling
their technologies through licensing can increase their share of industry profits while imposing
negative externalities upon other incumbents operating in the same product market. In a similar
51
direction, Fosfuri (2006) offers empirical evidence of the rent dissipation effect by focusing on
the supply side of markets for technology to demonstrate how the competition among multiple
technology holders triggers a more aggressive licensing behavior. In a more recent study
Gambardella & Giarratana (2012) relaxes some of the assumptions found in Arora & Fosfuri’s
model to show that high heterogeneity among players within the same industry reduces the
extent to which licensors will experience rent dissipation. Altogether, this stream of literature
has consistently indicated that the firms’ decision to license-out their technologies is directly
related to competitive implications experienced at the product market (Choi, 2002; Katz &
Shapiro, 1985). However, although those studies have comprehensively increased our
understanding about the functioning of markets for technology, to the best of our knowledge no
previous study has yet developed empirical evidence directly linking licensing-out and
dissipation effect.
In this paper, we develop and empirically test a model that explains the dissipation effect
experienced by licensors using a perspective that incorporates three important dimensions of the
markets for technology: 1) if the licensors possess downstream assets, 2) licensee size and 3)
technological overlap between the licensor and the licensee. The main contribution of this paper
lies on the development of an empirically testable model concerning one of the central
assumptions of markets for technology (the dissipation effect), which hasn’t been tested against
empirical data. Furthermore, we integrate the insights from previous studies in a novel way to
build and test our hypotheses. First, we drawn on Arora & Fosfuri’ s (2003) proposition that the
dissipation effect tends to be higher for firms with downstream assets in the product market.
Second, we also consider the licensee’s perspective (Ceccagnoli & Hicks, 2012; Ceccagnoli &
Jiang, 2012; Laursen, Leone, & Torrisi, 2010) to account for the fact that the licensee’s capacity
to commercially exploit the licensed technology plays an important moderating role between
technology licensing and the rent dissipation effect. In this regard, Arora & Gambardella (2010)
call attention to the fact that the demand-side of markets for technology has received less
attention in licensing literature. Therefore, in our model we incorporate the view that licensees
52
differ in their capacity to commercially exploit the licensed technology, which naturally impacts
in the licensor’s rent dissipation. Finally, our model also considers the effect of the
technological overlap between the licensor and the licensee. Previous research has shown that
the licensing decision is subject to how technologically close are the patent portfolios of both
companies (Arora & Fosfuri, 2003; Laursen et al., 2010). Hence, we apply this idea of
technological proximity to propose that the dissipation effect resulting from licensing out core
technologies will be weaker in a context where the technological overlap between the parties is
low. In testing those three propositions we are not supposing that firms take inefficient
decisions that lead to rent dissipation. On the contrary, we build on Arora & Fosfuri’s (2003)
proposition that the licensing decision is based on the balance between dissipation and revenue
effects18.
We test our hypotheses using a sample of 163 licensors involved in licensing contracts within
the US pharmaceutical industry during the period of 1984 – 2004. We use supplemental data
from COMPUSTAT and the United States Patent and Trademark Office - USPTO to obtain
specific characteristics of licensors, licensees and the licensed technology. A major strength of
our dataset regards the fine-grained information that we could obtain from the licensing
contracts which allowed us to combine three different data sources to estimate the effect that
technology licensing has on subsequent changes on the licensor’s share in the product market.
We used a fixed effect model as the econometric technique to model the relationship between
the dependent and independent variables. The results offered robust support to most of our
hypotheses.
The paper is organized as follows. First, we present theoretical arguments and hypotheses.
Second, we describe the databases used in this study and how the dependent and independent
variables were calculated, following by the econometric technique used to estimate our models.
Finally, we present the results and conclusion.
18 Given the scarcity of data that allows connecting firms’ overall revenues to a specific licensing deal, we decided to mainly focus on the dissipation effect and just supplement the main analysis with information regarding the remuneration structure of the licensing contracts as a proxy for the revenue effect.
53
2.2. Theory and Hypotheses
2.2.1. Licensing
Licensing contracts are agreements between companies through which the owner of the
technology (licensor) allows to other company (licensee) to make, sell and use a technology
without transferring its ownership in exchange of an economic compensation (Granstrand,
1999). Over the last years licensing agreements have experienced an unprecedented growth
(Kamiyama, Sheehan, & Martínez, 2006; Zuniga & Guellec, 2009) and, nowadays, it represents
one of the most important options available to transfer technology (Anand & Khanna, 2000b;
Arora & Fosfuri, 2003). In fact, given its significance, the U.S. Department of Justice has
defined markets for technology as “markets that consist of intellectual property that is licensed
and its close substitutes” (U.S. Department of Justice, 1995). Although it is also possible for
firms to enter into licensing agreements concerning the joint development of licensed
technologies, this type of contract is usually characterized as an arm’s length contractual deal
with low level of vertical integration (Ceccagnoli & Jiang, 2013; Grindley & Teece, 1997).
Indeed, in most licensing deals signed between firms the traded technology is already developed
and commercially proven19 (Atuahene-Gima, 1993; Leone & Reichstein, 2012).
In principle, licensing offers strategic advantages for licensors and licensees. On the demand
side, licensees can benefit from acquiring externally developed and proven technologies
(Atuahene-Gima, 1993), from reducing product development risks and costs (Lowe & Taylor,
1999) from adopting more diversified and less integrated R&D structures (Chesbrough, 2003).
On the supply side, licensors increase the possibilities to recover the investments and generate
revenue from innovations (Arora & Ceccagnoli, 2006; Teece, 1986), achieve rapid market
penetration (Lei & Slocum Jr, 1991) and facilitate the development of complementary products
(Shepard, 1987). However, involving in licensing as a mean to commercialize technologies may
also impose risks. On the demand side, licensees could become highly dependent on the
19 Jensen & Thursby (2001) identified that in most of the cases the technologies commercialized by universities are at early stages, requiring substantial further work to reach a stage that would allow it to be commercially exploited by firms. However, we restrict our analysis to licensing contracts between firms.
54
licensors for the maintenance of the technology (Walter, 2012) and suffer with limited
comprehension on how to further develop the licensed technology (Leone & Reichstein, 2012) .
On the supply side, in addition to the rent dissipation effect, licensors could lose the control of
the licensed technology and become heavily dependent on the licensee to generate revenue
(Arora & Fosfuri, 2003; Fosfuri, 2006).
As a consequence, the licensing decision is far from being straightforward for firms. Arora &
Fosfuri (2003) focus on the licensors’ point of view to propose a framework predicting the
firm’s rate of licensing. In their model, the licensing decision is the result of the interplay
between two opposite effects: revenue effect versus dissipation effect. The revenue effect refers
to the benefits that licensing generates, which consists of the present value of the payments that
the licensee will made to the licensor, net of transaction costs. Accordingly, the pecuniary
benefits that are connected to licensing contracts are one of the main factors that firms take into
account in order to decide to license-out a specific technology (Kulatilaka & Lin, 2006). On the
other hand, the dissipation effect refers to the potential reduction in the licensor’s benefits,
measured as a lower market share or a lower price cost margin, as a consequence of additional
competition in the final product market. Even though previous research has proposed several
strategies to limit the latter effect (Cohen, Nelson, & Walsh, 2000; Granstrand, Patel, & Pavitt,
1997), an additional competitor may always be considered a potential threat for the licensor
(Fosfuri, 2006). Therefore, firms seek to balance the revenue effect, which is a short-term effect,
against the dissipation effect, which can influence firm performance in the long run (Arora &
Fosfuri, 2003; Fosfuri, 2006).
Beyond the monetary compensation that licensing generates, firms may also choose not to
exploit a technology in-house as a consequence of several other factors. First, in order to
commercialize a technology independently firms must develop specific assets and capabilities
such as commercialization channels, sales workforce and infrastructure to service clients (Gans
& Stern, 2003). When considering the expected return from those investments, licensing may
appear as a more interesting alternative as other firms in the market may already possess the

55
necessary assets. Second, established firms launching a new product run the risk of
cannibalizing their own market and erode their competitive position (Hill & Rothaermel, 2003).
Third, licensing creates possibilities for cooperation between the licensor and the licensee,
which mitigates risks inherent to investments that are necessary to make a technology into a
marketable product (Gans & Stern, 2003, 2010). In line with the third point, Choi (2002)
proposed a distinction between competition that a firm faces in the current product market
(Kamien, 1992; Katz & Shapiro, 1985) and the innovation market (Choi, 2002; Gans & Stern,
2010). While the first regards the competition that licensing triggers within the product markets
that the licensor operates at the moment of the licensing deal, the second is related to a more
dynamic process through which competition is increased in the long run as a consequence of
technological developments in the licensed technology.
Despite the fact that previous studies have pointed out certain contingencies and characteristics
related to the licensing process that accentuate the dissipation effect (Arora & Ceccagnoli, 2011;
Cohen et al., 2000; Granstrand et al., 1997; Helpman, 1998), no empirical evidence has been
produced indicating the direct relationship between rent dissipation and technology licensing.
Based on previous research we focus on three main factors regarding technology and firm
specificities that could influence the dissipation effect experienced by the licensor. First, we
consider that licensors are more likely to be susceptible to the dissipation effect in the cases that
the licensed technology constitutes a core, instead of peripheral, technology. We expect that the
degree to which a technology is connected to the licensors’ main technological activities is an
indication of the possession of the downstream assets. Furthermore, core technologies are
mostly observed to be superior to peripheral ones in terms of production costs, market value and
potential to be further refined (Choi, 2002). Second, licensors are more susceptible to the
dissipation effect if the licensee is increasing on size. Large companies are more able to
appropriate value from inward licensing (Walter, 2012). Finally, we also expect that the
magnitude of the dissipation effect to be affected by the level of technological overlap between
56
the licensor and the licensee. In this case, it is expected that lower technological overlap reduces
the dissipation effect resulting from licensing out core technologies.
2.2.2. Licensing Out Core Technologies
The technological portfolio of a firm is formed by core and non-core technologies that are
related to the markets in which the firm operates (Granstrand et al., 1997). Core technologies
represent a firm’s main source of competitive advantage as they constitute the outcome of a path
dependent process regarding the accumulations of unique expertise (Prahalad & Hamel, 1993).
In general, core technologies are distinct given their potential access to a wide variety of
markets, significant contribution to the perceived customer benefits of the end product and the
difficulty for competitors to imitate it (Choi, 2002; Prahalad & Hamel, 1993). Given the
competitive implications that licensing-out core technologies may bring to the licensor, the
licensing literature does not frequently considers it as an alternative for firms. However, if the
licensor is able to either avoid creating direct competitors (Fosfuri, 2006; Leone & Reichstein,
2012) or receiving monetary remuneration that is compatible with the potential rent dissipation,
core technologies will also be licensed (Choi, 2002).
In fact, considering both sides of the markets for technologies, deals involving core-
technologies are more likely to take place comparatively to deals regarding peripheral
technologies. Indeed, core-technologies are more valuable for licensees as they have more
potential to be developed into a future generation of related products at the same time that
allows the acquiring firm to produce more revenue in the short term (Choi, 2002). Therefore,
considering this perspective, if the licensor can use licensing payment (e.g., fixed fees and
royalty rates) to appropriate a necessary amount sufficiently large to overcome the decrease in
the profit due to future competition, then deals exchanging core-technologies are likely to
happen. Furthermore, even if the uncertainty related to the licensed technology is as high as to
prevent all contingencies to be fully foreseen in a licensing contract, the use of royalty-based
57
payment is an option to ensure that the core-technologies (valuable) will be traded (Gallini &
Wright, 1990; Gans, Hsu, & Stern, 2008).
There are also other factors, in addition to revenue generation, that may affect firm decision to
license core-technologies. First, by engaging into licensing deals firms may access the
licensee’s assets and capabilities that can be useful in further developing the licensed
technology (Leone & Reichstein, 2012). The complexity related to the development of certain
technologies can move firms to enter into R&D partnerships (in form on licensing contracts) in
order to mitigate risks and increase the chances that a technology will continue to be developed
(Duysters & Hagedoorn, 2000). This is particular true for firms that are strongly centered
around a small group of core capabilities in a particular technological field, as those firms are
more likely to develop rigidities they are also more susceptible to fail to keep up with
environmental changes (Song, Almeida, & Wu, 2003). Furthermore, licensing is also an
alternative for firms to implement open innovation strategies (Chesbrough, 2003). Second, it is
not uncommon that the development and introduction of a new product require several
complementary technologies that are not all in possession of a unique firm. Under these
circumstances firms may possess in-house a technology that only has the potential to generate
rents when combined with those of other firms (Fershtman & Kamien, 1992). In this case, a
firm may pursuit the development of technologies which are related to its core business and
agree to provide its access to other firms in exchange for the access to their technologies
(Eswaran, 1994).
In spite of the different motivations that firms might have to license core-technologies, we
expect that technologies which are close to the firms main business reflect the areas in which
the licensor possess related downstream assets (Arora, Fosfuri, & Gambardella, 2001;
Ceccagnoli & Hicks, 2012). This observation lead to the assumption that licensors will
experience stronger competition originating from licensing-out a technology if it is closely
related to the firm’s main line of business. Therefore, to build our baseline hypothesis, we
follow the argument developed by Arora & Fosfuri (2001) that licensors are more likely to
58
experience rent dissipation in the cases in which downstream assets related to the licensed
technology are possessed in-house. Our baseline hypothesis therefore states:
Hypothesis 1: The closer a technology to the licensor’s core technological activities, the
stronger the dissipation effect, everything equal.
2.2.3. Licensing Out Core Technologies and Licensee Size
The relationship between firm size and the propensity to license-out has been deeply explored
by previous literature. Several studies have identified size as one the main determinants that
explain licensing-out activities (Fosfuri, 2006; Gambardella et al., 2007; Kani & Motohashi,
2012), with the results indicating that as size increase the propensity to license-out decreases
(Gambardella et al., 2007). In particular, previous research has found that smaller firms license-
out more technologies as a consequence of the lack of legitimacy and the downstream.
Therefore, in most of the cases licensing-out is the only way to appropriate rents from their
investments (Arora & Fosfuri, 2003; Fosfuri, 2006). From the point of view of the licensee, size
is expected not only increase the propensity to license-in, but also to explain the capacity that
the acquiring firm will have to exploit the acquired technology (Walter, 2012). Indeed, as larger
firms have several advantages in exploiting resources from the environment (Atuahene-Gima,
1993), many cross-firm differences in terms of their capacity to exploit licensed-in technologies
comes from differential advantages related to size and R&D intensity,.
One of the key factors of the licensing process is the efficiency of the licensee in applying the
newly acquired technology in the product market (Arora & Gambardella, 2010). No doubt, this
efficiency is highly dependent on the licensee’s capabilities, which in turn, are closely
connected to firm size. Accordingly, Walter (2012) has shown a positive relationship between
firm size and the propensity to license-in. Given that large firms are characterized by greater
economies of scale in R&D, faster learning curves and the downstream assets needed to
commercialize the final product (Cohen & Levinthal, 1990; Van Wijk, Jansen, & Lyles, 2008),
59
they are able to capture more value from licensing-in. Although larger firms also have a number
of disadvantages related to innovation such as rigidities (Dosi & Marengo, 2007) and
organizational inertia (Chen & Hambrick, 1995), we expect that the effect of size on firm
capacity to commercially exploit a newly acquired technology in the product market to be
positive. Moreover, considering Teece’s (1986) seminal work on firm capacity to profit from
innovation, the successful commercialization of externally acquired technologies is conditional
upon capabilities and other complementary resources, which are more likely to be present in
larger firms (Walter, 2012).
Following this line of reasoning, larger firms vis-à-vis to small firms are more likely to present
a substantially high amount of resources related to the commercialization and manufacturing of
the licensed technologies (Teece, 1986). This conclusion naturally leads to implications on the
rent dissipation effect that licensors experience when licensing-out core technologies.
Considering the baseline hypothesis regarding the extent to which a technology is core to the
licensor’s main technological activities, we expect that as the licensee increases in size the
competition within the licensor main business lines also increase. Actually, given that peripheral
technologies are unlikely to cause meaningful rent dissipation for the licensor, we expect that
licensee size will increase rent dissipation only when the licensing deal involves licensor’s core
technologies. Therefore, we expect that the dissipation effect caused by licensing-out core
technologies will increase with licensee size. Our second hypothesis thus states that:
Hypothesis 2: Everything else equal, the larger the licensee firm, the stronger the dissipation
effect caused by licensing core technologies.
2.2.4. Technological Overlap between partners
Another important dimension of the licensing process that directly affects the dissipation effect
regard the extent to which the licensor and the licensee operate in the same niches within the
product market (Gambardella & Giarratana, 2012). Actually, from the licensor’s perspective it
60
would be preferred to license to firms that build on a different set of technological capabilities
as they would be less likely to turn into a competitor in the product space (Arora &
Gambardella, 2010). Indeed, if the licensor can supply a technology to a firm with which it has
low level of overlap, the effect of increasing competition observed on both technology and
product markets will be substantially smaller as compared to licensing to a firm with high
technological overlap. Firms operating within close technological fields are more likely to share
similar resource bases (Hannan & Freeman, 1977), which increases the likelihood that they will
commercially exploit the licensed technology in similar ways. As a result, high overlap puts
licensor and licensee in more direct competition with each other (Gambardella & Giarratana,
2012; Walter, 2012).
Although license-out to firms with low technological overlap would be an optimal alternative
from the licensor perspective, licensing deals between firms operating in different technological
segments are not always possible. Indeed, markets for technology are mainly characterized by
asymmetric information between the parties, by difficulties to describe and to value the
technology and by the uncertainty about the validity and applicability of the traded technology
(Arora & Gambardella, 2010). As a consequence, firms can reduce those problems if they
belong to close a technological field (high overlap), which significantly limits the extent to
which deals between firms no technological overlap happen. In this context, from the licensee
point of view, it is easier to identify and understand the value of a specific technology when
operating with similar technologies to the licensor (Gambardella & Giarratana, 2012).
Furthermore, technologies licensed from a firm with similar technological portfolio are easier to
evaluate, assimilate and apply (Arora & Gambardella, 1994; Cohen & Levinthal, 1990). On the
licensor side, it is easier to scream the technological space for potential licensees that operate in
the closer technological fields. In summary, high technological overlap between the parties
reduce search costs and other frictions that are inherently present on the markets for technology.
Building on the arguments presented above, we claim that licensing deals are most likely to
involve firms with some degree of technological overlap in their portfolio. In other words, deals
61
are unlikely to happen between firms with absolutely no overlap as several issues ranging from
to partner identification to technology transferability can prevent those deals to happen. On the
other hand, firms with perfectly similar technological portfolios are unlikely to enter into
licensing deals as the risk of generating competition becomes too high20. Those arguments lead
to the idea that the technological overlap between the firms signing a licensing contract will fall
in a continuous between perfect and no overlap.
Shared similarities between the licensor and the licensee in the technological space are also
likely to be reflected in the product market. Accordingly, we consider the effect that low level
of technological overlap has an effect on the magnitude of the dissipation effect experienced by
the licensor. Therefore, we propose that companies with low technological overlap are less
likely to directly compete within the same technological niche, which weakens the dissipation
effect caused by licensing out core technologies. Therefore, we state:
Hypothesis 3: Everything else equal, the lower the technological overlap between the licensor
and the licensee, the weaker the dissipation effect by licensing out core technologies.
Figure 1 provides an overview of the conceptual model proposed in this paper21. First, the arrow
referring to hypothesis 1 indicates a positive relationship between licensor core technologies
and the dissipation effect. Second, this relationship is positively moderated by the licensee size
(H2). Finally, the lower level of technological overlap between licensor and licensee negatively
moderates the relationship between the licensor’s core technology and the dissipation effect
(H3).
[Insert Figure 1 around here]
20 Choi (2002) proposes that such deals could still take place if the licensee would agree to pay a high lump-sum payment and/or royalty fee to the licensor. However, if the total amount to be paid becomes too high then the licensee is unlikely to pursuit those deals. 21 Figure 1 summarizes the conceptual model developed in this paper, but the way that the dissipation effect is operationalized in the empirical model uses the inverse interpretation for the direction of the coefficients for the main independent variables.
62
2.3. Data, Methodology & Variables
2.3.1. Sample Selection and Data
It is challenging to study empirically the rent dissipation effect. The availability of public data
for systematic quantitative studies that allow modeling the relationship between technology
licensing and rent dissipation is limited. Licensors usually do not publicly report which
technologies are licensed, and the financial fillings rarely allow connecting firm revenue to a
specific licensing deal. An alternative to overcome the lack of public data could be the use of
interviews or questionnaires, but these methods would impose significant limitations. First,
respondents may be unwilling to reveal strategic information regarding the nature of the
licensed technologies as well the contractual specifications of the deal. Second, there are
substantial timing effects and cross-firm heterogeneity that could also explain a reduction on the
licensor’s share in the product market, which are hard to be considered without the use of a
longitudinal setting. To overcome those issues and test the proposed hypotheses we relied on
detailed information extracted from a sample of licensing contracts that allowed linking
licensing contracts to patent data and financial performance of the licensors. The sample,
measures and methods are summarized below.
The research setting for this study is the U.S. pharmaceutical industry. Firms in this industry
produce and commercialize drugs, chemical components and technologies. Several
characteristics of the pharmaceutical industry make it a useful empirical setting for testing the
relationship between technology licensing and the rent dissipation effect. First, licensing is one
of the most common methods of technology transfer among pharmaceutical companies. Second,
the pharmaceutical industry is characterized as technology driven and research intensive, what
makes technological knowledge a critical component to develop and sustain competitive
advantages (Roberts, 1999). Third, since our main analysis relies on patent data, we choose an
industry in which firms routinely and systematically use patents to protect their inventions
(Hagedoorn & Cloodt, 2003). Those characteristics correspond to an industry in which markets
63
for technology are well developed and present lower frictions, which facilitates the transaction
of technologies using licensing contracts. Accordingly, the fact that the pharmaceutical industry
presents those specific features creates a trade-off in terms of the generalizability of results and
how precise we are able to measure the variables used in the econometric analysis. However,
given the scarcity of empirical evidences on this topic we believe the purposeful choice of this
industry to be appropriate to shed light on important, and yet empirically unexplored, aspects of
technology licensing and the rent dissipation effect.
The data used to develop the empirical analysis come from three different sources. First, as a
starting point, we used the Deloitte Recap Database to obtain the licensing contracts involving
U.S. pharmaceutical firms. We choose this database because it is one of the most accurate
sources of information regarding partnerships in the pharmaceutical industry (Audretsch &
Feldman, 2003; Schilling, 2009). Additionally, it allowed us to access the original licensing
contracts from which we could extract precise information regarding the contractual and
technological aspects of the licensing deals. Second, we obtained information regarding the
patenting activity of licensors and licensees from the National Bureau of Economic Research
(NBER) patent database. Finally, we extracted from Compustat database firm’s financial
information.
Considering that one of the main ideas developed in this paper regards the degree to which the
licensed technology represents a core activity to licensors, we focus only on contracts in which
it was possible to identify the licensed technologies in an unambiguous manner. The way to do
it was to focus on licensing contracts containing a 7 digit patent number connecting a specific
technology to the United States Patent and Trademark Office (USPTO). This setting allows
calculating the relative importance of the licensed technology in relation to the licensor’s overall
activities. Although we use patent data to calculate how core a technology is, our analysis only
concern the rent dissipation related to product market activity. For example, if the licensor A
decides to license a specific technology to the licensee B, the effect that we are trying to capture
is a consequence of licensee B commercially exploiting the licensed technology and
consequently creating competitive pressures over licensor A. Additionally, we also acknowledge
64
that the dissipation effect can also increase overtime as a consequence of learning effects
experienced by the licensee and not only as a consequence of the immediate commercial
exploitation of the licensed technology. However, following an innovation perspective, the time
that licensees may take to assimilate, recombine and apply the licensed-in technology into
something new is excessively long to be captured with the empirical setting adopted in this
paper. For this reason, we only use licensing contracts that include commercialization clauses in
its contractual scope, which implies that the licensee is allowed to commercialize the licensed
technology without the need to further develop or incorporate it in a new product (Parr &
Sullivan, 1996).
The matching process between the licensing contracts extracted from the Recap and the two
other databases was done as follow. The first step was to use the licensor’s name and industry
described in the licensing contract to identify the corresponding observation in the Compustat
database. Second, using the Compustat firm identifier (GVKEY) we also connected the
licensors with the National Bureau of Economic Research (NBER) U.S. patent data file22. To
ensure an accurate matching we checked manually each individual GVKEY match between
Compustat and NBER datasets. Given that a substantially high number of licensees in our
sample are non-public firms we were not able to satisfactorily match the licensee firms with
Compustat, but because the patent data is less restrictive23 we were able to connect the licensees
with the NBER database. In order to drive the matching process for the licensees we relied on
firm name and country. Based on licensors and licensees patent information it was possible to
construct measures for the firm’s technological assets using the patenting behavior prior to the
licensing date. However, measures based on patent information are poor indicator for firms’
technological profile in the cases that the firm is not listed as an assignee on any patent within
the years prior to the licensing contract. Therefore, firms that have not filled at least one patent
during the time frame used to calculate the variables were dropped from the final sample.
22 We employed the NBER data version developed in which it is made available the GVKEY numbers linked to the assignee number of patent applicants 23 While Compustat only includes public firms, the patent data lists all the firms that filled at least one patent between 1976-2006
65
After selecting the contracts that met those specifications and conducting the matching process
between the three databases, we arrived to an estimation sample of 330 observations regarding
163 unique licensors and 198 unique licensees involved in licensing contracts during the period
1984-200424. This number corresponds to approximately 69% of the original contracts that
matched the required characteristics to be used in the empirical analysis
2.3.2. Method
To estimate the rent dissipation effect experienced by each licensor subsequently to the
licensing deal, we follow the conceptual references offered by prior literature on markets for
technology (Arora & Fosfuri, 2003; Arora & Gambardella, 2010; Fosfuri, 2006) and specify the
dependent variable as a relative changes in the licensor market-share. Despite the fact that we
are not aware of any previous attempt trying to measure the dissipation effect in this way, a
number of studies have applied this variable in a similar manner for different purposes (Ferrier,
Smith, & Grimm, 1999; Giroud & Mueller, 2011). One potential issue in estimating the relative
changes in the licensor market-share after a licensing deal regards the fact that a firm already
experiencing financial problems may also be more likely to involve in licensing deals as a way
to generate short-term revenue, which would produce biased estimates due to simultaneity
(Verbeek, 2000). In order to try to deal with this problem, we added the change on the licensor
market-share in the year prior to the licensing date as one of the predictors, which should
capture the effect of the past performance on the subsequent changes in the licensor market-
share. As a robustness check, we also applied the Wooldridge (2002) test for autocorrelation in
panel data and the estimators indicated no evidence of first-order autocorrelation.
The first approach we considered to test the proposed hypotheses was a fixed effects model as a
way to account for substantial unobserved firm heterogeneity that commonly effect studies
dealing with corporate performance measures (Coles, Lemmon, & Felix Meschke, 2012).
However, in the case that the unobserved firm-specific effects are uncorrelated with the
24 Although the NBER patent database would allow tracking firms patents until 2006, we decided to include the observations only until 2004 as a way to deal with potential truncation issues regarding the number of forward citations received by patents
66
regressors, the use of random effects model would be most appropriate given that it produces
more efficient estimators (Greene, 2003). In the case of modeling the dissipation effect, the
random effects assumption implies that unobserved characteristics of firm i affecting the
relative changes in the licensor’s market-share, such as aspects of corporate governance and
firm inability to innovate, are not correlated with licensing strategy, technological overlap and
licensee size. To test if the use of random effects is appropriate we applied a Hausman (1978)
test to compare the coefficients and capture systematic differences between both fixed and
random effects. The results indicated significant differences between the random and fixed
effects estimators (chi = 69.83, p < 0.001), confirming the suitability of fixed effects to model
the effect of technology licensing on subsequent changes on the licensor’s market-share.
Additionally, we also included year dummies to control for period effects, such as differences in
macroeconomic conditions that could also affect firm performance. Finally, robust standard
errors were used to rule out heteroskedasticity concerns (Wooldridge, 2002).
One of the main advantages of this empirical setting regards the use independent data sources to
calculate the variables applied in the econometric analysis. The combination of multiple sources
is a useful strategy to mitigate bias issues related to artificial variance created from a single
database (Avolio, Yammarino, & Bass, 1991; Doty & Glick, 1998). Accordingly, while the
dependent variable is calculated based on Compustat information, the main explanatory
variables are a composition of information extracted from the Recap and NBER patent
databases.
2.3.3. Variables
Dependent Variable: Dissipation Effect
We compute the dependent variable as a continuous change in the licensor market share in the
first year after signing a licensing contract. Following a similar approach to (Ferrier et al.,
1999), the first step to calculate this variable was to compute the licensor’s market-share using
the ratio between licensor’s sales and the total sales in the licensor’s industry reported on
67
Compustat. The industry sales were calculated based on all U.S pharmaceutical firms operating
in the within the same four-digit SIC code at year t. Following prior research (Giroud &
Mueller, 2011), we used all available Compustat firms within the same licensor’s SIC code. We
excluded firms for which the sales were either negative or missing. Then, our final measure is
derived from the differences in the logarithm of licensor’s market:
Dissipation Effect= ln(MS t+1) – ln(MS t)
Where ln(MS t+1) represents the licensor’s market-share in the first year after signing the license
contract; and ln(MS t) at the same year. This measure can be interpreted as positive values
representing an increase while negative values a decrease on licensors relative market-share in
the year subsequently to the license agreement. The rent dissipation effect measures in this
manner is consistent with the concepts proposed in the markets for technology literature,
according to which licensors are likely to experience increasing competition in the product
market in the period that follows the licensing deal (Arora & Fosfuri, 2003; Arora &
Gambardella, 2010; Fosfuri, 2006).
Focal Independent Variables
Licensor’s core Technology
The extent to which the licensed technology represents a licensor’s core technological activity is
calculated using the licensor’s overall patenting activity in the years anteceding the licensing
deal. This measure is operationalized based on the focal index proposed by Ziedonis (2007).
One of the key underlying assumptions in the use of the focal index regards the fact that the
licensors patenting activity represents a good indication of overall technological and market
activities, which have been shown to be the case in the context of the pharmaceutical industry
(Hoang & Rothaermel, 2010; Roberts, 1999). Accordingly, how core the licensed technology is
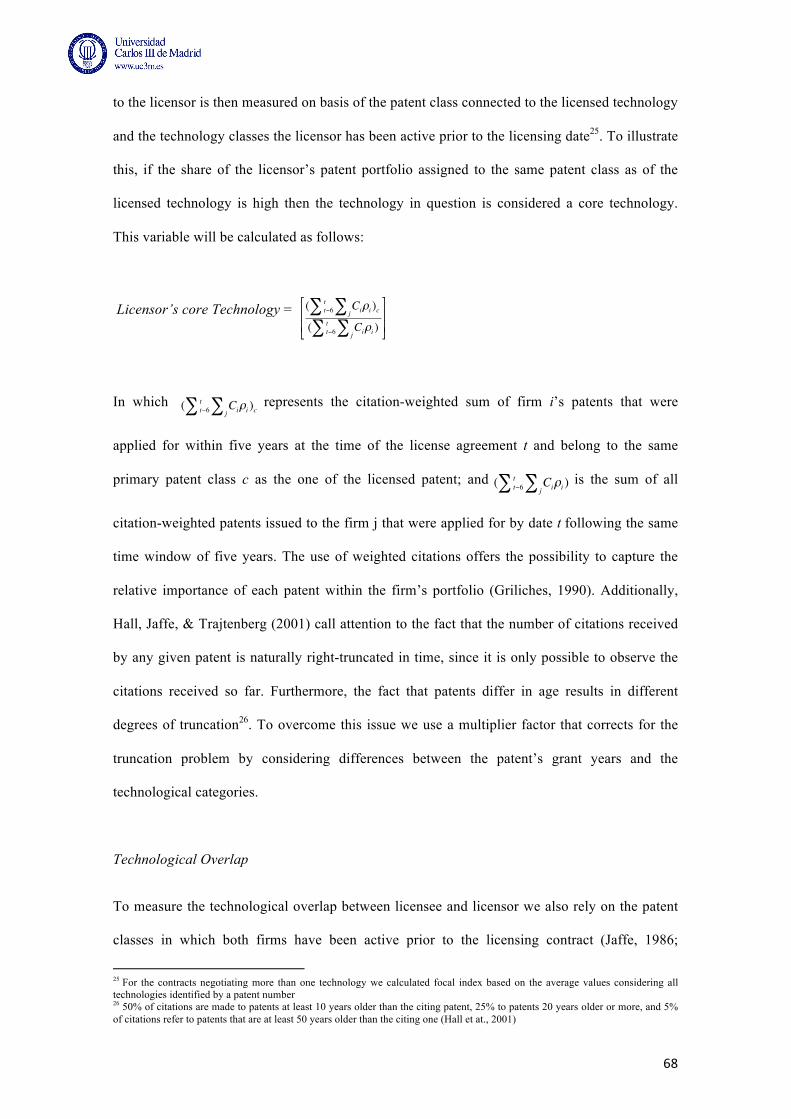
68
to the licensor is then measured on basis of the patent class connected to the licensed technology
and the technology classes the licensor has been active prior to the licensing date25. To illustrate
this, if the share of the licensor’s patent portfolio assigned to the same patent class as of the
licensed technology is high then the technology in question is considered a core technology.
This variable will be calculated as follows:
Licensor’s core Technology = ( t−6t Ciρi )cj∑∑
( t−6t Ciρi )j∑∑
#
$
%%
&
'
((
In which ( t−6t Ciρi )cj∑∑ represents the citation-weighted sum of firm i’s patents that were
applied for within five years at the time of the license agreement t and belong to the same
primary patent class c as the one of the licensed patent; and ( t−6t Ciρi )j∑∑ is the sum of all
citation-weighted patents issued to the firm j that were applied for by date t following the same
time window of five years. The use of weighted citations offers the possibility to capture the
relative importance of each patent within the firm’s portfolio (Griliches, 1990). Additionally,
Hall, Jaffe, & Trajtenberg (2001) call attention to the fact that the number of citations received
by any given patent is naturally right-truncated in time, since it is only possible to observe the
citations received so far. Furthermore, the fact that patents differ in age results in different
degrees of truncation26. To overcome this issue we use a multiplier factor that corrects for the
truncation problem by considering differences between the patent’s grant years and the
technological categories.
Technological Overlap
To measure the technological overlap between licensee and licensor we also rely on the patent
classes in which both firms have been active prior to the licensing contract (Jaffe, 1986;
25 For the contracts negotiating more than one technology we calculated focal index based on the average values considering all technologies identified by a patent number 26 50% of citations are made to patents at least 10 years older than the citing patent, 25% to patents 20 years older or more, and 5% of citations refer to patents that are at least 50 years older than the citing one (Hall et at., 2001)
69
Sampson, 2007). Prior studies have indicated that patent classes can be used as a reliable
indicator of specific technological fields in which the patenting firm operates (Lanjouw &
Schankerman, 2004; Nooteboom, Van Haverbeke, Duysters, Gilsing, & van den Oord, 2007).
Therefore, we use the measure proposed by (Jaffe, 1986) to capture the technological position
of the licensor relatively to the licensee in terms of the technological fields in which both firms
have patented. In order to construct our measure we first generated separately the technological
profile of licensors and licensees by measuring the distribution of accumulated patents across
different classes in the prior 5 years to the licensing contract. Similar to prior studies (e.g.,
Sampson, 2007) we obtained a multidimensional vector, Fi = (Fi1...Fi
S ) , according to which
FiS represents the number of patents assigned to firm i in the patent class s. Because we are
interested in investigating how low levels of technological overlap moderate the relationship
between licensing and rent dissipation the variable we inverted this variable by subtracting it
from 1, as follows:
Technological overlap=1−FiFj
(FiFi )(FjFj )
Accordingly, this measure takes value 1 for firms which have orthogonal vectors, value 0 for
firms with full overlap in their patenting activity, and a value between 0 and 1 for the cases in
which there is an intermediate degree of orthogonality between licensor and licensee.
Licensee Size
Given that we could not successfully match a satisfactory number of licensee firms with the
Compustat database, we relied on a patent stock measure as a proxy for licensee size. Therefore,
the measure for licensee’s size is based on the logarithm of the total number of patents filled by
the licensee within 10 years27 before the licensing contract. Although we recognize that this
proxy has limitations, there are reasons to consider the licensee’s patent stock a reliable proxy
27 Alternatively we estimated the models also using 5 and 15 years to calculate licensee’s patent stock and the results remained the same
70
for firm size. Examining the relationship between patent stock and number of employees for the
licensor firms in our sample it is observed a significant correlation of 63% between those two
variables. Furthermore, a number of previous studies have also proxied firm size using the total
number of patents accumulated over time (Cantwell & Santangelo, 2000; Quintana-García &
Benavides-Velasco, 2008). Still, one could argue that in certain circumstances small firms may
display an extensive patenting activity as compared to large firms, but if that is the case then the
size measure would lead to downwards bias (against the results we expect), given that small
firms are less likely to cause more rent dissipation vis-à-vis to large ones.
Control variables
To minimize alternative explanations and isolate the effects of the explanatory variables, we
controlled for several factors regarding firm, contract and technology characteristics that could
also explain changes in the licensor’s market-share. Regarding firm characteristics we control
for size using the logarithm of the licensor’s number of employees at year t. We control for
licensor’s R&D intensity by including the R&D expenditures divided by the firm total sales.
How specialized the licensor is in terms of different technological fields may also affect the
extent to which it is subject to the rent dissipation effect, in order to control for this
characteristic we calculated a Herfindahl index based on the classes connected to all the patents
the licensor successfully applied prior do the licensing date.
We also control for contractual specification by adding dummy variables capturing four legal
aspects of the deal. First, licensing contracts that allow the licensee to sub-license the acquired
technology are likely to amplify the dissipation effect experienced by the licensor, so we added
a dummy variable indicating if the licensing deal regards a contract which allows sub-licensing.
Second, licensing contracts may stipulate if the licensee is exclusive or not, we expect that the
exclusivity clauses can affect the dependent variable in either way positive or negative. On one
hand, if the licensee is exclusive it may be more willing to commercially exploit the licensed
technology in a more aggressive way. On the other hand, the fact that the technology is
71
restricted to a single firm could also reduce the rent dissipation. Third, we also use a dummy
variable to indicate if the licensing contract includes royalty fees in its remuneration structure
(Choi, 2002). Finally, we also included in the econometric analysis a dummy variable indicating
if the licensing contract allows the licensee to further develop the licensed technology. We
expect that licensees are more likely to require this clause to be included in the contract when
the licensed technology presents a high potential to be further developed and commercially
exploited, which might also affect the rent dissipation experienced by the licensor.
The final set of control variables regards specific characteristics of the licensed technology. We
expect that more valuable technologies are also more likely to result in stronger rent dissipation,
therefore we followed the convention in the patent literature and proxy value by the total
number of forward citations received by a given technology (Trajtenberg, 1990). We control for
the age of the licensed technology using the time difference between the application date of a
patent and the date of the licensing deal. Finally, in order to account for heterogeneity originated
from differences in the technological fields of licensed technologies we follow prior studies
(Gambardella, Harhoff, & Verspagen, 2008; Jaffe, 1989; Mowery, Sampat, & Ziedonis, 2002)
we grouped the patent classes into 4 main technology fields based patent classes and generated
dummy variables for each of them (Hall et al., 2001).
2.4. Results
2.4.1. Descriptive Statistics
Table 1 reports the means, standard deviations and Pearson correlation coefficients of the
variables used in the fixed effects model. The correlation does not warrant further examination
with respect to multicollinearity. Additionally, the maximum variance inflation factor (VIF)
associated with any of the independent variables was 1.66 (mean VIF = 1.39), which is well
below the rule-of-thumb value of ten (Wooldridge, 2012). It is possible to observe a moderate
correlation between licensor’s core technology and the number of employees, indicating that
larger firms are less likely to license core technologies. We expect this relationship to be caused
72
by the fact that larger firms also have a more diverse patent portfolio (less specialized) given
their capacity to operate in different technological fields simultaneously. Finally, we used the
likelihood ratio test to check how the stepwise inclusion of the variables change the likelihood
statistics, the results indicate a significant improvement in the overall fit of the model 7
(likelihood ratio: 80.506, p<0.001) .
[Insert Table 1 around here]
Table 2 reports the results for the fixed-effects model with robust standard errors. The
dependent variable across the seven models reported in this table regards the relative changes in
the licensors market-share in the year subsequent to the licensing deal. Model 1 reports the
estimators for the control variables. Model 2 introduces the main independent variable
licensor’s core technology. The variables technological overlap and licensee size are entered
into the Models 3 and 4 respectively. The two-way interaction between licensor’s core
technology and technological overlap (low) is estimated in the model 5. At model 6 the
interaction between licensee size and licensor’s core technology is included in the regression.
Finally, model 7 is estimated included all explanatory variables.
Hypothesis 1 predicted that the closer a technology to the licensor’s core technological
activities, the stronger the dissipation effect. Accordingly, the results of Table 2 indicate that the
coefficient for the licensor’s core technology variable is negative and significant at 1% level
when all controls are included in the equation, providing strong evidences in favor of our first
hypothesis. This result lends support to one of the main ideas proposed in this paper that the
closer the licensed technology to the licensor’s main technological activities, the stronger will
be the rent dissipation effect experienced in the product market. Hypothesis 2 predicts that the
larger the licensee firm, the stronger will be the dissipation effect caused by licensing core
technologies. As reported in table 2, the interaction term between licensor’s core technology
and licensee size presents consistently a negative and significant coefficient across the models,
suggesting that licensee size negatively moderates the relationship between licensing core
73
technologies and subsequent changes in the licensor’s market-share. This result offer support to
the relationship stated in hypothesis 2. Finally, hypothesis 3 predicts that the lower the level of
technological overlap between licensor and licensee will decrease the negative effect of
licensing-out core technologies and the licensor’s market-share. The statistical significant and
positive coefficient for the interaction between licensor’s core technology and Technological
Overlap (low) lends support for hypotheses 3.
[Insert Table 2 around here]
Concerning the control variables, the results indicate a negative and significant effect of sub-
licensing on the dependent variable. This result goes in the same direction of our expectations,
indicating that signing licensing contracts with a sub-licensing clause are negatively related with
subsequent changes on the licensor’s market-share. Indeed, the fact that the licensee is able to
transfer the commercialization rights of a specific technology to other firms is likely to increase
the number of potential competitors that will also use the licensed technology to compete
against the licensor.
2.4.2. Supplementary Analysis
The literature on markets for technology describes the ‘dilemma’ that licensors face when
deciding to license-out a technology (Fosfuri, 2006). On one hand, licensing creates dissipation
effect caused by increasing competition in the product market (Arora & Fosfuri, 2003; Choi,
2002), which we operationalize based on a relative change on the licensor’s market-share. On
the other hand, the decreasing shares in the product market experienced by the licensor should
be compensated with licensing revenues; otherwise firms would have no stimulus to enter into
licensing or other forms of technology exchange (Choi, 2002). In this paper we focus on the
dissipation effect caused by licensing core technologies and two main contingencies regarding
the licensee size and the overlap between licensor and licensee. Given the scarcity of empirical
evidences on this topic this focus contributes to a better understanding of the rent dissipation
effect as an important part of the markets for technology dynamics. Although relevant, it is still
74
only a partial picture of the licensing ‘dilemma’. Unfortunately, the dataset combination that we
used to test the proposed hypotheses does not allow us to extract information about the revenue
generated by each licensing deal. As a consequence, we are not able to test if the licensing
revenues will increase as the dissipation effect also increases. However, looking into each
individual contract we were able to extract certain information regarding the remuneration
structure of each deal in order to supplement the main analysis regarding the rent dissipation
effect.
In order to do so we estimated an additional econometric model based on the remuneration
conditions of the licensing contracts. We generated a dummy variable that takes value 1 if the
licensing contract includes a granted minimum royalty clause. This clause indicates that the
licensor will receive a given minimum royalty independently from the licensee’s performance in
exploiting the licensed technology, even if it is necessary the licensee to supplement the royalty
payment to achieve the stipulated amount (Battersby & Grimes, 2005). Apart from being a
contractual mechanism to ensure that the licensor will receive monetary compensation
regardless of licensee’s performance, this contractual specification can be also used as a way to
guarantee that the licensee will not use the licensing agreement to avoid or delay the
introduction of a competitive technology in the market (Goldscheider, 1995; Welch, Benito, &
Petersen, 2008). Accordingly, this clause can be applied in contracts transitioning valuable
technologies with high potential to generate revenue and which the licensor wants to avoid
becoming licensee’s hostage in terms of revenue generation. Indeed according Goldscheider
“minimum royalties may also be used to eliminate licensees who cannot perform adequately by
providing a mechanism to "weed out" the unsuccessful licensees” (1995, p.12). Therefore, we
generated a dependent variable calculated based on a binary outcome with the observations
taking value 1 if the contract includes the payment of minimum royalty fees and 0 otherwise.
Consequently, we expect that the main independent variables used to predict the dissipation
effect equation will have the opposite direction when estimated against this dependent variable
capturing the remuneration conditions of a licensing deal. We expect that the negative and
75
significant effect that licensing a core technology has on the licensor’s market-share, will be
positive in terms of the likelihood that this remuneration clause will be evoked. Following this
logic, we also expect the opposite moderating effects for licensee size and technological
overlap.
Considering the discrete nature of the dependent variable we used a logit model with robust
standard errors to estimate the likelihood that this clause will be used in a licensing contract
simultaneously. We included the same explanatory variables used in the fixed effects model,
apart from the variable Royalty Sales and the licensor market-share in the year prior to the
licensing date.
[Insert Table 3 around here]
In line with our expectations we find a positive and significant effect of the licensor’s core
technology on the likelihood that the licensing contract will include a minimum royalty fee
clause. This result suggests that the licensor is more likely to require safer remunerations
conditions (that do not depend on licensee performance) as a way to compensate the dissipation
effect caused by licensing-out core technologies. Examining the interaction between the
licensor’s core technology and technological overlap (low) between the licensor and the
licensee we also find support to the idea that low levels of overlap between both parts
negatively moderate the relationship between core technology and remuneration conditions. Our
results don’t lend support to the moderating effect that licensee size is expected to have on the
remuneration conditions of licensing contracts.
2.5. Discussion and Conclusions
This article starts by developing a conceptual model to explain the rent dissipation effect using
the concepts found in the markets for technology literature. Despite the fact that the dissipation
effect has been recurrently mentioned as one of the main dimensions of technology licensing,
only few studies have examined this topic. In this paper, we focus on the extent to which the
76
licensed technology represents a licensor’s core technology. We posit that licensing core
technologies is more likely to increase the dissipation effect caused by the existence of product
market downstream assets. Furthermore, we incorporate into our model the licensee’s point of
view by considering that licensee size plays an important moderating role in strengthening the
negative effect caused by licensing core technologies. Finally, we draw on recent advances in
the markets for technology literature and test the effect of technological overlap in the context
of licensing contracts. Indeed, the fact that the licensor and the licensee operate in different
technological niches within the same industry alleviates the rent dissipation effect experienced
by the licensor.
The results should also be considered in light of some limitations. First, the literature on
markets for technology conceptualizes the dissipation effect as a direct effect of increasing
competition on the licensors product market. However, the way that we are able to
operationalize our dependent variable does not allow distinguishing between a relative reduction
in the licensor’s current market share as a consequence of more fierce competition and the cases
in which firms purposefully choose to reduce its share in the product market (e.g., licensing-out
a specific line of business). This is a limitation that future research should try to deal with.
Second, although we try to rule-out issues with reverse causality (a firm licenses a core
technology because is experiencing financial problems), it could be possible that other
unobserved factors related to firm performance can lead to the decision to license core
technologies. However, we believe that the use of a fixed effects associated with several firm,
technology and industry control variables used in the econometric model offers a robust setting
to minimize such concerns. Third, our proxy for how core a technology is to the licensor is
based patenting information, the most appropriate solution would be the use of measure
connecting the licensed technology directly with produce market. Nevertheless, several studies
have indicated patent data to be a robust indicator for firm technological activities which is
naturally reflected in the firm’s product market. Fourth, despite the fact that we believe the
number of patents to be a reliable proxy for licensee size, further studies should use a more

77
precise measure that allows examining how the licensee downstream assets affect the rent
dissipation. Finally, the results are not directly generalizable; the pharmaceutical industry is a
specific case in which the several characteristics offer the necessary conditions for a well-
functioning market for technology where patents work as the main appropriability strategy.
Despite those limitations we believe that this paper contributes by shedding light on important,
and relatively unexplored, dimensions of the licensing literature. We encourage future research
to explore further the contingencies related to the dissipation effect against empirical data. In
this line, a possible extension would be how firms can use the contractual design of licensing
contracts to prevent licensees from becoming potential competitors.
78
2.6. References
Anand, B. N. & Khanna, T., 2000a. The Structure of Licensing Contracts. Journal of Industrial
Economics, 48(1): 103-135.
Anand, B. N. & Khanna, T., 2000b. Do Firms Learn to Create Value? The Case of Alliances.
Strategic Management Journal, 21(3): 295-315.
Arora, A. & Gambardella, A., 1994. Evaluating Technological Information and Utilizing it:
Scientific Knowledge, Technological Capability, and External Linkages in Biotechnology.
Journal of Economic Behavior & Organization, 24(1): 91-114.
Arora, A., Fosfuri, A., & Gambardella, A., 2001. Markets for Technology and their Implications
for Corporate Strategy. Industrial & Corporate Change, 10(2): 419-451.
Arora, A. & Fosfuri, A., 2003. Licensing the Market for Technology. Journal of Economic
Behavior & Organization, 52(2): 277.
Arora, A. & Ceccagnoli, M. 2006. Patent Protection, Complementary Assets, and Firms'
Incentives for Technology Licensing. Management Science, 52(2): 293-308.
Arora, A. & Gambardella, A., 2010. Ideas for rent: an Overview of Markets for Technology.
Industrial & Corporate Change, 19(3): 775-803.
Arora, A. & Ceccagnoli, M., 2011. Patent Protection, Complementary Assets, and Firms'
Incentives for Technology Licensing. In M. J. Leiblein & A. A. Ziedonis (Eds.),
Technology Strategy and Innovation Management: 193-208: Strategic Management
series, vol. 4. Cheltenham, U.K. and Northampton, Mass.: Elgar.
Atuahene-Gima, K., 1993. Determinants of Inward Technology Licensing Intentions: An
Empirical Analysis of Australian Engineering Firms. Journal of Product Innovation
Management, 10(3): 230-240.
Audretsch, D. & Feldman, M., 2003. Small-Firm Strategic Research Partnerships: The Case of
Biotechnology. Technology Analysis & Strategic Management, 15(2): 273-288.
Avolio, B. J., Yammarino, F. J., & Bass, B. M., 1991. Identifying Common Methods Variance
With Data Collected From A Single Source: An Unresolved Sticky Issue. Journal of
Management, 17(3): 571-587.
Battersby, G. J. & Grimes, C. W., 2005. Licensing Royalty Rates. New York: Aspen Publishers.
Cantwell, J. & Santangelo, G. D., 2000. Capitalism, Profits and Innovation in the New Techno-
Economic Paradigm. Journal of Evolutionary Economics, 10(1-2): 131-157.

79
Cassiman, B. & Veugelers, R., 2006. In Search of Complementarity in Innovation Strategy:
Internal R&D and External Knowledge Acquisition. Management Science, 52(1): 68-82.
Ceccagnoli, M. & Hicks, D., 2012. Complementary Assets and the Choice of Organizational
Governance: Empirical Evidence From a Large Sample of U.S. Technology-Based Firms.
IEEE Trans. Eng. Manage. IEEE Transactions on Engineering Management: 1-14.
Ceccagnoli, M. & Jiang, L., 2012. The Cost of Integrating External technologies: Supply and
Demand Drivers of Value Creation in the Markets for Technology. Strategic Management
Journal 34: 404-425.
Ceccagnoli, M. & Jiang, L., 2013. The Cost of Integrating External Technologies: Supply and
Demand Drivers of Value Creation in the Markets for Technology. Strategic Management
Journal, 34(4): 404-425.
Chen, M.-J. & Hambrick, D. C., 1995. Speed, Stealth, and Selective Attack: How Small Firms
Differ from Large Firms in Competitive Behavior. The Academy of Management Journal,
38(2): 453-482.
Chesbrough, H. W., 2003. Open Innovation : The New Imperative for Creating and Profiting
from Technology. Boston, Mass.: Harvard Business School Press.
Choi, J. P., 2002. A Dynamic Analysis of Licensing: The "Boomerang" Effect and Grant-Back
Clauses. International Economic Review, 43(3): 803-829.
Cohen, W. M. & Levinthal, D. A., 1990. Absorptive Capacity: A New Perspective on Learning
and Innovation. Administrative Science Quarterly, 35(1): 128-152.
Cohen, W. M., Nelson, R. R., & Walsh, J. P., 2000. Protecting Their Intellectual Assets:
Appropriability Conditions and Why U.S. Manufacturing Firms Patent (or Not). Working
paper series.(7552).
Coles, J. L., Lemmon, M. L., & Felix Meschke, J., 2012. Structural Models and Endogeneity in
Corporate Finance: The Link between Managerial Ownership and Corporate
performance. Journal of Financial Economics, 103(1): 149-168.
Dosi, G. & Marengo, L., 2007. On the Evolutionary and Behavioral Theories of Organizations:
A Tentative Roadmap. Organization Science, 18(3): 491-502.
Doty, D. H. & Glick, W. H., 1998. Common Methods Bias: Does Common Methods Variance
Really Bias Results? Organizational Research Methods, 1(4): 374-406.
Duysters, G. & Hagedoorn, J., 2000. Core Competences and Company Performance in the
World-Wide Computer Industry. Journal of High Technology Management Research,
11(1): 75-91.

80
Eswaran, M., 1994. Cross-Licensing of Competing Patents as a Facilitating Device. The
Canadian Journal of Economics / Revue canadienne d'Economique, 27(3): 689-708.
Ferrier, W. J., Smith, K. G., & Grimm, C. M., 1999. The Role of Competitive Action in Market
Share Erosion and Industry Dethronement: A Study of Industry Leaders and Challengers.
The Academy of Management Journal, 42(4): 372-388.
Fershtman, C. & Kamien, M. I., 1992. Cross Licensing of Complementary Technologies.
International Journal of Industrial Organization, 10(3): 329-348.
Fosfuri, A., 2006. The Licensing Dilemma: Understanding the Determinants of the Rate of
Technology Licensing. Strategic Management Journal, 27(12): 1141-1158.
Gallini, N. T. & Wright, B. D., 1990. Technology Transfer under Asymmetric Information. The
RAND Journal of Economics, 21(1): 147-160.
Gambardella, A., Giuri, P., & Luzzi, A., 2007. The Market for Patents in Europe. Research
Policy, 36(8): 1163-1183.
Gambardella, A., Harhoff, D., & Verspagen, B., 2008. The Value of European Patents.
European Management Review, 5(2): 69-84.
Gambardella, A. & Giarratana, M. S., 2012. General Technological Capabilities, Product
Market Fragmentation, and markets for technology. Research Policy(forthcoming).
Gans, J. S. & Stern, S., 2003. The Product Market and the Market for “Ideas”:
Commercialization Strategies for Technology Entrepreneurs. Research Policy, 32(2):
333-350.
Gans, J. S., Hsu, D. H., & Stern, S., 2008. The Impact of Uncertain Intellectual Property Rights
on the Market for Ideas: Evidence from Patent Grant Delays. Management Science,
54(5): 982-997.
Gans, J. S. & Stern, S., 2010. Is There a Market for Ideas? Industrial and Corporate Change,
19(3): 805-837.
Giroud, X. & Mueller, H. M., 2011. Corporate Governance, Product Market Competition, and
Equity Prices. The Journal of Finance, 66(2): 563-600.
Goldscheider, R., 1995. Negotiation of Royalties and Other Sources of Income from Licensing,
The. IDEA, 36: 1.
Granstrand, O., Patel, P., & Pavitt, K., 1997. Multi-Technology Corporations: Why They Have
"Distributed" Rather than "Distinctive Core" Competencies. California management
review., 39(4): 8.
81
Granstrand, O., 1999. The Economics and Management of Intellectual Property: Towards
Intellectual Capitalism. Edward Elgar Cheltenham, UK.
Greene, W. H., 2003. Econometric Analysis. Upper Saddle River, N.J.: Prentice Hall.
Griliches, Z., 1990. Patent Statistics as Economic Indicators - a Survey. Journal of Economic
Literature, 28(4): 1661-1707.
Grindley, P. C. & Teece, D. J., 1997. Managing Intellectual Capital: Licensing and Cross-
Licensing in Semiconductors and Electronics. California Management Review, 39(2): 8-
41.
Hagedoorn, J., 2002. Inter-firm R&D partnerships: an overview of major trends and patterns
since 1960. Research Policy Research Policy, 31(4): 477-492.
Hagedoorn, J. & Cloodt, M., 2003. Measuring innovative performance: is there an advantage in
using multiple indicators? Research Policy, 32(8): 1365-1379.
Hall, B. H., Jaffe, A. B., & Trajtenberg, M., 2001. The NBER Patent Citations Data File:
Lessons, Insights and Methodological Tools: NBER Working Paper, No. 8498.
Hannan, M. T. & Freeman, J., 1977. The Population Ecology of Organizations. American
Journal of Sociology, 82(5): 929-964.
Hausman, J. A., 1978. Specification Test in Econometrics. Econometrica, 46(6): 1251-1271.
Helpman, E., 1998. General purpose technologies and economic growth: The MIT press.
Hill, C. W. L. & Rothaermel, F. T., 2003. The Performance of Incumbent Firms in the Face of
Radical Technological Innovation. The Academy of Management Review, 28(2): 257-
274.
Hoang, H. & Rothaermel, F. T., 2010. Leveraging Internal and External Experience:
Exploration, Exploitation, and R&D Project Performance. Strategic Management
Journal, 31(7): 734-758.
Jaffe, A. B., 1986. Technological Opportunity and Spillovers of R&D : Evidence from Firm's
Patents, Profits and Market Value. NBER Working Papers 1815, National Bureau of
Economic Research.
Jaffe, A. B., 1989. Real Effects of Academic Research. American Economic Review, 79(5):
957-970.
Jensen, R. & Thursby, M., 2001. Proofs and Prototypes for Sale: The Licensing of University
Inventions. The American Economic Review, 91(1): 240-259.
82
Kamien, M. I., 1992. Patent Licensing. Handbook of game theory with economic applications,
1: 331-354.
Kamiyama, S., Sheehan, J., & Martínez, C., 2006. Valuation and Exploitation of Intellectual
Property. OECD Publishing.
Kani, M. & Motohashi, K., 2012. Understanding the Technology Market for Patents: New
Insights from a Licensing Survey of Japanese Firms. Research Policy, 41(1): 226-235.
Katz, M. L. & Shapiro, C., 1985. On the Licensing of Innovations. The RAND Journal of
Economics, 16(4): 504-520.
Kulatilaka, N. & Lin, L., 2006. Impact of Licensing on Investment and Financing of Technology
Development. Management Science, 52(12): 1824-1837.
Lanjouw, J. O. & Schankerman, M., 2004. Patent Quality and Research Productivity:
Measuring Innovation with Multiple Indicators. Economic Journal, 114(495): 441-465.
Laursen, K., Leone, M. I., & Torrisi, S., 2010. Technological Exploration through Licensing:
New Insights from the Licensee's Point of View. Industrial and Corporate Change, 19(3):
871-897.
Lei, D. & Slocum Jr, J. W., 1991. Global Strategic Alliances: Payoffs and Pitfalls.
Organizational Dynamics, 19(3): 44-62.
Leone, M. I. & Reichstein, T., 2012. Licensing-in Fosters Rapid Invention! the Effect of the
Grant-Back Clause and Technological Unfamiliarity. Strategic Management Journal,
33(8): 965-985.
Lowe, J. & Taylor, P., 1999. Imitation through Technology Licensing: Strategic Implications
for Smaller Firms. International Journal of Innovation Management, 3(02): 185-207.
Mowery, D. C., Sampat, B. N., & Ziedonis, A. A., 2002. Learning to Patent: Institutional
Experience, Learning, and the Characteristics of U. S. University Patents after the Bayh-
Dole Act, 1981-1992. Management Science, 48(1): 73-89.
Nooteboom, B., Van Haverbeke, W., Duysters, G., Gilsing, V., & van den Oord, A., 2007.
Optimal Cognitive Distance and Absorptive Capacity. Research Policy, 36(7): 1016-
1034.
Parr, R. L. & Sullivan, P. H., 1996. Technology Licensing: Corporate Strategies for Maximizing
Value. New York: Wiley.
Prahalad, C. K. & Hamel, G., 1993. The Core Competence of the Corporation. Boston, MA:
Harvard Business School.
83
Quintana-García, C. & Benavides-Velasco, C. A., 2008. Innovative Competence, Exploration
and Exploitation: The Influence of Technological Diversification. Research Policy, 37(3):
492-507.
Rivette, K. G. & Kline, D., 2000. Discovering New Value in Intellectual Property. Harvard
business review., 78(1): 54.
Roberts, P. W., 1999. Product Innovation, Product-Market Competition and Persistent
Profitability in the U.S. Strategic Management Journal, 20(7): 655-670.
Sakakibara, M., 2010. An Empirical Analysis of Pricing in Patent Licensing Contracts.
Industrial and Corporate Change, 19(3): 927-945.
Sampson, R. C., 2007. R&D Alliances and Firm Performance: The Impact of Technological
Diversity and Alliance Organization on Innovation. Academy of Management Journal,
50(2): 364-386.
Schilling, M. A., 2009. Understanding the alliance data. Strategic Management Journal, 30(3):
233-260.
Shepard, A., 1987. Licensing to Enhance Demand for New Technologies. The RAND Journal of
Economics, 18(3): 360-368.
Somaya, D., Kim, Y., & Vonortas, N. S., 2011. Exclusivity in licensing alliances: using
hostages to support technology commercialization. Strategic Management Journal, 32(2):
159-186.
Song, J., Almeida, P., & Wu, G., 2003. Learning–by–Hiring: When Is Mobility More Likely to
Facilitate Interfirm Knowledge Transfer? Management Science, 49(4): 351-365.
Teece, D. J., 1986. Profiting from technological innovation: Implications for integration,
collaboration, licensing and public policy. Research Policy, 15(6): 285-305.
Trajtenberg, M., 1990. A penny for your quotes: patent citations and the value of innovations.
RAND Journal of Economics (RAND Journal of Economics), 21(1): 172-187.
Van Wijk, R., Jansen, J. J. P., & Lyles, M. A., 2008. Inter- and Intra-Organizational
Knowledge Transfer: A Meta-Analytic Review and Assessment of its Antecedents and
Consequences. Journal of Management Studies, 45(4): 830-853.
Verbeek, M., 2000. A Guide to Modern Econometrics. Chichester; New York: Wiley.
Walter, J., 2012. The Influence of Firm and Industry Characteristics on Returns from
Technology Licensing Deals: Evidence from the US Computer and Pharmaceutical
Sectors. R&D Management, 42(5): 435-454.
84
Wang, X. H., 1998. Fee Versus Royalty Licensing in a Cournot Duopoly Model. Economics
Letters, 60(1): 55-62.
Welch, L. S., Benito, G. R., & Petersen, B., 2008. Foreign Operation Methods: Theory,
Analysis, Strategy: Edward Elgar Publishing.
Wooldridge, J. M., 2002. Econometric Analysis of Cross Section and Panel Data. Cambridge,
Mass.: MIT Press.
Wooldridge, J. M., 2012. Introductory Econometrics : a Modern Approach. Mason, Ohio:
South-Western Cengage Learning.
Zuniga, M. & Guellec, D., 2009. Who Licenses out Patents and Why? Lessons from a Business
Survey, STI Working Paper 2009/5.
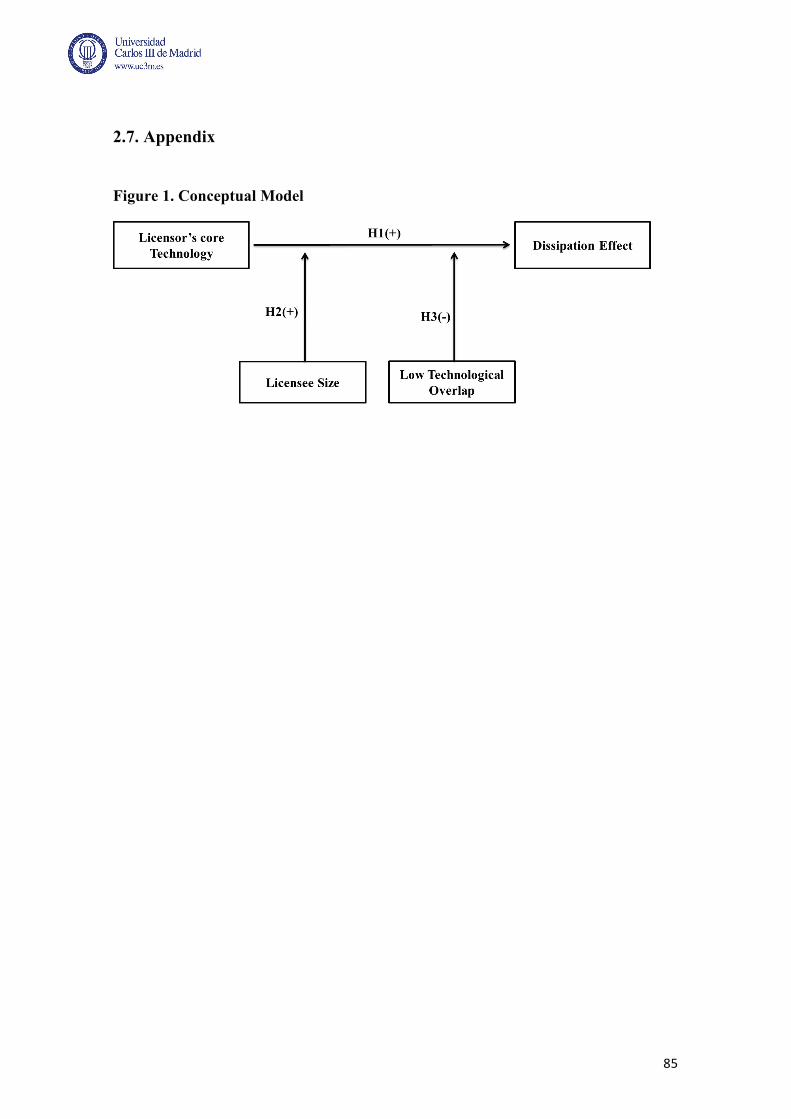
2.7. Appendix
Figure 1. Conceptual Model
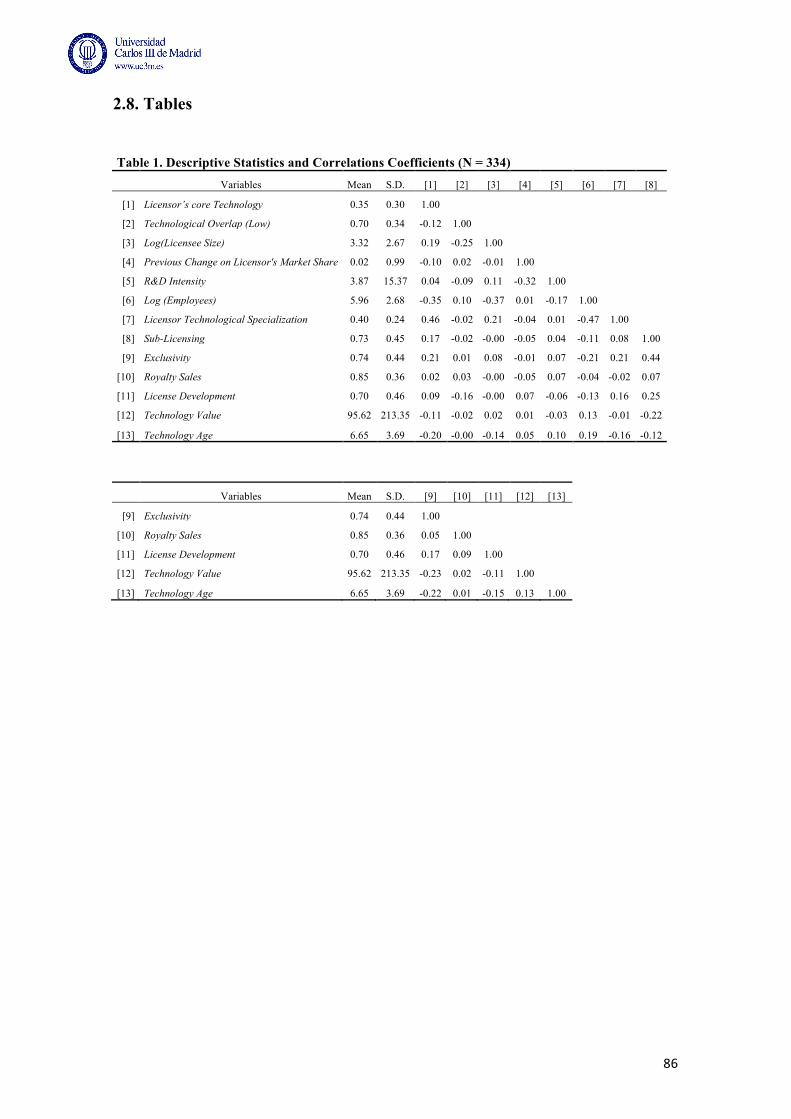
86
2.8. Tables
Table 1. Descriptive Statistics and Correlations Coefficients (N = 334) Variables Mean S.D. [1] [2] [3] [4] [5] [6] [7] [8]
[1] Licensor’s core Technology 0.35 0.30 1.00 [2] Technological Overlap (Low) 0.70 0.34 -0.12 1.00
[3] Log(Licensee Size) 3.32 2.67 0.19 -0.25 1.00 [4] Previous Change on Licensor's Market Share 0.02 0.99 -0.10 0.02 -0.01 1.00
[5] R&D Intensity 3.87 15.37 0.04 -0.09 0.11 -0.32 1.00 [6] Log (Employees) 5.96 2.68 -0.35 0.10 -0.37 0.01 -0.17 1.00
[7] Licensor Technological Specialization 0.40 0.24 0.46 -0.02 0.21 -0.04 0.01 -0.47 1.00 [8] Sub-Licensing 0.73 0.45 0.17 -0.02 -0.00 -0.05 0.04 -0.11 0.08 1.00
[9] Exclusivity 0.74 0.44 0.21 0.01 0.08 -0.01 0.07 -0.21 0.21 0.44
[10] Royalty Sales 0.85 0.36 0.02 0.03 -0.00 -0.05 0.07 -0.04 -0.02 0.07
[11] License Development 0.70 0.46 0.09 -0.16 -0.00 0.07 -0.06 -0.13 0.16 0.25
[12] Technology Value 95.62 213.35 -0.11 -0.02 0.02 0.01 -0.03 0.13 -0.01 -0.22
[13] Technology Age 6.65 3.69 -0.20 -0.00 -0.14 0.05 0.10 0.19 -0.16 -0.12
Variables Mean S.D. [9] [10] [11] [12] [13]
[9] Exclusivity 0.74 0.44 1.00
[10] Royalty Sales 0.85 0.36 0.05 1.00
[11] License Development 0.70 0.46 0.17 0.09 1.00
[12] Technology Value 95.62 213.35 -0.23 0.02 -0.11 1.00
[13] Technology Age 6.65 3.69 -0.22 0.01 -0.15 0.13 1.00
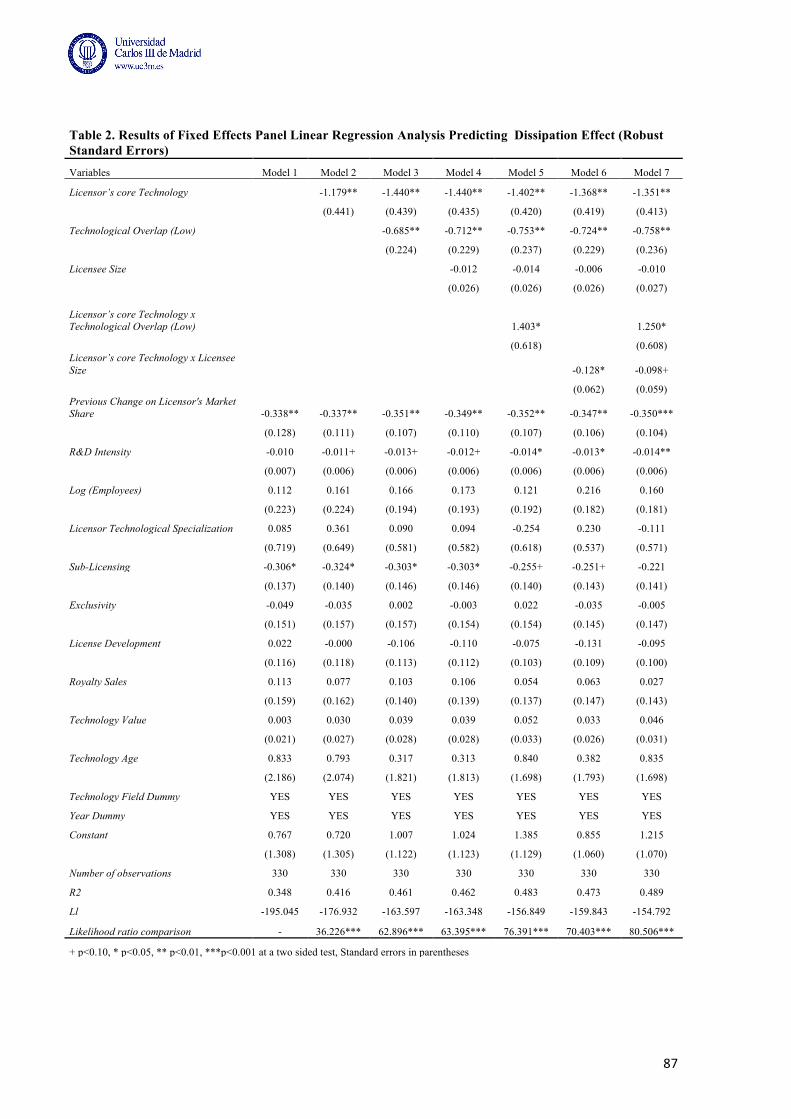
87
Table 2. Results of Fixed Effects Panel Linear Regression Analysis Predicting Dissipation Effect (Robust Standard Errors) Variables Model 1 Model 2 Model 3 Model 4 Model 5 Model 6 Model 7
Licensor’s core Technology
-1.179** -1.440** -1.440** -1.402** -1.368** -1.351**
(0.441) (0.439) (0.435) (0.420) (0.419) (0.413)
Technological Overlap (Low)
-0.685** -0.712** -0.753** -0.724** -0.758**
(0.224) (0.229) (0.237) (0.229) (0.236)
Licensee Size
-0.012 -0.014 -0.006 -0.010
(0.026) (0.026) (0.026) (0.027)
Licensor’s core Technology x Technological Overlap (Low)
1.403*
1.250*
(0.618)
(0.608)
Licensor’s core Technology x Licensee Size
-0.128* -0.098+
(0.062) (0.059)
Previous Change on Licensor's Market Share -0.338** -0.337** -0.351** -0.349** -0.352** -0.347** -0.350***
(0.128) (0.111) (0.107) (0.110) (0.107) (0.106) (0.104)
R&D Intensity -0.010 -0.011+ -0.013+ -0.012+ -0.014* -0.013* -0.014**
(0.007) (0.006) (0.006) (0.006) (0.006) (0.006) (0.006)
Log (Employees) 0.112 0.161 0.166 0.173 0.121 0.216 0.160
(0.223) (0.224) (0.194) (0.193) (0.192) (0.182) (0.181)
Licensor Technological Specialization 0.085 0.361 0.090 0.094 -0.254 0.230 -0.111
(0.719) (0.649) (0.581) (0.582) (0.618) (0.537) (0.571)
Sub-Licensing -0.306* -0.324* -0.303* -0.303* -0.255+ -0.251+ -0.221
(0.137) (0.140) (0.146) (0.146) (0.140) (0.143) (0.141)
Exclusivity -0.049 -0.035 0.002 -0.003 0.022 -0.035 -0.005
(0.151) (0.157) (0.157) (0.154) (0.154) (0.145) (0.147)
License Development 0.022 -0.000 -0.106 -0.110 -0.075 -0.131 -0.095
(0.116) (0.118) (0.113) (0.112) (0.103) (0.109) (0.100)
Royalty Sales 0.113 0.077 0.103 0.106 0.054 0.063 0.027
(0.159) (0.162) (0.140) (0.139) (0.137) (0.147) (0.143)
Technology Value 0.003 0.030 0.039 0.039 0.052 0.033 0.046
(0.021) (0.027) (0.028) (0.028) (0.033) (0.026) (0.031)
Technology Age 0.833 0.793 0.317 0.313 0.840 0.382 0.835
(2.186) (2.074) (1.821) (1.813) (1.698) (1.793) (1.698)
Technology Field Dummy YES YES YES YES YES YES YES
Year Dummy YES YES YES YES YES YES YES
Constant 0.767 0.720 1.007 1.024 1.385 0.855 1.215
(1.308) (1.305) (1.122) (1.123) (1.129) (1.060) (1.070)
Number of observations 330 330 330 330 330 330 330
R2 0.348 0.416 0.461 0.462 0.483 0.473 0.489
Ll -195.045 -176.932 -163.597 -163.348 -156.849 -159.843 -154.792
Likelihood ratio comparison - 36.226*** 62.896*** 63.395*** 76.391*** 70.403*** 80.506***
+ p<0.10, * p<0.05, ** p<0.01, ***p<0.001 at a two sided test, Standard errors in parentheses
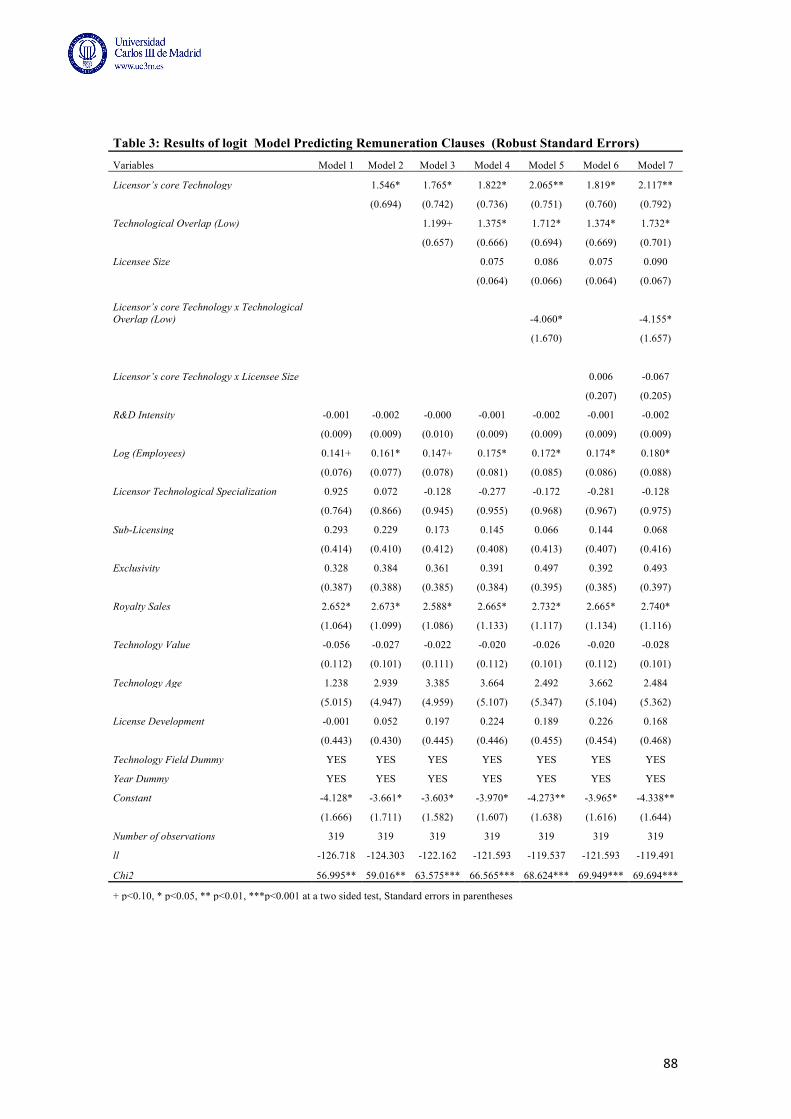
88
Table 3: Results of logit Model Predicting Remuneration Clauses (Robust Standard Errors) Variables Model 1 Model 2 Model 3 Model 4 Model 5 Model 6 Model 7
Licensor’s core Technology
1.546* 1.765* 1.822* 2.065** 1.819* 2.117**
(0.694) (0.742) (0.736) (0.751) (0.760) (0.792)
Technological Overlap (Low)
1.199+ 1.375* 1.712* 1.374* 1.732*
(0.657) (0.666) (0.694) (0.669) (0.701)
Licensee Size
0.075 0.086 0.075 0.090
(0.064) (0.066) (0.064) (0.067)
Licensor’s core Technology x Technological Overlap (Low)
-4.060*
-4.155*
(1.670)
(1.657)
Licensor’s core Technology x Licensee Size
0.006 -0.067
(0.207) (0.205)
R&D Intensity -0.001 -0.002 -0.000 -0.001 -0.002 -0.001 -0.002
(0.009) (0.009) (0.010) (0.009) (0.009) (0.009) (0.009)
Log (Employees) 0.141+ 0.161* 0.147+ 0.175* 0.172* 0.174* 0.180*
(0.076) (0.077) (0.078) (0.081) (0.085) (0.086) (0.088)
Licensor Technological Specialization 0.925 0.072 -0.128 -0.277 -0.172 -0.281 -0.128
(0.764) (0.866) (0.945) (0.955) (0.968) (0.967) (0.975)
Sub-Licensing 0.293 0.229 0.173 0.145 0.066 0.144 0.068
(0.414) (0.410) (0.412) (0.408) (0.413) (0.407) (0.416)
Exclusivity 0.328 0.384 0.361 0.391 0.497 0.392 0.493
(0.387) (0.388) (0.385) (0.384) (0.395) (0.385) (0.397)
Royalty Sales 2.652* 2.673* 2.588* 2.665* 2.732* 2.665* 2.740*
(1.064) (1.099) (1.086) (1.133) (1.117) (1.134) (1.116)
Technology Value -0.056 -0.027 -0.022 -0.020 -0.026 -0.020 -0.028
(0.112) (0.101) (0.111) (0.112) (0.101) (0.112) (0.101)
Technology Age 1.238 2.939 3.385 3.664 2.492 3.662 2.484
(5.015) (4.947) (4.959) (5.107) (5.347) (5.104) (5.362)
License Development -0.001 0.052 0.197 0.224 0.189 0.226 0.168
(0.443) (0.430) (0.445) (0.446) (0.455) (0.454) (0.468)
Technology Field Dummy YES YES YES YES YES YES YES
Year Dummy YES YES YES YES YES YES YES
Constant -4.128* -3.661* -3.603* -3.970* -4.273** -3.965* -4.338**
(1.666) (1.711) (1.582) (1.607) (1.638) (1.616) (1.644)
Number of observations 319 319 319 319 319 319 319
ll -126.718 -124.303 -122.162 -121.593 -119.537 -121.593 -119.491
Chi2 56.995** 59.016** 63.575*** 66.565*** 68.624*** 69.949*** 69.694***
+ p<0.10, * p<0.05, ** p<0.01, ***p<0.001 at a two sided test, Standard errors in parentheses
89
CHAPTER 3 -‐ Sources of Appropriation Capacity in Licensing Agreements
3.1. Introduction
Transactions in markets for technology have significantly increased during the last two decades
(Arora et al. 2001, Sheehan et al. 2004; Robbins, 2006; Athreye & Cantwell, 2007). The rapid
development of the information and technology sector, the intensive competition, the dynamic
changes in customer needs and the shorter product life-cycles have forced effective companies
to rely on both in-house research and external sources of knowledge. As a consequence, the
volume and the importance of licensing agreements have both increased remarkably (Zuniga
and Guellec, 2009; Kamiyama, 2006; Conti et al. 2013). Nowadays, it represents one of the
most important options available to transfer technology (Anand & Khanna, 2000b; Arora &
Fosfuri, 2003). In fact, given its significance, the U.S. Department of Justice has defined
markets for technology as “markets that consist of intellectual property that is licensed and its
close substitutes” (U.S. Department of Justice, 1995). Indeed, in several industries licensing has
become an integral part of firms’ strategy to appropriate value from innovation (Gans & Stern,
2003).
Consistently, licensing has attracted increasing attention in the management literature. In this
area, research has mainly focused on analyzing the strategic determinants that influence the
licensing decision (Gans et al., 2008; Gambardella et al., 2007; Kani and Motohashi, 2012;
Bianchi et al., 2011; Cockburn et al., 2010; Kim and Vonortas, 2006; Fosfuri, 2006), on
quantifying the transactions in markets for technology (Arora et al. 2001; Sheehan et al. 2004;
Robbins, 2006; Athreye and Cantwell; 2007), on proposing the optimal licensing payment form
(Katz and Shapiro, 1985; Gallini, 1984; Gallini and Winter, 1985; Kamien and Tauman, 1986;
Rockett, 1990; Bousquet et al. 1998; Vishwasrao, 2007) and on studying the relationship
between licensing-in and firm performance (Zahra, 1996b; Jones et al., 2001;Rothaermel et al.,
2006; Cassiman and Veugelers, 2006; Tsai and Wang, 2007). However, to the best of my
knowledge, previous research has not put much emphasis on the factors that influence the
appropriation capacity of the parties involved in the agreement. The main reason that explains
this lack is the no availability of uniform licensing data: licensing agreements are confidential
and it is not compulsory for companies to report licensing revenues as a separate item in the
income statement. Hence, previous research in licensing has relied on cumulative abnormal
returns (CARs) as a market based measure of performance (Annand and Khanna, 2000b and
90
Walter, 2012). Specifically, Anand and Khanna (2000b) found that licensing agreements in
general generates CARs equal to 3.13% over a 14-day window, but they did not distinguish
between the parties and just found one significant determinant of cumulative abnormal returns:
licensing experience. On the other hand, Walter (2012) showed that CAR for licensors is almost
double that for licensees (2.00% vs 1.06%) and he also pointed out four different determinants
that impact it: firm size, R&D intensity, business relatedness and industry. Nevertheless, it is
very important to conduct a deeper analysis of the stock market reaction to the announcement of
licensing agreements. This empirical question is important for the following reasons. First, in an
efficient market the current share price is the best available estimate of a company true value
(Akhtar, F. and Oliver, B., 2009). Second, previous research has demonstrated that the initial
stock market response to a key event positively correlates with the long-term performance of the
company and the value of the event (Kale et al. 2002). Third, usually managers’ compensation
is linked to the company market value. As a result, in order to maintain their job and their
reputation and to receive a higher salary managers will not make any strategic decision that
could negatively influence this variable. Fourth, it is necessary for companies to understand the
signal that the market perceives at the time to license their technology: if a company is licensing
out its technology, does the market view it as a signal of superior technology or a signal of lack
of capability to commercialize the technology by itself?
This study analyzes the determinants of licensors’ appropriation capacity at the moment they
announce a licensing agreement. In particular, I argue that licensors’ appropriation capacity is a
function of their bargaining power and the potential costs of imitation. Regarding bargaining
power, I posit that it is determined by the existence of financial constraints in the company and
the presence of information asymmetries between parties. First, previous literature has noted
that financial constraints erode the bargaining power of companies (Aghion and Tirole, 1994;
Lerner and Merger, 1998), so I hypothesize that companies with cash constraints, as a
consequence of their weak bargaining power, appropriate fewer benefits from licensing than
companies that are not cash constrained. Second, previous research has demonstrated that
incomplete information reduces the bargaining power of the company (Chattejee & Samuelson,
1983). Thus, I hypothesize that licensors are better able to appropriate benefits from licensing
when they license out in the same sector (characterized by lower information asymmetries) than
when they license out to another sector (characterized by higher information asymmetries).
Since bargaining power in each situation determines licensors’ success and the level of rewards
in the agreement (Kim, 1997; Mannix, 1993a; Pinkley, Neale, and Bennett, 1994), I expect it to
increase the licensor’s appropriation capacity in terms of market value. When it comes to the
potential cost of imitation, I argue that it has a negative influence on licensors’ appropriation
capacity. Since the threat of imitation increases with licensors’ greater market share (Arora and
91
Fosfuri, 2003), I hypothesize that licensors that lead a specific sector (i.e. have the highest
marker share) appropriate fewer benefits from licensing than those that are followers.
To test these hypotheses, I used a sample of 260 licensing agreements between U.S. high-tech
public companies during 1998–2009. Licensing data came from four different sources: Prompt
Database, Google, Highbeam Research, and SDC Platinum. To analyze the impact on licensors’
market value at the time of announcing the contract, I ran an event study around the
announcement dates using a two-day event window (-1,0). In order to obtain the average
cumulative abnormal returns I followed Flammer’s (2013) procedure: I computed abnormal
returns using the market model, estimated the coefficients with ordinary least squares based on
200 trading days [-240, -41], and employed the daily return of the equally weighted market
portfolio as a reference. To determine if the proposed contingencies have different impacts on
licensors’ appropriation capacity, I designated six subsamples. As a robustness checks I
considered (-1,1) and (-3,3) event windows under the market model and I also checked if my
results were influenced by the choice of the model or the choice of the reference portfolio using
the market adjusted model and the value weighted index as well. In addition, as second
hypothesis provides us insights regarding the choice of the sector and the third one regarding
the relative position of the company in the sector, I explore their combined effect on CARs in
conjunction, considering four additional cases.
The results of this study show that (1) companies with cash constraints appropriate fewer
benefits from licensing than companies with no cash problems in terms of market value (1.10%
vs. 2.65%); (2) companies that license out under low information asymmetries (same sector)
benefit more from licensing than do companies that license out under high information
asymmetries (different sector), in terms of market value (7.27% vs. 1.53%); (3) leaders in the
sector benefit much less from licensing, in terms of market value, than companies that follow
(0.61% vs. 3.86%); (4) in the specific context of licensing out in the same sector, leaders
appropriate much less value than companies that follow (0.73% vs. 8.46%); and (5) the
difference between being a leader and being a follower is less important when a company
licenses out to a different sector (0.59% vs. 2.19%).
This study contributes an analysis of value appropriation in licensing agreements. Just Walter
(2012) has addressed the benefits appropriated by each individual partner proposing four
determinants that influence the impact on the stock market. I seek to improve our understanding
of licensors’ appropriation capacity, through an analysis of company, sector, and industry
factors. Furthermore, this article provides evidence of the licensing trade-off. Fosfuri (2006)
theoretically describes the dilemma that licensing entails but does not show empirically how
92
both effects interact. This paper uses market value to explicate the effect of this trade-off
empirically. Specifically, by observing licensors’ market value, I can determine how their
appropriation capacity increases with contingencies that determine the bargaining power but
declines when there is a high potential cost of imitation.
The remainder of this paper is organized as follows. Section 2 presents literature review and
hypotheses development. Section 3 describes the data, variables and methodology. Section 4
reports the results and robustness checks and Section 5 concludes with a discussion of the
results and their managerial implications.
3.2. Theory and Hypotheses Development
Over the last decades a new way to manage R&D innovations has emerged. With strong
competition in the product market, shorter product life cycles, and robust growth in information
and communication technologies, companies cannot produce everything by themselves (Zuniga
and Guellec, 2009). Increasingly, they must trust networks, new entrants, and technology-based
firms if they want to remain efficient and competitive. Licensing agreements thus have
increased in importance and volume, to become the most important method for commercializing
and diffusing new technologies outside the firm (Anand and Khanna, 2000; Hagedoorn, 2002;
Somaya et al. 2010).Despite this surge in popularity, establishing a licensing agreement is not
an easy task. Markets for technology are mainly characterized by asymmetric information
between parties, difficulties in describing and valuing the technology, uncertainty about the
validity and applicability of the traded technology, and the risk of opportunistic behavior by
licensees. Thus it is reasonable to expect that parties do not appropriate the total profits
generated by the agreement equally; neither the licensor nor the licensee can know precisely the
true value of the technology (Dwyer & Walker, 1981).
Therefore, the output of any negotiation depends on the specific characteristics of the company,
sector, and industry in which each licensing agreement is signed. However, while previous
research in licensing deeply analyzed the strategic benefits surrounding the establishment of
these contracts (Telesio, 1979; Katz & Shapiro, 1985; Shepard, 1987; Farrel & Gallini, 1988;
Rockett, 1990; Lei and Slocum, 1991; Lowe and Taylor, 1999; Saphiro, 2001), research
regarding their economic benefits is scarce. In this vein, previous research has mainly focused
on explaining, through the use of surveys, that licensing revenues is one of the main motivations
for companies to license out (Gambardella et al. 2007; Robbins, 2008; Zuniga and Guellec,
2009). However, these studies focused on quantifying the benefits from licensing on markets for
technology at an aggregate level (Arora et al. 2001; Sheehan et al. 2004; OECD,2006; Robbins,
2006; Athreye and Cantwell; 2007).
93
Researchers did not pay attention to the economics benefits at the firm level. To the best of my
knowledge, Walter (2012) offers the only study that analyzes the licensing benefits appropriated
by each party in the agreement. Specifically, analyzing 11 years of licensing in the U.S.
computer and pharmaceutical sector, Walter uses abnormal stock market returns to distinguish
the impact of licensing on the licensor versus the licensee. The results show that average
cumulative abnormal returns (CAR) for licensors are almost double those for licensees (2.00%
vs. 1.06%). In addition, this study pointed out four determinants that influence the impact on the
stock market: firm size (positive), R&D intensity (positive), business relatedness (negative), and
industry (varying).
Considering the strategic corporate implications that such knowledge implies, it seems very
important to analyze in greater depth which factors determine appropriation levels at the time of
a licensing agreement. No doubt, this will help managers to take better advantage of their
technologies and to be conscious of the impact of announcing a licensing agreement.
Accordingly, in this paper I analyze how licensors’ appropriation capacity varies at the time
they announce a licensing agreement. This appropriation capacity should depend on two main
factors: bargaining power and the potential cost of imitation. The former should be a function of
the existence of financial constrains in the company and the presence of information
asymmetries between the parties. With more bargaining power, the licensor can demand more
rewards in the agreement (Kim, 1997; Mannix, 1993a; Pinkley, Neale and Bennett, 1994), so I
expect it to increase the licensor’s appropriation capacity. However, because the cost of
imitation is a function of the relative position that the licensor has in a sector (leader vs.
follower), I expect it to hinder the licensor’s appropriation capacity, in terms of market value.
3.2.1. Bargaining Power: Cash Constraints
Consider a company that has successfully developed a commercial innovation and must choose
between entering the product market (commercialize the final product) or licensing out the
innovation to another company. The choice depends on the net benefits resulting from each
option (Gans, Hsu and Stern, 2002). Companies compare the benefits of developing the final
product on their own (e.g., revenues from sales in the product market, less the costs of acquiring
complementary assets, hiring personnel, and buying necessary raw material) against the benefits
of licensing out (e.g., lower transaction costs, less a potential decrease in market share by
creating more competition). Although the optimal decision is the one that maximizes benefits,
several factors might impede it. For example, companies with cash constraints rarely can
develop the product by themselves. As they lack the needed financial resources it is unlike that
they decide to commercialize the product instead licensing out their technology. Thus, licensing
94
out is often their only option to recover previous investments in R&D. Therefore, following
Fisher and Ury’s (1981) claim that the bargaining power of the company relates positively to
the number of options that companies have, I expect companies that are having cash constraints
to have lower bargaining power than companies that do not.
In addition, Lerner and Merges (1998), consistent with the framework developed by Aghion and
Tirole (1994) and in an attempt to examine the determinants of the allocation of control rights in
alliances, show that the greater their financial resources, the fewer control rights R&D firms
allocate to financial firms. They provide three cases in which internal financial trouble
influenced the final outcome of the contract negotiation suggesting that companies with cash
constraints have lower bargaining power at the time of negotiation.28
Therefore, as the bargaining power of the company relates positively to the number of options
they have (Fisher and Ury, 1981) and companies with cash constraints have lower bargaining
power at the time of negotiation (Lerner and Merges, 1998), I posit that companies facing cash
problems suffer from lower bargaining power and, thus, they should appropriate less value from
licensing than companies without cash constraints.
H1. All else being equal, licensors with short-term cash problems capture lower abnormal
market returns from licensing out technology than licensors that face no cash constraints.
3.2.2. Bargaining Power: Information Asymmetries
Markets for technology are characterized by asymmetric information between parties,
difficulties describing and valuing the focal technology, and uncertainty about the validity and
applicability of the traded technology (Caves et al. 1983; Gallini & Wright, 1990; Arora &
Gambardella, 2010). However, the influence of asymmetric information on the licensor’s
bargaining power varies when the licensing agreement includes companies that belong to the
same sector (low information asymmetry) or different sectors (high information asymmetry).
Thus researchers generally analyze these two cases separately (e.g., Walter, 2012; Müllez-Seitz,
2012).
28 One example they offer is the alliance between ALZA and Giba-Geigy. When negotiating the alliance, ALZA confronted a major
financial crisis. In turn, the alliance agreement assigned almost total control to Ciba-Geigy: It had a supermajority on the joint board
that reviewed and approved potential research projects, the right to license and manufacture any of ALZA’s current or future
products, the ability to block any other alliances that ALZA sought to enter, and eight of the eleven seats on ALZA’s board of
directors. In addition, Ciba-Geigy received a new class of preferred shares. If converted into common stock, they would represent
53% of the equity in ALZA. Prior to this conversion, Ciba-Geigy had 80% of the voting rights, an allocation that allowed it to
employ ALZA’s tax losses (Lerner and Merges, 1993).
95
The rationale for this distinction is that asymmetric information diminishes significantly if the
licensor belongs to the same sector as the licensee. First, companies in the same sector can more
readily detect opportunistic behavior, understand the agreement and its potential, and establish
and communicate a common objective (Koh and Verikatraman, 1991). Second, the similarity of
companies in a sector suggests lower uncertainty and lower transaction costs. Both licensors and
investors then should have more confidence in the selection decision, because they possess good
information about the technology, the company, and the sector in which they operate
(Baladrishnan and Koza, 1993).
If companies license out to a company that belongs to a different sector, licensing instead
represents a way to enter a new market. With this option, companies can recover returns on their
innovative effort, without having to invest additional time or money to develop new sector-
specific assets and knowledge. Yet in this case, the bargaining power of licensors also is much
lower. They face greater information asymmetries and uncertainty, because they do not know
the new sector, do not fully understand how the technology will be used, and lack any previous
experience to help them anticipate opportunistic behavior. Therefore, when companies function
in different sectors and the licensor seeks to expand its technology to another market, a shift in
bargaining power occurs, in that licensors become dependent on licensees to generate returns.
Their only other option is more time consuming and requires a greater monetary investment.
Licensors thus should appropriate more value from licensing out when they deal with a
company that belongs to the same sector. If they deal with a different sector, they face
uncertainty and information asymmetries in relation to the sector, the technology, and the
company. In this case, licensors depend more on the partner’s efforts to extract some benefit
from their technology. Accordingly, I hypothesize that companies that license out to a company
in the same sector appropriate more value than companies that license out to a company that
belongs to a different sector, because of their greater bargaining power.
H2. All else being equal, licensors that license out their technology to companies that belong to
the same sector capture greater abnormal market returns from licensing out technology than do
licensors that license out to companies in other sectors.
96
3.2.3. Costs of Imitation: Leader/ Follower
Through their licensing agreements, licensors grant access to secrets about their technology and
allow licensees to use it. After internalizing and understanding how the licensed technology
works, the licensees thus could invent around the technology, imitate licensors, and compete
directly with them in the product market. Such additional competition would reduce the
licensors’ benefits by an amount equal to the cost of imitation, that is, the difference between
licensors’ benefits in the product market without imitation and their benefits with imitation. The
importance of this cost depends on the presence of the licensor in the product market. Arora and
Fosfuri (2003) show that when market share before licensing is small, the reduction implied by
imitation is almost insignificant, because each company internalizes just a small loss. In
contrast, when companies have higher market shares, the impact of imitation could be very
strong: They suffer significantly reduced market share or price–cost margins due to the
additional competition in the product market.
Therefore, the potential cost of imitation is higher for leaders than for followers in a specific
sector. Leaders usually have the largest market share in the sector, along with accumulated
experience in their business and huge investments in fixed assets. Because they often own
complementary assets, they can benefit from economies of scale in R&D, achieve faster
learning curves, and understand how to commercialize the technology. In this sense, a
significant portion of company benefits depends on leaders’ activity in the product market, so
the impact of imitation could be very negative in terms of competitive advantage. Followers
instead tend to be firms with small market shares, which lack both the downstream assets
needed to commercialize the final product (e.g., distribution channel, marketing, manufacturing)
and the legitimacy in the marketplace needed to leverage incurred R&D expenditures.
Therefore, licensing may represent the only way to recover their previous investments (Teece,
1986; Kollmer and Dowling, 2004), establish relationships with large companies, and enhance
their reputation (Teece, 1986; Stuart et al. 1999; Shane and Venkataraman, 2000). Followers
have incentives to license out their technology: They have much to earn from licensing and little
to lose in the product market. Because leaders have more to lose from licensing than followers, I
predict they appropriate fewer benefits from licensing, in terms of market value, than followers.
H3. All else being equal, licensors that lead a specific sector capture fewer cumulative
abnormal returns from licensing out technology than do licensors that are followers.
97
Figure 1 represents the relationships analyzed herein.
3.3. Data, Variables and Methodology
3.3.1. Sample Selection and Data
The empirical analysis is based on a sample of innovative U.S. companies, selected according to
several criteria. First, I identified 140 companies with the most granted patents from the U.S.
Patent and Trademark Office (USPTO) during 1990–2009.29 Because my main objective was to
analyze how the licensors’ appropriation capacity varies in terms of market value I focused on
potential licensors, namely, companies with technological assets to license. Second, considering
the easy access to information and the size of their market for technology,30 I narrowed the
initial sample to U.S. companies. Licensing data are per se difficult to find; this search process
becomes nearly impossible in countries in which information about companies is less accessible
and markets for technology are smaller. Third, because I used the stock market value of the
company as a proxy for appropriation capacity, I retained only those agreements in which both
companies were public. Fourth, because they did not fit with my theoretical focus and could
have totally different impacts on market value, I eliminated cross-licensing agreements and
agreements enforced by a settlement. Unfortunately, many U.S. innovative companies are
characterized by exactly these features, which means the results are less generalizable.
However, noting the scarce evidence related to this topic, I purposefully chose this setting to
improve understanding of an important and unexplored relationship: how licensors’
appropriation capacity varies in different situations.
The licensing data came from four sources: Prompt database, HighBeam Research, Google
News, and SDC Platinum. The first three sources use press news; the latter is an established
licensing database. In the Prompt, Google News, and HighBeam Research databases, I looked
for licensing agreements using key words, namely, “licensing agreement” plus the company
name or “licens” plus the company name. In Prompt and HighBeam Research, I read all the
results; in Google I checked them up to the twentieth page. After reading the news and
corroborating that each announcement referred to a license agreement, I collected and codified
the information. From these stories, I was consistently able to extract the announcement date (if
the same agreement listed different dates, I selected the earlier one), licensor’s name, and
licensee’s name. I next appended these licensing agreements to those I obtained from SCD
29 I choose a period of almost 20 years because of the normal length of a patent. If the USPTO granted a patent to a company in 1990, it would still be valid at the end the study period. 30 Arora et al. (2001) indicate the annual value of transactions in markets for technology was $25–35 billion in the United States and $35–50 billion globally. The British Technology Group (1998) estimates the size of the market at $25 billion in North America and $6.6 billion in Europe.
98
Platinum, which provided information about joint ventures, marketing agreements, and
licensing agreements, among other forms of contract. As Anand and Khanna (2000a) have
shown, information regarding contract dates from SCD is highly inaccurate, so I manually
checked each date, using the names of the parties involved, with a Google search for “name of
company 1” “name of company 2” “licens agreement.” The extent of inaccuracy in my sample
was not as great as that reported by Anand and Khanna (2000a). The date variance was from
one to ten days, probably due to the different criteria used to select dates. In an event study
though, data accuracy is critical, and my window is very narrow, so to avoid any biases, I
always selected the first possible date.
Using the licensor’s and licensee’s names, I next sought corresponding firm level identifiers
(gvkey and permno), then matched licensing data with Compustat financial data and stock
market data from CRSP. The final licensing output featured 260 licensing agreements during
1998–2009. Finally, I manually checked if the day of the licensing announcement companies
also announced other news that could influenced my results. Coincidences were not found.
A potential concern regarding this data collection is the possibility that I did not capture the
entire universe of licensing agreements. In general, licensing agreements are private and
confidential. Companies do not have to report licensing agreements in their income statements,
and even in countries with regulatory reporting requirements, they refer only to cross-border
transactions. Therefore, I might not have captured all the licensing agreements established by
these companies, though my focus on companies from the same country and same information
environment, with the same characteristics (public companies with most patents granted),
reduced the chances that I would obtain more news from one company than from another.
Accordingly, bias due to any systematic variation in tracking these companies is unlikely.
3.3.2. Variables
3.3.2.1. Dependent Variable: Cumulative Abnormal Returns (CARs).
For each firm i (Kale et al. 2003; Gulati et al. 2009), I computed the abnormal returns using the
market model (Fama et al., 1969), which assumes a stable linear relationship between market
returns and returns on the financial instrument, accounts for market trends and firm risk, and
improves the chances of isolating the effect of specific events (Campbell, Lo and MacKindley
1997). To estimate the coefficients αi (average return of the firm compared with the market
average) and βi (sensitivity of its return to the market return or risk of the stock), I used
99
ordinary least squares (OLS) with the 200 trading days in the estimation, which correspond to
the interval [-240, -41] according to daily return data from CRSP. Formally:
Rit =αi +βi ×Rmt + eit ,
where Rit is the return on the stock of company i on day t, αi is the intercept, βi is the
systematic risk of stock i, Rmt is the daily return of the equally weighted CRSP market
portfolio, and eit is the daily risk-adjusted residual for firm i. The corresponding estimated
return on the stock for firm i on day t is given by:
R̂it =αi +βi ×Rmt .
Next, I calculated the abnormal daily return (AR) of company i on day t as follows:
ARit = Rit − R̂it .
Finally, I computed the cumulative abnormal returns (CARs) for each time interval by summing
up the abnormal returns within the specific time window [-1,0].
CAR(−1,0) = ARtt=−1
0
∑
3.3.2.2. Independent Variables.
Previous research defines organizational slack as “The disparity between the resources
available to the organization and the payments required to maintain the coalition” (Cyert &
March, 1963, p. 36) or “The difference between the existing resources and activated demands”
(March & Olsen, 1976, p. 87). Therefore, slack represents excess resources beyond what is
needed for “normal,” efficient operations, and its existence enables companies to pursue various
options, including introducing new products or entering new sectors or markets. Such projects
are less likely in a resource-constrained environment. Some authors thus argue that managers
need slack to innovate (Penrose, 1959; Cyert and March, 1963) and that it facilitates creative
behavior and innovative experimentation (Hambrick and Snow, 1977; Bourgeois, 1981). I use
two existing measures of available slack (Bourgeois, 1981) or unabsorbed slack (Singh, 1986),
which are immediately available and not yet assimilated into the technical design of the
organization. First, following previous literature, I used the quick ratio (Baucus and Near, 1991;
Combs and Ketchen, 1999b; Davis and Miziuchi, 1999; Palmer and Wiseman, 1999; Smith et
al. 1991), which reflects the company’s ability to meet its short-term obligations with its most
100
liquid assets. The higher the ratio, the better the position of the company. I computed this ratio
as (current assets – inventories)/current liabilities. Next, I divided the observations at the
median, into quick_undermedian and quick_abovemedian. As a robustness check, I also
differentiated observations that were below the 25th percentile (quick1) and those above the
75th percentile (quick3). Second, another measure commonly used to reflect available slack is
the current ratio (CR) (Ahuja, 2000; Bergh, 1997; Bergh and Lawless, 1998; Bromiley, 1991;
Bolton, 1993; Chang and Singh, 1999; Dailey, 1995; Dailey and Dalton, 1994; Hambrick et al.
1996; Hitt et al. 1996; Hoskisson and Jonhson, 1992). It indicates the company’s ability to meet
short-term debt obligations, computed as current assets/current liabilities. If the firm’s current
assets are more than twice its current liabilities, the company is financially strong. If current
liabilities exceed current assets, the company may have problems meeting its short-term
obligations. Similar to the quick ratio, I divided these observations at the median:
cr_undermedian and cr_abovemedian. As a robustness check, I again differentiated
observations that were below the 25th percentile (CR1) and those above the 75th percentile
(CR3)
To distinguish between licensing agreements within the same or across different sectors, I used
a dummy variable (SSIC), equal to 1 if the four-digit standard industrial classification (SIC) of
the licensor is identical to the four-digit SIC of the licensee, and 0 otherwise. The four-digit SIC
code accounts for the division, the major group, and the industry group of each company.31 It
was acquired through Compustat database.
Finally, to classify each licensor as a leader or follower in a specific sector, I computed its
market share, as the ratio between the licensor’s net sales and total net sales in the licensor’s
industry. Industry net sales represented the sum of all net sales by companies operating in the
same four-digit SIC code in year t. Following Giroud and Mueller (2011), I included all
available Compustat firms in the same SIC code but excluded firms for which net sales were
missing. Then, after computing the market share of each licensor in each year, I distinguished
companies with high (LEADER) or low (FOLLOWER) market shares, using a dummy variable.
This variable equaled 1 if the licensor was one of the three companies with the highest market
share in the four-digit SIC code at year t, and 0 otherwise.
31 The SIC codes are grouped into progressively broader classifications; four digits represent a specific division, three digits correspond to the industry group, and two digits indicate the major group.
101
3.3.3. Methodology
3.3.3.1. Event Study.
To capture the stock price reaction to licensing announcements, I ran an event study and
examined the stock price reaction by analyzing the average CARs during the event window.
These CARs captured how much the stock price deviated from its expected value on the day of
the licensing announcement. This methodology relies on the assumption that stock markets are
efficient and that prices perfectly reflect all public information related to the prospects of the
company. Thus, the effect of a specific event should be reflected almost immediately in the
stock market. That is, when an event occurs, the market updates its forecast, causing a shift in
market value.
To avoid including unrelated events that might influence stock returns, the event window needs
to be sufficiently narrow (Gulati et al. 2009). A common approach sets the event day (day 0) as
the day of the announcement and also considers the possibility that the event might have
happened on the previous day, before the stock market closed (day -1) (MacKinlay, 1997).
Previous research has indicated that a two-day window is more effective than longer windows
for capturing stock market reactions (Crutchley et al., 1991). However, as a robustness check, I
also considered the [-1,1] and [-3,3] windows.
Prior studies of licensing (Anand and Khanna, 2000b; Walter, 2012), alliances (Merchant and
Schendel, 2000; Kale et al., 2002; Gulati et al. 2009), and joint ventures (Balakrishna and Koza,
1993; Park and Kim, 1997; Reuer and Koza, 2000) have employed CAR as an effective,
market-based measure of firm performance. Moreover, prior research has found a high
correlation (around 40%) between this variable and the long-term firm performance and value
of the event (Koh and Venkatraman, 1991; Kale et al. 2002). Thus, to examine if the various
contingencies I proposed have different impacts on the licensor’s market value, I divided the
sample into six cases and computed separate CARs for each: licensors with and without cash
constraints (H1), licensing agreements between companies that belong to the same and different
sectors (H2), and licensors that are leaders or followers (H3). Next, in order to provide a deeper
analysis, I computed the CARs for four interactions: (1) licensing agreements between
companies that belong to the same sector + leaders, (2) licensing agreements between
companies that belong to the same sector + followers, (3) licensing agreements between
companies that belong to different sectors + leaders, and (4) licensing agreements between
companies that belong to different sectors + followers.
102
3.3.3.2. Significance Tests.
To determine if the resulting mean CARs differed significantly from 0, I conducted three tests:
two parametric (Patell Z test and crude dependence adjustment [CDA]) and one non-parametric
(generalized sign Z). Parametric tests rely on the assumption that a firm’s ARs are normally
distributed. As I detail in the Appendix, the Patell Z Test (or standardized abnormal return test)
thus estimates a separate standard error for each security event, assuming cross-sectional
independence. The standardization ensures that each AR offers the same variance. Under the
null hypothesis, this statistic converges to unit normal (see Linn and McConnell, 1983; Schipper
and Smith, 1986; Haw, Pastena and Lilien, 1990). In contrast, the time-series standard deviation
test, or CDA (Brown and Warner, 1985), uses a single variance estimate to reflect all pairwise
correlations between ARs, thereby addressing cross-sectional dependence (see the Appendix). It
is distributed as a Student t and approximately unit normal under the null hypothesis (see
Dopuch, Holthausen and Leftwich, 1986; Brickley, Dark and Weisbach, 1991).
In addition to these parametric tests, I include a non-parametric test to acknowledge that daily
stock data are not normally distributed (Fama, 1965; Mandelbrot, 1963; Officer, 1972) and
compare the test conclusions (Campbell et al. 1997). The generalized sign test (see the
Appendix) uses a normal approximation of the binomial distribution and adjusts for the fraction
of positive abnormal returns in the estimation period instead of assuming 0.5. The null
hypothesis is that the fraction of positive returns is the same as in the estimation period (Sanger
and Peterson 1990; Singh, Cowan and Nayar 1991; Chen, Hu and Shieh 1991). A more detailed
explanation of the generalized sign test is available from Sprent (1989) or Cowan (1992).
3.3.3.3. Significance of the Differences Between Groups.
After analyzing the significance of the mean CAR, a necessary next step is to discern if the
differences between the mean CAR of the compared groups are significant. I used the T-
Statistic to compare the means between two groups, as I detail in the Appendix. The null
hypothesis states that the difference between the means is zero. Therefore, if this null hypothesis
can be rejected, there must be a significant difference between the two samples. The same
process repeated for event windows equal to (-1,1) and (-3,3).
103
3.4. Results
3.4.1. Descriptive Statistics and Main Results
Table 1 provides the descriptive statistics and the correlations for the variables of interest. On
this table we can see that the mean of CARs using a three-day event window (-1,1) is more than
one percentage point greater than the mean CARs using a two-day event window (-1,0).
Regarding the differences between the quick ratio and the current ratio, we can observe that
they are quite similar. In particular, quick ratio is a little smaller because by definition its
numerator is reduced by inventories’ variable, not as in the current ratio. Regarding the
correlations, we can observe that the correlation between CARs using a two event window and
CARs using a three-event window is equal 0.59. However, this does not represent any problem
because I am not using both simultaneously. Also, we can observe that correlations between
market share and the financial variables (quick ratio and current ratio) are negative and quite
high (-0.3101 and -0.3034, respectively).
[Insert Table 1 around here]
Table 2 contains a summary of the results for each daily return and the whole population of
licensing agreements (N = 260) and Figure 2 represents them graphically. On the day of the
announcement (day 0), mean ARs were positive (2.46%) and statistically significant at the 1%
level for all tests. By day 1, the mean of ARs remained positive (0.88%) and was statistically
significant in the parametric tests. However, no significant effects emerged in the immediate
previous or posterior days, as Table 3 shows in relation to the mean CAR variable. For the three
event windows, each of which contains the day of the licensing agreement—(-1,0), (-1,1) and (-
3,3)—the mean CARs were positive and statistically significant for all tests at the 1% level.
However, for the event windows that did not contain the day of the announcement—(-30,2) and
(2, 30)—the mean CAR was positive in both cases but not so significant.
[Insert Table 2 and Table 3 around here]
Table 4 contains the resulting mean CAR and test statistics for each subsample using a event
window of (-1,0). The precision weighted cumulative average abnormal return (CAAR), defined
as a weighted average of the original CARs, provides a means to report an average standardized
cumulative abnormal return (average SCAR). For each group, I also indicate the number of
securities with positive and negative average abnormal returns.
[Insert Table 4 around here]
104
In line with H1 regarding the effect of cash constraints, the mean CARs resulting from the
announcement of a licensing agreement were lower when the licensor had cash flow problems
than when it did not, whether I used the current ratio “undermedian/overmedian” grouping
(1.33% vs. 2.24%), quick ratio “undermedian/overmedian” grouping (1.10% vs. 2.65%), quick
ratio percentile comparisons (1.04% vs. 3.55%), or the current ratio percentile comparisons
(1.84% vs. 2.70%). The resulting mean CARs also were statistically significant in all the tests at
least at the 5% level, with the exception of the current ratio (>75%) under the generalized sign
test.
I also found support for same-sector benefits, as predicted in H2. Specifically, the mean CAR
resulting from announcing a licensing agreement increased when both companies belonged to
the same sector rather than different sectors (7.27% vs. 1.53%). The positive mean CARs were
statistically significant for both the Patell Z and CDA test at the 0.1% level. For the generalized
sign Z, announcements between companies in the same SIC were significant at the 0.1% level,
and mean CARs resulting from announcements between companies from different sectors were
significant at the 1% level.
Finally, the data corroborated H3, in that the mean CAR resulting from the announcement of
licensing agreements was greater when licensors were followers instead of leaders in the sector
(0.61% vs. 3.86%). For followers, the mean CAR was statistically significant under the Patell Z
and CDA tests at the 0.1% level and under the generalized sign test at the 0.01 level. For
leaders, it was statistically significant at the 5% level (Patell Z and generalized sign Z) or 1%
level (CDA).
Table 5 provides the Student t-test results, to determine if the difference in means between the
groups is statistically significant. All the mean differences were statistically significant, except
for the cases related to the current ratio, for which the difference of mean CARs were not
significant. For the quick ratio, the difference between the abovemedian group and the
undermedian group was significant at 10% level. Regarding the sector, the mean CAR
differences between licensing in the same sector and licensing in a different sector were
significant at the 5% level. Regarding the position of the company in its sector, the difference
between leader and follower mean CARs was significant at the 10% level.
3.4.2. Robustness Checks
As a robustness check, I computed the mean CARs for each subgroup for two additional event
windows, (-1,1) and (-3,3); in Tables 6 and 7, respectively, the main results are again
corroborated. However, two main changes are notable: (1) the mean CARs of the fourth quartile
105
ratio became significant at the 0.001 level (previously was not significant) and (2) the mean
CARs for leaders were not significant in the CDA test or generalized sign Z test (previously
significant at the 10% and 5% levels, respectively). These changes appear in both Tables 6 and
7.
[Insert Table 6 and Table 7 around here ]
Also, to show that the results are not influenced either by the choice of the model or by the
choice of reference portfolio, I ran different models: Market Adjusted Model and with another
reference portfolio: Value Weighted Index Portfolio. Therefore, Table 8 reports the results of
the event study for each subsample using the Market Adjusted Returns Model and using, as in
the previous case, the Equally Weighted Index. Under this scenario, CARs for each subsample
are positive and statistically significant under the three significance tests. Table 9 reports the
results of the event study for each subsample using, as in the first case, the Market Model and,
as novelty, the Value Weighted Index. Also under this scenario, CARs were positive and
statistically significant under the three significance tests. Therefore, results are not affected by
neither the choice of the model nor the choice of the reference portfolio.
[Insert Table 8 and Table 9 around here]
3.4.3. Interaction Effects
Results from previous hypotheses have shown that companies that license out to a company in
the same sector obtain more benefits (H2) and that leaders benefit less than followers (H3).
However, as the former one gives us insights regarding the choice of the sector and the latter
one regarding the relative position of the company in the sector, these two supported hypotheses
are not mutually exclusive. Rather, in conjunction they represent the licensing trade-off that
Fosfuri (2006) describes. On the one hand, in terms of appropriation, companies that license out
the technology to the same sector will increase their benefits more than companies that license
out to a different one. On the other hand, the potential cost of imitation would be higher if the
companies are in the same sector: given the similarities of the companies that belong to the
same sector, it would be easier for companies to invent around the licensed technology and to
imitate the licensor in the product market reducing licensors’ benefits as much as the higher is
their market share. Therefore, as the appropriation of benefits will not just depend on the
licensees’ sector but on both: licensees’ sector and relative position of the licensor in the
product market. I explore their combined effect on CARs in conjunction, considering four cases.
106
First, among companies that license to same-sector companies, I would expect followers to
appropriate more value from licensing than leaders. Recall that followers have little to lose due
to imitation by competitors, and they already have some bargaining power because they are
negotiating in a context marked by low information asymmetries. Although leaders have similar
bargaining power due to low information asymmetries, the cost of imitation could be high, so
they likely appropriate fewer benefits from licensing.
Second, for companies that license out to different sectors, I would expect again that followers
appropriate more value from licensing than leaders. However, this difference should not be as
pronounced as in the previous case, because all licensors confront high information
asymmetries and depend on their licensee to earn benefits from their previous investments.
Followers still have little to lose if the licensee decides to imitate them, but now they lack any
bargaining power. Licensors that are leaders suffer both the information asymmetry and the
potential cost of imitation. I recognize that this possibility is relatively unlikely, because
licensees would incur massive investments to compete directly with a licensor, yet licensees
plausibly could imitate licensors, which would reduce the licensor’s benefits.
[Insert Table 10 around here]
In Table 10, following the Market Model and using the Equally Weighted Index, the mean
CARs of leaders were much lower than those of followers when they licensed in the same sector
(0.73% vs. 8.46%), though the impact was statistically significant when licensors were
followers. Furthermore, the difference between the mean CAR when licensors were leaders
versus followers was much lower if they belonged to different sectors (0.59% and 2.19% vs.
0.73% and 8.46%). Therefore, we can see that the best situation to appropriate benefits from
licensing is when licensees belong to the same sector than licensors and when they are followers
(CARs=8.46%). On contrary, appropriation is very low when licensor and licensee belong to
different sectors and licensors are leaders (CARs=0.73%). This conclusion is still corroborated
under two additional specifications: 1) Market Adjusted Return Model, using the Equally
Weighted Index Model and 2) Market Model, using the Value Weighted Index.
3.5. Summary and Conclusion
This article proposes that the licensor’s appropriation capacity is a function of two aspects: The
licensor’s bargaining power (determined by their cash constraints and the existence of
information asymmetries between parties) and the potential cost of imitation. The data confirms
that these factors influence the licensor’s appropriation capacity, in terms of market value, in
significant and distinct ways. Firstly, in line with previous research which indicates that
107
financial constraints erode the bargaining power of companies (Lerner and Merges, 1993;
Aghion and Tirole, 1994), I show that the appropriation capacity of the licensor is lower when
companies face cash constraints than when they do not. Also, in accordance with the research
that demonstrates that information asymmetries reduce the bargaining power of companies
(Chattejee & Samuelson, 1983), I find that licensors can better appropriate benefits from
licensing when they license out in the same sector (i.e., lower information asymmetries) than
when they license out to another sector (higher information asymmetries). Furthermore, I also
state that the impact of imitation grows stronger when the market share of the licensor increases
(Arora & Fosfuri, 2003) by demonstrating that the licensors that are followers appropriate more
benefits from licensing than the licensors that are leaders do. Additionally, I prove that the best
situation to appropriate benefits from licensing, in terms of market value, is when the licensees
belong to the same sector as the licensors, and when they are followers. Finally, appropriation is
very low when the licensor and the licensee belong to different sectors and the licensors are
leaders.
This paper does have some limitations. From an empirical point of view, I am measuring
licensor’s appropriation capacity under the assumption that the total generated returns are
orthogonal to the cumulative abnormal returns and, therefore, any increase in the licensor value
could be just generated by an increase in the appropriation capacity. However, I am conscious
that an increase in CARs could be the result of an increase in the licensors’ appropriation
capacity or of an increase in the level of the total generated returns. Also, this study only
contemplates the impact that licensing out has on the stock market. Ideally, I should know how
much the licensors would benefit, in terms of market value, compared with licensees. This
would allow me to understand the whole impact of announcing a licensing agreement. I explain
how to introduce the licensee’s aspect in the section of future research. Furthermore, a potential
concern regarding the data collection is the possibility that I did not capture the entire history of
licensing agreements for all the companies in my study. However, focusing on companies from
the same country and with the same characteristics (public companies with most patents
granted) I expect to reduce the chances of obtaining more news from one company than from
another. As Schilling (2009, p.258) claimed “even though each database only captures a
sample of alliance activity, it may yield reliable results for many-if not all- purposes”.
However, in this study, the fact that I am not observing all the licensing agreements would go
against my research. Specifically, if I am not identifying all the licensing agreements, nor am I
considering all these “increases” in the stock market. In consequence, the “normal” returns used
to make the prediction should be greater than in the case of identifying the whole population
and, therefore, obtaining significant “abnormal returns” should be more difficult. Finally, as far
as it concerns the generality of the results, they cannot be applied to wider populations of
companies. Licensing has still not spread to all industries or countries. Rather, the companies
108
for which these findings hold (1) have more patents to trade in markets for technology, (2)
belong to industries in which licensing agreements are common, (3) operate in the most
developed (U.S.) environment for markets for technology, and (4) are public companies, subject
to the pressures of the stock market. The results do not apply to other companies that do not
satisfy these characteristics.
Despite these limitations, this study sheds a new light on some important and relatively
unexplored topics. In particular, it provides more evidence of the value of appropriation in
licensing agreements. To the best of my knowledge, only Walter (2012) has considered the
licensing benefits appropriated by each partner. This study also explicates the bargaining power
in the context of licensing agreements, by proposing and confirming that it is a function of two
factors. Furthermore, this article proposes another potential explanation for why large firms are
not really active in the market for technology, mainly, the small effect on their market value
obtained from licensing out (CAR = 0.66% for the leaders with a high market share versus
3.86% for the followers). Finally, this study empirically evidences, through market value
variations, how both effects of the licensing trade-off interact.
From a practical point of view, my study provides some strategic insights that managers could
take into account. In recent years, the company stock market measures have increased in
importance. External observers use them to proxy for the firm’s future performance and the
board of directors use them to evaluate and compensate managers (Degeorge et al. 1999).
Therefore, in order to maintain their jobs, earn higher salaries, and enhance their reputation,
managers also prefer to make decisions that increase the stock market measures. By analyzing
the situations that generate stronger/weaker impacts in the stock market, this study offers the
managers some guidance in their strategic decisions. First of all, managers should realize that
licensing decisions in cash-constrained situations will appropriate fewer benefits in terms of
market value. Secondly, the stock market responds better to a licensing decision if the licensee
belongs to the same sector. Another same-sector company’s desire to license the technology
offers a signal of the superiority of the licensor, the inability of the licensee to compete with the
technology, and/or the likely standardization of this technology throughout the sector.
Therefore, companies can increase their benefits by licensing in the same sector, earning
immediate revenues and a heightened stock market value. However, this significant stock
market increase occurs only if the risk of imitation resulting from licensing is not too high. For
managers of firms that are leaders in their sector, this study reveals that the impact of licensing
on the stock market is almost nonexistent. Therefore, for them, it is better not to license out;
unless the licensing payments overcome the potential cost of imitation. On the contrary, this
paper suggests to the managers of companies that are followers to license out their proprietary
109
technologies. Followers that are able to license out are sending a signal of reputation, quality
and prospects of growth. Finally, this paper reveals, that the best situation to appropriate
benefits in terms of market value is to license out the technology to a company that belongs to
the same sector while being a follower.
Regarding future research, my plan is the following. First of all, I would like to introduce the
licensee’s analysis aspect in order to capture the total value created and the relative value
appropriated by each part. Therefore, knowing the percentage of increase caused by each
licensing agreement in the licensor and the licensee’s market value and also the market value of
each involved company (the price of each share multiplied by the number of outstanding
shares), I will be able to know the total value created by each licensing agreement as well the
value appropriated by each part in relative terms. As this analysis will imply having a cross
sectional data, I can also use some control variables to try to isolate the effect in the stock
market and to rule out other possible explanations.
Finally, further research should continue to analyze additional organizational and industrial
characteristics that might affect the distribution of the bargaining power in licensing
agreements, as well the consequences of this distribution. One possible extension might be to
determine the consequences of a low bargaining power on decisions about the control over the
company after the agreement. For instance, do companies with less bargaining power accept key
conditions, such as investments in equity, grant back clauses or votes in the board of directors?
110
3.6. References
Aghion, P. and Tirole, J., 1994. The Management of Innovation. The Quarterly Journal of
Economics, 109, 4: 1185-1209.
Ahuja, G., 2000. Collaboration Networks, Structural Holes, and Innovation: A Longitudinal
Study. Administrative Science Quarterly, 45(3): 425.
Akhtar, F. and Oliver, B., 2009. Capital Market Efficiency. McGraw-Hill Australia Pty Ltd.
/PPTs t/a Business Finance 10e by Peirson, Chapter 16.
Anand, B.N., Khanna, T., 2000a. The Structure of Licensing Contracts. Journal of Industrial
Economics 48: 103-135.
Anand, B.N., Khanna, T., 2000b. Do Firms Learn to Create Value? The Case of Alliances.
Strategic Management Journal 21:295-315.
Arora, A., Fosfuri, A., and A. Gambardella, 2001a. Markets for Technology: The economics of
Innovation and Corporate Strategy, The MIT Press, Cambridge MA.
Arora, A. and Fosfuri, A., 2003. Licensing the Market for Technology. Journal of Economic
Behaviour and Organization. 52: 277-295.
Arora, A. & Gambardella, A., 2010. Ideas for Rent: An Overview of Markets for Technology.
Industrial and Corporate Change, Oxford University Press, 19 (3): 775-803.
Athreye, S. and Cantwell, J., 2007. Creating Competition? Globalisation and the Emergence of
New Technology Producers. Research Policy, 36: 209-226.
Balakrishna, S., & Koza, M.P., 1993. Information Asymmetry, Adverse Selection and Joint
Ventures. Journal of Economic Behavior and Organization, 20: 99-117.
Bianchi, M., Chiaroni, D., Chiesa, V. and Frattini, F. 2011. Organizing for External Technology
Commercialization: Evidence From a Multiple Case Study in the Pharmaceutical
Industry. R&D Management 41, 2: 120-137.
Baucus, M.S. & Near, J.P., 1991. Can Illegal Corporate Behavior Be Predicted? An Event
History Analysis. Academy of Management Journal, 34 (1):9-36.
Bergh, D.D. 1997. Product with Repeated Measures Analysis: Demonstration with a Study of
the Diversification and Divestiture Relationship. Academy of Management Journal, 38:
1692-1708.
111
Bergh, D.D. and Lawless, M.W. 1998. Portfolio Restructuring and Limits to Hierarchical
Governance: The Effects of Environmental Uncertainty and Diversification Strategy.
Institute for Operations Research and the Management Sciences.
Bianchi, M., Chiaroni, D., Chiesa, V. and Frattini, F., 2011. Organizing for External
Technology Commercialization: Evidence from a Multiple Case Study in the
Pharmaceutical Industry. R&D Management 41 (2): 120-137.
Bolton, M.K., 1993. Organizational Innovation and Substandard Performance: When is
Necessary the Mother of Innovation? Organization Science, 4 (1): 57-75.
Bourgeois, L.J. 1981. On the Measurement of Organizational Slack. The Academy of
Management Review, 6 (1): 29-39.
Bousquet, A., Cremer, H., Ivaldi, M. & Wolkowicz, M., 1998. Risk Sharing in Licensing.
International Journal of Industrial Organization, 16 (5): 535-554.
Brickley, J.A., Dark, F.H. and Weisbach, M.S., 1991. An Agency Perspective on Franchising.
Finantial Management, 20 (1): 27-35.
British Technology Group (BTG), 1998. IPR Benchmark Study
Bromiley, P., 1991. Testing a Causal Model of Corporate Risk Taking and Performance. The
Academy of Management Journal, 34 (1): 37-59.
Brown, S. and Warner, J., 1985. Using Daily Stock Returns: The Case of Event Studies, Journal
Financial Economics, 14:3-31.
Campbell, J.Y., Lo, A.W. and MacKindley, A.C., 1997. The Econometrics of Financial
Markets. Princeton University Press.
Caves, R., Crookel, H., Killing, J.P., 1983. The Imperfect Market for Technology Licensing.
Oxford Bulletin of Economics and Statistics 54: 249–267.
Cassiman, B. and Veugelers, R. 2006. In Search of Complementarity in Innovation Strategy:
Internal R&D and External Knowledge Acquisition. Management Science, INFORMS,
Vol. 52 (1): 68-82.
Chang, S.J. and Singh, H., 1999. The Impact of Modes of Entry and Resource Fit on Modes of
Exit by Multibusiness Firms. Strategic Management Journal, 20(11):1019-1035.
Chattejee, K. and Samuelson, W., 1983. Bargaining under Incomplete Information. Operations
Research, 31 (5): 835-851.
Chen, H., Hu, M.Y., and Shieh, J.C.P., 1991. The Wealth Effect of International Joint Ventures:
The Case of U.S. Investment in China. Financial Management, 20: 31-41.
112
Cyert, R.M. and March, J.G.,1963. A Behavioral Theory of the Firm. Academy for
Entrepreneurial Leadership Historical Research Reference in Entrepreneurship.
Available at SSRN: http://ssrn.com/abstract=1496208.
Cockburn, I., MacGarvie, M.J. and Müller, E., 2010. Patent Thickets, Licensing and Innovative
Performance. Industrial and Corporate Change, 19 (3): 899-925.
Combs and Ketchen, 1999b. Can Capital Scarcity Help Agency Theory Explain Franchising?
Revisiting the Capital Scarcity Hypothesis. Academy of Management Journal, 42(2):196-
207.
Conti, R., Gambardella, A. & Novelli, E., 2013. Research on Markets for Inventions and Implications for R&D Allocation Strategies. Academy of Management Annals, 7, 717-774.
Cowan, A.R., 1992. Nonparametric Event Study Tests. Review of Quantitative Finance and
Accounting 2: 343-358.
Crutchley, C.E., Guo, E. and Hansen, R.S., 1991. Stockholder Benefits from Japanese-U.S.
Joint Ventures. Financial Management, 20 (4): 22-30.
Dailey, C. and Dalton, D. 1994. Bankruptcy and Corporate Governance: The Impact of Board
Composition and Structure. Academy of Management Journal, 37 (6): 1603.
Dailey, C.M., 1995. The Relationship between Board Composition and Leadership Structure
and Bankruptcy Reorganization Outcomes. Journal of Management 21(6): 1041-1056.
Davis, G.F. and Miziuchi, M.S., 1999. The Money Center Cannot Hold: Commercial Banks in
the U.S. System of Corporate Governance. Administrative Science Quarterly, 44 (2): 215-
239.
Degeorge, F., Patel, J. and Zeckhauser, R., 1999. Earning Management to Exceed Thresholds.
Journal of Business, 72 (1): 1-33.
Dopuch, N., Holthausen, R.W. and Leftwich, R., 1986. Abnormal Stock Returns Associated with
Media Disclosures of “subjet to” Qualified Audit Opinions. Journal of Accounting and
Economics, 8 (2): 93-118
Dwyer F. R., Walker, O.C., 1981. Bargaining in an Asymmetrical Power Structure. Journal of
Marketing, 45 (Winter): 104-115.
Fama, E.F., 1965. The Behavior of Stock Market Prices. The Journal of Business, 38 (1): 34-
105.
Fama, E.F., Fisher, L., Jensen, M.C. and Roll, R., 1969. The Adjustment of Stock Prices to New
Information. International Economic Review, 10(1): 1-21.
113
Flammer, C. 2013. Corporate Social Responsibility and Shareholder Reaction: The
Environmental Awareness of Investors. Academy of Management Journal, 56 (3): 758-
781.
Farrel, J. and Gallini, N., 1988. Second Sourcing as a Means of Commitment: Monopoly
Incentives to Attract Competition. Quarterly Journal of Economics, 108: 673-694.
Fisher, R. And Ury, W., 1981. Getting to Yes: Negotiating Agreement Without Giving in. 1st ed.
New York; Penguin.
Fosfuri, A., 2006. The Licensing Dilemma: Understanding the Determinants of the Rate of
Technology Licensing. Strategic Management Journal, 27 (12): 1141-1158.
Gallini, N.T., 1984. Deterrence Through Market Sharing: A Strategic Incentive for Licensing.
American Economic Review, 74: 931-941.
Gallini, N.T. and Winter, R.A., 1985. Licensing in the Theory of Innovation. RAND Journal of
Economics,16(2): 237-252.
Gallini, N.T. and Wright, B.D., 1990. Technology Transfer under Asymmetric Information.
RAND Journal of Economics, 21(1): 147-160.
Gambardella, A., Giuri, P. and Luzzi, A., 2007. The Market for Patent in Europe. Research
Policy, 36(8): 1163-1183.
Gans, J. Hsu, D. and Stern, S., 2003. The Product Market and the Market for Ideas:
Commercialization Strategies for Technology Entrepreneurs. Research Policy, 32: 333-
350.
Gans J., Hsu D.H. and Stern, S. 2008. The Impact of Uncertain Intellectual Property Rights on
the Market for Ideas: Evidence from Patent Grant Delays. Management Science 54 (5):
982-997.
Giroud, X. and Mueller, H.M., 2011. Corporate Governance, Product Market Competition and
Equity Prices. The Journal of Finance, 66 (2): 563-600.
Gulati, R., Lavie, D. and Singh, H., 2009. The Nature of Partnership Experience and the Gains
From Alliances. Strategic Management Journal, 30:1213-1233.
Hagedoorn, J. 2002. Inter-firm R&D Partnerships: An Overview of Major Trends and Patterns
since 1960. Research Policy, 31 (4): 477-492.
Hambrick, D.C. and Snow, C.C., 1977. A Contextual Model of Strategic Decision Making in
Organizations. Academy Management Proceedings: 109-112
114
Hambrick, D.C., Cho, T.S. and Chen, M.J., 1996. The Influence of Top Management Team
Heterogeneity on Firms’ Competitive Moves. Administrative Science Quarterly, 41 (4):
659-684.
Haw, I., Pastena, V. and Lilien, S., 1990. Market Manifestations of Nonpublic Information Prior
to Merges: The Effect of Ownership Structure. The Accounting Review, April: 432-451.
Hitt, M.A., Hoskisson, R.E., Johson, R.A. and Moesel, D.D., 1996. The Market for Corporate
Control and Firm Innovation. Academy of Management Journal, 39 (5):1084-1119.
Hoskisson, R.O. and Jonhson, R.A., 1992. Corporate Restructuring and Strategic Change: The
Effect on Diversification Strategy and R&D Intensity. Strategic Management Journal, 13
(8): 625-634.
Jones G., Lanctot, A. And Teegen H.J. 2001. Determinants and Performance Impacts of
External Technology Acquisition. Journal of Business Venturing 16(3): 255-283.
Katz, M., Shapiro, C., 1985. On the licensing of innovations. RAND Journal of Economics 16:
504 –520.
Kale, P., Dyer, J., and Singh, H., 2002. Alliance capability, Stock Market Response and Long-
Term Alliance Success: The role of the alliance function. Strategic Management Journal,
23(8), 747–767.
Kale, P. Dyer, J. and Singh, H., 2003. Value Creation and Success in Strategic Alliances.
European Management Journal, 19 (5): 463-471.
Kamien, M. and Tauman, Y.,1986. Fees versus Royalties and the Private Value of a Patent.
Quarterly Journal of Economics, 101, 471–491.
Kamiyama, S., Sheehan, J. and Martinez, C., 2006. Valuation and Exploitation of Intellectual
Property. STI Working Paper 2006/5. Statistical Analysis of Science, Technology and
Industry.
Kani, M. an Motohashi, K., 2012. Understanding the Technology Market for Patents: New
Insights from a Licensing Survey of Japanese Firms. Research Policy, 41 (1): 226-235.
Kim, P.H.,1997. Strategic Timing in Group Negotiations: The Implications of Forced Entry and
Forced Exit for Negotiations with Unequal Power. Organizational Behavior and Human
Decision Processes, 71: 263-286.
Kim Y. and Vonortas, N. 2006. Technology Licensing Partners. Journal of Economics and
Business, 58 (4): 273-289.
Kollmer, H. and Dowling, M., 2004. Licensing as a Commercialization Strategy for New
Technology-Based Firms. Research Policy, 33 (8): 1141-1151.
115
Koh, J. and Venkatraman, N., 1991. Joint Venture Formations and Stock Market Reactions: An
Assessment in the Information Technology Sector. Academy of Management, 34 (4): 869-
892.
Lax, D.A. and Sebenius, J.K. 1986. The Manager as Negotiator: Bargaining for Cooperation
and Competitive Gain. Free Press Book (ISBN 0029187702).
Lei and Slocum, 1991. Global Strategic Alliances: Payoffs and Pitfalls. Organizational
Dynamics, Winter, 19 (3): 44.
Lerner, J. and Merges, R.P., 1998. The Control of Technology Alliances: An Empirical Analysis
of the Biotechnology Industry. The Journal of Industrial Economics, 46 (2): 125-156.
Linn, S.C. and McConnell, J.J., 1983. An Empirical Investigation of the Impact of
“Antitakeover” Amendments on Common Stock Prices. Journal of Financial Economics,
Elsevier, 11 (1-4): 361-399.
Lowe, J. and Taylor, P., 1998. R&D and Technology Purchase Through License Agreements:
Complementary Strategies and Complementary Assets. R&D Management 28 (4): 263-
278.
Mannix, E., 1993a. Organizations as Resource Dilemmas: The Effects of Power Balance on
Coalition Formation in Small Groups. Organization Behavior and Human Decision
Processes. Vol. 55(1): 1-22.
MacKinlay, A.C., 1997. Event Studies in Economics and Finance. Journal of Economics
Literature, 35 (1): 13-39.
Mandelbrot, B., 1963. The Variation of Certain Speculative Prices. The Journal of Business, 36
(4): 394-419.
March, J.G. and Olsen, J.P., 1976. Ambiguity and Choice in Organizations. Berger:
Universitesforlaget.
Merchant, H. and Schendel, D. 2000. How Do International Joint Ventures Create Shareholder
Value? Strategic Management Journal, 21(7): 723-737.
Motohashi, K. 2006. Licensing or Not Licensing? Empirical Analysis on Strategic Use of Patent
in Japanese Firms. RIETI Discussion Paper Series 06-E- 021.
Müllez- Seitz, G. 2012. Absorptive and Desorptive Capacity-Related Practices at the Network
Level: The Case of SEMATECH. R&D Management, 42: 90-99.
Officer, R.R., 1972. The Distribution of Stock Returns. Journal of the American Statistical
Association, 67 (340): 807-812.
116
Palmer, T.B. and Wiseman, R.M.,1999. Decoupling Risk Taking from Income Stream
Uncertainty: A Holistic Model of Risk. Strategic Management Journal, 20 (11): 1037-
1062.
Park, S.H., & Kim, D., 1997. Market Valuation of Joint Ventures: Joint Venture Characteristics
and Wealth Gains. Journal of Business Venturing,12: 83-108.
Patell, J. M., 1976. Corporate Forecasts of Earnings per Share and Stock Price Behavior:
Empirical test. Journal of accounting research, 246-276.
Penrose, E.T., 1959. The Theory of the Growth of the Firm. New York: John Wiley.
Pinkley, R.L., Neale, M.A. and Bennett, R.J., 1994. The Impact of Alternatives to Settlement in
Dyadic Negotiation. Organizational Behavior and Human Decision Processes, 57 (1): 97-
116.
Reuer, J. and Koza, M.P., 2000. Asymmetric Information and Joint Venture Performance:
Evidence from Domestic and International Joint Ventures. Strategic Management
Journal, 21 (1): 81-88.
Robbins, 2006. Measuring Payments for the Supply and Use of Intellectual Property. NBER
Chapter in International Trade in Services and Intangibles in the Era of Globalization.
Rockett, K., 1990b. Choosing the Competition and Patent Licensing. RAND Journal of
Economics 21: 161–171.
Rothaermel, F.T., Hitt, M.A. and Jobe, L.A. 2006. Balancing Vertical Integration and Strategic
Outsourcing: Effects on Product Portfolio, Product Success, and Firm Performance.
Strategic Management Journal, 27: 1033-1056.
Sakakibara, M., 2010. An Empirical Analysis of Pricing in Patent Licensing Contracts.
Industrial and Corporate Change. Vol.19(3): 927-945.
Sanger, G.C. and Peterson, J.D., 1990. An Empirical Analysis of Common Stock Delistings.
Journal of Financial and Quantitative Analysis, 25 (2): 261-272.
Schipper, K. and Smith, A., 1986. A Comparison of Equity Carve-outs and Seasoned Equity
Offerings Share Price Effects and Corporate Restructuring. Journal of Financial
Economics, 15: 153-186.
Schilling, M. A., 2009. Understanding the Alliance Data. Strategic Management Journal, 30
(3): 233-260.
Shane, S. and Venkataraman, S., 2000. The Promise of Entrepreneurship as a Field of
Research, Academy of Management Review, 25 (1): 217-226.
117
Shapiro, C., 2001. Navigating the Patent Thicket: Cross Licenses, Patent Pools, and Standard
Setting. Innovation Policy and the Economy, 1: 119-150.
Schelling, T.C., 1956. An Essay on Bargaining. The American Economic Review, 46 (3): 281-
306.
Sheehan, J. Martínez, C. and Guellec, D. (2004). Understanding Business Patenting and
Licensing: Results of a Survey. Chapter 4. Patents, Innovation and Economic
Performance. Proceedings of and OECD Conference, OCDE, Paris.
Shepard, A. 1987. Licensing to Enhance Demand for New Technologies. RAND Journal of
Economics,18, (3): 360-368.
Singh, J.V: 1986. Performance, Slack, and Risk Taking in Organizational Decision Making.
Academy Management, 29 (3): 562-585.
Singh, A.K., Cowan, A.R. and Nayar, N., 1991. Underwritten Calls of Convertible Bonds.
Journal of Financial Economcis, 29: 173-196.
Skinner, D.J. and Sloan, R.G., 2002. Earnings Surprises, Growth Expectations, and Stock
Returns or Don’t Let an Earnings Torpedo Sink Your Portfolio. Review of Accounting
Studies, 7 (2-3): 289-312.
Smith, K.G., Grimm, C.M., Gannon, M.J. and Chen, M.J., 1991. Organizational Information
Processing, Competitive Responses, and Performance in the U.S. Domestic Airline
Industry, 34(1): 60.
Somaya, D., Kim, Y. and Vonortas, N.S., 2010. Exclusivity in Licensing Alliances: Using
Hostages to Support Technology Commercialization. Strategic Management Journal 32:
159-186.
Sprent, P., 1989. Applied Non-Parametric Statistical Methods. Chapman & Hall, ISBN-
10:0412306107.
Stuart, T.E., Hoang, H. and Hybels, R.C., 1999. Interorganizational Endorsements and the
Performance of Entrepreneurial. Administrative Science Quarterly, 44 (2): 315-349.
Teece, D.J., 1986. Profiting from Technological Innovation: Implications for Integration,
Collaboration, Licensing and Public Policy, 15(6): 285-305.
Telesio, P., 1979. Technology Licensing and Multinational Enterprises. New York: Praeger.
Tsai H. and Wang. 2007. Inward Technology Licensing and Firm Performance: A Longitudinal
Study. R&D Management 37( 2): 151-160.
118
Vishwasrao, S., 1994. Intellectual Property Rights and the Mode of Technology Transfer.
Journal of Development Economics, 44(2): 381-402.
Vishwasrao, S., 2007. Royalties vs. Fees: How do Firms Pay for Foreign Technology?.
International Journal of Industrial Organization, 25: 741-759.
Walter, J., 2012. The Influence of Firm and Industry Characteristics on Returns from
Technology Licensing Deals: Evidence from the US Computer and Pharmaceutical
Sectors. R&D Management, 42 (5): 435-454.
Zahra, S., 1996. Governance, Ownership, and Corporate Entrepreneurship: The Moderating
Impact of Industry Technological Opportunities. Academy of Management Journal, 39
(6): 1713-1735.
Zuniga M.P. and Guellec, D. 2009. Who Licenses Out Patents and Why? Lessons From a
Business Survey. STI Working Paper 2009/5. Statistical Analysis of Science, Technology
and Industry.
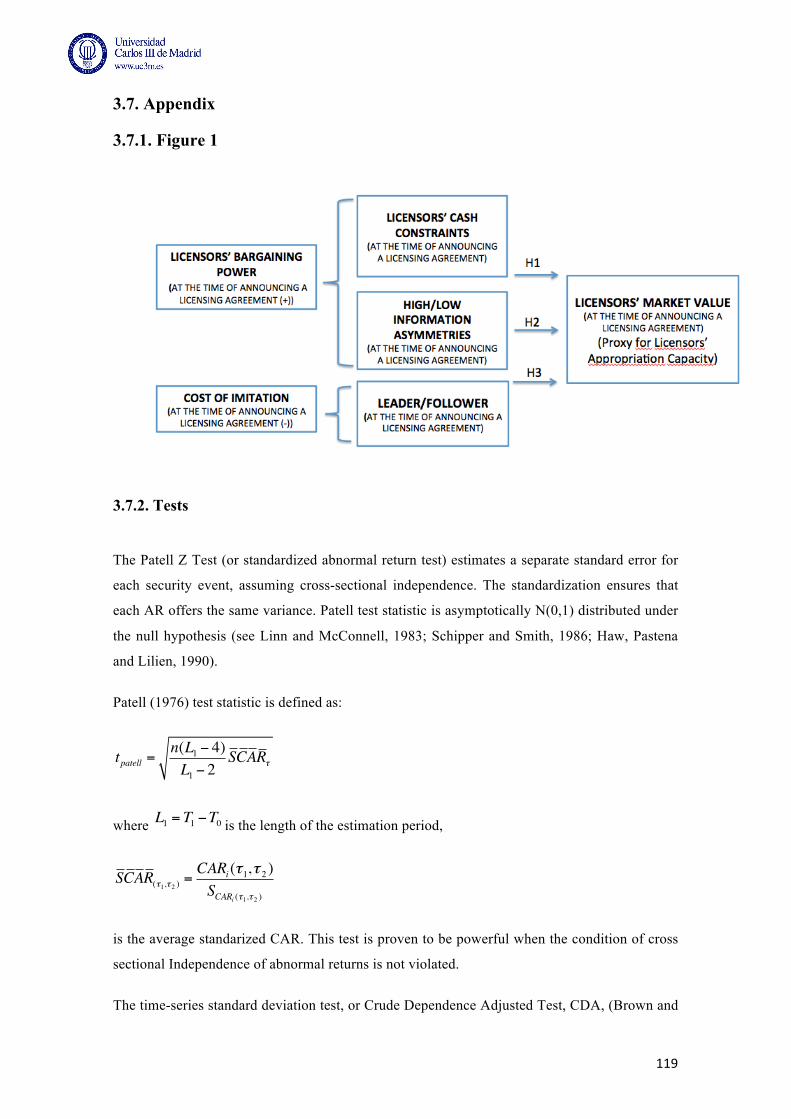
119
3.7. Appendix
3.7.1. Figure 1
3.7.2. Tests
The Patell Z Test (or standardized abnormal return test) estimates a separate standard error for
each security event, assuming cross-sectional independence. The standardization ensures that
each AR offers the same variance. Patell test statistic is asymptotically N(0,1) distributed under
the null hypothesis (see Linn and McConnell, 1983; Schipper and Smith, 1986; Haw, Pastena
and Lilien, 1990).
Patell (1976) test statistic is defined as:
tpatell =n(L1 − 4)L1 − 2
SCARτ
where L1 = T1 −T0 is the length of the estimation period,
SCAR(τ1,τ 2 ) =CARi (τ1,τ 2 )SCARi (τ1,τ 2 )
is the average standarized CAR. This test is proven to be powerful when the condition of cross
sectional Independence of abnormal returns is not violated.
The time-series standard deviation test, or Crude Dependence Adjusted Test, CDA, (Brown and
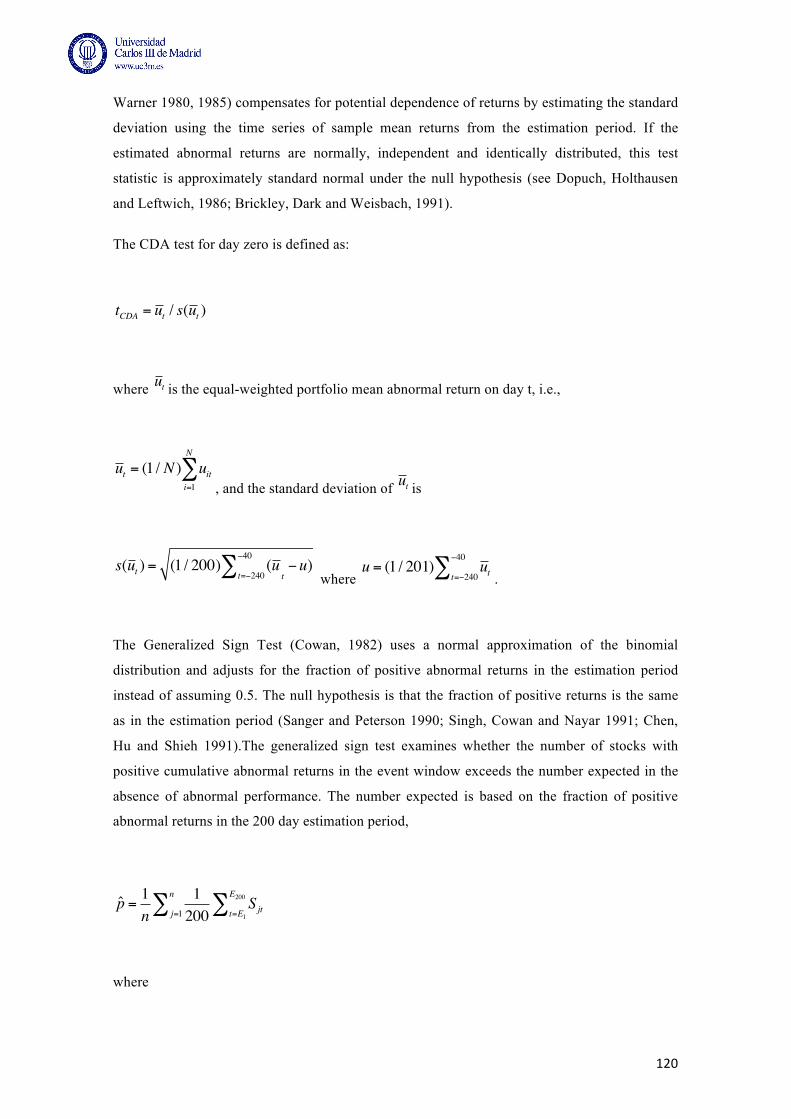
120
Warner 1980, 1985) compensates for potential dependence of returns by estimating the standard
deviation using the time series of sample mean returns from the estimation period. If the
estimated abnormal returns are normally, independent and identically distributed, this test
statistic is approximately standard normal under the null hypothesis (see Dopuch, Holthausen
and Leftwich, 1986; Brickley, Dark and Weisbach, 1991).
The CDA test for day zero is defined as:
tCDA = ut / s(ut )
where ut is the equal-weighted portfolio mean abnormal return on day t, i.e.,
ut = (1 / N ) uiti=1
N
∑, and the standard deviation of ut is
s(ut ) = (1 / 200) (ut=−240
−40∑
t−u)
where u = (1 / 201) utt=−240
−40∑ .
The Generalized Sign Test (Cowan, 1982) uses a normal approximation of the binomial
distribution and adjusts for the fraction of positive abnormal returns in the estimation period
instead of assuming 0.5. The null hypothesis is that the fraction of positive returns is the same
as in the estimation period (Sanger and Peterson 1990; Singh, Cowan and Nayar 1991; Chen,
Hu and Shieh 1991).The generalized sign test examines whether the number of stocks with
positive cumulative abnormal returns in the event window exceeds the number expected in the
absence of abnormal performance. The number expected is based on the fraction of positive
abnormal returns in the 200 day estimation period,
p̂ = 1n
1200
Sjtt=E1
E200∑j=1
n∑
where
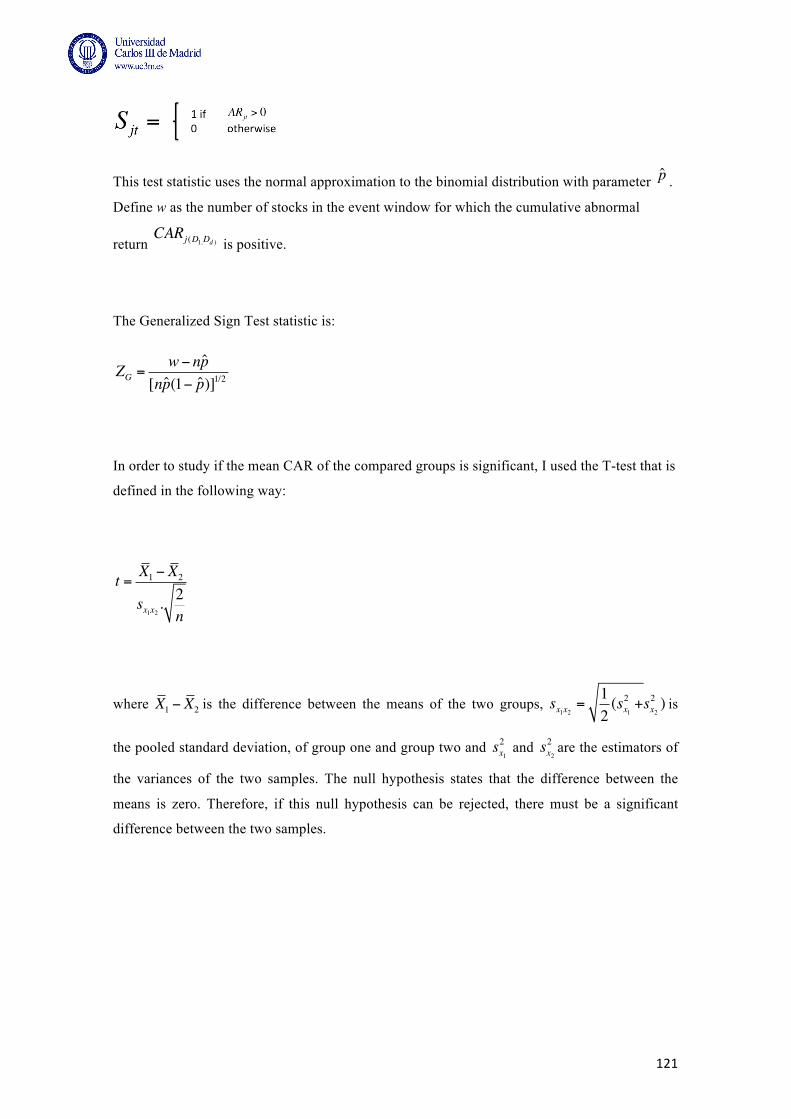
121
This test statistic uses the normal approximation to the binomial distribution with parameter p̂ .
Define w as the number of stocks in the event window for which the cumulative abnormal
return CARj (D1,Dd ) is positive.
The Generalized Sign Test statistic is:
ZG =w− np̂
[np̂(1− p̂)]1/2
In order to study if the mean CAR of the compared groups is significant, I used the T-test that is
defined in the following way:
t = X1 − X2
sx1x2 .2n
where X1 − X2 is the difference between the means of the two groups, sx1x2 =12(sx12 +sx2
2 ) is
the pooled standard deviation, of group one and group two and sx12 and sx2
2 are the estimators of
the variances of the two samples. The null hypothesis states that the difference between the
means is zero. Therefore, if this null hypothesis can be rejected, there must be a significant
difference between the two samples.
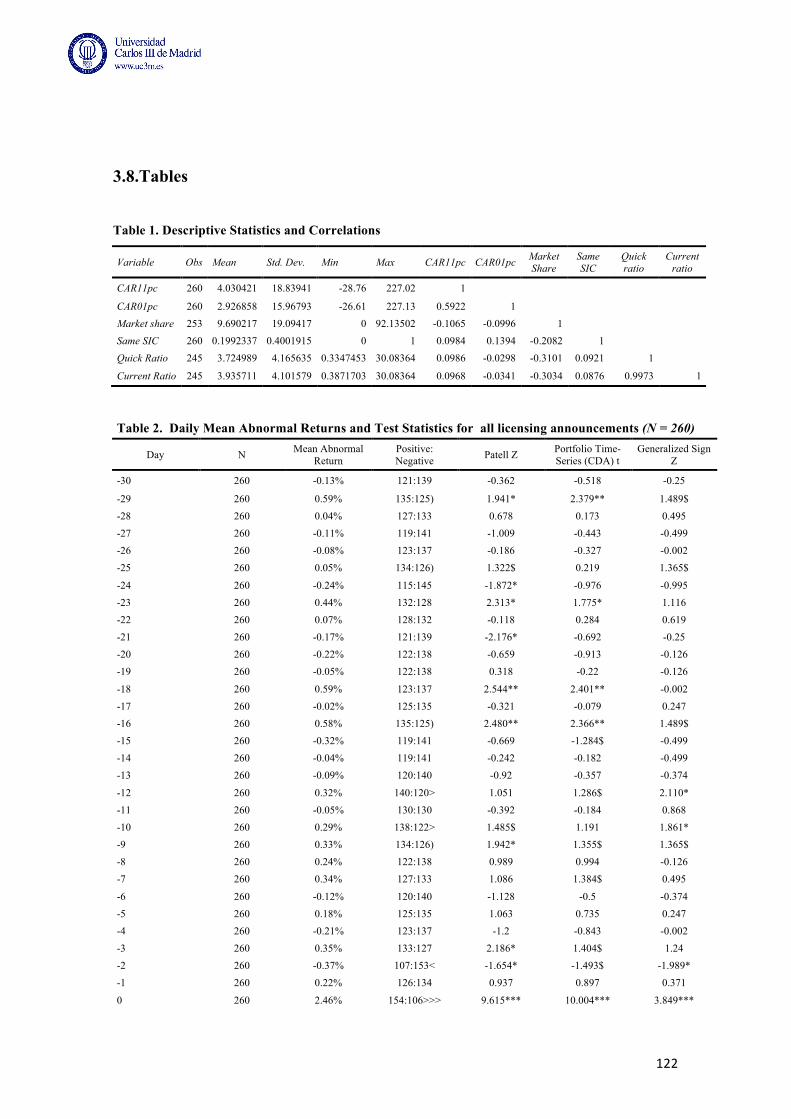
122
3.8.Tables
Table 1. Descriptive Statistics and Correlations
Variable Obs Mean Std. Dev. Min Max CAR11pc CAR01pc Market Share
Same SIC
Quick ratio
Current ratio
CAR11pc 260 4.030421 18.83941 -28.76 227.02 1 CAR01pc 260 2.926858 15.96793 -26.61 227.13 0.5922 1 Market share 253 9.690217 19.09417 0 92.13502 -0.1065 -0.0996 1 Same SIC 260 0.1992337 0.4001915 0 1 0.0984 0.1394 -0.2082 1 Quick Ratio 245 3.724989 4.165635 0.3347453 30.08364 0.0986 -0.0298 -0.3101 0.0921 1 Current Ratio 245 3.935711 4.101579 0.3871703 30.08364 0.0968 -0.0341 -0.3034 0.0876 0.9973 1
Table 2. Daily Mean Abnormal Returns and Test Statistics for all licensing announcements (N = 260)
Day N Mean Abnormal Return
Positive: Negative Patell Z Portfolio Time-
Series (CDA) t Generalized Sign
Z
-30 260 -0.13% 121:139 -0.362 -0.518 -0.25
-29 260 0.59% 135:125) 1.941* 2.379** 1.489$ -28 260 0.04% 127:133 0.678 0.173 0.495 -27 260 -0.11% 119:141 -1.009 -0.443 -0.499 -26 260 -0.08% 123:137 -0.186 -0.327 -0.002 -25 260 0.05% 134:126) 1.322$ 0.219 1.365$
-24 260 -0.24% 115:145 -1.872* -0.976 -0.995 -23 260 0.44% 132:128 2.313* 1.775* 1.116 -22 260 0.07% 128:132 -0.118 0.284 0.619 -21 260 -0.17% 121:139 -2.176* -0.692 -0.25 -20 260 -0.22% 122:138 -0.659 -0.913 -0.126 -19 260 -0.05% 122:138 0.318 -0.22 -0.126
-18 260 0.59% 123:137 2.544** 2.401** -0.002 -17 260 -0.02% 125:135 -0.321 -0.079 0.247 -16 260 0.58% 135:125) 2.480** 2.366** 1.489$ -15 260 -0.32% 119:141 -0.669 -1.284$ -0.499 -14 260 -0.04% 119:141 -0.242 -0.182 -0.499 -13 260 -0.09% 120:140 -0.92 -0.357 -0.374
-12 260 0.32% 140:120> 1.051 1.286$ 2.110* -11 260 -0.05% 130:130 -0.392 -0.184 0.868 -10 260 0.29% 138:122> 1.485$ 1.191 1.861* -9 260 0.33% 134:126) 1.942* 1.355$ 1.365$ -8 260 0.24% 122:138 0.989 0.994 -0.126 -7 260 0.34% 127:133 1.086 1.384$ 0.495
-6 260 -0.12% 120:140 -1.128 -0.5 -0.374 -5 260 0.18% 125:135 1.063 0.735 0.247 -4 260 -0.21% 123:137 -1.2 -0.843 -0.002 -3 260 0.35% 133:127 2.186* 1.404$ 1.24 -2 260 -0.37% 107:153< -1.654* -1.493$ -1.989* -1 260 0.22% 126:134 0.937 0.897 0.371
0 260 2.46% 154:106>>> 9.615*** 10.004*** 3.849***
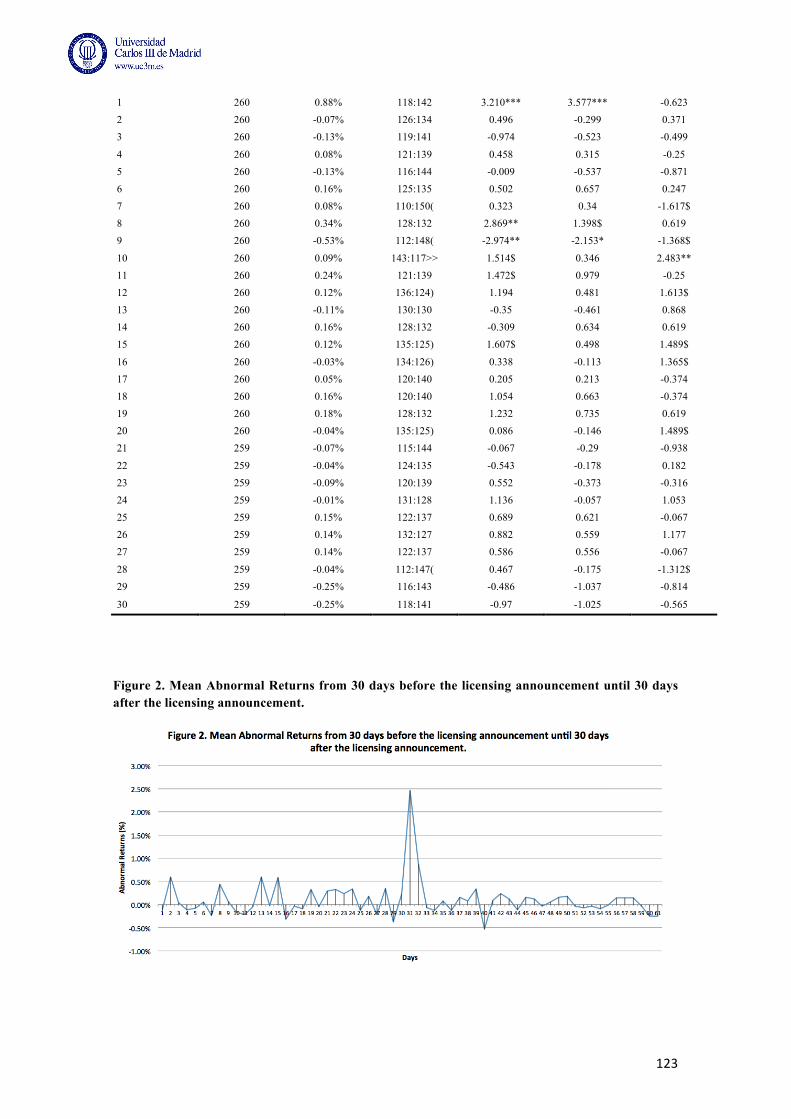
123
1 260 0.88% 118:142 3.210*** 3.577*** -0.623 2 260 -0.07% 126:134 0.496 -0.299 0.371 3 260 -0.13% 119:141 -0.974 -0.523 -0.499
4 260 0.08% 121:139 0.458 0.315 -0.25 5 260 -0.13% 116:144 -0.009 -0.537 -0.871 6 260 0.16% 125:135 0.502 0.657 0.247 7 260 0.08% 110:150( 0.323 0.34 -1.617$ 8 260 0.34% 128:132 2.869** 1.398$ 0.619 9 260 -0.53% 112:148( -2.974** -2.153* -1.368$
10 260 0.09% 143:117>> 1.514$ 0.346 2.483** 11 260 0.24% 121:139 1.472$ 0.979 -0.25 12 260 0.12% 136:124) 1.194 0.481 1.613$ 13 260 -0.11% 130:130 -0.35 -0.461 0.868 14 260 0.16% 128:132 -0.309 0.634 0.619 15 260 0.12% 135:125) 1.607$ 0.498 1.489$
16 260 -0.03% 134:126) 0.338 -0.113 1.365$ 17 260 0.05% 120:140 0.205 0.213 -0.374 18 260 0.16% 120:140 1.054 0.663 -0.374 19 260 0.18% 128:132 1.232 0.735 0.619 20 260 -0.04% 135:125) 0.086 -0.146 1.489$ 21 259 -0.07% 115:144 -0.067 -0.29 -0.938
22 259 -0.04% 124:135 -0.543 -0.178 0.182 23 259 -0.09% 120:139 0.552 -0.373 -0.316 24 259 -0.01% 131:128 1.136 -0.057 1.053 25 259 0.15% 122:137 0.689 0.621 -0.067 26 259 0.14% 132:127 0.882 0.559 1.177 27 259 0.14% 122:137 0.586 0.556 -0.067
28 259 -0.04% 112:147( 0.467 -0.175 -1.312$ 29 259 -0.25% 116:143 -0.486 -1.037 -0.814
30 259 -0.25% 118:141 -0.97 -1.025 -0.565
Figure 2. Mean Abnormal Returns from 30 days before the licensing announcement until 30 days after the licensing announcement.
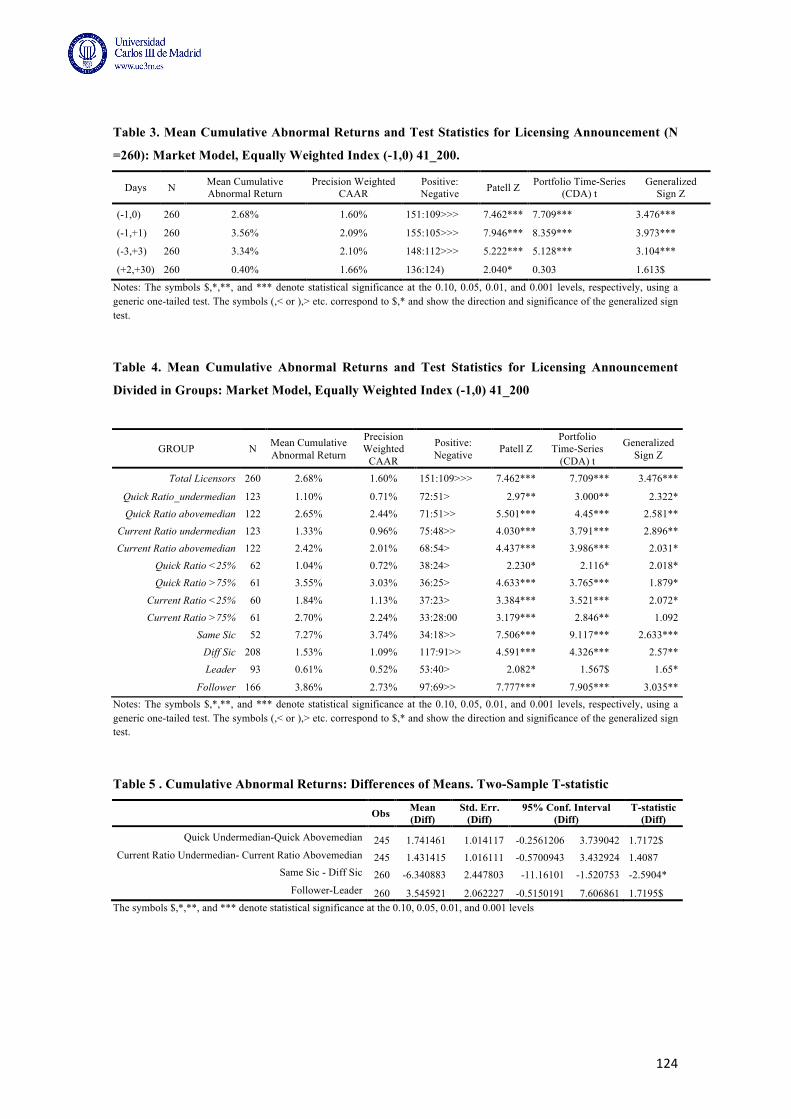
124
Table 3. Mean Cumulative Abnormal Returns and Test Statistics for Licensing Announcement (N
=260): Market Model, Equally Weighted Index (-1,0) 41_200.
Days N Mean Cumulative Abnormal Return
Precision Weighted CAAR
Positive: Negative Patell Z Portfolio Time-Series
(CDA) t Generalized
Sign Z
(-1,0) 260 2.68% 1.60% 151:109>>> 7.462*** 7.709*** 3.476***
(-1,+1) 260 3.56% 2.09% 155:105>>> 7.946*** 8.359*** 3.973***
(-3,+3) 260 3.34% 2.10% 148:112>>> 5.222*** 5.128*** 3.104***
(+2,+30) 260 0.40% 1.66% 136:124) 2.040* 0.303 1.613$
Notes: The symbols $,*,**, and *** denote statistical significance at the 0.10, 0.05, 0.01, and 0.001 levels, respectively, using a generic one-tailed test. The symbols (,< or ),> etc. correspond to $,* and show the direction and significance of the generalized sign test.
Table 4. Mean Cumulative Abnormal Returns and Test Statistics for Licensing Announcement
Divided in Groups: Market Model, Equally Weighted Index (-1,0) 41_200
GROUP N Mean Cumulative Abnormal Return
Precision Weighted
CAAR
Positive: Negative Patell Z
Portfolio Time-Series
(CDA) t
Generalized Sign Z
Total Licensors 260 2.68% 1.60% 151:109>>> 7.462*** 7.709*** 3.476***
Quick Ratio_undermedian 123 1.10% 0.71% 72:51> 2.97** 3.000** 2.322* Quick Ratio abovemedian 122 2.65% 2.44% 71:51>> 5.501*** 4.45*** 2.581**
Current Ratio undermedian 123 1.33% 0.96% 75:48>> 4.030*** 3.791*** 2.896** Current Ratio abovemedian 122 2.42% 2.01% 68:54> 4.437*** 3.986*** 2.031*
Quick Ratio <25% 62 1.04% 0.72% 38:24> 2.230* 2.116* 2.018* Quick Ratio >75% 61 3.55% 3.03% 36:25> 4.633*** 3.765*** 1.879*
Current Ratio <25% 60 1.84% 1.13% 37:23> 3.384*** 3.521*** 2.072* Current Ratio >75% 61 2.70% 2.24% 33:28:00 3.179*** 2.846** 1.092
Same Sic 52 7.27% 3.74% 34:18>> 7.506*** 9.117*** 2.633*** Diff Sic 208 1.53% 1.09% 117:91>> 4.591*** 4.326*** 2.57** Leader 93 0.61% 0.52% 53:40> 2.082* 1.567$ 1.65*
Follower 166 3.86% 2.73% 97:69>> 7.777*** 7.905*** 3.035** Notes: The symbols $,*,**, and *** denote statistical significance at the 0.10, 0.05, 0.01, and 0.001 levels, respectively, using a generic one-tailed test. The symbols (,< or ),> etc. correspond to $,* and show the direction and significance of the generalized sign test.
Table 5 . Cumulative Abnormal Returns: Differences of Means. Two-Sample T-statistic
Obs Mean (Diff)
Std. Err. (Diff)
95% Conf. Interval (Diff)
T-statistic (Diff)
Quick Undermedian-Quick Abovemedian 245 1.741461 1.014117 -0.2561206 3.739042 1.7172$ Current Ratio Undermedian- Current Ratio Abovemedian 245 1.431415 1.016111 -0.5700943 3.432924 1.4087
Same Sic - Diff Sic 260 -6.340883 2.447803 -11.16101 -1.520753 -2.5904* Follower-Leader 260 3.545921 2.062227 -0.5150191 7.606861 1.7195$
The symbols $,*,**, and *** denote statistical significance at the 0.10, 0.05, 0.01, and 0.001 levels
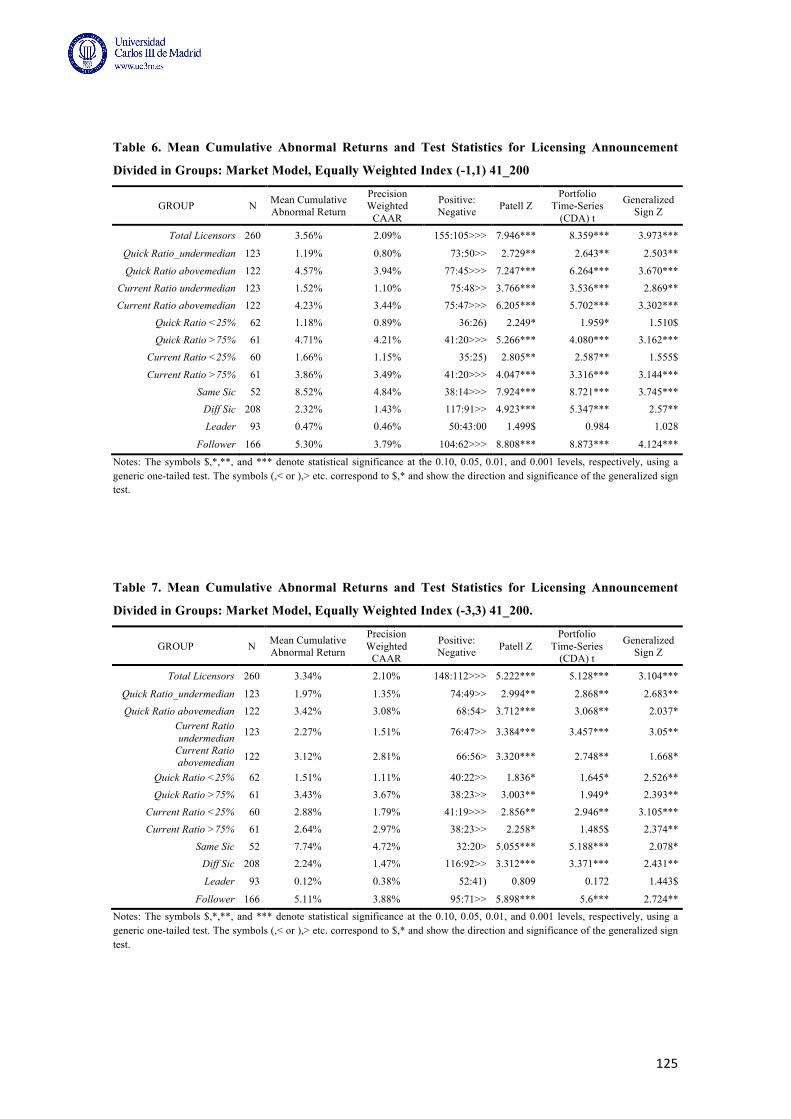
125
Table 6. Mean Cumulative Abnormal Returns and Test Statistics for Licensing Announcement
Divided in Groups: Market Model, Equally Weighted Index (-1,1) 41_200
GROUP N Mean Cumulative Abnormal Return
Precision Weighted
CAAR
Positive: Negative Patell Z
Portfolio Time-Series
(CDA) t
Generalized Sign Z
Total Licensors 260 3.56% 2.09% 155:105>>> 7.946*** 8.359*** 3.973***
Quick Ratio_undermedian 123 1.19% 0.80% 73:50>> 2.729** 2.643** 2.503**
Quick Ratio abovemedian 122 4.57% 3.94% 77:45>>> 7.247*** 6.264*** 3.670*** Current Ratio undermedian 123 1.52% 1.10% 75:48>> 3.766*** 3.536*** 2.869** Current Ratio abovemedian 122 4.23% 3.44% 75:47>>> 6.205*** 5.702*** 3.302***
Quick Ratio <25% 62 1.18% 0.89% 36:26) 2.249* 1.959* 1.510$ Quick Ratio >75% 61 4.71% 4.21% 41:20>>> 5.266*** 4.080*** 3.162***
Current Ratio <25% 60 1.66% 1.15% 35:25) 2.805** 2.587** 1.555$
Current Ratio >75% 61 3.86% 3.49% 41:20>>> 4.047*** 3.316*** 3.144*** Same Sic 52 8.52% 4.84% 38:14>>> 7.924*** 8.721*** 3.745***
Diff Sic 208 2.32% 1.43% 117:91>> 4.923*** 5.347*** 2.57** Leader 93 0.47% 0.46% 50:43:00 1.499$ 0.984 1.028
Follower 166 5.30% 3.79% 104:62>>> 8.808*** 8.873*** 4.124***
Notes: The symbols $,*,**, and *** denote statistical significance at the 0.10, 0.05, 0.01, and 0.001 levels, respectively, using a generic one-tailed test. The symbols (,< or ),> etc. correspond to $,* and show the direction and significance of the generalized sign test.
Table 7. Mean Cumulative Abnormal Returns and Test Statistics for Licensing Announcement
Divided in Groups: Market Model, Equally Weighted Index (-3,3) 41_200.
GROUP N Mean Cumulative Abnormal Return
Precision Weighted
CAAR
Positive: Negative Patell Z
Portfolio Time-Series
(CDA) t
Generalized Sign Z
Total Licensors 260 3.34% 2.10% 148:112>>> 5.222*** 5.128*** 3.104***
Quick Ratio_undermedian 123 1.97% 1.35% 74:49>> 2.994** 2.868** 2.683** Quick Ratio abovemedian 122 3.42% 3.08% 68:54> 3.712*** 3.068** 2.037*
Current Ratio undermedian 123 2.27% 1.51% 76:47>> 3.384*** 3.457*** 3.05**
Current Ratio abovemedian 122 3.12% 2.81% 66:56> 3.320*** 2.748** 1.668*
Quick Ratio <25% 62 1.51% 1.11% 40:22>> 1.836* 1.645* 2.526** Quick Ratio >75% 61 3.43% 3.67% 38:23>> 3.003** 1.949* 2.393**
Current Ratio <25% 60 2.88% 1.79% 41:19>>> 2.856** 2.946** 3.105*** Current Ratio >75% 61 2.64% 2.97% 38:23>> 2.258* 1.485$ 2.374**
Same Sic 52 7.74% 4.72% 32:20> 5.055*** 5.188*** 2.078* Diff Sic 208 2.24% 1.47% 116:92>> 3.312*** 3.371*** 2.431**
Leader 93 0.12% 0.38% 52:41) 0.809 0.172 1.443$
Follower 166 5.11% 3.88% 95:71>> 5.898*** 5.6*** 2.724** Notes: The symbols $,*,**, and *** denote statistical significance at the 0.10, 0.05, 0.01, and 0.001 levels, respectively, using a generic one-tailed test. The symbols (,< or ),> etc. correspond to $,* and show the direction and significance of the generalized sign test.
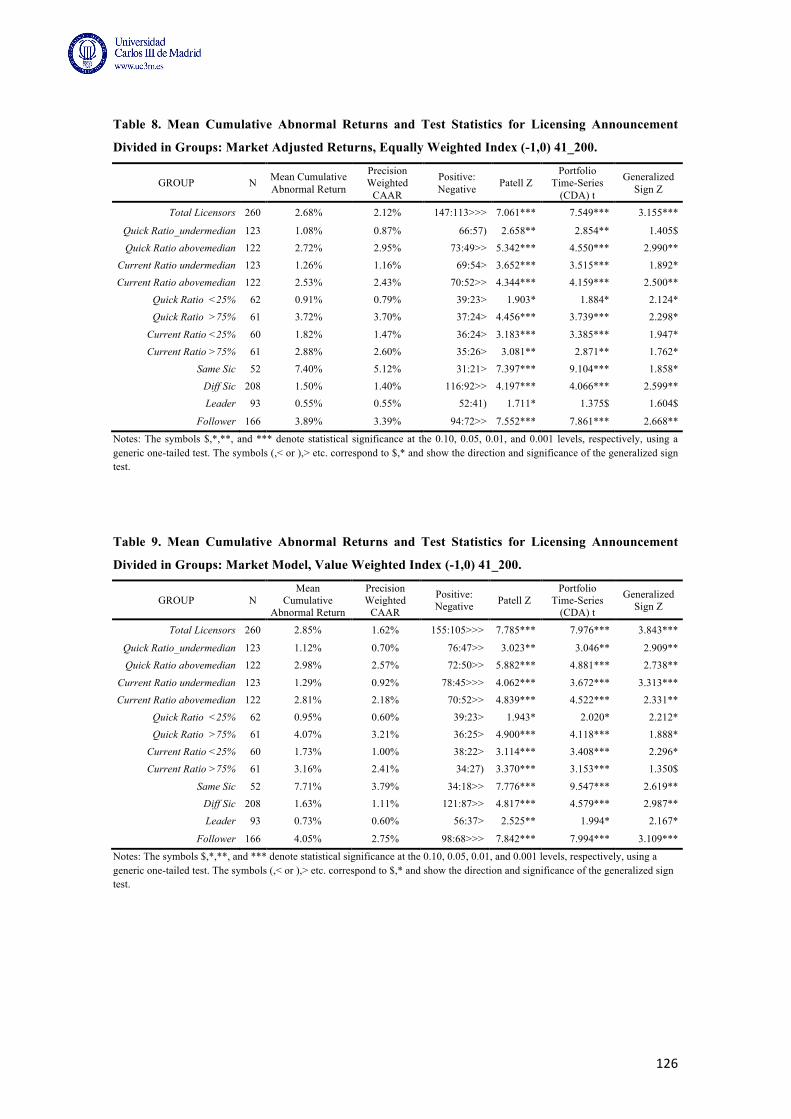
126
Table 8. Mean Cumulative Abnormal Returns and Test Statistics for Licensing Announcement
Divided in Groups: Market Adjusted Returns, Equally Weighted Index (-1,0) 41_200.
GROUP N Mean Cumulative Abnormal Return
Precision Weighted
CAAR
Positive: Negative Patell Z
Portfolio Time-Series
(CDA) t
Generalized Sign Z
Total Licensors 260 2.68% 2.12% 147:113>>> 7.061*** 7.549*** 3.155***
Quick Ratio_undermedian 123 1.08% 0.87% 66:57) 2.658** 2.854** 1.405$ Quick Ratio abovemedian 122 2.72% 2.95% 73:49>> 5.342*** 4.550*** 2.990**
Current Ratio undermedian 123 1.26% 1.16% 69:54> 3.652*** 3.515*** 1.892* Current Ratio abovemedian 122 2.53% 2.43% 70:52>> 4.344*** 4.159*** 2.500**
Quick Ratio <25% 62 0.91% 0.79% 39:23> 1.903* 1.884* 2.124* Quick Ratio >75% 61 3.72% 3.70% 37:24> 4.456*** 3.739*** 2.298*
Current Ratio <25% 60 1.82% 1.47% 36:24> 3.183*** 3.385*** 1.947* Current Ratio >75% 61 2.88% 2.60% 35:26> 3.081** 2.871** 1.762*
Same Sic 52 7.40% 5.12% 31:21> 7.397*** 9.104*** 1.858* Diff Sic 208 1.50% 1.40% 116:92>> 4.197*** 4.066*** 2.599** Leader 93 0.55% 0.55% 52:41) 1.711* 1.375$ 1.604$
Follower 166 3.89% 3.39% 94:72>> 7.552*** 7.861*** 2.668**
Notes: The symbols $,*,**, and *** denote statistical significance at the 0.10, 0.05, 0.01, and 0.001 levels, respectively, using a generic one-tailed test. The symbols (,< or ),> etc. correspond to $,* and show the direction and significance of the generalized sign test.
Table 9. Mean Cumulative Abnormal Returns and Test Statistics for Licensing Announcement
Divided in Groups: Market Model, Value Weighted Index (-1,0) 41_200.
GROUP N Mean
Cumulative Abnormal Return
Precision Weighted
CAAR
Positive: Negative Patell Z
Portfolio Time-Series
(CDA) t
Generalized Sign Z
Total Licensors 260 2.85% 1.62% 155:105>>> 7.785*** 7.976*** 3.843***
Quick Ratio_undermedian 123 1.12% 0.70% 76:47>> 3.023** 3.046** 2.909** Quick Ratio abovemedian 122 2.98% 2.57% 72:50>> 5.882*** 4.881*** 2.738**
Current Ratio undermedian 123 1.29% 0.92% 78:45>>> 4.062*** 3.672*** 3.313*** Current Ratio abovemedian 122 2.81% 2.18% 70:52>> 4.839*** 4.522*** 2.331**
Quick Ratio <25% 62 0.95% 0.60% 39:23> 1.943* 2.020* 2.212* Quick Ratio >75% 61 4.07% 3.21% 36:25> 4.900*** 4.118*** 1.888*
Current Ratio <25% 60 1.73% 1.00% 38:22> 3.114*** 3.408*** 2.296* Current Ratio >75% 61 3.16% 2.41% 34:27) 3.370*** 3.153*** 1.350$
Same Sic 52 7.71% 3.79% 34:18>> 7.776*** 9.547*** 2.619** Diff Sic 208 1.63% 1.11% 121:87>> 4.817*** 4.579*** 2.987** Leader 93 0.73% 0.60% 56:37> 2.525** 1.994* 2.167*
Follower 166 4.05% 2.75% 98:68>>> 7.842*** 7.994*** 3.109***
Notes: The symbols $,*,**, and *** denote statistical significance at the 0.10, 0.05, 0.01, and 0.001 levels, respectively, using a generic one-tailed test. The symbols (,< or ),> etc. correspond to $,* and show the direction and significance of the generalized sign test.
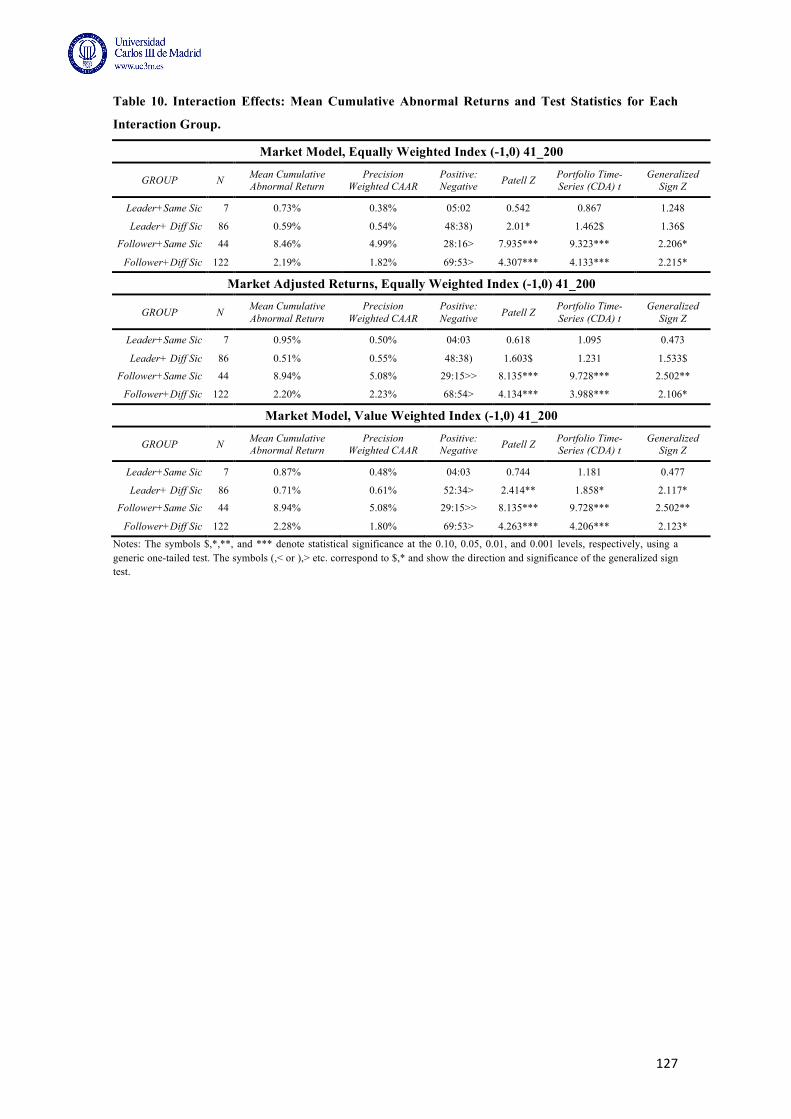
127
Table 10. Interaction Effects: Mean Cumulative Abnormal Returns and Test Statistics for Each
Interaction Group.
Market Model, Equally Weighted Index (-1,0) 41_200
GROUP N Mean Cumulative Abnormal Return
Precision Weighted CAAR
Positive: Negative Patell Z Portfolio Time-
Series (CDA) t Generalized
Sign Z
Leader+Same Sic 7 0.73% 0.38% 05:02 0.542 0.867 1.248
Leader+ Diff Sic 86 0.59% 0.54% 48:38) 2.01* 1.462$ 1.36$
Follower+Same Sic 44 8.46% 4.99% 28:16> 7.935*** 9.323*** 2.206*
Follower+Diff Sic 122 2.19% 1.82% 69:53> 4.307*** 4.133*** 2.215*
Market Adjusted Returns, Equally Weighted Index (-1,0) 41_200
GROUP N Mean Cumulative Abnormal Return
Precision Weighted CAAR
Positive: Negative Patell Z Portfolio Time-
Series (CDA) t Generalized
Sign Z
Leader+Same Sic 7 0.95% 0.50% 04:03 0.618 1.095 0.473
Leader+ Diff Sic 86 0.51% 0.55% 48:38) 1.603$ 1.231 1.533$
Follower+Same Sic 44 8.94% 5.08% 29:15>> 8.135*** 9.728*** 2.502**
Follower+Diff Sic 122 2.20% 2.23% 68:54> 4.134*** 3.988*** 2.106*
Market Model, Value Weighted Index (-1,0) 41_200
GROUP N Mean Cumulative Abnormal Return
Precision Weighted CAAR
Positive: Negative Patell Z Portfolio Time-
Series (CDA) t Generalized
Sign Z
Leader+Same Sic 7 0.87% 0.48% 04:03 0.744 1.181 0.477
Leader+ Diff Sic 86 0.71% 0.61% 52:34> 2.414** 1.858* 2.117*
Follower+Same Sic 44 8.94% 5.08% 29:15>> 8.135*** 9.728*** 2.502**
Follower+Diff Sic 122 2.28% 1.80% 69:53> 4.263*** 4.206*** 2.123*
Notes: The symbols $,*,**, and *** denote statistical significance at the 0.10, 0.05, 0.01, and 0.001 levels, respectively, using a generic one-tailed test. The symbols (,< or ),> etc. correspond to $,* and show the direction and significance of the generalized sign test.


![DOCTORAL THESIS [TESIS DOCTORAL] - UAM](https://img.pdfslide.us/doc/110x75/62162d5b17f9b23eb24b8a87/doctoral-thesis-tesis-doctoral-uam.jpg)