Embed Size (px)
Citation preview
THE ROLE OF SELF-SELECTION IN CLIL:
A PILOT STUDY INTO THE PROFILE AND
MOTIVES OF CLIL AND NON-CLIL PUPILS
IN FLANDERS
Aantal woorden: 13792
Julie Decloedt
Studentennummer: 01400177
Promotor: Prof. Dr. June Eyckmans
Masterproef voorgelegd voor het behalen van de graad master in de richting Tolken
Academiejaar: 2017 - 2018

ABSTRACT
The number of schools offering CLIL education in Europe has increased significantly over the past two
decades. Alongside the practical implementation of teaching subjects through a foreign language, a
plethora of studies comparing CLIL and non-CLIL learners concluded that CLIL methodology renders
superior learning gains. However, scholars have recently voiced concerns about shortcomings in the
research designs of these studies, which might have led to biased results. The present study aims to
contribute to methodologically sound CLIL research by analysing which pupils enrol in CLIL and why.
Therefore, the learner profile of Flemish CLIL and non-CLIL pupils in Belgium will be examined. The
comparison will centre on four variables: cognitive abilities, linguistic abilities, socioeconomic status
and cultural capital. 276 Flemish pupils from the 4th, 5th and 6th year of secondary education took part in
the experiment. Even though there is no overt selection in CLIL programs in Flanders, the results of this
study suggest that self-selection in CLIL programs leads to covert selection. Pupils who enrol in CLIL
classes have the same abilities as the pupils who enrol in L1 classes but the former usually come from
families with more cultural capital and a higher socioeconomic status. Furthermore, although pupils
mainly report to enrol in a specific type of educational program because they take an interest in it rather
than because they are pushed towards it by external factors, CLIL pupils stated much more often than
non-CLIL pupils that they had been influenced by their parents in their program choice.


1
TABLE OF CONTENTS
List of figures and tables .........................................................................................................................3
1 Introduction ................................................................................................................................5
2 Literature review ........................................................................................................................8
3 Research questions ...................................................................................................................14
4 Methodology .............................................................................................................................15
4.1 Participants .........................................................................................................................15
4.2 Measures and instruments ..................................................................................................16
4.2.1 Cognitive ability – Raven SPM test .........................................................................16
4.2.2 Linguistic ability – LLAMA aptitude test................................................................16
4.2.3 Socioeconomic status, cultural capital and motives - background questionnaire ....18
4.3 Procedure ............................................................................................................................18
4.4 Scoring ................................................................................................................................19
5 Results ......................................................................................................................................20
5.1 Cognitive ability .................................................................................................................20
5.2 Linguistic ability .................................................................................................................21
5.2.1 Vocabulary learning .................................................................................................23
5.2.2 Sound recognition ....................................................................................................23
5.2.3 Sound to symbol matching.......................................................................................23
5.2.4 Grammatical inferencing .........................................................................................24
5.3 Socioeconomic status .........................................................................................................24
5.4 Cultural capital ...................................................................................................................25
5.5 Correlation between variables ............................................................................................26
5.6 Predictive power of variables .............................................................................................27
5.7 Reasons for CLIL education ...............................................................................................28
5.8 Reasons for choosing L1 education ....................................................................................30
6 Discussion .................................................................................................................................32
6.1 Pupils’ learner characteristics .............................................................................................32
6.2 Pupils’ motives for an educational program .......................................................................33
6.3 Practical implications, limitations and recommendations ..................................................35
7 Conclusion ................................................................................................................................38
Reference list .........................................................................................................................................40
Appendix: background questionnaire ....................................................................................................45

2
3
LIST OF FIGURES AND TABLES
Figure 1 Average cognitive ability in CLIL and non-CLIL groups as measured by the Raven SPM
test ......................................................................................................................................20
Figure 2: Average overall linguistic ability in CLIL and non-CLIL groups as measured by the
LLAMA aptitude test .........................................................................................................21
Figure 3: Average ability in the subdomains of linguistic ability in CLIL and non-CLIL groups as
measured by the LLAMA aptitude test ..............................................................................22
Figure 4: Average socioeconomic status in CLIL and non-CLIL groups .........................................25
Figure 5: Average cultural capital in CLIL and non-CLIL groups ...................................................26
Figure 6: Tick-marked reasons for CLIL education ..........................................................................29
Figure 7: Tick-marked reasons for L1 education ..............................................................................30
Table 1: Overview of the number of participants included in each part of the experiment .............16
Table 2: Cognitive ability in CLIL and non-CLIL groups as measured by the Raven SPM test .....21
Table 3: Linguistic ability in CLIL and non-CLIL groups as measured by the LLAMA aptitude test
...........................................................................................................................................22
Table 4: Vocabulary learning in CLIL and non-CLIL groups as measured by the LLAMA B .......23
Table 5: Sound recognition in CLIL and non-CLIL groups as measured by the LLAMA D ..........23
Table 6: Sound to symbol matching in CLIL and non-CLIL groups as measured by the LLAMA E
...........................................................................................................................................24
Table 7: Grammatical inferencing in CLIL and non-CLIL groups as measured by the LLAMA B
...........................................................................................................................................24
Table 8: Socioeconomic status in CLIL and non-CLIL groups. ......................................................25
Table 9: Cultural capital in CLIL and non-CLIL groups .................................................................26
Table 10: Correlation coefficient values for correlations between Raven, LLAMA B, LLAMA D,
LLAMA E, LLAMA F, LLAMA overall, socioeconomic status and cultural capital .......27
Table 11: Logistic regression predicting likelihood of CLIL choice based on socioeconomic status,
cultural capital, linguistic ability as measured by the LLAMA test and cognitive ability as
measured by the Raven SPM test.......................................................................................28
Table 12: Logistic regression predicting likelihood of CLIL choice based on socioeconomic status
and cultural capital .............................................................................................................28
Table 13: Tick-marked reasons for CLIL education of 138 pupils ....................................................29
Table 14: Tick-marked reasons for L1 education of 129 pupils .......................................................31

4

5
1 INTRODUCTION
Over the past few decades, Europe has witnessed a gradual increase of interest in multilingualism.
Although multilingualism lies at the heart of the European identity, it was not until 1995 that the
European Commission issued a white paper in which it was recommended explicitly. One of the
objectives in this matter is ensuring that every European citizen is able to speak two languages in
addition to their mother tongue, which is the so-called “1 + 2” principle (European Commission, 1995).
To this end, the European Commission stressed that “it is no longer possible to reserve proficiency in
foreign languages for an elite or for those who acquire it on account of their geographical mobility”
(p. 47). Moreover, it is recommended that “secondary schools pupils should study certain subjects in the
first foreign language learned” (p. 47).
To meet this objective, numerous member states began implementing “an educational approach
in which a foreign language is used as the medium of instruction to teach content subjects” (Nikula,
Dalton-Puffer and Linares, 2013, p. 70). This teaching methodology is often referred to as CLIL, which
stands for Content and Language Integrated Learning, although other acronyms are also adopted such
as TTO (TweeTalig Onderwijs) in Dutch, EMILE (Enseignement d'une Matière par Intégration d'une
Langue Etrangère) in French or AICLE (Aprendizaje Integrado de Contenidos y Lenguas Extranjeras)
in Spanish. Although the term suggests a singular and specific teaching methodology, CLIL should
rather be considered as a “blanket on a large bed shared by many children, each pulling in their own
direction” (Dickey, 2004, p. 13) since CLIL programs can adopt different forms on an international,
national, regional and local level (Hiligsmann et al. 2017). From the 1990s onwards, European countries
began adopting a suitable CLIL teaching methodology in their educational systems. According to
Pladevall-Ballester and Vallbona (2016), the majority of the European countries have implemented
CLIL education in the meantime. Moreover, CLIL approaches have gradually been finding their way
into all layers of education, from kindergarten to university level (Lasagabaster and Doiz, 2016). In
some countries, CLIL has been embraced very early and easily. This is for example the case in countries
such as Spain or the Netherlands. In other countries, the implementation of CLIL occurred later and
more slowly. This is for example the case in Belgium.
The implementation of CLIL unfolded gradually in Belgium. This is not surprising bearing in mind that
Belgium is composed of three official language communities which are each responsible for their own
language policies. Over the past decades, the country has witnessed flaring tensions between the
communities which has resulted in a strained socio-political situation with regards to language affairs.
Consequently, the communities bear negative attitudes towards the “L2 and the L2 community”
(De Smet et al., 2018, p. 52). Introducing a learning methodology through which non-language subjects
are taught in a second language has therefore been no mean feat, especially in Flanders. CLIL found its
way into the educational landscape in Belgium around the turn of the century in the Walloon Region. In

6
1998, the Walloon legislator decided to allow multilingual education and thereby revolutionised
language learning in the French-speaking part of Belgium. Since then schools in Wallonia can offer a
CLIL teaching methodology for Dutch, English and German in all layers of education, although the
majority of CLIL programs are taught in Dutch. In Wallonia, a CLIL methodology can expand from
25% up to 75% of the curriculum. It is important to highlight that one of the conditions for the
implementation of CLIL is that “no official selection procedure is allowed” (Hiligsman et al., 2017,
p. 5). The Walloon government is not allowed to select to pupils and in that way, all pupils are eligible
to enrol in a CLIL program.
It was not until 2008 that the Flemish Region followed the example of Wallonia. In the context
of a small-scale CLIL project, nine schools piloted the desirability and feasibility of a CLIL teaching
methodology in Flanders during three school years. The Flemish government evaluated the project and
concluded that CLIL could become a success in Flanders under certain conditions and that it did not
have to be elitist (Vlaamse Overheid, 2011). This positive evaluation led to the adoption of the
educational decree in 2013 that stipulates that schools are allowed to adopt a CLIL methodology for
French, English or German but they can only do so in secondary education. As opposed to Wallonia, it
is also determined that schools are only allowed to offer a maximum of 20% of the curriculum in the
CLIL language and are obliged to offer a parallel program in Dutch. From 2014 onwards, secondary
schools in the Flemish Region began implementing CLIL and meanwhile, over 80 schools have opted
for this language learning methodology. This means that 9% of all Flemish secondary schools nowadays
have CLIL on offer, a percentage that is likely to increase significantly over the next decade.
From the turn of the century onwards, CLIL has not only sparked the interest of legislators in Belgium
and abroad, it has also frequently come into the focus of researchers in different fields. Initial studies
largely reflected the legislators’ positive attitude towards CLIL. Researchers compared CLIL and
non-CLIL groups and attributed superior learning gains to the CLIL education (e.g. Van de Craen et al.,
2007; Lorenzo, Casal and Moore, 2009; Merikivi and Pietilä, 2014; Heras and Lasagabaster, 2015).
However, scholars have recently voiced concerns about shortcomings in the research designs of these
studies, which might have led to biased results with regards to the learning outcomes of CLIL
(e.g. Bruton, 2011a; 2011b; 2013; 2015; Bonnet, 2012; Paran, 2013; Pérez-Cañado, 2016; 2017).
One of the most important shortcomings of prior CLIL research lies in the fact that the pupils’
learner charachteristics have not been taking into account in comparisons. In order to be able to compare
CLIL and non-CLIL groups, it is important to ascertain that both groups are equally matched. Prior
studies in the field did not take this into consideration because both groups were assumed to be
comparable. Recent studies, however, began focussing on the comparability of CLIL and non-CLIL
groups prior to comparisons by investigating the role of self-selection in CLIL education. In that way,
the learner charachteristics could be taken into consideration when assessing learner gains in CLIL

7
programs (e.g. Lancaster, 2018; Moreno and Callejas, 2018; Fernández Sanjurjo, Arias Blanco and
Fernandez-Costales, 2018; Pérez-Cañado, 2018).
Nevertheless, there are hardly any studies that explicitly report on the difference in learner
profile of CLIL and non-CLIL pupils even though this is crucial to assess whether CLIL education is
accessible to all pupils. Therefore, the present study will investigate the role of self-selection in CLIL
by which pupils enrol in CLIL education and what their motives are to choose a specific teaching
methodology. After taking a closer look at the research in Belgium and in Europe dedicated to CLIL
education, we will formulate the research questions of the present study. We will then discuss the
methodology and results of the experiment.

8
2 LITERATURE REVIEW
The number of schools offering CLIL education in Europe has increased significantly over the past two
decades. Alongside the practical implementation of teaching subjects through a foreign language, a
plethora of studies have been dedicated to CLIL. Many researchers have focussed on the teaching
methodology because it has been promoted as “a lever for change and success in language learning”
ever since its implementation (Pérez Cañado and Ráez Padilla, 2015, p. 1). During the second half of
the past century, foreign language education in Europe was characterised by two main shortcomings.
Firstly, the teaching methodologies that were adopted did not meet the expectations (Marsh, 2002).
Secondly, language learning was a privilege reserved to a small percentage of the population. Learning
another language was not a widespread practice because language education was not included in the
mainstream education but rather “restricted to private establishments and European schools” (Fernández
Sanjurjo, Arias Blanco and Fernández-Costales, 2018, p.18). Although the European Union had set out
to provide its citizens with the ability to communicate easily in two languages in addition to their mother
tongue, a study conducted by the European Commission revealed that only one in four Europeans met
that objective (European Commission, 2006).
In order to address the shortcomings of foreign language education, schools in Europe began
implementing a CLIL teaching methodology. This way, all pupils would have access to foreign language
learning by studying subjects through a foreign language, as had been recommended by the European
Commission in its white paper in 1995 (European Commission, 1995). To this end, Bruton (2013, p.
588) argues that a CLIL teaching methodology offers “two for the price of one” because it integrates
language and content knowledge acquisition. Legislators have adopted a very positive stance towards
CLIL education because it was considered to be the “ potential lynchpin to tackle the foreign language
deficit on our continent” (Pérez-Cañado, 2016, p. 10). In other words, CLIL education was believed to
revolutionise the way in which pupils would learn languages, especially since “it is seen to open doors
on languages for a broader range of learners” (Marsh, 2002, p. 10).
Researchers have reflected the legislators’ enthusiasm towards CLIL and aimed to provide empirical
evidence that would attest to its beneficial effects on pupils’ language knowledge. Numerous researchers
have shown interest in the field. Nevertheless, CLIL research in Belgium, and in Flanders in particular,
which forms the context of the present study, is relatively scarce and limited. To this end, Hiligsman et
al. (2017) observed that studies in Belgium do not often find their way into peer-reviewed journals. In
Flanders, research has mainly focussed on the description of the implementation and pedagogy of CLIL
in text books (e.g. Martens and Van de Craen, 2017) and in governmentally-funded reports (e.g. Vlaamse
Overheid 2011; 2017). In Wallonia, there is a limited body of small-scale empirical research into CLIL.
9
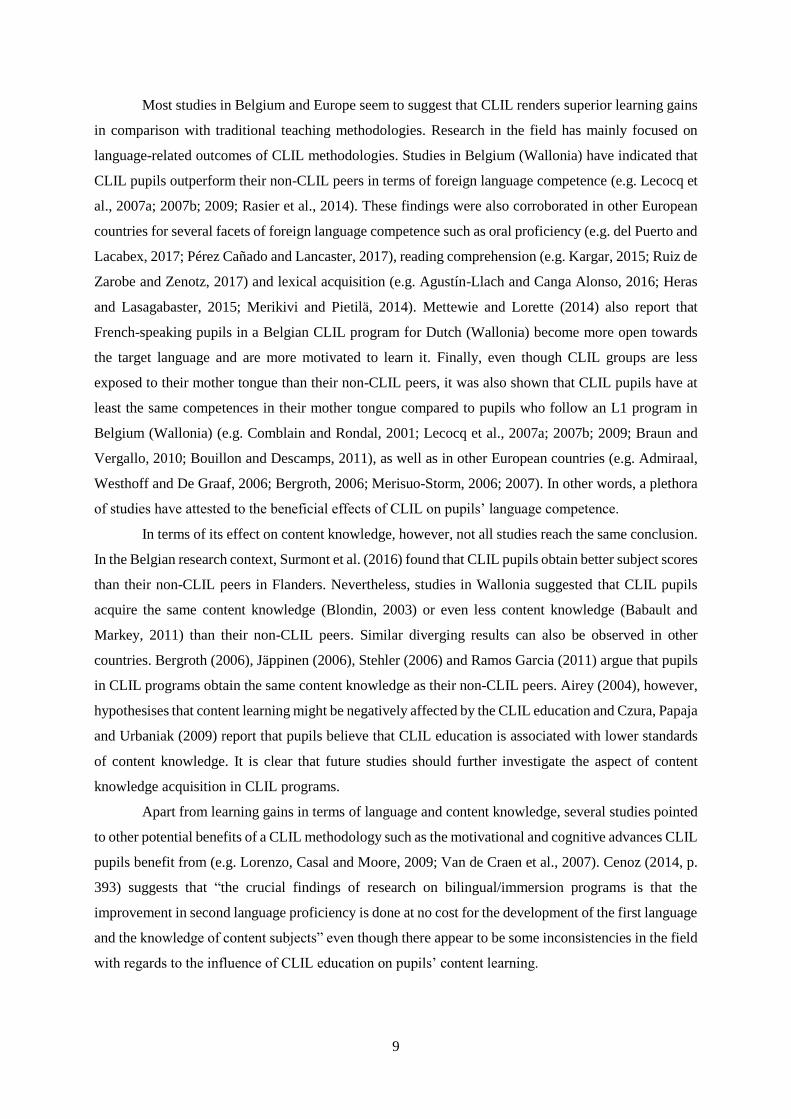
Most studies in Belgium and Europe seem to suggest that CLIL renders superior learning gains
in comparison with traditional teaching methodologies. Research in the field has mainly focused on
language-related outcomes of CLIL methodologies. Studies in Belgium (Wallonia) have indicated that
CLIL pupils outperform their non-CLIL peers in terms of foreign language competence (e.g. Lecocq et
al., 2007a; 2007b; 2009; Rasier et al., 2014). These findings were also corroborated in other European
countries for several facets of foreign language competence such as oral proficiency (e.g. del Puerto and
Lacabex, 2017; Pérez Cañado and Lancaster, 2017), reading comprehension (e.g. Kargar, 2015; Ruiz de
Zarobe and Zenotz, 2017) and lexical acquisition (e.g. Agustín-Llach and Canga Alonso, 2016; Heras
and Lasagabaster, 2015; Merikivi and Pietilä, 2014). Mettewie and Lorette (2014) also report that
French-speaking pupils in a Belgian CLIL program for Dutch (Wallonia) become more open towards
the target language and are more motivated to learn it. Finally, even though CLIL groups are less
exposed to their mother tongue than their non-CLIL peers, it was also shown that CLIL pupils have at
least the same competences in their mother tongue compared to pupils who follow an L1 program in
Belgium (Wallonia) (e.g. Comblain and Rondal, 2001; Lecocq et al., 2007a; 2007b; 2009; Braun and
Vergallo, 2010; Bouillon and Descamps, 2011), as well as in other European countries (e.g. Admiraal,
Westhoff and De Graaf, 2006; Bergroth, 2006; Merisuo-Storm, 2006; 2007). In other words, a plethora
of studies have attested to the beneficial effects of CLIL on pupils’ language competence.
In terms of its effect on content knowledge, however, not all studies reach the same conclusion.
In the Belgian research context, Surmont et al. (2016) found that CLIL pupils obtain better subject scores
than their non-CLIL peers in Flanders. Nevertheless, studies in Wallonia suggested that CLIL pupils
acquire the same content knowledge (Blondin, 2003) or even less content knowledge (Babault and
Markey, 2011) than their non-CLIL peers. Similar diverging results can also be observed in other
countries. Bergroth (2006), Jäppinen (2006), Stehler (2006) and Ramos Garcia (2011) argue that pupils
in CLIL programs obtain the same content knowledge as their non-CLIL peers. Airey (2004), however,
hypothesises that content learning might be negatively affected by the CLIL education and Czura, Papaja
and Urbaniak (2009) report that pupils believe that CLIL education is associated with lower standards
of content knowledge. It is clear that future studies should further investigate the aspect of content
knowledge acquisition in CLIL programs.
Apart from learning gains in terms of language and content knowledge, several studies pointed
to other potential benefits of a CLIL methodology such as the motivational and cognitive advances CLIL
pupils benefit from (e.g. Lorenzo, Casal and Moore, 2009; Van de Craen et al., 2007). Cenoz (2014, p.
393) suggests that “the crucial findings of research on bilingual/immersion programs is that the
improvement in second language proficiency is done at no cost for the development of the first language
and the knowledge of content subjects” even though there appear to be some inconsistencies in the field
with regards to the influence of CLIL education on pupils’ content learning.

10
This initial overall burst of enthusiasm for CLIL was often characterised by research designs in which
the performance of two groups, CLIL pupils and non-CLIL pupils, was compared by means of tests
which measure the pupils’ competence of the subject and target language. In most of these studies, CLIL
pupils’ superior scores were merely attributed to the CLIL treatment. This is for example the case in the
study conducted by Lorenzo, Casal and Moore (2009). In that study, CLIL groups were reported to score
almost 25 percent higher than non-CLIL groups in a language test. Consequently, the authors concluded
the following: “considering that the only feature which distinguishes these two groups is that the
bilingual learners have had one and a half years of CLIL, the difference is striking” (Lorenzo, Casal and
Moore, 2009, p. 427). Nonetheless, they suggest that CLIL and non-CLIL pupils might not possess the
same characteristics and that this should not be ignored. Paradoxically, however, they do not take this
into further consideration when analysing their results. In many studies, comparisons between CLIL and
non-CLIL pupils were merely based on pupils’ test results and other variables such as the learner profile
of the pupils were overlooked, not taken into account or even ignored. The reason for this lies in the
belief that pupils in CLIL and L1 education consist of equal groups because CLIL is open to all pupils.
According to Moreno and Calles (2018, p. 116), this is assumed to be “favouring egalitarianism”.
In many countries, pupils are indeed not subjected to selection procedures in which they need to prove
their suitability for the CLIL program. Some countries even explicitly stipulate that schools are not
allowed to select pupils. As was already mentioned before, this is for example the case in Belgium. This
does however not apply to all countries. Dallinger, Jonkmann and Holm (2018), for example, report that
pupils are thoroughly screened at the onset of a CLIL program in Germany in order to ascertain that
only the pupils that are highly likely to do well are given the opportunity to enrol in the program.
Nevertheless, even though pupils can freely choose a program in most educational contexts, Bruton
(2011a, p. 237) cautions that “choice supposes equality in theory, but in reality it might not”.
Numerous studies have recently debunked the egalitarian postulate that is often associated with
CLIL education (e.g. Bruton, 2011a; 2011b; 2013; 2015; Mehisto, 2007; Paran, 2013; Pérez Cañado,
2016). These scholars point out that there is a lack of evidence to corroborate the assumption that CLIL
and non-CLIL groups are equally matched. Bruton (2013, p. 595), for example, argues that “implicitly,
CLIL is likely to be elitist and cream off certain students”. Although many authors point out that CLIL
is open to all pupils and that there are no overt selection procedures in place, critical voices suggest that
selection might be covert. CLIL education may not be inherently discriminatory but without empirical
evidence it cannot be guaranteed that there is no selection at all in CLIL programs. It is possible that
pupils with specific charachteristics are more attracted to CLIL education than others. In regard to this,
Bruton (2011a, p. 238) suggests that “the control groups are not students of similar characteristics taken
from schools with no CLIL streams so much as students who on average would have lower initial
language proficiency scores, lower motivational levels, and probably lower content subject scores as
well, in the same schools”. Therefore, numerous calls have been made for more “empirical
substantiation” of CLIL-effects by means of an in-depth investigation of the learner charachteristics of

11
CLIL and non-CLIL pupils. In that way, studies can look into the role of self-selection into CLIL
programs, which seems warranted if learning gains are compared across groups (Pérez-Cañado, 2017,
p. 88).
Researchers have recently started exploring the learner characteristics of CLIL and non-CLIL pupils.
Two main trends can be distinguished with regards to these studies. Firstly, a few studies focussed on
the learner profile of CLIL and non-CIL pupils and reported whether and how both groups differed from
each other. This is crucial to guarantee that CLIL does not target a specific group of pupils but is
accessible to a wide range of learners. Secondly, the majority of studies rather focus on the learning
gains in CLIL programs. In order to assure that the compared groups are fit for comparing purposes,
they take the pupils’ learner charachteristics into account by excluding pupils that are outliers.
Nonetheless, they do so without reporting on the differences they observed between the groups.
As far as we know, there are only a few studies that report on the learner characteristics of CLIL
and non-CLIL pupils. It is remarkable to point out that all these studies were conducted in the
educational context of Germany. Dallinger et al. (2016) was the first to observe that CLIL pupils come
from families with a higher socioeconomic status and obtain better scores than their non-CLIL peers in
the same school for four variables: verbal cognitive skills, content and language competence and
motivation. Rumlich (2017) also detected significant differences in favour of CLIL pupils in terms of
verbal cognitive skills and foreign language proficiency. Finally, Dallinger, Jonkmann and Hollm (2018)
observed the same differences between CLIL and non-CLIL pupils. Furthermore, the authors added that
pupils enrolled in a CLIL program also had more books in their households, which was used as a proxy
for cultural capital. All these studies suggest that the learners in CLIL and L1 education have different
learner characteristics. Nonetheless, it should be highlighted that these studies were conducted in
Germany, a country in which overt selection procedures are in place. Therefore, different learner
charachteristics between both groups are to be expected because this education context paves the way
for selection. Outside the educational context of Germany, Broca (2016) surveyed pupils enrolled in
CLIL and L1 programs in Spain. Even though CLIL is open to all pupils in Spain, Broca also found that
pupils who enrol in a CLIL program obtain higher grades than pupils who enrol in an L1 program.
Moreover, CLIL pupils are much more influenced by their parents in their program choice. Broca’s
study suggests that even in educational contexts without overt selection procedures, there is some form
of selection as a consequence of the pupils’ self-selection into CLIL programs. These findings appear
to corroborate critical scholars’ assumptions that there is covert selection in CLIL education.
Other studies do not explicitly report on the differences between CLIL and non-CLIL pupils but
immediately take their learner charachteristics into account when comparing learning gains
(e.g. Lancaster, 2018; Moreno and Callejas, 2018; Fernández Sanjurjo, Arias Blanco and Fernandez-
Costales, 2018; Pérez-Cañado, 2018). Lancaster (2018) and Pérez-Cañado (2018), for example, ensured
that both groups were comparable by excluding outliers. To obtain equal groups, they had to exclude no
12
less than half of the participants that took part in their studies which respectively corresponded to about
300 up to 2000 participants. By excluding that many participants, both studies suggest remarkable initial
differences between both groups. Yet the reader can only speculate about the way in which both groups
differ. Furthermore, comparisons that are merely based on mainstream pupils and exclude over- and
underachievers are likely to render a distorted view of the learner outcomes. In order to ascertain that
CLIL offers an appropriate educational environment for a broad range of pupils, it is important to
consider all pupils in comparisons to obtain a representative view of the effectiveness of the program.
In this regard, it is worth mentioning that several studies have found a correlation between
pupils’ socioeconomic status (SES) and their academic performance: pupils coming from families with
a higher SES consistently obtain better scores than pupils coming from families with a lower SES
(Anghel, Cabrales and Carro, 2016; Fernández-Sanjurjo, Fernández-Costales and Arias Blanco, 2017;
Fernández Sanjurjo, Arias Blanco and Fernández-Costales, 2018; Moreno and Callejas, 2018). As a
possible explanation for this, Fernández Sanjurjo, Arias Blanco and Fernández-Costales (2018) refer to
the possibility that “students from more privileged backgrounds may receive additional support from
the family environment: besides living in wealthier environments, these students also enjoy more
cultural opportunities, have more support outside the school context, and usually show higher
motivational levels in the learning process” (p.23). Moreover, the authors found that pupils with a lower
SES who enrolled in a CLIL program failed to meet the academic goals for the content of the course.
According to these studies, pupils’ SES appears to be closely linked to academic achievement regardless
of educational program. If a considerable proportion of the pupils are excluded from comparisons,
studies might therefore render a biased view of the effectiveness of the program taking into consideration
that pupils with different socioeconomic backgrounds respond differently to a CLIL teaching
methodology.
It was not until recently that researchers in the field began focussing on the learner charachteristics of
CLIL and non-CLIL pupils after numerous claims were made that the two groups were not equally
matched. This way, the role of self-selection in CLIL education has been explored to a limited extent.
There is preliminary evidence that seems to support the claim that CLIL education attracts learners with
a different profile in comparison with L1 education. Consequently, an increasing number of researchers
in the field attest to the importance of including the learners’ characteristics in comparisons in order to
evaluate the outcomes of the educational programs. Nevertheless, they do not report on the differences
between both groups and merely exclude outliers when assuring their homogeneity. As a consequence,
this approach is likely to render a biased view of the effectiveness of the educational program. In the
future, studies should focus and report on the learner profile of CLIL and non-CLIL learners in the first
place in order to assess whether CLIL is accessible to all pupils and then take the learner characteristics
into account when comparing learning gains between both groups in order to assess whether all pupils
in CLIL benefit equally from the educational program. In order to further investigate this matter, the

13
present study will analyse the role of self-selection in CLIL by looking closely at a number of learner
characteristics which might distinguish CLIL pupils from non-CLIL pupils, namely cognitive ability,
linguistic ability and the pupils’ socioeconomic and cultural background. In doing so, the present study
aims to provide a methodologically sound basis for future studies into the effects of CLIL in Flanders,
Belgium and abroad.
14
3 RESEARCH QUESTIONS
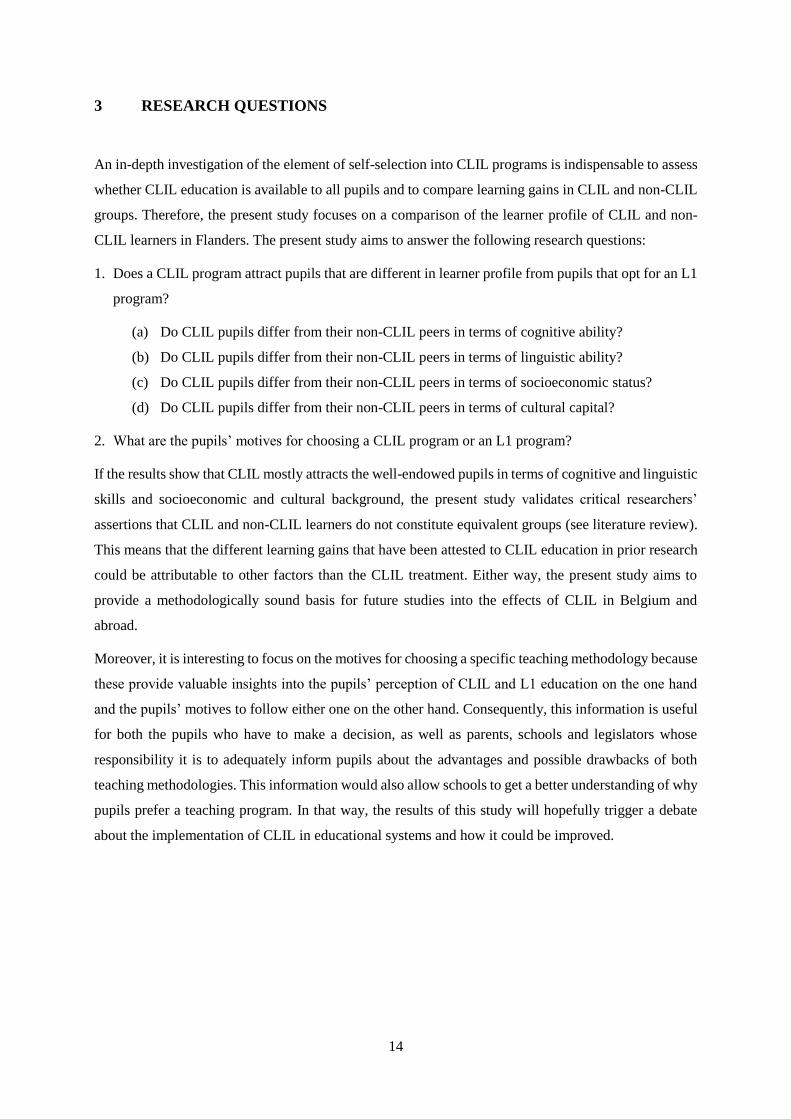
An in-depth investigation of the element of self-selection into CLIL programs is indispensable to assess
whether CLIL education is available to all pupils and to compare learning gains in CLIL and non-CLIL
groups. Therefore, the present study focuses on a comparison of the learner profile of CLIL and non-
CLIL learners in Flanders. The present study aims to answer the following research questions:
1. Does a CLIL program attract pupils that are different in learner profile from pupils that opt for an L1
program?
(a) Do CLIL pupils differ from their non-CLIL peers in terms of cognitive ability?
(b) Do CLIL pupils differ from their non-CLIL peers in terms of linguistic ability?
(c) Do CLIL pupils differ from their non-CLIL peers in terms of socioeconomic status?
(d) Do CLIL pupils differ from their non-CLIL peers in terms of cultural capital?
2. What are the pupils’ motives for choosing a CLIL program or an L1 program?
If the results show that CLIL mostly attracts the well-endowed pupils in terms of cognitive and linguistic
skills and socioeconomic and cultural background, the present study validates critical researchers’
assertions that CLIL and non-CLIL learners do not constitute equivalent groups (see literature review).
This means that the different learning gains that have been attested to CLIL education in prior research
could be attributable to other factors than the CLIL treatment. Either way, the present study aims to
provide a methodologically sound basis for future studies into the effects of CLIL in Belgium and
abroad.
Moreover, it is interesting to focus on the motives for choosing a specific teaching methodology because
these provide valuable insights into the pupils’ perception of CLIL and L1 education on the one hand
and the pupils’ motives to follow either one on the other hand. Consequently, this information is useful
for both the pupils who have to make a decision, as well as parents, schools and legislators whose
responsibility it is to adequately inform pupils about the advantages and possible drawbacks of both
teaching methodologies. This information would also allow schools to get a better understanding of why
pupils prefer a teaching program. In that way, the results of this study will hopefully trigger a debate
about the implementation of CLIL in educational systems and how it could be improved.

15
4 METHODOLOGY
In order to investigate the learner profile of CLIL and non-CLIL learners, four main characteristics will
be taken into account: cognitive ability, linguistic ability, socioeconomic status (SES) and cultural
capital. These characteristics have been selected on the basis of their attested relevance in the CLIL
literature (see literature review). Moreover, the pupils’ motives for a CLIL or L1 teaching methodology
will be taken into account in order to obtain a clear view of the pupils’ motives for both methodologies.
4.1 Participants
282 pupils from the 4rd, 5th and 6th year of secondary school in Flanders took part in the study. They
were all aged between 14 and 19, although the majority of the pupils were 15, 16 or 17 years old, and
attended secondary schools in East Flanders (Ghent) or West Flanders (Ardooie) at the time of testing.
All pupils followed general secondary education and chose one of the following fields of study:
(a) economics, (b) Latin or (c) Greek-Latin in combination with sciences, mathematics or languages, or
(d) sciences in combination with mathematics or languages.
Six pupils were immediately excluded from the study because they were absent when the program
choice was made. Of the remaining 276 pupils, there were 143 participants who opted for a CLIL
program and 133 participants who preferred an L1 program, although CLIL was on offer. It is important
to point out that this division corresponds to the pupils’ choices rather than the program they are actually
following. 17 pupils opted for CLIL but were not able to follow the program due to a lack of capacity.
Since this study focusses on the pupils’ program choice rather than the programs they are actually in,
we opted to include these 17 pupils in the CLIL group. In the following sections, we will refer to the
pupils who opted for a CLIL program as the CLIL group and to the pupils who preferred an L1 program
as the non-CLIL group.
Several participants had to be excluded from specific parts of the study due to absence, software failure
or incomplete responses. Table 1 gives an overview of the number of participants that are included in
each part of the experiment. As will be explained in the measures and instruments section below, the
linguistic ability test consists of several subtests. Table 1 presents all participants that have completed
all four subtests but in order to maximize the number of participants for each variable, we have included
as many participants as possible for each subtest. Consequently, the number of participants included in
the subtests separately varies from 248 to 253 participants.

16
Measures CLIL pupils non-CLIL pupils Total
Cognitive ability 143 133 276
Linguistic ability 126 100 226
Socioeconomic status 127 119 246
Cultural capital 142 131 273
Motives 143 132 275
Table 1: Overview of the number of participants included in each part of the experiment
4.2 Measures and instruments
4.2.1 Cognitive ability – Raven SPM test
The first variable that is tested for is cognitive ability. Even though there is much on-going debate about
the most appropriate way to measure human intelligence, a consensus has been reached on the
importance of the Cattell–Horn–Carroll theory, often referred to as the CHC theory in short (McGrew,
2009). According to this model, general intelligence consists of multiple subdomains which should be
taken into account when measuring a person’s intelligence. Due to practical limitations, we were not
able to test for all these domains for the assessment of the pupils’ cognitive ability. Therefore, we opted
to test for one domain in particular which has been shown to be a good predictor for general intelligence,
namely fluid intelligence (Primi, Ferrão and Almeida, 2010). Fluid intelligence measures a person’s
abstract reasoning skills, which stands for “the ability to reason and to solve new problems
independently of previously acquired knowledge” (Jaeggi et al., 2008, p. 6829).
Considering the close link between general and fluid intelligence, we opted for a fluid intelligence test
which provides a general impression of an individual’s cognitive ability. In this study, the pupils will be
administered a Raven test (Raven, 1941). This test was developed almost 80 years ago but is still the
most wide-spread and frequently used test to measure fluid intelligence (Raven, 2000). In this study, we
will use a version of the Raven test adapted to secondary school level, which is the Raven Standard
Progressive Matrices (SPM). In the test, participants’ abstract reasoning skills are tested by presenting
them with 60 geometrical patterns of which one element is missing. Participants respond to each item
by selecting the appropriate geometrical figure from a series of six or eight. Although the test is usually
administered without time limitations, we chose to limit the time available to the participants to 15
minutes to meet efficiency needs. Research has already shown that a shorter version of the Raven test is
a good predictor of scores that would be obtained on the untimed Raven test (e.g. Hamel, 2006).
4.2.2 Linguistic ability – LLAMA aptitude test
The second variable that is tested for is linguistic ability. Everybody can learn a foreign language but
some people find it more challenging than others. Language aptitude is a measure which indicates how
easily an individual is able to learn another language. In this study pupils’ language aptitude will be

17
charted by means of the LLAMA aptitude test (Meara, 2005), which has been validated by several
scholars (e.g. Granena, 2013; Rogers et al., 2016; 2017). This battery of tests measures individuals’
language aptitude regardless of their L1. In order to exclude the affinity that may arise when individuals
learn a language that typologically resembles their L1, an Indian minority language spoken in North-
America is used throughout the LLAMA test. The test takes approximately 30 minutes to complete
digitally and consists of four subtests (LLAMA B, LLAMA D, LLAMA E and LLAMA F) that each
measure a different aspect of language aptitude. Each subtests consists of a learning phase in which
participants learn about an aspect of the language they are not familiar with. Afterwards, there is a testing
phase in which participants are tested for the knowledge they acquired during the learning phase. After
each response, feedback is provided in the form of a sound: a ding sound corresponds to a correct answer,
a bleep sound corresponds to a wrong answer. After finishing the test, a score is displayed on the screen.
It is important to mention that participants loose points in three out of the four subtests if they give a
wrong answer in order to avoid guessing (except for the LLAMA B, all subtests offer two possible
answer from which participants need to choose).
LLAMA B: learning vocabulary
The LLAMA B measures how easily an individual is able to learn a considerable amount of vocabulary
in a limited time period. Participants receive two minutes to learn the names of twenty objects that are
displayed on a screen. In order to learn the names of the objects, they need to click on them to see their
name displayed. They can click on the objects as many times as they like. In the testing phase, the
participants are given a name and have to click on the corresponding object.
LLAMA D: recognising sounds
The LLAMA D measures how easily an individual is able to recognise spoken words. The participants
listen to ten words. Afterwards, in the testing phase, the participants hear these words again alongside
new words they have not heard before. For each word the participants hear in the testing phase, they
need to indicate whether they believe they have already heard the word or not.
LLAMA E: matching sound to symbols
The LLAMA E measures how easily an individual can match sounds to symbols. In this test, participants
see 27 short written items on the screen such as ‘9i’. They are expected to click on the items and listen
to their pronunciation during two minutes. This way they can figure out how the spelling system of this
language works. Afterwards, they need to indicate which word corresponds to a pronunciation they hear.
They have to choose between two words, of which only one is spelled correctly.
18
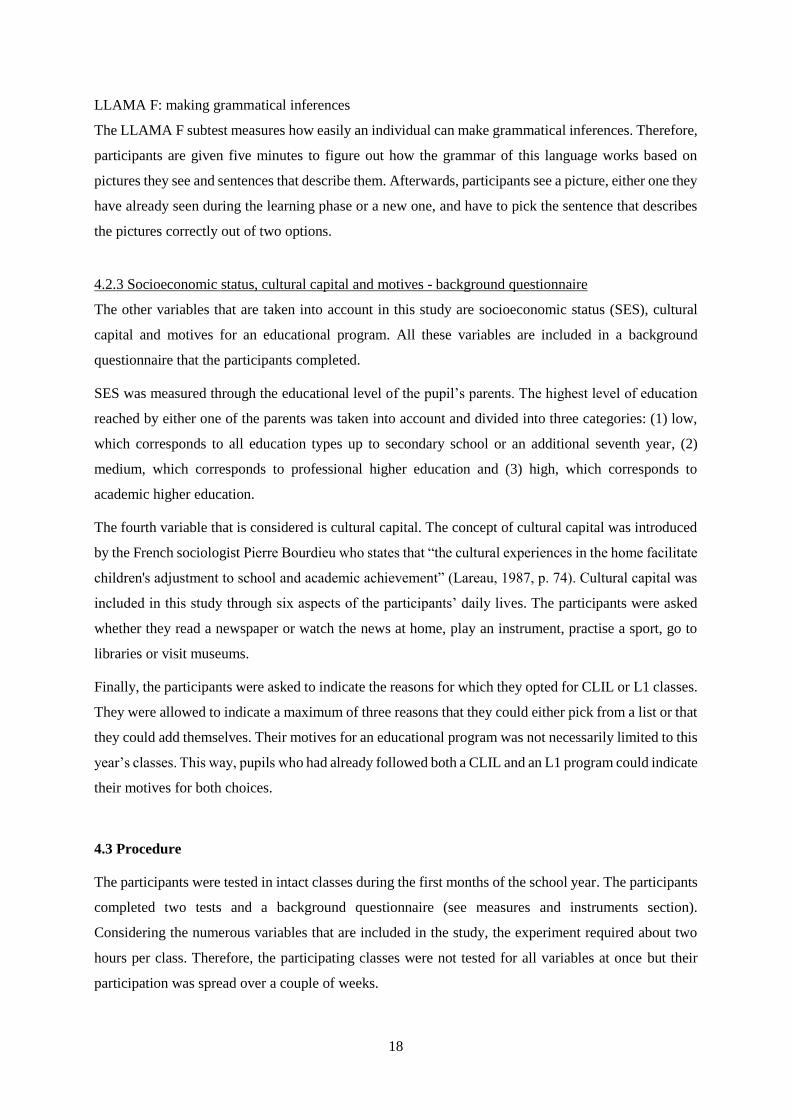
LLAMA F: making grammatical inferences
The LLAMA F subtest measures how easily an individual can make grammatical inferences. Therefore,
participants are given five minutes to figure out how the grammar of this language works based on
pictures they see and sentences that describe them. Afterwards, participants see a picture, either one they
have already seen during the learning phase or a new one, and have to pick the sentence that describes
the pictures correctly out of two options.
4.2.3 Socioeconomic status, cultural capital and motives - background questionnaire
The other variables that are taken into account in this study are socioeconomic status (SES), cultural
capital and motives for an educational program. All these variables are included in a background
questionnaire that the participants completed.
SES was measured through the educational level of the pupil’s parents. The highest level of education
reached by either one of the parents was taken into account and divided into three categories: (1) low,
which corresponds to all education types up to secondary school or an additional seventh year, (2)
medium, which corresponds to professional higher education and (3) high, which corresponds to
academic higher education.
The fourth variable that is considered is cultural capital. The concept of cultural capital was introduced
by the French sociologist Pierre Bourdieu who states that “the cultural experiences in the home facilitate
children's adjustment to school and academic achievement” (Lareau, 1987, p. 74). Cultural capital was
included in this study through six aspects of the participants’ daily lives. The participants were asked
whether they read a newspaper or watch the news at home, play an instrument, practise a sport, go to
libraries or visit museums.
Finally, the participants were asked to indicate the reasons for which they opted for CLIL or L1 classes.
They were allowed to indicate a maximum of three reasons that they could either pick from a list or that
they could add themselves. Their motives for an educational program was not necessarily limited to this
year’s classes. This way, pupils who had already followed both a CLIL and an L1 program could indicate
their motives for both choices.
4.3 Procedure
The participants were tested in intact classes during the first months of the school year. The participants
completed two tests and a background questionnaire (see measures and instruments section).
Considering the numerous variables that are included in the study, the experiment required about two
hours per class. Therefore, the participating classes were not tested for all variables at once but their
participation was spread over a couple of weeks.

19
All participants signed an informed consent form prior to the experiment. The first test the participants
completed was the cognitive ability test (Raven SPM). Therefore, they were given a booklet with the
geometrical patterns and a form with all possible answers. They received oral instructions prior to the
test, after which they were given 15 minutes to complete as many geometrical patterns as they could,
regardless of the order of the patterns in the booklet.
The second test the participants completed was the linguistic ability test (LLAMA). Therefore, they
were assigned to a computer and were given a form to write down the scores they obtained in each
subtest. They received oral instructions prior to each subtest and only when all pupils were ready, they
received instructions to the following subtest.
After these two tests, all participants received a background questionnaire in which they were asked,
amongst other things, about SES, cultural capital and motives for CLIL or L1 classes. While completing
the questionnaire, they were allowed to ask for as many clarifications as they wanted to.
4.4 Scoring
For the Raven SPM test, participants received a score out of 60. They were given 1 point for each correct
answer and 0 points for an incorrect or missing answer.
For the LLAMA aptitude test, participants received a score for each subtest, as well as an overall score,
all of which were out of a total of 100. The scores obtained in the subtests were automatically processed
by the program and displayed on the screen. Of those four scores, we calculated the average to give each
participants an overall score for linguistic ability.
For SES, participants received a score between 0 and 2 based on their report of the highest educational
level obtained by their parents:
- 0 corresponds to a low SES (secondary school or 7th year)
- 1 corresponds to a medium SES (professional higher education)
- 2 corresponds to a high SES (academic higher education).
For cultural capital, participants indicated whether or not an activity was relevant to them. For each
aspect indicated, they received a point. In that way, every participant received a score from 0 to 6.

20
5 RESULTS
In this section, the data that was collected at the onset of the CLIL programme will be reported. The
following four variables are taken into account: cognitive ability, linguistic ability, socioeconomic status
and cultural capital. Firstly, we will describe the scores that were obtained by the pupils in the CLIL and
non-CLIL groups. We will then compare their average scores by means of a two-tailed independent
samples t-test to reveal possible differences between both groups. A p-value of 0.05 is used as the cutoff
point for statistical significance. In order to further investigate the magnitude of the differences that are
observed, effect sizes will be given for each variable in the study, which will be reported by means of
the Cohen’s d for its widespread use in the literature. We also calculated the association between the
variables by means of a Pearson correlation coefficient. This way, we can assess whether the variables
included in the study are related. Furthermore, we carried out a logistic regression in order to assess the
predictive power of the variables on the likelihood that pupils’ choose a CLIL program. Finally, the
pupils’ motives to follow one or the other educational program will be described.
5.1 Cognitive ability
Cognitive ability of 276 participants was assessed by means of the Raven SPM test. The scores ranged
from 24 to 58 out of 60, with an overall mean of 48.62 and a standard deviation of 5.04. As can be seen
in figure 1, the CLIL pupils obtained higher scores on average than the non-CLIL pupils in terms of
cognitive ability. Table 2 shows the pupils’ average scores in function of their choice of educational
program.
Figure 1: Average cognitive ability in CLIL and non-CLIL groups as measured by the Raven SPM test
45
46
47
48
49
50
CLIL pupils non-CLIL pupils
Cognitive ability

21
The difference between the scores obtained by the CLIL pupils (M = 49.04, SD = 5.06) and those
obtained by the non-CLIL pupils (M = 48.19, SD = 5.00), however, was not shown to be significant
(t (274) = 1.41, p = 0.16). The effect size for cognitive ability can also be considered small (d = 0.17).
In our sample of participants we have not found empirical evidence of a difference in cognitive ability
between CLIL and non-CLIL pupils.
Participants of the Raven SPM test N M SD
CLIL pupils 140 49.04 5.06
non-CLIL pupils 136 48.19 5.00
Table 2: Cognitive ability in CLIL and non-CLIL groups as measured by the Raven SPM test.
N = number of participants, M = mean, SD = standard deviation
5.2 Linguistic ability
The linguistic ability of 259 participants was assessed by means of the LLAMA aptitude test. The scores
ranged from 4 to 90 out of a total of 100, with an overall mean of 61.42 and a standard deviation of
14,66. As can be seen in figure 2, the CLIL pupils obtained higher scores on average than their non-
CLIL peers. Table 3 shows the pupils’ average scores in function of their choice of educational program.
Figure 2: Average overall linguistic ability in CLIL and non-CLIL groups as measured by the LLAMA
aptitude test
Nevertheless, the difference between the scores of the CLIL pupils (M = 62.32, SD = 14.46) and those
of the non-CLIL pupils (M = 60.44, SD = 14.87) was not shown to be significant (t (257) = 1.03, p =
55
56
57
58
59
60
61
62
63
CLIL pupils non-CLIL pupils
Overall linguistic ability
22
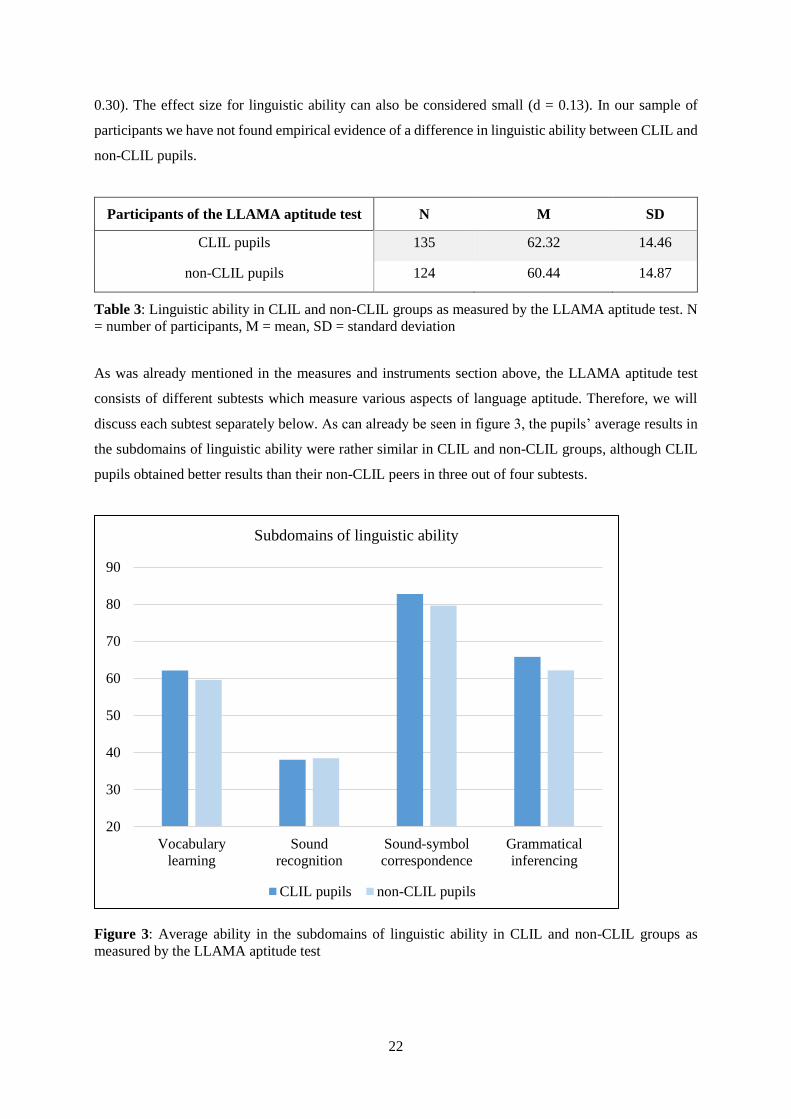
0.30). The effect size for linguistic ability can also be considered small (d = 0.13). In our sample of
participants we have not found empirical evidence of a difference in linguistic ability between CLIL and
non-CLIL pupils.
Participants of the LLAMA aptitude test N M SD
CLIL pupils 135 62.32 14.46
non-CLIL pupils 124 60.44 14.87
Table 3: Linguistic ability in CLIL and non-CLIL groups as measured by the LLAMA aptitude test. N
= number of participants, M = mean, SD = standard deviation
As was already mentioned in the measures and instruments section above, the LLAMA aptitude test
consists of different subtests which measure various aspects of language aptitude. Therefore, we will
discuss each subtest separately below. As can already be seen in figure 3, the pupils’ average results in
the subdomains of linguistic ability were rather similar in CLIL and non-CLIL groups, although CLIL
pupils obtained better results than their non-CLIL peers in three out of four subtests.
Figure 3: Average ability in the subdomains of linguistic ability in CLIL and non-CLIL groups as
measured by the LLAMA aptitude test
20
30
40
50
60
70
80
90
Vocabulary
learning
Sound
recognition
Sound-symbol
correspondence
Grammatical
inferencing
Subdomains of linguistic ability
CLIL pupils non-CLIL pupils
23
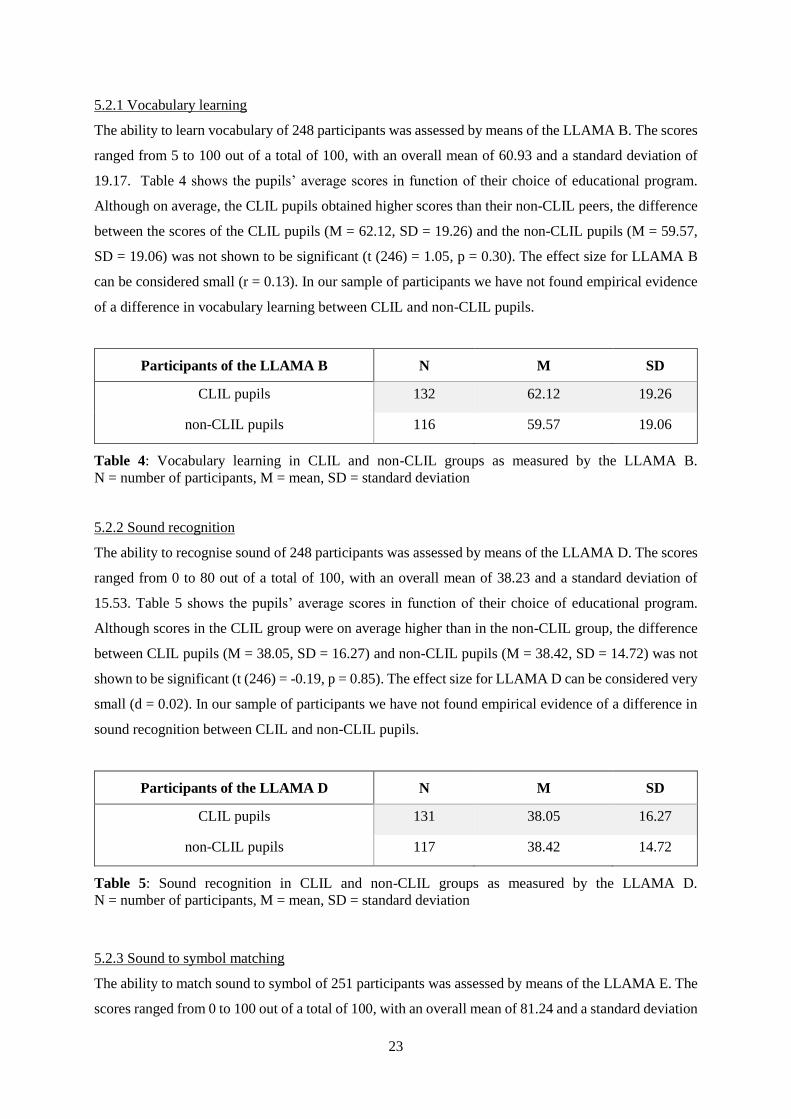
5.2.1 Vocabulary learning
The ability to learn vocabulary of 248 participants was assessed by means of the LLAMA B. The scores
ranged from 5 to 100 out of a total of 100, with an overall mean of 60.93 and a standard deviation of
19.17. Table 4 shows the pupils’ average scores in function of their choice of educational program.
Although on average, the CLIL pupils obtained higher scores than their non-CLIL peers, the difference
between the scores of the CLIL pupils (M = 62.12, SD = 19.26) and the non-CLIL pupils (M = 59.57,
SD = 19.06) was not shown to be significant (t (246) = 1.05, p = 0.30). The effect size for LLAMA B
can be considered small (r = 0.13). In our sample of participants we have not found empirical evidence
of a difference in vocabulary learning between CLIL and non-CLIL pupils.
Participants of the LLAMA B N M SD
CLIL pupils 132 62.12 19.26
non-CLIL pupils 116 59.57 19.06
Table 4: Vocabulary learning in CLIL and non-CLIL groups as measured by the LLAMA B.
N = number of participants, M = mean, SD = standard deviation
5.2.2 Sound recognition
The ability to recognise sound of 248 participants was assessed by means of the LLAMA D. The scores
ranged from 0 to 80 out of a total of 100, with an overall mean of 38.23 and a standard deviation of
15.53. Table 5 shows the pupils’ average scores in function of their choice of educational program.
Although scores in the CLIL group were on average higher than in the non-CLIL group, the difference
between CLIL pupils (M = 38.05, SD = 16.27) and non-CLIL pupils (M = 38.42, SD = 14.72) was not
shown to be significant (t (246) = -0.19, p = 0.85). The effect size for LLAMA D can be considered very
small (d = 0.02). In our sample of participants we have not found empirical evidence of a difference in
sound recognition between CLIL and non-CLIL pupils.
Participants of the LLAMA D N M SD
CLIL pupils 131 38.05 16.27
non-CLIL pupils 117 38.42 14.72
Table 5: Sound recognition in CLIL and non-CLIL groups as measured by the LLAMA D.
N = number of participants, M = mean, SD = standard deviation
5.2.3 Sound to symbol matching
The ability to match sound to symbol of 251 participants was assessed by means of the LLAMA E. The
scores ranged from 0 to 100 out of a total of 100, with an overall mean of 81.24 and a standard deviation
24
of 22.22. Table 6 shows the pupils’ average scores in function of their choice of educational program.
On average, the results of the CLIL pupils were higher than those of the non-CLIL pupils. However, the
difference between the scores of the CLIL pupils (M = 82.73, SD = 22.73) and the non-CLIL pupils (M
= 79.58, SD = 21.61) was not shown to be significant (t (249) = 1.12, p = 0.26). The effect size for
LLAMA E can be considered small (d = 0.14). In our sample of participants we have not found empirical
evidence of a difference in sound-symbol correspondence between CLIL and non-CLIL pupils.
Participants of the LLAMA E N M SD
CLIL pupils 132 82.73 22.73
non-CLIL pupils 119 79.58 21.61
Table 6: Sound to symbol matching in CLIL and non-CLIL groups as measured by the LLAMA E.
N = number of participants, M = mean, SD = standard deviation
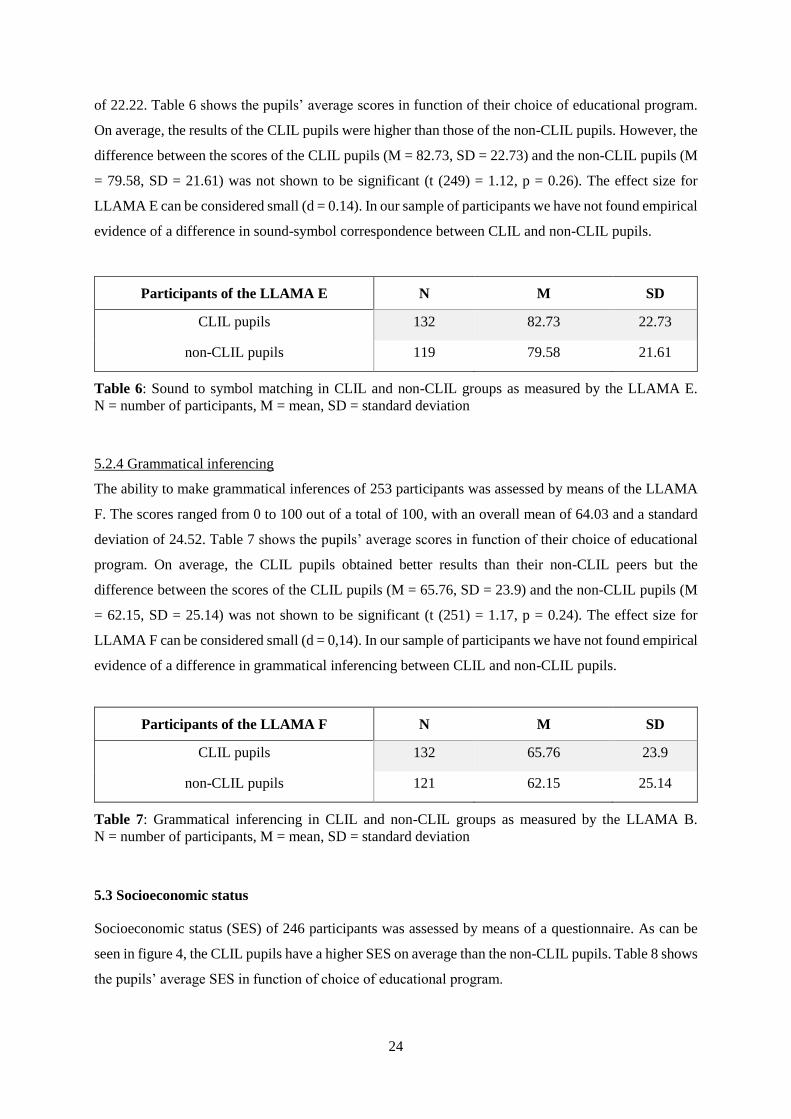
5.2.4 Grammatical inferencing
The ability to make grammatical inferences of 253 participants was assessed by means of the LLAMA
F. The scores ranged from 0 to 100 out of a total of 100, with an overall mean of 64.03 and a standard
deviation of 24.52. Table 7 shows the pupils’ average scores in function of their choice of educational
program. On average, the CLIL pupils obtained better results than their non-CLIL peers but the
difference between the scores of the CLIL pupils (M = 65.76, SD = 23.9) and the non-CLIL pupils (M
= 62.15, SD = 25.14) was not shown to be significant (t (251) = 1.17, p = 0.24). The effect size for
LLAMA F can be considered small (d = 0,14). In our sample of participants we have not found empirical
evidence of a difference in grammatical inferencing between CLIL and non-CLIL pupils.
Participants of the LLAMA F N M SD
CLIL pupils 132 65.76 23.9
non-CLIL pupils 121 62.15 25.14
Table 7: Grammatical inferencing in CLIL and non-CLIL groups as measured by the LLAMA B.
N = number of participants, M = mean, SD = standard deviation
5.3 Socioeconomic status
Socioeconomic status (SES) of 246 participants was assessed by means of a questionnaire. As can be
seen in figure 4, the CLIL pupils have a higher SES on average than the non-CLIL pupils. Table 8 shows
the pupils’ average SES in function of choice of educational program.

25
Figure 4: Average socioeconomic status in CLIL and non-CLIL groups
Moreover, the difference between the SES of the CLIL pupils (M = 1.76, SD = 0.5) and the non-CLIL
pupils (M = 1.55, SD = 0.7) was shown to be significant (t (244) = 2.65, p < 0.01). The effect size of
SES can be considered medium (d = 0.34). These results suggest that there is a difference between CLIL
and non-CLIL pupils in terms of SES with pupils from higher socioeconomic backgrounds self-selecting
into CLIL more readily than their peers from lower or medium socioeconomic backgrounds.
Participants for SES N M SD
CLIL pupils 124 1.76 0.5
non-CLIL pupils 122 1.55 0.7
Table 8: Socioeconomic status in CLIL and non-CLIL groups. N = number of participants, M = mean,
SD = standard deviation
5.4 Cultural capital
Cultural capital of 273 participants was assessed by means of a questionnaire. As can be seen in figure
5, the CLIL pupils report to possess more cultural capital on average than the non-CLIL pupils. Table 9
shows the pupils’ average cultural capital in function of their choice of educational program.
1
1,2
1,4
1,6
1,8
2
CLIL pupils non-CLIL pupils
SES

26
Figure 5: Average cultural capital in CLIL and non-CLIL groups
The difference between the cultural capital of the CLIL pupils (M = 4.40, SD = 1.17) and the non-CLIL
pupils (M = 4.13, SD = 1.25) almost reached significance (t (271) = 1.83, p = 0.07). The effect size of
cultural capital is however rather small (r = 0.22). These results seem to suggest that CLIL education is
chosen more often by pupils who possess more cultural capital.
Participants for cultural capital N M SD
CLIL pupils 139 4.4 1.17
non-CLIL pupils 134 4.13 1.25
Table 9: Cultural capital in CLIL and non-CLIL groups. N = number of participants, M = mean, SD =
standard deviation
5.5 Correlation between variables
Table 10 shows the correlation coefficient values for correlation between the independent variables
included in this study. Values indicated with a * correspond to a significance value of p < 0.05, values
indicated with a ** correspond to a significance value of p < 0.01. Only the observations that are relevant
to this study will be discussed below.
SES was shown to correlate with cognitive ability (r = 0.136, p = 0.03) and cultural capital (r = 0.22, p
< 0.01). Furthermore, a correlation was found between cognitive ability and linguistic ability (r = 0.321,
p < 0.01). No correlation was found between language aptitude and SES or cultural capital.
3
3,5
4
4,5
5
CLIL pupils non-CLIL pupils
Cultural capital

27
Raven LlamaB LlamaD LlamaE LlamaF Llama SES CC
Raven r 1 ,303** -,017 ,276** ,272** ,321** ,136* ,013
p ,000 ,785 ,000 ,000 ,000 ,033 ,833
LlamaB r ,303** 1 ,146* ,385** ,417** ,700** ,018 ,026
p ,000 ,024 ,000 ,000 ,000 ,786 ,684
LlamaD r -,017 ,146* 1 ,176** ,200** ,475** ,004 ,145*
p ,785 ,024 ,006 ,002 ,000 ,949 ,023
LlamaE r ,276** ,385** ,176** 1 ,473** ,760** ,166* ,094
p ,000 ,000 ,006 ,000 ,000 ,012 ,138
LlamaF r ,272** ,417** ,200** ,473** 1 ,804** ,117 -,036
p ,000 ,000 ,002 ,000 ,000 ,078 ,574
Llama r ,321** ,700** ,475** ,760** ,804** 1 ,098 ,075
p ,000 ,000 ,000 ,000 ,000 ,139 ,230
SES r ,136* ,018 ,004 ,166* ,117 ,098 1 ,220**
p ,033 ,786 ,949 ,012 ,078 ,139 ,001
CC r ,013 ,026 ,145* ,094 -,036 ,075 ,220** 1
p ,833 ,684 ,023 ,138 ,574 ,230 ,001
Table 10: Correlation coefficient values for correlations between Raven, LLAMA B, LLAMA D,
LLAMA E, LLAMA F, LLAMA overall, socioeconomic status (SES) and cultural capital (CC). r =
Pearson correlation coefficient, p = significance and N = number of participants.
5.6 Predictive power of variables
A binomial logistic regression was performed to ascertain the effects of cognitive ability, linguistic
ability, socioeconomic status and cultural capital on the likelihood that pupils choose a CLIL program.
Because of the casewise exclusions in the analysis when missing data are encountered, the total number
of observations for participants is somewhat reduced. Of the 276 pupils, there were 229 pupils that could
be included in the logistic regression model that integrates all four independent variables. The model,
however, is not statistically significant, χ2(4) = 7.981, p = 0.092. The model explains 5% (Nagelkerke
R2) of the variance in CLIL choice and correctly classifies 59.8% of the cases. Of the four predictor
variables, none is statistically significant (as shown in table 11).

28
B S.E. Wald df p Exp(B)
SES ,437 ,227 3,701 1 ,054 1,548
CC ,170 ,114 2,226 1 ,136 1,185
LLAMA ,002 ,010 ,034 1 ,853 1,002
Raven ,009 ,028 ,101 1 ,751 1,009
Constant -1,926 1,392 1,913 1 ,167 ,146
Table 11: Logistic regression predicting likelihood of CLIL choice based on socioeconomic status
(SES), cultural capital (CC), linguistic ability as measured by the LLAMA test and cognitive ability as
measured by the Raven SPM test. The B coefficients influence the prediction of probability and the
Wald test is used to determine the variable’s significance.
By reducing the number of variables included in the logistic regression, we could include a larger
number of participants and consequently obtain more statistical power. The logistic regression model
with SES and cultural capital, including 243 out of the 276 pupils, appeared to be the best predictor of
CLIL choice. The model was statistically significant, χ2(2) = 10.102, p = 0.006. The model explains 5%
(Nagelkerke R2) of the variance in CLIL choice and correctly classifies 60.9% of the cases. Of the
predictor variables, SES is statistically significant. This means that the likelihood that a pupil opts for a
CLIL program is 60% greater for pupils who come from families with a higher SES as opposed to pupils
coming from families with a lower SES.
B S.E. Wald df Sig. Exp(B)
SES
CC
Constant
,499 ,223 5,014 1 ,025 1,647
,185 ,111 2,801 1 ,094 1,203
-1,602 ,572 7,846 1 ,005 ,202
Table 12: Logistic regression predicting likelihood of CLIL choice based on socioeconomic status
(SES) and cultural capital (CC). The B coefficients influence the prediction of probability and the Wald
test is used to determine the variable’s significance.
5.7 Reasons for CLIL education
138 pupils motivated why they enrolled for a CLIL program in a background questionnaire. They were
asked to indicate a maximum of three reasons which could be chosen from seven listed options or added
by writing down other explanations for their program choice. Figure 6 gives an overview of the reasons
that were tick-marked.

29
Figure 6: Tick-marked reasons for CLIL education
Table 13 lists the reasons tick-marked, with those indicated the most mentioned at the top. It is clear that
the most important reasons why pupils choose for CLIL are that they want to improve their language
knowledge on the one hand and that they want to add an extra challenge to their curriculum on the other
hand. Almost one in five pupils also mentions that he wants to follow CLIL for one of the following
reasons: (1) his friends will also be in the CLIL class, (2) he wants to be in the CLIL teacher’s class or
(3) his parents convinced him to choose for CLIL. Less than one in ten pupils mention that a teacher
convinced him to choose for CLIL and less than one in twenty pupils point to the school’s influence in
making a program choice.
Reasons for choosing CLIL N Percentage of pupils
I wanted to improve my foreign language
knowledge 105 76 %
I wanted an extra challenge 78 57 %
My friends chose for CLIL 26 19 %
I wanted to be in the CLIL teacher’s class 25 18 %
My parents convinced me to choose for CLIL 22 16 %
A teacher convinced me to choose for CLIL 11 8 %
My school convinced me to choose for CLIL 5 4 %
Table 13: Tick-marked reasons for CLIL education of 138 pupils. N = number of participants
In addition to the reasons mentioned above, ten pupils believe that CLIL will be useful in their future
(7%). Another eight pupils enrolled in the CLIL-program for the joy of being taught in a different
Reasons for CLIL
I wanted to improve my
foreign language knowledge
I wanted an extra challenge
My friends chose for CLIL
I wanted to be in the CLIL
teacher’s class
My parents convinced me to
choose for CLIL
A teacher convinced me to
choose for CLIL
30
language than their mother tongue (6%). Two pupils enrolled for CLIL because they were curious about
the teaching methodology (1%). One pupil responded that he does not like the subject and hopes that
this affection for languages will motivate him when the subject is taught in a foreign language and
another pupil explained that his foreign language skills are good enough to take part in a CLIL class.
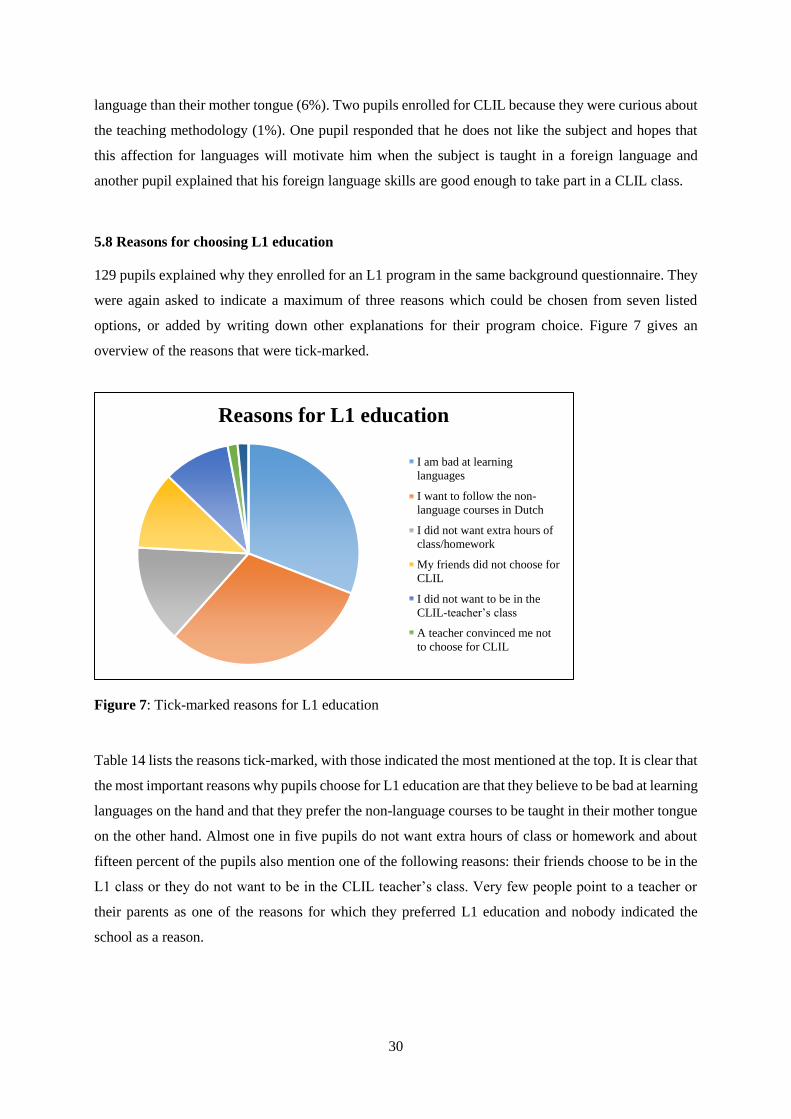
5.8 Reasons for choosing L1 education
129 pupils explained why they enrolled for an L1 program in the same background questionnaire. They
were again asked to indicate a maximum of three reasons which could be chosen from seven listed
options, or added by writing down other explanations for their program choice. Figure 7 gives an
overview of the reasons that were tick-marked.
Figure 7: Tick-marked reasons for L1 education
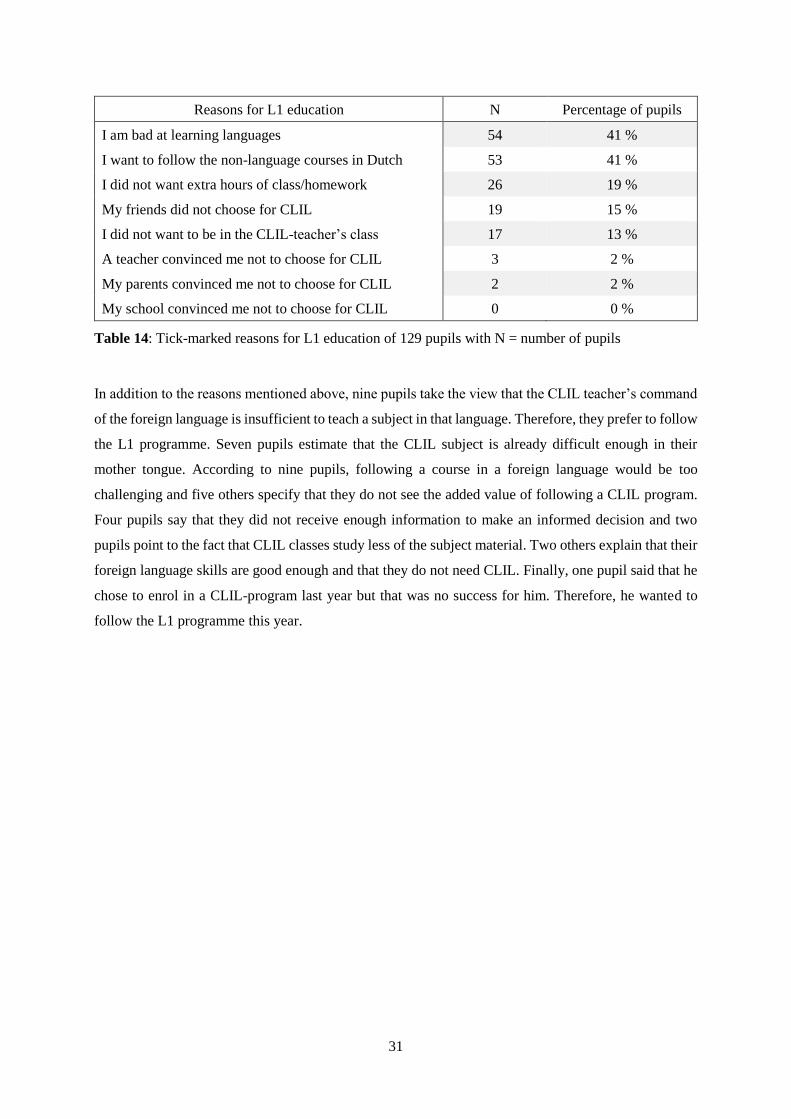
Table 14 lists the reasons tick-marked, with those indicated the most mentioned at the top. It is clear that
the most important reasons why pupils choose for L1 education are that they believe to be bad at learning
languages on the hand and that they prefer the non-language courses to be taught in their mother tongue
on the other hand. Almost one in five pupils do not want extra hours of class or homework and about
fifteen percent of the pupils also mention one of the following reasons: their friends choose to be in the
L1 class or they do not want to be in the CLIL teacher’s class. Very few people point to a teacher or
their parents as one of the reasons for which they preferred L1 education and nobody indicated the
school as a reason.
Reasons for L1 education
I am bad at learning
languages
I want to follow the non-
language courses in Dutch
I did not want extra hours of
class/homework
My friends did not choose for
CLIL
I did not want to be in the
CLIL-teacher’s class
A teacher convinced me not
to choose for CLIL
31
Reasons for L1 education N Percentage of pupils
I am bad at learning languages 54 41 %
I want to follow the non-language courses in Dutch 53 41 %
I did not want extra hours of class/homework 26 19 %
My friends did not choose for CLIL 19 15 %
I did not want to be in the CLIL-teacher’s class 17 13 %
A teacher convinced me not to choose for CLIL 3 2 %
My parents convinced me not to choose for CLIL 2 2 %
My school convinced me not to choose for CLIL 0 0 %
Table 14: Tick-marked reasons for L1 education of 129 pupils with N = number of pupils
In addition to the reasons mentioned above, nine pupils take the view that the CLIL teacher’s command
of the foreign language is insufficient to teach a subject in that language. Therefore, they prefer to follow
the L1 programme. Seven pupils estimate that the CLIL subject is already difficult enough in their
mother tongue. According to nine pupils, following a course in a foreign language would be too
challenging and five others specify that they do not see the added value of following a CLIL program.
Four pupils say that they did not receive enough information to make an informed decision and two
pupils point to the fact that CLIL classes study less of the subject material. Two others explain that their
foreign language skills are good enough and that they do not need CLIL. Finally, one pupil said that he
chose to enrol in a CLIL-program last year but that was no success for him. Therefore, he wanted to
follow the L1 programme this year.
32
6 DISCUSSION
6.1 Pupils’ learner characteristics
Overall, the results of the study suggest the following findings with regards to the first research question,
i.e. the learner characteristics of CLIL and non-CLIL pupils. Overall, CLIL pupils consistently obtained
better scores than their non-CLIL peers on the measures for almost all independent variables (except for
sound recognition as a part of linguistic ability). Nevertheless, the difference between both groups was
only shown to be significant for socioeconomic status and borderline so for cultural capital. On the basis
of our data we have found no empirical basis for different cognitive or linguistic abilities between CLIL
and non-CLIL groups. However, it appears that the CLIL pupils come from families with a higher
socioeconomic status and more cultural capital their non-CLIL peers. The effect sizes for both findings
range from small to medium. In addition, analyses revealed correlations between several independent
variables included in the study, regardless of program choice. Firstly, socioeconomic status was shown
to correlate with cultural capital. Surprisingly, although socioeconomic status was shown to correlate
with cognitive ability, this was not shown to be the case for linguistic ability. Consequently, the
socioeconomic status of the pupils appears to influence their abstract reasoning skills but not their
language aptitude. This means that pupils with a higher socioeconomic status do not necessarily learn
languages more easily than pupils with a lower socioeconomic status. Finally, the logistic regression
showed that socioeconomic status in combination with cultural capital is the best predictor for the pupils’
program choice out of all variables considered.
Prior studies in the field suggested that pupils in CLIL classes in Germany are different from their non-
CLIL peers for a considerable range of characteristics (Dallinger et al., 2016; Rumlich, 2017; Dallinger,
Jonkmann and Hollm, 2018). The present study, however, only found a distinction between both groups
in terms of socioeconomic status and, to a lesser extent, cultural capital. The educational context of these
studies might account for these diverging findings. As was already mentioned before, CLIL programs
in Germany usually go hand in hand with extensive screening and selection procedures. Consequently,
it is not surprising that pupils who are accepted to enrol in CLIL programs have different characteristics
compared to their non-CLIL peers. The present study was conducted in an environment where all pupils
can follow CLIL education. Although pupils in CLIL and non-CLIL classes appear to have the same
abilities, the results of the study nevertheless suggest that CLIL pupils come from families with a higher
socioeconomic status and more cultural capital. This way, it could be argued that in countries where no
overt selection procedures are in place, covert selection occurs as a consequence of the self-selection of
pupils with a higher socioeconomic status and more cultural capital into CLIL programmes.

33
Although in our sample of participants we have not found empirical evidence of a difference in cognitive
ability between CLIL and non-CLIL groups, we should bear in mind that we found a correlation between
socioeconomic status and cognitive ability: pupils with a higher socioeconomic status are more likely
to obtain higher scores for abstract reasoning. Taking into consideration that pupils who choose a CLIL
program tend to have a higher socioeconomic than their non-CLIL peers, the relationship that we
observed between socioeconomic status and cognitive ability should not be disregarded. Future studies
might observe an inequality between CLIL and non-CLIL groups in terms of cognitive ability seeing
that CLIL groups consist of a larger number of pupils with a higher socioeconomic status who might,
consequently, also obtain better results in cognitive ability tests because of the observed correlation
between socioeconomic status and cognitive ability. Therefore, if CLIL pupils were found to outperform
their non-CLIL peers for cognitive ability in future research, the results of the present study suggest that
this should not be considered as an immediate cause for CLIL choice but rather as a consequence of the
CLIL pupils’ higher socioeconomic status.
6.2 Pupils’ motives for an educational program
Turning to the second research question of this study, we investigated the pupils’ motives to enrol in an
educational program. Although we did not explicitly assess the intrinsic or extrinsic nature of the pupils’
motives, we could interpret them on an intrinsic - extrinsic scale in order to gain more insight in the
reasons for which pupils enrolled in an educational program. Coon and Mitterer (2012, p. 349) explain
that “intrinsic motivation occurs when we (…) simply enjoy an activity or see it as an opportunity to
explore, learn and actualize our potentials. In contrast, extrinsic motives stem from external factors, such
as pay, grades, rewards, obligations and approval”. Following this distinction, it is clear that a CLIL
program is mainly chosen intrinsically, i.e. by the pupils themselves. More than three in four pupils
indicate that they enrol in a CLIL program because they are aiming to improve their language
knowledge. Eight percent of the pupils also specify that they opt for CLIL education because they
believe they are likely to benefit from it in the future. Seven others mention that they like the idea of
being taught in another language, especially since the language on offer was English in their school.
According to those pupils, they will reap the benefits of a CLIL program later in life in the context of
further education and their future careers both in Belgium and abroad. In addition, more than half of the
pupils indicate that they sign up for CLIL because they want to add an extra challenge to their
curriculum. Pupils who indicated either one of the reasons mentioned above primarily enrolled in a
CLIL program because they take an interest in it.
Other pupils, however, are rather influenced by extrinsic factors pushing them in the direction
of a CLIL program. Almost one in five pupils wants to be instructed by the CLIL teacher. Furthermore,
a similar number of pupils state that their friends or parents convinced them to enrol in CLIL education.
The role of the pupils’ teachers or schools in making a decision was shown to be rather small. In addition,
34
there are a number of responses that cannot directly be included in the categories mentioned above. One
pupil, for example, clarifies that the subject is one of his least favourite courses but that he is really fond
of languages. Therefore, he hopes that his affection for languages will make the course more attractive.
Another pupil mentions that his command of English is good and that he therefore choses to sign up for
CLIL seeing that he believes that he will understand the foreign language spoken and the course taught
in that language.
The intrinsic – extrinsic scale can also be applied to pupils’ motives to enrol in an L1 program. Following
this distinction, it is clear that an L1 program is also mainly chosen intrinsically, i.e. by the pupils
themselves. Pupils do not enrol in a CLIL program because they believe that they are bad at learning
languages and because they prefer classes taught in their mother tongue when it comes to non-language
subjects. Both reasons were indicated by almost half of the pupils. To this regard, it should be mentioned
that twelve percent of the pupils considered following a CLIL program as a potential risk: they either
fear that the subject to which the CLIL program applies is already too challenging in itself or that they
would not understand the matter in another language. One pupil even describes that he asked a teacher
for advice on his decision and according to the pupil, the teacher would have given him the advice not
to sign up for CLIL since it would be too challenging with regards to her weakness in language learning.
Nevertheless, there are also two pupils who believe that their language skills are already good enough
and that they therefore do not need to be taught in a foreign language more. Similar to the mainly
intrinsic motives for CLIL education mentioned above, most pupils prefer classes taught in their mother
tongue because it is what they want to do.
Yet other pupils are rather influenced by extrinsic factors pushing them in the direction of an
L1 program. A quarter of the pupils do not want extra class hours. Moreover, about the same number of
pupils clarify that they do not want to follow a CLIL program because their friends did not enrol in the
program or because they do not want to be taught by the CLIL-teacher. The latter reason does not
necessarily imply that the pupils are not satisfied with the teacher’s motivation, teaching skills or attitude
but rather that the CLIL teacher’s command of the CLIL language is insufficient, an observation that
was also made by Dalton-Puffer et al. (2009). Nevertheless, all CLIL teachers in Flanders are obliged
to pass a test in which they have to prove that their command of the CLIL language is at least of C1-
level on the Common European Framework of Reference for Languages. Yet these tests prove a
teacher’s general proficiency in the foreign language rather than the specific linguistic skills needed in
a CLIL setting such as technical terminology or oral skills. Furthermore, five pupils are not willing to
make an extra effort. The role of the pupils’ teachers, parents or their schools in making their decision
was shown to be rather small. In addition, there are a number of responses that cannot directly be
included in the categories mentioned above but are nevertheless interesting to consider. Several pupils
feel that they did not receive the necessary information to make an appropriate decision about the

35
program they want to follow. In addition, two pupils point to the fact that CLIL classes learn less content
because they need more time to process the course material.
Bearing in mind that the pupils in CLIL programs were shown to come from families with a higher
socioeconomic status, we should pay special attention to the influence of the parents on the pupils’
program choice. Although it was shown that the pupils’ motives for both educational programs mainly
came from the pupils themselves rather than from external factors pushing them towards a program,
considerable differences were observed in terms of the parental influence between both groups. Sixteen
percent of the CLIL pupils indicated that they were influenced by their parents in their program choice
whereas this motive was only indicated by two percent of the non-CLIL pupils, which suggests that
families with a higher socioeconomic status tend to be more in favour of CLIL education. Consequently,
pupils coming from these families will be more encouraged by their parents to enrol in a CLIL class,
which was also observed by Broca (2016). Moreover, it should be pointed out that even though pupils
did not explicitly point to their parents as a motive for their program choice, it is possible that the parents
implicitly contributed to the pupils’ choice because the pupils are highly likely to inherit their parents’
values and the importance they attach to a CLIL program.
Finally, it should be pointed out that seventeen pupils indicated that they had wanted to enrol in a CLIL
program but that they had not been able to do so. Considering that these pupils make up more than ten
percent of the total number of pupils in CLIL classes, we can say that demand seems to exceed supply
in this particular school. Eleven other pupils who had already followed CLIL education in the past
decided to follow L1 education in the current school year. They mainly pointed to the subject for which
the CLIL course was offered as a reason not to choose CLIL. The subject was either considered too
important or too difficult to be taught in a foreign language. There was only one pupil who was now in
the L1 program because the CLIL program had proven to be too much of a challenge.
6.3 Practical implications, limitations and recommendations
No overt selection takes place in CLIL programs in Flanders, as opposed to Germany, but the results of
this study nevertheless suggest that self-selection in CLIL programs leads to covert selection. Although
pupils who enrol in CLIL classes have the same abilities as the pupils who enrol in L1 classes, the former
usually come from families with more cultural capital and a higher socioeconomic status. This
observation is also reflected in the fact that sixteen percent of the pupils who opted for a CLIL program
indicated that their parents convinced them to do so whereas almost no pupils who opted for an L1
program mentioned that their parents took an active part in their decision. Although many advocates of
CLIL education emphasize that it is an educational program open to pupils from all layers of society,
our results suggest that CLIL attracts a disproportional number of pupils that are well-endowed in terms
36
of socioeconomic status and cultural capital. Bearing into mind that Europe has been promoting to CLIL
education because all pupils would have access to foreign language, the results of this study indicate
that CLIL programs in Flanders do not meet this objective. Therefore, schools should attempt to involve
pupils from all layers of society in CLIL programs to ensure that all pupils have equal access to CLIL.
Moreover, several studies have shown a close relationship between socio-economic status and
academic achievement regardless of educational program: pupils coming from families with a higher
SES consistently obtain better scores than pupils coming from families with a lower SES (Anghel,
Cabrales and Carro, 2016; Fernández-Sanjurjo, Fernández-Costales and Arias Blanco, 2017; Fernández
Sanjurjo, Arias Blanco and Fernández-Costales, 2018; Moreno and Callejas, 2018). Taking into
consideration that the results of this study suggested that CLIL and non-CLIL groups are not equally
matched in terms of socio-economic status, these findings implicate that schools should closely follow
pupils once they are following a CLIL program in order to ascertain that all pupils benefit equally from
the educational program adopted, which has received too little attention in the literature so far. If a
considerable proportion of the pupils are excluded from comparisons, studies might render a biased view
of the effectiveness of the program taking into consideration that pupils with different socioeconomic
backgrounds respond differently to a CLIL teaching methodology.
Furthermore, pupils mainly enrol in a specific type of educational program because they take an interest
in it rather than because they are pushed towards it by external factors. The main motive to follow a
CLIL program indicated by the pupils is their intention to improve their language knowledge, which is
very encouraging seeing that this was one of the original goals that were formulated when CLIL was
implemented. The European Union aims to prepare its citizens “for life in a more internationalised
society and offer them better job prospects on the labour market” (Eurydice, 2006, p. 22). On the
contrary, pupils mainly prefer an L1 program because they fear that they are too bad at languages to be
able to learn in a foreign language. To this end, it is worthwhile to mention that some scholars have
already advocated in the literature that “although students with a high level of linguistic competence
tend to perform well regardless of the type of instruction, average students show more foreign language
improvement through CLIL than through L1 foreign language instruction” (Denman, Tanner and de
Graaf, 2013, p. 288). Dalton-Puffer et al. (2009, p. 21) also report that pupils with prior CLIL experience
“rate their English competence in all language skills significantly higher” than the pupils without prior
CLIL experience. In other words, studies show that both the language knowledge as well as the self-
perception of pupils who score below average for languages improve in a CLIL program. Taking these
findings into consideration, it is crucial that pupils are adequately informed about CLIL education prior
to making a program choice and that schools encourage them to overcome their insecurities.
Although this study is a valuable contribution to the field, we should bear in mind that this is only the
first of many steps ahead. The present study provided a general but limited impression of the role of

37
self-selection in CLIL programs in Flanders. Further studies on self-selection in CLIL should attempt to
investigate the matter to a greater extent and in more detail. Therefore, future research should include
more participants and those included should be more diversified. Due to practical limitations to this pilot
study, we were only able to include three schools and about 300 pupils, all of whom followed general
secondary education. Nevertheless, in Flanders, there are already over eighty schools that have a CLIL
program on offer. In order to obtain a representative view of the role of self-selection in CLIL, pupils
from different backgrounds and educational contexts should be integrated in future studies. It should
also be remembered that the results observed here are not a reflection of one singular CLIL teaching
methodology. There were only three schools included in the study and they already varied greatly in the
way they implemented CLIL programs. Therefore, it would also be interesting to consider the influence
of the type of CLIL education on the pupils’ program choice. Some schools, for example, offer a CLIL
teaching methodology in which only half of the topics are taught in the foreign language or in which the
mother tongue is used frequently when topics become rather complex. In these contexts, it is possible
that the threshold to enrol in a CLIL program is much lower than in other learning environments. Linked
to this, the level of experience that schools and teachers have when it comes to CLIL varies greatly as
well. Some schools have only recently set up a CLIL program whereas other schools already built up
several years of experience. Consequently, some pupils already received the opportunity to follow CLIL
courses in the past whereas other pupils were only able to enrol for the first time this school year. All
these aspects of CLIL should be included in future research. In addition, in order to examine the pupils’
socioeconomic status, we relied on self-report for practical reasons. Future studies should attempt to
obtain information about socioeconomic status directly from the pupils’ parents in order to guarantee
reliability to an even greater extent. Finally, in order to investigate the pupils’ motives for an educational
program, we listed several options that could be tick-marked but we also gave the pupils the possibility
to add other motives. If the pupils had been required to write down all their motives for an educational
program instead of merely tick-marking them, their responses might have given a slightly different view,
which should be borne in mind for future studies. In spite of the shortcomings of this pilot study, it is
clear that future studies should further investigate the role of self-selection in CLIL programs.
38
7 CONCLUSION
Since the turn of the century, Europe has been promoting a CLIL teaching methodology in order give
all its citizens access to foreign language education (European Commission, 1995). A plethora of studies
have been conducted in the field to investigate the learning effects of the teaching methodology.
Nevertheless, numerous researchers claimed that CLIL and non-CLIL pupils are often not equally
matched (e.g. Bruton, 2011a; 2011b; 2013; 2015; Mehisto, 2007; Paran, 2013; Pérez Cañado, 2016). In
order to look into this claim, the present study investigated the role of self-selection in CLIL programs.
Therefore, we analysed the characteristics of pupils in CLIL and L1 programs in Flanders. The variables
that were taken into account were the pupils’ cognitive and linguistic abilities, socioeconomic status and
cultural capital. A total number of 276 participants in the 4rd, 5th and 6th year of secondary school were
included in the study. Results indicated that the CLIL and non-CLIL pupils possess the same cognitive
and linguistic abilities. The pupils in the CLIL classes, however, are shown to come from families with
more cultural capital and a higher socioeconomic status, measured by means of parental education.
Although pupils mainly report to enrol in a specific type of educational program because they take an
interest in it rather than because they are pushed towards it by external factors, CLIL pupils stated much
more often than non-CLIL pupils that they had been influenced by their parents in their program choice.
This suggests that families with a higher socioeconomic status tend to be more in favour of CLIL
education. Consequently, pupils coming from these families will be more encouraged by their parents
to enrol in a CLIL class. These findings suggest that CLIL programs in Flanders fail to meet the
ambitious objective set out by Europe to give all pupils access to foreign language education. In addition,
it has also become clear that pupils should be adequately informed about CLIL education in order to
address possible insecurities the pupils might have, bearing into mind that it was shown that pupils with
lower language proficiency are more likely to benefit from a CLIL program than from traditional
language classes (Denman, Tanner and de Graaf, 2013).
The results of this study do not concur entirely with prior studies in the field. Dallinger et al. (2016),
Rumlich (2017) and Dallinger, Jonkmann and Hollm (2018) found that CLIL pupils outperform their
non-CLIL peers in Germany for a broad range of characteristics whereas the present study only observed
a difference for socioeconomic status and for cultural capital. These diverging results suggest that two
types of selection can occur in CLIL programs. On the one hand, overt selection might occur in countries
such as Germany where schools are allowed to screen and select pupils on the basis of academic
achievements and motivation for their CLIL classes. Not surprisingly, this leads to CLIL groups that
widely outperform their non-CLIL peers. On the other hand, covert selection might occur in countries
such as Belgium where schools are required to give every pupil the possibility to enrol in a CLIL
program. Even though the latter system is supposed to lead to an equal distribution of pupils, results

39
have indicated that CLIL attracts a disproportional number of pupils with a higher SES. This way, this
study provides empirical evidence for the inequality claim that has been dominating the field of CLIL
research.
In conclusion, future studies should further investigate the role of self-selection into CLIL in order
guarantee that all pupils have access to CLIL education and that all pupils benefit equally from the
educational program adopted, the latter of which has received too little attention in the literature so far.
To this end, it is important to bear in mind that several studies have found a close relationship between
socio-economic status and academic achievement (Anghel, Cabrales and Carro, 2016; Fernández-
Sanjurjo, Fernández-Costales and Arias Blanco, 2017; Fernández Sanjurjo, Arias Blanco and
Fernández-Costales, 2018; Moreno and Callejas, 2018). If a considerable proportion of the pupils are
excluded from comparisons, studies might render a biased view of the effectiveness of the program
taking into consideration that pupils with different socioeconomic backgrounds respond differently to a
teaching methodology. Therefore, all pupils should be take into account when assessing the efficacy of
educational programs. It could be concluded that this pilot study conducted in Flanders might only reveal
the top of the iceberg when it comes to the role of self-selection in CLIL and therefore, future research
should further investigate the matter.
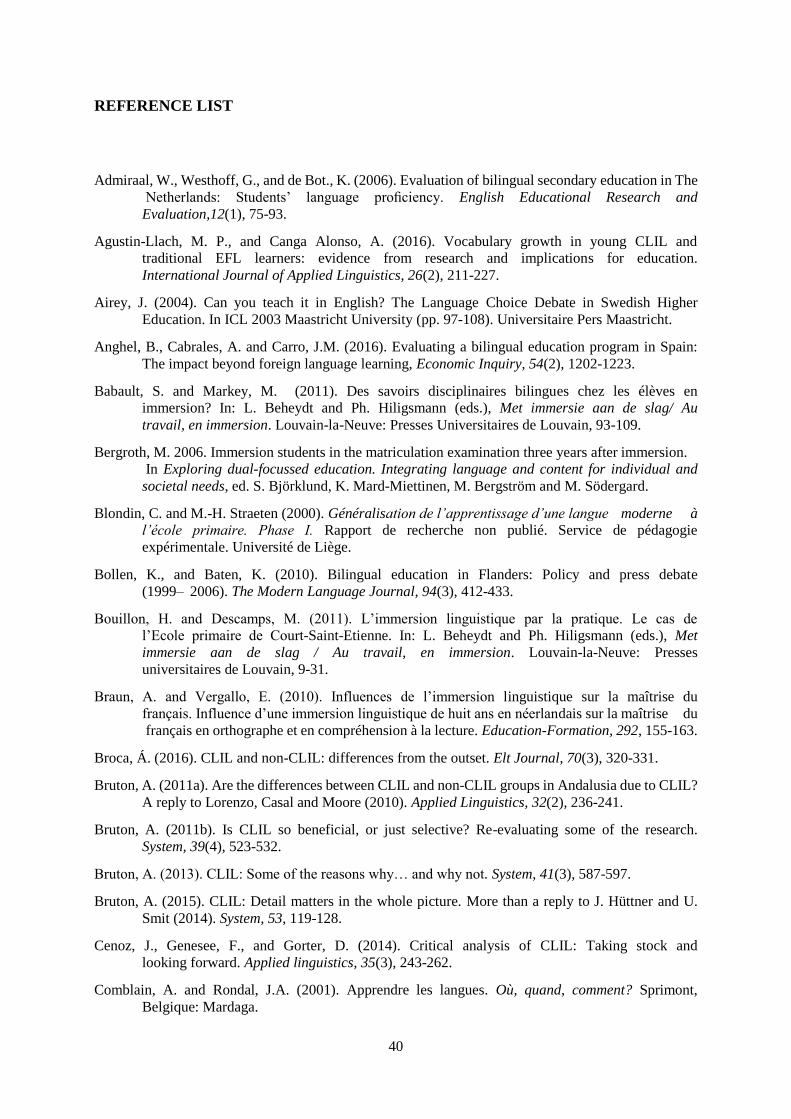
40
REFERENCE LIST
Admiraal, W., Westhoff, G., and de Bot., K. (2006). Evaluation of bilingual secondary education in The
Netherlands: Students’ language proficiency. English Educational Research and
Evaluation,12(1), 75-93.
Agustin-Llach, M. P., and Canga Alonso, A. (2016). Vocabulary growth in young CLIL and
traditional EFL learners: evidence from research and implications for education.
International Journal of Applied Linguistics, 26(2), 211-227.
Airey, J. (2004). Can you teach it in English? The Language Choice Debate in Swedish Higher
Education. In ICL 2003 Maastricht University (pp. 97-108). Universitaire Pers Maastricht.
Anghel, B., Cabrales, A. and Carro, J.M. (2016). Evaluating a bilingual education program in Spain:
The impact beyond foreign language learning, Economic Inquiry, 54(2), 1202-1223.
Babault, S. and Markey, M. (2011). Des savoirs disciplinaires bilingues chez les élèves en
immersion? In: L. Beheydt and Ph. Hiligsmann (eds.), Met immersie aan de slag/ Au
travail, en immersion. Louvain-la-Neuve: Presses Universitaires de Louvain, 93-109.
Bergroth, M. 2006. Immersion students in the matriculation examination three years after immersion.
In Exploring dual-focussed education. Integrating language and content for individual and
societal needs, ed. S. Björklund, K. Mard-Miettinen, M. Bergström and M. Södergard.
Blondin, C. and M.-H. Straeten (2000). Généralisation de l’apprentissage d’une langue moderne à
l’école primaire. Phase I. Rapport de recherche non publié. Service de pédagogie
expérimentale. Université de Liège.
Bollen, K., and Baten, K. (2010). Bilingual education in Flanders: Policy and press debate
(1999– 2006). The Modern Language Journal, 94(3), 412-433.
Bouillon, H. and Descamps, M. (2011). L’immersion linguistique par la pratique. Le cas de
l’Ecole primaire de Court-Saint-Etienne. In: L. Beheydt and Ph. Hiligsmann (eds.), Met
immersie aan de slag / Au travail, en immersion. Louvain-la-Neuve: Presses
universitaires de Louvain, 9-31.
Braun, A. and Vergallo, E. (2010). Influences de l’immersion linguistique sur la maîtrise du
français. Influence d’une immersion linguistique de huit ans en néerlandais sur la maîtrise du
français en orthographe et en compréhension à la lecture. Education-Formation, 292, 155-163.
Broca, Á. (2016). CLIL and non-CLIL: differences from the outset. Elt Journal, 70(3), 320-331.
Bruton, A. (2011a). Are the differences between CLIL and non-CLIL groups in Andalusia due to CLIL?
A reply to Lorenzo, Casal and Moore (2010). Applied Linguistics, 32(2), 236-241.
Bruton, A. (2011b). Is CLIL so beneficial, or just selective? Re-evaluating some of the research.
System, 39(4), 523-532.
Bruton, A. (2013). CLIL: Some of the reasons why… and why not. System, 41(3), 587-597.
Bruton, A. (2015). CLIL: Detail matters in the whole picture. More than a reply to J. Hüttner and U.
Smit (2014). System, 53, 119-128.
Cenoz, J., Genesee, F., and Gorter, D. (2014). Critical analysis of CLIL: Taking stock and
looking forward. Applied linguistics, 35(3), 243-262.
Comblain, A. and Rondal, J.A. (2001). Apprendre les langues. Où, quand, comment? Sprimont,
Belgique: Mardaga.
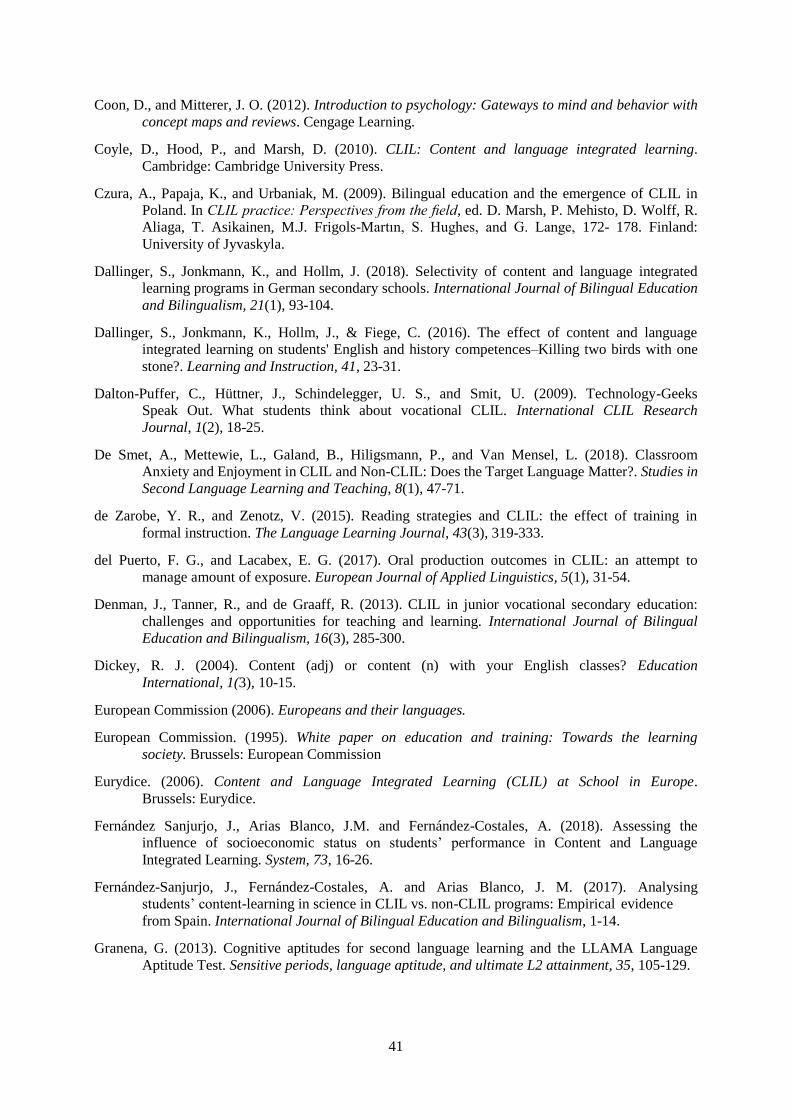
41
Coon, D., and Mitterer, J. O. (2012). Introduction to psychology: Gateways to mind and behavior with
concept maps and reviews. Cengage Learning.
Coyle, D., Hood, P., and Marsh, D. (2010). CLIL: Content and language integrated learning.
Cambridge: Cambridge University Press.
Czura, A., Papaja, K., and Urbaniak, M. (2009). Bilingual education and the emergence of CLIL in
Poland. In CLIL practice: Perspectives from the field, ed. D. Marsh, P. Mehisto, D. Wolff, R.
Aliaga, T. Asikainen, M.J. Frigols-Martın, S. Hughes, and G. Lange, 172- 178. Finland:
University of Jyvaskyla.
Dallinger, S., Jonkmann, K., and Hollm, J. (2018). Selectivity of content and language integrated
learning programs in German secondary schools. International Journal of Bilingual Education
and Bilingualism, 21(1), 93-104.
Dallinger, S., Jonkmann, K., Hollm, J., & Fiege, C. (2016). The effect of content and language
integrated learning on students' English and history competences–Killing two birds with one
stone?. Learning and Instruction, 41, 23-31.
Dalton-Puffer, C., Hüttner, J., Schindelegger, U. S., and Smit, U. (2009). Technology-Geeks
Speak Out. What students think about vocational CLIL. International CLIL Research
Journal, 1(2), 18-25.
De Smet, A., Mettewie, L., Galand, B., Hiligsmann, P., and Van Mensel, L. (2018). Classroom
Anxiety and Enjoyment in CLIL and Non-CLIL: Does the Target Language Matter?. Studies in
Second Language Learning and Teaching, 8(1), 47-71.
de Zarobe, Y. R., and Zenotz, V. (2015). Reading strategies and CLIL: the effect of training in
formal instruction. The Language Learning Journal, 43(3), 319-333.
del Puerto, F. G., and Lacabex, E. G. (2017). Oral production outcomes in CLIL: an attempt to
manage amount of exposure. European Journal of Applied Linguistics, 5(1), 31-54.
Denman, J., Tanner, R., and de Graaff, R. (2013). CLIL in junior vocational secondary education:
challenges and opportunities for teaching and learning. International Journal of Bilingual
Education and Bilingualism, 16(3), 285-300.
Dickey, R. J. (2004). Content (adj) or content (n) with your English classes? Education
International, 1(3), 10-15.
European Commission (2006). Europeans and their languages.
European Commission. (1995). White paper on education and training: Towards the learning
society. Brussels: European Commission
Eurydice. (2006). Content and Language Integrated Learning (CLIL) at School in Europe.
Brussels: Eurydice.
Fernández Sanjurjo, J., Arias Blanco, J.M. and Fernández-Costales, A. (2018). Assessing the
influence of socioeconomic status on students’ performance in Content and Language
Integrated Learning. System, 73, 16-26.
Fernández-Sanjurjo, J., Fernández-Costales, A. and Arias Blanco, J. M. (2017). Analysing
students’ content-learning in science in CLIL vs. non-CLIL programs: Empirical evidence
from Spain. International Journal of Bilingual Education and Bilingualism, 1-14.
Granena, G. (2013). Cognitive aptitudes for second language learning and the LLAMA Language
Aptitude Test. Sensitive periods, language aptitude, and ultimate L2 attainment, 35, 105-129.

42
Hamel, R and Schittmann, V. D. (2006). The 20-minute version as a predictor of the Raven
Advances Progressive Matrices test. Educational and psychological measurement,
66(6), 1039-1046.
Heras, A., and Lasagabaster, D. (2015). The impact of CLIL on affective factors and vocabulary
learning. Language Teaching Research, 19(1), 70-88.
Hiligsmann, P., Van Mensel, L., Galand, B., Mettewie, L., Meunier, F., Szmalec, A., ... and
Simonis, M. (2017). Assessing Content and Language Integrated Learning (CLIL) in
French-speaking Belgium: Linguistic, cognitive and educational perspectives. Les
Cahiers de Recherche du Girsef, 17(109), 1-25.
Hiligsmann, P., Van Mensel, L., Galand, B., Mettewie, L., Meunier, F., Szmalec, A., ... and
Simonis, M. (2017). Assessing Content and Language Integrated Learning (CLIL) in
French-speaking Belgium: Linguistic, cognitive and educational perspectives. Les Cahiers de
Recherche du Girsef, 17(109), 1-25.
Jaeggi, S. M., Buschkuehl, M., Jonides, J., and Perrig, W. J. (2008). Improving fluid intelligence with
training on working memory. Proceedings of the National Academy of Sciences, 105(19), 6829-
6833.
Jäppinen, A.K. (2006). CLIL and future learning. In Exploring dual-focussed education. Integrating
language and content for individual and societal needs, ed. S. Björklund, K. Mard-Miettinen,
M. Bergström and M. Södergard.
Kargar, N. (2015). The impact of content and language integrated learning (CLIL) on EFL
learners’ reading comprehension. Modern Journal of Language Teaching Methods, 5(4), 454.
Lancaster, N. K. (2018). Extramural Exposure and Language Attainment: The Examination of
Input- Related Variables in CLIL Programs. Porta Linguarum: revista internacional de
didáctica de las lenguas extranjeras, 29, 91-114.
Lareau, A. (1987). Social class differences in family-school relationships: the importance of
cultural capital. Sociology of education, 60(2), 73-85.
Lasagabaster, D., and Doiz, A. (2016). CLIL students' perceptions of their language learning
process: delving into self-perceived improvement and instructional preferences. Language
Awareness, 25(1-2), 110-126.
Lecocq, K., Kolinsky, R., Goetry, V., Morais, J., Alegria, J., and Mousty, P. (2009). Reading
development in two alphabetic systems differing in orthographic consistency: a longitudinal
study of French-speaking children enrolled in a Dutch immersion program. Psychologica
Belgica, 49(2&3), 111-156.
Lecocq, K., Mousty, P., Kolinsky, R., Goetry, V., Morais, J. and Alegria, J. (2007a). Evaluation de
programs d’immersion en Communauté française: étude longitudinale du développement des
habiletés écrites en L1 et L2. In L. Puren and S. Babault (eds.), L’éducation au-delà des
frontières, Apprentissage précoce du néerlandais, apprentissage précoce en néerlandais dans
la zone frontalière francobelge. Paris: L’Harmattan, 259-293.
Lecocq, K., Mousty, P., Kolinsky, R., Goetry, V., Morais, J. and Alegria, J. (2007b). Évaluation de
programs d’immersion en Communauté française: une étude longitudinale comparative du
développement de compétences linguistiques d’enfants francophones immergés en néerlandais.
Recherches en éducation.
Lorenzo, F., Casal, S., and Moore, P. (2009). The effects of content and language integrated
learning in European education: Key findings from the Andalusian bilingual sections
evaluation project. Applied Linguistics, 31(3), 418-442.
Marsh, D. (2002). CLIL/EMILE-The European dimension: Actions, trends and foresight potential.
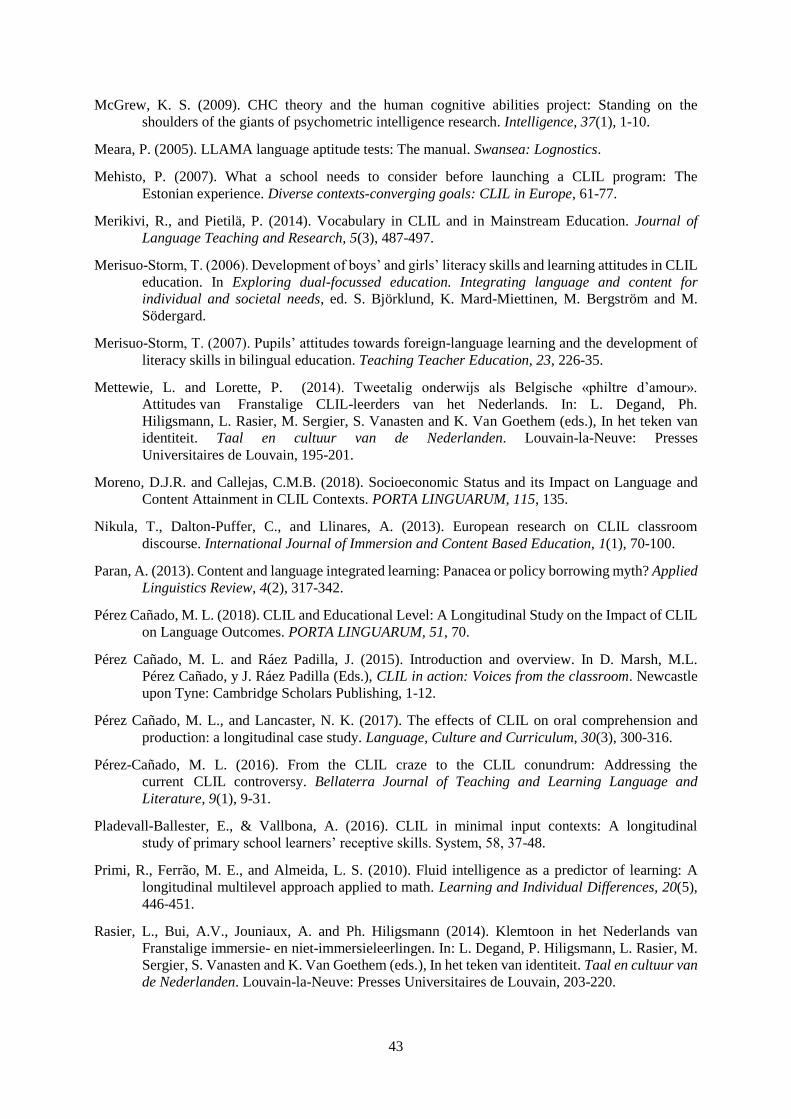
43
McGrew, K. S. (2009). CHC theory and the human cognitive abilities project: Standing on the
shoulders of the giants of psychometric intelligence research. Intelligence, 37(1), 1-10.
Meara, P. (2005). LLAMA language aptitude tests: The manual. Swansea: Lognostics.
Mehisto, P. (2007). What a school needs to consider before launching a CLIL program: The
Estonian experience. Diverse contexts-converging goals: CLIL in Europe, 61-77.
Merikivi, R., and Pietilä, P. (2014). Vocabulary in CLIL and in Mainstream Education. Journal of
Language Teaching and Research, 5(3), 487-497.
Merisuo-Storm, T. (2006). Development of boys’ and girls’ literacy skills and learning attitudes in CLIL
education. In Exploring dual-focussed education. Integrating language and content for
individual and societal needs, ed. S. Björklund, K. Mard-Miettinen, M. Bergström and M.
Södergard.
Merisuo-Storm, T. (2007). Pupils’ attitudes towards foreign-language learning and the development of
literacy skills in bilingual education. Teaching Teacher Education, 23, 226-35.
Mettewie, L. and Lorette, P. (2014). Tweetalig onderwijs als Belgische «philtre d’amour».
Attitudes van Franstalige CLIL-leerders van het Nederlands. In: L. Degand, Ph.
Hiligsmann, L. Rasier, M. Sergier, S. Vanasten and K. Van Goethem (eds.), In het teken van
identiteit. Taal en cultuur van de Nederlanden. Louvain-la-Neuve: Presses
Universitaires de Louvain, 195-201.
Moreno, D.J.R. and Callejas, C.M.B. (2018). Socioeconomic Status and its Impact on Language and
Content Attainment in CLIL Contexts. PORTA LINGUARUM, 115, 135.
Nikula, T., Dalton-Puffer, C., and Llinares, A. (2013). European research on CLIL classroom
discourse. International Journal of Immersion and Content Based Education, 1(1), 70-100.
Paran, A. (2013). Content and language integrated learning: Panacea or policy borrowing myth? Applied
Linguistics Review, 4(2), 317-342.
Pérez Cañado, M. L. (2018). CLIL and Educational Level: A Longitudinal Study on the Impact of CLIL
on Language Outcomes. PORTA LINGUARUM, 51, 70.
Pérez Cañado, M. L. and Ráez Padilla, J. (2015). Introduction and overview. In D. Marsh, M.L.
Pérez Cañado, y J. Ráez Padilla (Eds.), CLIL in action: Voices from the classroom. Newcastle
upon Tyne: Cambridge Scholars Publishing, 1-12.
Pérez Cañado, M. L., and Lancaster, N. K. (2017). The effects of CLIL on oral comprehension and
production: a longitudinal case study. Language, Culture and Curriculum, 30(3), 300-316.
Pérez-Cañado, M. L. (2016). From the CLIL craze to the CLIL conundrum: Addressing the
current CLIL controversy. Bellaterra Journal of Teaching and Learning Language and
Literature, 9(1), 9-31.
Pladevall-Ballester, E., & Vallbona, A. (2016). CLIL in minimal input contexts: A longitudinal
study of primary school learners’ receptive skills. System, 58, 37-48.
Primi, R., Ferrão, M. E., and Almeida, L. S. (2010). Fluid intelligence as a predictor of learning: A
longitudinal multilevel approach applied to math. Learning and Individual Differences, 20(5),
446-451.
Rasier, L., Bui, A.V., Jouniaux, A. and Ph. Hiligsmann (2014). Klemtoon in het Nederlands van
Franstalige immersie- en niet-immersieleerlingen. In: L. Degand, P. Hiligsmann, L. Rasier, M.
Sergier, S. Vanasten and K. Van Goethem (eds.), In het teken van identiteit. Taal en cultuur van
de Nederlanden. Louvain-la-Neuve: Presses Universitaires de Louvain, 203-220.
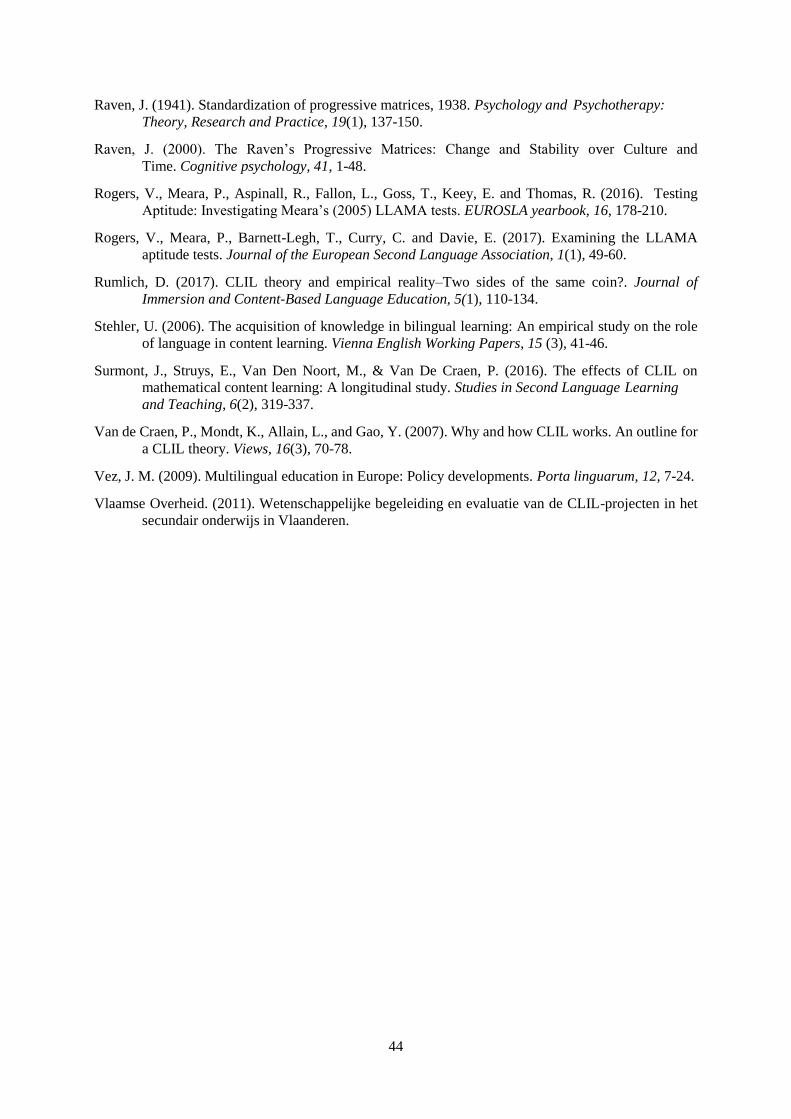
44
Raven, J. (1941). Standardization of progressive matrices, 1938. Psychology and Psychotherapy:
Theory, Research and Practice, 19(1), 137-150.
Raven, J. (2000). The Raven’s Progressive Matrices: Change and Stability over Culture and
Time. Cognitive psychology, 41, 1-48.
Rogers, V., Meara, P., Aspinall, R., Fallon, L., Goss, T., Keey, E. and Thomas, R. (2016). Testing
Aptitude: Investigating Meara’s (2005) LLAMA tests. EUROSLA yearbook, 16, 178-210.
Rogers, V., Meara, P., Barnett-Legh, T., Curry, C. and Davie, E. (2017). Examining the LLAMA
aptitude tests. Journal of the European Second Language Association, 1(1), 49-60.
Rumlich, D. (2017). CLIL theory and empirical reality–Two sides of the same coin?. Journal of
Immersion and Content-Based Language Education, 5(1), 110-134.
Stehler, U. (2006). The acquisition of knowledge in bilingual learning: An empirical study on the role
of language in content learning. Vienna English Working Papers, 15 (3), 41-46.
Surmont, J., Struys, E., Van Den Noort, M., & Van De Craen, P. (2016). The effects of CLIL on
mathematical content learning: A longitudinal study. Studies in Second Language Learning
and Teaching, 6(2), 319-337.
Van de Craen, P., Mondt, K., Allain, L., and Gao, Y. (2007). Why and how CLIL works. An outline for
a CLIL theory. Views, 16(3), 70-78.
Vez, J. M. (2009). Multilingual education in Europe: Policy developments. Porta linguarum, 12, 7-24.
Vlaamse Overheid. (2011). Wetenschappelijke begeleiding en evaluatie van de CLIL-projecten in het
secundair onderwijs in Vlaanderen.

45
APPENDIX: BACKGROUND QUESTIONNAIRE
Naam leerling: ______________________________________
Deel I: Toestemmingsverklaring
Ik verklaar hierbij dat ik deelneem aan een leerexperiment aan de Vakgroep Vertalen, Tolken en
Communicatie van de Universiteit Gent met betrekking tot CLIL, onder leiding van Prof. dr. June
Eyckmans. Ik bevestig dat ik:
(1) de uitleg over de aard van de opdrachten in dit leerexperiment heb begrepen
(2) uit vrije wil deelneem aan dit leerexperiment
(3) de toestemming geef aan de projectleider om mijn resultaten op anonieme wijze te verwerken
en te rapporteren.
(4) op de hoogte ben van de mogelijkheid om mijn deelname aan het onderzoek op ieder moment
vóór april 2018 stop te zetten.
(5) ervan op de hoogte ben dat ik op aanvraag een samenvatting van de onderzoeksbevindingen kan
krijgen bij Julie Decloedt ([email protected])
Gelezen en goedgekeurd op ………………………………… (datum).
Handtekening:

46
Deel II: Achtergrondinformatie
School: _________________ ___________________________________________________________
Studiejaar: ______________ ___________________________________________________________
Studierichting: ___________ ___________________________________________________________
Leeftijd: _______________ ___________________________________________________________
Thuista(a)l(en): __________ ___________________________________________________________
Ter verduidelijking: Als je deel uitmaakt van een nieuw samengesteld gezin dan heb je soms meerdere
papa’s of mama’s. In deze enquête peilen we naar de mama/papa waar je sinds je geboorte het meeste
tijd mee hebt doorgebracht. Als dat voor jou moeilijk te bepalen is, dan mag je gerust bij de vragen waar
dat van toepassing is extra informatie toevoegen.
Hoeveel procent behaalde je in totaal op je rapport van de vorige examenperiode?
□ Minder dan 50
□ 50 – 60
□ 60 – 70
□ 60 – 70
□ 80 – 90
□ 90 – 100
Hoeveel procent behaalde je voor Frans op je vorige examen?
□ Minder dan 50
□ 50 – 60
□ 60 – 70
□ 60 – 70
□ 80 – 90
□ 90 – 100
Hoeveel jaar heb je al lessen Frans gehad in totaal (dit schooljaar inbegrepen)?
□ 4
□ 5
□ 6
□ 7
□ Overige: ____________________________________________________________________

47
Kom je buiten school in contact met Frans?
□ Ja
□ Hoe? ________________ _______________________________________________________
□ Hoe vaak? _______ ____________________________________________________________
□ Nee
Hoeveel procent behaalde je voor Engels op je vorige examen?
□ Minder dan 50
□ 50 – 60
□ 60 – 70
□ 60 – 70
□ 80 – 90
□ 90 – 100
Hoeveel jaar heb je al lessen Engels gehad in totaal (dit schooljaar inbegrepen)?
□ 4
□ 5
□ 6
□ 7
□ Overige: ____________________________________________________________________
Kom je buiten school in contact met Engels?
□ Ja
□ Hoe? ________________________________________________________________ _______
□ Hoe vaak? ___________________________________________________________ _______
□ Nee
Wat is het hoogstbehaalde diploma van je moeder?
□ Lager middelbaar onderwijs
□ Hoger middelbaar onderwijs
□ 7e jaar middelbaar onderwijs
□ Hogeschool van het korte type
□ Hogeschool van het lange type
□ Licentiaats- of masterdiploma aan een universiteit
□ Doctoraatsdiploma aan een universiteit
□ Overige: ______________________________________________________________ ______
□ Ik weet het niet
Als je weet wat ze gestudeerd heeft, schrijf het dan hier: ____________________________________

48
Welke talen spreekt je moeder?
□ Nederlands
□ Engels
□ Frans
□ Duits
□ Italiaans
□ Spaans
□ Turks
□ Arabisch
□ Overige: ____________________________________________________________________
Wat is het hoogstbehaalde diploma van je vader?
□ Lager middelbaar onderwijs
□ Hoger middelbaar onderwijs
□ 7e jaar middelbaar onderwijs
□ Hogeschool van het korte type
□ Hogeschool van het lange type
□ Licentiaats- of masterdiploma aan een universiteit
□ Doctoraatsdiploma aan een universiteit
□ Overige: ____________________________________________________________________
□ Ik weet het niet
Als je weet wat hij gestudeerd heeft, schrijf het dan hier: ______________________________________
Welke talen spreekt je vader?
□ Nederlands
□ Engels
□ Frans
□ Duits
□ Italiaans
□ Spaans
□ Turks
□ Arabisch
□ Overige: ____________________________________________________________________

49
Vul het onderstaande schema aan.
Activiteiten Ja Nee Zo ja, hoe vaak?
Lezen jullie thuis (een) krant(en)?
(op papier of online)
Dagelijks
Wekelijks
Maandelijks
Jaarlijks
Welke krant?
__________________
__________________
Kijken jullie thuis naar het journaal?
Dagelijks
Wekelijks
Maandelijks
Jaarlijks
Welk journaal?
__________________
__________________
Bespeel je (een)
muziekinstrument(en)?
Dagelijks
Wekelijks
Maandelijks
Jaarlijks
Welk instrument?
__________________
__________________
Beoefen je (een) sport(en)?
Dagelijks
Wekelijks
Maandelijks
Jaarlijks
Welke sport?
__________________
__________________
Ga je naar de bibliotheek?
Dagelijks
Wekelijks
Maandelijks
Jaarlijks
Bezoek je musea?
Dagelijks
Wekelijks
Maandelijks
Jaarlijks
Deel III: CLIL (Content and Language Integrated Learning)
Heb jij de voorbije schooljaren al deelgenomen aan CLIL?
□ Ja
□ Nee
Als je op de vorige vraag ja hebt geantwoord, vul dan ook deze vragen in:
Als je al aan CLIL hebt deelgenomen, hoeveel jaar/jaren was dat in totaal?
□ 1 jaar
□ 2 jaren
□ 3 jaren

50
In welke taal/talen was dat?
□ Frans
□ Engels
□ Duits
Voor welk vak/ welke vakken heb je CLIL gevolgd? _________________________________________
Neem je dit schooljaar deel aan CLIL?
□ Ja
□ Nee
Als je op de vorige vraag ja hebt geantwoord, vul dan ook deze vragen in:
In welke taal volg je nu CLIL?
□ Frans
□ Engels
□ Duits
Voor welk vak volg je CLIL? ___________________________________________________________
Hoeveel uur per week heb je dat vak?
□ 1 uur
□ 2 uren
□ 3 uren
□ 4 uren
□ Overige: ____________________________________________________________________
Worden alle lesuren van het vak in de vreemde taal gegeven?
□ Ja
□ Nee
Toen je voor CLIL koos, waarom was dat vooral?
Je mag maximaal 3 opties aanduiden.
□ Ik wilde mijn talenkennis verbeteren
□ Ik wilde een extra uitdaging aangaan

51
□ Mijn vrienden kozen voor CLIL
□ Een leerkracht heeft me overtuigd om voor CLIL te kiezen
□ Mijn school heeft me overtuigd om voor CLIL te kiezen
□ Mijn ouders hebben me overtuigd om voor CLIL te kiezen
□ Ik wilde les krijgen van de CLIL-leerkracht
□ Andere: ___________________________________________________________________
Als je niet voor CLIL koos, waarom was dat vooral?
Je mag maximaal 3 opties aanduiden.
□ Taal is mijn ding niet
□ Ik ben goed in talen maar ik wil de niet-taalvakken in het Nederlands volgen.
□ Ik wilde geen extra uur/uren les
□ Mijn vrienden kozen niet voor CLIL
□ Een leerkracht heeft me overtuigd om niet voor CLIL te kiezen
□ Mijn school heeft me overtuigd om niet voor CLIL te kiezen
□ Mijn ouders hebben me overtuigd om niet voor CLIL te kiezen
□ Ik wilde geen les krijgen van de CLIL-leerkracht
□ Andere: ___________________________________________________________________