Embed Size (px)
Citation preview
The Role of Selective Capital Account Openness in Resilience to Financial Shocks
Tong Hui (IMF)Shang-Jin Wei (Columbia Univ, NBER & CEPR)

Motivations
• Innovation and industrial upgrading more dependent on external finance than average economic activities.
• One threat to successful innovation, upgrading, and economic growth is an economy’s vulnerability to liquidity shocks and to financial sector crises.
• Role of selective capital account convertibility– Resilience to finance shocks– Example of government interventions meant to create a
hospitable/safe environment for innovation and growth
2

The Goals
• How different are different types of capital flows• Consequence during a crisis (some results)• Consequence during tranquil periods
(preliminary results)
• To do:– How to combine them?– Endogeneity?
3
4
A crisis as an angle to examine the composition effect in financial globalization
A large literature on effects of international capital flows (“financial globalization”):– Potential benefits: lower cost of capital, better risk sharing,
knowledge spillover, better discipline– Henry (2007); Stulz (2005), etc
Stubborn lack of empirical corroboration Kose, Prasad, Rogoff and Wei (2003); Rodrik and
Subramanian (2008) Composition matters:
Frankel-Rose (1996), Wei (2001, 2006 and 2007)

What is the composition effect?• Because bank loans (and maybe portfolio flows) are more volatile than
FDI, the share of FDI in total capital inflows affects a country’s experience with financial integration. Not all integration is equal.
• The composition and the likelihood of currency/BOP crisis– Frankel and Rose, 1996: Probit in a panel– Classens, Dooley, and Warner, 1995 (skeptics):
• how reliable are the labels?
– Frankel and Wei, 2005: (semi-parametric) regression tree method– Other types of compositions (maturity structure, share of foreign currency debt)
• The composition and the liquidity crunch– Tong and Wei, 2009
5

Agenda for the presentation
• Basic facts: Are different types of capital flows actually different in volatility?
• Preliminary evidence: The composition effect in the 2008-2009 crisis: Is there evidence that it affects the severity of the liquidity crunch?
• To do: Effects of capital flows in tranquil times
• What lies behind the composition?
6

Results so far
• Are different types of capital flows actually different in volatility?– Yes. – FDI appears most stable; foreign loans appear most volatile
• The composition effect in the 2008-2009 crisis: Is there evidence that it affects the spread of the liquidity crunch?– Yes– Countries that relied more on non-FDI before the crisis exhibit a more
severe credit crunch during the 2008-09 crisis
• What lies behind the composition?– Financial institutional quality is an important factor– Property rights institutions can have different effects– Consistent with recent theory
7

• Part 1: Do the labels matter?
8
9
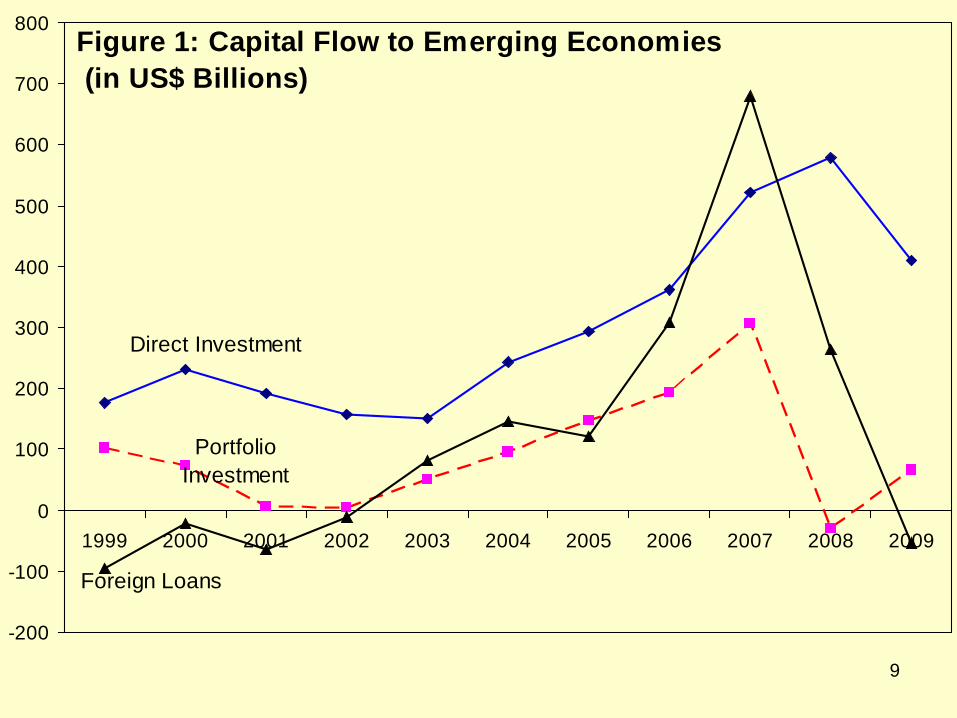
Figure 1: Capital Flow to Emerging Economies (in US$ Billions)
Direct Investment
Portfolio Investment
Foreign Loans
-200
-100
0
100
200
300
400
500
600
700
800
1999 2000 2001 2002 2003 2004 2005 2006 2007 2008 2009

Volatility of (FDI/GDP) and (Loan/GDP) (1980-2006, Measured by Standard Deviation)
10
FDI/GDP Loan/GDP

Volatility of (FDI/GDP) and (Loan/GDP) (1980-2006, Measured by Coefficient of Variation)
11

Volatility measured by standard deviation
12

Volatility measured by standard deviation
13
FDI/GDP Loan/GDP Portfolio/GDP

• Part 2: Is there evidence supporting the composition effect from the latest crisis?
14

15
The current crisis as an opportunity
• Crisis =危(danger)机(opportunity)
The 2008-09 global financial crisis as an opportunity to check the composition effect
Whether/how a country’s pre-crisis composition of capital inflows affects the severity of liquidity crunch experienced by its non-financial firms during a systemic crisis.
16
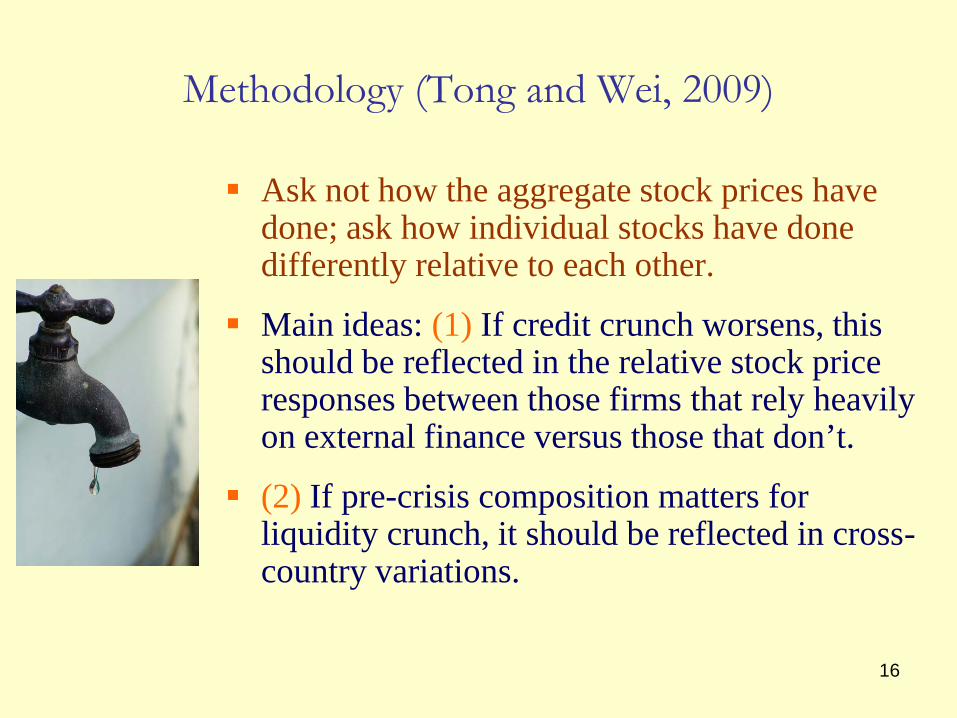
Methodology (Tong and Wei, 2009)
Ask not how the aggregate stock prices have done; ask how individual stocks have done differently relative to each other.
Main ideas: (1) If credit crunch worsens, this should be reflected in the relative stock price responses between those firms that rely heavily on external finance versus those that don’t.
(2) If pre-crisis composition matters for liquidity crunch, it should be reflected in cross-country variations.
• International lending -> support domestic lending– E.g., the “wholesale funding” model of Korea
• FDI: Internal capital market of multin’l firmsNormal times: Desai, Foley and Forbes (2009)Crisis times?
17

18
Main Findings (1)
Liquidity squeeze is wide-spread across countries. Firms that depend intrinsically more on external finance
for working capital fare significantly worse

19
Main Findings (2) Pre-crisis volume of capital inflows
does not predict severity of credit crunch in 2008
The (lack of a) volume effect hides an important composition effect The credit crunch is more severe in
emerging countries with large exposure to non-FDI flows
but less severe in countries with exposure to FDI.

20
Empirical Specification
Key regressors
Baseline findings and Robustness checks

21
Econometric Model
The model
Pure cross-sectional
Key regressors are all pre-determined by values in 2006
(1) ij j ij ij ijStockReturn FinancialDependence Controlα β ε= + + +

22
Pre-crisis Financial Integration
The severity of an emerging economy’s credit crunch is systematically linked to its pre-crisis capital inflows since the crisis may have triggered a reversal of global capital flows.
Focus on 24 emerging markets.
1 2(2) jFinancial Integrationβ β β= +
23
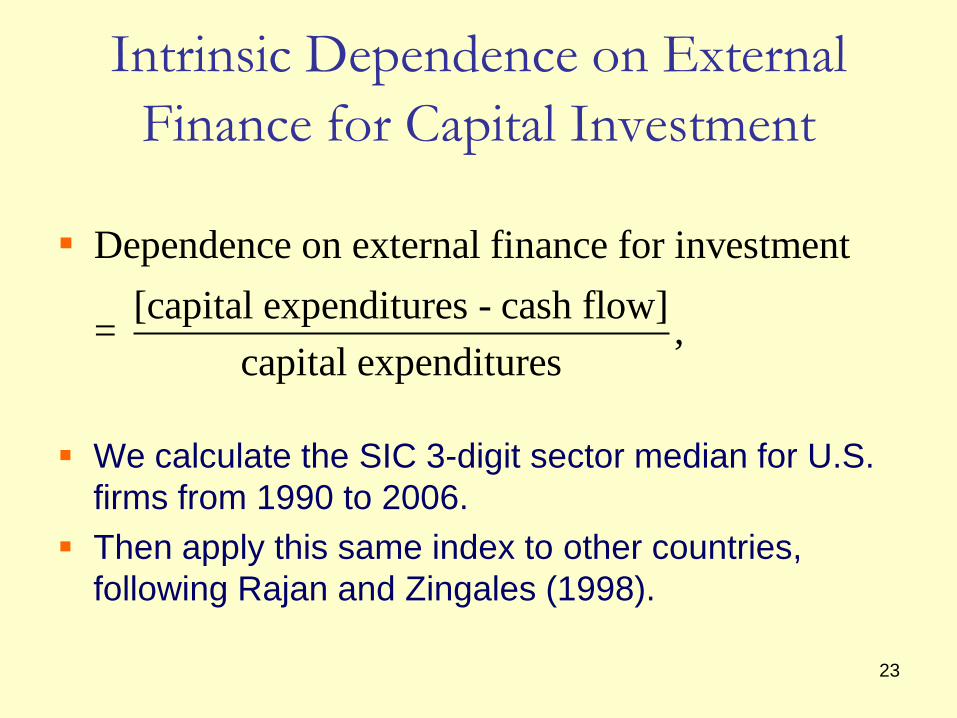
Intrinsic Dependence on External Finance for Capital Investment
We calculate the SIC 3-digit sector median for U.S. firms from 1990 to 2006.
Then apply this same index to other countries, following Rajan and Zingales (1998).
Dependence on external finance for investment [capital expenditures - cash flow]= ,
capital expenditures

24
Intrinsic Dependence on External Finance for Working Capital
Intrinsic liquidity need for working capital
We calculate the SIC 3-digit sector median for U.S. firms from 1990 to 2006
Then apply the same index to other countries, similar to Raddatz (2006) and Kroszner, Laeven and Klingebiel (2007).
Cash conversion cycle
inventories-account payables account receivables= 365*cost of goods sold total sales
+
25
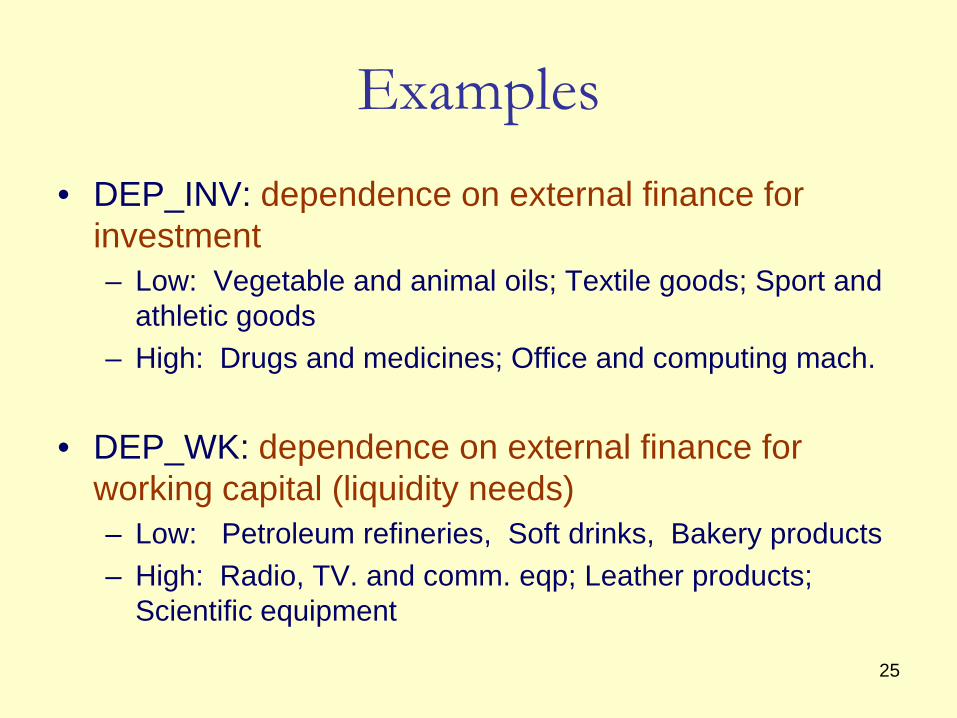
Examples• DEP_INV: dependence on external finance for
investment– Low: Vegetable and animal oils; Textile goods; Sport and
athletic goods – High: Drugs and medicines; Office and computing mach.
• DEP_WK: dependence on external finance for working capital (liquidity needs)– Low: Petroleum refineries, Soft drinks, Bakery products – High: Radio, TV. and comm. eqp; Leather products;
Scientific equipment

26
Control Variables Country fixed effects
Firm-level features: four factor model (firm size, beta, market/book, momentum).
Sector Sensitivity to Demand Shock– Track stock return from 9/10/01 to 9/28/01 for
each U.S. listed firm.– Define the average stock return for each 3-digit
SIC sector as the sector-level sensitivity to demand shock, as in Tong and Wei (2008).

27
Dependent Variable The difference in the log of stock price from July
31, 2007 to December 31, 2008 for 14,307 non-financial firms in 44 developed and emerging economies.

28
The Extent of Liquidity Crunch
The fall in stock price is more severe for sectors with a greater dependence on external finance for working capital;
– In some cases, more severe for sectors with dependence on external finance for investment as well (Table 3)

29
Stock Returns from 7/31/07 to 12/31/08
Dependence for Investment (DEF_INV)
-7.766* 0.147
Dependence Working Capital(DEF_WK)
-0.115*** -0.134***
Beta*Market Return 0.270***
Firm Size 3.748***
Market/Book -1.141***
Momentum -0.0334
Demand Sensitivity -4.879***

30
Pre-crisis Exposure to Capital Inflows (Averaged from 2002-06, % of GDP, 24 emerging economies)
Country Total inflow FDI FPI Foreign LoansChile 8.41 5.61 1.43 1.38China 5.13 3.11 0.78 1.24Hungary 11.31 5.02 2.05 4.24India 3.68 1.16 1.08 1.44Korea 4.19 0.72 1.56 1.91

31
Capital flow volume is insignificant
We start with a de facto measure of financial integration: the country’s annual inflow over GDP averaged from 2002 to 2006.
Capital flow volume is not significantly associated with the severity of credit crunch. (Table 5)

32
Table 2. Role of Pre-crisis Financial Integration(Emerging Markets; Volume Effect)
(Dependent Var: Stock return from 7/31/07—12/31/08)
DEF_INV -6.929
DEF_INV*Inflow 0.0243 0.135
DEF_WK -0.0768*
DEF_WK*Inflow -0.00059 -0.00041
Firm level controls Yes Yes
Industry fixed effects No Yes
Observations 5917 5917

33
But composition matters a great deal
Separating FDI, portfolio investment, and foreign loan (over GDP).
FDI reduces the liquidity crunch while Non-FDI aggravates it. (Table 6)
Results hold even after we control firm-level factors and industry fixed effects.

34
Table 3. Role of Pre-crisis Financial Integration in Emerging Markets(Dep Var: Stock return from 7/31/07—12/31/08)
DEF_INV -11.06
DEF_INV*FDI 1.339 2.662**DEF_INV*FPI -1.228** -1.395**
DEF_INV*Foreign Loan -1.141 -2.202*
DEF_WK -0.113**DEF_WK*FDI 0.0253** 0.018DEF_WK*FPI -0.0061 -0.0049
DEF_WK*Foreign Loan -0.0233* -0.0192*
Firm-level controls No YesSector fixed effects No Yes

35
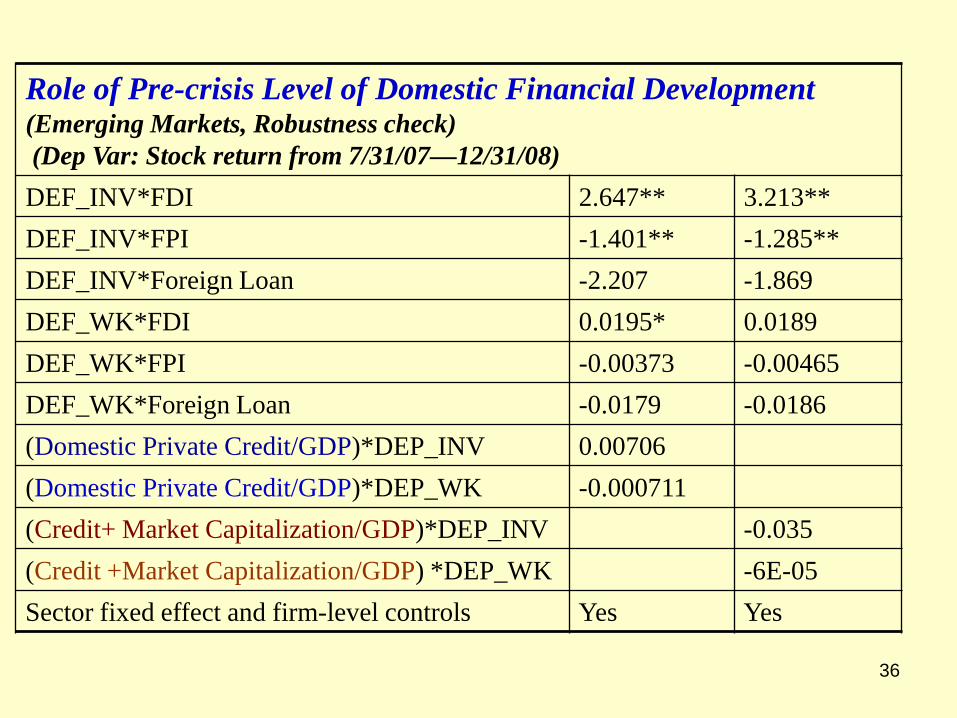
Robustness Tests
Add domestic financial development (x dependence on external finance) –no effect
Add an indicator of market vs bank system (and x DEF)
Add firm-level leverage ratio and (x DEF)
Add a dummy for a stock that also has an ADR (and x DEF)
Add measure of cyclicality (X FD) – no effect
Directly measure demand-sensitivity (source: Tong and Wei , 2008).
36
Role of Pre-crisis Level of Domestic Financial Development (Emerging Markets, Robustness check)(Dep Var: Stock return from 7/31/07—12/31/08)DEF_INV*FDI 2.647** 3.213**DEF_INV*FPI -1.401** -1.285**DEF_INV*Foreign Loan -2.207 -1.869DEF_WK*FDI 0.0195* 0.0189DEF_WK*FPI -0.00373 -0.00465DEF_WK*Foreign Loan -0.0179 -0.0186(Domestic Private Credit/GDP)*DEP_INV 0.00706(Domestic Private Credit/GDP)*DEP_WK -0.000711(Credit+ Market Capitalization/GDP)*DEP_INV -0.035(Credit +Market Capitalization/GDP) *DEP_WK -6E-05Sector fixed effect and firm-level controls Yes Yes
37
• Could realized volume and composition of capital inflows be endogenous?
• Try de jure measures of capital account convertibility– with attention on different restrictions on
different types of capital flows

38
De Jure Measure of Capital Openness
A de jure measure on capital openness, based on the IMF’s Annual Report on Exchange Arrangements and Exchange Restrictions for year 2006.
Openness on inward capital flows: FDI, FPI (stocks and bonds), and foreign loan (commercial and financial credits) respectively.
Confirm the findings for de facto classification, particularly for DEP_INV. (Table 9)

39
Role of Pre-crisis Financial Integration—De Jure Classification (emerging economies)(Dep Var: Stock return from 7/31/07—12/31/08)DEF_INV -2.688
DEF_INV*FDI 8.724 15.39***
DEF_INV*FPI -12.61* -12.47**
DEF_INV*Foreign Loan 0.134 -0.551
DEF_WK -0.0358
DEF_WK*FDI -0.00997 0.00787
DEF_WK*FPI -0.112* -0.0746
DEF_WK*Foreign Loan 0.0402 0.00836
Industry fixed effects No Yes
40
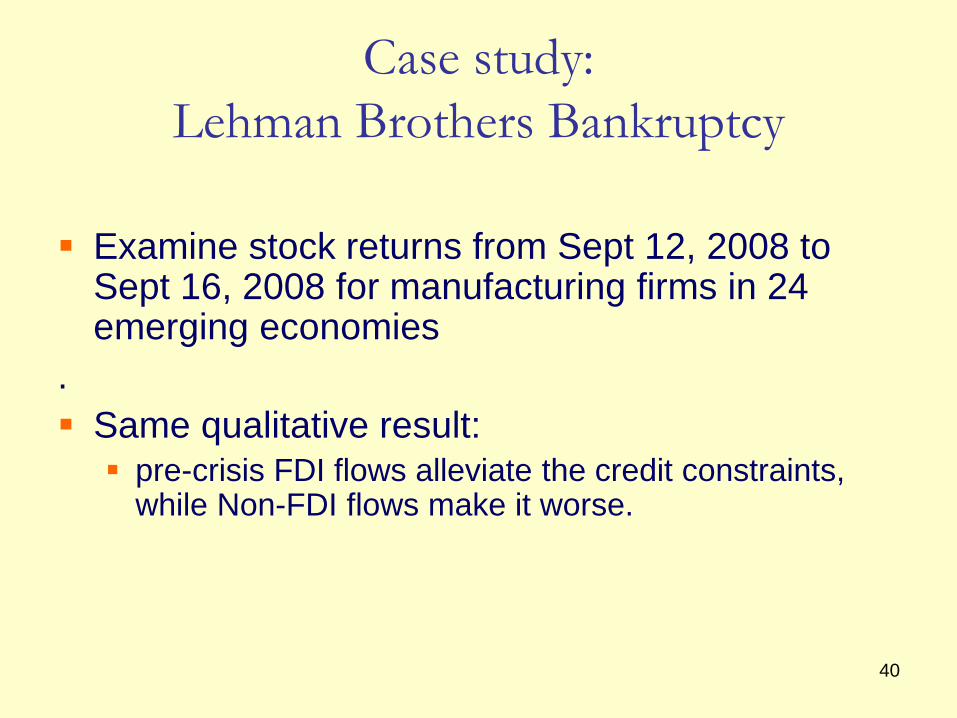
Case study: Lehman Brothers Bankruptcy
Examine stock returns from Sept 12, 2008 to Sept 16, 2008 for manufacturing firms in 24 emerging economies
. Same qualitative result: pre-crisis FDI flows alleviate the credit constraints,
while Non-FDI flows make it worse.

41
Table 11. Stock Returns around Lehman Brother BankruptcyCase 6
DEF_INV*FDI 0.330***DEF_INV*FPI -0.0767DEF_INV*ForeignLoans -0.226DEF_WK*FDI 0.00187DEF_WK*FPI -0.00163**DEF_WK*ForeignLoans -0.00352*Leverage -1.596**Leverage*FDI 0.187Leverage*FPI -0.0511Leverage*ForeignLoans -0.25Sector dummies and firm controls Yes

• Part 3: Overall assessment
• Tranquil periods (early results, 2002-2006)– Some evidence that capital inflows alleviate
liquidity constraints
Question: How to put the results from tranquil and crisis periods together?
42

• Part 4: Endogeneity of composition
• Is it institutional quality or level of financial development lurking behind the composition effect?
43

44
Explanation? Caballero, Farhi, and Gourichas (2008) Mendoza, Enrique, Quadrini, and Rios-Rull (2009),
"Financial integration, financial deepness and global imbalances," NBER Working Paper 12909.
Ju and Wei (AEJ-EP 2010), “Domestic institutions and the bypass effect of financial globalization” Good property rights protection (low corruption) helps to attract more
FDI, maybe less loans Better financial system would retain more domestic savings at home
More domestic investment -> lower MPK Less FDI

Ju and Wei (AEJ 2010): Domestic Institutions and the Bypass Effect of Financial Globalization
• Embed Holmstrom and Tirole (1997) into a 2-country general equilibrium model
• When c=b=0, MPK=financial interest rate.• Inefficient financial system (a high c or a higher b)
reduces the financial interest rate for a given MPK• Two-way capital flows• Different effect of financial institutions/property
rights on K flows 45

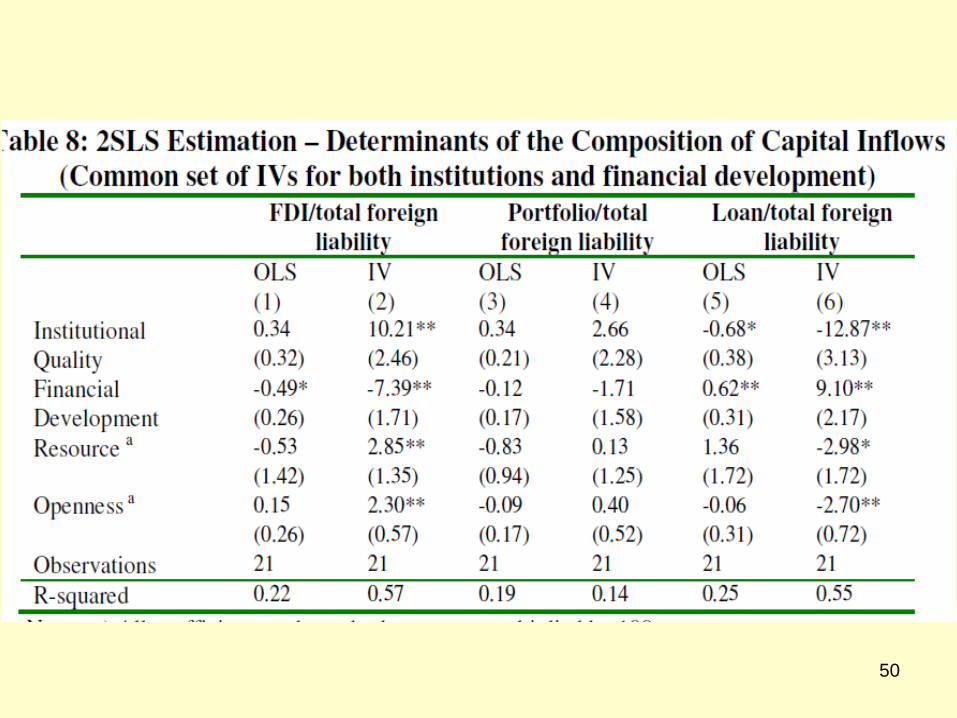
Linking composition to institutions and financial development
46

Linking composition to institutions and financial development
• OLS– Measurement errors + endogeneity
• 2SLS: Using history as instruments– Settler mortality: Acemoglu, Johnson and Robinson– Legal origin: La Porta, Lopez-di-Silanes, Shleifer and Vishny
47

48

49
50

51

52
Policy lessons
• Looking at the average effect of capital inflows may mistakenly conclude that capital flows don’t matter
Since the composition matters, reforms on capital account need to be sequenced
Future work: need to quantify benefits of non-FDI in good times and
costs in bad times Recognize determinants of the composition How innovation and growth are affected by selective
capital account openness