Embed Size (px)
Citation preview
The Role of Pyrite in Localized H2S Corrosion of Mild Steel
Jing Ning, Yougui Zheng, Bruce Brown, David Young, and Srdjan Nesic Institute for Corrosion and Multiphase Technology, Ohio University
342 West State Street, Athens, OH 45701
ABSTRACT Localized corrosion is troublesome for corrosion engineers because it is generally considered the main cause for pipeline failures in the oil and gas industry, particularly in sour systems, and it is hard to predict or detect. However, compared to general corrosion, localized corrosion is poorly understood and less studied. Hence, understanding mechanisms of localized corrosion in sour fields is critical to corrosion engineers for integrity management. In a previous study, a strong correlation between the formation of greigite and/or pyrite and the onset of localized corrosion was observed. A further comprehensive study was then required to investigate this correlation between localized corrosion and greigite and/or pyrite. Thus, novel experiments involving deposition of pyrite on the steel surface were designed and conducted for the current study to investigate if localized corrosion occurs when pyrite is deposited on mild steel in an aqueous H2S environment. It was confirmed that severe localized corrosion was observed and replicated in the presence of pyrite deposit layers. Furthermore, the impact of pyrite particle size on pit characteristics was also studied. It was found that smaller and deeper pits were observed in the presence of smaller pyrite particles. This was concluded to be due to a larger cathodic area of the small particles, compared to the same amount of larger particles. Keywords: Hydrogen sulfide, localized corrosion, pyrite, polymorphism
INTRODUCTION CO2 and H2S corrosion of carbon steel are amongst the most frequently encountered materials’ degradation processes associated with production and transportation of oil and gas.1,2 The CO2 corrosion mechanism is generally well defined, however, complications arise when H2S is present. H2S metal loss attack can be classified into two categories, localized corrosion and general corrosion, based on the appearance of the corroded steel. Due to recent studies3-9, mechanisms associated with H2S general corrosion have become better understood. Localized H2S corrosion is more troublesome for corrosion engineers because it is generally considered the main cause for pipeline failures in the oil and gas industry. Compared to H2S general corrosion, there is minimal understanding of H2S localized corrosion. In general, it can be concluded that mechanisms of H2S localized corrosion are unclear and the causes of H2S localized corrosion are uncertain. It is understood that most types of localized corrosion are related to the formation and damage of corrosion product layer. In CO2 corrosion in oil and gas production environments, siderite (FeCO3) is almost always the favored corrosion product. However, in H2S corrosion of carbon steel, various types, or polymorphs, of iron sulfide and related phases have been reported10-22 as corrosion product. These
1
Paper No.
9251
©2017 by NACE International.Requests for permission to publish this manuscript in any form, in part or in whole, must be in writing toNACE International, Publications Division, 15835 Park Ten Place, Houston, Texas 77084.The material presented and the views expressed in this paper are solely those of the author(s) and are not necessarily endorsed by the Association.
include amorphous ferrous sulfide (FeS), mackinawite (FeS), cubic ferrous sulfide (FeS), troilite (FeS), pyrrhotites (Fe1-xS), smythite (Fe3+xS4), greigite (Fe3S4), and pyrite (FeS2). Each has its own unique set of physicochemical properties. The impact of different iron sulfide phases on the corrosion process of carbon steel in sour environments has been observed in a few studies23-26. Therefore, it is of great interest to study the role of iron sulfide phases in carbon steel corrosion. A correlation between occurrence of localized corrosion and onset of pyrite and/or greigite was seen in our previous study27. Although experimental results have proven that the formation of greigite and/or pyrite plays an important role in the initiation of the localized corrosion, the mechanism of this specific type of localized corrosion is not yet clear. It could be due to a galvanic effect exaggerated by the electrical conductivity associated with greigite and/or pyrite28-32 or it may be due to the local acidification at the steel specimen surface33 during the transformation process to greigite and/or pyrite. Clearly, a comprehensive mechanistic study on this type of localized corrosion is needed. Besides, a correlation does not constitute causation, i.e. it was not certain whether the spontaneous formation of greigite and/or pyrite was a cause of localized corrosion, or if it happened approximately at the same time for some yet unknown reason, or if it occurred possibly even as a consequence of the localized corrosion. To distinguish these possibilities and to bypass the complicated transformation step of polymorphous iron sulfides, being a thermodynamically stable iron sulfide, pyrite was directly deposited onto the steel surface and the subsequent corrosion process of the steel was studied. Experiments were designed and conducted to study if localized corrosion would occur when pyrite is deposited on mild steel in an aqueous H2S environment.
EXPERIMENTAL Experimental Design
Experiment Series #1: The Impact of Deposits (Pyrite/Silica Sand) on Corrosion The objective of this series of experiments was to verify if localized corrosion would occur when pyrite is deposited on a mild steel surface in an aqueous H2S environment, compared to a blank experiment in the presence of the inert silica sand deposit. Table 1 shows the test matrix of this series of experiments. Two experiments were performed in a 1 wt. % NaCl solution. Pyrite particles with 150 ~ 400 µm diameter dimensions were used as the deposit to study the effect of pyrite on the corrosion process of the steel underneath.
Table 1 Test matrix for Experiment Series #1. Description Experiment #1 Experiment #2
Deposit Silica sand Pyrite particles
Deposit Particle Diameter 150 ~ 400 µm
Deposit Layer Depth 2 mm
Temperature 25 oC
Gas Composition pH2S (balance with N2) = 0.1 bar
Stirring Speed 500 rpm
Electrolyte 1 wt.% NaCl
Material API 5L X65
Experimental Duration 1 week
Initial pH 4.0
2
©2017 by NACE International.Requests for permission to publish this manuscript in any form, in part or in whole, must be in writing toNACE International, Publications Division, 15835 Park Ten Place, Houston, Texas 77084.The material presented and the views expressed in this paper are solely those of the author(s) and are not necessarily endorsed by the Association.
Experiment Series #2: The Impact of Pyrite Particle Size on Corrosion This experimental series was designed to study the impact of pyrite particle size on the corrosion process, particularly on localized corrosion. A larger pyrite particle size, 1000 ~ 2000 µm, was used in Experiment #3 comparing with the smaller particle size used in Experiment #2. The test matrix is shown in Table 2.
Table 2 Test matrix for Experiment Series #2. Description Experiment #2 Experiment #3
Deposit Pyrite particles
Deposit Particle Diameter 150 ~ 400 µm 1000 ~ 2000 µm
Deposit Layer Depth 2 mm
Temperature 25 oC
Gas Composition pH2S (balance with N2) = 0.1 bar
Stirring Speed 500 rpm
Electrolyte 1 wt.% NaCl
Material API 5L X65
Experimental Duration 1 week
Initial pH 4.0
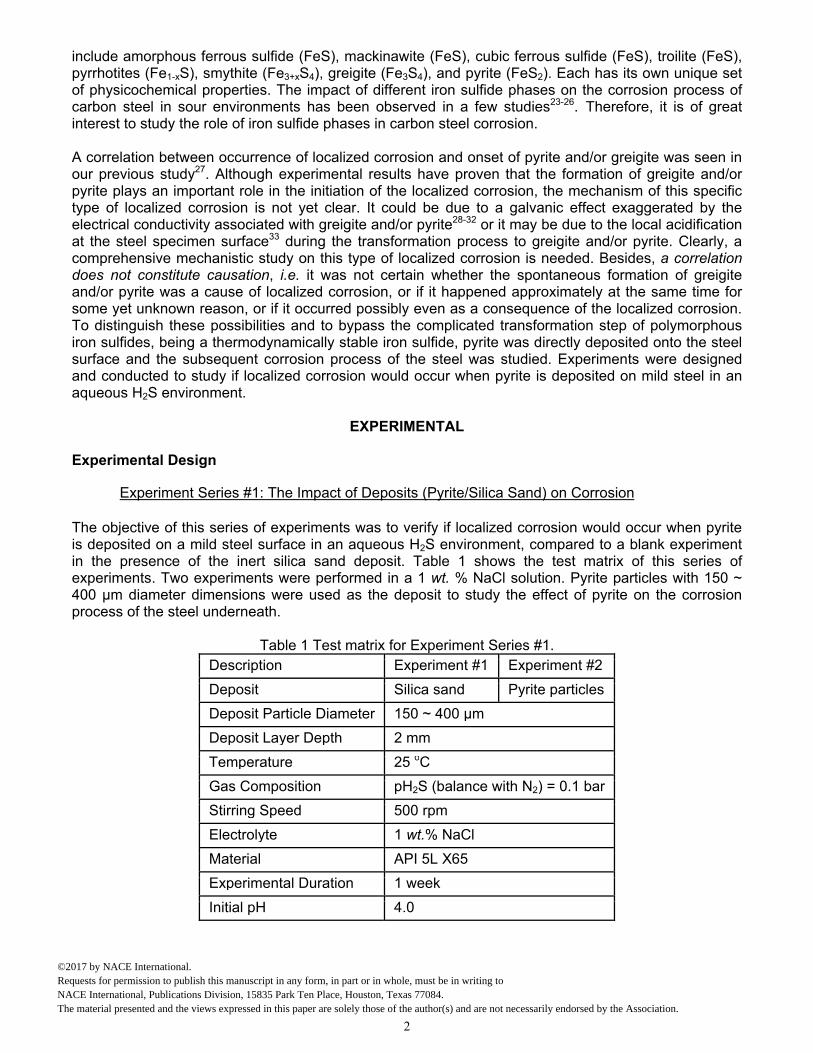
Apparatus The under deposit corrosion (UDC) specimen holder used in this study is shown in Figure 1 (a). The base, shown on the left with three conductive pins, is designed for easy electrical connection for electrochemical measurements. The specimen holder in the middle is for holding the mild steel specimen, and on the right side the deposit holder shown is used to hold and measure the depth of the deposited particle layer. This assembled UDC setup was exposed to an electrolyte in a glass cell depicted in Figure 1 (b). A stir bar was placed underneath the specimen holder to keep the solution well mixed during the experiment. Figure 1 (b) also shows the elements of an electrochemical cell consisting of a working electrode (abovementioned steel specimen), reference electrode (vs. Ag/AgCl Sat. KCl), and counter electrode (a platinum wire).
(a)
(b) Figure 1. (a) UDC specimen holder; (b) Experimental setup.
3
©2017 by NACE International.Requests for permission to publish this manuscript in any form, in part or in whole, must be in writing toNACE International, Publications Division, 15835 Park Ten Place, Houston, Texas 77084.The material presented and the views expressed in this paper are solely those of the author(s) and are not necessarily endorsed by the Association.
Materials
Carbon Steel Specifications Carbon steel specimens with a 7.9 cm2 exposed area were made from API 5L X65 (UNS K03014) carbon steel. The chemical composition of this carbon steel is shown in Table 3.
Table 3 Chemical composition of X65 carbon steel used in experiment (wt. %). Cr Mo S V Si C Fe Ni Mn P 0.14 0.16 0.009 0.047 0.26 0.13 Balance 0.36 1.16 0.009
Characterization of Deposits
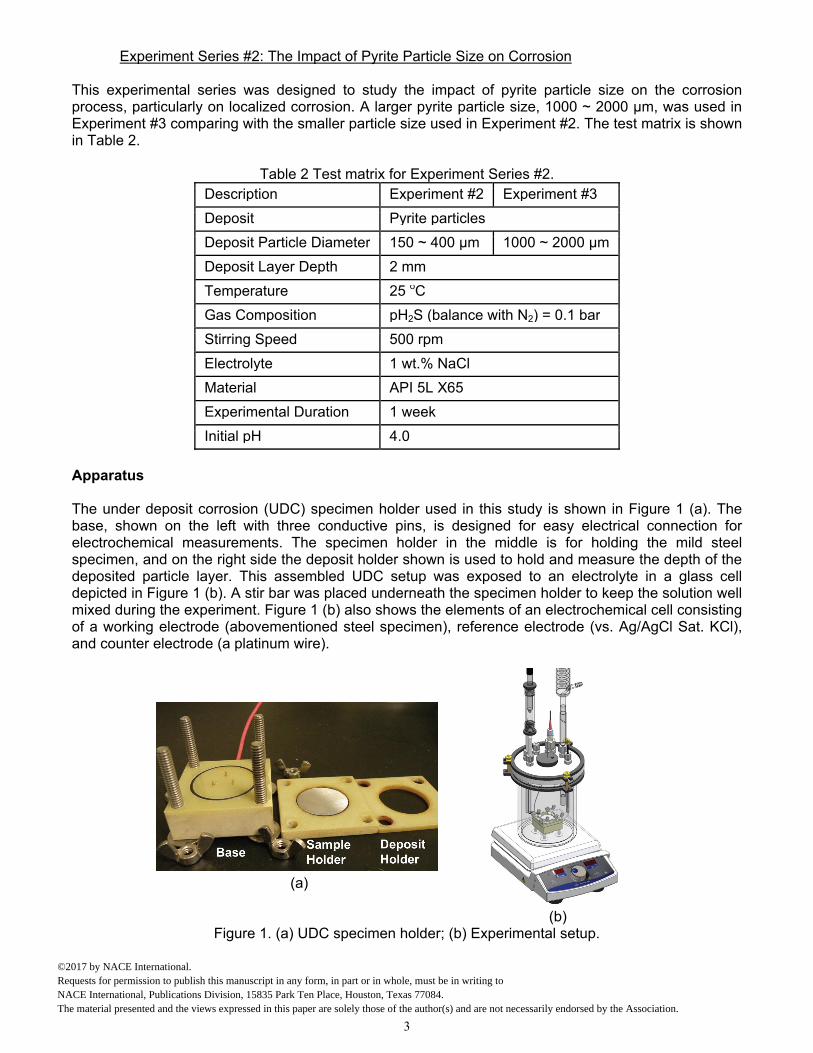
Figure 2 shows scanning electron microscope (SEM) images of the deposits used in experiments. Figure 2 (a) shows the silica sand particles with approximate 150 ~ 400 µm dimensions, (b) shows pyrite particles of approximately the same size, and (c) shows pyrite particles with larger dimensions, 1000 ~ 2000 µm. All deposits were screened using sieves for the desired size.
(a)
(b) (c)
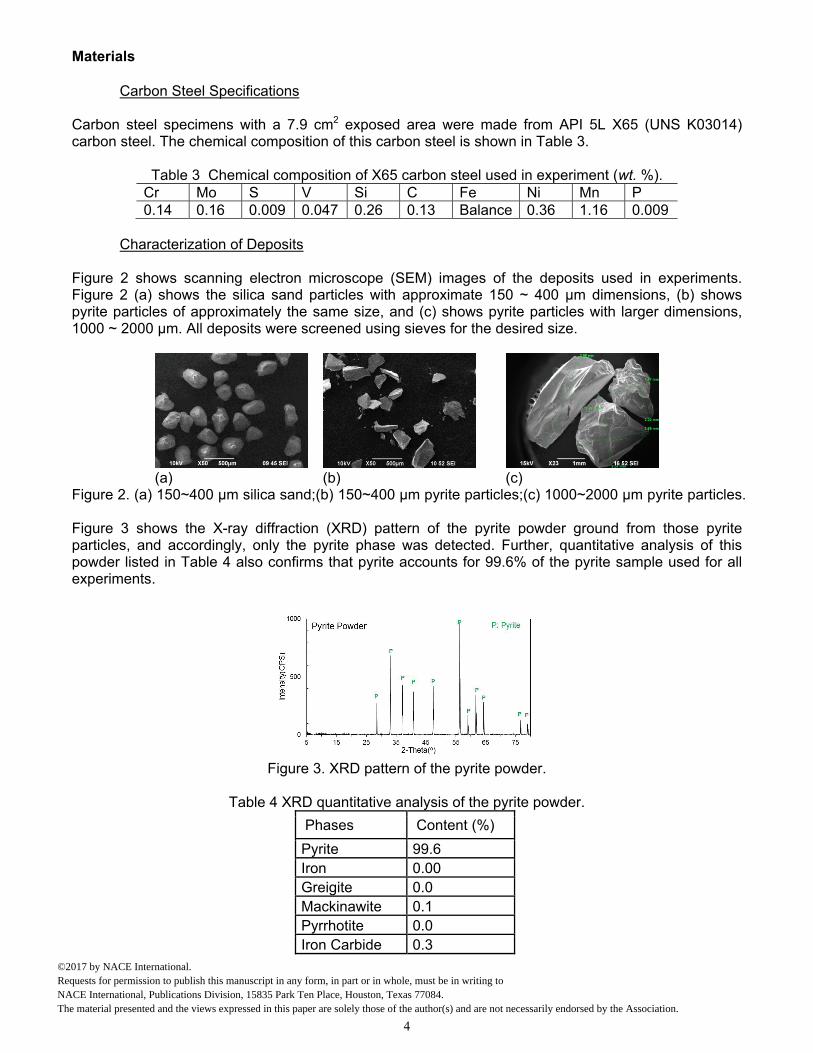
Figure 2. (a) 150~400 µm silica sand;(b) 150~400 µm pyrite particles;(c) 1000~2000 µm pyrite particles. Figure 3 shows the X-ray diffraction (XRD) pattern of the pyrite powder ground from those pyrite particles, and accordingly, only the pyrite phase was detected. Further, quantitative analysis of this powder listed in Table 4 also confirms that pyrite accounts for 99.6% of the pyrite sample used for all experiments.
Figure 3. XRD pattern of the pyrite powder.
Table 4 XRD quantitative analysis of the pyrite powder.
Phases Content (%)
Pyrite 99.6 Iron 0.00 Greigite 0.0 Mackinawite 0.1 Pyrrhotite 0.0 Iron Carbide 0.3
4
©2017 by NACE International.Requests for permission to publish this manuscript in any form, in part or in whole, must be in writing toNACE International, Publications Division, 15835 Park Ten Place, Houston, Texas 77084.The material presented and the views expressed in this paper are solely those of the author(s) and are not necessarily endorsed by the Association.
Procedure Nitrogen gas (N2) was sparged into the glass cell filled with 2-liter of electrolyte until pH stabilized (typically a few hours). Bulk pH of the electrolyte was adjusted to pH 4.0 using 1.0 M deoxygenated HCl or NaOH solutions. Deposits (silica sand and pyrite particles) were washed using acetone, rinsed thoroughly with deionized water, blown dry, and put into a container filled with the same electrolyte. The N2 gas was also sparged into the container until saturated, and the pH of solution in the container was adjusted to pH 4.0 as well. An API 5L X65 carbon steel specimen with a 7.9 cm2 exposed area was polished to a 600 grit sand paper finish, rinsed thoroughly with deionized water and isopropanol, ultrasonically cleaned in isopropanol, dried by an air blower, and mounted into the UDC specimen holder as shown in Figure 1. The specimen holder was introduced in the glass cell and the steel specimen was pre-corroded for one hour. Then, a 2 mm thick layer of silica sand or pyrite particles was deposited onto the steel specimen surface. An H2S and N2 mixed gas with 10% H2S in the gas phase was sparged into the glass cell approximately one hour after the deposition of the solid layer. The experiment was conducted for a week. Electrochemical measurements on the steel specimen were conducted to obtain the corrosion rate of the steel specimen and the solution resistance using a Gamry‡ Reference 600 Potentiostat. After the experiment, SEM and energy dispersive X-ray spectrometry (EDX) were used to analyze the surface morphologies of the steel specimen. In addition, weight loss of the steel specimen was performed to confirm the B value used for linear polarization resistance (LPR) measurements. Surface profilometry of the specimen after removing the corrosion product layer was performed confirming the occurrence of localized corrosion.
EXPERIMENTAL RESULTS Experiment Series #1: Impact of Deposits (Pyrite/Silica Sand) on Corrosion Figure 4 shows the experimental setup with a layer of the sand deposit and with a layer of the pyrite particles.
(a)
(b)
Figure 4. Experimental setup with: (a) 150 ~ 400 µm silica sand deposit; (b) 150 ~ 400 µm pyrite particles deposit.
Comparison of Electrochemical Behavior
A silica sand layer was deposited onto the steel surface in the “blank” experiment. Figure 5 shows the open circuit potential (OCP) and the corrosion rate in the initial five hours, including the deposition of a silica sand layer and the introduction of H2S gas into the solution. A decrease in both OCP and corrosion rate was observed after the deposition of the sand layer, which is considered to be due to the surface coverage and a diffusion barrier effect provided by the sand layer34. The addition of H2S gas to
‡ Trade Name
5
©2017 by NACE International.Requests for permission to publish this manuscript in any form, in part or in whole, must be in writing toNACE International, Publications Division, 15835 Park Ten Place, Houston, Texas 77084.The material presented and the views expressed in this paper are solely those of the author(s) and are not necessarily endorsed by the Association.

the solution was done approximately one hour after depositing the sand layer, while the pH remained practically unchanged (pH4.0±0.1). It was observed that the corrosion rate gradually increased after the addition of H2S gas. This is considered to be due to the introduction of aqueous H2S that is corrosive. Figure 6 presents the OCP and corrosion rate throughout the experiment lasting one week. Time averaged corrosion rate by weight loss (WL) of the steel substrate, shown as a green diamond at 7 days in Figure 6, was determined to confirm LPR measurements. A B value of 20 mV was used to calculate corrosion rates from LPR measurements, yielding a good overall agreement with WL. The corrosion rate decreased after about half-a-day and subsequently remained stable throughout the experiment, which is likely due to the formation of an iron sulfide layer.
Figure 5. Corrosion rate and OCP using silica sand deposit in the initial hours of Experiment #1.
Figure 6. Corrosion rate and OCP using silica sand deposit during a week of exposure - Experiment #1. In contrast, evolution of OCP and corrosion rate in the initial five hours including the deposition of a pyrite particle layer and the introduction of H2S gas are shown in Figure 7. A large increase in both the OCP and corrosion rate was observed after the deposition of the pyrite particle layer. This is thought to be due to the contact of steel with the more noble pyrite and possibly due to a significant increase in the rate of cathodic reaction(s) in the presence of pyrite deposits. In addition, a lot of bubbles were seen on the surface of pyrite particles during the experiment, at least when compared to the experiment using sand deposit. Two hypotheses were tested to explain these observations. :
An electrochemical effect due to pyrite providing more cathodic reaction area by electrically contacting the steel.
A chemical effect caused by increasing the concentration of cathodic species during the formation/dissolution process of pyrite, such as H+.
Both mechanisms are plausible and can lead to the increase in the rate of cathodic reaction(s). This investigation was completed, and is a subject of a separate publication being currently prepared. After H2S gas was introduced, both OCP and corrosion rate increased dramatically, which was due to the addition of one more cathodic reaction species, aqueous H2S. The OCP and corrosion rate throughout the experiment lasting a week are shown in Figure 8. The corrosion rate was stable
6
©2017 by NACE International.Requests for permission to publish this manuscript in any form, in part or in whole, must be in writing toNACE International, Publications Division, 15835 Park Ten Place, Houston, Texas 77084.The material presented and the views expressed in this paper are solely those of the author(s) and are not necessarily endorsed by the Association.
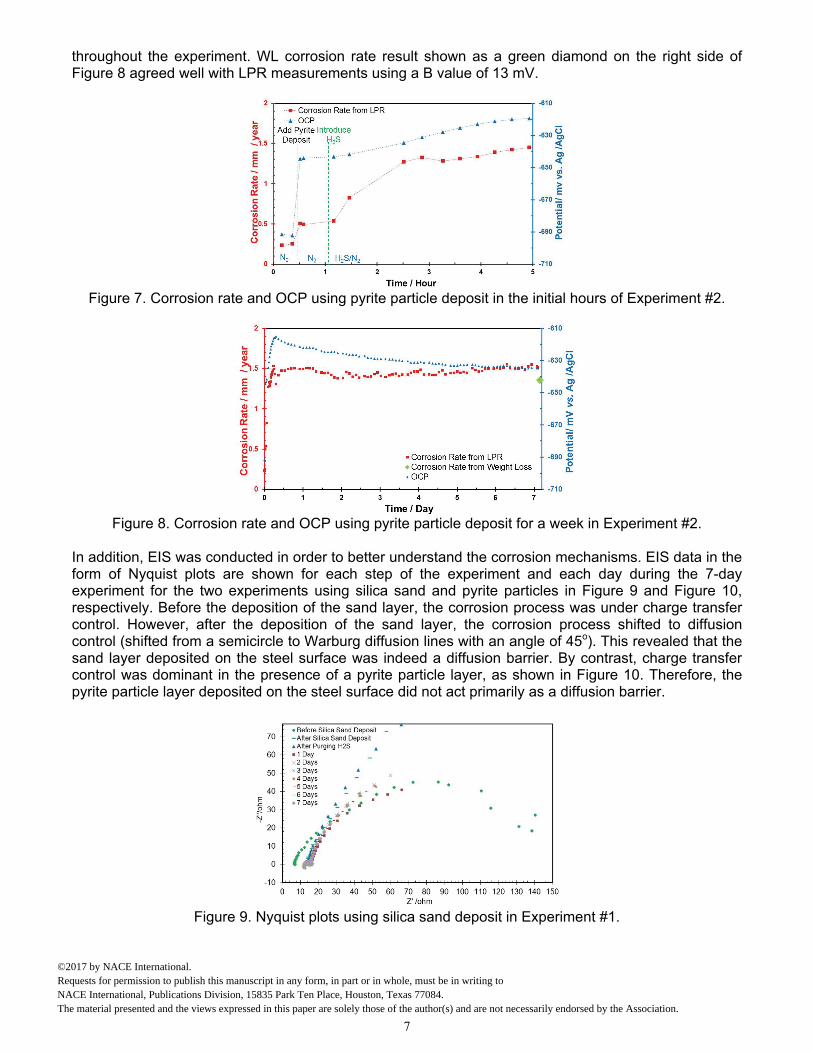
throughout the experiment. WL corrosion rate result shown as a green diamond on the right side of Figure 8 agreed well with LPR measurements using a B value of 13 mV.
Figure 7. Corrosion rate and OCP using pyrite particle deposit in the initial hours of Experiment #2.
Figure 8. Corrosion rate and OCP using pyrite particle deposit for a week in Experiment #2.
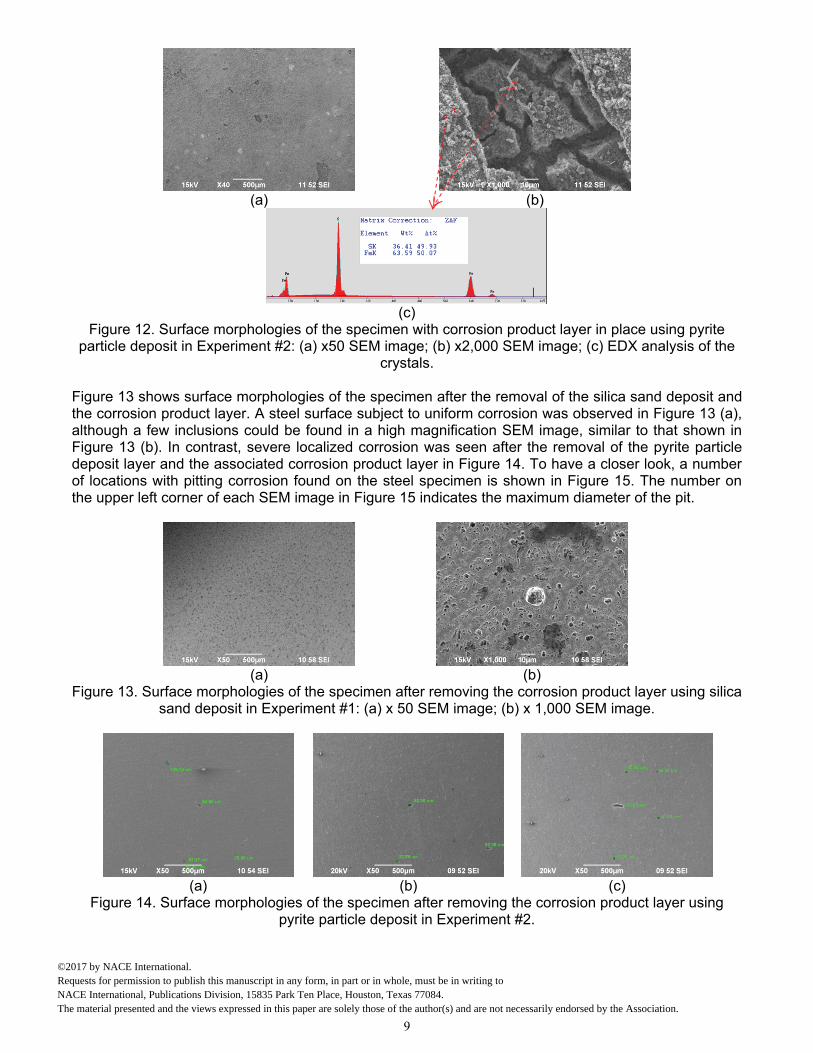
In addition, EIS was conducted in order to better understand the corrosion mechanisms. EIS data in the form of Nyquist plots are shown for each step of the experiment and each day during the 7-day experiment for the two experiments using silica sand and pyrite particles in Figure 9 and Figure 10, respectively. Before the deposition of the sand layer, the corrosion process was under charge transfer control. However, after the deposition of the sand layer, the corrosion process shifted to diffusion control (shifted from a semicircle to Warburg diffusion lines with an angle of 45o). This revealed that the sand layer deposited on the steel surface was indeed a diffusion barrier. By contrast, charge transfer control was dominant in the presence of a pyrite particle layer, as shown in Figure 10. Therefore, the pyrite particle layer deposited on the steel surface did not act primarily as a diffusion barrier.
Figure 9. Nyquist plots using silica sand deposit in Experiment #1.
7
©2017 by NACE International.Requests for permission to publish this manuscript in any form, in part or in whole, must be in writing toNACE International, Publications Division, 15835 Park Ten Place, Houston, Texas 77084.The material presented and the views expressed in this paper are solely those of the author(s) and are not necessarily endorsed by the Association.
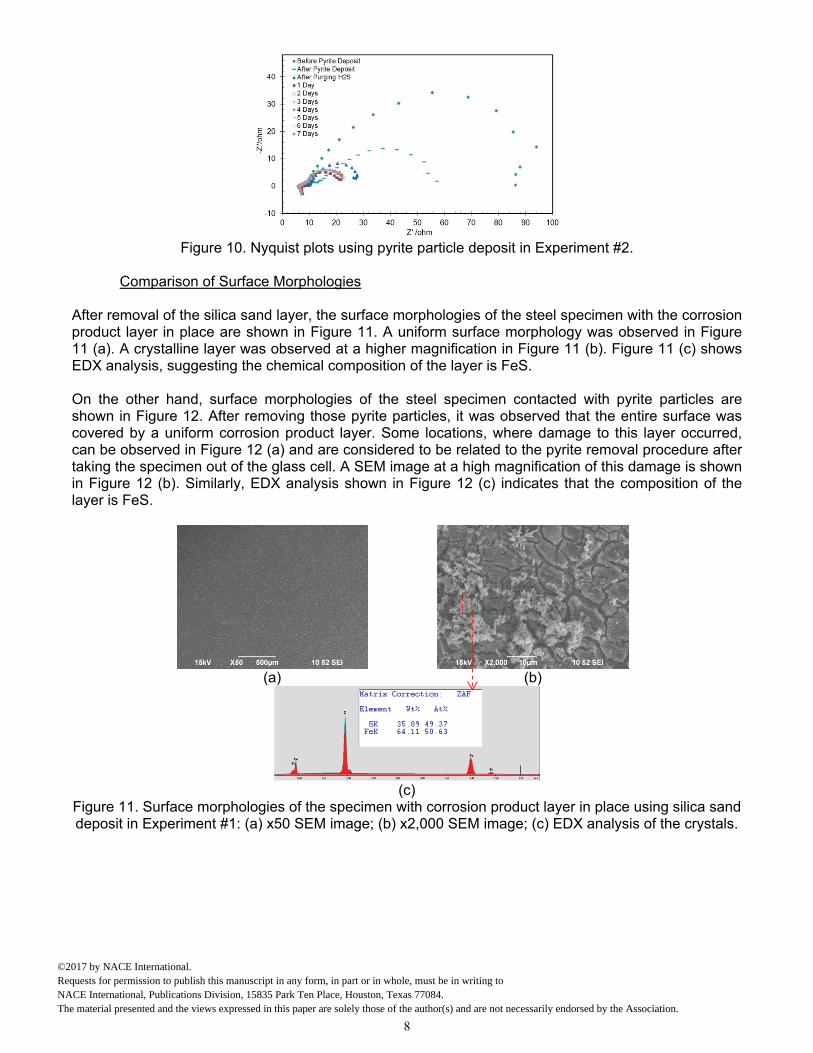
Figure 10. Nyquist plots using pyrite particle deposit in Experiment #2.
Comparison of Surface Morphologies
After removal of the silica sand layer, the surface morphologies of the steel specimen with the corrosion product layer in place are shown in Figure 11. A uniform surface morphology was observed in Figure 11 (a). A crystalline layer was observed at a higher magnification in Figure 11 (b). Figure 11 (c) shows EDX analysis, suggesting the chemical composition of the layer is FeS. On the other hand, surface morphologies of the steel specimen contacted with pyrite particles are shown in Figure 12. After removing those pyrite particles, it was observed that the entire surface was covered by a uniform corrosion product layer. Some locations, where damage to this layer occurred, can be observed in Figure 12 (a) and are considered to be related to the pyrite removal procedure after taking the specimen out of the glass cell. A SEM image at a high magnification of this damage is shown in Figure 12 (b). Similarly, EDX analysis shown in Figure 12 (c) indicates that the composition of the layer is FeS.
(a)
(b)
(c)
Figure 11. Surface morphologies of the specimen with corrosion product layer in place using silica sand deposit in Experiment #1: (a) x50 SEM image; (b) x2,000 SEM image; (c) EDX analysis of the crystals.
8
©2017 by NACE International.Requests for permission to publish this manuscript in any form, in part or in whole, must be in writing toNACE International, Publications Division, 15835 Park Ten Place, Houston, Texas 77084.The material presented and the views expressed in this paper are solely those of the author(s) and are not necessarily endorsed by the Association.
(a)
(b)
(c)
Figure 12. Surface morphologies of the specimen with corrosion product layer in place using pyrite particle deposit in Experiment #2: (a) x50 SEM image; (b) x2,000 SEM image; (c) EDX analysis of the
crystals. Figure 13 shows surface morphologies of the specimen after the removal of the silica sand deposit and the corrosion product layer. A steel surface subject to uniform corrosion was observed in Figure 13 (a), although a few inclusions could be found in a high magnification SEM image, similar to that shown in Figure 13 (b). In contrast, severe localized corrosion was seen after the removal of the pyrite particle deposit layer and the associated corrosion product layer in Figure 14. To have a closer look, a number of locations with pitting corrosion found on the steel specimen is shown in Figure 15. The number on the upper left corner of each SEM image in Figure 15 indicates the maximum diameter of the pit.
(a)
(b)
Figure 13. Surface morphologies of the specimen after removing the corrosion product layer using silica sand deposit in Experiment #1: (a) x 50 SEM image; (b) x 1,000 SEM image.
(a) (b) (c)
Figure 14. Surface morphologies of the specimen after removing the corrosion product layer using pyrite particle deposit in Experiment #2.
9
©2017 by NACE International.Requests for permission to publish this manuscript in any form, in part or in whole, must be in writing toNACE International, Publications Division, 15835 Park Ten Place, Houston, Texas 77084.The material presented and the views expressed in this paper are solely those of the author(s) and are not necessarily endorsed by the Association.

Figure 15. Locations of localized corrosion on the specimen using pyrite particle deposit in
Experiment#2. After removing the corrosion product layer, some areas on steel specimens were arbitrarily selected for profilometry analysis to reveal any additional features across the surface. Profilometry of the specimen using the sand deposit is shown in Figure 16 (a) and the maximum pitting depth, 10 µm, found on the specimen is shown in Figure 16 (c). In general, uniform corrosion, with a just few inclusions, was seen on specimens that had sand deposits. However, many pits with a much greater depth were seen on the surface that was covered with pyrite, as shown in Figure 16 (b). Figure 16 (d) shows a maximum pitting depth of 135 µm found on the specimen. Figure 17 shows a comparison of corrosion rates between silica sand and pyrite deposits. The general corrosion rate was obtained from weight loss results, and the maximum localized corrosion rate was converted from the maximum pitting depth. Clearly, both general corrosion rate and pit penetration rate were accelerated dramatically in the presence of pyrite particles. The time averaged pit penetration rate was up to 7 mm/year during the 7 days of exposure in the presence of pyrite particle layers.
(a)
(b)
(c)
(d)
Figure 16. (a) Profilometry feature with sand deposit in Experiment #1; (b) Profilometry feature with pyrite deposit in Experiment #2; (c) Maximum pit depth with sand deposit in Experiment #1; (d)
Maximum pit depth with pyrite deposit in Experiment #2.
10
©2017 by NACE International.Requests for permission to publish this manuscript in any form, in part or in whole, must be in writing toNACE International, Publications Division, 15835 Park Ten Place, Houston, Texas 77084.The material presented and the views expressed in this paper are solely those of the author(s) and are not necessarily endorsed by the Association.
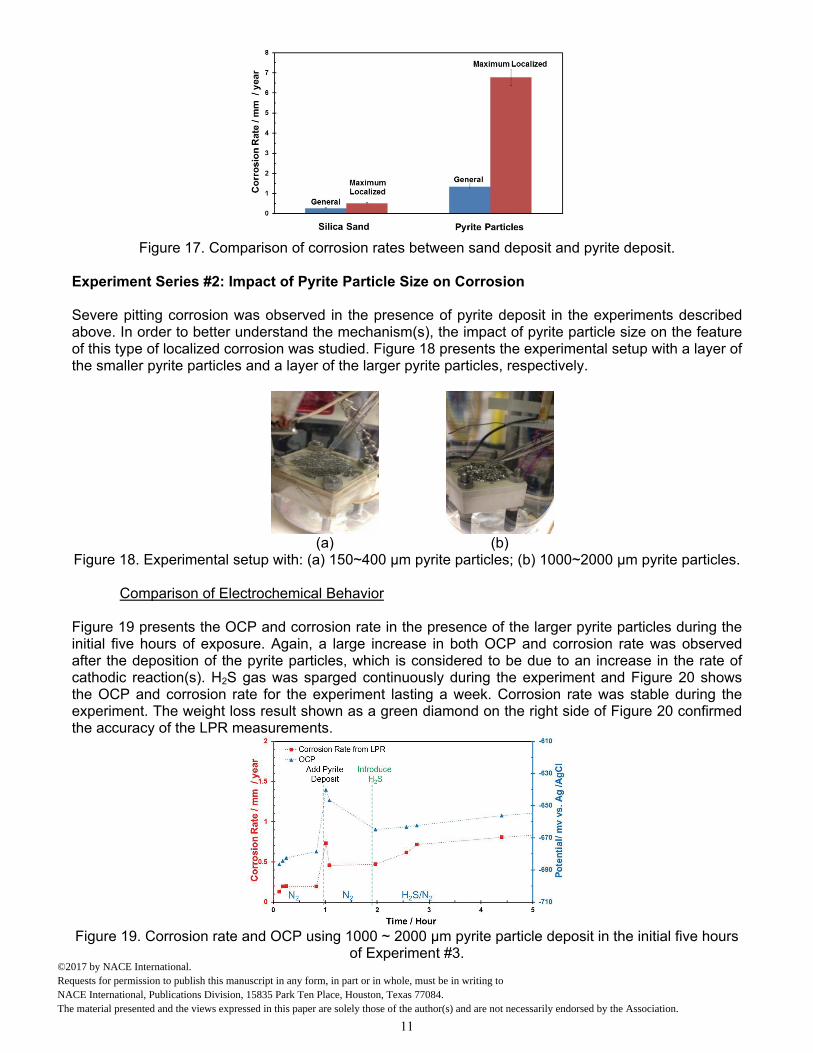
Figure 17. Comparison of corrosion rates between sand deposit and pyrite deposit.
Experiment Series #2: Impact of Pyrite Particle Size on Corrosion Severe pitting corrosion was observed in the presence of pyrite deposit in the experiments described above. In order to better understand the mechanism(s), the impact of pyrite particle size on the feature of this type of localized corrosion was studied. Figure 18 presents the experimental setup with a layer of the smaller pyrite particles and a layer of the larger pyrite particles, respectively.
(a)
(b)
Figure 18. Experimental setup with: (a) 150~400 µm pyrite particles; (b) 1000~2000 µm pyrite particles.
Comparison of Electrochemical Behavior Figure 19 presents the OCP and corrosion rate in the presence of the larger pyrite particles during the initial five hours of exposure. Again, a large increase in both OCP and corrosion rate was observed after the deposition of the pyrite particles, which is considered to be due to an increase in the rate of cathodic reaction(s). H2S gas was sparged continuously during the experiment and Figure 20 shows the OCP and corrosion rate for the experiment lasting a week. Corrosion rate was stable during the experiment. The weight loss result shown as a green diamond on the right side of Figure 20 confirmed the accuracy of the LPR measurements.
Figure 19. Corrosion rate and OCP using 1000 ~ 2000 µm pyrite particle deposit in the initial five hours
of Experiment #3.
11
©2017 by NACE International.Requests for permission to publish this manuscript in any form, in part or in whole, must be in writing toNACE International, Publications Division, 15835 Park Ten Place, Houston, Texas 77084.The material presented and the views expressed in this paper are solely those of the author(s) and are not necessarily endorsed by the Association.
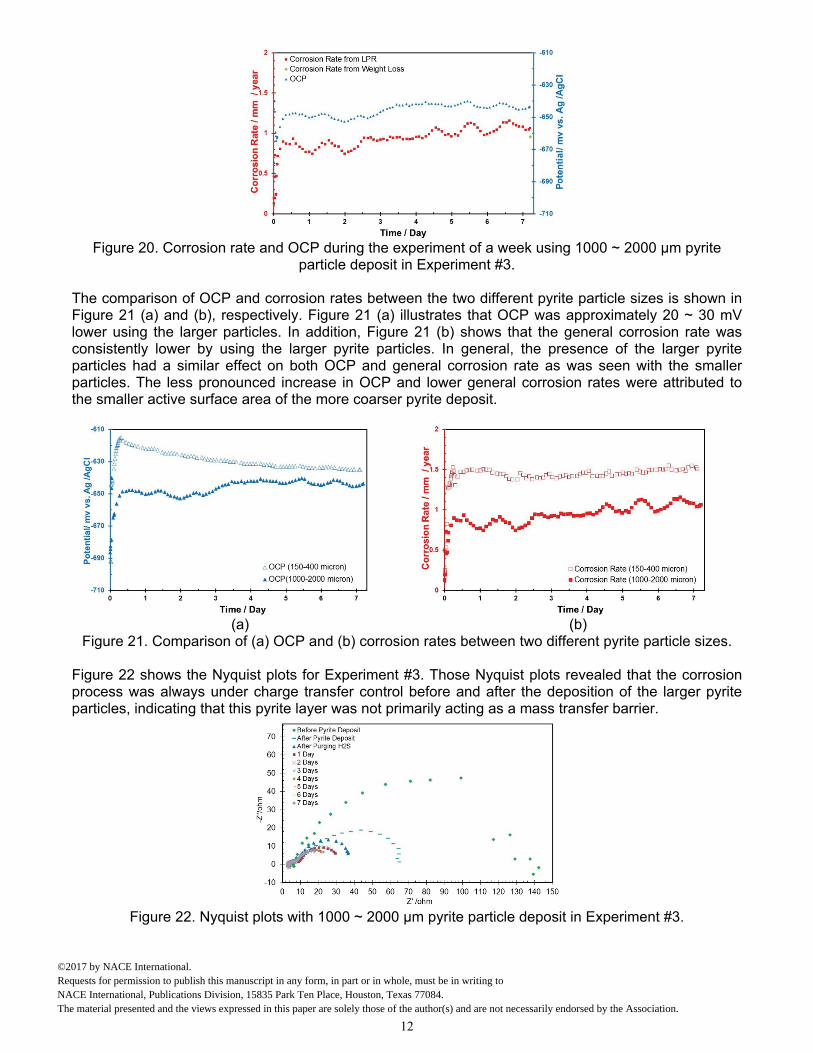
Figure 20. Corrosion rate and OCP during the experiment of a week using 1000 ~ 2000 µm pyrite
particle deposit in Experiment #3.
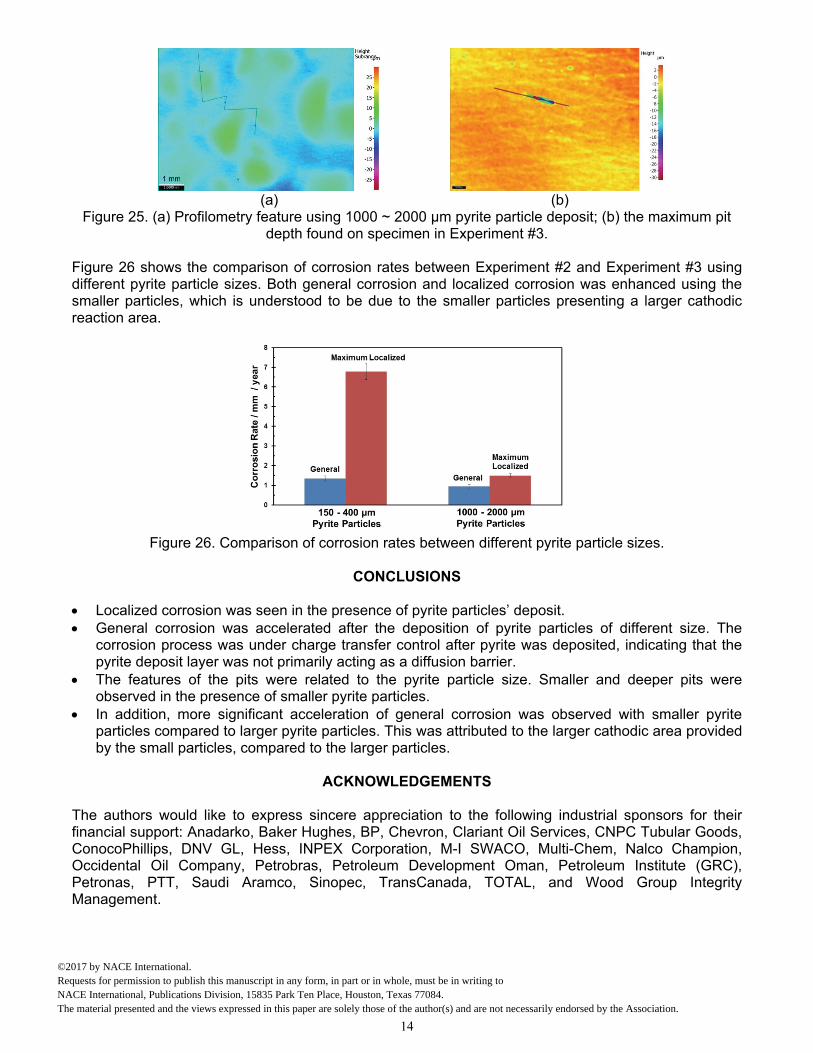
The comparison of OCP and corrosion rates between the two different pyrite particle sizes is shown in Figure 21 (a) and (b), respectively. Figure 21 (a) illustrates that OCP was approximately 20 ~ 30 mV lower using the larger particles. In addition, Figure 21 (b) shows that the general corrosion rate was consistently lower by using the larger pyrite particles. In general, the presence of the larger pyrite particles had a similar effect on both OCP and general corrosion rate as was seen with the smaller particles. The less pronounced increase in OCP and lower general corrosion rates were attributed to the smaller active surface area of the more coarser pyrite deposit.
(a) (b) Figure 21. Comparison of (a) OCP and (b) corrosion rates between two different pyrite particle sizes.
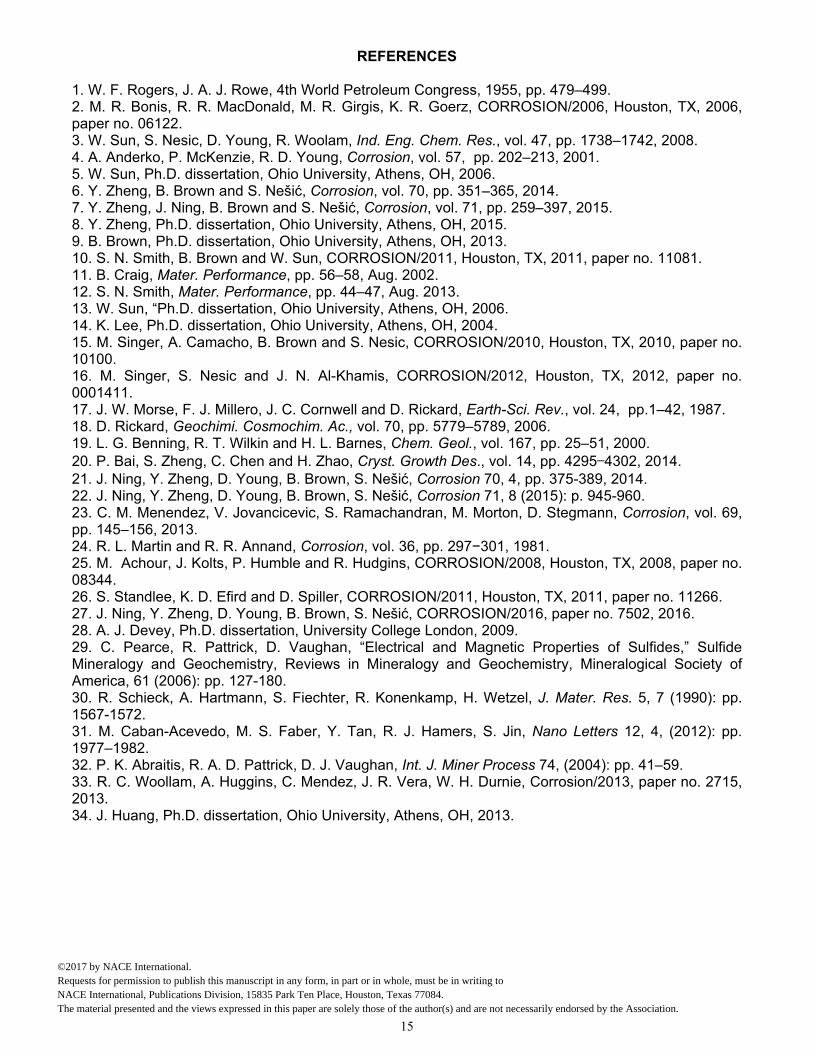
Figure 22 shows the Nyquist plots for Experiment #3. Those Nyquist plots revealed that the corrosion process was always under charge transfer control before and after the deposition of the larger pyrite particles, indicating that this pyrite layer was not primarily acting as a mass transfer barrier.
Figure 22. Nyquist plots with 1000 ~ 2000 µm pyrite particle deposit in Experiment #3.
12
©2017 by NACE International.Requests for permission to publish this manuscript in any form, in part or in whole, must be in writing toNACE International, Publications Division, 15835 Park Ten Place, Houston, Texas 77084.The material presented and the views expressed in this paper are solely those of the author(s) and are not necessarily endorsed by the Association.

Comparison of Surface Morphologies Figure 23 presents surface morphology of the steel specimen with the corrosion product layer in place using the larger pyrite particles. A uniform layer was seen in Figure 23 (a), (b), and (c), and EDX analysis on this layer indicated FeS in Figure 23 (d). The corrosion product layer was removed to reveal the corroded steel surface underneath. Figure 24 shows some locations of localized corrosion; it is noteworthy that the pits were consistently elongated. Compared with the localized corrosion associated with the smaller pyrite particles shown in Figure 15, the pits associated with the larger pyrite particles appear to be larger. Moreover, Figure 25 (a) shows the profilometry image of this specimen after removing the corrosion product layer and Figure 25 (b) shows the maximum pitting depth found on the specimen. Compared to the profilometry of the specimen using the smaller pyrite particles in Figure 16 (b), the pits appeared to be shallower in the presence of the larger pyrite particles.
(a)
(b)
(c)
(d)
Figure 23. Surface morphologies of the specimen with the corrosion product layer in place using 1000 ~ 2000 µm pyrite particle deposit in Experiment #3: (a) x 50 SEM image; (b) x 1,000 SEM image; (c) x
5,000 SEM image; (d) EDX analysis of crystals.
Figure 24. Locations of localized attack on the specimen using 1000 ~ 2000 µm pyrite particle deposit
in Experiment #3.
13
©2017 by NACE International.Requests for permission to publish this manuscript in any form, in part or in whole, must be in writing toNACE International, Publications Division, 15835 Park Ten Place, Houston, Texas 77084.The material presented and the views expressed in this paper are solely those of the author(s) and are not necessarily endorsed by the Association.
(a)
(b)
Figure 25. (a) Profilometry feature using 1000 ~ 2000 µm pyrite particle deposit; (b) the maximum pit depth found on specimen in Experiment #3.
Figure 26 shows the comparison of corrosion rates between Experiment #2 and Experiment #3 using different pyrite particle sizes. Both general corrosion and localized corrosion was enhanced using the smaller particles, which is understood to be due to the smaller particles presenting a larger cathodic reaction area.
Figure 26. Comparison of corrosion rates between different pyrite particle sizes.
CONCLUSIONS
Localized corrosion was seen in the presence of pyrite particles’ deposit. General corrosion was accelerated after the deposition of pyrite particles of different size. The
corrosion process was under charge transfer control after pyrite was deposited, indicating that the pyrite deposit layer was not primarily acting as a diffusion barrier.
The features of the pits were related to the pyrite particle size. Smaller and deeper pits were observed in the presence of smaller pyrite particles.
In addition, more significant acceleration of general corrosion was observed with smaller pyrite particles compared to larger pyrite particles. This was attributed to the larger cathodic area provided by the small particles, compared to the larger particles.
ACKNOWLEDGEMENTS
The authors would like to express sincere appreciation to the following industrial sponsors for their financial support: Anadarko, Baker Hughes, BP, Chevron, Clariant Oil Services, CNPC Tubular Goods, ConocoPhillips, DNV GL, Hess, INPEX Corporation, M-I SWACO, Multi-Chem, Nalco Champion, Occidental Oil Company, Petrobras, Petroleum Development Oman, Petroleum Institute (GRC), Petronas, PTT, Saudi Aramco, Sinopec, TransCanada, TOTAL, and Wood Group Integrity Management.
14
©2017 by NACE International.Requests for permission to publish this manuscript in any form, in part or in whole, must be in writing toNACE International, Publications Division, 15835 Park Ten Place, Houston, Texas 77084.The material presented and the views expressed in this paper are solely those of the author(s) and are not necessarily endorsed by the Association.
REFERENCES 1. W. F. Rogers, J. A. J. Rowe, 4th World Petroleum Congress, 1955, pp. 479–499. 2. M. R. Bonis, R. R. MacDonald, M. R. Girgis, K. R. Goerz, CORROSION/2006, Houston, TX, 2006, paper no. 06122. 3. W. Sun, S. Nesic, D. Young, R. Woolam, Ind. Eng. Chem. Res., vol. 47, pp. 1738–1742, 2008. 4. A. Anderko, P. McKenzie, R. D. Young, Corrosion, vol. 57, pp. 202–213, 2001. 5. W. Sun, Ph.D. dissertation, Ohio University, Athens, OH, 2006. 6. Y. Zheng, B. Brown and S. Nešić, Corrosion, vol. 70, pp. 351–365, 2014. 7. Y. Zheng, J. Ning, B. Brown and S. Nešić, Corrosion, vol. 71, pp. 259–397, 2015. 8. Y. Zheng, Ph.D. dissertation, Ohio University, Athens, OH, 2015. 9. B. Brown, Ph.D. dissertation, Ohio University, Athens, OH, 2013. 10. S. N. Smith, B. Brown and W. Sun, CORROSION/2011, Houston, TX, 2011, paper no. 11081. 11. B. Craig, Mater. Performance, pp. 56–58, Aug. 2002. 12. S. N. Smith, Mater. Performance, pp. 44–47, Aug. 2013. 13. W. Sun, “Ph.D. dissertation, Ohio University, Athens, OH, 2006. 14. K. Lee, Ph.D. dissertation, Ohio University, Athens, OH, 2004. 15. M. Singer, A. Camacho, B. Brown and S. Nesic, CORROSION/2010, Houston, TX, 2010, paper no. 10100. 16. M. Singer, S. Nesic and J. N. Al-Khamis, CORROSION/2012, Houston, TX, 2012, paper no. 0001411. 17. J. W. Morse, F. J. Millero, J. C. Cornwell and D. Rickard, Earth-Sci. Rev., vol. 24, pp.1–42, 1987. 18. D. Rickard, Geochimi. Cosmochim. Ac., vol. 70, pp. 5779–5789, 2006. 19. L. G. Benning, R. T. Wilkin and H. L. Barnes, Chem. Geol., vol. 167, pp. 25–51, 2000. 20. P. Bai, S. Zheng, C. Chen and H. Zhao, Cryst. Growth Des., vol. 14, pp. 4295−4302, 2014. 21. J. Ning, Y. Zheng, D. Young, B. Brown, S. Nešić, Corrosion 70, 4, pp. 375-389, 2014. 22. J. Ning, Y. Zheng, D. Young, B. Brown, S. Nešić, Corrosion 71, 8 (2015): p. 945-960. 23. C. M. Menendez, V. Jovancicevic, S. Ramachandran, M. Morton, D. Stegmann, Corrosion, vol. 69, pp. 145–156, 2013. 24. R. L. Martin and R. R. Annand, Corrosion, vol. 36, pp. 297−301, 1981. 25. M. Achour, J. Kolts, P. Humble and R. Hudgins, CORROSION/2008, Houston, TX, 2008, paper no. 08344. 26. S. Standlee, K. D. Efird and D. Spiller, CORROSION/2011, Houston, TX, 2011, paper no. 11266. 27. J. Ning, Y. Zheng, D. Young, B. Brown, S. Nešić, CORROSION/2016, paper no. 7502, 2016. 28. A. J. Devey, Ph.D. dissertation, University College London, 2009. 29. C. Pearce, R. Pattrick, D. Vaughan, “Electrical and Magnetic Properties of Sulfides,” Sulfide Mineralogy and Geochemistry, Reviews in Mineralogy and Geochemistry, Mineralogical Society of America, 61 (2006): pp. 127-180. 30. R. Schieck, A. Hartmann, S. Fiechter, R. Konenkamp, H. Wetzel, J. Mater. Res. 5, 7 (1990): pp. 1567-1572. 31. M. Caban-Acevedo, M. S. Faber, Y. Tan, R. J. Hamers, S. Jin, Nano Letters 12, 4, (2012): pp. 1977–1982. 32. P. K. Abraitis, R. A. D. Pattrick, D. J. Vaughan, Int. J. Miner Process 74, (2004): pp. 41–59. 33. R. C. Woollam, A. Huggins, C. Mendez, J. R. Vera, W. H. Durnie, Corrosion/2013, paper no. 2715, 2013. 34. J. Huang, Ph.D. dissertation, Ohio University, Athens, OH, 2013.
15
©2017 by NACE International.Requests for permission to publish this manuscript in any form, in part or in whole, must be in writing toNACE International, Publications Division, 15835 Park Ten Place, Houston, Texas 77084.The material presented and the views expressed in this paper are solely those of the author(s) and are not necessarily endorsed by the Association.


![Combined Corrosion and Wear of Aluminium Alloy 7075-T6 · 2017. 8. 28. · Many researchers have studied the localized corrosion of AA7075-T6 [7, 9–12]. The susceptibility, to localized](https://img.pdfslide.us/doc/110x75/6117227e83526d73256dd28f/combined-corrosion-and-wear-of-aluminium-alloy-7075-t6-2017-8-28-many-researchers.jpg)