Embed Size (px)
Citation preview
WP/06/110
The Role of Interest Rates in Business Cycle Fluctuations in Emerging Market
Countries: The Case of Thailand
Ivan Tchakarov and Selim Elekdag

© 2006 International Monetary Fund WP/06/110
IMF Working Paper
Asia and Pacific Department
The Role of Interest Rates in Business Cycle Fluctuations in Emerging Market Countries: The Case of Thailand
Prepared by Ivan Tchakarov and Selim Elekdag1
Authorized for distribution by Nissanke Weerasinghe
May 2006
Abstract
This Working Paper should not be reported as representing the views of the IMF. The views expressed in this Working Paper are those of the author(s) and do not necessarily represent those of the IMF or IMF policy. Working Papers describe research in progress by the author(s) and are published to elicit comments and to further debate.
Emerging market countries have enjoyed an exceptionally favorable economic environment throughout 2004, 2005, and early 2006. In particular, accommodative U.S. monetary policy in recent years has helped create an environment of low interest rates in international capital markets. However, if world interest rates were to take a sudden upward course, this would lead to less hospitable financing conditions for emerging market countries. The purpose of this paper is to measure the effects of world interest rate shocks on real activity in Thailand. The analysis incorporates balance sheet related credit market frictions into the IMF’s Global Economy Model (GEM) and finds that Thailand would best minimize the adverse effects of rising world interest rates if it were to follow a flexible exchange rate regime. JEL Classification Numbers: F41, F42 Keywords: Exchange rate regimes; Global Economy Model (GEM); financial accelerator;
balance sheets; Thailand Author(s) E-Mail Address: [email protected], [email protected]
1 Ivan Tchakarov is an Economist in the Asia and Pacific Department and Selim Elekdag is an Economist in the Research Department. The authors are grateful to Nissanke Weerasinghe, Giovanni Dell’Ariccia, and the Bank of Thailand for comments and useful discussions.
- 2 -
Contents Page I. Introduction...................................................................................................................3 II. Interest Rates and Busines Cycles ................................................................................4 III. The Global Economy Model with the Financial Accelerator .......................................5 A. Extending the Global Economy Model ...................................................................6 B. Model Calibration ....................................................................................................7 IV. The Effects of a 1 Percent U.S. Interest Rate Hike ......................................................9 V. A Repeat of the Global Bond Market Rout of 1994?..... ............................................10 A. U.S. Monetary Policy and EMC Spreads ..............................................................11 B. A Sudden Decrease in Global Liquidity ................................................................11 VI. What Role for Monetary Policy?................................................................................13 VI. Conclusion ..................................................................................................................14 Tables 1. Correlation of Real Interest Rates with GDP..............................................................4 2. Model Calibration ......................................................................................................8 3. Cumulative Losses from a 1 Percent U.S. Interest Rate... ........................................10 4. Cumulative Losses in Thailand from a 2 Percent Interest Rate Hike in the ................ United States... ..........................................................................................................12 5. Cumulative Losses in Thailand Under Three Different Exchange Rate Regimes....13 Figures 1. Real Interest Rates and GDP in Emerging Markets Countries..... ............................16 2. Real Interest Rates and GDP in Developed Markets..... ...........................................17 3. Cross Correlations Between Real Interest Rates and GDP in Emerging Markets and Developed Economies........................................................................................18 4. Simple GEM Structure..............................................................................................19 5. Impulse Response Functions in Thailand to a 1 Percent Interest Rate Shock in the United States... ................................................................................................20 6. Impulse Response Functions in Thailand to a 2 Percent Interest Rate Shock in the United States Lasting for Four Quarters...... ...................................................21 7. Impulse Response Functions in Thailand to a 2 Percent Interest Rate Shock in the United States Under Three Different Exchange Rate Regimes..... ...........................22 References..........................................................................................................................15
- 3 -
I. INTRODUCTION
Emerging market countries have enjoyed an exceptionally favorable economic environment throughout 2004, 2005, and early 2006. Solid global growth, a broadening investor base, and soaring asset prices buoyed by abundant global liquidity have dramatically suppressed credit spreads. Moreover, accommodative U.S. monetary policy in recent years has helped create an environment of low interest rates in international capital markets. However, if world interest rates were to take a sudden upward course, this would increase the cost of borrowing for emerging market countries (EMCs), and lead to less hospitable financing conditions for them. The purpose of this paper is to measure the effects of world interest rate shocks on real activity in Thailand.
Thailand, of course, is not the only EMC that would be affected by higher U.S. interest rates. Our analysis could certainly be applied to a wider pool of EMCs—not only in the Asia Pacific region—but also throughout the world. There is, however, one main reason why this paper uses Thailand as a case study. After the Federal Reserve initiated its most recent tightening cycle in August 2004, Thailand became the first country in the Asia Pacific region to begin increasing interest rates. Therefore, the issue of how this recent rise in international interest rates may affect the domestic economy arose first in Thailand.
This paper employs the Global Economy Model (GEM) developed by the Research Department of the IMF. We extend GEM by incorporating balance sheet related credit market frictions and investigate how various exchange rate regimes affect the impact of foreign interest rate shocks on the Thai economy. This paper finds that Thailand would best minimize the adverse effects of rising world interest rates by implementing a flexible exchange rate regime.
The paper is organized as follows. Section II describes the importance of interest rates in determining business cycles in EMCs. Section III provides an overview of the model and its calibration. Section IV describes the effects of a 1 percent U.S. interest rate blip on the Thai economy. Section V discusses an experiment that resembles the global bond market rout of 1994. Section VI assumes a more prolonged U.S. interest rate hike when Thailand is calibrated to be more vulnerable than in the baseline case. Finally, Section VII concludes.

- 4 -
II. INTEREST RATES AND BUSINESS CYCLES
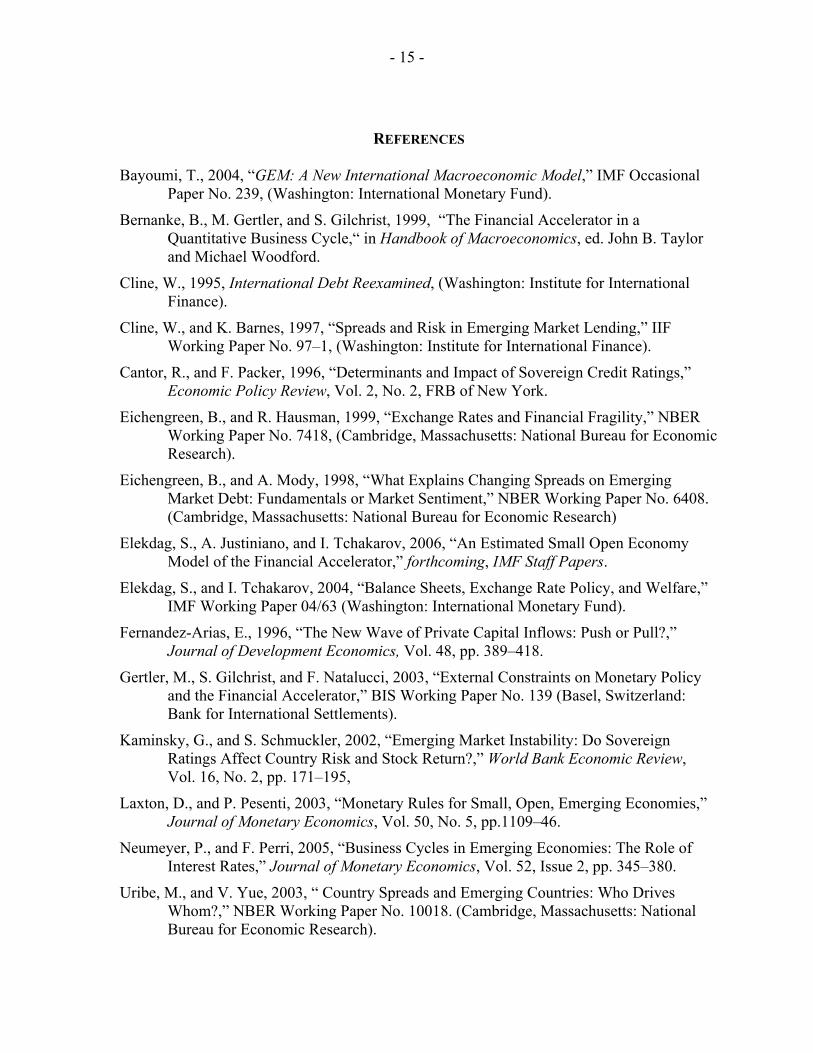
Interest rates are a key determinant of business cycles in EMCs. Over the last decade, many EMCs have coped with frequent and large changes in the interest rates that they face in international financial markets. These changes have usually been associated with significant business cycles fluctuations. This observation is illustrated in Figure 1, which graphs output and country interest rates for six EMCs.2 Periods of low interest rates are typically coupled with relatively rapid economic expansion, whereas times of high interest rates are often associated with lower growth.
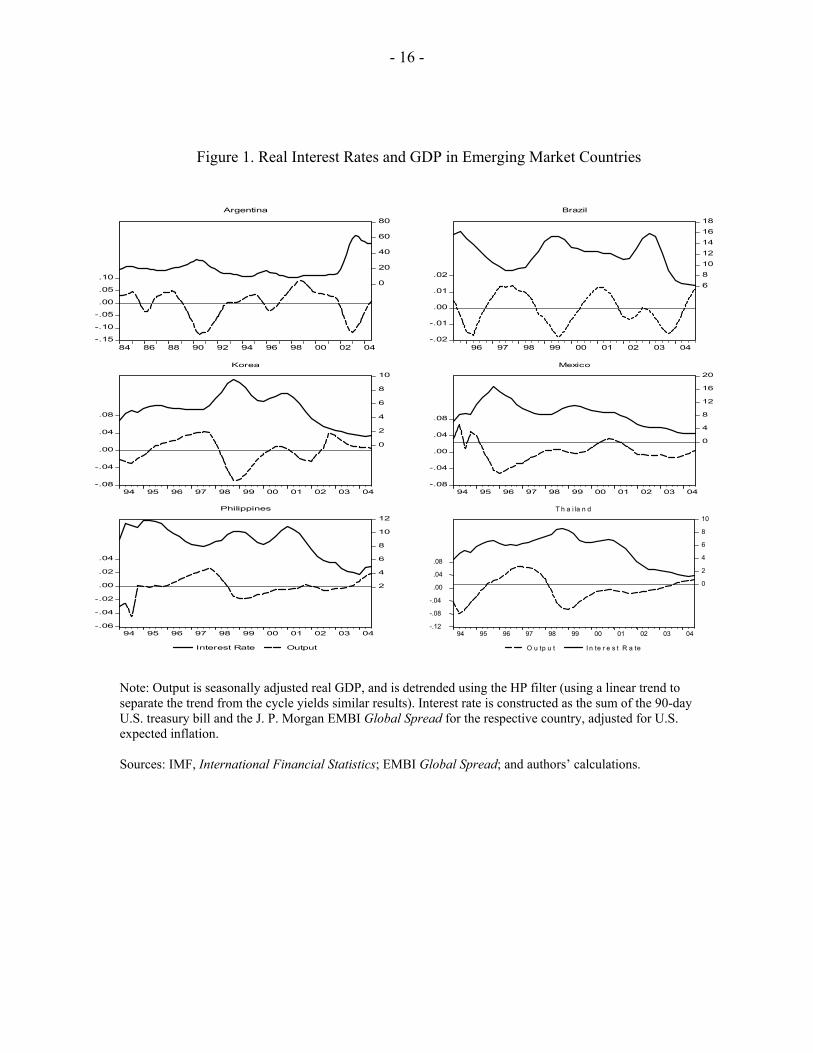
The link between interest rates and output in EMCs is markedly different from that in developed economies. While the previous figure demonstrates that interest rates in EMCs are clearly countercyclical, in the developed countries interest rates are at best acyclical. Figure 2 depicts this relationship for four small open developed countries. This point is further reinforced by the correlation coefficient estimates for these countries shown in Table 1.
Table 1. Correlation of Real Interest Rates with GDP
Emerging Economies
Argentina Brazil Mexico Korea Philippines Thailand -0.64 -0.41 -0.24 -0.49 -0.31 -0.14
Developed Economies
Australia Canada Sweden New Zealand 0.30 0.32 0.00 0.18
Source: Authors’ calculations.
Why is the impact of interest rates different in EMCs and developed economies? Theoretical models usually find that interest rates are not a key determinant of business cycle fluctuations for developed economies. Moreover, in these models, interest rates exhibit either acyclical or procyclical patters, which accords well with the findings of Figure 2.
2 We should note that, as in Neumeyer and Perri (2005), country interest rates include the U.S. interest rate plus individual countries’ EMBI spreads.
- 5 -
In contrast, Neumeyer and Perri (2005) develop a business cycle model that is consistent with the empirical regularities observed in EMCs. The key feature is that firms have to pay for factors of production before production takes place. The need for working capital makes labor demand sensitive to interest rates fluctuations. If interest rates increase, working capital becomes more expensive and firms tend to reduce their demand for labor. In addition, the utility function specification ensures that labor supply is independent of interest rate fluctuations. This guarantees that falling labor demand leads to a lower level of equilibrium output.
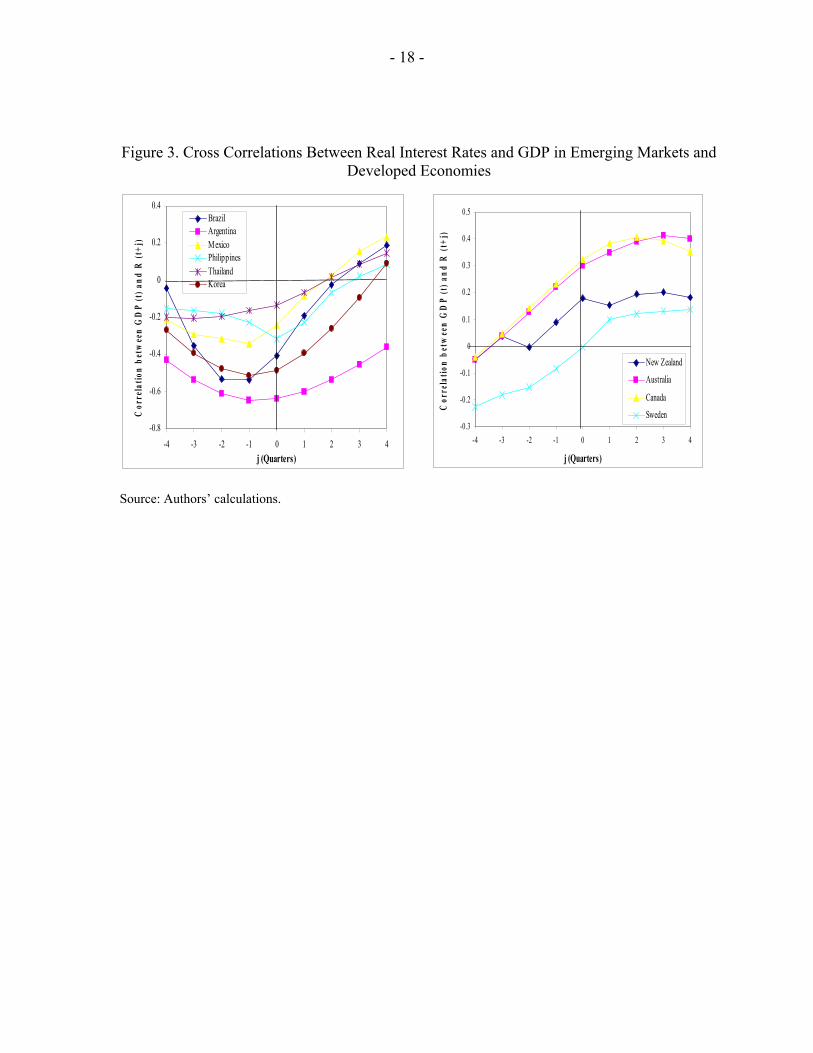
In addition, real interest rates in EMCs lead the cycle, whereas in developed economies interest rates lag the cycle. This point is illustrated in Figure 3, which shows the cross correlations between GDP and interest rates for both groups of countries. EMCs depict a distinctive U-shaped pattern, whereas in developed countries, the cross correlations exhibit a concave shape and are less synchronized.
III. THE GLOBAL ECONOMY MODEL WITH THE FINANCIAL ACCELERATOR
The Global Economy Model (GEM) is a new type of policy model based on strong microeconomic foundations, in which consumers and firms maximize utility and profits, respectively.3 The policy model of choice in the IMF over the last two decades was MULTIMOD. While MULTIMOD is able to generate realistic dynamic responses to cyclical disturbances, its lack of solid theoretical foundations makes it susceptible to the “Lucas critique.” In particular, policy analysis using reduced-form equations that fit the data but are only loosely tied to theory cannot, among other things, properly account for resulting shifts in behavior. GEM, on the other hand, combines production, consumption, trade, nominal and real rigidities, as well as international financial markets in a coherent theoretical framework.
GEM has many important strengths. First, GEM can study policies in a general equilibrium setting, thus taking into account the full range of interactions between consumers and producers as well as linkages across sectors and countries. Second, the costs and benefits of a policy can be measured directly by the impact on consumer welfare, rather than by using less accurate and more ad hoc proxies of welfare. Third, GEM has a very flexible structure, so that one can include or exclude features easily in accordance with the issue at hand.
However, moving to a model with tight theoretical structure may impose some limitations. First, models are not easy to build and run. Second, the need to create a large interlinked structure occasionally constrains theoretical specifications and hence model properties.4 Third, calibration is time-consuming, as the model concepts do not dovetail with existing
3 For details, see Bayoumi (2004).
4 For example, since the model is based on a single representative consumer, it cannot be used to address issues of income distribution.
- 6 -
data.5 Fourth, the capital account is not richly modeled and, therefore, issues related to capital flows are given only a cursory consideration.
A. Extending the Global Economy Model
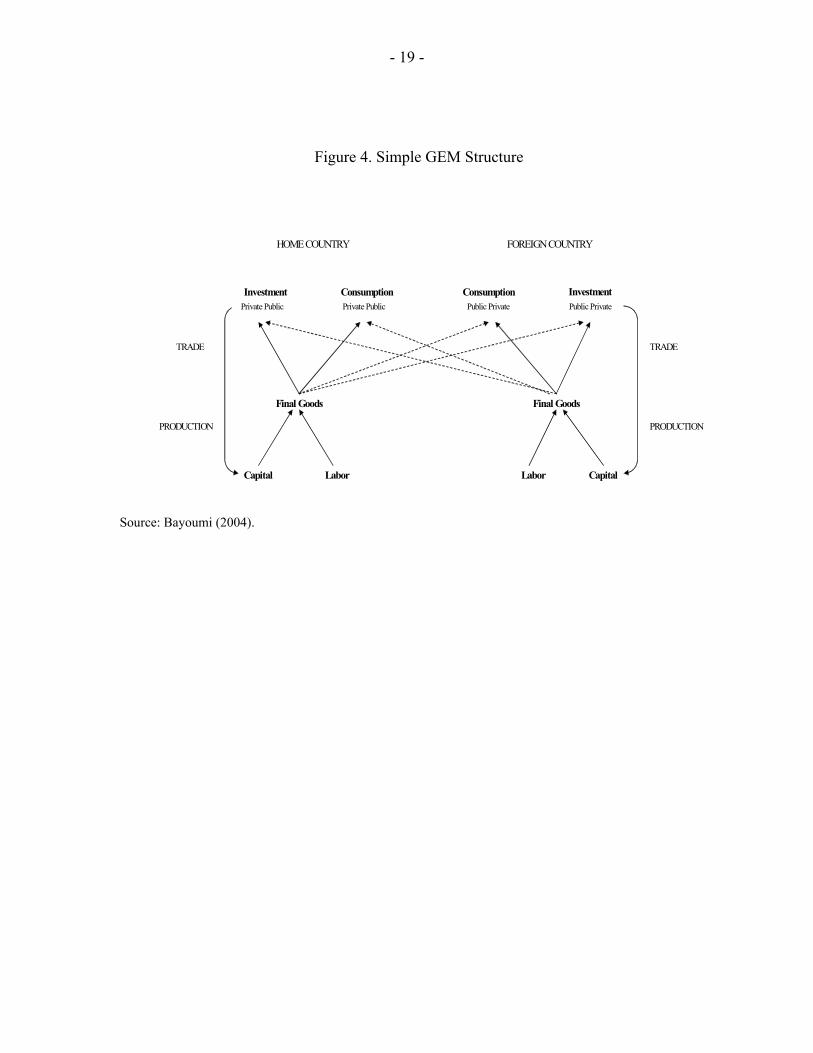
Figure 4 displays the simplest version of a two-country GEM structure.6 Labor and capital are combined to produce a single type of tradable good that can be used for consumption or investment. Given the preferences of consumers, firms, and the government, these goods are then distributed across countries.
We extend the basic version of GEM in two ways. First, we allow for balance sheet related credit market frictions. As will be discussed in detail below, this creates a valuation channel that amplifies the impact of external shocks on the domestic economy. Second, we add another country, which we call the “Rest of the World” (RoW). This third country, among other things, allows a more realistic calibration of international financial and trade linkages.
One of the key features of our model is that the foreign interest rate is the sum of the world interest rate, plus a country-specific external finance premium. In the context of EMCs, hikes to world interest rates do not usually translate into equivalent movements in country interest rates due to the presence of country risk premia. These premia may also be positively related to world interest rates, and may therefore amplify the interest rate cycle initiated by industrial countries.7 The attempt to analyze the relationship between interest rates and real activity is also complicated by the fact that these premia respond systematically and countercyclically to business conditions in EMCs.8
Against this backdrop, our model endogenizes the risk premium by assuming that it is inversely related to the conditions of the domestic economy’s balance sheets. For example, if a shock triggers a decline in asset prices, this lowers the value of firm equity, thereby increasing the debt-to-equity ratio and thus raises the risk premium. In other words, it becomes increasingly difficult for an EMC to finance investment when the country faces unfavorable shocks, thus generating a vicious cycle.
5 For example, it is not easy to split output into traded and nontraded goods or to determine the role of commodities and semifinished goods in production.
6 For a full technical description of GEM, see Laxton and Pesenti (2003).
7 Evidence in support of this notion can be found in Fernandez-Arias (1996), Kaminsky and Schmukler (2002), and Uribe and Yue (2003).
8 See, for example, Cline (1995), Cline and Barnes (1997), Cantor and Packer (1996), and Eichengreen and Mody (1998).
- 7 -
We formally model these credit market frictions by incorporating the financial accelerator into GEM.9 The financial accelerator captures two salient features of EMCs that complicate the conduct of monetary policy. First, these countries can typically borrow only in foreign currency denominations, a phenomenon labeled “original sin.”10 Second, EMCs usually have imperfect access to capital markets. Foreign credit is typically associated with an external finance premium which is linked to the condition of borrower balance sheets. Through the impact on the balance sheets of an EMC, these credit market frictions may substantially magnify the effects of shocks to the economy.11
Balance sheets and the financial accelerator
The financial accelerator mechanism amplifies the effects of shocks to world interest rate on the domestic economy. Adjusted for expected exchange rate movements, the domestic interest rate is the sum of the foreign interest rate plus the risk premium. Therefore, interest rate hikes in the foreign country induce interest rate increases in the domestic economy. Owing to nominal rigidities, this also leads to a rise in the real domestic interest rate, which in turn, engenders a contraction in real activity. Furthermore, the fall in asset prices generated by the output drop increases the debt-to-equity ratio, thereby raising the premium. This additional channel further suppresses consumption, investment, and production beyond the initial impact caused by the foreign interest rate hike.12
B. Model Calibration
The long-run properties of the model are calibrated to Thailand, the United States, and the Rest of the World (RoW). Table 2 below provides a summary of the key steady state ratios calibrated using 2004 annual data. Size is based on a simple average of the shares of these countries relative to world population and real GDP. Thailand makes up one percent, the United States 19 percent, and RoW 80 percent of the world. Consumption- and investment-to-GDP ratios for Thailand and United States are calculated from national accounts data. Since the precise computation of these ratios for the RoW would require aggregating all 9 The closed economy version of the financial accelerator was developed by Bernanke, Gertler, and Gilchrist (1999).
10 For details, see Eichengreen and Hausman (1999).
11 Elekdag, Justiniano, and Tchakarov (2006), provide empirical evidence supporting the inclusion of the financial accelerator into models attempting to capture these key EMC features.
12 Furthermore, in the context of a flexible exchange rate regime, an increase in the foreign interest rate would induce a depreciation of the domestic currency. Given balance sheets with currency mismatches, the depreciation would inflate the value of foreign currency denominated debt, further amplifying the impact of the shock.
- 8 -
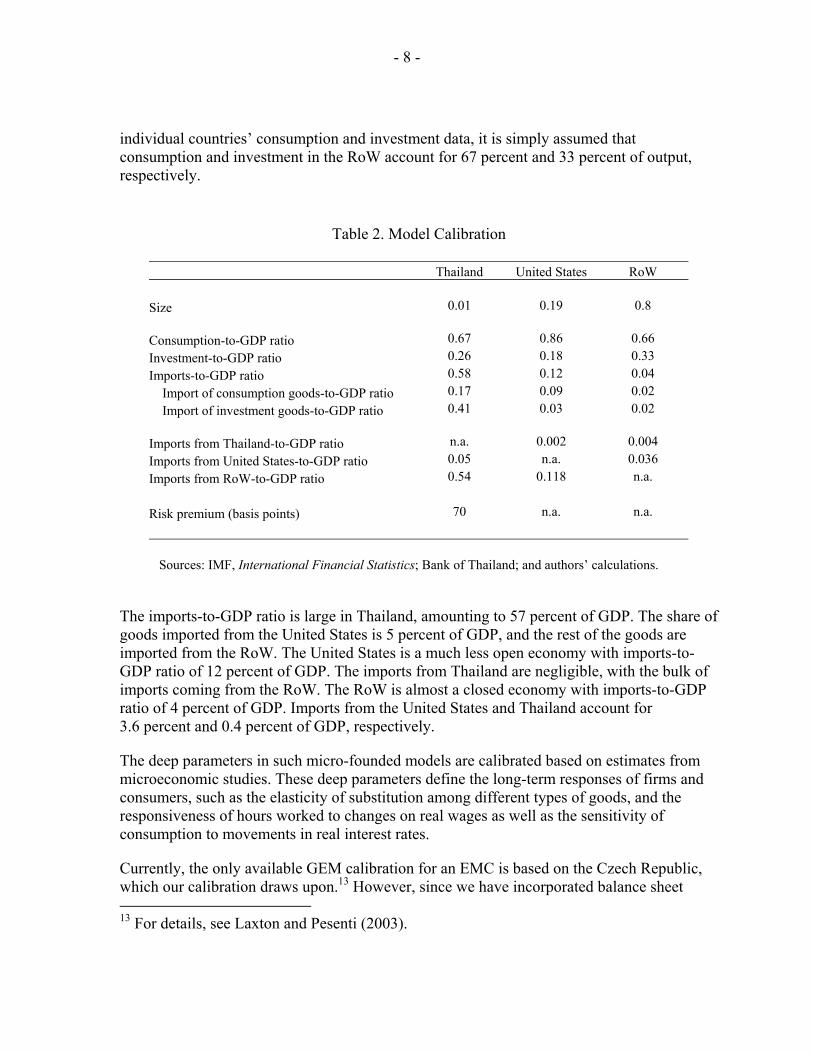
individual countries’ consumption and investment data, it is simply assumed that consumption and investment in the RoW account for 67 percent and 33 percent of output, respectively.
Table 2. Model Calibration Thailand United States RoW
Size 0.01 0.19 0.8 Consumption-to-GDP ratio 0.67 0.86 0.66 Investment-to-GDP ratio 0.26 0.18 0.33 Imports-to-GDP ratio 0.58 0.12 0.04 Import of consumption goods-to-GDP ratio 0.17 0.09 0.02 Import of investment goods-to-GDP ratio 0.41 0.03 0.02 Imports from Thailand-to-GDP ratio n.a. 0.002 0.004 Imports from United States-to-GDP ratio 0.05 n.a. 0.036 Imports from RoW-to-GDP ratio 0.54 0.118 n.a. Risk premium (basis points) 70 n.a. n.a. Sources: IMF, International Financial Statistics; Bank of Thailand; and authors’ calculations.
The imports-to-GDP ratio is large in Thailand, amounting to 57 percent of GDP. The share of goods imported from the United States is 5 percent of GDP, and the rest of the goods are imported from the RoW. The United States is a much less open economy with imports-to-GDP ratio of 12 percent of GDP. The imports from Thailand are negligible, with the bulk of imports coming from the RoW. The RoW is almost a closed economy with imports-to-GDP ratio of 4 percent of GDP. Imports from the United States and Thailand account for 3.6 percent and 0.4 percent of GDP, respectively.
The deep parameters in such micro-founded models are calibrated based on estimates from microeconomic studies. These deep parameters define the long-term responses of firms and consumers, such as the elasticity of substitution among different types of goods, and the responsiveness of hours worked to changes on real wages as well as the sensitivity of consumption to movements in real interest rates.
Currently, the only available GEM calibration for an EMC is based on the Czech Republic, which our calibration draws upon.13 However, since we have incorporated balance sheet 13 For details, see Laxton and Pesenti (2003).
- 9 -
related credit market frictions, we need to calibrate the steady-state external finance premium as well. The risk premium is calibrated using the EMBIG spread for Thailand. The premium has been steadily decreasing since the Asian crisis, and its average value in 2004 was 70 basis points, which we use in our baseline simulations.
The monetary framework assumes inflation targeting. Monetary policy for the United States and RoW follows a classic Taylor rule with no weight on the exchange rate. Since the Asian crisis, Thailand has adopted an inflation targeting regime, and has intervened in the foreign exchange market to prevent excessive baht volatility. The model, therefore, depicts monetary policy in Thailand by positing a Taylor rule augmented with an explicit targeting of the exchange rate. Our baseline simulation assumes that the weight on the exchange rate is smaller than the weights on expected inflation and the output gap.
IV. THE EFFECTS OF A 1 PERCENT U.S. INTEREST RATE HIKE
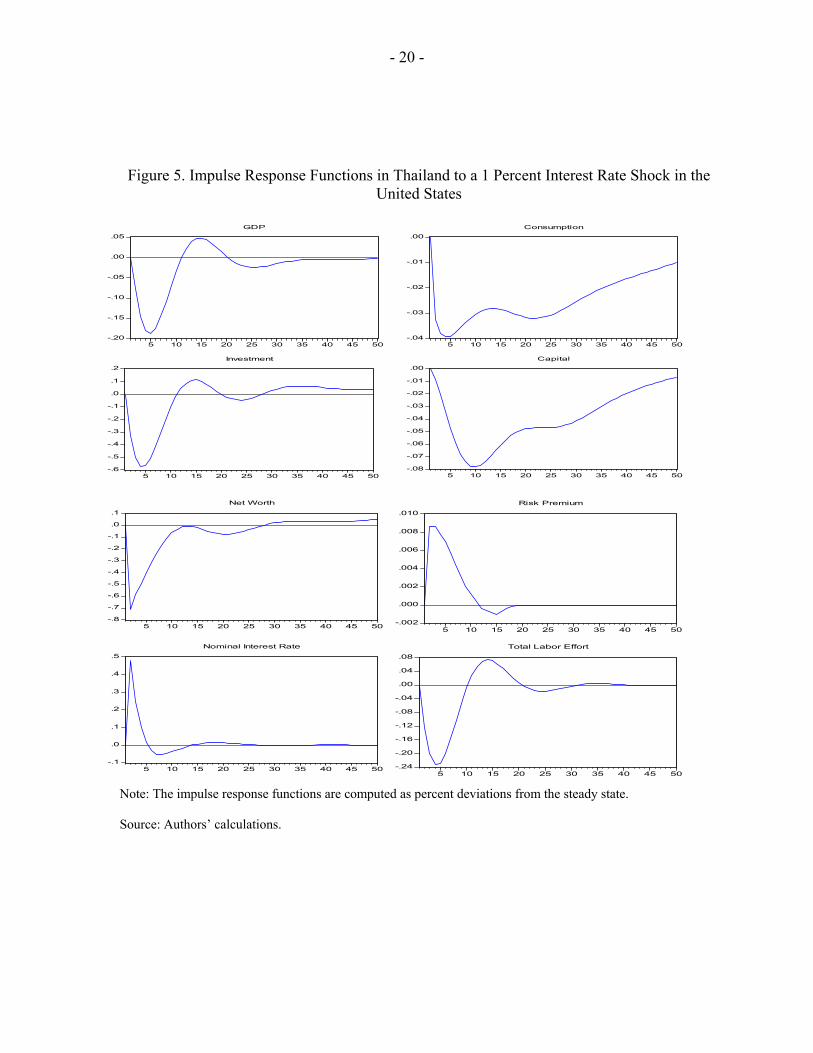
To model an increase in international interest rates, we consider a one percent hike in the U.S. interest rate. The shock lasts one quarter, after which U.S. interest rates are governed by the Taylor rule. The foreign interest rate shock moderately suppresses economic activity in Thailand as shown in Figure 5. Although Thai monetary policy limits transitional volatility in the foreign exchange market, the shock still induces a mild depreciation, implying that about half of the increase in the foreign interest rate is transmitted to the domestic interest rate.
The impulse response functions in Figure 5 depict the dynamic behavior of key macroeconomic variables. The figure shows that the real variables hit their respective troughs after four to five quarters after the onset of the shock. Consumption, investment, labor effort, and output drop by 0.04 percent, 0.57 percent, 0.23 percent, and 0.19 percent relative to steady state, respectively. Owing to the presence of adjustment costs, the capital stock reaches a low point of –0.08 percent relative to steady state 10 quarters after the shock. Because the risk premium is calibrated to be only 70 basis points in steady state, there is only a minor reduction in entrepreneurial net worth reflecting the negligible role of the balance sheet channel in this scenario.14
14 The slight oscillation in the impulse response functions are caused by an additional delayed increase in Thai interest rates needed to mop up second-round inflationary pressures.

- 10 -
Table 3. Cumulative Losses from a 1 Percent U.S. Interest Rate Hike
Thailand United States Output -0.23 -0.46 Consumption -0.28 -0.52 Investment -0.51 -1.21 Capital stock -0.62 -1.34 Sources: Authors’ calculations.
The cumulative costs of the interest rate shock are also limited. Table 3 computes the cumulative output, consumption, investment, and capital stock losses for Thailand and the United States caused by the U.S. interest rate increase.
V. A REPEAT OF THE GLOBAL BOND MARKET ROUT OF 1994?
The U.S. monetary tightening cycle during 1994 was followed by heightened bond market volatility and the widening of EMC credit spreads. The Federal Reserve began raising policy rates in February 1994. During the following 12 months, the federal funds rate doubled to 6 percent in the course of seven successive rate increases. Bond market volatility and 10-year U.S. treasury yields shot up by 250 basis points, peaking at eight percent during November 1994. In the process, international portfolio managers shifted their exposure from short-term to longer-dated securities. This resulted in a marked widening of emerging bond market yield spreads from 405 basis points at end-1993 to about 800 basis points by mid-December 1994.
The current benign global market conditions for EMCs are reminiscent of the period preceding the sell-off of 1994. Low interest rates in major financial centers, a broadening investor base, and soaring asset prices buoyed by abundant global liquidity have dramatically suppressed credit spreads on emerging market bonds. These factors have created a very favorable external environment for emerging market borrowers—with the EMBIG composite spread declining from about 725 basis points at end-2002 to 237 basis points at end-2005—despite the onset of monetary policy tightening in the United States, significant commodity price volatility, and a further widening of global imbalances.
- 11 -
Nevertheless, the risks that did not materialize in 2004 and 2005 remain a concern. Government bond yields and credit spreads remain quite low, leaving plenty of room for further increases in world interest rates. An unanticipated spike in U.S. treasury yields could trigger a widening of credit spreads on emerging market bonds. Under these circumstances, EMCs would face higher borrowing costs, and underlying vulnerabilities that have been masked by the recent benign external financing environment could quickly resurface.
A. U.S. Monetary Policy and EMC spreads
A recent IMF study found that mature market interest rates and global liquidity have become the most important determinants of emerging market spreads following September 2001. The IMF’s 2004 Global Financial Stability Report estimates a simple econometric model with a view to identifying the drivers of the latest emerging bond market rally. Theoretical models suggest that the econometric specification should include relevant measures of country-specific fundamentals, global liquidity as represented by mature market interest rates, the expansion of demand for emerging market bonds caused by a widening investor base, and risk preferences.
The study finds that the explanatory variables are statistically significant and intuitive: improved fundamentals, greater investor demand, and decreased volatility all drive down spreads. More critically, however, the estimation results indicate that liquidity stemming from accommodative U.S. monetary policy has become the most important factor driving the recent emerging bond market rally.
B. A Sudden Decrease in Global Liquidity
To mimic a sudden decrease in global liquidity, we consider a larger and more protracted increase in world interest rates. In addition, we calibrate the steady state external finance premium to 700 basis points, thereby making Thailand more financially vulnerable relative to the previous simulation.15
After the most recent tightening cycle began in mid-2004, the federal funds rate had reached 2.5 percent during the first quarter of 2005. At the time, it was believed that the Fed would continue to raise rates to a “neutral” level. Roughly speaking, a neutral rate should minimize inflationary pressures without dampening economic growth. Various estimates suggest that such a rate ranges between 3 percent to 5 percent, implying a midpoint of 4 percent. Against
15 The EMBIG composite spread average about 730 basis points during the 1990 to 2004 period.
- 12 -
this backdrop, we assume a scenario in which U.S. interest rates increase by 2 percent in four consecutive 50 basis point increments, reaching the neutral rate of 4 percent after a year.16
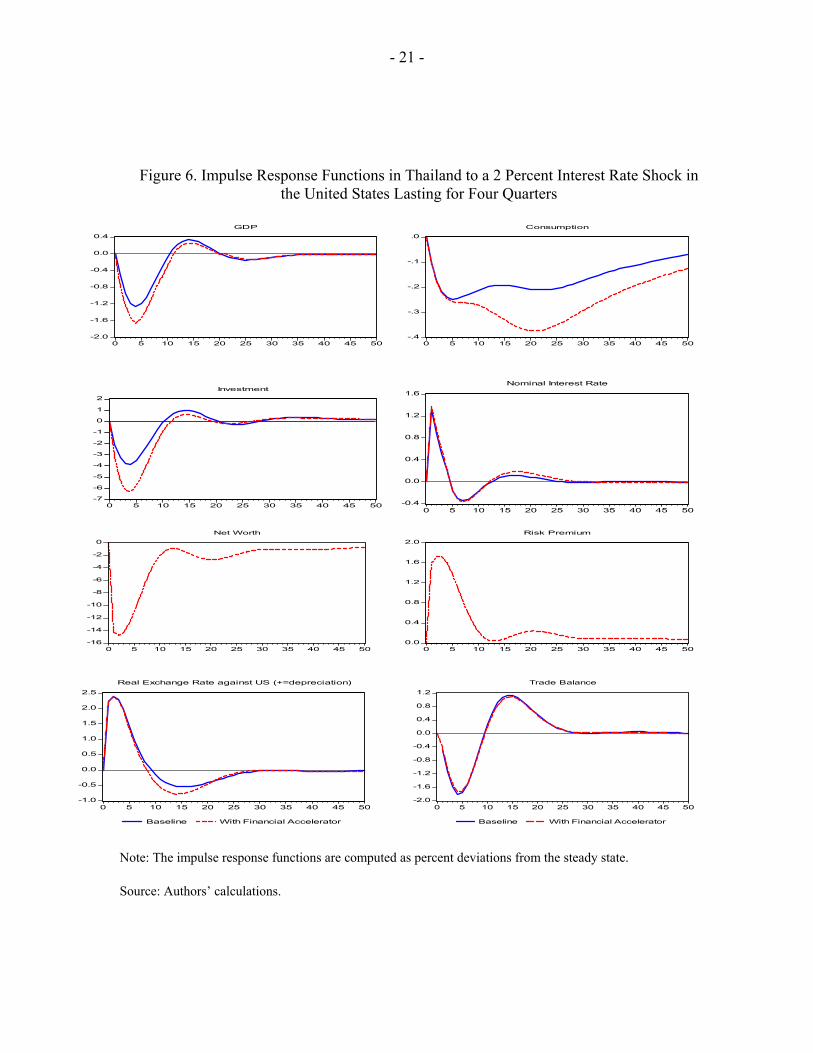
To highlight the importance of balance sheet related vulnerabilities, we consider experiments with and without the financial accelerator present. As shown in Figure 6, a prolonged increase in U.S. interest rates would imply a relatively severe recession in Thailand, which would be further exacerbated with the presence of credit market frictions.
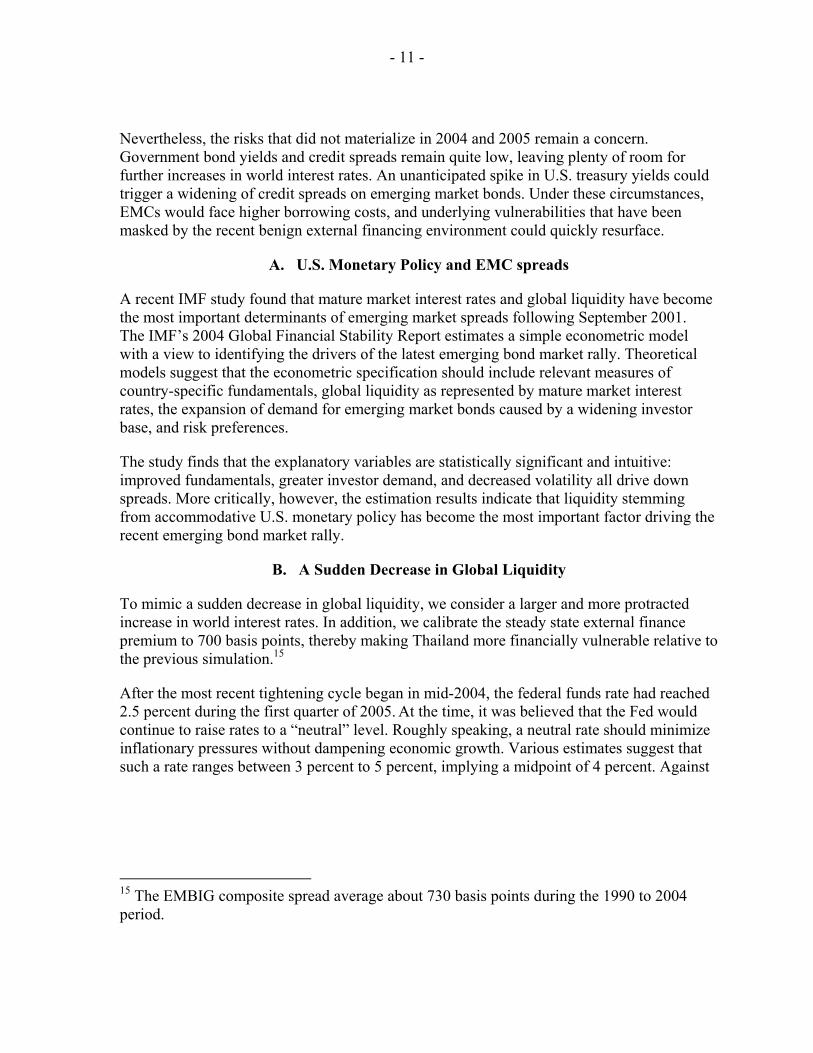
To further highlight the adverse implications of this harsher world interest rate increase, Table 4 presents the cumulative declines in key macroeconomic variables. In the case without the financial accelerator, the model implies cumulative decreases for output, consumption, investment, and the capital stock of 1.8 percent, 2.3 percent, 1.8 percent, and 2.6 percent, respectively. The presence of the financial accelerator adds considerably to the cumulative losses, with output and consumption falling by 2.9 percent and 3.1 percent; whereas the losses are even larger for investment and the capital stock, which both drop by 8.1 percent.
Table 4. Cumulative Losses in Thailand from a 2 Percent Interest Rate Hike in the United States
No financial accelerator Financial accelerator Output -1.80 -2.90 Consumption -2.31 -3.09 Investment -1.75 -8.10 Capital stock -2.60 -8.08 Sources: Authors’ calculations.
The impact of higher world interest rates is more severe in the presence of credit market frictions since the financial accelerator generates a vicious cycle. The external shock causes a decline in asset prices as well as a depreciation of the baht. The former decreases the value of the firm, whereas the latter inflates the value of foreign currency denominated liabilities. Both work in parallel to cause a deterioration in Thai balance sheets, which then increases the risk premium. Coupled with rising international interest rates, the higher premium raises the opportunity cost of investment further, thereby choking off the process of capital accumulation, which in turn, decreases output and thus investment demand further.
16 Also note that, as mentioned in Section V, the magnitude of the shock is consistent with the parallel increases in the federal funds and long-term interest rates during the global bond market rout of 1994.
- 13 -
VI. WHAT ROLE FOR MONETARY POLICY?
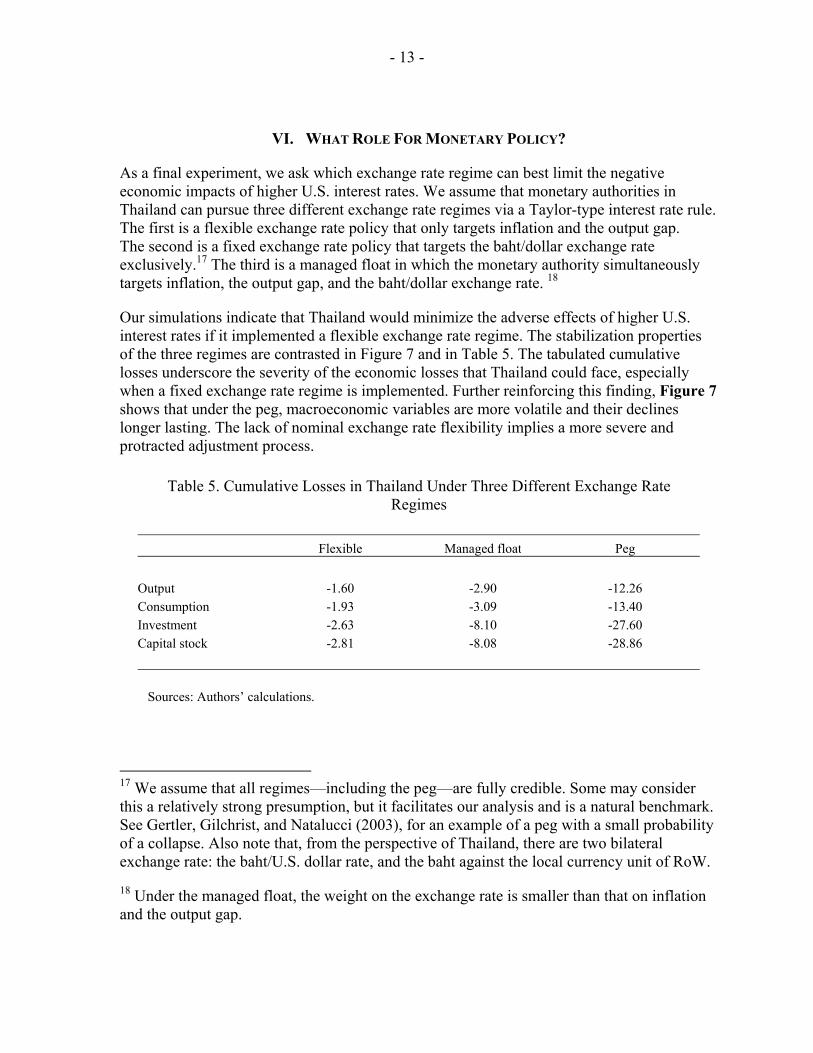
As a final experiment, we ask which exchange rate regime can best limit the negative economic impacts of higher U.S. interest rates. We assume that monetary authorities in Thailand can pursue three different exchange rate regimes via a Taylor-type interest rate rule. The first is a flexible exchange rate policy that only targets inflation and the output gap. The second is a fixed exchange rate policy that targets the baht/dollar exchange rate exclusively.17 The third is a managed float in which the monetary authority simultaneously targets inflation, the output gap, and the baht/dollar exchange rate. 18
Our simulations indicate that Thailand would minimize the adverse effects of higher U.S. interest rates if it implemented a flexible exchange rate regime. The stabilization properties of the three regimes are contrasted in Figure 7 and in Table 5. The tabulated cumulative losses underscore the severity of the economic losses that Thailand could face, especially when a fixed exchange rate regime is implemented. Further reinforcing this finding, Figure 7 shows that under the peg, macroeconomic variables are more volatile and their declines longer lasting. The lack of nominal exchange rate flexibility implies a more severe and protracted adjustment process.
Table 5. Cumulative Losses in Thailand Under Three Different Exchange Rate Regimes
Flexible Managed float Peg Output -1.60 -2.90 -12.26 Consumption -1.93 -3.09 -13.40 Investment -2.63 -8.10 -27.60 Capital stock -2.81 -8.08 -28.86 Sources: Authors’ calculations.
17 We assume that all regimes—including the peg—are fully credible. Some may consider this a relatively strong presumption, but it facilitates our analysis and is a natural benchmark. See Gertler, Gilchrist, and Natalucci (2003), for an example of a peg with a small probability of a collapse. Also note that, from the perspective of Thailand, there are two bilateral exchange rate: the baht/U.S. dollar rate, and the baht against the local currency unit of RoW.
18 Under the managed float, the weight on the exchange rate is smaller than that on inflation and the output gap.

- 14 -
The intuition for the results is as follows. Under the fixed exchange rate, foreign interest rate shocks are transmitted directly to the domestic economy, satisfying the uncovered interest rate parity condition. Because prices adjust sluggishly, higher nominal interest rates imply higher real interest rates, which induce a contraction in output. Once again, the financial accelerator—acting through the balance sheet channel—magnifies the output drop. The rise in the real interest rate causes a contraction in asset prices, which increases the debt-to-equity ratio in Thailand. The rise in the debt-to-equity ratio increases the external finance premium thereby increasing the opportunity cost of investment further, which in turn, completes the vicious cycle by dampening investment and output yet again.
In contrast, under a flexible exchange rate regime, the domestic nominal interest rate is no longer strictly tied to the foreign interest rate, and is also governed by a standard Taylor rule. Under this regime, a rise in the foreign interest rate triggers a depreciation of the nominal exchange rate, which presents a trade-off. On one hand, the depreciation is beneficial as expenditure switching promotes demand for Thai exports, thereby, stimulating aggregate demand. On the other hand, the depreciation increases the value of foreign currency denominated liabilities, which through the financial accelerator mechanism would dampen economic activity further. Since Thailand is a very open economy, the gains owing to expenditure switching dominate the losses stemming from the balance sheet channel. Finally, note that the managed float is an intermediate case.
VII. CONCLUSION
This paper evaluated quantitatively the impact of rising foreign interest rates on real activity in Thailand. In particular, it uses an extended version of the IMF’s Global Economy Model to investigate how key macroeconomic variables in Thailand would respond to increases in U.S. interest rates.
The standard version of GEM is augmented by explicitly modeling balance sheet related credit market frictions by incorporating a financial accelerator mechanism. The paper finds that in the presence of the financial accelerator, foreign interest rate shocks lead to more severe recessions because of underlying balance sheet vulnerabilities.
Most importantly, the paper studies how the Thai monetary authorities may best respond to foreign interest rate shocks. We compute impulse response functions to a protracted U.S. interest rate increase under a fully flexible, a managed float, and a fixed exchange rate regime. Our results indicate that the fully flexible exchange rate regime stabilizes real macroeconomic variables the best. The depreciation of the exchange rate creates expenditure switching effects that dominate the balance sheet effects.
The main policy implication of the paper is that the best monetary policy option for the Thai authorities would be to pursue a flexible exchange rate regime to better handle the challenges of an external environment characterized by rising global interest rates.
- 15 -
REFERENCES
Bayoumi, T., 2004, “GEM: A New International Macroeconomic Model,” IMF Occasional Paper No. 239, (Washington: International Monetary Fund).
Bernanke, B., M. Gertler, and S. Gilchrist, 1999, “The Financial Accelerator in a Quantitative Business Cycle,“ in Handbook of Macroeconomics, ed. John B. Taylor and Michael Woodford.
Cline, W., 1995, International Debt Reexamined, (Washington: Institute for International Finance).
Cline, W., and K. Barnes, 1997, “Spreads and Risk in Emerging Market Lending,” IIF Working Paper No. 97–1, (Washington: Institute for International Finance).
Cantor, R., and F. Packer, 1996, “Determinants and Impact of Sovereign Credit Ratings,” Economic Policy Review, Vol. 2, No. 2, FRB of New York.
Eichengreen, B., and R. Hausman, 1999, “Exchange Rates and Financial Fragility,” NBER Working Paper No. 7418, (Cambridge, Massachusetts: National Bureau for Economic Research).
Eichengreen, B., and A. Mody, 1998, “What Explains Changing Spreads on Emerging Market Debt: Fundamentals or Market Sentiment,” NBER Working Paper No. 6408. (Cambridge, Massachusetts: National Bureau for Economic Research)
Elekdag, S., A. Justiniano, and I. Tchakarov, 2006, “An Estimated Small Open Economy Model of the Financial Accelerator,” forthcoming, IMF Staff Papers.
Elekdag, S., and I. Tchakarov, 2004, “Balance Sheets, Exchange Rate Policy, and Welfare,” IMF Working Paper 04/63 (Washington: International Monetary Fund).
Fernandez-Arias, E., 1996, “The New Wave of Private Capital Inflows: Push or Pull?,” Journal of Development Economics, Vol. 48, pp. 389–418.
Gertler, M., S. Gilchrist, and F. Natalucci, 2003, “External Constraints on Monetary Policy and the Financial Accelerator,” BIS Working Paper No. 139 (Basel, Switzerland: Bank for International Settlements).
Kaminsky, G., and S. Schmuckler, 2002, “Emerging Market Instability: Do Sovereign Ratings Affect Country Risk and Stock Return?,” World Bank Economic Review, Vol. 16, No. 2, pp. 171–195,
Laxton, D., and P. Pesenti, 2003, “Monetary Rules for Small, Open, Emerging Economies,” Journal of Monetary Economics, Vol. 50, No. 5, pp.1109–46.
Neumeyer, P., and F. Perri, 2005, “Business Cycles in Emerging Economies: The Role of Interest Rates,” Journal of Monetary Economics, Vol. 52, Issue 2, pp. 345–380.
Uribe, M., and V. Yue, 2003, “ Country Spreads and Emerging Countries: Who Drives Whom?,” NBER Working Paper No. 10018. (Cambridge, Massachusetts: National Bureau for Economic Research).
- 16 -
-.15
-.10
-.05
.00
.05
.100
20
40
60
80
84 86 88 90 92 94 96 98 00 02 04
Argentina
-.08
-.04
.00
.04
.08
0
2
4
6
8
10
94 95 96 97 98 99 00 01 02 03 04
Korea
-.08
-.04
.00
.04
.08
0
4
8
12
16
20
94 95 96 97 98 99 00 01 02 03 04
Mexico
-.06
-.04
-.02
.00
.02
.04
2
4
6
8
10
12
94 95 96 97 98 99 00 01 02 03 04
Interest Rate Output
Philippines
-.12
-.08
-.04
.00
.04
.08
0
2
4
6
8
10
94 95 96 97 98 99 00 01 02 03 04
O u tp u t I n t e r e s t R a t e
T h a i l a n d
Figure 1. Real Interest Rates and GDP in Emerging Market Countries
Note: Output is seasonally adjusted real GDP, and is detrended using the HP filter (using a linear trend to separate the trend from the cycle yields similar results). Interest rate is constructed as the sum of the 90-day U.S. treasury bill and the J. P. Morgan EMBI Global Spread for the respective country, adjusted for U.S. expected inflation. Sources: IMF, International Financial Statistics; EMBI Global Spread; and authors’ calculations.
-.02
-.01
.00
.01
.02681012141618
96 97 98 99 00 01 02 03 04
Brazil
- 17 -
-.03
-.02
-.01
.00
.01
.02
.03
0
4
8
12
16
86 88 90 92 94 96 98 00 02 04
Australia
-.04
-.02
.00
.02
.04
0
10
20
30
40
86 88 90 92 94 96 98 00 02 04
Interest Rate Output
New Zealand
Figure 2. Real Interest Rates and GDP in Developed Markets
Note: Output is seasonally adjusted real GDP, and is detrended using the HP filter (using a linear trend to separate the trend from the cycle yields similar results). Interest rate is the 90-day money market rate, adjusted for expected inflation. Sources: IMF, International Financial Statistics; and authors’ calculations.
-.02
-.01
.00
.01
.02
.03
0
4
8
12
16
86 88 90 92 94 96 98 00 02 04
Canada
-.06
-.04
-.02
.00
.02
.04
0
4
8
12
16
86 88 90 92 94 96 98 00 02 04
Output Interest Rate
Sweden
- 18 -
Figure 3. Cross Correlations Between Real Interest Rates and GDP in Emerging Markets and
Developed Economies
Source: Authors’ calculations.
-0.8
-0.6
-0.4
-0.2
0
0.2
0.4
-4 -3 -2 -1 0 1 2 3 4j (Quarters)
Cor
rela
tion
betw
een
GD
P (t
) and
R (t
+j)
BrazilArgentinaMexicoPhilippinesThailandKorea
-0.3
-0.2
-0.1
0
0.1
0.2
0.3
0.4
0.5
-4 -3 -2 -1 0 1 2 3 4
j (Quarters)C
orre
latio
n be
twee
n G
DP
(t) a
nd R
(t+j
)
New Zealand
Australia
Canada
Sweden
- 19 -
Figure 4. Simple GEM Structure
Source: Bayoumi (2004).
HOME COUNTRY FOREIGN COUNTRY
Investment Consumption Private Public
Consumption Investment Public Private Public Private
Final Goods Final Goods
Capital Labor Labor Capital
TRADE
PRODUCTION
TRADE
PRODUCTION
Private Public
- 20 -
-.20
-.15
-.10
-.05
.00
.05
5 10 15 20 25 30 35 40 45 50
GDP
-.04
-.03
-.02
-.01
.00
5 10 15 20 25 30 35 40 45 50
Consumption
-.6
-.5
-.4
-.3
-.2
-.1
.0
.1
.2
5 10 15 20 25 30 35 40 45 50
Investment
-.08
-.07
-.06
-.05
-.04
-.03
-.02
-.01
.00
5 10 15 20 25 30 35 40 45 50
Capital
-.8
-.7
-.6
-.5
-.4
-.3
-.2
-.1
.0
.1
5 10 15 20 25 30 35 40 45 50
Net Worth
-.24
-.20
-.16
-.12
-.08
-.04
.00
.04
.08
5 10 15 20 25 30 35 40 45 50
Total Labor Effort
Figure 5. Impulse Response Functions in Thailand to a 1 Percent Interest Rate Shock in the United States
Note: The impulse response functions are computed as percent deviations from the steady state. Source: Authors’ calculations.
-.002
.000
.002
.004
.006
.008
.010
5 10 15 20 25 30 35 40 45 50
Risk Premium
-.1
.0
.1
.2
.3
.4
.5
5 10 15 20 25 30 35 40 45 50
Nominal Interest Rate
- 21 -
-2.0
-1.6
-1.2
-0.8
-0.4
0.0
0.4
0 5 10 15 20 25 30 35 40 45 50
GDP
-.4
-.3
-.2
-.1
.0
0 5 10 15 20 25 30 35 40 45 50
Consumption
-7
-6
-5
-4
-3
-2
-1
0
1
2
0 5 10 15 20 25 30 35 40 45 50
Investment
-16
-14
-12
-10
-8
-6
-4
-2
0
0 5 10 15 20 25 30 35 40 45 50
Net Worth
0.0
0.4
0.8
1.2
1.6
2.0
0 5 10 15 20 25 30 35 40 45 50
Risk Premium
-0.4
0.0
0.4
0.8
1.2
1.6
0 5 10 15 20 25 30 35 40 45 50
Nominal Interest Rate
-1.0
-0.5
0.0
0.5
1.0
1.5
2.0
2.5
0 5 10 15 20 25 30 35 40 45 50
Baseline With Financial Accelerator
Real Exchange Rate against US (+=depreciation)
-2.0
-1.6
-1.2
-0.8
-0.4
0.0
0.4
0.8
1.2
0 5 10 15 20 25 30 35 40 45 50
Baseline With Financial Accelerator
Trade Balance
Figure 6. Impulse Response Functions in Thailand to a 2 Percent Interest Rate Shock in the United States Lasting for Four Quarters
Note: The impulse response functions are computed as percent deviations from the steady state. Source: Authors’ calculations.

- 22 -
-2.5
-2.0
-1.5
-1.0
-0.5
0.0
0.5
0 5 10 15 20 25 30 35 40 45 50
GDP
-1.2
-1.0
-0.8
-0.6
-0.4
-0.2
0.0
0 5 10 15 20 25 30 35 40 45 50
Consumption
-50
-40
-30
-20
-10
0
10
0 5 10 15 20 25 30 35 40 45 50
Net Worth-1
0
1
2
3
4
5
6
0 5 10 15 20 25 30 35 40 45 50
Risk Premium
-1.0
-0.5
0.0
0.5
1.0
1.5
2.0
2.5
0 5 10 15 20 25 30 35 40 45 50
Nominal Interest Rate
-3
-2
-1
0
1
2
0 5 10 15 20 25 30 35 40 45 50
Flexible Exchange RateManaged FloatFixed Exchange Rate
Trade Balance
-2
-1
0
1
2
3
4
0 5 10 15 20 25 30 35 40 45 50
Flexible Exchange RateManaged FloatFixed Exchange Rate
Real Exchange Rate against US (+=depreciation)
Figure 7. Impulse Response Functions in Thailand to a 2 Percent Interest Rate Shock in the
United States under Three Different Exchange Rate Regimes
Note: The impulse response functions are computed as percent deviations from the steady state. Source: Authors’ calculations.
-20
-16
-12
-8
-4
0
4
0 5 10 15 20 25 30 35 40 45 50
Investment