Embed Size (px)
Citation preview
THE ROLE OF INFORMATION TECHNOLOGY IN
ALLIANCES AND MERGERS
by
Ali R. Tafti
A dissertation submitted in partial fulfillment of the requirements for the degree of
Doctor of Philosophy (Business Administration)
in The University of Michigan 2009
Doctoral Committee:
Professor Mayuram S. Krishnan, Co-Chair Professor Robert J. Franzese Jr. Assistant Professor Sreedhar T. Bharath Assistant Professor Nigel P. Melville
Assistant Professor Sunil Mithas, University of Maryland

© Ali R. Tafti 2009

ii
DEDICATION
I dedicate this work to my parents, Mohammed and Shahnaz Tafti, who are my
greatest role models and two of my best friends; and also to my beloved wife Marmar,
who inspires me to persist and brings me great happiness.

iii
ACKNOWLEDGMENTS
I am grateful to members of my dissertation committee, and would like to
acknowledge them individually, although in no particular order. I would like to thank my
advisor and committee chair, Professor M.S. Krishnan, who recognized my potential and
encouraged me. This work would not have been possible without his generous support,
mentorship, and willingness to listen and help shape my ideas. Sunil Mithas has been an
excellent collaborator on many research projects with me, as well as a kind and generous
mentor through the years. Sunil has carefully reviewed and made valuable suggestions in
writing and analysis in many versions of the chapter entitled Information Technology,
Service-Oriented Architectures, and the Firm-Value Effects of Alliance Formation.
Sreedhar Bharath has provided many valuable suggestions and mentorship on the chapter
entitled The Effects of Information Technology Investment and Integration Costs on
Merger Value in the U.S. Commercial Banking Industry. Sreedhar has also helped me
improve my skills in econometric analysis. Nigel Melville has also been a mentor to me,
in many informal and formal meetings; he has read and provided valuable feedback on a
broad range of my writings; and he has greatly enriched the PhD experience for my
colleagues and me through his active presence in the department. Finally, I am deeply
grateful to Robert Franzese who, besides being an excellent teacher of econometrics, has
met with me regularly since the spring of 2008 to review the progress of my work and
iv
provide valuable feedback in each step of the way.
I would also like to extend my thanks for many valuable comments provided on
the empirical study on SOA, IT, and alliances by three anonymous journal reviewers,
participants at ICIS in Paris in 2008, INFORMS annual meeting in Seattle in 2007, Big
10 Information Systems Research Symposium at Purdue University, the University of
Michigan Business Information Technology Department seminar series, the Internal
Entrepreneurship Workshop, and the bi-annual STIET Research Workshop at the
University of Michigan for their valuable comments. Financial support was provided in
part by NSF IGERT grant no. 0114368.
I would also like to extend my thanks for many valuable comments provided on
the empirical study on IT and bank mergers by seminar participants at CIST in Seattle in
2007, and WISE in Paris in 2008. I thank Ben Fields, Chandra Pathuri, Sophia Zhuo,
Cory Simonds, and Robyn S. Wang for their assistance in data collection.
v
TABLE OF CONTENTS
DEDICATION ii
ACKNOWLEDGMENTS iii
LIST OF TABLES viii
LIST OF FIGURES x
ABSTRACT xi
GENERAL INTRODUCTION 1
CHAPTER
I. Towards a Theoretical Framework of Information Technology in Alliances and Mergers 3
I.1. Inter-Organizational Relationships and Governance Requirements I.2 Contracting Hazards in the Role of IT in Inter-organizational Relationships I.3 Coordination and Reconfiguration in Inter-organizational Relationships I.4. A Dynamic Capabilities Perspective of IT-enabled Reconfiguration in Inter-organizational Relationships
References
II. Propositions on the Value of Flexible IT Systems in Strategic Alliances 19
II.1. Contracting Perspective
vi
II.2 Coordination Perspective
II.3. Dynamic Capabilities Perspective
II.4. Conclusion: IT, Business Process Flexibility, and Strategic Flexibility
References
III. Information Technology, Service-Oriented Architectures, and the Firm-Value Effects of Alliance Formation 46
III.1 Introduction III.2 Theoretical Framework III.3. Research Design and Methodology
III.4. Discussion Appendix 1: More Variable Definitions
Appendix 2: Derivation of Baseline Tobin’s Q Model
Appendix 3: Coding and Verification of Alliance Attributes
Appendix 4: Unabridged Regression Tables
References
IV. The Effects of Information Technology Investment and Integration Costs on Merger Value in the U.S. Commercial Banking Industry 104
IV.1. Introduction
IV.2. Background Literature
IV.3. Theory and Hypotheses
IV.4. Methods
IV.5. Results
IV.6. Discussion
References

vii
V. Final Considerations 165
viii
LIST OF TABLES
TABLE
II.1 Overview of Propositions and Key Constructs 40
III.1 Correlations and Summary Statistics 80
III.2 Baseline Value of IT Specifications 81
III.3 IT Interactions with JV and Non-Equity Alliances 82
III.4 SOA Interactions with JV and Non-Equity Alliances 83
III.5 SOA Interactions with Collaborative and Arms-length Alliances 84
III.6 Features of Collaborative Alliances 85
III.7 Examples of Collaborative and Arms-length Alliances 86
III.A1 Strong and Weak Keywords for Collaborative and Arms-length Alliance Deal-text Content Analysis
91
III.A2 Cross-sectional Proportions of Alliance Formation Characteristics 91
III.A3 Baseline Value of IT Specifications, Unabridged Results 93
III.A4 IT Interactions with JV and Non-Equity Alliances, Unabridged Results 94
III.A5 SOA Interactions with JV and Non-Equity Alliances, Unabridged Results 96
III.A6 SOA Interactions with Collaborative and Arms-length Alliances, Unabridged Results
97
IV.1 Variable Definition and Data Sources 140
ix
IV.2 Summary Statistics 142
IV.3. Pairwise Correlations Matrix 143
IV.4 OLS Regression Results including Control Variables: Cost Efficiency 144
IV.5 Abridged IVREG Results 146
IV.6 Abridged OLS Results for ROA and Deposits-To-Assets 147
IV.7 Abridged Cumulative Abnormal Returns (CAR) 148
IV.8 Cumulative Abnormal Returns, Comparison of IVREG Results with Integration Costs and OLS Results with Proxy for Integration Difficulty
149
IV.9 Unabridged OLS Results for Profitability (ROA) 150
IV.10 Unabridged OLS Results for Customer Retention (DOA) 152
IV.11 Unabridged IVREG Results for Cost-efficiency, Including First-stage Regressions 154
IV.12 Unabridged IVREG Results for Profitability, Including First-stage Regressions 156
IV.13 Unabridged IVREG Results for Customer Retention, Including First-stage Regressions
158
IV.14 Unabridged IVREG Results for CAR1 160
x
LIST OF FIGURES
FIGURE
III.1 Marginal Effect of Joint-venture Formation on Tobin’s q, as an Increasing Function of IT, with 90% Confidence Intervals
77
III.2 Marginal Effect of Joint-venture Formation on Tobin’s q, as an Increasing Function of SOA, with 90% Confidence Intervals
78
III.3 Marginal Effect of Collaborative Alliance Formation on Tobin’s q, as an Increasing Function of SOA, with 90% Confidence Intervals
79
IV.1 Sample Representation Over the Population of Completed Domestic U.S Banking M&As
135
IV.2 Trends in Cost-efficiency Pre- and Post-merger
136
IV.3a. Marginal Effect of Acquirers’ IT on Changes in Cost-efficiency, as a Function of Integration Costs, with 90% Confidence Intervals
137
IV.3b. Marginal Effect of Integration on Changes in Cost-efficiency, as a Function of Acquirers’ IT, with 90% Confidence Intervals
137
IV.4a. Marginal Effect of Acquirers’ IT on Changes in Profitability (ROA), as a Function of Integration Costs, with 90% Confidence Intervals
138
IV.4b. Marginal Effect of Integration on Changes in Profitability (ROA), as a Function of Acquirers’ IT, with 90% Confidence Intervals
138
IV.5a. Marginal Effect of Acquirers’ IT on Changes in Customer Retention (DOA), as a Function of Integration Costs, with 90% Confidence Intervals
139
IV.5b. Marginal Effect of Integration on Changes in Customer Retention (DOA), as a Function of Acquirers’ IT, with 90% Confidence Intervals
139
xi
ABSTRACT
Chapter 1. Towards a Theoretical Framework of Information Technology in Alliances and Mergers
In this introductory chapter, I place the central research question of this
dissertation in context of the theoretical perspectives that have been provided in prior
studies, describe the implications and critical gaps in those studies, and motivate further
work on this topic. First, I discuss the governance attributes of different inter-
organizational forms—alliances, joint ventures, and mergers—and describe why each is
appropriate for different types of cooperative activities between firms. Next, I discuss
insights on the role of IT in inter-organizational relationships that emerge by considering
the contracting hazards in transactions. Then, pointing out the limitations of the
contracting perspective in application to a broader range of coordination and cooperation
in inter-firm relationships, I consider how the perspectives of the Resource-based View
(RBV) and of Dynamic Capabilities might inform our understanding of the impact of IT
in alliances and mergers.
Chapter 2. Propositions on the Value of Flexible IT Systems in Strategic Alliances
This chapter focuses on the role of IT flexibility in strategic alliances. I build on
the theoretical perspectives outlined in chapter 1 to identify three factors of success in
alliances—reduction of contracting hazards, reduction of coordination costs, and
xii
enhancement of dynamic capabilities. I then link these factors to the role of IT flexibility,
identify several open questions on IT flexibility in alliances, and develop testable
propositions based on a synthesis of the existing theory.
Chapter 3. Information Technology, Service-Oriented Architectures, and the Firm-Value Effects of Alliance Formation
We examine the effect of information technology (IT) investment and service-
oriented architectures (SOA) in the firm-value contributions of strategic alliance
formation. We argue that through SOA, capabilities in IT flexibility can enhance the
value derived from joint ventures, since such alliances are typically collaboration-
intensive and involve a substantial degree of reconfiguration of firm resources. To further
explore the role of flexibility in inter-organizational collaboration, we identify three
pertinent characteristics of collaborative alliance activities: recombination or
reconfiguration of firm resources, coordination intensity, and the sharing of tacit
knowledge. Using a procedure of automated content-analysis that identifies these features
of collaboration in our sample of alliance descriptions, we then classify alliances as
collaborative or arms-length, and compare the effect of SOA in the firm-value
contribution of these two these alliance types. Our sample includes data from 369 firms
that are publicly listed in the United States and that span multiple industries. These firms
have collectively engaged in more than 8,000 alliances over a period of 10 years.
Empirical results show that SOA has a positive effect on the firm-value contribution of
collaborative alliances, and that this effect is greater than in the firm-value contribution of
arms-length alliances. The results suggest that requirements for flexibility in businesses
processes increase with the number and collaboration-intensity of alliances, and that the
xiii
transformative role of IT should be considered, alongside theories based on transaction
and coordination-cost reduction, to understand the business value of IT in inter-
organizational contexts.
Chapter 4. The Effects of Information Technology Investment and Integration Costs on Merger Value in the U.S. Commercial Banking Industry
Information technology (IT) investment can facilitate the process of corporate
merger integration and enable firms to derive greater value from mergers and acquisitions
(M&A). This paper examines the effect of IT investment and merger integration costs on
merger value, using measures of both long-term performance change and short-term
cumulative abnormal returns. Three possible theoretical mechanisms for the role of IT are
discussed in this context: IT economies of scale, rationalization of business processes,
and enhanced capabilities in reconfiguration. Empirical findings suggest that IT
investment of acquiring firms is associated with greater cost-efficiency gains in mergers,
while integration costs have a negative effect. The positive effects of the acquiring firms’
IT investment on financial performance and on market value increase significantly with
merger integration costs, suggesting that IT investment can help mitigate the risks of
integration or enhance merging firms’ ability to unleash synergies that are latent in
merger integration projects. Since mergers involve a massive scale of reconfiguration and
integration of disparate IT systems, business processes, and organizational structures, this
context enables new perspectives in understanding the business value of IT in dynamic
multi-firm settings.
1
GENERAL INTRODUCTION
The proliferation in frequency of corporate alliances and mergers
beginning in the 1980’s has coincided with greater investments in information technology
(IT), modular designs, common digital standards, and use of electronic networks (Rai,
Patnayakuni and Seth 2006; Straub, Rai and Klein 2004; Wareham et al. 2005). Scholars
have argued that the role of IT in enhancing inter-firm collaboration has enabled the
economic globalization of current times (Friedman 2005; Prahalad and Krishnan 2008).
IT has enabled firms to become nodal entities in a global ecosystem, to rapidly tap into
resources across corporate and geographic barriers, and to provide services that are
increasingly complex and personalized (Prahalad and Krishnan 2008).
Despite all indications of such economically significant impacts of IT, there has
been little empirical examination of the role of IT investment in the firm-performance
effects of corporate alliances and mergers. In the Strategic Management literature,
alliances and mergers have been examined as capabilities in themselves, without much
consideration of the investments in business process infrastructure that underlie such
capabilities. In the Information Systems literature, the study of the role of IT in inter-
organizational relationships has primarily emphasized efficiency and accuracy of
transactions in existing supply chains. Both traditions of academic research leave a
2
substantial gap in our understanding of the internal technological capabilities required for
firms to derive value from their mergers or collaborative alliances.
This dissertation examines how investments in information technology (IT)
influence the value that firms derive from merging or collaborating with other firms. The
dissertation is organized as follows. The first chapter, entitled Towards a Theoretical
Framework of Information Technology in Alliances and Mergers, describes the central
themes of this dissertation, synthesizes the prior relevant research, and elaborates upon
three theoretical perspectives useful in understanding role of IT in corporate alliances and
mergers. This is followed by a theoretical chapter, entitled Propositions on the Value of
Flexible IT Systems in Strategic Alliances, which focuses on the contexts in which IT
flexibility has value in strategic alliances, reveals some open questions on this topic, and
provides a set of propositions intended to motivate further work. The next chapter,
entitled Information Technology, Service-Oriented Architectures, and the Firm-Value
Effects of Alliance Formation, examines the influence of flexible IT architecture and IT
investment in the effect of alliance activity on firm performance utilizing data from 375
firms that are publicly listed in the United States and that span multiple industries. The
final chapter, entitled The Effects of IT Investment and Integration Costs on Value-
Enhancing Outcomes of Mergers and Acquisitions in the U.S. Banking Industry,
examines the effects of IT investment and merger integration costs on merger value,
using measures of both long-term performance change and short-term cumulative
abnormal returns. Core findings of this dissertation suggest that IT investment and
flexible IT infrastructures have significant impacts on firm-value in multi-firm contexts,
by enhancing the value that firms derive from corporate alliances or mergers.
3
CHAPTER I
Towards a Theoretical Framework of Information Technology in Alliances and Mergers
While there is a large body of research in the fields of corporate strategy,
economics, and information systems related to strategic alliances as well as inter-
organizational systems, this literature has not been synthesized for greater understanding
of the many ways in which IT can have a critical role in the success of corporate strategic
alliances. In this introductory chapter, I place the central research question of this
dissertation in context of the theoretical perspectives that have been provided in prior
studies, describe the implications and critical gaps in those studies, and motivate further
work on this topic. First, I discuss the governance attributes of different inter-
organizational forms—alliances, joint ventures, and mergers—and describe why each is
appropriate for different types of cooperative activities between firms. Next, I discuss
insights on the role of IT in inter-organizational relationships that emerge by considering
the contracting hazards in transactions. Then, pointing out the limitations of the
contracting perspective in application to a broader range of coordination and cooperation
in inter-firm relationships, I consider how the perspectives of the Resource-based View
(RBV) and of Dynamic Capabilities might inform our understanding of the impact of IT
in alliances and mergers.
I.1. Inter-Organizational Relationships and Governance Requirements
4
The characteristics and the inherent risks of inter-firm cooperation create specific
requirements in inter-organizational governance, and in turn, influence the choice of
inter-organizational form: a licensing or supply contract, a joint venture, or a merger.
Among the costs and risks inherent in such inter-organizational relationships, researchers
have focused primarily on transaction costs and coordination costs. Transaction costs
arise as a result of self-interested agents acting opportunistically (Oxley 1997).
Coordination costs stem from the complexities inherent in coordinating a set of
disaggregated processes across firm boundaries (Gurbaxani and Whang 1991). In order to
mitigate transaction and coordination costs, which make it difficult to specify complete
and unambiguous contracts, partners may decide to include certain hierarchical controls
into the inter-organizational relationship. First, the firms may decide to share the risks
bilaterally through joint equity investments in a new entity. Alternatively, they may
decide to integrate the two firms completely and form a single merged entity (Gulati and
Singh 1998; Oxley 1997). Each of these arrangements places different demands on a
firm’s IT infrastructure capabilities in order to reconfigure firm resources, form business-
process connections across firm boundaries, or integrate capabilities. I next discuss the
various inter-organizational forms and governance characteristics.
Alliances are defined as “voluntary arrangements between firms involving
exchange, sharing, or co-development of products, technologies, or services” (Gulati
1998). They represent a continuum of hybrid governance forms between markets and
hierarchies (Gibbons 2005), requiring greater mutual commitment than arms-length
market transactions, but also affording more flexibility than mergers or acquisitions for
firms to enter and exit cooperative agreements (Chan, Kensinger, & Keown, 1997).
5
Alliances are a means by which firms can competitively position themselves, amidst
technological and environmental uncertainty, in a way that is more flexible and less
costly than mergers and acquisitions. They provide firms with the ability to rapidly
pursue new technological developments and product markets (Volberda, 1996).
Some alliances involve a greater depth of collaboration or bi-lateral integration of
capabilities. The language of network theory refers to collaborative alliances, those that
involve greater depth of cooperation, as “strong-tie” alliances; while alliances that
resemble arms-length market transactions are referred to as “weak-tie” alliances (Lavie
2007). An example of an arms-length or weak-tie alliance is Dinner by Design’s
agreement to feature Kraft Foods’ products in its home meal assembly offerings
(Kraft.com 2006). This was essentially a supply-relationship of an end product, which
had a marketing component. Since such alliances do not involve much depth in
collaboration, the ability to enter or terminate such alliances may not hinge directly upon
the need for deep reconfiguration of firm processes. In contrast, an example of a
collaborative alliance is State Street and SunGard’s alliance to integrate State Street’s
foreign currency trading platform FX Connect with SunGard’s eTreasury exchange for
corporate customers (Sisk 2003). This alliance enabled State Street to expand its
customer base to include more corporate treasury departments, while also enhancing the
value of SunGard’s financial software offerings. The alliance was driven largely by the
synergies between these two firms’ IT-based products and services. Success would
depend on the seamless integration of technology infrastructure with these eTreasury and
foreign currency trading services. Since collaborative alliances entail relatively greater
flow of information and knowledge between firms, firms need to establish new inter-
6
organizational business processes, modify business processes, and reconfigure resources
in order to derive greater value from such alliances.
Partnerships requiring greater depth in collaboration, coordination, and
knowledge sharing tend to be accompanied by bilateral joint venture equity arrangements
that enforce mutual commitment in the relationship (Oxley and Sampson 2004). Joint
ventures are equity-based alliances involving bilateral investments in capital, technology,
and firm-specific assets (Gulati and Singh 1998). In such collaborative efforts, both
outcomes and actions become difficult to specify in ex-ante contracts, which is why an
incentive structures in which each partner invests a share of equity is often mutually
optimal (Oxley 1997). Although each firm in a joint venture remains as a distinct legal
entity, the firms will often jointly integrate substantial aspects of their capabilities. For
example, the joint venture between Nissan and Renault involved a substantial investment
by both firms to integrate the information systems capabilities of the two firms (Renault
2008). The inter-twining of firm processes and sharing of tacit knowledge entailed in
joint ventures is demonstrated in a study by Anand and Khanna (2000), who find strong
learning effects in joint ventures and no such effects in alliances involving licensing
contracts.
Mergers and acquisitions (M&A) involve an even greater degree of
reconfiguration and integration of inter-firm capabilities than in joint ventures, as two
firms become a single legal entity. In particular, mergers among banks involve the
integration of highly complex IT systems. Mergers and acquisitions (M&A) entail
substantial sunk costs and asset-specific investments; but they also entail possibilities for
leveraging inter-firm synergies that may not exist in alliances or joint ventures.
7
In the following sections, I describe how the theoretical lenses of Transaction
Cost Economics, the Resource-based View, and Dynamic Capabilities each provide
different insights into three classes of factors of success in inter-organizational
relationships that have implications for the role of IT— beginning with a discussion of
the governance characteristics of alliances and mergers, their requirements for
coordination and reconfiguration, and the implications for the role of IT.
I.2. Contracting Hazards in the Role of IT in Inter-organizational Relationships
Much of the prior work in economics and strategy drawing from TCE has placed
a greater emphasis on the characteristics of contracts and the extent to which they can
adequately be enforced, rather than coordination costs involved in conducting inter-firm
transactions. From the premise that inter-organizational relationships involve self-
interested agents that act opportunistically, three insights emerge on the role of IT in
inter-organizational relationships: the asset-specific nature of IT, the role of incomplete
contracting in essential complementary investments, and the impact of IT on the quality
of inter-firm monitoring.
First, establishing new supply-chain relationships requires firms to make asset-
specific (or relation-specific) investments in IT. Asset-specific investments are those
which are not readily transferable to other uses; and hence there are inherent risks
involved in such investments (Williamson 1981). Relation-specific IT systems are those
that involve highly specific investments for setup and maintenance, and typically involve
capabilities that are not easily transferable to other partners (Kim and Mahoney 2006).
Disinvestment can become particularly costly when firm resources are highly intertwined
in relation-specific inter-organizational IT systems—such as EDI systems which can take
8
months to configure and set up for a particular partner. From the perspective of TCE,
relation-specific IT systems have desirable contractual properties, particularly when there
are greater risks of opportunism, rivalry, or the appropriation by one firm of its partner’s
valuable knowledge (also known as ‘information leakage') (Kim and Mahoney 2006).
Rigid IT linkages create a kind of mutual hostage situation that reduces the risk of
opportunism (Venkatraman 1994). On the other hand, rigid and tightly-coupled EDI-
based process linkages can sometimes lock firms into sub-optimal relationships (McAfee
2005). If a firm is held up with highly asset specific investments, it can be impeded from
efficiently reallocating resources among its alliance partners in a timely fashion. Hence,
from the point of view of TCE, there are competing benefits and risks in investing in such
inter-organizational systems. The TCE models are often concerned with the problem of
how to induce such relation-specific investments in the context of inter-firm
collaborations or mergers (Williamson 2002).
A second contribution of the TCE perspective is that leveraging value from IT
investments requires complementary investments on the part of business partners,
including investments in innovative work practices and business processes (Bresnahan,
Brynjolfsson and Hitt 2002; Mata, Fuerst and Barney 1995; Melville, Kraemer and
Gurbaxani 2004). The problem is that such complementary investments are often not
observable or enforceable (Barney 1991; Mata et al. 1995). Due to the complexity of IT
projects, firms cannot foresee or stipulate all of the contingent steps to be taken by
partner firms that will help leverage the value of a firm’s IT investments. Since many IT-
leveraging investments will be specific to an alliance relationship, there are high risks of
opportunistic behavior (Williamson 1981). Therefore, as firms construct alliance
9
portfolios, they must consider how partner firms can best be incentivized to make
complementary investments that leverage IT capabilities—not just to lower the risk for
themselves but also to maximize cooperative behavior of partners (Kim and Mahoney
2006).
A third contribution of the TCE perspective is the idea that IT enhances the
quality of information exchange—improving the ability of inter-organizational partners
to monitor each other. Through greater mutual monitoring between business partners,
greater information sharing, and closer inter-firm linkages, IT can contribute to a
reduction in opportunistic behavior (Kim and Mahoney 2006).This allows firms to sense
and react to sudden changes in supply or demand, improving coordination in inter-firm
processes, and leading to expanded cooperation (Bensaou 1997; Bensaou and
Venkatraman 1995; Nicolaou and McKnight 2006). From the perspective of TCE,
contractual hazards can be overcome through information-rich channels that enable
greater monitoring, and that make tacit agreements become more binding (Oxley 1997).
Hence, by increasing the transparency of information exchange, IT can reduce the
transaction costs inherent in an alliance or merger.
Transaction-cost economics (TCE), with its focus on asset-specificity, hold-ups,
and opportunism, has been widely used to articulate the risks and benefits of inter-
organizational relationships (Oxley and Sampson 2004). While the emphasis on the
contracting hazards aspect of TCE has been valuable to understanding the needs or
incentives of firms in inter-organizational relationships, coordination is an another
important component of transaction costs that needs to be considered (Gurbaxani and
Whang 1991). As discussed next, coordination can be viewed as a firm capability, the
10
understanding of which can be enhanced by considering the Resource-based View as a
complement to TCE (Mata et al. 1995; Melville et al. 2004).
I.3. Coordination and Reconfiguration in Inter-organizational Relationships
Prior studies have shown that engaging successfully in corporate alliances or
mergers is a firm capability that is learned through prior experience in alliances, joint
ventures or mergers (Anand and Khanna 2000; Delong and Deyoung 2007; Kale, Dyer
and Singh 2002). Gulati (1999) shows that firms with more corporate alliance experience
have a greater likelihood of engaging in additional alliances. Ahuja (2000) finds that
firms that enter alliances are those that have more opportunities to do so, a finding which
accords with the Resource-Based view because it suggests that capabilities must be
considered along with incentives.
Despite the evidence that alliance or merger capabilities can be learned, few
studies have focused on the internal firm capabilities that enable firms to leverage greater
value from alliances or mergers. Among the exceptions, Zollo and Singh (2004) show
bank merger capabilities can be improved through codification of merger-related
knowledge (through documents, manuals, and quantitative models). This helps explain
empirical evidence by Delong and Deyoung (2007) that success in the choice of good
bank acquisition targets or the implementation of bank mergers is learned over time
through experience and observation. Since the codification of firm knowledge is
something that can be enhanced through investments in IT (Sambamurthy, Bharadwaj
and Grover 2003), it remains an open question whether IT capabilities have an effect on
the value that is derived from alliances or mergers. To my knowledge, there have been
11
few empirical studies on how IT capabilities can enhance the firm-performance effects of
alliances and mergers. As an exception, Tanriverdi and Uysal (2008) examine the effect
of IT integration on M&A performance. In addition, relevant theoretical frameworks are
provided by a study by Gosain, Malhotra, and El Sawy (2005) on the strategic flexibility
provided by supply chain linkages, and by Malhotra, Gosain, and El Sawy (2005) on the
role of IT in partner-enabled knowledge creation.
Among empirical studies on the firm-performance effects of IT investment, the
most closely related to the approach of this dissertation are those studies which present
implications for the relationship IT investment and inter-firm coordination costs. For
example, Brynjolfsson, Malone, Gurbaxani and Kambil (1994) show an association
between IT investment and smaller firm sizes. Dewan, Michael and Min (1998) find a
positive relationship between firm diversification and IT demand, and an inverse
relationship between vertical integration and IT demand. Their results suggest that
diversification increases the need for coordination across multiple business units,
resulting in a greater demand for IT. While these studies are suggestive, they leave open
the question of the effects of IT investment in the context of alliances and mergers.
Another relevant stream of literature has focused on inter-organizational information
systems. For example, researchers have studied the antecedents and incentives for
investment in Electronic Data Interchange (EDI) (Patnayakuni, Rai and Seth 2006;
Riggins and Kriebel 1994; Zaheer and Venkatraman 1994). Other studies provide insight
into the impact of IT on the effectiveness of supply chain relationships (Barua and Lee
1997; Mukhopadhyay and Kekre 2002; Rai et al. 2006). Coordination capabilities lead to
greater efficiency in the supply chain, lower inventory, and higher productivity (Barua
12
and Lee 1997; Mukhopadhyay and Kekre 2002; Rai, Patnayakuni and Seth 2006).
However, supply chain relationships are often limited in scope to transactions to a small
set of firm processes. In considering a broader scope of collaborative activities or
integration of capabilities across firm-boundaries, this dissertation argues that
investments in IT provide two benefits often overlooked in the prior literature on inter-
organizational systems: visibility or transparency of internal firm business processes, and
greater flexibility to modify business processes.
The ability of the firm to modify business processes is enhanced as business
processes are rendered in digital form. As the scope of collaboration increases in alliances
or mergers, there is greater emphasis in creating new interfaces between firms in the
search for novel resource combinations. Greater breadth or scope of activities within an
alliance implies more opportunities for innovation and novel resource combinations:
“...involvement in collaborative R&D expands the horizons of the firm’s personnel and
increases the awareness of additional projects that might be undertaken” (Powell, Koput
and Smith-Doerr 1996, p. 120). The greater the scope of the alliance, the greater is the
coordination complexity, knowledge interchange, interdependence, and depth of
collaboration (Sampson and Oxley 2004). Through greater digitization of business
processes, firms are able to respond more quickly to environmental conditions that
require modification of processes within the alliance (Gosain et al. 2005). As firms
establish organizational capabilities to handle coordination complexity, they can better
capture synergies among the various processes that lead to new sources of business value.
What the above discussion suggests is that even when incentives are aligned and
the conditions for inter-organizational trust are established, firms sometimes encounter
13
process-related complexities that can hinder the ability to create value in inter-
organizational relationships. Hence, any useful theoretical perspectives on the role of IT
in inter-organizational relationships would need to address many facets of process-related
capabilities. I argue next that one such perspective is Dynamic Capabilities, which has
evolved from and is considered by many scholars to be a subset of RBV (Eisenhardt and
Martin 2000).
I.4. A Dynamic Capabilities Perspective of IT-enabled Reconfiguration in Inter-organizational Relationships
Teece, Pisano, and Shuen (1997 p.516) define Dynamic Capabilities as “the
firm’s ability to integrate, build, and reconfigure internal and external competencies to
address rapidly changing environments”. This definition contains two inherent points of
emphasis. First is the emphasis on the creation, reconfiguration and recombination of
resources. Second is the emphasis on the need for agility for “rapidly changing
environments”, which requires flexibility of organizational processes and routines. The
Dynamic Capabilities perspective goes beyond the RBV to assert that merely attaining
resources that are non-substitutable, inimitable, and valuable is insufficient. Firms must
also develop capabilities that enable them to unleash value from such resources—through
innovation in processes and adjustment, and particularly through novel resource
reconfigurations (Eisenhardt and Martin 2000; Teece et al. 1997).
The Dynamic Capabilities perspective can inform our understanding of the role of
IT in inter-organizational relationships, in the following ways. First, leveraging inter-
organizational synergies can be difficult because it requires firms to re-examine
architectural knowledge that is “embedded in the practices and procedures in the
14
organization” (Henderson and Clark 1990, p. 15). The failure to do so can lead to inertia
and the failure to move beyond an existing set of capabilities, expertise, and assumptions
(Bower and Christensen 1996). The Dynamic Capabilities perspective suggests that tacit
information exchange becomes a potential source of value that is unleashed through a
mobilization of firm resources. Second, the ability to reconfigure routines and develop
new routines enhances inter-organizational learning through “joint contribution to
understanding complex problems” that are “coordinative management processes” (Teece
et al. 1997, p. 520). Inter-organizational learning is enhanced as the firm mobilizes and
re-applies tacit knowledge to new contexts (Jacobides and Winter 2005; Teece et al.
1997). Third, the Dynamic Capabilities perspective emphasizes the importance of agile
responsiveness to unforeseen challenges or opportunities (Jacobides and Winter 2005).
Such responsiveness is needed to handle complex interdependencies among business
processes that span multiple functional areas (Sambamurthy et al. 2003).
The role of information technology in enhancing dynamic capabilities has been
gaining greater attention among researchers. The rendering of products or processes in
digital form generates options value for firms, enabling them to extend more quickly into
new customer markets (Dewan, Shi and Gurbaxani 2007; Sambamurthy et al. 2003).
Firms can leverage IT to develop dynamic capabilities in the development of new
products (Pavlou and El Sawy 2006). The tools and organizational practices that increase
the visibility, transparency, and codifiability of knowledge can also enhance the detection
of opportunities and reduce the costs of resource recombination (Galunic and Rodan
1998). Investments that enable this include systems, software, and hardware, as well as
skilled technical staff with business process competencies. As sensors, electronic
15
networks, and software become pervasive in many categories of products and services,
IT-intensity of business processes has led to greater possibilities for recombination of
resources in many categories of products and services.
While prior studies on the dynamic capabilities aspect of IT business value have
been compelling, there is a need for empirical studies on the impact of IT in dynamic
inter-organizational contexts such as alliances and mergers. In Chapter II, I establish a
theoretical foundation for a research agenda to examine the value of flexible IT systems
in various types of alliance relationships. Subsequently, in Chapter III I present an
empirical study that further refines and tests part of the framework presented in Chapter
II. Finally, Chapter IV examines the effect of IT investment in the value derived from
mergers and acquisitions in the U.S. banking industry.
16
References Ahuja, G. 2000. The Duality of Collaboration: Inducements and Opportunities in the
Formation of Interfirm Linkages. Strategic Management Journal 21(3) 317. Anand, B.N., T. Khanna. 2000. Do firms learn to create value? The case of alliances.
Strategic Management Journal 21(3) 285-315. Barney, J.B. 1991. Firm Resources and Sustained Competitive Advantage. Journal of
Management 17(1) 99-120. Barua, A., B. Lee. 1997. An Economic Analysis of the Introduction of an Electronic Data
Interchange System. Information Systems Research 8(4) 398-422. Bower, J.L., C.M. Christensen. 1996. Customer Power, Strategic Investment, and the
Failure of Leading Firms. Strategic Management Journal 17(3) 197-218. Bresnahan, T.F., E. Brynjolfsson, L.M. Hitt. 2002. Information Technology, Workplace
Organization, and the Demand for Skilled Labor: Firm-Level Evidence. Quarterly Journal of Economics 117(1) 339-376.
Brynjolfsson, E., T.W. Malone, V. Gurbaxani, A. Kambil. 1994. Does Information Technology Lead to Smaller Firms? Management Science 40(12) 1628-1644.
Delong, G., R. Deyoung. 2007. Learning by Observing: Information Spillovers in the Execution and Evaluation of Commercial Bank M&As. The Journal of Finance 62(1) 181-216.
Dewan, S., S.S. Michael, C.K. Min. 1998. Firm Characteristics and Investments in Information Technology: Scale and Scope Effects. Information Systems Research 9(3) 219-232.
Dewan, S., C. Shi, V. Gurbaxani. 2007. Investigating the Risk-Return Relationship of Information Technology Investment. Management Science 53(12) 1829-1842.
Eisenhardt, K.M., J.A. Martin. 2000. Dynamic Capabilities: What Are They? Strategic Management Journal 21 1105-1121.
Galunic, D.C., S. Rodan. 1998. Resource Recombinations in the Firm: Knowledge Structures and the Potential for Schumpeterian Innovation. Strategic Management Journal 19(12) 1193-1201.
Gibbons, R. 2005. Four formal(izable) theories of the firm? Journal of Economic Behavior & Organization 58(2) 200-245.
Gosain, S., A. Malhotra, O.A. El Sawy. 2005. Coordinating for Flexibility in e-Business Supply Chains. Journal of Management Information Systems 21(3) 7-45.
Gulati, R. 1999. Network location and learning: The influence of network resources and firm capabilities on Alliance Formation. Strategic Management Journal 20(5) 397-420.
Gulati, R., H. Singh. 1998. The Architecture of Cooperation: Managing Coordination Costs and Appropriation Concerns in Strategic Alliances. Administrative Science Quarterly 43 781-814.
Gurbaxani, V., S. Whang. 1991. The Impact of Information Systems on Organizations and Markets. Communications of the ACM 34(1) 59-73.
Henderson, R.M., K.B. Clark. 1990. Architectural Innovation: The Reconfiguration of Existing Product Technologies and the Failure of Established Firms. Strategic Management Journal 35(1) 9-30.
17
Jacobides, M.G., S.G. Winter. 2005. The Co-Evolution of Capabilities and Transaction Costs: Explaining the Institutional Structure of Production. Strategic Management Journal 26(5) 395-413.
Kim, S.M., J.T. Mahoney. 2006. Mutual commitment to support exchange: relation-specific IT system as a substitute for managerial hierarchy. Strategic Management Journal 27(5) 401-423.
Kraft.com. 2006. Dinner By Design Home Meal Assembly Business Forms Agreement With Kraft Foods 2007(May 1, 2007) http://www.kraft.com/newsroom/07182006.html
Lavie, D. 2007. Alliance Portfolios and Firm Performance: A Study of Value Creation and Appropriation In the U.S. Software Industry. Strategic Management Journal 28(12) 1187-1212.
Malhotra, A., S. Gosain, O.A. El Sawy. 2005. Absorptive Capacity Configurations in Supply Chains: Gearing for Partner- Enabled Market Knowledge Creation. MIS Quarterly 29(1) 145-187.
Mata, F.J., W.L. Fuerst, J.B. Barney. 1995. Information Technology and Sustained Competitive Advantage: A Resource-Based Analysis. MIS Quarterly 19(4) 487-506.
McAfee, A. 2005. Will Web Services Really Transform Collaboration? MIT Sloan Management Review 46(2) 78-84.
Melville, N., K. Kraemer, V. Gurbaxani. 2004. Review: Information Technology and Organizational Performance: An Integrative Model of IT Business Value. MIS Quarterly 28(2) 283-322.
Mukhopadhyay, T., S. Kekre. 2002. Strategic and Operational Benefits of Electronic Integration in B2B Procurement Processes. Management Science 48(10) 1301-1313.
Oxley, J.E. 1997. Appropriability Hazards and Governance in Strategic Alliances: A Transaction Cost Approach. Journal of Law, Economics, & Organization 13(2) 387-409.
Oxley, J.E., R.C. Sampson. 2004. The Scope And Governance Of International R&D Alliances. Strategic Management Journal 25 723-749.
Patnayakuni, R., A. Rai, N. Seth. 2006. Relational Antecedents of Information Flow Integration for Supply Chain Coordination. Journal of Management Information Systems 23(1) 13-49.
Pavlou, P., O. El Sawy. 2006. From IT Leveraging Competence to Competitive Advantage in Turbulent Environments: The Case of New Product Development. Information Systems Research 17(3) 198-227.
Powell, W.W., K.W. Koput, L. Smith-Doerr. 1996. Interorganizational Collaboration and the Locus of Innovation: Networks of Learning in Biotechnology. Administrative Science Quarterly 41(1) 116-145.
Rai, A., R. Patnayakuni, N. Seth. 2006. Firm Performance Impacts of Digitally Enabled Supply Chain Integration Capabilities. MIS Quarterly 30(2) 225-246.
Renault. 2008. The Alliance on the Move 2008(March 10, 2008) http://www.renault.com/renault_com/en/main/10_GROUPE_RENAULT/60_Acteur_mondial/10_Alliance_Renault-Nissan/20_Dynamique/index.aspx
18
Riggins, F.J., C.H. Kriebel. 1994. The Growth of Interorganizational Systems in the Presence of Network Externalities. Management Science 40(8) 984-998.
Sambamurthy, V., A. Bharadwaj, V. Grover. 2003. Shaping Agility through Digital Options: Reconceptualizing the Role of Information Technology in Contemporary Firms. MIS Quarterly 27(2) 237-263.
Sisk, M. 2003. State Street Finds Tech Allies to Keep its Forex Perch. Bank Technology News 16(1) 20.
Tanriverdi, H., V.B. Uysal. 2008. Cross-business Information Technology Integration and Acquirer Value Creation in Corporate Mergers and Acquisitions Working paper.
Teece, D.J., G. Pisano, A. Shuen. 1997. Dynamic Capabilities and Strategic Management. Strategic Management Journal 18(7) 509-533.
Venkatraman, N. 1994. IT-Enabled Business Transformation: From Automation to Business Scope Redefinition. Sloan management review 35(2) 73-87.
Williamson, O.E. 1981. The Economics of Organization: The Transaction Cost Approach. American Journal of Sociology 87(3) 548-577.
Williamson, O.E. 2002. The Theory of the Firm as Governance Structure: From Choice to Contract. Journal of Economic Perspectives 16(3).
Zaheer, A., N. Venkatraman. 1994. Determinants of Electronic Integration in the Insurance Industry: An Empirical Test. Management Science 40(5) 549-566.
Zollo, M., H. Singh. 2004. Deliberate learning in corporate acquisitions: post-acquisition strategies and integration capability in U.S. bank mergers. Strategic Management Journal 25(13) 1233-1256.
19
CHAPTER II
Propositions on the Value of Flexible IT Systems in Strategic Alliances
This chapter focuses on the role of IT flexibility in strategic alliances. I build on
the theoretical perspectives outlined in the previous chapter to identify three factors of
success in alliances—reduction of contracting hazards, reduction of coordination costs,
and enhancement of dynamic capabilities. I then link these factors to the role of IT
flexibility, identify several open questions on IT flexibility in alliances, and develop
testable propositions based on a synthesis of the existing theory.
Understanding the role of flexibility in strategic alliances is now particularly
important, as firms are increasingly becoming nodal entities, linked together in extended
networks rather than in linear supply relationships (Prahalad, Ramaswamy, & Krishnan,
2000). The emergence of digitally enabled inter-organizational networks has expanded
the range of possible cooperative arrangements from which firms can derive value,
enabling firms to act simultaneously as “supplier...competitor, customer, and consultant”
(Fulk 1995, p. 344). Prahalad and Krishnan (2008) argue that firms should assess their
business processes in terms of their requirements for both flexibility and efficiency, and
suggest that firms should periodically adjust their IT investment strategies to provide
greater efficiency for stable domain business processes and flexibility for evolving
domain processes. By enhancing the flexibility and modularity of business processes,
flexible IT systems such as systems based on service-oriented architectures (SOA)
20
allow business processes to be disaggregated, in a way that facilitates collaboration
across a broad spectrum of business activities.1
Researchers have identified the following aspects of information systems
flexibility: Integration, modularity, and IT personnel flexibility (Byrd and Turner 2000;
Duncan 1995). Malhotra et al. (2005) show that the higher levels of integration afforded
by advanced IT capabilities enhance the quality of information exchange between
business partners. Modular design and structured data connectivity are associated with
higher flexibility in the inter-organizational business processes (Gosain et al. 2005), and
thus require fewer maintenance and integration costs when being adapted for business
For example, inter-organizational
collaboration can include the sharing of tacit knowledge in the joint creation of new
products or services, rather than just the exchange of goods or services. Therefore, the
role of IT in inter-organizational relationships is not limited to supply-chain systems,
which has been the focus of a large number of studies in the IS field. IT is being used not
just to automate the exchange of information and optimize the efficiency of supply chain
relationships, but also to reconfigure business processes in order to develop innovative
business models that span organizational boundaries (Prahalad and Krishnan 2008). For
these reasons, it becomes particularly important to understand how flexible IT systems
can enhance the ability of firms to generate value from alliance partnerships, not just for
the sake of theory building but also to guide managerial practice. Further, it becomes
important to understand how the value of flexible IT depends on various characteristics
of a firm’s alliance partnerships, such as the governance form, the asset-specificity of
resources, and the complexity and diversity of tasks involved in the alliance partnerships.
1 See Chapter III for a discussion on SOA: “SOA is a framework comprised of guidelines and principles that enable greater flexibility, modularity, and transparency of business processes” Babcock, C. 2007. BearingPoint Says SOA Can Be Costly, Hard To Maintain InformationWeek.
21
process changes. Developing and deploying a flexible IT infrastructure requires
personnel with a depth and breadth in technology management knowledge and skills, as
well as with business functional knowledge and skills (Byrd and Turner 2000; Lee,
Trauth and Farwell 1995). Employing highly skilled personnel and supporting their
efforts in work organization redesign account for a substantial portion of IT-related
expenses (Bresnahan et al. 2002; Mata et al. 1995).
There are two aspects of strategic flexibility in the context of inter-organizational
relationships that are enabled by flexibility in business processes. First, partnering
flexibility enables firms to establish or terminate connections with minimal frictions or
dissipation of value (Chatterjee, Segars and Watson 2006; Gosain et al. 2005; Young-
Ybarra and Wiersema 1999). Partnering flexibility refers to firms’ ability to engage or
disengage with business partners like “plug and play” devices (Chatterjee, Segars and
Watson 2006; McAfee 2005), allowing firms greater agility to maneuver in competitive
and rapidly changing markets (Broadbent, Weill and St. Clair 1999; Gupta, Karimi and
Somers 1997). Second, offering flexibility enables firms to modify, adapt, or develop new
business processes which in turn facilitate the innovation of new products or services
(Broadbent et al. 1999; Gosain et al. 2005). Flexibility to enter or modify partnerships
makes firms agile in breaking into new product and service markets, which drives firm
value (Feeny and Ives 1990; Kettinger et al. 1994).
The remainder of this essay is structured as follows. First, I consider contracting
hazards in the governance of alliance relationships. In particular, I consider the
implications on the value of flexible IT investments, as firms engage in a greater number
of alliance relationships, and as those alliances involve greater asset-specificity, credible
22
commitments, or hierarchical forms of governance. Second, I consider how flexible IT
may enhance coordination capabilities, particularly in alliances involving high
complexity or diversity of cooperative tasks; or alliances in which industry standards are
not prevalent. Third, I draw from the perspective of Dynamic Capabilities to examine
how flexible IT may be more influential in alliances forged under conditions of high
industry dynamism, alliances involving recombination of products or processes, or
alliances involving tacit knowledge or work processes.
Table II.1 shows an overview of propositions and key constructs.
II.1. Contracting Perspective
A substantial body of research exists on why firms enter alliances, how they
expect to benefit from them, and what are the risks. The contracting perspective covers a
broad swath of literature including Transaction Cost Economics, property rights and
social exchange theories. From these perspectives, the outcomes of predominant interest
have been decision variables: Whether to engage in the alliance, the scope of
collaborative activities, and the types of contracts or incentive arrangements used to
govern the alliance (Oxley and Sampson 2004).
The contracting perspective begins with the premise that alliances involve self-
interested agents acting opportunistically, and have been used to examine the influence of
trust, asset-specificity, and mutual dependence in alliances. In addition, these
perspectives have been used to examine the role of strategic flexibility in alliances
(Young-Ybarra and Wiersema 1999). Prior research suggests that firms seek alliance
partnerships to quickly absorb new knowledge (Anand and Khanna 2000), and to explore
new product markets with less capital investment (Chan, Kensinger and Keown 1997). In
23
short, alliances are attractive because they provide strategic flexibility from a transaction
costs and governance point of view.
The existing literature examining governance issues of inter-organizational
systems has been concerned with the intersection of two general problems. First, in inter-
organizational IT systems such as supply-chain systems, issues of mutual commitment
and mutual investment can arise (Barua and Lee 1997). Second, the future choices of
alliance partners can be constrained by inter-organizational systems that are inflexible
and involve high switching costs (Zaheer and Venkatraman 1994). Together, these two
problems have implications for role of IT flexibility in corporate alliances.
II.1.1 Electronic Integration, Alliance Partnership Multiplicity, and the
Value of Flexible IT Systems
Next, I discuss the implications of one of the relevant themes in prior literature on
the concept of electronic integration, defined by Zaheer and Venkatraman (1994 p. 549)
as “form of vertical quasi-integration achieved through the deployment of proprietary
information systems between relevant actors in adjacent sages of the value chain”.
Monteverde and Teece (1982 p. 321) define quasi-vertical integration as “the ownership
by a downstream firm of the specialized tools, dies, jigs, and patterns used in the
fabrication of components for larger systems”. This form of relation-specific investment
is a mechanism that deters opportunistic behavior on the part of the supplier, and hence
becomes an alternative to actual integration. Many anecdotal examples of electronic
integration exist; among them, State Street’s electronic integration with its clients’ back-
office accounting systems through a technology paradigm known in the financial industry
as straight-through processing (Melville, Tafti and Gallaugher 2007), and the Vendor-
24
Management Inventory system linking Wal-Mart and P&G (Kim and Mahoney 2006). As
Kim and Mahoney (2006) point out, electronic integration can mitigate some transaction
hazards between supply chain partners.
Electronic integration can mitigate a contracting problem referred to as ‘hold-up’
(Williamson 1983). Consider the scenario of a contracting hazard stemming from an
imbalance in the number of alternative counterparties. Supplier firm A has few
substantial customers whereas customer firm B has many alternative suppliers for a
particular product or service. Supplier A is therefore subject to hold-up risks as customer
B has greater leverage in making arbitrary demands by threatening to drop supplier A at
will. As supplier A is aware of this risk at the outset, this supplier will be prudent in
requiring customer B to invest up front in a relation-specific system, which electronically
integrates the supplier and customer, in order to demonstrate a credible commitment to
the supply relationship. According to the theory, by virtue of an investment in an inter-
organizational system that is inflexible or involves high-switching costs, the credible
commitment is demonstrated.
While electronic integration can reduce some aspects of transaction costs, the
implication is that inter-organizational systems need to be inflexible and involve high
switching costs; however, this is likely to lead to new types of transaction hazards that
must be considered (Williamson 1991). First, an inflexible system will make it difficult
for alliance partners to modify or evolve business processes within the context of the
relationship, as the need arises. When the option to exit the relationship becomes
infeasible, then the option to modify the relationship becomes more important. As
business conditions change, partnering firms will often try to adapt by evolving their
25
business models, which will have implications for processes that are inter-coupled across
organizational boundaries. Therefore, inflexibility in inter-organizational IT systems may
lead to further problems. Second, it is often in the interest of both business partners to
have flexibility in exiting from the alliance relationship, when conditions demand it.
When alliance partners are bound by inflexible systems to a relationship that is less than
mutually optimal, then this hinders the ability of alliance partners to benefit from other
additional alliance opportunities that may arise. Therefore, to the extent that inter-
organizational IT systems are inflexible and impose high switching costs, it becomes
more difficult to capitalize upon new strategic alliance opportunities.
Flexible IT systems enable a firm to engage and derive value from a larger
number of alliance opportunities. Although an inflexible system may sometimes be
beneficial in creating a mutual commitment, as an alliance partnership evolves over time,
alliance partners will mutually benefit from the ability to modify inter-organizational
business processes or to exit from the relationship when it is no longer deemed mutually
optimal. The flexibility to modify existing alliance relationships or exit from them
becomes more valuable as the number of alliance partners increases. Therefore,
Proposition 1.1: The value of flexible IT systems increases with the number of alliance
partnerships.
II.1.2 Asset-specificity, Flexible IT Systems, and Alliance Value
Transaction costs have many possible causes, including an imbalance in number
of counterparties, or imbalance in access to critical resources or sources of information
(Williamson 1991). Another source of transaction costs is the asset-specificity of
resources invested in the alliance relationship (Williamson 2002). Asset-specificity of
26
resources in an alliance relationship is commonly understood to be the extent to which
resources that are deployed within a relationship have more value in that context, as
compared to when the same resources are deployed for any alternative purpose
(Williamson 1981).
While alliance partners may use asset-specificity for opportunistic gain at the
expense of partners, the literature in inter-organizational relationships shows how asset
specificity can also be mutually beneficial to alliance partners (Williamson 1983). When
there is greater asset-specificity, alliance partners are more likely to be bilaterally
engaged in a breadth and depth of collaborative activities, leading to the likely need for
some of those processes to be transformed or modified as business conditions change
(Young-Ybarra and Wiersema 1999). As alliance partners become more inter-dependent,
the need to co-evolve business processes is more likely to arise (Gosain et al. 2005).
Young-Ybarra and Wiersema (1999) argue that flexibility in modifying alliances
becomes increasingly important with greater asset-specificity of resources involved in the
alliance. Under asset-specific conditions of an alliance, firms will have greater incentive
for flexibility to modify business processes within an alliance, especially as business and
contractual conditions may increase the difficulty of exiting from an alliance relationship.
As alliance partners find it more difficult to exit from an asset-specific relationship, it
becomes more important that they be able to adapt and co-evolve in response to
challenges that arise within their alliance relationships. As the need for flexibility in both
modification and exit increase with asset specificity of alliance partnerships, the value of
flexible IT also becomes greater.
27
Proposition 1.2: The value of flexible IT systems increases with the asset-specificity of
firm resources invested in alliance relationships.
II.1.3 Effect of Hierarchical Governance Structure in Alliances on the Value of Flexible IT Systems
As business processes are reconfigured in the course of collaboration, and alliance
partners innovate in order to create new inter-organizational business processes, the
incentive for forming the deep collaborative relationship is not based solely on
transaction cost mechanisms (Conner and Prahalad 1996). Rather, the logic for
cooperation is often based on a need for knowledge-specific cooperation, wherein the
equity-based relationship is considered to be more conducive to collaboration depth
(Pisano 1989; Poppo and Zenger 1998). Such alliance relationships are more likely to
enable alliance partners to realize mutually-beneficial synergies in collaboration (Pisano
1989; Poppo and Zenger 1998). As firms benefit more from the synergies, mechanisms of
enforcing credible commitment such as in electronic integration involving high switching
costs may not be as critical to success as having flexibility in IT systems, which is needed
to adapt to changing market and industry conditions (Young-Ybarra and Wiersema
1999).
Flexible IT systems can be particularly beneficial in the context of knowledge-
specific cooperation. Modularity of flexible IT systems enables firms to conceive and
define business processes in finer and more optimal levels of granularity, allowing firms
to explore new forms of collaboration within the context of an alliance relationship
(Baldwin and Clark 2000; Ethiraj and Levinthal 2004). Just as flexible IT can enhance
the value of equity-based alliances, the relational mechanisms of such alliances can
mitigate the risks of potential opportunism that are sometimes associated with the open
28
interfaces of flexible systems (Dyer and Hatch 2006). Under open interfaces, common
standards, and modular systems, sensitive information can sometimes be made
inadvertently more alienable and subject to appropriation by opportunistic partners, a
potential vulnerability of information leakage associated with flexible systems
(Cherbakov et al. 2005). For this reason, it becomes even more beneficial to utilize a
relational or hierarchical governance arrangement such as a joint venture, since a
licensing contract may not be able to cover all contingencies to prevent such
opportunistic behavior (Pisano 1989). By having other relational mechanisms in place
that deter opportunistic behavior, equity-based partnerships can enable firms to leverage
the potentially alienable information in many ways, turning a potential transaction hazard
into an opportunity to create new synergies. Therefore, the flexible IT system becomes
much more useful in the alliance context if there is a contractual mechanism in place to
safeguard the potential vulnerabilities (Pisano 1989).
Proposition 1.3: Flexible IT systems have greater value in the context of alliance
relationships featuring greater hierarchical governance structure, such as in equity-based
alliances, than in alliances with less hierarchical governance structure.
II.2 Coordination Perspective
Flexibility in inter-organizational systems is important for reasons other than for
governance. Once a firm has decided to engage in an alliance and has committed to a
particular configuration of activities, contracts, or risk-sharing agreements, there remain
some unanswered questions regarding why some firms are more successful than others in
deriving value from alliances. In particular, flexible IT systems also bring other benefits
29
in allowing alliance partners to more fully leverage inter-organizational resources. As I
argue in the next sections, flexible IT can enhance the coordination of operations and
business processes, and also enhance the recombination or reconfiguration of resources.
This allows alliance partners to better leverage new opportunities, to develop new
business models, and to better achieve the synergies in their alliance relationships.
II.2 .1 Effect of Alliance Coordination Complexity on the
Value of Flexible IT Systems
Just as industries vary in the complexity of production, alliance activities vary in
the complexity of tasks involved in the cooperative arrangement (Sahaym, Steensma and
Schilling 2007; Simon 1962). Sometimes coordination with alliance partners is made
difficult as a result of the complexity and variety of inputs needed to create or provide a
product or service. In such cases, the firm becomes a node in a nexus of alliance
partnerships, acting as a bridge that joins and recombines a variety of products and
services in order to provide a unique product or service. For instance, Apple’s iPhone is
a product of collaboration involving dozens of alliances with other software and hardware
technology providers. As the number of inputs or business processes inter-linked with
alliance partners increases, a firm faces greater challenges in managing the
interdependencies which can form across multiple business functions within the
partnerships (Gulati and Singh 1998). This presents some substantial coordination
challenges between firms and within the firm, such as maintaining information quality,
accuracy, and efficiency, in addition to knowledge-management challenges (Malhotra et
al. 2005).
30
Flexibility in IT systems can enable firms to cope with high coordination
complexity. As diverse inputs can lead to greater interdependencies between firm
functional units, flexibility in IT systems makes it easier for the firm to coordinate among
diverse sources and high volumes of information flow, by decomposing units of business
process functionality at fine levels of granularity. Through increased modularity of
business processes, the firm is able to fine-tune specific components of business process
functionality without causing inadvertent changes to another component (Gosain et al.
2005). Lack of modularity under conditions of high coordination complexity would
reduce the firm’s capabilities in coordination, leading to a greater frequency of errors in
coordination, and inefficiencies in inter-organizational business processes. Particularly
under conditions of high input diversity and coordination complexity, flexible IT systems
become an enabler of efficient and accurate coordination.
Proposition 2.1: The value of flexible IT systems increases with the coordination
complexity of alliance partnerships.
II.2.2 Relationship between Flexible IT and Industry Standards in Alliance
Coordination
Prior research has examined the relationship between industry standards and inter-
firm alliances (Sahaym et al. 2007). Standards enable the codification of knowledge that
is often exchanged, reduce the amount of knowledge that remains in tacit form, and
facilitate the establishment of inter-organizational business routines. Loose coupling,
through modularity of business processes, and the existence of standards, can be critical
to firms managing coordination-intensive relationships with multiple firms (Sahaym et al.
31
2007). When open communication protocols or industry standards are employed, it
becomes easier for firms to interface in myriad ways with other firms.
It has been argued that flexible IT is associated with industry standards, and
therefore, that flexible IT systems become more valuable with the existence of standards
(Sahaym et al. 2007). While it is true that flexible IT systems rely on communication
standards that exist on a horizontal layer of published communication standards or
protocols such as SOAP,2
Corporate alliances can involve many layers and forms of tacit cooperation. Many
different technological protocols or industry standards exist, and they facilitate various
types of inter-firm communications and business process routines. When one set of inter-
firm routines or processes do not conform to any particular standard, this can be
mitigated by the creation of standards on a different layer of business processes. For
example, prior to its SOA initiative, Helvetia had been struggling to integrate systems
between its own subsidiaries in part because of insufficient standards, and as a result was
burdened with a large number of manual business processes (Gambon 2006). By
integrating its multiple subsidiaries through a flexible SOA-based IT system, Helvetia
was subsequently better able to forge and derive value from a larger number of new
I argue that there is further nuance in the relationship between
flexible IT and the role of industry standards or protocols. Flexible IT systems become
more valuable under industry conditions that demand it, such as when some industry
standards are missing or not utilized. Therefore, flexible IT systems can help alleviate
situations in which certain industry-specific or firm-specific routines do not conform to
any open standards and are highly tacit in nature.
2 Standing for Simple Object Access Protocol, SOAP is a protocol specification for exchanging structured information in a decentralized, distributed environment such as in e-commerce applications that communicate over the internet: http://www.w3.org/TR/soap/
32
linkages with external business partners (Gambon 2006). This example illustrates how
SOA capabilities can be particularly valuable in mitigating problems in coordination
when protocols or standards are otherwise lacking.
Flexible IT enhances the codifiability of standards by facilitating the creation of
new layers of standards, which becomes particularly valuable in situations where industry
standards don’t otherwise exist. Likewise, when a collaboration involves tacit forms of
knowledge exchange, business process routines are inherently difficult to specify or
codify (Galunic and Rodan 1998). It is precisely in such conditions that flexible IT
systems that enhance standardization, such as SOA-based systems, become particularly
valuable. Flexible IT systems can mitigate the lack of standards, for instance, by allowing
software wrappers that hide the firm-specific language of mainframes (Neat 2006). When
the codified routines or standard functional interfaces are missing on one level, SOA and
other types of frameworks can help create such interfaces on a different level of business
process protocols.
Proposition 2.2: Flexible IT systems enhance coordination capabilities by mitigating the
lack of industry standards among alliance partners.
II.3. Dynamic Capabilities Perspective
I next draw from the perspective of dynamic capabilities to understand the role of
IT flexibility in strategic alliances, because this perspective emphasizes agility and
flexibility as a firm capability (Pavlou and El Sawy 2006; Sambamurthy et al. 2003).
Through dynamic capabilities, firms develop the capacity to make better strategic
decisions, to develop new products, and to derive value from alliances. Teece et al.
(1997) argue that the capability to reconfigure resources, which involves the spanning
33
boundaries of processes, are among the most transformational of dynamic capabilities.
Transformational changes are difficult to accomplish because firms operate implicitly
upon architectural knowledge that is “embedded in the practices and procedures in the
organization” (Henderson and Clark 1990, p. 15). Alliance relationships are not
necessarily centered on the supply of a product or service, but rather involve many levels
of inter-organizational cooperation in order to develop a new product or service. This
requires substantial flexibility within the confines of an alliance relationship in order to
seek and find new opportunities for recombination of existing products or services in the
process of innovation. In addition, this requires substantial cross-functional cooperation.
Using the lens of dynamic capabilities, I discuss three ways in which flexible IT systems
can be particularly important in the context of strategic alliances.
II.3.1 Effect of Industry Turbulence on the Value of Flexible IT Systems
The dynamic capabilities perspective is often applied to understand the effects of
industry turbulence. I define industry turbulence as any of the following three conditions:
high industry churn rates such as in high annual rates of industry entry or exit by firms,
high industry competition as indicated by measures such as the Herfindahl index, or
competitive uncertainty indicated by measures such as firm-specific variation in annual
returns (Mithas and Tafti 2009). Cooperative activities may involve asset-specific
resources, which can make cooperation risky under conditions of industry turbulence. As
business process requirements rapidly evolve in highly turbulent industry environments,
the need for flexibility in modification or exit from the alliance becomes greater.
34
In highly turbulent industries, alliance partnerships can be fraught with high
transaction costs, requiring firms more often to form new partnerships or pursue new
opportunities with either existing or new alliance partners. In these scenarios, alliance
formation opportunities represent ‘options value’ which is enhanced by the dynamism of
the industry (Vassolo, Anand and Folta 2004). In such environments, strategic flexibility
often depends on the ability to have flexibility in IT-enabled business processes (Gosain
et al. 2005). The flexibility to modify or create new business processes in the context of
alliances will enhance the value of alliances particularly in highly dynamic industries,
and will also reduce the potential risk and costs should the competitive environment
require firms to modify their alliance relationships. As the business environment creates
new opportunities to generate alliance value, firms will need to respond with agility when
new business opportunities arise.
Therefore, flexible IT will be more valuable to alliances in the conditions of
industry dynamism; since the flexibility to modify or exit the alliance become especially
necessary due to turbulent industry conditions.
Proposition 3.1: The effect of flexible IT systems on alliance value increases with
industry turbulence.
II.3.2 Effect of Alliance Recombination or Reconfiguration Requirements on the Value of Flexible IT Systems
Many strategic alliances involve the recombination of knowledge between firms
in the process of innovation, and not just the exchange of data (Conner and Prahalad
1996). Flexible IT systems can lead to a greater capacity for recombining resources and
35
reconfiguring business processes, which enables firms to generate greater synergies from
their alliances. Consider an alliance between SunGard, the financial software vendor, and
State Street, the financial holding company; formed to integrate State Street’s foreign
currency trading platform FX Connect with SunGard’s eTreasury exchange for corporate
customers (Sisk 2003). Prior to this, the currency platform and eTreasury exchange had
distinct contexts of use and well-defined interfaces, under which the details and
complexity underlying their functionality was hidden to all but the most familiar
technical staff. In combining these systems, the firms had to open the black box of their
processes, and to create entirely new linkages that leveraged the synergies between their
product offerings (Sisk 2003). Success in recombination of such services depends in large
part on the seamless integration of disparate systems, which requires flexibility in the IT
infrastructures on which the respective systems are based. With increased digitization of
business processes, investments in flexible IT systems become particularly important in
collaborative partnerships such as joint ventures that involve the development of new
products or services.
Proposition 3.2: The effect of flexible IT on alliance value is greater in alliances
involving recombination or reconfiguration of products or processes.
II.3.3 Effect of Tacit Knowledge Exchange on the Value of Flexible IT Systems
When processes are digitized, a firm has greater visibility into its own business
processes. As accessibility and transparency of information increase, business processes
become more transparent, putting firms in a much better position to identify opportunities
for innovation. As Galunic and Rodan (1998) argue, knowledge often has the property of
tacitness; and the possibility of novelty in recombination in alliances is greater when
36
tacitness of routines or a knowledge base is high (Monteverde 1995). However, tacitness
also reduces the likelihood of detection of discovery of opportunities for innovation and
increases the costs of exchange of knowledge resources (Galunic and Rodan 1998). This
leaves open the possibility of tools, methods, and technologies that increase detection
probability and reduce the costs of resource recombination.
I argue that flexible IT systems can help generate tools and an organizational
apparatus that systematically increases the visibility, transparency, and codifiability of
knowledge— increasing the likelihood of detection and reducing the costs of resource
recombination. Such investments include not only systems, software, and hardware, but
also trained technical staff with business process competencies. For example, as a firm
achieves greater visibility and systematic control of business processes, it can better steer
the technical design of a jointly developed system so that it works better in the context of
its own business. On precisely this logic, JP Morgan reversed a potentially cost-cutting
outsourcing arrangement with IBM in 2005; and instead invested billions of dollars to
develop internal technical competencies (Hovanesian 2006). Subsequently, JP Morgan
formed a joint venture with First Data and four other banks “to integrate information and
technology” and to combine best practices in creating real-time identity authentication
and payment fraud assessment solutions services (Hovanesian 2006, p. 1). This joint
project involves many hidden expenses and obstacles in the process of integrating
technological capabilities of banks and First Data, but in which JP Morgan’s internal
competencies have enabled it to derive greater value.
Based on the arguments above, I argue that investments in flexible IT can enable
firms to have greater transparency and visibility of firm processes. This, in turn, helps
37
increase the possibilities of detection for opportunities in innovation while decreasing the
costs of resource recombination.
Proposition 3.3: The effect of flexible IT systems on alliance value is greater in alliances
involving tacit exchange of knowledge or work processes.
II.4. Conclusion: IT, Business Process Flexibility, and Strategic Flexibility
Multiple theoretical perspectives are needed in order to examine the effect of IT
flexibility on alliance performance. In this essay, I described the role of IT flexibility and
made predictions regarding how the effect of IT flexibility may depend on the number
and characteristics of alliances. By considering multiple theoretical perspectives, we can
better avoid drawing conclusions based on a simple association of constructs, for
instance, in simply associating flexible alliance contracts with the need for flexible IT.
While some contracts and incentive structures may constrain the flexibility of firms in
alliance relationships, I argue that it is precisely in such conditions that firms need to
cultivate flexibility of IT and business processes. By distinguishing the capabilities of
flexibility from the incentives—through perspectives of governance, coordination, and
dynamic capabilities—we are better able to better understand how IT flexibility can be
valuable in the context of strategic alliances.
Since alliance value may be driven in part by capabilities of process
reconfiguration and resource recombination, theories of Transaction Cost Economics,
property rights or social trust may not fully explain why some firms are better than others
at deriving value from strategic alliances. The Resource-based View (RBV), which
argues that forming and maintaining alliances is a capability that draws from internal firm
resources, has shown some promise in explaining how firms learn from their alliances
and develop internal competencies to derive value from them (Kale, Dyer and Singh
38
2002; Lavie 2007). However, in its emphasis on the attainment of resources that are non-
substitutable, inimitable, and valuable, RBV does not by itself explain how firms
compete in the face of technology-driven upheavals that suddenly render resources as
irrelevant (Henderson and Clark 1990; Teece et al. 1997).
There has been greater recognition of the reality that firms often thrive on
advantages in innovation, agility, and flexibility— not necessarily to the advantage of
incumbent firms with established market positions. This recognition has taken form in a
perspective and stream of literature referred to as Dynamic Capabilities, which has
evolved from and is arguably a subset of the RBV (Eisenhardt and Martin 2000; Teece et
al. 1997). In its emphasis on reconfiguration and recombination of resources, the
theoretical perspective of Dynamic Capabilities calls for greater attention on role of IT in
enhancing the flexibility of business processes.
The above discussion on the role of IT flexibility in alliances provides some
intuition regarding how one might expect IT infrastructure capabilities to enable firms to
derive greater value from alliances. Drawing from prior theory, I made argued that IT
investment and the deployment of flexible IT infrastructures will enable firms to derive
greater value from strategic alliances, particularly when alliance activity is frequent.
However, it remains unclear whether firms have adequately embraced frameworks or
practices for IT infrastructure flexibility, and whether their IT investments are actually
leading to greater strategic flexibility. Technology vendors and articles in the business
press claim that emerging technology frameworks and standards, such as service-oriented
architectures (SOA) have enhanced business process flexibility (Cearley, Abrams and
Smith 2006). On the other hand, anecdotal evidence also suggests that IT investments
39
have actually made firms more rigid in their business processes in a way that inhibits the
speed at which they can adjust to accommodate market changes. For instance, in the
1990’s, Allstate invested heavily in a system that streamlined many business processes,
but also had the negative effect of making it difficult to alter or modify those business
processes (Weier 2007). Against this backdrop of competing claims, I next present an
empirical study to examine the moderating influence of IT investment and of the
deployment of flexible IT infrastructures, through SOA, in the effect of alliance
formation on firm performance.
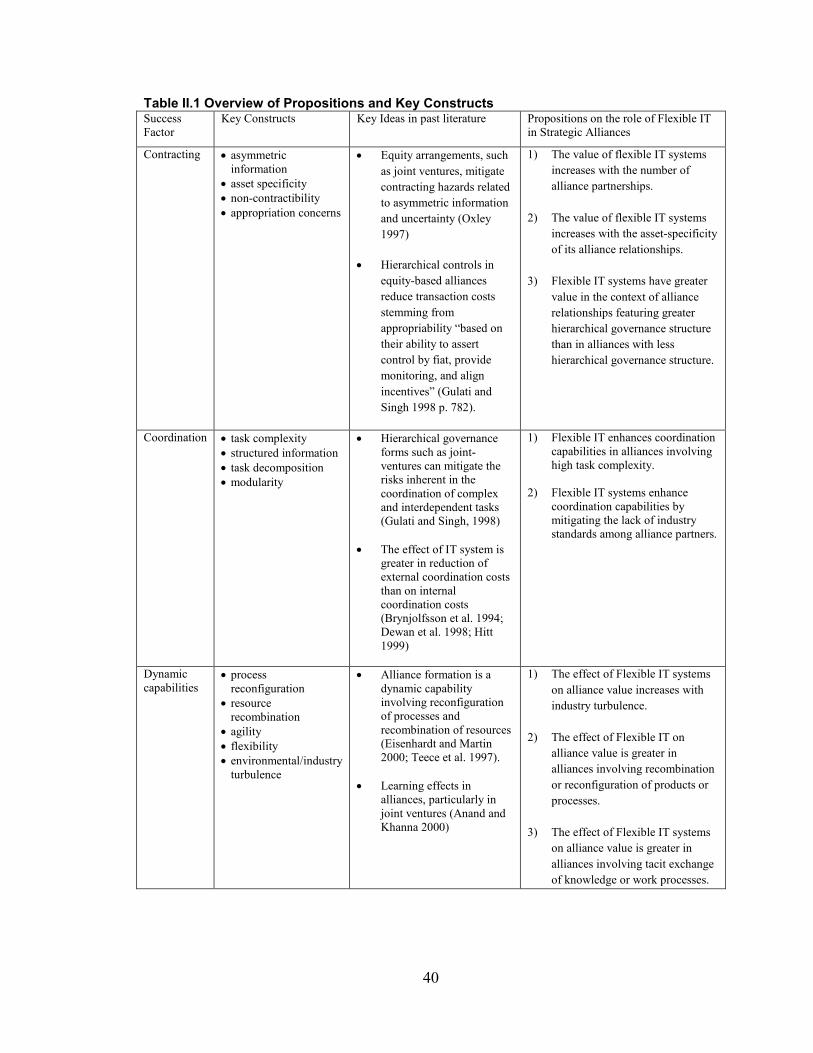
40
Table II.1 Overview of Propositions and Key Constructs Success Factor
Key Constructs Key Ideas in past literature Propositions on the role of Flexible IT in Strategic Alliances
Contracting • asymmetric information
• asset specificity • non-contractibility • appropriation concerns
• Equity arrangements, such as joint ventures, mitigate contracting hazards related to asymmetric information and uncertainty (Oxley 1997)
• Hierarchical controls in equity-based alliances reduce transaction costs stemming from appropriability “based on their ability to assert control by fiat, provide monitoring, and align incentives” (Gulati and Singh 1998 p. 782).
1) The value of flexible IT systems increases with the number of alliance partnerships.
2) The value of flexible IT systems increases with the asset-specificity of its alliance relationships.
3) Flexible IT systems have greater value in the context of alliance relationships featuring greater hierarchical governance structure than in alliances with less hierarchical governance structure.
Coordination • task complexity • structured information • task decomposition • modularity
• Hierarchical governance forms such as joint-ventures can mitigate the risks inherent in the coordination of complex and interdependent tasks (Gulati and Singh, 1998)
• The effect of IT system is greater in reduction of external coordination costs than on internal coordination costs (Brynjolfsson et al. 1994; Dewan et al. 1998; Hitt 1999)
1) Flexible IT enhances coordination capabilities in alliances involving high task complexity.
2) Flexible IT systems enhance coordination capabilities by mitigating the lack of industry standards among alliance partners.
Dynamic capabilities
• process reconfiguration
• resource recombination
• agility • flexibility • environmental/industry
turbulence
• Alliance formation is a dynamic capability involving reconfiguration of processes and recombination of resources (Eisenhardt and Martin 2000; Teece et al. 1997).
• Learning effects in alliances, particularly in joint ventures (Anand and Khanna 2000)
1) The effect of Flexible IT systems on alliance value increases with industry turbulence.
2) The effect of Flexible IT on alliance value is greater in alliances involving recombination or reconfiguration of products or processes.
3) The effect of Flexible IT systems on alliance value is greater in alliances involving tacit exchange of knowledge or work processes.
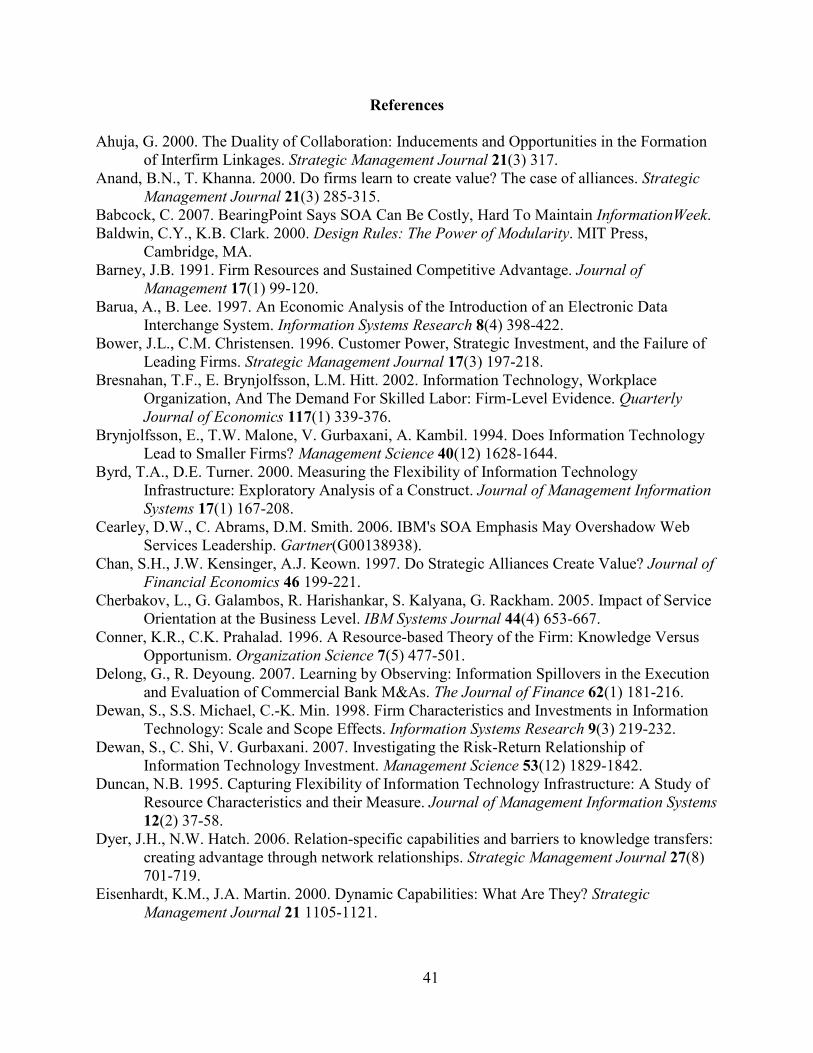
41
References Ahuja, G. 2000. The Duality of Collaboration: Inducements and Opportunities in the Formation
of Interfirm Linkages. Strategic Management Journal 21(3) 317. Anand, B.N., T. Khanna. 2000. Do firms learn to create value? The case of alliances. Strategic
Management Journal 21(3) 285-315. Babcock, C. 2007. BearingPoint Says SOA Can Be Costly, Hard To Maintain InformationWeek. Baldwin, C.Y., K.B. Clark. 2000. Design Rules: The Power of Modularity. MIT Press,
Cambridge, MA. Barney, J.B. 1991. Firm Resources and Sustained Competitive Advantage. Journal of
Management 17(1) 99-120. Barua, A., B. Lee. 1997. An Economic Analysis of the Introduction of an Electronic Data
Interchange System. Information Systems Research 8(4) 398-422. Bower, J.L., C.M. Christensen. 1996. Customer Power, Strategic Investment, and the Failure of
Leading Firms. Strategic Management Journal 17(3) 197-218. Bresnahan, T.F., E. Brynjolfsson, L.M. Hitt. 2002. Information Technology, Workplace
Organization, And The Demand For Skilled Labor: Firm-Level Evidence. Quarterly Journal of Economics 117(1) 339-376.
Brynjolfsson, E., T.W. Malone, V. Gurbaxani, A. Kambil. 1994. Does Information Technology Lead to Smaller Firms? Management Science 40(12) 1628-1644.
Byrd, T.A., D.E. Turner. 2000. Measuring the Flexibility of Information Technology Infrastructure: Exploratory Analysis of a Construct. Journal of Management Information Systems 17(1) 167-208.
Cearley, D.W., C. Abrams, D.M. Smith. 2006. IBM's SOA Emphasis May Overshadow Web Services Leadership. Gartner(G00138938).
Chan, S.H., J.W. Kensinger, A.J. Keown. 1997. Do Strategic Alliances Create Value? Journal of Financial Economics 46 199-221.
Cherbakov, L., G. Galambos, R. Harishankar, S. Kalyana, G. Rackham. 2005. Impact of Service Orientation at the Business Level. IBM Systems Journal 44(4) 653-667.
Conner, K.R., C.K. Prahalad. 1996. A Resource-based Theory of the Firm: Knowledge Versus Opportunism. Organization Science 7(5) 477-501.
Delong, G., R. Deyoung. 2007. Learning by Observing: Information Spillovers in the Execution and Evaluation of Commercial Bank M&As. The Journal of Finance 62(1) 181-216.
Dewan, S., S.S. Michael, C.-K. Min. 1998. Firm Characteristics and Investments in Information Technology: Scale and Scope Effects. Information Systems Research 9(3) 219-232.
Dewan, S., C. Shi, V. Gurbaxani. 2007. Investigating the Risk-Return Relationship of Information Technology Investment. Management Science 53(12) 1829-1842.
Duncan, N.B. 1995. Capturing Flexibility of Information Technology Infrastructure: A Study of Resource Characteristics and their Measure. Journal of Management Information Systems 12(2) 37-58.
Dyer, J.H., N.W. Hatch. 2006. Relation-specific capabilities and barriers to knowledge transfers: creating advantage through network relationships. Strategic Management Journal 27(8) 701-719.
Eisenhardt, K.M., J.A. Martin. 2000. Dynamic Capabilities: What Are They? Strategic Management Journal 21 1105-1121.
42
Ethiraj, S.K., D. Levinthal. 2004. Modularity and Innovation in Complex Systems. Management Science 50(2) 159-173.
Feeny, D.F., B. Ives. 1990. In Search of Sustainability: Reaping Long-term Advantage from Investments in Information Technology. Journal of Management Information Systems 7(1) 27.
Friedman, T.L. 2005. The World Is Flat: A Brief History of the Twenty-first Century Picador, New York, NY.
Fulk, J., G. DeSanctis. 1995. Electronic Communication and Changing Organizational Forms. Organization Science 6(4) 337-349.
Galunic, D.C., S. Rodan. 1998. Resource Recombinations in the Firm: Knowledge Structures and the Potential For Schumpeterian Innovation. Strategic Management Journal 19(12) 1193-1201.
Gambon, J. 2006. Building Data Bridges. Baseline X(66) 83-85. Gibbons, R. 2005. Four formal(izable) theories of the firm? Journal of Economic Behavior &
Organization 58(2) 200-245. Gosain, S., A. Malhotra, O.A. El Sawy. 2005. Coordinating for Flexibility in e-Business Supply
Chains. Journal of Management Information Systems 21(3) 7-45. Gulati, R., H. Singh. 1998. The Architecture of Cooperation: Managing Coordination Costs and
Appropriation Concerns in Strategic Alliances. Administrative Science Quarterly 43 781-814.
Gurbaxani, V., S. Whang. 1991. The Impact of Information Systems on Organizations and Markets. Communications of the ACM 34(1) 59-73.
Henderson, R.M., K.B. Clark. 1990. Architectural Innovation: The Reconfiguration of Existing Product Technologies and the Failure of Established Firms. Strategic Management Journal 35(1) 9-30.
Hitt, L.M. 1999. Information Technology and Firm Boundaries: Evidence from Panel Data. Information Systems Research 10(2) 134-149.
Hovanesian, M.D. 2006. JP Morgan: The Bank of Technology BusinessWeek. Jacobides, M.G., S.G. Winter. 2005. The Co-Evolution of Capabilities and Transaction Costs:
Explaining the Institutional Structure of Production. Strategic Management Journal 26(5) 395-413.
Kale, P., J.H. Dyer, H. Singh. 2002. Alliance capability, stock market response, and long-term alliance success: the role of the alliance function. Strategic Management Journal 23(8) 747.
Kettinger, W.J., V. Grover, S. Guha, A.H. Segars. 1994. Strategic information systems revisited: A study in sustainability and performance. MIS Quarterly 18(1) 31.
Kim, S.M., J.T. Mahoney. 2006. Mutual commitment to support exchange: relation-specific IT system as a substitute for managerial hierarchy. Strategic Management Journal 27(5) 401-423.
Kraft.com. 2006. Dinner By Design Home Meal Assembly Business Forms Agreement With Kraft Foods 2007(May 1, 2007) http://www.kraft.com/newsroom/07182006.html
Lavie, D. 2007. Alliance Portfolios and Firm Performance: A Study of Value Creation and Appropriation In the U.S. Software Industry. Strategic Management Journal 28(12) 1187-1212.
Lee, D.M.S., E.M. Trauth, D. Farwell. 1995. Critical Skills and Knowledge Requirements of IS Professionals: A Joint Academic/Industry Investigation. MIS Quarterly 313-340.
43
Malhotra, A., S. Gosain, O.A. El Sawy. 2005. Absorptive Capacity Configurations in Supply Chains: Gearing for Partner- Enabled Market Knowledge Creation. MIS Quarterly 29(1) 145-187.
Mata, F.J., W.L. Fuerst, J.B. Barney. 1995. Information Technology and Sustained Competitive Advantage: A Resource-Based Analysis. MIS Quarterly 19(4) 487-506.
McAfee, A. 2005. Will Web Services Really Transform Collaboration? MIT Sloan Management Review 46(2) 78-84.
Melville, N., K. Kraemer, V. Gurbaxani. 2004. Review: Information Technology and Organizational Performance: An Integrative Model of IT Business Value. MIS Quarterly 28(2) 283-322.
Melville, N., A. Tafti, J. Gallaugher. 2007. Informational Architecture and Competitive Advantage: Lessons from Foreign Currency Markets working paper.
Mithas, S., A. Tafti. 2009. How Strategic Posture and Competitive Environment Influence Firms’ IT Investments: Theory And Evidence. H. Chen, S. Slaughter, eds. Proceedings of the 30th International Conference on Information Systems
Pheonix, AZ. Monteverde, K. 1995. Technical Dialog As an Incentive for Vertical Integration in the
Semiconductor Industry. Management Science 41(10) 1624-1638. Monteverde, K., D.J. Teece. 1982. Appropriable Rents and Quasi-Vertical Integration. Journal
of Law and Economics 25(2) 321-328. Mukhopadhyay, T., S. Kekre. 2002. Strategic and Operational Benefits of Electronic Integration
in B2B Procurement Processes. Management Science 48(10) 1301-1313. Neat, A.G. 2006. Embracing SOA for the Legacy World. IBM Developer Works.
http://www.ibm.com/developerworks/library/ar-embsoa/ Oxley, J.E. 1997. Appropriability Hazards and Governance in Strategic Alliances: A Transaction
Cost Approach. Journal of Law, Economics, & Organization 13(2) 387-409. Oxley, J.E., R.C. Sampson. 2004. The Scope And Governance Of International R&D Alliances.
Strategic Management Journal 25 723-749. Patnayakuni, R., A. Rai, N. Seth. 2006. Relational Antecedents of Information Flow Integration
for Supply Chain Coordination. Journal of Management Information Systems 23(1) 13-49.
Pavlou, P., O. El Sawy. 2006. From IT Leveraging Competence to Competitive Advantage in Turbulent Environments: The Case of New Product Development. Information Systems Research 17(3) 198-227.
Pisano, G. 1989. Using Equity Participation to Support Exchange: Evidence from the Biotechnology Industry. Journal of Law, Economics, & Organization 5(1) 109-126.
Poppo, L., T. Zenger. 1998. Testing Alternative Theories of the Firm: Transaction Cost, Knowledge-Based, and Measurement Explanations for Make-or-Buy Decisions in Information Services. Strategic Management Journal 19(9) 853-877.
Powell, W.W., K.W. Koput, L. Smith-Doerr. 1996. Interorganizational Collaboration and the Locus of Innovation: Networks of Learning in Biotechnology. Administrative Science Quarterly 41(1) 116-145.
Prahalad, C.K., M.S. Krishnan. 2008. The New Age of Innovation: Driving Cocreated Value through Global Networks. McGraw-Hill, New York.
Rai, A., R. Patnayakuni, N. Seth. 2006. Firm Performance Impacts of Digitally Enabled Supply Chain Integration Capabilities. MIS Quarterly 30(2) 225-246.
44
Renault. 2008. The Alliance on the Move 2008(March 10, 2008) http://www.renault.com/renault_com/en/main/10_GROUPE_RENAULT/60_Acteur_mondial/10_Alliance_Renault-Nissan/20_Dynamique/index.aspx
Riggins, F.J., C.H. Kriebel. 1994. The Growth of Interorganizational Systems in the Presence of Network Externalities. Management Science 40(8) 984-998.
Sahaym, A., H.K. Steensma, M.A. Schilling. 2007. The Influence of Information Technology on the Use of Loosely Coupled Organizational Forms: An Industry-Level Analysis. Organization Science 18(5) 865-880.
Sambamurthy, V., A. Bharadwaj, V. Grover. 2003. Shaping Agility through Digital Options: Reconceptualizing the Role of Information Technology in Contemporary Firms. MIS Quarterly 27(2) 237-263.
Simon, H.A. 1962. The Architecture of Complexity. Proceedings of the American Philosophical Society 106(6) 467-482.
Sisk, M. 2003. State Street Finds Tech Allies to Keep its Forex Perch. Bank Technology News 16(1) 20.
Straub, D., A. Rai, R. Klein. 2004. Measuring Firm Performance at the Network Level: A Nomology of the Business Impact of Digital Supply Networks. Journal of Management Information Systems 21(1) 83-114.
Tanriverdi, H., V.B. Uysal. 2008. Cross-business Information Technology Integration and Acquirer Value Creation in Corporate Mergers and Acquisitions Working paper.
Teece, D.J., G. Pisano, A. Shuen. 1997. Dynamic Capabilities and Strategic Management. Strategic Management Journal 18(7) 509-533.
Vassolo, R.S., J. Anand, T.B. Folta. 2004. Non-Additivity in Portfolios of Exploration Activities: a Real Options-Based Analysis of Equity Alliances in Biotechnology. Strategic Management Journal 25(11) 1045-1061.
Venkatraman, N. 1994. IT-Enabled Business Transformation: From Automation to Business Scope Redefinition. Sloan management review 35(2) 73-87.
Wareham, J., L. Mathiassen, A. Rai, D. Straub, R. Klein. 2005. The business value of digital supply networks: A program of research on the impacts of globalization. Journal of International Management 11(2) 201-227.
Weier, M.H. 2007. The Good Hands People Want Better Hands InformationWeek Williamson, O.E. 1981. The Economics of Organization: The Transaction Cost Approach.
American Journal of Sociology 87(3) 548-577. Williamson, O.E. 1983. Credible Commitments: Using Hostages to Support Exchange. The
American Economic Review 73(4) 519-540. Williamson, O.E. 1991. The Analysis of Discrete Structural Alternatives. Administrative Science
Quarterly 36(2) 269-296. Williamson, O.E. 2002. The Theory of the Firm as Governance Structure: From Choice to
Contract. Journal of Economic Perspectives 16(3). Young-Ybarra, C., M. Wiersema. 1999. Strategic Flexibility in Information Technology
Alliances: The Influence of Transaction Cost Economics and Social Exchange Theory. Organization Science 10(4) 439-459.
Zaheer, A., N. Venkatraman. 1994. Determinants of Electronic Integration in the Insurance Industry: An Empirical Test. Management Science 40(5) 549-566.

45
Zollo, M., H. Singh. 2004. Deliberate learning in corporate acquisitions: post-acquisition strategies and integration capability in U.S. bank mergers. Strategic Management Journal 25(13) 1233-1256.
46
CHAPTER III
Information Technology, Service-Oriented Architectures, and the Firm-Value Effects of Alliance Formation
III.1 Introduction
Why do firms differ in the value that they derive from inter-firm alliances? To
answer this question we consider the role of information technology (IT), which has
transformed the way organizations collaborate. While prior research in the field of
information systems has examined the role of IT in supply chain relationships, there is a
need for greater empirical examination of the role of IT in the diversity of forms of
collaboration that occur in strategic alliances. Gulati (1998 p. 283) defines alliances as
“voluntary arrangements between firms involving exchange, sharing, or co-development
of products, technologies, or services.” Alliance activities include the co-development or
recombination of products and services, the joint design of systems, and the sharing of
managerial or technical expertise. Anecdotal evidence suggests that flexibility and
strategic agility of firms can be enhanced by recent advances in flexible IT architectures,
such as service-oriented architectures (Cherbakov et al. 2005). The challenge for firms in
strategic alliances is not only to optimize the efficiency or accuracy of transactions, but
also to codify and mobilize tacit knowledge, and to reconfigure processes for the creation
of new boundary-spanning processes. Therefore, we argue that flexibility of IT can
enhance firms’ ability to derive value from alliances.
47
The contrast between the recent experiences of General Motors (GM) and Nissan
illustrates the potential importance of business process flexibility. GM lost over $4
billion in a failed joint venture with Fiat, while on the other hand Nissan has been able to
derive greater value from its joint venture with Renault; the contrasting fate of these joint
ventures has been attributed to the ability of alliance partners to reconfigure business
processes, to transfer managerial and technical capabilities, and to leverage synergies
through investments in IT (CXO 2004; Gomes-Casseres 2005; Renault 2008). The
corporate strategy literature also argues that firms engage in strategic alliances for greater
agility and quick access to new product markets or technological capabilities (Ahuja
2000; Vassolo, Anand and Folta 2004; Young-Ybarra and Wiersema 1999). This
suggests the need for greater consideration of the flexibility in business processes that are
required to fully leverage the value of strategic alliances.
Despite the importance of IT in an increasingly networked economy, to our
knowledge the quantitative impacts of flexible IT infrastructures have not been examined
in the context of strategic alliances. This context can yield new theoretical insights into
the underpinnings of IT business value. Prior studies on IT business value have theorized
that transaction and coordination costs are generally higher in markets than in hierarchies,
and hence, that IT investment should have a greater effect in facilitating markets than in
hierarchies (Brynjolfsson et al. 1994; Dewan, Michael and Min 1998). The Dynamic
Capabilities perspective, which would emphasize the transformative role of IT, can be
interpreted to suggest that flexibility becomes particularly important in the formation of
alliances that are collaboration-intensive. A synthesis of other existing theories suggests
that the need to adapt to changes in business conditions is highest in alliances involving
48
the most bilateral commitment in cooperatives activities (Young-Ybarra and Wiersema
1999). Therefore, we argue that IT investment can have an important role in joint venture
contexts, which are equity-based alliances more closely resembling hierarchies than non-
equity alliances, because joint ventures are highly collaboration-intensive and require a
greater degree of reconfiguration of resources than non-equity alliances.3
To further explore the implications of perspectives emphasizing flexibility in
business processes, we discuss a technology framework referred to as service-oriented
architecture (SOA), which has generated much interest of late for its guidelines and
principles for enhancing flexibility, modularity, and transparency of business processes
(Natis and Schulte 2003). We then examine the impact of IT investment and SOA in joint
ventures. Next, we identify specific features of inter-organizational collaboration that can
be enhanced by flexible IT infrastructure: highly-coupled or integrated business
processes, the sharing of tacit knowledge, or reconfiguration of processes or
recombination of products and services. We develop a method to identify collaborative
alliances based upon these features, and distinguish those alliances from arms-length
alliances. We conduct an empirical test to compare the influence of flexible IT
infrastructure in the firm-value contributions of collaborative alliances versus in arms-
length alliances. We use data from a panel of over 370 firms that are publicly listed in the
United States and that span multiple industries; these firms have collectively engaged in
more than 8,000 documented alliances over a period of 10 years from 1996-2006.
Empirical results show that IT flexibility has a greater effect in the context of
collaborative alliances than in arms-length alliances, suggesting a need for greater
3 The distinction between joint ventures and non-joint venture alliances is a common classification system in the strategy literature. Since these categories are based on the existence of equity, non-joint venture alliances are commonly referred to as non-equity alliances. We adopt the latter term.
49
consideration of the transformative role of IT, in addition to transaction cost and
coordination cost reduction, to understand the underpinnings of IT business value in
inter-organizational contexts.
III.2 Theoretical Framework Prior research on the business value of IT has emphasized the role of IT
investment in the reduction of transaction and coordination costs (Brynjolfsson et al.
1994; Dewan et al. 1998; Hitt 1999). First, IT can enhance coordination capabilities,
resulting in greater efficiency in the supply chain, lower inventory, and higher
productivity (Barua and Lee 1997; Mukhopadhyay and Kekre 2002; Rai, Patnayakuni
and Seth 2006). Second, IT can reduce transaction hazards, which stem from the
possibility of opportunistic behavior by business partners, particularly when incentives
are misaligned (Bensaou 1997; Bensaou and Venkatraman 1995; Nicolaou and McKnight
2006). The prevailing view in prior business value of IT studies is that both transaction
and coordination costs, and hence the business value impacts of IT, tend to be greater in
markets than in hierarchies. These insights are part of substantial work on the role of IT
investment in vertical integration and outsourcing (Dewan et al. 1998; Hitt 1999; Ray,
Wu and Konana 2009). However, we know far less about the influence of IT in the
context of strategic alliances, which are hybrid organizational forms representing a
continuum between hierarchies and markets (Gibbons 2005).
According to Almeida, Song and Grant (2002 p. 149), the formation and
maintenance of dynamic hybrid organizational forms “involve the creation of new
combinations of knowledge,” enabling the firm to create value that far exceeds the goal
of “transaction cost avoidance.” This suggests that new theoretical perspectives are
needed to complement existing interpretations of the theory of the firm that emphasize
50
transaction and coordination cost reduction. Particularly in dynamic contexts involving
the formation of hybrid organizational forms, the influence of IT may also be in
enhancing flexibility and agility that enhance the ability of firms to derive value from
alliance relationships. Alliances can enable firms to gain quick access to new product
markets, while also requiring core internal firm business processes to be transformed as
they link and integrate business processes across organizational boundaries (Ahuja 2000;
Vassolo et al. 2004; Young-Ybarra and Wiersema 1999).
Given the need to conceptually separate the incentives for alliance formation from
the capabilities of firms to benefit from them, our approach in this study is to control for
the factors that are known to encourage alliance formation as well as the business value
of IT, and then examine the moderating influence of flexible IT infrastructure on the
performance effects of alliance activity.
III.2.1 Business Value Effects of Information Technology in Joint Ventures
Among alliance contexts, we begin by considering the formation of joint ventures,
which are equity-based alliances involving bilateral investments in capital, technology,
and firm-specific assets (Gulati and Singh 1998). Joint ventures tend to be formed more
often in cooperation involving risky projects in which coordination is intrinsically
difficult, such as the joint development of new technology. The bilateral sharing of equity
in joint ventures creates an incentive for business partners to monitor each other, and to
share information through informal and formal channels. Since joint venture formation is
a dynamic context, involving the creation of collaboration-intensive, hybrid inter-
organizational forms (Zollo et al. 2002), this can be a useful context to understand the
role of IT investment.
51
Besides the influence of IT on transaction and coordination costs, this particular
context highlights two additional roles of IT as enabling the creation of new collaborative
inter-organizational forms. First, joint ventures involve a high degree of tacit knowledge
inherent in cooperative activities. By enhancing the accessibility of information and the
visibility of business processes, investments in IT can enhance firms’ capabilities to
search and detect new opportunities for innovation in the context of joint ventures
(Prahalad and Krishnan 2008). Detection of opportunities for innovation can become
costly because of the complexity in business processes, wherein firm-specific knowledge
of routines is often tacit (Zollo and Winter 2002). By increasing the visibility,
transparency, and codifiability of knowledge, investments in IT can enhance
“entrepreneurial alertness”, and enable firms to extend existing assets to new contexts
(Sambamurthy, Bharadwaj and Grover 2003). Second, joint ventures involve higher costs
in reconfiguration both in formation and in modification over the course of the alliance.
This is the case because joint ventures involve greater firm-specific assets and more
deeply collaborative activities. Through investments in IT, the digitization of business
processes can reduce the costs associated with reconfiguration of firm processes (Allen
and Boynton 1991; Byrd and Turner 2000; Duncan 1995), thereby enabling firms to
better create synergies in joint ventures.
For example, the joint venture between Hershey and Godrej, the Indian
confectionary, was made possible in part because Hershey had invested significantly to
overcome costly IT-related supply chain problems in the 1990’s. Hershey integrated its
supply chain on a global scale through decision support systems integrated with
centralized enterprise systems, and through robotic palletizers at its remote packaging
52
facilities that adjust automatically to new product specifications with minimal disruption
(Mans 2008; Reuters 2007). Supply chain flexibility enabled Hershey to form a broader
nexus of global partnerships, and to expand the reach of its products and processes
without overwhelming its supply capabilities. The ability to reconfigure business
processes through investments in IT enables firms to more effectively form new
boundary spanning processes (Gosain, Malhotra and El Sawy 2005), and hence, to better
capitalize on synergies with joint venture partners.
For a focal firm engaging in a portfolio of alliances, we consider how investments
in IT may influence the contribution of joint ventures to firm value. IT-enabled dynamic
capabilities can enhance a firm’s ability to utilize joint ventures to create new products or
services (Pavlou and El Sawy 2006), achieve greater reach into new geographical
markets, and obtain new market positioning (Sambamurthy et al. 2003). These enhanced
capabilities may not immediately be reflected in accounting measures such as sales,
though they are valued by market investors (Anand and Khanna 2000; Chan, Kensinger
and Keown 1997). Prior studies have argued for the use of firm-value based constructs in
studying the performance impacts of investments in IT, since such forward-looking
measures are less vulnerable than accounting-based measures to idiosyncrasies of
accounting practice (Bharadwaj, Bharadwaj and Konsynski 1999; Brynjolfsson, Hitt and
Yang 2002). Therefore:
Hypothesis 1: IT investment has a positive moderating influence in the effect of joint
ventures on firm value.
53
III.2.2 Business Value Effects of Service-Oriented Architectures In Joint Ventures
Among IT capabilities, SOA is closely associated with the dynamic capabilities of
process reconfiguration and opportunity detection (Cherbakov et al. 2005; Prahalad and
Krishnan 2008). SOA is a framework comprised of guidelines and principles that enable
greater flexibility, modularity, and transparency of business processes (Babcock 2007).
SOA-related capabilities are likely to require multiple years to reach maturity; and firms
with this broad strategic orientation are likely to have utilized earlier incarnations of SOA
technologies that emerged in the mid to late 1990’s, including object-oriented
technologies and service-based component architectures such as CORBA and Java Beans
(Natis and Schulte 2003). SOA does not represent a single technology or component of
technology that can be purchased or installed, but rather, is a unifying framework of
guidelines and principles under which multiple technologies have emerged and matured
to enhance capabilities for process reconfiguration and opportunity detection.
Two aspects of SOA capability are particularly relevant to process
reconfiguration. First, the existence of a services-based architecture enables functional
areas of an enterprise to be conceived as modular components that respond to individual
service requests. This allows components of a business to be designed with appropriate
levels of granularity and resiliency so that they can be more easily added, replaced, or
invoked in novel ways without needing to be rebuilt (Prahalad and Krishnan 2008).
Second, the use of a common data representation language, known as eXtensible Markup
Language (XML), enables messaging routines between functional components of the
enterprise to be reconfigured at minimal cost. Together, services-based architecture and
54
XML, which enable modularity of enterprise functions and standardization of messaging
routines, embody the principles of flexible IS design (Duncan 1995; Gosain et al. 2005;
Natis and Schulte 2003). Hence, SOA can facilitate greater agility and flexibility in the
establishment of new inter-organizational process linkages without sacrificing the
efficiency of these channels (Chatterjee, Segars and Watson 2006; McAfee 2005).
SOA enhances the transparency and visibility of business processes, in turn
enhancing the possibilities for detection of new business opportunities in the context of
joint ventures. Two aspects of SOA capability are particularly relevant to opportunity-
detection. First, the use of technical standards that comprise an ‘enabling layer’ referred
to as web services provide XML-ready interfaces with external or internal enterprise
functions (McAfee 2005). Web services help establish a common grammar in the
technical specification of application programmer interfaces (API’s), reducing their
context-specificity. This enables the firm to turn tacit knowledge into codified
knowledge, mobilize it, and re-apply it to new contexts; increasing the likelihood of
detecting value-creating opportunities in joint ventures (Jacobides and Winter 2005;
Teece, Pisano and Shuen 1997; Zollo and Winter 2002). Second, the breadth of
enterprise functionality in which SOA is used reflects the level of priority and progress
that the firm has made with respect to its SOA capabilities, in alignment with strategic
flexibility objectives. This indicates the extent to which the visibility and transparency of
business processes enabled by SOA extends across multiple functional areas.
For a focal firm engaging in a portfolio of alliances, we consider how capabilities
in SOA may influence the contribution of joint ventures to firm value. Joint ventures
involve relatively high costs in the reconfiguration of firm-specific assets, and the sharing
55
of tacit knowledge (Gulati and Singh 1998). Tacit routines or knowledge, while high in
the potential for novel innovations and value creation, reduce the likelihood of detection
of opportunities for innovation, and increase the costs of exchange of knowledge
resources (Galunic and Rodan 1998). As standardized interfaces and the modularization
of enterprise functions make business processes more explicit and well-defined,
knowledge becomes more codified. SOA can enhance a firm’s capacity for architectural
innovation, along the lines described by Henderson and Clark (1990), in that firms must
alter how the individual components of an enterprise relate to one another as they
reconfigure processes to leverage potential inter-firm synergies in a joint venture. Beyond
the performance impacts of overall IT infrastructure capability, SOA can bring specific
dynamic capabilities of process reconfiguration and opportunity detection that enable
firms to further leverage value from joint ventures. Therefore:
Hypothesis 2: SOA has a positively moderating influence in the effect of joint ventures
on firm value.
III.2.3 Business Value Effects of Service-Oriented
Architectures in Collaborative Alliances We next consider the aspects of collaboration in which the capabilities associated
with SOA should have a particularly important role. To better understand how the value
of alliances can be enhanced by business process flexibility, we consider a classification
system based on features of collaborative activity rather than the contractual form of the
alliance. In particular, we consider alliances to be collaborative if they include any of the
following characteristics, as listed in Table 6: 1) Sharing of firm-specific or tacit
knowledge, such as in joint design or development (Anand and Khanna 2000; Gulati and
56
Singh 1998; Zollo et al. 2002). 2) Reconfiguration of business processes or
recombination of products, services or processes across organizational boundaries
(Eisenhardt and Martin 2000; Zollo et al. 2002) or 3) Heavy coupling of inter-
organizational business processes (Gosain et al. 2005; Kim and Mahoney 2006; Zaheer
and Venkatraman 1994). These features of collaboration involve transformation and
integration of products, systems, or processes— capabilities that can be enhanced by
flexibility in business processes.4
Collaborative alliances are useful contexts to examine the influence of the
codification and modularity capabilities of SOA, since SOA can be particularly beneficial
in mitigating the complexity of collaboration involving the sharing of tacit knowledge
(Chesbrough and Spohrer 2006; Sanchez and Mahoney 1996). The collaborative
examples in the appendices (see Table 7) suggest alliance partners working together to
develop new products or services; such as the joint competency center in example #2 or
the joint development of new oral care products in example #3. Such examples exemplify
cooperation involving tacit knowledge and firm-specific assets. Because of the
complexity in the collaborative processes, it becomes critical for firms to be able to
define business processes at appropriate levels of granularity or modularity (Baldwin and
Clark 2000). Capabilities in SOA can help codify aspects of processes that are inherently
tacit—aiding in their reconfiguration or adaptation to new inter-organizational contexts
(Chesbrough and Spohrer 2006; Galunic and Rodan 1998).
Second, collaborative alliances are coordination-intensive. Collaborative alliances
involve joint activities that invoke business processes intensively, and involve an active
4 Collaborative alliances can be joint-ventures or non-equity alliances. Table A2 in Appendix 3 shows the proportional breakdown in alliance types in our sample.
57
flow of information and knowledge between firms. In the collaborative example #1 of
Table 7, we read that two firms (Sun and Sprint) plan to provide an integrated web
solution that will involve coordination of sales and marketing processes. Business process
flexibility is needed in establishing and maintaining such coordination, in order to adapt
to changes in business conditions or business requirements as they arise. Without
flexibility of IT systems, the firms would then face high costs both in modifying business
processes within the relationship or in trying to disengage themselves from the
relationship in case it turns out to be a sub-optimal arrangement (Young-Ybarra and
Wiersema 1999).
Third, collaborative alliances are more likely to require reconfiguration or
modification of business processes in the process of alliance formation. Particularly in the
dynamic context of formation, such collaborative environments involve high
requirements in recombination of resources or reconfiguration of processes.
Recombination of products and services in alliances is common in household product
industries, but also in biotechnology, semi-conductors, software, and numerous other
industries. The collaborative example #3 (of Table 7) describes the recombination of
Colgate’s oral care products with Nestlé’s confectionary products to create new products
that "taste good, clean teeth and freshen breath." Recombination is closely tied to the
need for business process reconfiguration, which requires flexibility in IT-driven business
processes, since the recombination of products or services is accompanied by a
reconfiguration of business processes.
Based on the role of flexibility in all three aspects of collaboration discussed
above, coordination-intensity, recombination, and the sharing of tacit knowledge, we
58
argue that alliances that require integration of resources or transformation of processes
are contexts in which we should discern the business value impact of SOA.
Hypothesis 3: SOA has a positive moderating influence in the effect of collaborative
alliances on firm value.
III.2.4 Comparative Effects of SOA in Collaborative vs. Arms-length Alliances
It is helpful to contrast collaborative-alliances with arms-length alliances, in order
to distinguish the influence of SOA in these contexts. We define arms-length alliances
simply as the set of alliances that are lacking in the features attributed to collaborative
alliances. An arms-length alliance is more likely to involve products or services that are
provided, sold or exchanged between firms; rather than jointly developed, integrated, or
recombined as in collaborative alliances. Examples of arms-length alliances include
agreements for the exchange of products or services, usually for direct monetary
compensation, and usually based on licenses or contracts for a finite length of time.5
5 Please refer to Table 7 for examples.
Arms-length alliances may have benefits in the realm of strategic marketing, in gaining or
offering gaining exclusive access to product markets, or for the sharing of name brands.
However, they do not involve joint design or development of products or services,
recombination of products or services, or reconfiguring of business processes for inter-
organizational integration. In general, arms-length alliances are less likely to involve
highly asset-specific resources in the collaborative processes, or to involve an actively
coordinated flow of information or knowledge between alliance partners.
59
We argue that the influence of SOA will be greater in the firm-value effects of
collaborative alliances than in arms-length alliances, for two reasons. First, the
integration of resources in formation or modification of collaborative alliances involves
greater costs of reconfiguration than in arms-length alliances. Collaborative alliances
involve greater inter-coupling of business processes as well as exchange of tacit
knowledge, suggesting greater complexity and multiplicity of interfaces between alliance
partners. To mobilize resources amidst this complexity, partnering firms need to be able
to codify and define business processes at precise and appropriate levels of granularity,
which is made possible by capabilities in SOA. Second, in response to changes in
business requirements or conditions, collaborative alliance partners often need to modify
or reconfigure business processes within the alliance; the need to adapt within the
alliance becomes even greater with the mutual commitment inherent in the collaborative
relationship (Young-Ybarra and Wiersema 1999). With greater mutual commitment,
evolving business models will demand ongoing modification of business processes to
leverage common firm-specific assets (Young-Ybarra and Wiersema 1999). Therefore,
the role of business process flexibility becomes particularly important in the context of
collaborative alliances— those that involve deeply intertwined processes, tacit knowledge
sharing, and higher reconfiguration costs.
Hypothesis 4: The influence of SOA in the effect of collaborative alliances on firm value
is greater than the influence of SOA in the effect of arms-length alliances on firm value.
60
III.3. Research Design and Methodology
III.3.1 Data The data for this study comes from several sources. First, we obtained the data
related to IT investment from InformationWeek (IWeek) surveys from 1999 to 2006.
InformationWeek surveys are considered to be reliable, and have been used in prior
academic studies (Bharadwaj et al. 1999; Rai, Patnayakuni and Patnayakuni 1997).6
Data on several SOA practices was available in the IWeek survey of year 2003.
While it is possible that firms’ utilization of SOA practices varied over the time of the
panel, the technology and business practices that comprise SOA are reflective of a
broader set of practices that create the conditions for flexibility in IT infrastructure (Natis
and Schulte 2003).
Respondents are Chief Information Officers, Chief Technology Officers, or other most
senior-level IT executives in the firm; those in the best position to be knowledgeable of
firm IT investment figures and IT practices. IT investment is reported as a percentage of
firm revenue. Although different firms are included in the IWeek sample in each year, a
given firm is present for an average of three out of the seven years. The final sample
includes firms from 63 different industries on the 3-digit NAICS level.
7
6 Bharadwaj et al. (1999) confirm that IT spending data correlates highly (with coefficients between 0.85 to 0.94) with the only other source of data for IT budgets and computer capital known at the time, an annual survey by International Data Group (IDG). Average IT spending as a percentage of revenue is consistently between 2% and 3% for both datasets, as well as in ours.
Such practices would have developed slowly and over at least a
multiple number of years. Hence, a panel from 2000-2006 is short enough that we can
reasonably assume that the flexible IT infrastructure practices are constant over this
period while it is long enough to correct for the effects of potential unobserved
7 In fact, earlier incarnations of SOA technologies began to become widely known in the mid to late 1990’s, with the emergence of XML and service-based component architectures such as CORBA and Java Beans, and it is likely that many of the firms that reported engaging in SOA practices began in earlier years to develop flexible IT practices around those earlier incarnations of SOA technology.
61
heterogeneity and endogeneity through fixed-effects panel analysis.8
Second, for publicly listed and identifiable firms in the IWeek sample, we
retrieved 8,678 alliance announcements from the SDC Platinum Database (a product of
The Thomson Corporation). Alliance announcements originate from publicly available
sources such as trade publications, SEC filings, and news and wire sources. Although it
does not track every deal entered into by U.S firms, SDC Platinum is considered to be
among the most comprehensive sources of data on alliances and has been used in many
prior academic studies (Anand and Khanna 2000; Lavie 2007). Alliance records in the
SDC Database included dates, deal type, description, names and SIC codes of all
participating firms, a listing of activities involved in the alliance, and a flag indicating
whether the alliance is a joint venture. Of the 2,005 total joint ventures in our sample, 98
(less than 5%) of them involved two or more firms in our sample. Of the remaining 6,673
alliances, 493 (about 7%) involved two or more firms in the sample.
To check this
assumption, we used different windows of time in estimation models as a check for
robustness.
9
8 This consideration has also been made in prior panel data studies involving a construct measured at a single point of time, such as in Black, S.E., L.M. Lynch. 2001. How To Compete: The Impact Of Workplace Practices And Information Technology On Productivity. Review of Economics & Statistics 83(3) 434.
The rest involved
an alliance between an in-sample focal firm, for which we had IWeek data, and out-of-
sample partners for which we had no firm level data on IT investment, or SOA practices.
In many cases, however, we were able to obtain other firm-level or industry-level
9 We refer to joint-ventures versus non-equity alliances for the discussion on sample representation, because all alliances in the sample are classified as one or the other. We used content-analysis procedures on the descriptions of 3,129 of the alliances, to classify 1,330 of them as collaborative and 1,799 as arms-length. Further details are provided in the discussion of variables, and in the appendix.
62
characteristics of partner firms from Compustat and the Bureau of Economic Analysis.10
Third, we retrieved performance variables, as well as firm-level and industry-level
controls from the Compustat North America database. A larger sample to verify the
baseline IT business value model included 369 firms and 1126 firm-year observations in
the unbalanced panel dataset of firms present in at least one of the InformationWeek
(IWeek) surveys from 1999 to 2006. Of the 369 firms, 169 of them were present in the
IWeek 2003 survey in which detailed questions regarding practices that support SOA
were asked, with 635 observations in this sub-sample.
To verify the representativeness of alliance counts in our dataset with actual population
of alliances, we used a random number generator to select 10% of firms in the final
sample, and conducted comprehensive manual searches for alliance and joint venture
formation announcements in Factiva news database between the years 1996 and 2007.
We find a statistically significant correlation of 0.81 (p=0.0000) between the SDC
alliance counts and Factiva alliance announcement counts. Our findings are consistent
with (Schilling 2009), who show that the alliance listings in the SDC database are well-
representative of the population of alliances.
10 In comparison to their industry averages of publicly listed firms, the firms in our sample are larger, with approximately three and a half times the number of employees. These firms also have lower R&D investment intensities (6.6% vs. 20% of revenue), lower advertising intensities (4.9% vs. 6.3%), and lower Tobin’s q than their industry averages (1.46 vs. 1.96). In relation to their alliance partners, firms in our sample are smaller in terms of the number of employees (37.8 vs. 41.7 thousand), have smaller R&D intensity (6.6% vs. 7.7%), and larger advertising intensities (4.9% vs. 2.9%). Regarding IT-intensity, our data allows only comparison with out-of-sample firms on industry-level measures of IT from BEA. We find that industry-level IT capital intensities of firms in our sample are lower than those of their alliance partners (19.5% vs. 22.5% of combined hardware, software, and communications-equipment assets divided by total assets), although firm-level IT intensities may be higher than those of alliances partners. A direct comparison between firm-level IWeek figures and the publicly available figures from the Bureau of Economic Analysis (BEA) is not possible because they are in different units: The former presents firm-level IT expenditure ratios while the latter presents industry-level IT capital expenditures. However, we see a positive correlation of 0.27, significant at α=0.01, between firm and industry-level measures from these distinct data sources. Basic firm parameters in our sample (firm size, Tobin’s q, advertising intensity, R&D intensity, IT-intensity, and related diversification) are comparable to those in (Bharadwaj et al. 1999).
63
III.3.2 Key Variables
The dependent variable is Tobin’s q (Q), which has been used to measure the
performance impacts of alliances as well as of IT investment (Bharadwaj et al. 1999;
Lavie 2007): Tobin’s q = (MVE + PS + DEBT)/TA, where PS is the liquidating value of
the firm’s outstanding preferred stock, and TA is the book value of total assets. MVE is
the average of twelve end-of-month market values of equity obtained from the Center for
Research in Security Prices, which makes this measure less vulnerable to end-of-year
market volatility.
The SOA measure reflects four critical aspects of SOA capability described in the
theory section: 1) the deployment of services-based architecture (SBA), 2) the use of the
common data representation language, called eXtensible Markup Language (XML), that
is used in SOA (XML), 3) the use of technical standards that comprise an ‘enabling
layer’, referred to as web services, on top of which SOA is built (WebServ), and 4) the
number of business functions for which SOA is used, which proxies for firm-wide
breadth of SOA use (SOA_BREADTH). Since each of the components of our summative
measure for SOA has a different scale, we standardized the SOA measure components
SBA, XML, WebServ, and SOA_BREADTH. The indicators are not necessarily
interchangeable and the direction of causality flows from these indicators to the main
construct. Hence, according to the criteria in Jarvis, Mackenzie and Podsakoff (2003),
these are formative indicators. An unrotated principal components analysis (PCA) reveals
that all items comprising the measure of SOA load positively onto the first principal
component, with weightings for each of between 0.41 and 0.56. The first principal
component is above the 1.0 threshold with a value of 1.7; hence, each item contributes
64
significantly to the SOA measure. We use the first principal component in all subsequent
analysis.
The measures of alliance formation are the number of new alliance
announcements in any given year. Alliances are classified as either joint ventures (JV) or
non-equity alliances (Non-Eq), and also either as collaborative (COLLAB) or arms-length
alliances (Arms-len). While the total sample of firms had 8,678 alliances, only 3,129 of
these alliances involved the 169 firms for which we had SOA measures. Since no
corresponding categorical or quantitative data field currently exists in the SDC Platinum
database, we developed and validated a procedure of automated content analysis to
classify each of the 3,129 alliances as collaborative or arms-length. First, we evaluated
and confirmed the feasibility of alliance description “deal text” content for analysis. Next,
we developed a set of simple coding rules for automated classification of alliances as
collaborative or arms-length based on their descriptions, using a content-analysis
procedure adapted from a set of exemplars of content-analysis methods in prior research
(Nag, Hambrick and Chen 2007; Tetlock, Saar-Tsechansky and Mackskassy 2008).
Finally, we examined the outcome of automated coding for both sufficient variation in
data, robustness of results, and consistency with manual coders. Detailed steps of this
procedure are given in Appendix 3.
IT intensity (IT) indicates the percentage of revenue represented by the firm’s
total worldwide IT budget. IT expenditure includes hardware, software, network
infrastructure, salaries and recruitment of IT professionals, internet-related costs, and IT-
related services and training. Given the comprehensiveness of this measure in capturing
all of a firm’s IT-related expenses, this construct is a proxy for overall information-
65
intensity of a firm’s operations. Other control variables related to the characteristics of
firm alliance portfolios include the percentage of international alliances, percentage of
firms in the same industry (proxy for bilateral competition), and scope of alliance
activity, as in Lavie (2007). For a limited portion of the sample, we were able to obtain
measures of partner characteristics, including number of employees, R&D, advertising,
free cash flow, profitability, and industry-average IT investment. All control variables are
defined in Appendix 1. Table 1 shows summary statistics and correlations.
III.3.3 Estimation Model
To connect the theory with the econometric model, we derive a baseline model of
IT business value in Appendix 2 and reconcile it with the model in Bharadwaj et al.
(1999). In theory, joint ventures create value that is not quantified in the accounting
books: intangible inter-organizational resources which can generate future profits through
the joint development of new products or services (Anand and Khanna 2000; Chan et al.
1997). Hence, we begin by incorporating JV, the number of joint-ventures formed
annually; as well as Non-Eq, the number of annually formed non-equity alliances, into
the Tobin’s q framework.
Qi,t = βo + βSOA SOAi + βIT ITi,t + βJ JVi,t + βNE Non-EQi,t + XC βC + ∑t βt yeart + ∑i βi industryi + ui + εi,t (1)
Consistent with Bharadwaj et al. (1999), the matrix XC represents controls for
capital intensity, Herfindahl index (a measure of industry concentration), industry
regulation, market share, diversification, the log of the number of employees, R&D, and
advertising. Consistent with Lavie (2007), the matrix also contains controls for
characteristics of the firm’s alliance network: the scope of alliance activities, the
66
technological basis of alliance activities, and the percentage of international alliances.
Equation (1) also includes year and industry (two-digit NAICS) dummy variables.
Next, we formalize the hypotheses and apply them to the model. Suppose that a
firm entering into a joint venture obtains a total net present value of in net profits
generated as a result of the alliance. is the difference between the strategic benefit BJ
of a joint venture and its cost CJ; = BJ – CJ.11 CJ is comprised of the following: costs
of coordination cJ, costs of transaction hazards hJ, and costs of reconfiguration rJ: CJ = cJ
+ hJ + rJ . Prior theory, as discussed above, suggests that IT can have a role in decreasing
each component of CJ, which we represent using three monotonically decreasing
functions on IT, δc, δh, and δr , such that 0 < δc,h,r < 1.12
Hence:
The net contribution of each joint
venture to firm value becomes = BJ – (cJδc + hJδh + rJδr +αitIT).
itrJhJcJitrJhJcJJJ rhcIT
rIT
hIT
cCITIT
αδδδαδδδπ −++=+∂∂
+∂∂
+∂∂
−=∂∂
−=∂∂ ˆˆˆ)(ˆ
where ( ) represents the gross marginal contribution of IT investment to
the value of the joint venture (noting that the sign of thcIT ,,δ∂∂ is negative), αit represents
11 The strategic benefit BJ of the joint venture may include potential profits generated by new products or services, reach into new geographical markets, or new market positioning. For the sake of simplicity we assume that the gross benefit (BJ) of a joint venture to firm value is fixed and independent of SOA, but that joint venture costs CJ are reduced by SOA. 12 The are many possible forms of such functions; but for the sake of illustration here is an example: Suppose we set δc = )exp( ITcα− , δh = )exp( IThα− , and δr = )exp( ITrα− , in which there are diminishing returns to IT and differential effects on the three components of costs:
ITITrIThITcC itrhcJ αααα +−+−+−= )exp())(exp())(exp( such that as IT 0, CJ c + h + r. The marginal influence of IT on alliance value is
itrrJhhJccJJ ITrIThITcIT
αααααααπ −−+−+−=∂∂ )exp()exp()exp(ˆ
Jπ̂
Jπ̂
Jπ̂
Jπ̂
rJhJcJ rhc δδδ ˆˆˆ ++
67
the marginal cost, and JITπ̂
∂∂ represents the net change in joint venture value for each
unit of IT.
As utilization of IT and SOA increase, we consider whether a reduction in costs
associated with coordination, transaction, and reconfiguration will be greater than all
additional IT-related expenses as a result of the alliance αit. Hence, we model the
coefficient βJ as βJ = βJ0 + β1IT + β2SOA. The contribution of each joint venture to firm
value is . Hypothesis 1 and Hypothesis 2 state that the influence of IT and SOA,
respectively, on the value contribution of each joint venture (or collaborative alliance) is
positive 0ˆ
1 >=∂∂
∂∂
=∂∂ βπ
s
J
JVq
ITIT and 0
ˆ2 >=
∂∂
∂∂
=∂∂
βπ
s
J
JVq
SOASOA. To test Hypothesis 3
and Hypothesis 4, we replace the construct of JV with Collab, and Non-Eq with Arms-
length. Hypothesis 3 states 0ˆ
3 >=∂
∂∂
∂=
∂∂
βπ
s
C
Collabq
SOASOA. If the reconfiguration costs
are sufficiently larger in the case of collaborative alliances—then the impact of SOA will
be greater in the case of collaborative alliances than in arms-length alliances. Hypothesis
4 can be written as: ,ˆˆ AC SOASOAππ
∂∂
>∂
∂ or β3 > β4.
III.3.4 Estimation Techniques
Our analysis relies primarily on fixed-effects panel estimations, a parsimonious
way of removing any firm-specific omitted factors that are not generally thought to be
varying rapidly over short periods of time (e.g. organizational culture, managerial
capability, and brand reputation), relegating any remaining endogeneity to idiosyncratic
time-varying unobservables that are comparatively small. In all models, we used robust
sJ JV
q∂∂
=π̂
68
standard errors to correct for possible non-spherical errors.13
We estimated each model with and without additional controls for alliance
partners, including R&D, advertising, cash flow, profitability, and number of employees
of alliance partners. Since these control variable values are not available for all alliance
partners, sample size is substantially reduced when alliance partner control variables are
included. The coefficients of interaction terms of interest remain similar in magnitude,
direction, and significance; suggesting that we can rely on the main regression results
which use a larger portion of the data.
Since the SOA variable is a
constant, we also present random-effects estimation results in order to show its direct
influence on Tobin’s q, since such effects cannot be shown in a fixed-effects model. For
the other coefficients, our results show a similarity in coefficient estimates (in direction
and significance) between random and fixed effects models, suggesting that the estimates
are robust to the choice of panel estimator. Since our coefficients of interest are the
interaction terms that vary over time, we can rely on fixed-effects estimators, which have
better consistency properties than random effects or pooled-OLS estimators (Greene
2003).
13 There would be a reason to cluster errors by individual joint venture in order to correct for the sample containing both sides of a joint venture dyad. But this occurs in such small proportion of cases that the net benefit of such a correction would be negligible.
69
III.3.5 Results
To relate this study to prior studies in the business value of IT, we estimate the
baseline model with no joint ventures or SOA. Estimation results of baseline IT value are
in Table 2. In accordance with equation (A.3) of Appendix 2 in which we show that the
y-intercept has a value of one, estimates of the constant βo are close to one. The random-
effects estimate for βIT, in the model including all (undifferentiated) alliances (Table 2,
column 3) shows that each 10% increase in ratio of IT expenditure to revenue is
associated with a 0.1683 increase in Tobin’s q.14 To put this in economic perspective, the
average firm in our sample has annual revenues of $10 billion, total replaceable assets
worth $10.9 billion, and a Tobin’s q of 1.46. For such a firm, a one standard-deviation
increase (=0.04) of IT-intensity amounts to ($10 billion × 0.04=) $400 million of
additional annual investment in IT. According to the estimate of β2, this is associated
with an increase of 0.06732 in Tobin’s q, or a market-value increase of about 0.06732 ×
$10.9 billion, or $734 million. Considering that many of the beneficial impacts of IT may
be unobserved externally and hence, undervalued, a market value premium of 83.5% (=
734/400 – 1) on IT investment is substantial. Across all specifications in Table 2 and
Table 3, our coefficient estimates for IT range from 0.518 to 3.681; well within the range
of -1.72 to 9.24 in Chari, Devaraj and David (2008), and reasonably close to the range of
0.15 to 0.70 in Bharadwaj et al. (1999).15
14 Note that units of IT-intensity (as in advertising. and R&D), are in straight proportions. Each 1-unit increase (or 100% increase) in IT intensity is associated with an increase in Tobin’s q of 1.683. Hence a 10% increase in IT-intensity is associated with a 0.1683 increase in Tobin’s q, and a one-standard deviation increase in IT-intensity (4%) is associated with a 0.06732 increase in Tobin’s q.
In addition, we note that IT investment by
15 Due to the difference in sample years (by a decade), different sample of firms, and our panel estimation techniques on pooled data rather than the separate annual OLS regression estimates in Bharadwaj et al. (1999), results are as expected slightly different from Bharadwaj et al. (1999). Nevertheless, some similarities are seen across the studies. Of the coefficients in Bharadwaj et al. (1999) that are the same in
70
itself, apart from SOA, appears to have positive and significant interaction effect with
joint ventures.
Hypothesis 1, which states that IT investment has a positive effect in the value
contribution of joint ventures, is tested in the estimates of the coefficient β1 shown in all
columns of Table 3. In support of Hypothesis 1, the estimate of β1 is positive and
significant. Fixed-effects, random-effects, and OLS estimation yield approximately the
same coefficient estimates; the Hausman statistic comparing the random and fixed-effects
estimations is insignificant, suggesting that unobserved firm fixed-effects are not
seriously biasing the results.
Hypothesis 2 predicts that SOA will have a positive influence on the value
contribution of each joint venture. Estimation results in Table 4, showing positive and
significant estimates for β2, support this hypothesis. Hypothesis 3 predicts that SOA will
have a positive influence on the value contribution of each collaborative alliance.
Estimation results in Table 5, showing positive and significant estimates for β3, again
support this hypothesis. The results are economically significant. An increase in one-
standard deviation in the measure of SOA is associated with an increase in the market-
value contribution of each collaborative alliance by (0.151×1.28) = 0.193, according to β3
in column (4) of Table 5. Assuming a firm with the mean value in tangible assets of
$10.9 billion, this amounts to an increase of $2.1 billion in the value associated with each
collaborative alliance.
direction (not necessarily statistical significance) across years, our results show the same direction of impact across model specifications in IT, industry concentration, industry Tobin’s q, capital intensity, and market share as in the previous study. Other than employees and advertising, none of the other coefficients estimates in Bharadwaj et al (1999) have the same directional effect in all years.
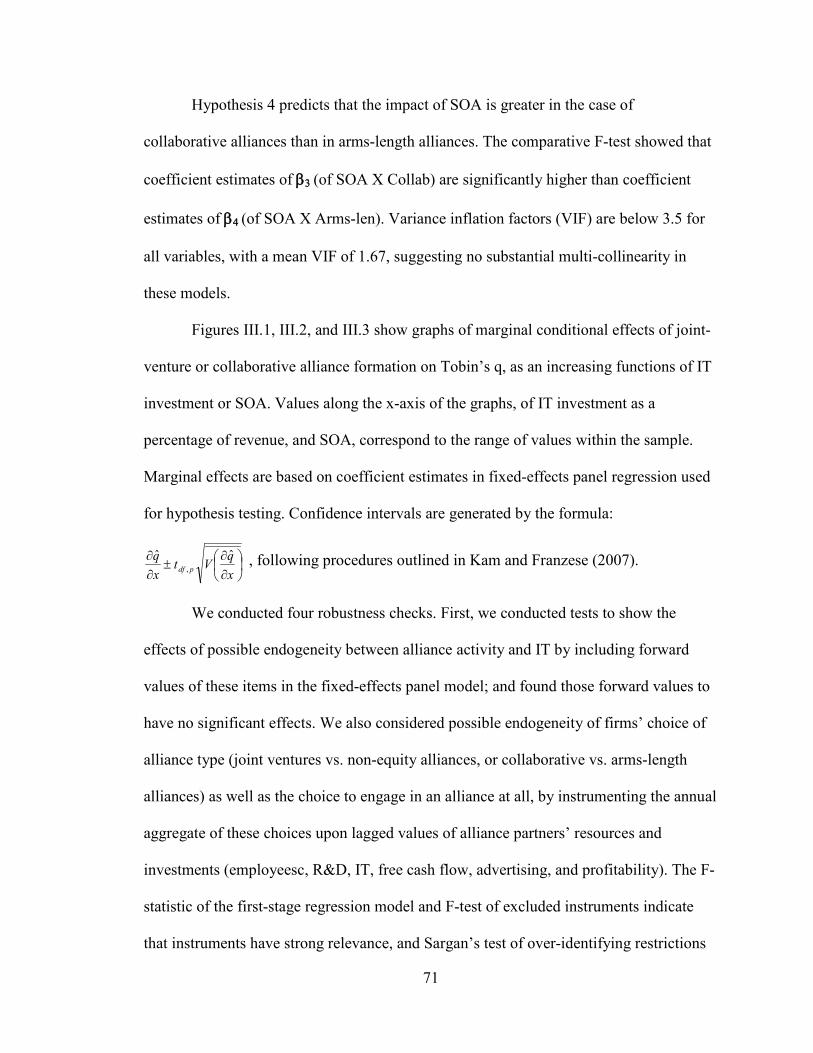
71
Hypothesis 4 predicts that the impact of SOA is greater in the case of
collaborative alliances than in arms-length alliances. The comparative F-test showed that
coefficient estimates of β3 (of SOA X Collab) are significantly higher than coefficient
estimates of β4 (of SOA X Arms-len). Variance inflation factors (VIF) are below 3.5 for
all variables, with a mean VIF of 1.67, suggesting no substantial multi-collinearity in
these models.
Figures III.1, III.2, and III.3 show graphs of marginal conditional effects of joint-
venture or collaborative alliance formation on Tobin’s q, as an increasing functions of IT
investment or SOA. Values along the x-axis of the graphs, of IT investment as a
percentage of revenue, and SOA, correspond to the range of values within the sample.
Marginal effects are based on coefficient estimates in fixed-effects panel regression used
for hypothesis testing. Confidence intervals are generated by the formula:
∂∂
±∂∂
xqVt
xq
pdfˆˆ
, , following procedures outlined in Kam and Franzese (2007).
We conducted four robustness checks. First, we conducted tests to show the
effects of possible endogeneity between alliance activity and IT by including forward
values of these items in the fixed-effects panel model; and found those forward values to
have no significant effects. We also considered possible endogeneity of firms’ choice of
alliance type (joint ventures vs. non-equity alliances, or collaborative vs. arms-length
alliances) as well as the choice to engage in an alliance at all, by instrumenting the annual
aggregate of these choices upon lagged values of alliance partners’ resources and
investments (employeesc, R&D, IT, free cash flow, advertising, and profitability). The F-
statistic of the first-stage regression model and F-test of excluded instruments indicate
that instruments have strong relevance, and Sargan’s test of over-identifying restrictions
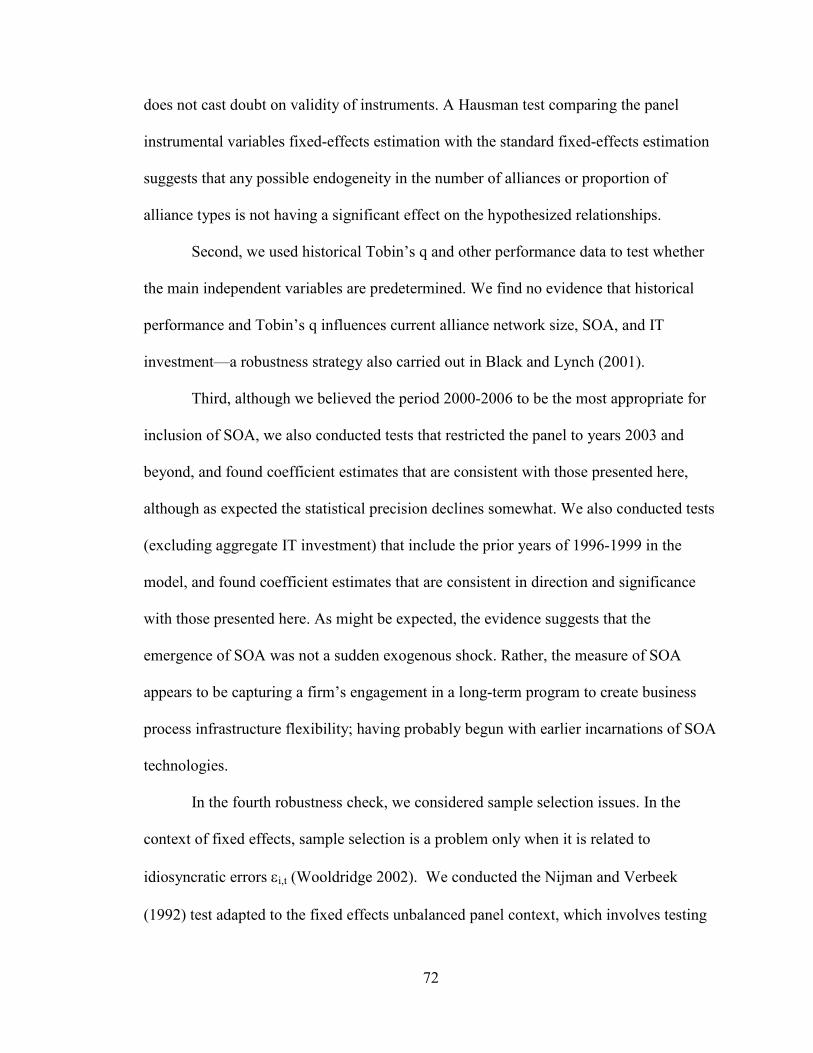
72
does not cast doubt on validity of instruments. A Hausman test comparing the panel
instrumental variables fixed-effects estimation with the standard fixed-effects estimation
suggests that any possible endogeneity in the number of alliances or proportion of
alliance types is not having a significant effect on the hypothesized relationships.
Second, we used historical Tobin’s q and other performance data to test whether
the main independent variables are predetermined. We find no evidence that historical
performance and Tobin’s q influences current alliance network size, SOA, and IT
investment—a robustness strategy also carried out in Black and Lynch (2001).
Third, although we believed the period 2000-2006 to be the most appropriate for
inclusion of SOA, we also conducted tests that restricted the panel to years 2003 and
beyond, and found coefficient estimates that are consistent with those presented here,
although as expected the statistical precision declines somewhat. We also conducted tests
(excluding aggregate IT investment) that include the prior years of 1996-1999 in the
model, and found coefficient estimates that are consistent in direction and significance
with those presented here. As might be expected, the evidence suggests that the
emergence of SOA was not a sudden exogenous shock. Rather, the measure of SOA
appears to be capturing a firm’s engagement in a long-term program to create business
process infrastructure flexibility; having probably begun with earlier incarnations of SOA
technologies.
In the fourth robustness check, we considered sample selection issues. In the
context of fixed effects, sample selection is a problem only when it is related to
idiosyncratic errors εi,t (Wooldridge 2002). We conducted the Nijman and Verbeek
(1992) test adapted to the fixed effects unbalanced panel context, which involves testing
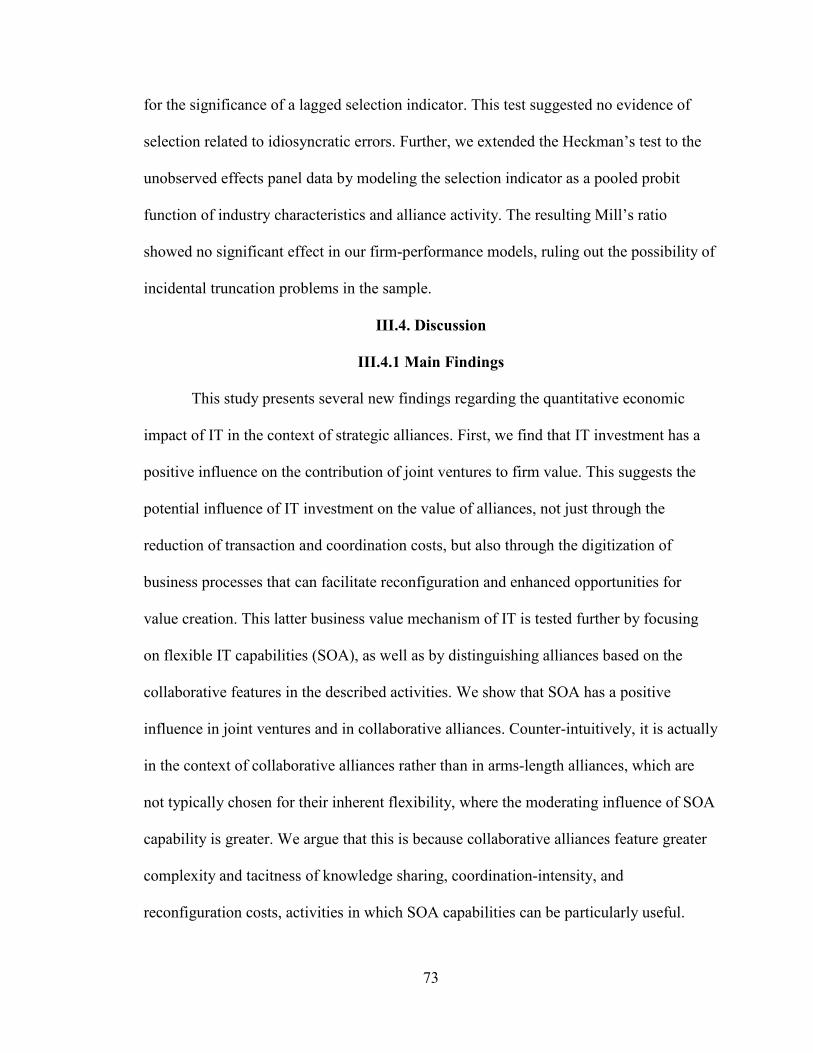
73
for the significance of a lagged selection indicator. This test suggested no evidence of
selection related to idiosyncratic errors. Further, we extended the Heckman’s test to the
unobserved effects panel data by modeling the selection indicator as a pooled probit
function of industry characteristics and alliance activity. The resulting Mill’s ratio
showed no significant effect in our firm-performance models, ruling out the possibility of
incidental truncation problems in the sample.
III.4. Discussion
III.4.1 Main Findings
This study presents several new findings regarding the quantitative economic
impact of IT in the context of strategic alliances. First, we find that IT investment has a
positive influence on the contribution of joint ventures to firm value. This suggests the
potential influence of IT investment on the value of alliances, not just through the
reduction of transaction and coordination costs, but also through the digitization of
business processes that can facilitate reconfiguration and enhanced opportunities for
value creation. This latter business value mechanism of IT is tested further by focusing
on flexible IT capabilities (SOA), as well as by distinguishing alliances based on the
collaborative features in the described activities. We show that SOA has a positive
influence in joint ventures and in collaborative alliances. Counter-intuitively, it is actually
in the context of collaborative alliances rather than in arms-length alliances, which are
not typically chosen for their inherent flexibility, where the moderating influence of SOA
capability is greater. We argue that this is because collaborative alliances feature greater
complexity and tacitness of knowledge sharing, coordination-intensity, and
reconfiguration costs, activities in which SOA capabilities can be particularly useful.
74
III.4.2 Implications for Research
This study contributes to prior literature on the role of IT in inter-organizational
relationships by considering alliance activities that have a broader scope in terms of how
firms collaborate— because alliances not only involve the exchange of goods or services,
but also the joint development of goods and services. In collaborative alliances, firms
establish new inter-organizational business processes, modify existing business
processes, and reconfigure resources. While enhanced coordination is one way that IT
can contribute to alliance success, the enhancement of flexibility in business processes
appears to be another impact of IT. Alliances provide a suitable context for empirical
verification of these concepts because they encompass a large variety of organizational
forms and governance structures—from those that resemble arms-length transactions to
those that involve more deeply intertwined collaborations. This variation is useful in
studying the role of IT infrastructure capabilities in leveraging value from frequent
collaborative partnerships.
This study adds to the prior understanding of how enhanced alliance capabilities
can have firm-level impacts. Alliance capabilities have a direct bearing upon innovation
outcomes such as new products and services, which generate value at the firm level.
There can potentially be many firm resources that are being reconfigured around a firm’s
alliances, in some cases more effectively than others, and which may not be observed as
transaction or process-level outcomes. Hence, market-value based firm performance
measures are useful in assessing the value that firms derive from alliances.
III.4.3 Managerial Implications
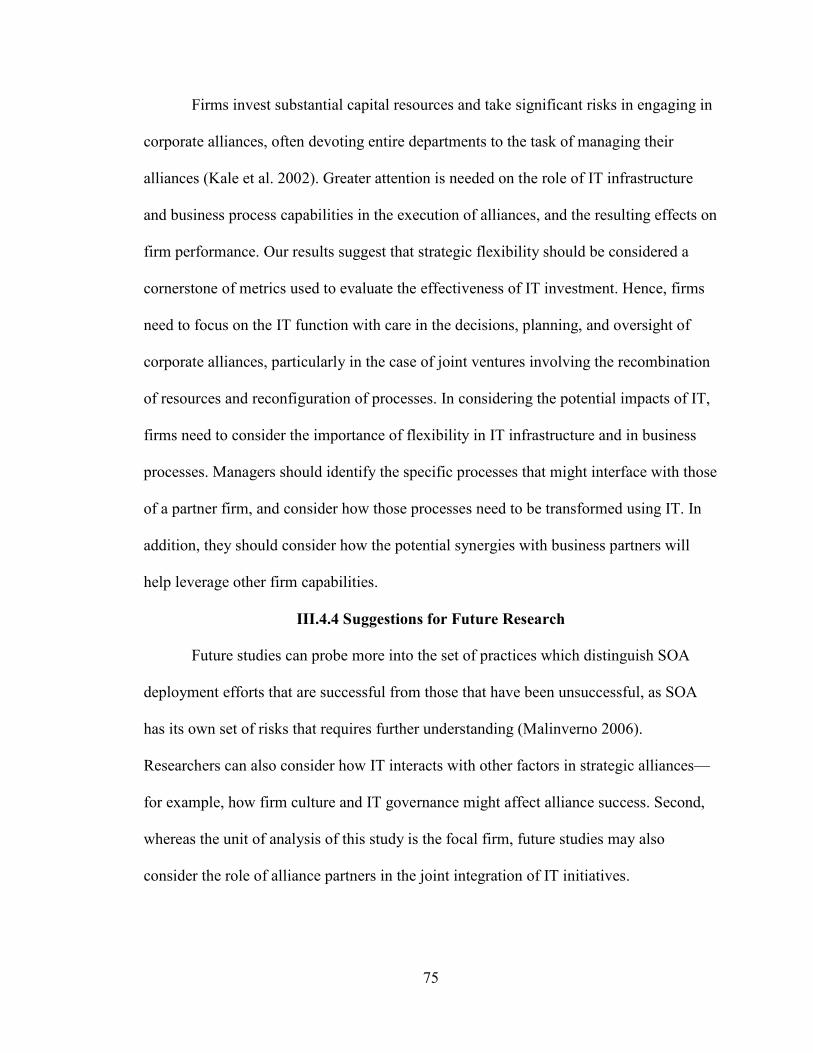
75
Firms invest substantial capital resources and take significant risks in engaging in
corporate alliances, often devoting entire departments to the task of managing their
alliances (Kale et al. 2002). Greater attention is needed on the role of IT infrastructure
and business process capabilities in the execution of alliances, and the resulting effects on
firm performance. Our results suggest that strategic flexibility should be considered a
cornerstone of metrics used to evaluate the effectiveness of IT investment. Hence, firms
need to focus on the IT function with care in the decisions, planning, and oversight of
corporate alliances, particularly in the case of joint ventures involving the recombination
of resources and reconfiguration of processes. In considering the potential impacts of IT,
firms need to consider the importance of flexibility in IT infrastructure and in business
processes. Managers should identify the specific processes that might interface with those
of a partner firm, and consider how those processes need to be transformed using IT. In
addition, they should consider how the potential synergies with business partners will
help leverage other firm capabilities.
III.4.4 Suggestions for Future Research
Future studies can probe more into the set of practices which distinguish SOA
deployment efforts that are successful from those that have been unsuccessful, as SOA
has its own set of risks that requires further understanding (Malinverno 2006).
Researchers can also consider how IT interacts with other factors in strategic alliances—
for example, how firm culture and IT governance might affect alliance success. Second,
whereas the unit of analysis of this study is the focal firm, future studies may also
consider the role of alliance partners in the joint integration of IT initiatives.
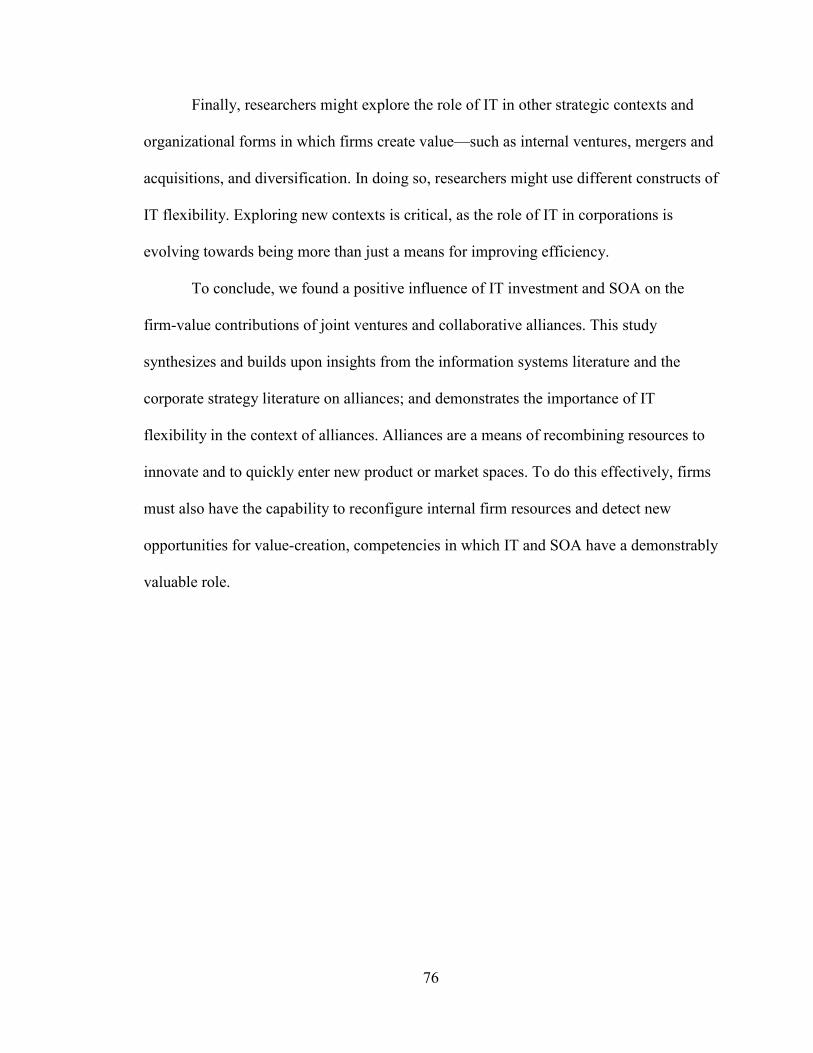
76
Finally, researchers might explore the role of IT in other strategic contexts and
organizational forms in which firms create value—such as internal ventures, mergers and
acquisitions, and diversification. In doing so, researchers might use different constructs of
IT flexibility. Exploring new contexts is critical, as the role of IT in corporations is
evolving towards being more than just a means for improving efficiency.
To conclude, we found a positive influence of IT investment and SOA on the
firm-value contributions of joint ventures and collaborative alliances. This study
synthesizes and builds upon insights from the information systems literature and the
corporate strategy literature on alliances; and demonstrates the importance of IT
flexibility in the context of alliances. Alliances are a means of recombining resources to
innovate and to quickly enter new product or market spaces. To do this effectively, firms
must also have the capability to reconfigure internal firm resources and detect new
opportunities for value-creation, competencies in which IT and SOA have a demonstrably
valuable role.
77
Figure III.1 Marginal Effect of Joint-venture Formation on Tobin’s q, as an Increasing Function of IT, with 90% Confidence Intervals
02
46
dq/d
(JV
)
0 .1 .2 .3 .4IT
78
Figure III.2 Marginal Effect of Joint-venture Formation on Tobin’s q, as an Increasing Function of SOA, with 90% Confidence Intervals
-1-.5
0.5
1dq
/d(J
V)
-4 -2 0 2SOA
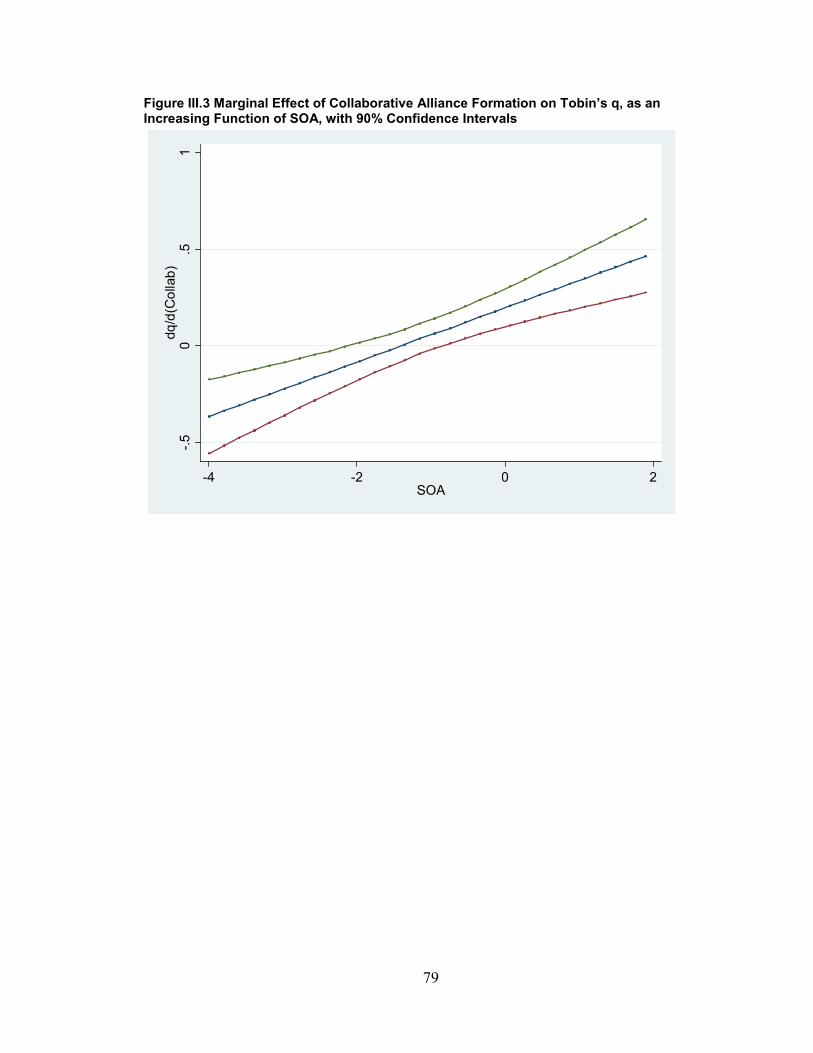
79
Figure III.3 Marginal Effect of Collaborative Alliance Formation on Tobin’s q, as an Increasing Function of SOA, with 90% Confidence Intervals
-.50
.51
dq/d
(Col
lab)
-4 -2 0 2SOA
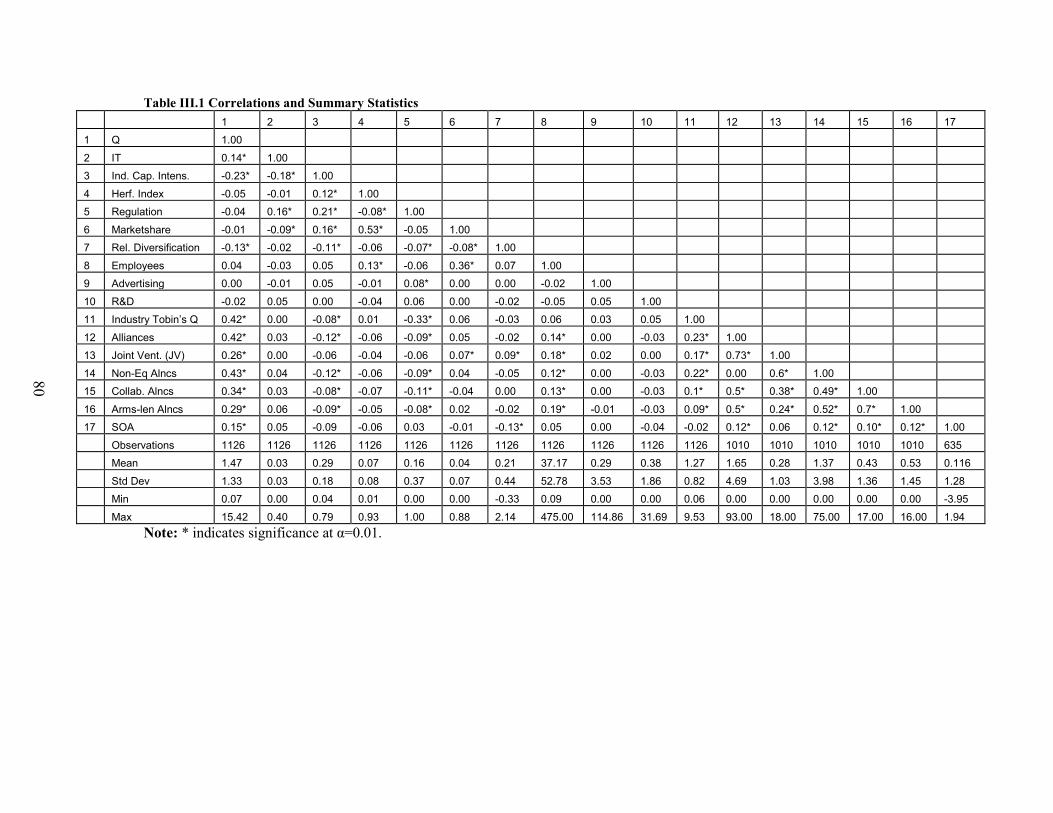
Table III.1 Correlations and Summary Statistics 1 2 3 4 5 6 7 8 9 10 11 12 13 14 15 16 17
1 Q 1.00
2 IT 0.14* 1.00
3 Ind. Cap. Intens. -0.23* -0.18* 1.00
4 Herf. Index -0.05 -0.01 0.12* 1.00
5 Regulation -0.04 0.16* 0.21* -0.08* 1.00
6 Marketshare -0.01 -0.09* 0.16* 0.53* -0.05 1.00
7 Rel. Diversification -0.13* -0.02 -0.11* -0.06 -0.07* -0.08* 1.00
8 Employees 0.04 -0.03 0.05 0.13* -0.06 0.36* 0.07 1.00
9 Advertising 0.00 -0.01 0.05 -0.01 0.08* 0.00 0.00 -0.02 1.00
10 R&D -0.02 0.05 0.00 -0.04 0.06 0.00 -0.02 -0.05 0.05 1.00
11 Industry Tobin’s Q 0.42* 0.00 -0.08* 0.01 -0.33* 0.06 -0.03 0.06 0.03 0.05 1.00
12 Alliances 0.42* 0.03 -0.12* -0.06 -0.09* 0.05 -0.02 0.14* 0.00 -0.03 0.23* 1.00
13 Joint Vent. (JV) 0.26* 0.00 -0.06 -0.04 -0.06 0.07* 0.09* 0.18* 0.02 0.00 0.17* 0.73* 1.00
14 Non-Eq Alncs 0.43* 0.04 -0.12* -0.06 -0.09* 0.04 -0.05 0.12* 0.00 -0.03 0.22* 0.00 0.6* 1.00
15 Collab. Alncs 0.34* 0.03 -0.08* -0.07 -0.11* -0.04 0.00 0.13* 0.00 -0.03 0.1* 0.5* 0.38* 0.49* 1.00
16 Arms-len Alncs 0.29* 0.06 -0.09* -0.05 -0.08* 0.02 -0.02 0.19* -0.01 -0.03 0.09* 0.5* 0.24* 0.52* 0.7* 1.00
17 SOA 0.15* 0.05 -0.09 -0.06 0.03 -0.01 -0.13* 0.05 0.00 -0.04 -0.02 0.12* 0.06 0.12* 0.10* 0.12* 1.00
Observations 1126 1126 1126 1126 1126 1126 1126 1126 1126 1126 1126 1010 1010 1010 1010 1010 635
Mean 1.47 0.03 0.29 0.07 0.16 0.04 0.21 37.17 0.29 0.38 1.27 1.65 0.28 1.37 0.43 0.53 0.116
Std Dev 1.33 0.03 0.18 0.08 0.37 0.07 0.44 52.78 3.53 1.86 0.82 4.69 1.03 3.98 1.36 1.45 1.28
Min 0.07 0.00 0.04 0.01 0.00 0.00 -0.33 0.09 0.00 0.00 0.06 0.00 0.00 0.00 0.00 0.00 -3.95
Max 15.42 0.40 0.79 0.93 1.00 0.88 2.14 475.00 114.86 31.69 9.53 93.00 18.00 75.00 17.00 16.00 1.94 Note: * indicates significance at α=0.01.
80
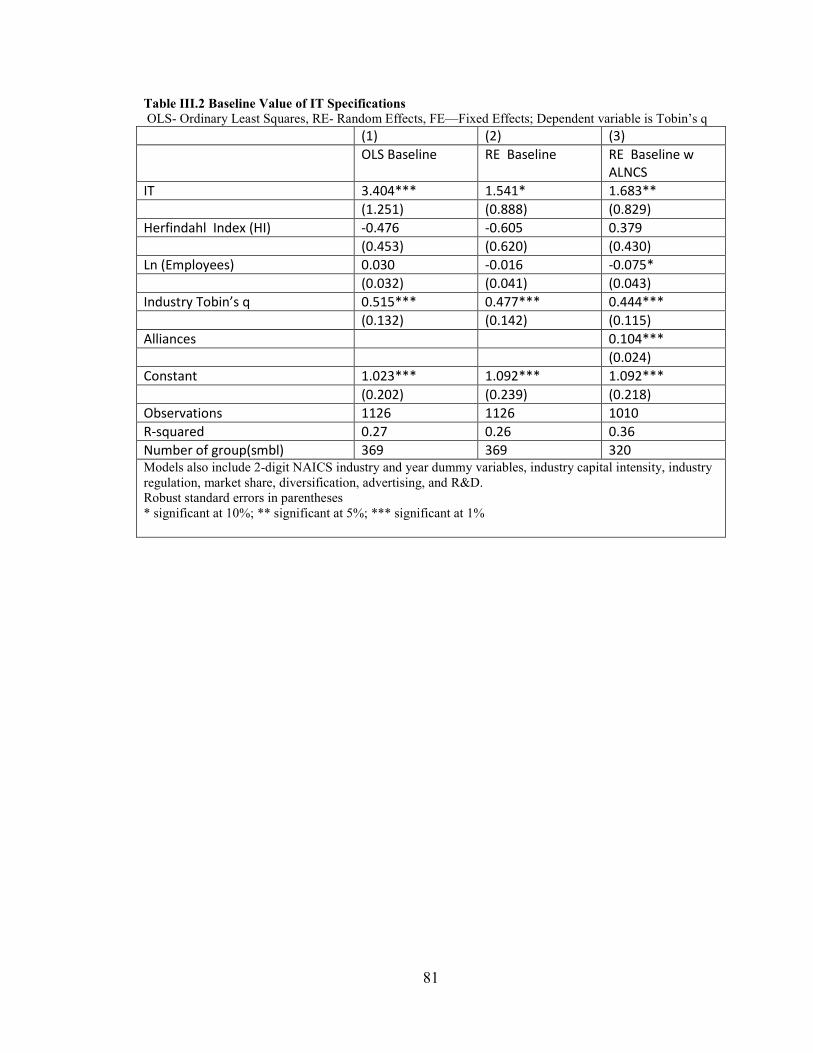
81
Table III.2 Baseline Value of IT Specifications OLS- Ordinary Least Squares, RE- Random Effects, FE—Fixed Effects; Dependent variable is Tobin’s q (1) (2) (3) OLS Baseline RE Baseline RE Baseline w
ALNCS IT 3.404*** 1.541* 1.683** (1.251) (0.888) (0.829) Herfindahl Index (HI) -0.476 -0.605 0.379 (0.453) (0.620) (0.430) Ln (Employees) 0.030 -0.016 -0.075* (0.032) (0.041) (0.043) Industry Tobin’s q 0.515*** 0.477*** 0.444*** (0.132) (0.142) (0.115) Alliances 0.104*** (0.024) Constant 1.023*** 1.092*** 1.092*** (0.202) (0.239) (0.218) Observations 1126 1126 1010 R-squared 0.27 0.26 0.36 Number of group(smbl) 369 369 320 Models also include 2-digit NAICS industry and year dummy variables, industry capital intensity, industry regulation, market share, diversification, advertising, and R&D. Robust standard errors in parentheses * significant at 10%; ** significant at 5%; *** significant at 1%
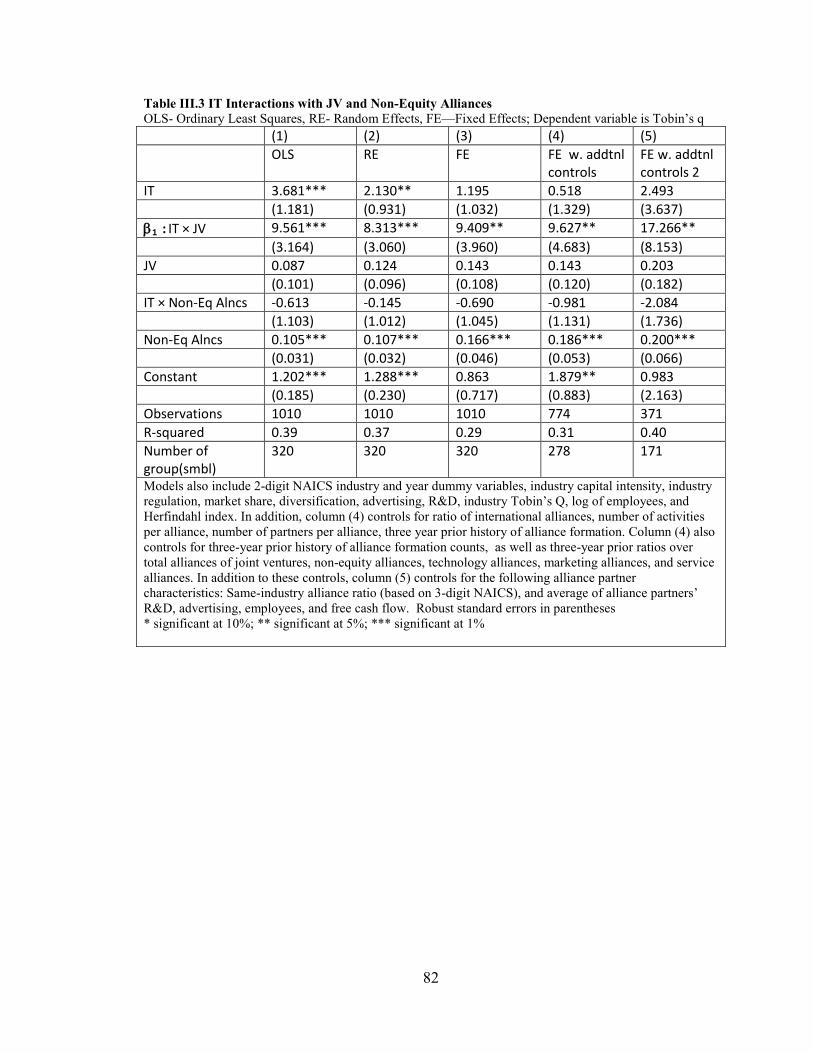
82
Table III.3 IT Interactions with JV and Non-Equity Alliances OLS- Ordinary Least Squares, RE- Random Effects, FE—Fixed Effects; Dependent variable is Tobin’s q (1) (2) (3) (4) (5) OLS RE FE FE w. addtnl
controls FE w. addtnl controls 2
IT 3.681*** 2.130** 1.195 0.518 2.493 (1.181) (0.931) (1.032) (1.329) (3.637) β1 : IT × JV 9.561*** 8.313*** 9.409** 9.627** 17.266** (3.164) (3.060) (3.960) (4.683) (8.153) JV 0.087 0.124 0.143 0.143 0.203 (0.101) (0.096) (0.108) (0.120) (0.182) IT × Non-Eq Alncs -0.613 -0.145 -0.690 -0.981 -2.084 (1.103) (1.012) (1.045) (1.131) (1.736) Non-Eq Alncs 0.105*** 0.107*** 0.166*** 0.186*** 0.200*** (0.031) (0.032) (0.046) (0.053) (0.066) Constant 1.202*** 1.288*** 0.863 1.879** 0.983 (0.185) (0.230) (0.717) (0.883) (2.163) Observations 1010 1010 1010 774 371 R-squared 0.39 0.37 0.29 0.31 0.40 Number of group(smbl)
320 320 320 278 171
Models also include 2-digit NAICS industry and year dummy variables, industry capital intensity, industry regulation, market share, diversification, advertising, R&D, industry Tobin’s Q, log of employees, and Herfindahl index. In addition, column (4) controls for ratio of international alliances, number of activities per alliance, number of partners per alliance, three year prior history of alliance formation. Column (4) also controls for three-year prior history of alliance formation counts, as well as three-year prior ratios over total alliances of joint ventures, non-equity alliances, technology alliances, marketing alliances, and service alliances. In addition to these controls, column (5) controls for the following alliance partner characteristics: Same-industry alliance ratio (based on 3-digit NAICS), and average of alliance partners’ R&D, advertising, employees, and free cash flow. Robust standard errors in parentheses * significant at 10%; ** significant at 5%; *** significant at 1%
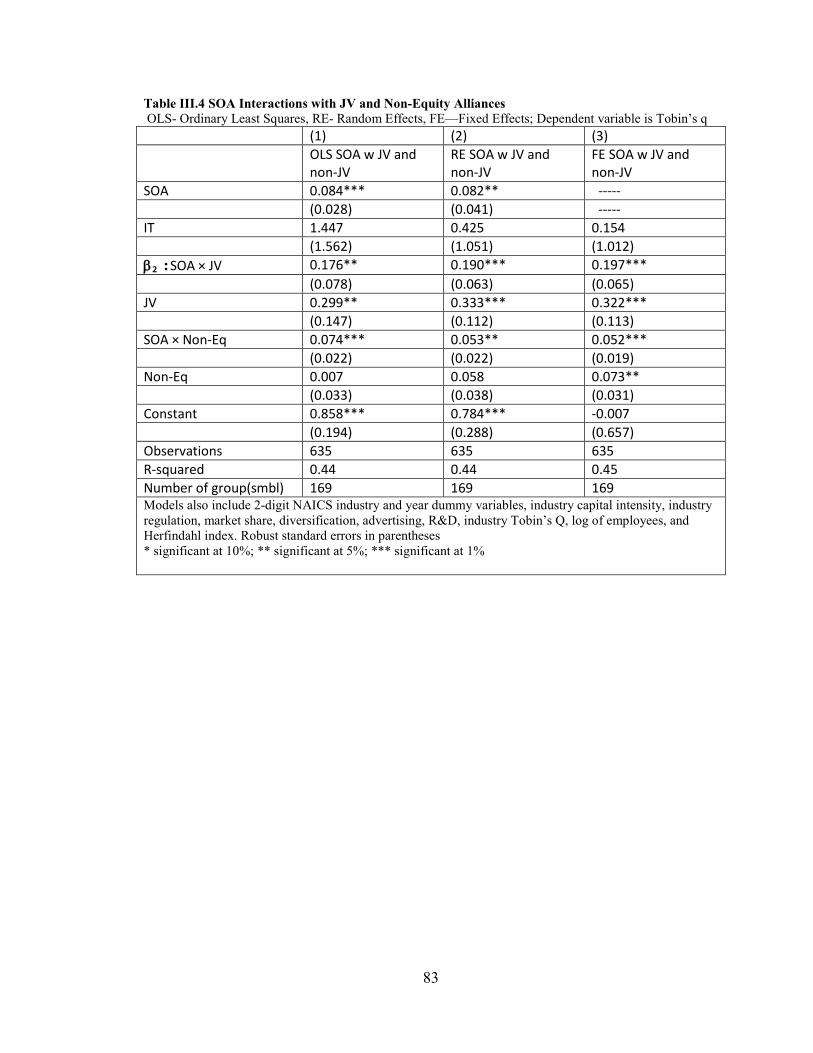
83
Table III.4 SOA Interactions with JV and Non-Equity Alliances OLS- Ordinary Least Squares, RE- Random Effects, FE—Fixed Effects; Dependent variable is Tobin’s q (1) (2) (3) OLS SOA w JV and
non-JV RE SOA w JV and non-JV
FE SOA w JV and non-JV
SOA 0.084*** 0.082** ----- (0.028) (0.041) ----- IT 1.447 0.425 0.154 (1.562) (1.051) (1.012) β2 :SOA × JV 0.176** 0.190*** 0.197*** (0.078) (0.063) (0.065) JV 0.299** 0.333*** 0.322*** (0.147) (0.112) (0.113) SOA × Non-Eq 0.074*** 0.053** 0.052*** (0.022) (0.022) (0.019) Non-Eq 0.007 0.058 0.073** (0.033) (0.038) (0.031) Constant 0.858*** 0.784*** -0.007 (0.194) (0.288) (0.657) Observations 635 635 635 R-squared 0.44 0.44 0.45 Number of group(smbl) 169 169 169 Models also include 2-digit NAICS industry and year dummy variables, industry capital intensity, industry regulation, market share, diversification, advertising, R&D, industry Tobin’s Q, log of employees, and Herfindahl index. Robust standard errors in parentheses * significant at 10%; ** significant at 5%; *** significant at 1%
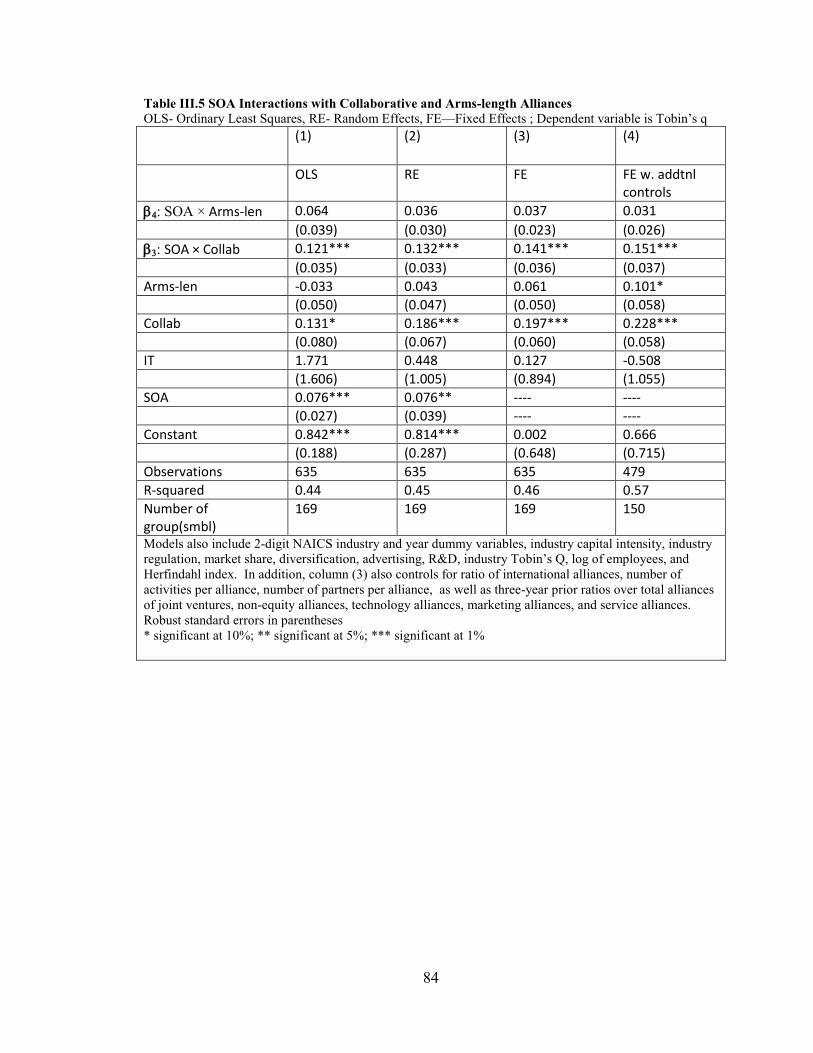
84
Table III.5 SOA Interactions with Collaborative and Arms-length Alliances OLS- Ordinary Least Squares, RE- Random Effects, FE—Fixed Effects ; Dependent variable is Tobin’s q
(1) (2) (3) (4)
OLS RE FE FE w. addtnl controls
β4: SOA × Arms-len 0.064 0.036 0.037 0.031 (0.039) (0.030) (0.023) (0.026) β3: SOA × Collab 0.121*** 0.132*** 0.141*** 0.151*** (0.035) (0.033) (0.036) (0.037) Arms-len -0.033 0.043 0.061 0.101* (0.050) (0.047) (0.050) (0.058) Collab 0.131* 0.186*** 0.197*** 0.228*** (0.080) (0.067) (0.060) (0.058) IT 1.771 0.448 0.127 -0.508 (1.606) (1.005) (0.894) (1.055) SOA 0.076*** 0.076** ---- ---- (0.027) (0.039) ---- ---- Constant 0.842*** 0.814*** 0.002 0.666 (0.188) (0.287) (0.648) (0.715) Observations 635 635 635 479 R-squared 0.44 0.45 0.46 0.57 Number of group(smbl)
169 169 169 150
Models also include 2-digit NAICS industry and year dummy variables, industry capital intensity, industry regulation, market share, diversification, advertising, R&D, industry Tobin’s Q, log of employees, and Herfindahl index. In addition, column (3) also controls for ratio of international alliances, number of activities per alliance, number of partners per alliance, as well as three-year prior ratios over total alliances of joint ventures, non-equity alliances, technology alliances, marketing alliances, and service alliances. Robust standard errors in parentheses * significant at 10%; ** significant at 5%; *** significant at 1%
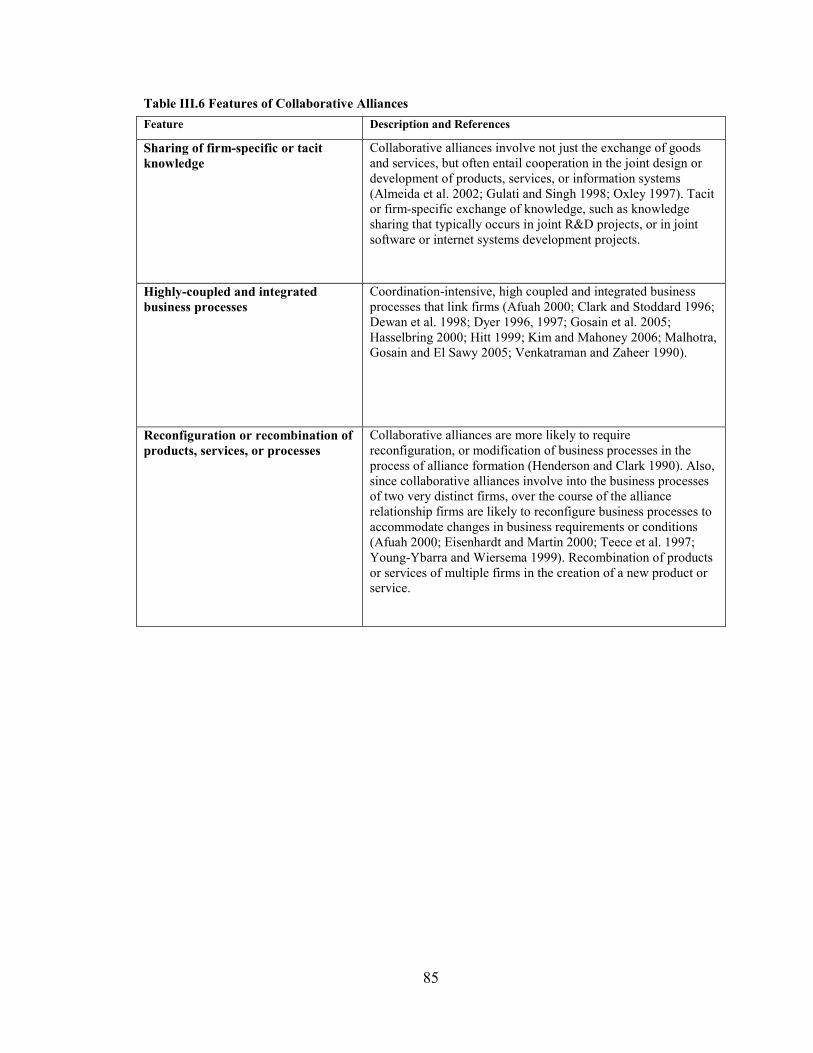
85
Table III.6 Features of Collaborative Alliances
Feature Description and References
Sharing of firm-specific or tacit knowledge
Collaborative alliances involve not just the exchange of goods and services, but often entail cooperation in the joint design or development of products, services, or information systems (Almeida et al. 2002; Gulati and Singh 1998; Oxley 1997). Tacit or firm-specific exchange of knowledge, such as knowledge sharing that typically occurs in joint R&D projects, or in joint software or internet systems development projects.
Highly-coupled and integrated business processes
Coordination-intensive, high coupled and integrated business processes that link firms (Afuah 2000; Clark and Stoddard 1996; Dewan et al. 1998; Dyer 1996, 1997; Gosain et al. 2005; Hasselbring 2000; Hitt 1999; Kim and Mahoney 2006; Malhotra, Gosain and El Sawy 2005; Venkatraman and Zaheer 1990).
Reconfiguration or recombination of products, services, or processes
Collaborative alliances are more likely to require reconfiguration, or modification of business processes in the process of alliance formation (Henderson and Clark 1990). Also, since collaborative alliances involve into the business processes of two very distinct firms, over the course of the alliance relationship firms are likely to reconfigure business processes to accommodate changes in business requirements or conditions (Afuah 2000; Eisenhardt and Martin 2000; Teece et al. 1997; Young-Ybarra and Wiersema 1999). Recombination of products or services of multiple firms in the creation of a new product or service.
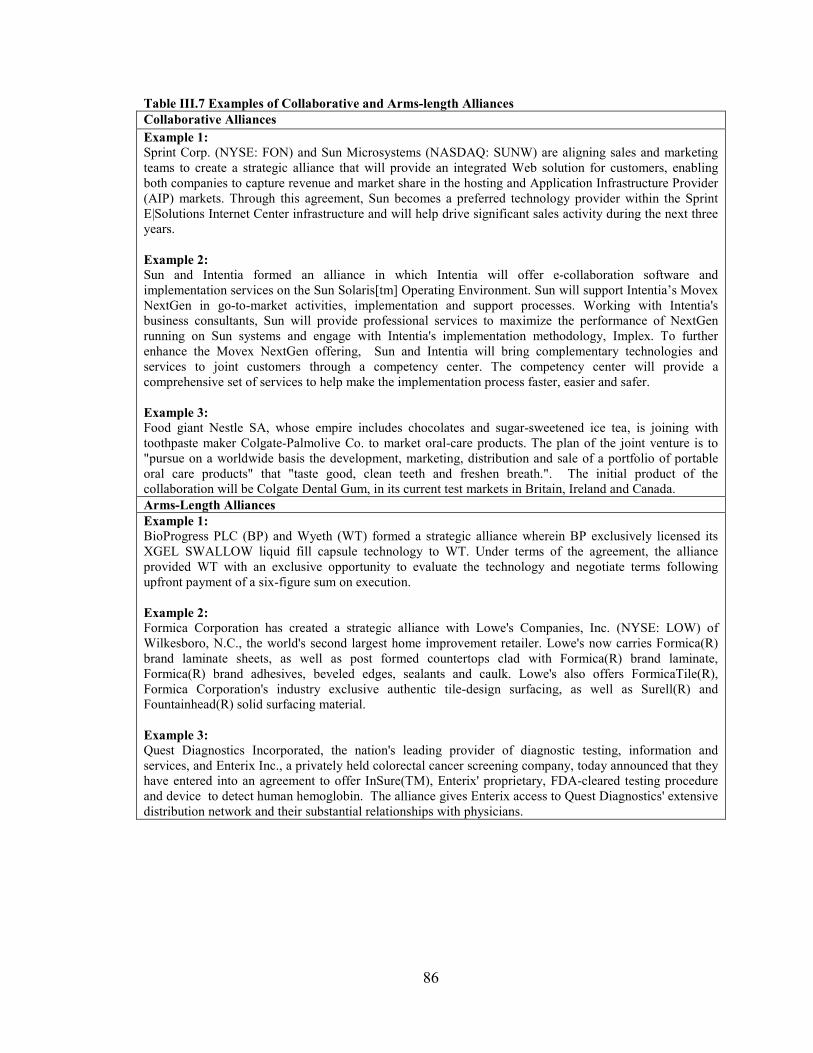
86
Table III.7 Examples of Collaborative and Arms-length Alliances Collaborative Alliances Example 1: Sprint Corp. (NYSE: FON) and Sun Microsystems (NASDAQ: SUNW) are aligning sales and marketing teams to create a strategic alliance that will provide an integrated Web solution for customers, enabling both companies to capture revenue and market share in the hosting and Application Infrastructure Provider (AIP) markets. Through this agreement, Sun becomes a preferred technology provider within the Sprint E|Solutions Internet Center infrastructure and will help drive significant sales activity during the next three years. Example 2: Sun and Intentia formed an alliance in which Intentia will offer e-collaboration software and implementation services on the Sun Solaris[tm] Operating Environment. Sun will support Intentia’s Movex NextGen in go-to-market activities, implementation and support processes. Working with Intentia's business consultants, Sun will provide professional services to maximize the performance of NextGen running on Sun systems and engage with Intentia's implementation methodology, Implex. To further enhance the Movex NextGen offering, Sun and Intentia will bring complementary technologies and services to joint customers through a competency center. The competency center will provide a comprehensive set of services to help make the implementation process faster, easier and safer. Example 3: Food giant Nestle SA, whose empire includes chocolates and sugar-sweetened ice tea, is joining with toothpaste maker Colgate-Palmolive Co. to market oral-care products. The plan of the joint venture is to "pursue on a worldwide basis the development, marketing, distribution and sale of a portfolio of portable oral care products" that "taste good, clean teeth and freshen breath.". The initial product of the collaboration will be Colgate Dental Gum, in its current test markets in Britain, Ireland and Canada. Arms-Length Alliances Example 1: BioProgress PLC (BP) and Wyeth (WT) formed a strategic alliance wherein BP exclusively licensed its XGEL SWALLOW liquid fill capsule technology to WT. Under terms of the agreement, the alliance provided WT with an exclusive opportunity to evaluate the technology and negotiate terms following upfront payment of a six-figure sum on execution. Example 2: Formica Corporation has created a strategic alliance with Lowe's Companies, Inc. (NYSE: LOW) of Wilkesboro, N.C., the world's second largest home improvement retailer. Lowe's now carries Formica(R) brand laminate sheets, as well as post formed countertops clad with Formica(R) brand laminate, Formica(R) brand adhesives, beveled edges, sealants and caulk. Lowe's also offers FormicaTile(R), Formica Corporation's industry exclusive authentic tile-design surfacing, as well as Surell(R) and Fountainhead(R) solid surfacing material. Example 3: Quest Diagnostics Incorporated, the nation's leading provider of diagnostic testing, information and services, and Enterix Inc., a privately held colorectal cancer screening company, today announced that they have entered into an agreement to offer InSure(TM), Enterix' proprietary, FDA-cleared testing procedure and device to detect human hemoglobin. The alliance gives Enterix access to Quest Diagnostics' extensive distribution network and their substantial relationships with physicians.
87
Appendix 1: More Variable Definitions Alliance Network Controls: Alliance Activity Scope (Scope): The number of cooperative activities per alliance. International: Percentage of alliance partners whose corporate headquarters are located in a different nation from that of the focal firm. Experience with Technology-Based Alliances (Tech Hist. 3yr.): Percentage of alliance activities, over the three previous years (t-4 to t-1), involving the joint development of new technology or technological processes: Manufacturing, Software Development, Research & Development, Internet, Computer Integrated Systems, Telecommunications, Communications, and Exploration. Experience with Marketing-Based Alliances (Mkt Hist. 3yr.): Percentage of marketing-based alliance activities, over the three previous years (t-4 to t-1). Experience with Joint-venture Alliances (JV Hist. 3yr.): Percentage of alliances, formed over the three previous years (t-4 to t-1), that are joint ventures. Free Cash Flow of Partners (Cash Prtnr): Average free cash flow of alliance partners. Profitability of Partners (ROA Prtnr): Average return on assets (ROA) of alliance partners. ROA is measured as operating income (Compustat #13) divided by total book value of assets (Compustat #6). Employees of Partners (Empl Prtnr): Average number of employees of alliance partners. R&D of Partners (R&D Prtnr): Average R&D expenditure ratios of alliance partners. Advertising of Partners (Adv Prtnr): Average advertising expenditure ratios of alliance partners.
Partners per alliance: Average number of partners per alliance formed in the current year.
Same industry: Percentage of alliances formed within the same three-digit NAICS code.
Industry controls: Industry concentration (Herf. Index): , where sij is the market share of firm i in industry j, as in Hou
et al. (2006) Weighted Industry Average Tobin’s q (Industry Tobin’s q): Market-share weighted average Tobin’s q for all firms with the same three-digit NAICS code. Weighted Industry Capital Intensity (Ind. Capital Intensity): Market-share weighted average capital intensity, defined in Waring (Waring 1996) as Physical Capital/Net Income. Physical capital is book value of physical capital (Compustat #8). Regulation: Binary variable for regulated industry—these include airlines, banking, pharmaceuticals, and utilities. Firm controls: Employees: Number of employees in the firm, which is a measure of firm size, in thousands. Advertising Intensity (Advertising): The portion of sales spent on advertising. If this value was missing in Compustat, we used the 3-digit NAICS industry average, weighted by the firm’s industry segments.
∑i ijs 2
88
R&D Intensity (R&D): The portion of sales spent on research and development. If this value was missing in Compustat, we used the 3-digit NAICS industry average, weighted by the firm’s industry segments. Weighted Market Share (Marketshare): where MSij is firm i’s market share in three-digit
NAICS industry j and Pij is the portion of the firm i’s sales in industry j. Pij is calculated using the Compustat Industrial Segments database. Related Diversification (Rel. Diversification): , as described in Robins
et al. (1995), where Pt = Percentage of sales in each 4-digit NAICS industry, and Pu = Percentage of sales in each 2-digit NAICS category.
Appendix 2: Derivation of Baseline Tobin’s Q Model
We begin with the assumption that firm valuation (V) equals sum of tangible assets (T) and intangible
assets (I):
V = I + T (A.1)
Intangible value (I) comprises all of a firm’s assets that is not captured in its accounting books, including
intellectual capital, reputation, or advantages in technology or business processes. Although intangible
resources are hard to quantify, prior literature has established that such resources are generated through
investment in research and development (R&D) and advertising (Bharadwaj et al. 1999; Villalonga 2004).
There has also been an increasing awareness of the contribution of IT towards intangible assets (Bharadwaj
et al. 1999; Brynjolfsson et al. 2002):
I = αitIT + αrdRD + αadvADV + Y (A.2)
Y represents all additional contributions to firm-intangible value. Combining equations (A.1) and (A.2),
and dividing both sides by T, we have:
Q = V/T = 1 + (1/T) (αit IT + αrd RD + αadv ADV) + y (A.3)
Ideally, IT (IT), R&D (RD), and advertising (ADV) would be measured by their capital stocks; but this
would require uninterrupted panel data for IT, which we lack. As Wernerfelt and Montgomery (Wernerfelt
and Montgomery 1988) point out, since the actual value of intangible capital is difficult to estimate, annual
investment figures are used as approximations for their contributions to intangible capital. Bharadwaj et al.
(Bharadwaj et al. 1999) present IT-intensity as a ratio of annual IT expenditures to annual revenues; in
accordance, we set αIT = βIT (T/Sales).
∑ j ijij PMS
)1log()1log( ∑∑ −u
ut
t PPPP
89
y = CI + HI + R + MS + D + Log(E) + ∑ yeart + ∑ industryi (A.4)
The construct (y) in equation (4) includes all control variables used in (Bharadwaj et al. 1999): CI is capital
intensity, HI is herfindahl index (a measure of industry concentration), R is regulation, MS is market share,
D is related diversification, E is the number of employees. In addition, we account for industry-wide effects
using two-digit NAICS codes, and for year effects which would correct for annual fluctuations in market-
values.
Transforming this into a baseline estimation model, we obtain:
Q = βo + βIT IT + βADV ADV+ βRD RD + β CI CI + β HI HI + βR R + β MS MS + β D D + β E Log(Employees)
+ ∑ β yt yeart + ∑ β Ii industryi + ui + εi, t (A.5)
90
Appendix 3: Coding and Verification of Alliance Attributes
To our knowledge, this is the first study has directly assessed depth of alliance collaboration in terms of business process requirements of specific activities; no corresponding categorical or quantitative data field currently exists in the SDC Platinum database. Prior alliance typologies have used alliance activity labels; but these do not map consistently to theories of collaboration depth where the emphasis is on business processes. Fortunately, relevant information can be extracted from the alliance descriptions (“deal text”) that are in free text form. Converting such free text into a categorical or quantitative measure for large data sets requires a systematic and automated procedure of content-analysis to ensure consistency, accuracy, and reliability. We developed an automated coding procedure to classify alliances as collaborative or arms-length based on free-text descriptions of alliance activities, adapting methods described in Nag et. al. (2007) and Tetlock et al. (2008). This procedure involves the following three steps.
First, we evaluated the feasibility of content for analysis and identified a set of representative tokens or keywords. While the total sample of firms had 8,678 alliances, only 3,129 of these alliances involved the 169 firms for which we had SOA measures. Using a random number generator, we randomly selected 10% of these alliances, and then retrieved relevant news articles regarding these alliance announcements through searches in Factiva. Reading through this sample of alliance descriptions, we verified that the “deal text” description in SDC accurately captures the essential activities involved in the alliance by cross-checking with corresponding news articles in Factiva and found no inaccuracies of description, suggesting that accurate content analysis of deal descriptions in SDC is possible. Using the criteria of prior theory and theory development of this paper, one of the authors completed a preliminary hand-coding of the 10% sample of alliances, categorizing each as collaborative or arms-length based on a careful reading of the given description. In this manual process, it became apparent that certain keywords were consistently suggestive of whether the alliance was collaborative or arms-length. This was further confirmed by feeding alliance texts into content analysis software (Wordsmith and Catpac) in two separate groups (collaborative and arms-length alliance descriptions), and observing non-overlapping sets of keywords emerge from each group. The root forms of these keywords are listed in Table A1. Similar techniques in identifying keywords based on a sample of text are described in prior work (Nag et al. 2007; Tetlock et al. 2008).
Second, we developed and refined simple coding rules for automated coding of alliances as collaborative or arms-length based on their descriptions. Starting with the keywords, we devised a simple set of rules determining whether certain keywords were to be designated as strong or weak; this was sufficient to resolve ambiguities in some cases where an alliance showed characteristics of both collaboration and arms-length agreement. The summary of the coding rules are listed in Table A1. To further verify these coding rules, two researchers/managers independently replicated the manual coding exercise for a 10% randomly selected portion of the training sample of alliances. The instructions for this coding exercise are given below; correlations among independent coding responses are highly significant at α = 0.000. Having developed and independently verified the coding rules for 10% set of randomly selected alliances, we applied the automated coding procedure to the entire set of alliances.
Third, we examined the outcome of automated coding for both sufficient variation in data, robustness of results, and consistency with manual coders. The alliance type counts are shown in Table A2, which shows that the automated coding procedure identified 42.5% of the alliances as collaborative and 57.5% of the alliances as arms-length. Consistent with theory, joint ventures are more likely to be collaborative alliances, while non-equity alliances are more likely to be arms-length alliances (Gulati and Singh 1998; Zollo et al. 2002). We next conduct a confirmatory test of the consistency of this automated coding result with human manual coding based on a different 10% selection of alliance description readings. A 2 X 2 ANOVA test yielded chi-square test statistic that was significant at α= 0.001. Finally, some basic robustness checks were employed to examine the sensitivity of data and analysis to small changes in these coding rules. We generated added-variable plots on collaborative and arms-length alliances in order to identify influential data points, and found that neither removal of these data points nor minor alterations in coding rules had any effect on the significance or direction of the main results.
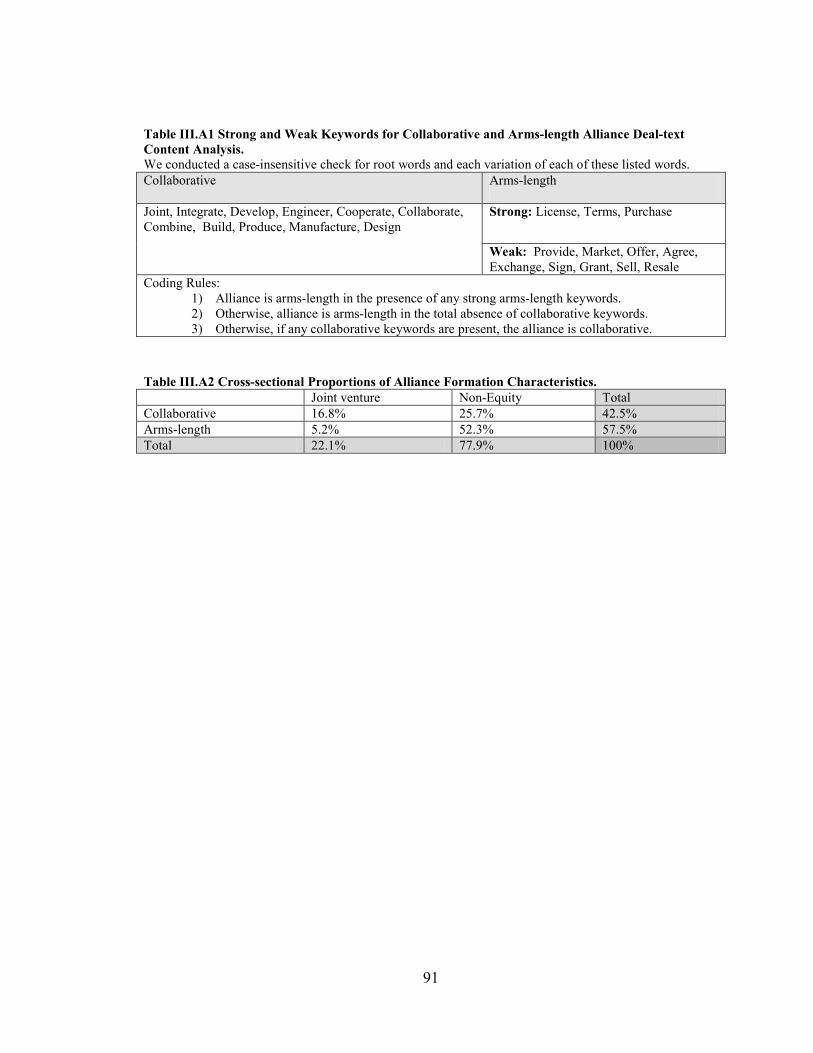
91
Table III.A1 Strong and Weak Keywords for Collaborative and Arms-length Alliance Deal-text Content Analysis. We conducted a case-insensitive check for root words and each variation of each of these listed words. Collaborative Arms-length
Joint, Integrate, Develop, Engineer, Cooperate, Collaborate, Combine, Build, Produce, Manufacture, Design
Strong: License, Terms, Purchase
Weak: Provide, Market, Offer, Agree, Exchange, Sign, Grant, Sell, Resale
Coding Rules: 1) Alliance is arms-length in the presence of any strong arms-length keywords. 2) Otherwise, alliance is arms-length in the total absence of collaborative keywords. 3) Otherwise, if any collaborative keywords are present, the alliance is collaborative.
Table III.A2 Cross-sectional Proportions of Alliance Formation Characteristics. Joint venture Non-Equity Total Collaborative 16.8% 25.7% 42.5% Arms-length 5.2% 52.3% 57.5% Total 22.1% 77.9% 100%
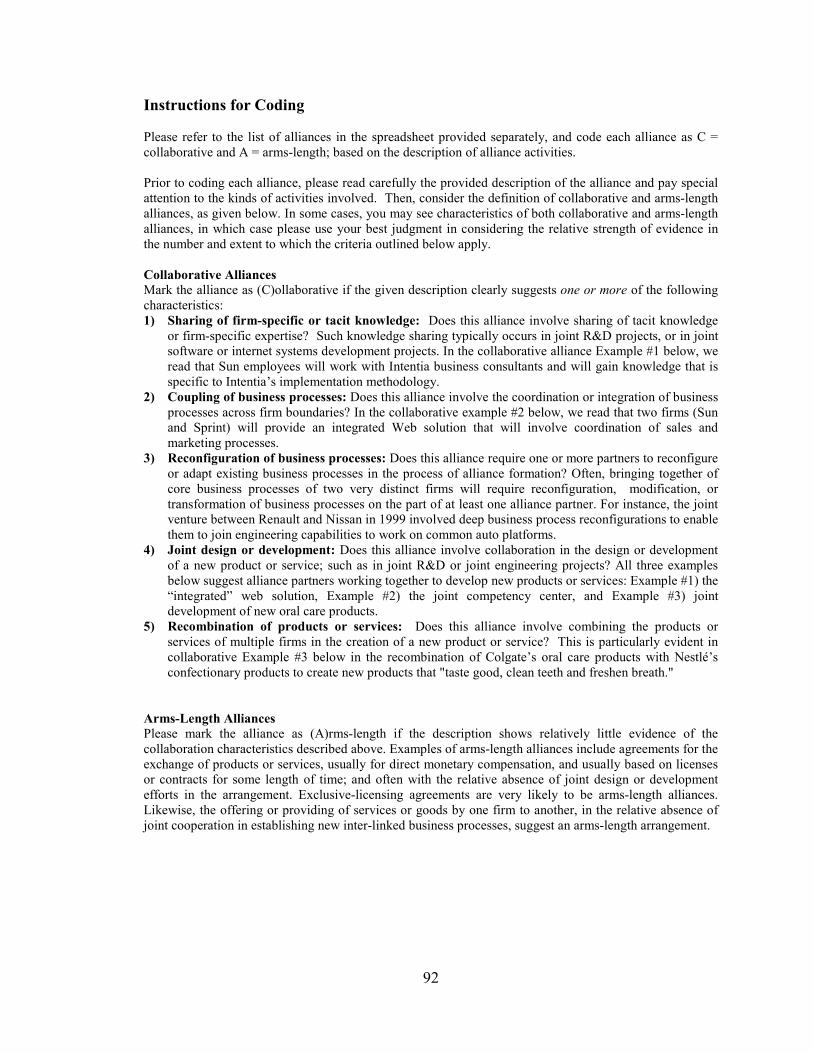
92
Instructions for Coding Please refer to the list of alliances in the spreadsheet provided separately, and code each alliance as C = collaborative and A = arms-length; based on the description of alliance activities. Prior to coding each alliance, please read carefully the provided description of the alliance and pay special attention to the kinds of activities involved. Then, consider the definition of collaborative and arms-length alliances, as given below. In some cases, you may see characteristics of both collaborative and arms-length alliances, in which case please use your best judgment in considering the relative strength of evidence in the number and extent to which the criteria outlined below apply. Collaborative Alliances Mark the alliance as (C)ollaborative if the given description clearly suggests one or more of the following characteristics: 1) Sharing of firm-specific or tacit knowledge: Does this alliance involve sharing of tacit knowledge
or firm-specific expertise? Such knowledge sharing typically occurs in joint R&D projects, or in joint software or internet systems development projects. In the collaborative alliance Example #1 below, we read that Sun employees will work with Intentia business consultants and will gain knowledge that is specific to Intentia’s implementation methodology.
2) Coupling of business processes: Does this alliance involve the coordination or integration of business processes across firm boundaries? In the collaborative example #2 below, we read that two firms (Sun and Sprint) will provide an integrated Web solution that will involve coordination of sales and marketing processes.
3) Reconfiguration of business processes: Does this alliance require one or more partners to reconfigure or adapt existing business processes in the process of alliance formation? Often, bringing together of core business processes of two very distinct firms will require reconfiguration, modification, or transformation of business processes on the part of at least one alliance partner. For instance, the joint venture between Renault and Nissan in 1999 involved deep business process reconfigurations to enable them to join engineering capabilities to work on common auto platforms.
4) Joint design or development: Does this alliance involve collaboration in the design or development of a new product or service; such as in joint R&D or joint engineering projects? All three examples below suggest alliance partners working together to develop new products or services: Example #1) the “integrated” web solution, Example #2) the joint competency center, and Example #3) joint development of new oral care products.
5) Recombination of products or services: Does this alliance involve combining the products or services of multiple firms in the creation of a new product or service? This is particularly evident in collaborative Example #3 below in the recombination of Colgate’s oral care products with Nestlé’s confectionary products to create new products that "taste good, clean teeth and freshen breath."
Arms-Length Alliances Please mark the alliance as (A)rms-length if the description shows relatively little evidence of the collaboration characteristics described above. Examples of arms-length alliances include agreements for the exchange of products or services, usually for direct monetary compensation, and usually based on licenses or contracts for some length of time; and often with the relative absence of joint design or development efforts in the arrangement. Exclusive-licensing agreements are very likely to be arms-length alliances. Likewise, the offering or providing of services or goods by one firm to another, in the relative absence of joint cooperation in establishing new inter-linked business processes, suggest an arms-length arrangement.
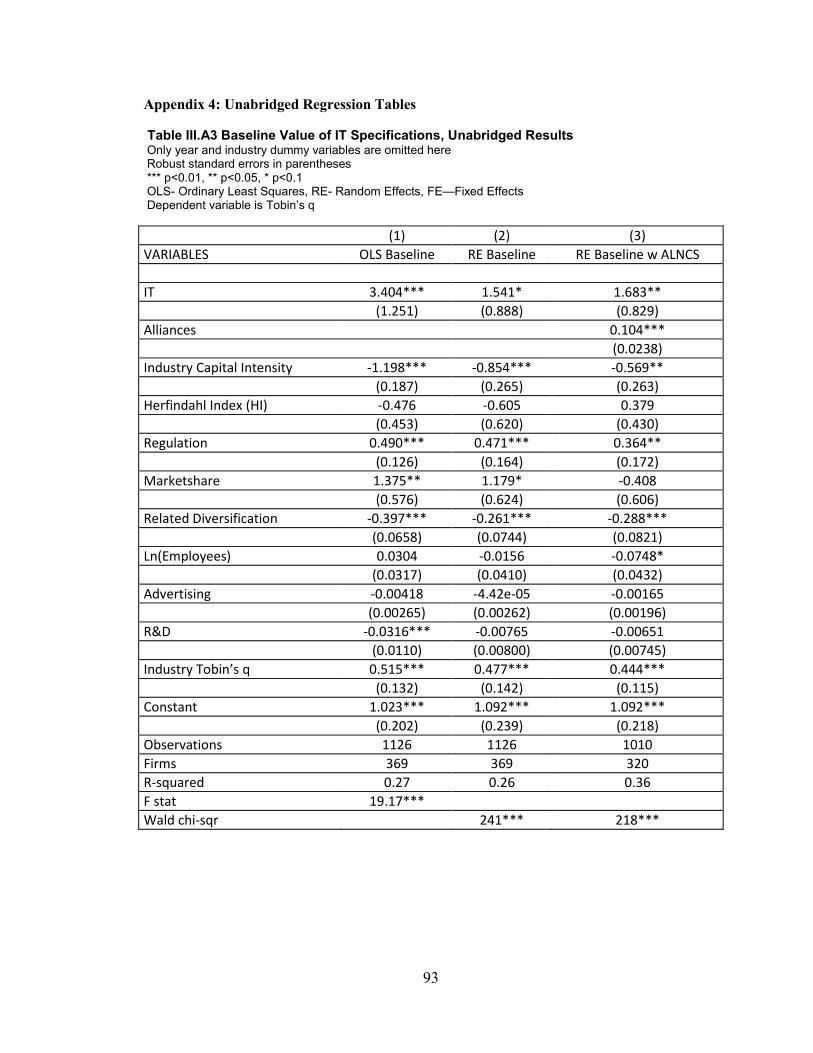
93
Appendix 4: Unabridged Regression Tables Table III.A3 Baseline Value of IT Specifications, Unabridged Results Only year and industry dummy variables are omitted here Robust standard errors in parentheses *** p<0.01, ** p<0.05, * p<0.1 OLS- Ordinary Least Squares, RE- Random Effects, FE—Fixed Effects Dependent variable is Tobin’s q (1) (2) (3) VARIABLES OLS Baseline RE Baseline RE Baseline w ALNCS IT 3.404*** 1.541* 1.683** (1.251) (0.888) (0.829) Alliances 0.104*** (0.0238) Industry Capital Intensity -1.198*** -0.854*** -0.569** (0.187) (0.265) (0.263) Herfindahl Index (HI) -0.476 -0.605 0.379 (0.453) (0.620) (0.430) Regulation 0.490*** 0.471*** 0.364** (0.126) (0.164) (0.172) Marketshare 1.375** 1.179* -0.408 (0.576) (0.624) (0.606) Related Diversification -0.397*** -0.261*** -0.288*** (0.0658) (0.0744) (0.0821) Ln(Employees) 0.0304 -0.0156 -0.0748* (0.0317) (0.0410) (0.0432) Advertising -0.00418 -4.42e-05 -0.00165 (0.00265) (0.00262) (0.00196) R&D -0.0316*** -0.00765 -0.00651 (0.0110) (0.00800) (0.00745) Industry Tobin’s q 0.515*** 0.477*** 0.444*** (0.132) (0.142) (0.115) Constant 1.023*** 1.092*** 1.092*** (0.202) (0.239) (0.218) Observations 1126 1126 1010 Firms 369 369 320 R-squared 0.27 0.26 0.36 F stat 19.17*** Wald chi-sqr 241*** 218***
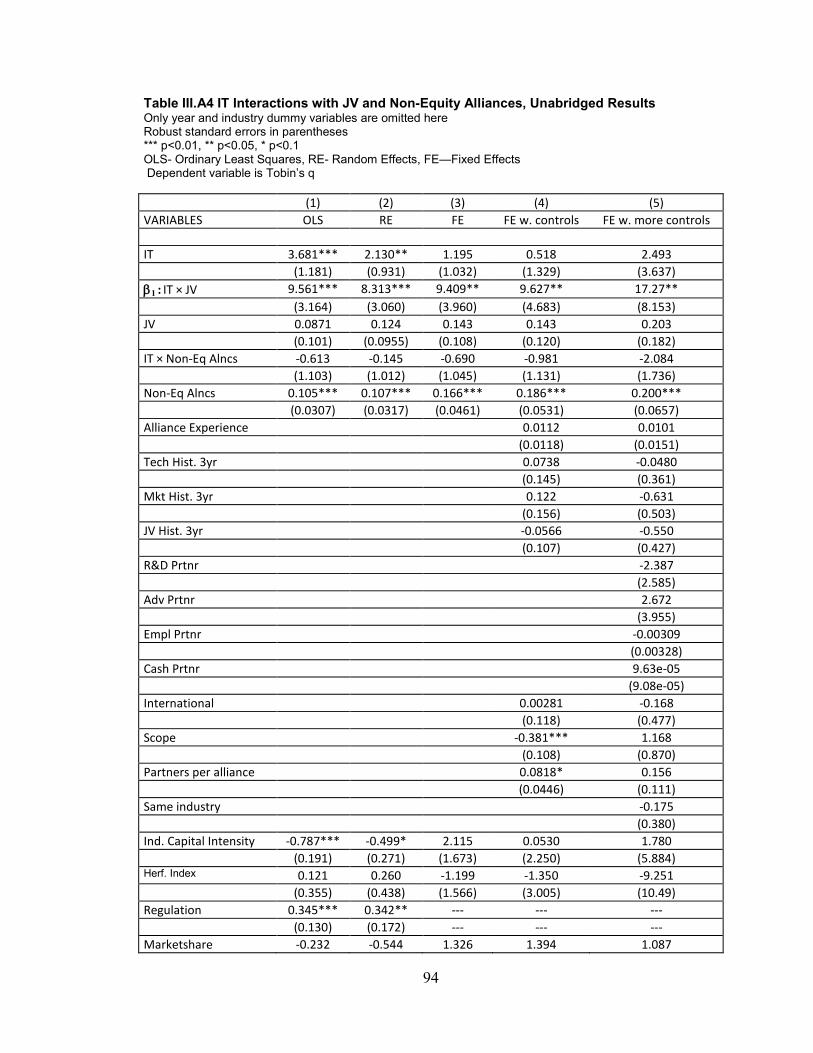
94
Table III.A4 IT Interactions with JV and Non-Equity Alliances, Unabridged Results Only year and industry dummy variables are omitted here Robust standard errors in parentheses *** p<0.01, ** p<0.05, * p<0.1 OLS- Ordinary Least Squares, RE- Random Effects, FE—Fixed Effects Dependent variable is Tobin’s q (1) (2) (3) (4) (5) VARIABLES OLS RE FE FE w. controls FE w. more controls IT 3.681*** 2.130** 1.195 0.518 2.493 (1.181) (0.931) (1.032) (1.329) (3.637) β1 : IT × JV 9.561*** 8.313*** 9.409** 9.627** 17.27** (3.164) (3.060) (3.960) (4.683) (8.153) JV 0.0871 0.124 0.143 0.143 0.203 (0.101) (0.0955) (0.108) (0.120) (0.182) IT × Non-Eq Alncs -0.613 -0.145 -0.690 -0.981 -2.084 (1.103) (1.012) (1.045) (1.131) (1.736) Non-Eq Alncs 0.105*** 0.107*** 0.166*** 0.186*** 0.200*** (0.0307) (0.0317) (0.0461) (0.0531) (0.0657) Alliance Experience 0.0112 0.0101 (0.0118) (0.0151) Tech Hist. 3yr 0.0738 -0.0480 (0.145) (0.361) Mkt Hist. 3yr 0.122 -0.631 (0.156) (0.503) JV Hist. 3yr -0.0566 -0.550 (0.107) (0.427) R&D Prtnr -2.387 (2.585) Adv Prtnr 2.672 (3.955) Empl Prtnr -0.00309 (0.00328) Cash Prtnr 9.63e-05 (9.08e-05) International 0.00281 -0.168 (0.118) (0.477) Scope -0.381*** 1.168 (0.108) (0.870) Partners per alliance 0.0818* 0.156 (0.0446) (0.111) Same industry -0.175 (0.380) Ind. Capital Intensity -0.787*** -0.499* 2.115 0.0530 1.780 (0.191) (0.271) (1.673) (2.250) (5.884) Herf. Index 0.121 0.260 -1.199 -1.350 -9.251 (0.355) (0.438) (1.566) (3.005) (10.49) Regulation 0.345*** 0.342** --- --- --- (0.130) (0.172) --- --- --- Marketshare -0.232 -0.544 1.326 1.394 1.087
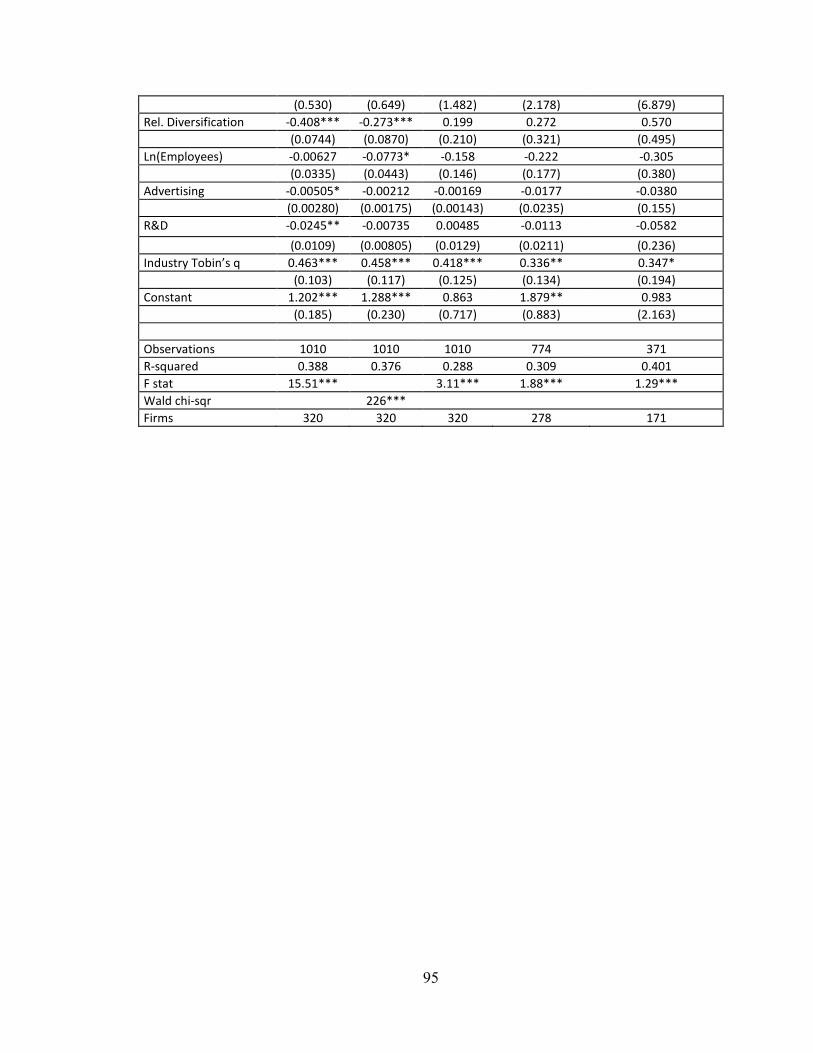
95
(0.530) (0.649) (1.482) (2.178) (6.879) Rel. Diversification -0.408*** -0.273*** 0.199 0.272 0.570 (0.0744) (0.0870) (0.210) (0.321) (0.495) Ln(Employees) -0.00627 -0.0773* -0.158 -0.222 -0.305 (0.0335) (0.0443) (0.146) (0.177) (0.380) Advertising -0.00505* -0.00212 -0.00169 -0.0177 -0.0380 (0.00280) (0.00175) (0.00143) (0.0235) (0.155) R&D -0.0245** -0.00735 0.00485 -0.0113 -0.0582
(0.0109) (0.00805) (0.0129) (0.0211) (0.236) Industry Tobin’s q 0.463*** 0.458*** 0.418*** 0.336** 0.347* (0.103) (0.117) (0.125) (0.134) (0.194) Constant 1.202*** 1.288*** 0.863 1.879** 0.983 (0.185) (0.230) (0.717) (0.883) (2.163) Observations 1010 1010 1010 774 371 R-squared 0.388 0.376 0.288 0.309 0.401 F stat 15.51*** 3.11*** 1.88*** 1.29*** Wald chi-sqr 226*** Firms 320 320 320 278 171
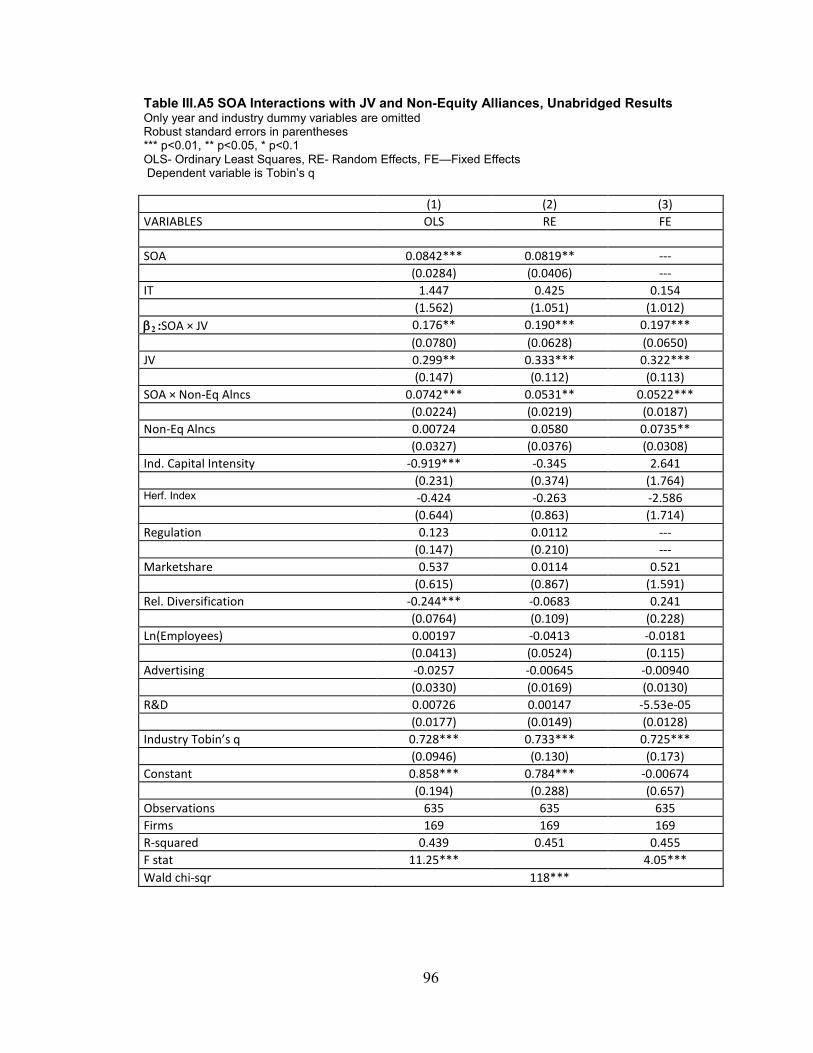
96
Table III.A5 SOA Interactions with JV and Non-Equity Alliances, Unabridged Results Only year and industry dummy variables are omitted Robust standard errors in parentheses *** p<0.01, ** p<0.05, * p<0.1 OLS- Ordinary Least Squares, RE- Random Effects, FE—Fixed Effects Dependent variable is Tobin’s q (1) (2) (3) VARIABLES OLS RE FE SOA 0.0842*** 0.0819** --- (0.0284) (0.0406) --- IT 1.447 0.425 0.154 (1.562) (1.051) (1.012) β2 :SOA × JV 0.176** 0.190*** 0.197*** (0.0780) (0.0628) (0.0650) JV 0.299** 0.333*** 0.322*** (0.147) (0.112) (0.113) SOA × Non-Eq Alncs 0.0742*** 0.0531** 0.0522*** (0.0224) (0.0219) (0.0187) Non-Eq Alncs 0.00724 0.0580 0.0735** (0.0327) (0.0376) (0.0308) Ind. Capital Intensity -0.919*** -0.345 2.641 (0.231) (0.374) (1.764) Herf. Index -0.424 -0.263 -2.586 (0.644) (0.863) (1.714) Regulation 0.123 0.0112 --- (0.147) (0.210) --- Marketshare 0.537 0.0114 0.521 (0.615) (0.867) (1.591) Rel. Diversification -0.244*** -0.0683 0.241 (0.0764) (0.109) (0.228) Ln(Employees) 0.00197 -0.0413 -0.0181 (0.0413) (0.0524) (0.115) Advertising -0.0257 -0.00645 -0.00940 (0.0330) (0.0169) (0.0130) R&D 0.00726 0.00147 -5.53e-05 (0.0177) (0.0149) (0.0128) Industry Tobin’s q 0.728*** 0.733*** 0.725*** (0.0946) (0.130) (0.173) Constant 0.858*** 0.784*** -0.00674 (0.194) (0.288) (0.657) Observations 635 635 635 Firms 169 169 169 R-squared 0.439 0.451 0.455 F stat 11.25*** 4.05*** Wald chi-sqr 118***
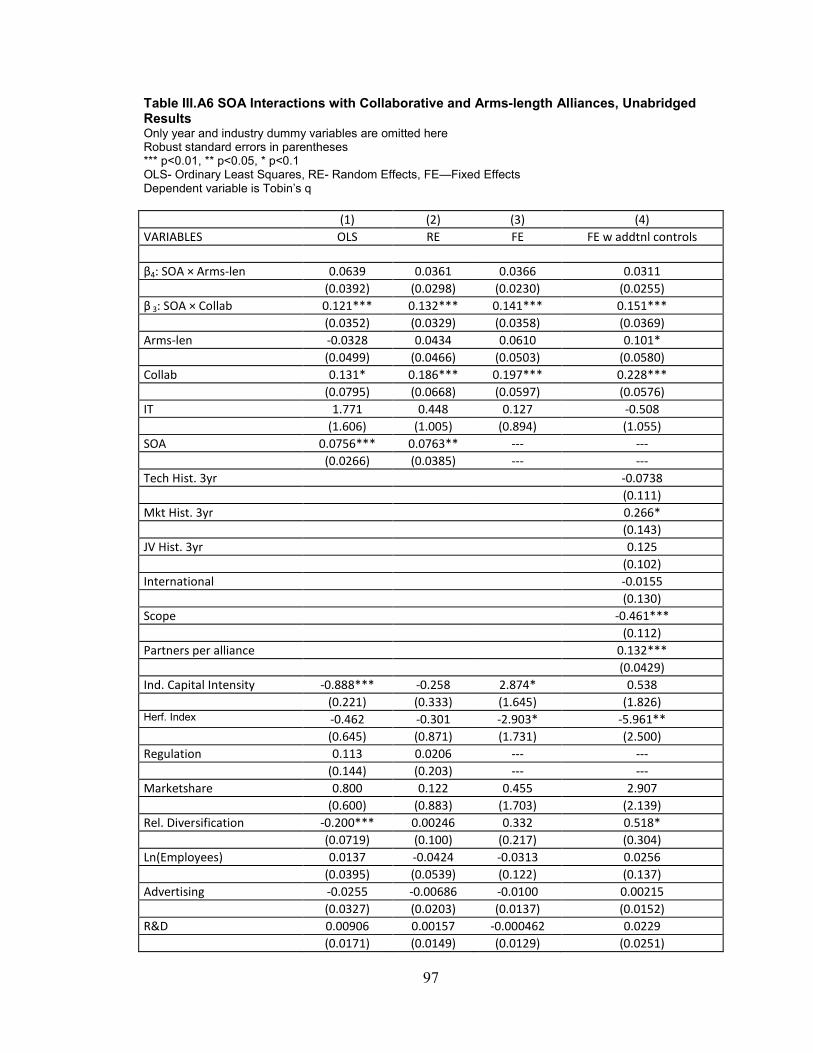
97
Table III.A6 SOA Interactions with Collaborative and Arms-length Alliances, Unabridged Results Only year and industry dummy variables are omitted here Robust standard errors in parentheses *** p<0.01, ** p<0.05, * p<0.1 OLS- Ordinary Least Squares, RE- Random Effects, FE—Fixed Effects Dependent variable is Tobin’s q (1) (2) (3) (4) VARIABLES OLS RE FE FE w addtnl controls β4: SOA × Arms-len 0.0639 0.0361 0.0366 0.0311 (0.0392) (0.0298) (0.0230) (0.0255) β 3: SOA × Collab 0.121*** 0.132*** 0.141*** 0.151*** (0.0352) (0.0329) (0.0358) (0.0369) Arms-len -0.0328 0.0434 0.0610 0.101* (0.0499) (0.0466) (0.0503) (0.0580) Collab 0.131* 0.186*** 0.197*** 0.228*** (0.0795) (0.0668) (0.0597) (0.0576) IT 1.771 0.448 0.127 -0.508 (1.606) (1.005) (0.894) (1.055) SOA 0.0756*** 0.0763** --- --- (0.0266) (0.0385) --- --- Tech Hist. 3yr -0.0738 (0.111) Mkt Hist. 3yr 0.266* (0.143) JV Hist. 3yr 0.125 (0.102) International -0.0155 (0.130) Scope -0.461*** (0.112) Partners per alliance 0.132*** (0.0429) Ind. Capital Intensity -0.888*** -0.258 2.874* 0.538 (0.221) (0.333) (1.645) (1.826) Herf. Index -0.462 -0.301 -2.903* -5.961** (0.645) (0.871) (1.731) (2.500) Regulation 0.113 0.0206 --- --- (0.144) (0.203) --- --- Marketshare 0.800 0.122 0.455 2.907 (0.600) (0.883) (1.703) (2.139) Rel. Diversification -0.200*** 0.00246 0.332 0.518* (0.0719) (0.100) (0.217) (0.304) Ln(Employees) 0.0137 -0.0424 -0.0313 0.0256 (0.0395) (0.0539) (0.122) (0.137) Advertising -0.0255 -0.00686 -0.0100 0.00215 (0.0327) (0.0203) (0.0137) (0.0152) R&D 0.00906 0.00157 -0.000462 0.0229 (0.0171) (0.0149) (0.0129) (0.0251)
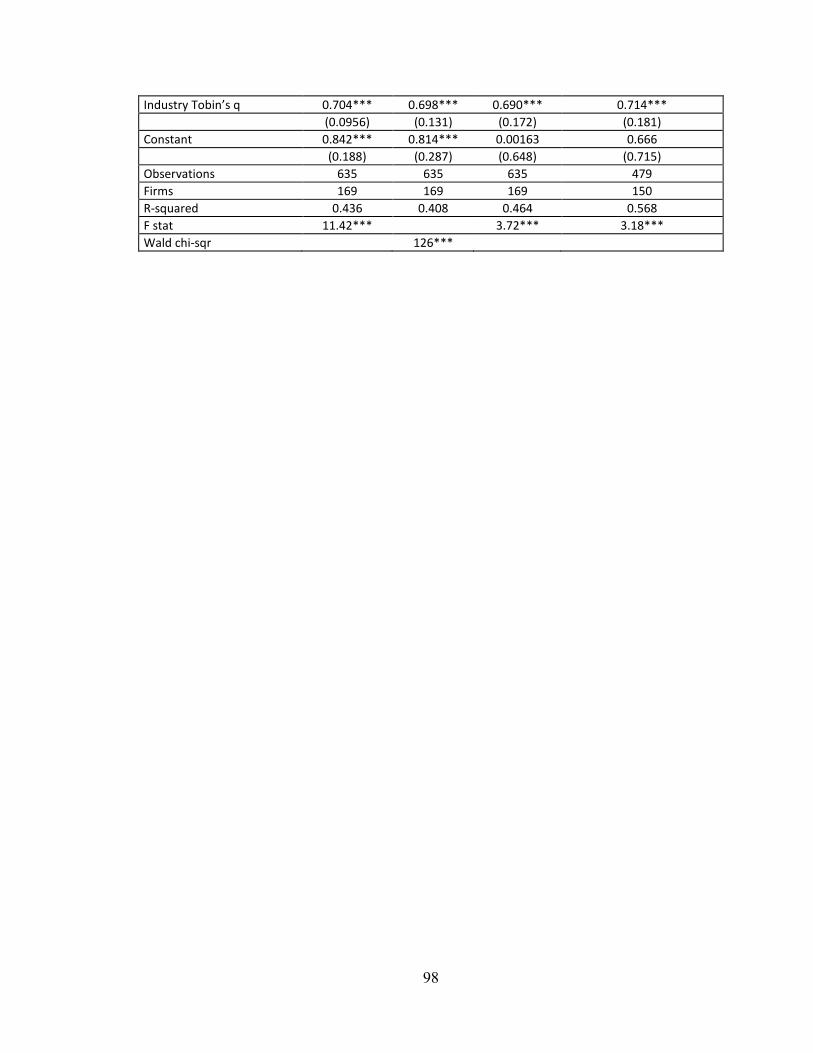
98
Industry Tobin’s q 0.704*** 0.698*** 0.690*** 0.714*** (0.0956) (0.131) (0.172) (0.181) Constant 0.842*** 0.814*** 0.00163 0.666 (0.188) (0.287) (0.648) (0.715) Observations 635 635 635 479 Firms 169 169 169 150 R-squared 0.436 0.408 0.464 0.568 F stat 11.42*** 3.72*** 3.18*** Wald chi-sqr 126***
99
References Afuah, A. 2000. How Much Do Your Co-opetitors' Capabilities Matter in the Face of
Technological Change? Strategic Management Journal 21(3) 387-404. Ahuja, G. 2000. Collaboration Networks, Structural Holes, and Innovation: A
Longitudinal Study. Administrative Science Quarterly 45(3) 425-455. Allen, B.R., A.C. Boynton. 1991. Information Architecture: In Search of Efficient
Flexibility. MIS Quarterly 15(4) 435-445. Almeida, P., J. Song, R.M. Grant. 2002. Are Firms Superior to Alliances and Markets?
An Empirical Test of Cross-Border Knowledge Building. Organization Science 13(2) 147-161.
Anand, B.N., T. Khanna. 2000. Do firms learn to create value? The case of alliances. Strategic Management Journal 21(3) 285-315.
Babcock, C. 2007. BearingPoint Says SOA Can Be Costly, Hard To Maintain InformationWeek.
Baldwin, C.Y., K.B. Clark. 2000. Design Rules: The Power of Modularity. MIT Press, Cambridge, MA.
Barua, A., B. Lee. 1997. An Economic Analysis of the Introduction of an Electronic Data Interchange System. Information Systems Research 8(4) 398-422.
Bensaou, M. 1997. Interorganizational Cooperation: The Role of Information Technology an Empirical Comparison of U.S. and Japanese Supplier Relations. Information Systems Research 8(2) 107.
Bensaou, M., N. Venkatraman. 1995. Configurations of interorganizational relationships: A comparison Management Science 41(9) 1471.
Bharadwaj, A., S. Bharadwaj, B.R. Konsynski. 1999. Information Technology Effects on Firm Performance As Measured by Tobin's Q. Management Science 45(7) 1008-1024.
Black, S.E., L.M. Lynch. 2001. How To Compete: The Impact Of Workplace Practices And Information Technology On Productivity. Review of Economics & Statistics 83(3) 434.
Brynjolfsson, E., L.M. Hitt, S. Yang. 2002. Intangible Assets: Computers and Organizational Capital. Brookings Papers on Economic Activity: Macroeconomics 1 137-199.
Brynjolfsson, E., T.W. Malone, V. Gurbaxani, A. Kambil. 1994. Does Information Technology Lead to Smaller Firms? Management Science 40(12) 1628-1644.
Byrd, T.A., D.E. Turner. 2000. Measuring the Flexibility of Information Technology Infrastructure: Exploratory Analysis of a Construct. Journal of Management Information Systems 17(1) 167-208.
Chan, S.H., J.W. Kensinger, A.J. Keown. 1997. Do Strategic Alliances Create Value? Journal of Financial Economics 46 199-221.
Chari, M.D.R., S. Devaraj, P. David. 2008. The Impact of Information Technology Investments and Diversification Strategies on Firm Performance. Management Science 54(1) 224-234.
Chatterjee, D., A.H. Segars, R.T. Watson. 2006. Realizing the Promise of E-Business: Developing and Leveraging Electronic Partnering Options. California Management Review 48(4) 60-83.
100
Cherbakov, L., G. Galambos, R. Harishankar, S. Kalyana, G. Rackham. 2005. Impact of Service Orientation at the Business Level. IBM Systems Journal 44(4) 653-667.
Chesbrough, H., D. Spohrer. 2006. A Research Manifesto for Services Science. Communications of the ACM 49(7) 35-40.
Clark, T.H., D.B. Stoddard. 1996. Interorganizational business process redesign: Merging technological and process innovation. Journal of Management Information Systems 13(2) 9-28.
CXO. 2004. Evolving Companies May Control their Information System. CXO Europe. http://www.enterprise-architecture.info/Images/Documents/MEGA%20Success%20Story%20-%20Renault%20EN.pdf.
Dewan, S., S.S. Michael, C.-K. Min. 1998. Firm Characteristics and Investments in Information Technology: Scale and Scope Effects. Information Systems Research 9(3) 219-232.
Duncan, N.B. 1995. Capturing Flexibility of Information Technology Infrastructure: A Study of Resource Characteristics and their Measure. Journal of Management Information Systems 12(2) 37-58.
Dyer, J.H. 1996. Specialized supplier networks as a source of competitive advantage: evidence from the auto industry. Strategic Management Journal 17 271-292.
Dyer, J.H. 1997. Effective Interfirm Collaboration: How Firms Minimize Transaction Costs and Maximize Transaction Value. Strategic Management Journal 18 535-556.
Eisenhardt, K.M., J.A. Martin. 2000. Dynamic Capabilities: What Are They? Strategic Management Journal 21 1105-1121.
Galunic, D.C., S. Rodan. 1998. Resource Recombinations in the Firm: Knowledge Structures and the Potential For Schumpeterian Innovation. Strategic Management Journal 19(12) 1193-1201.
Gibbons, R. 2005. Four formal(izable) theories of the firm? Journal of Economic Behavior & Organization 58(2) 200-245.
Gomes-Casseres, B. 2005. Outsource Processes, Don't Abandon Them CIO Magazine, http://www.cio.com/article/print/12556.
Gosain, S., A. Malhotra, O.A. El Sawy. 2005. Coordinating for Flexibility in e-Business Supply Chains. Journal of Management Information Systems 21(3) 7-45.
Greene, W.H. 2003. Econometric Analysis, 5th ed. Prentice Hall, Upper Saddle River, NJ.
Gulati, R. 1998. Alliances and Networks. Strategic Management Journal 19(4) 293-317. Gulati, R. 1999. Network location and learning: The influence of network resources and
firm capabilities on Alliance Formation. Strategic Management Journal 20(5) 397-420.
Gulati, R., H. Singh. 1998. The Architecture of Cooperation: Managing Coordination Costs and Appropriation Concerns in Strategic Alliances. Administrative Science Quarterly 43 781-814.
Hasselbring, W. 2000. Information system integration. Communications of the ACM 43(6) 32 - 38.
101
Henderson, R.M., K.B. Clark. 1990. Architectural Innovation: The Reconfiguration of Existing Product Technologies and the Failure of Established Firms. Strategic Management Journal 35(1) 9-30.
Hitt, L.M. 1999. Information Technology and Firm Boundaries: Evidence from Panel Data. Information Systems Research 10(2) 134-149.
Hou, K., D.T. Robinson. 2006. Industry Concentration and Average Stock Returns. Journal of Finance 61(4) 1927-1956.
Jacobides, M.G., S.G. Winter. 2005. The Co-Evolution of Capabilities and Transaction Costs: Explaining the Institutional Structure of Production. Strategic Management Journal 26(5) 395-413.
Kale, P., J.H. Dyer, H. Singh. 2002. Alliance capability, stock market response, and long-term alliance success: the role of the alliance function. Strategic Management Journal 23(8) 747.
Kam, C.D., and Franzese, R.J. 2007. Modeling and Interpreting Interactive Hypotheses in Regression Analysis: A Brief Refresher and Some Practical Advice. Ann Arbor, MI: University of Michigan Press.
Kim, S.M., J.T. Mahoney. 2006. Mutual commitment to support exchange: relation-specific IT system as a substitute for managerial hierarchy. Strategic Management Journal 27(5) 401-423.
Lavie, D. 2007. Alliance Portfolios and Firm Performance: A Study of Value Creation and Appropriation In the U.S. Software Industry. Strategic Management Journal 28(12) 1187-1212.
Malhotra, A., S. Gosain, O.A. El Sawy. 2005. Absorptive Capacity Configurations in Supply Chains: Gearing for Partner- Enabled Market Knowledge Creation. MIS Quarterly 29(1) 145-187.
Mans, J. 2008. Automated palletizing system provides 'sweet' relief for Hershey Packaging Digest, http://www.packagingdigest.com/index.asp?layout=articlePrint&articleID=CA6527473&article_prefix=CA&article_id=6527473.
McAfee, A. 2005. Will Web Services Really Transform Collaboration? MIT Sloan Management Review 46(2) 78-84.
Mukhopadhyay, T., S. Kekre. 2002. Strategic and Operational Benefits of Electronic Integration in B2B Procurement Processes. Management Science 48(10) 1301-1313.
Nag, R., D.C. Hambrick, M.-J. Chen. 2007. What is Strategic Management, Really? Inductive Derivation of a Consensus Definition of the Field Strategic Management Journal 28(9) 935-955.
Natis, Y.V., R.W. Schulte. 2003. Introduction to Service-Oriented Architecture. Gartner 2(SPA-19-5971).
Nicolaou, A.I., D.H. McKnight. 2006. Perceived Information Quality in Data Exchanges: Effects on Risk, Trust, and Intention to Use. Information Systems Research 17(4) 332-351.
Nijman, T., M. Verbeek. 1992. Nonresponse in Panel Data: The Impact on Estimates of a Life Cycle Consumption Function. Journal of Applied Econometrics 7(3) 243-257.
102
Oxley, J.E. 1997. Appropriability Hazards and Governance in Strategic Alliances: A Transaction Cost Approach. Journal of Law, Economics, & Organization 13(2) 387-409.
Pavlou, P., O. El Sawy. 2006. From IT Leveraging Competence to Competitive Advantage in Turbulent Environments: The Case of New Product Development. Information Systems Research 17(3) 198-227.
Prahalad, C.K., M.S. Krishnan. 2008. The New Age of Innovation: Driving Cocreated Value through Global Networks. McGraw-Hill, New York.
Rai, A., R. Patnayakuni, N. Patnayakuni. 1997. Technology Investment and Business Performance. Communications of the ACM 40(7) 89-97.
Rai, A., R. Patnayakuni, N. Seth. 2006. Firm Performance Impacts of Digitally Enabled Supply Chain Integration Capabilities. MIS Quarterly 30(2) 225-246.
Ray, G., D. Wu, P. Konana. 2009. Competitive Environment and the Relationship Between IT and Vertical Integration. Management Science 20(4) forthcoming.
Renault. 2008. The Alliance on the Move 2008(March 10, 2008) http://www.renault.com/renault_com/en/main/10_GROUPE_RENAULT/60_Acteur_mondial/10_Alliance_Renault-Nissan/20_Dynamique/index.aspx
Reuters. 2007. Hershey Foods announces global supply chain transformation(February 15, 2007) http://www.reuters.com/article/inPlayBriefing/idUSIN20070215080432HSY20070215
Robins, J., M. Wiersema. 1995. A Resource-Based Approach to the Multibusiness Firm: Empirical Analysis of Portfolio Interrelationships and Corporate Financial Performance. Strategic Management Journal 16(4) 277-299.
Sambamurthy, V., A. Bharadwaj, V. Grover. 2003. Shaping Agility through Digital Options: Reconceptualizing the Role of Information Technology in Contemporary Firms. MIS Quarterly 27(2) 237-263.
Sanchez, R., J.T. Mahoney. 1996. Modularity, Flexibility, and Knowledge Management in Product and Organization Design. Strategic Management Journal 17(1) 63-76.
Schilling, M.A. 2009. Understanding the Alliance Data. Strategic Management Journal 30(3) 233 - 260.
Teece, D.J., G. Pisano, A. Shuen. 1997. Dynamic Capabilities and Strategic Management. Strategic Management Journal 18(7) 509-533.
Tetlock, P.C., Saar-Tsechansky, S. Mackskassy. 2008. More Than Words: Quantifying Language to Measure Firms’ Fundamentals. Journal of Finance 63(3) 1437-1467.
Vassolo, R.S., J. Anand, T.B. Folta. 2004. Non-Additivity in Portfolios of Exploration Activities: a Real Options-Based Analysis of Equity Alliances in Biotechnology. Strategic Management Journal 25(11) 1045-1061.
Venkatraman, N., A. Zaheer. 1990. Electronic Integration and Strategic Advantage: A Quasi-Experimental Study in the Insurance Industry. Information Systems Research 1(4) 377-393.
Villalonga, B. 2004. Intangible resources, Tobin's q, and sustainability of performance differences. Journal of Economic Behavior & Organization 54(2) 205.
Waring, G.F. 1996. Industry Difference in the Persistence of Firm-Specific Returns. American Economic Review 86(5) 1253-1265.
103
Wernerfelt, B., C.A. Montgomery. 1988. Tobin's q and the Importance of Focus in Firm Performance. the American Economic Review 78(1) 246-250.
Wooldridge, J.M. 2002. Econometric Analysis of Cross Section and Panel Data. The MIT Press, Cambridge, MA.
Young-Ybarra, C., M. Wiersema. 1999. Strategic Flexibility in Information Technology Alliances: The Influence of Transaction Cost Economics and Social Exchange Theory. Organization Science 10(4) 439-459.
Zaheer, A., N. Venkatraman. 1994. Determinants of Electronic Integration in the Insurance Industry: An Empirical Test. Management Science 40(5) 549-566.
Zollo, M., J.J. Reuer, H. Singh. 2002. Interorganizational Routines and Performance in Strategic Alliances. Organization Science 13(6) 701-713.
Zollo, M., S.G. Winter. 2002. Deliberate Learning and the Evolution of Dynamic Capabilities. Organization Science 13(3) 339-351.
104
CHAPTER IV
The Effects of Information Technology Investment and Integration Costs on Merger Value in the U.S. Commercial Banking Industry
IV.1. Introduction
The critical role of information technology (IT) in mergers and acquisitions
(M&A) has been described in case studies and in countless industry press reports (Gilson
and Escalle 1998). The merger of two firms is a complex event, involving the integration
of two distinct and intricate organizational structures, cultures, business processes, and IT
systems (Focarelli and Panetta 2003). Merger integration challenges are especially
prominent in the commercial banking industry, where the integration between bank
business processes and systems can be extremely complex, yet also critical to survival
and success of the merging banks. In the words of a banking analyst at Merrill Lynch:
“Most mergers fall down on IT. Few boards have got the message that integrating IT
systems is critical” (Piggott 2000).
IT investment can have a tremendous impact in enhancing the value that firms
derive from the process of merger integration (Aberg and Sias 2005; Gilson and Escalle
1998; Kendler 2005). In the banking industry, advances in IT have been considered,
along with deregulation legislation such as the Riegle-Neal Interstate Banking and
Branch Efficiency Act, to be enablers of widespread consolidation over the past two
decades (Berger et al. 1999; Holmstrom and Kaplan 2001). As automation and
digitization have reduced constraints on the scale and geographic scope of firm
105
operations, the creation of larger banks has become more feasible. Studies on the
performance outcomes of M&A— in the fields of economics, finance, and industrial
organization— often acknowledge, albeit tangentially, the important role of IT in the
successful integration of merging firms. For instance, Berger and Mester (2003 p. 166)
speculate that revenue gains from M&A may be driven by banks’ increased capability to
offer new IT-enabled products and services at a greater scale: “...banks involved in
M&A’s spread the new or improved services afforded by technological advances to the
acquired banks.” Despite the widely acknowledged role of IT in M&A, there remains
surprisingly little empirical evidence regarding the effects of IT investment on merger
value.
In this paper, I examine the effect of pre-merger IT investment of both acquiring
and target firms on the value derived from a merger, from the perspective of both the
acquiring firm as well as the combined acquirer-target entity. Further, I examine whether
the effect of IT investment on merger value changes with the size of a merger integration
project. I draw from a data set of mergers from 1994 to 2006 among large public U.S.
commercial banks, and consider stock market reactions to merger announcements as well
as long-term changes in financial performance. Empirical results suggest that IT
investment of the acquiring bank becomes increasingly beneficial to merger value with
the size of the integration project. While integration costs by themselves are negatively
associated with merger value, this effect is moderated in the positive direction by
acquirers’ pre-merger IT investment. Further, the interaction between IT investment and
integration costs is similarly associated with short-term stock market reactions to merger
announcement events, reflecting a possible awareness on the part of market analysts
106
regarding the role of IT and integration capabilities in mergers. Results do not show a
significant effect of IT investment on the part of the target firms, suggesting that
acquiring firms may not have been leveraging target firms’ IT capabilities nearly as much
as their own. Building on the business value of IT literature, I discuss several possible
mechanisms that can explain why the firm-value contribution of acquirers’ IT investment
is amplified with the size of integration projects: IT economies of scale, rationalization of
business processes, and digitization of business processes.
I choose the U.S. banking industry as the setting for this study for a number of
reasons. First, this is an economically significant setting, as the M&A activity in this
sector represents a substantial portion of total U.S. economic activity.16
16 Asset sizes of merging banks often exceed $100 billion.
Second, one of
the primary reasons that banks engage in mergers is also the reason that IT investments
can be impactful: To enhance operational efficiencies, to increase economies of scale,
reduce costs, and leverage inter-organizational synergies (Gilson and Escalle 1998).
Third, bank operations are very IT-intensive. Almost any complex business process or
innovation in banking products or services involves substantial investments or
capabilities in IT. While bank business process are complex, reliability of those processes
are critical and any disruption in operations may affect bank profits and reputation
(Davamanirajan et al. 2006). Fourth, the U.S. bank industry provides unique advantages
in the data available for empirical study, including the existence of federal regulations
that standardize how banks report key firm-performance metrics on a quarterly basis, and
their common practice of reporting IT investment and merger-related integration costs.
Finally, by considering only the largest U.S. commercial banks, this study conducts
107
analysis in a controlled industry setting in which all firms are subject to similar temporal
industry conditions.
IV.2. Background Literature
The relevant research on this topic can be organized into two broad clusters: 1)
The finance, accounting, and economic literatures on the firm-value effects of bank
mergers, and 2) Studies within the Information Systems (IS) discipline, including
business value of IT studies focusing on the financial services sectors, and qualitative and
case-study based research works on the role of IT in merger integration.
Studies on bank mergers in the fields of finance, accounting, and economics show
mixed evidence regarding whether corporate mergers and acquisitions (M&A) create
value. This has led to somewhat of a puzzle, because theory would suggest that mergers
should create economies of scale and hence should improve operating efficiency (Berger
et al. 1999; Delong and Deyoung 2007). In the period from 1991 to 1997, profit
productivity of banks engaging in mergers increased substantially while cost productivity
of banks actually became worse (Berger and Mester 2003). Some research has shown
that banking M&A has led to greater profit-related efficiencies, and that neither the
resulting cost-reduction nor consolidation-driven price increases were driving these
efficiencies (Akhavein et al. 1997). On the other hand, evidence shows that the stock
market reacts more favorably to managerial projections of cost-reduction in bank M&As
rather than projections of revenue increases, and that managers either overstate the
expected revenue gains or the stock market undervalues them (Houston et al. 2001).
Although recent evidence suggests that banks have been improving in best practices
underlying the execution of M&A (Delong and Deyoung 2007), we still have little
108
quantitative evidence regarding the specific types of investments or firm capabilities that
give rise to such best practices.
Prior studies in economics and corporate finance make tangential reference to the
role of IT capabilities and integration of bank operations. Evidence from nine prior case
studies of horizontal mega-mergers, those involving two banks with at least $1 billion in
assets each, suggests that cost-reduction results largely from reduction in staff and
elimination of redundant IT systems and processes (Rhoades 1998). The same case
studies also reveal that “… the most frequent and serious problem [in the efficiency gains
of mergers] was unexpected difficulty in integrating data processing systems and
operations” (Rhoades 1998 p. 273). In an empirical study on the impact of strategic
similarities on post-merger performance, it is argued that long-term gains in post-merger
performance may be reduced by the difficulties in integrating large institutions: “As a
financial institution becomes more complex, it is more difficult for managers to control
the [merged] entity, possibly leading to less efficient internal control procedures and
duplicated or overlapping expenses” (Altunbas and Marques 2008, p. 207). Although
there is broad consensus that the large-scale consolidation of the banking industry has
been enabled by IT as well as deregulation, research in this domain has yet to examine
the influence of IT investment or integration costs.
Prior studies in the business value of IT include those focusing on the financial
services sector. In the context of global wholesale banking, a production function
approach shows returns on IT investment to be about 100% per year (Davamanirajan et
al. 2002). In the trade-services sector of international banking, research on the effects of
electronic integration on labor productivity and cycle time shows a link between process-
109
level productivity measures and firm-level profit margins (Davamanirajan et al. 2006).
While studies demonstrate that IT investments have substantial and measurable economic
value in the banking industry, there is an emerging recognition of the need to understand
the role of IT investment in the merger integration process. A recent empirical study
using survey measures of 86 Fortune 1000 firms shows that the capital markets value
cross-business IT integration capabilities of acquirers (Tanriverdi and Uysal 2009). Since
mergers are dynamic contexts involving the transformation of business processes or
reconfiguration of organizational structures, there may be particular mechanisms by
which IT investment can generate business value in these contexts.
Several qualitative and case studies have focused on the role of IT in the merger
integration process (Giacomazzi et al. 1997; Johnston and Yetton 1996; Robbins and
Stylianou 1999; Stylianou et al. 1996). For example, a single-case study using twenty-one
detailed unstructured interviews conducted among managers of two banks before and
after a merger, provides some basic prescriptions regarding the use of different models of
IT integration (Johnston and Yetton 1996). These case studies have been valuable in
highlighting the challenges and benefits of IT in the merger integration process, as well
as providing clues into the ways that IT can generate value in the context of mergers.
However, there remains a need for greater empirical evidence on the effect of IT
investment and integration processes in the value that firms derive from mergers, and
new research has only begun to emerge on this topic (Tanriverdi and Uysal 2009). The
current paper addresses this gap in the literature through an empirical study in a
homogeneous industry setting, using quantitative measures of IT spending and
110
integration costs, and examining outcomes in long-term accounting performance in
addition to abnormal returns.
IV.3. Theory and Hypotheses
The integration process is considered to be a key determinant of success in bank
mergers—in realizing long-term cost-efficiency, and in generating synergies that result in
new sources of revenue (Aberg and Sias 2005; Houston et al. 2001; Rhoades 1998). Prior
academic studies as well as industry trade journals have acknowledged the substantial
role of IT in the success of merger integration projects (Berger 2003; Rhoades 1998). A
broad survey of the IS literature reveals three primary mechanisms by which IT
capabilities can enhance the value that is created in mergers: 1) Extensibility of IT across
larger scales of operations, or IT economies of scale, 2) the rationalization or
streamlining of business processes to facilitate integration, and 3) the flexibility of IT to
reconfigure firm resources and enable inter-firm synergies to be created.
First, firms can leverage IT economies of scale, the ability to extend IT
capabilities towards larger scales of business operations in order to achieve greater
efficiency of the merged firm. Given the role of IT in both coordination and control, IT
investment can have a substantial role in generating economies of scale and scope
(Dewan et al. 1998). This has implications for the role of IT in the context of corporate
mergers as well. Through automation and digitization, large sets of business processes
can be made to extend across enormous scales, coordination capabilities are enhanced,
and transactions become much more efficient (Melville et al. 2007). With greater
automation it becomes possible to reduce reliance on manual processes which require
111
human labor, enabling larger corporate entities to operate more efficiently and at larger
scales.
Second, firms can leverage value from a merger through rationalization of
business processes—the practice in which firms identify sub-optimal or inefficient
business processes, and then reconfigure and streamline them (Dietz 2006; Hammer and
Champy 1993). Otherwise, without a high level of visibility into firm processes which
digitization enables, the merger integration process can contribute to a chaotic
environment for bank personnel and make it difficult to systematically improve the
efficiency of bank processes. Large scale integration processes can exacerbate the
operational disruptions and general sense of uncertainty experienced by employees,
leading to the conditions such as social complexity and causal ambiguity (Mata et al.
1995; Melville et al. 2004). Rationalization of business processes implies that the firm
can have more control of streamlined business processes, allowing the firm to better
manage business processes, and to eliminate redundancy of business processes.
Third, an entire sub-literature has emerged on the flexibility-enhancing
contribution of IT in turbulent or dynamic environments (Gosain et al. 2005; Pavlou and
El Sawy 2006; Sambamurthy et al. 2003). Prior studies suggest that investments in IT
enable core business processes to be rendered in digital form, increasing the flexibility of
firms to reconfigure business processes (Byrd and Turner 2000; Duncan 1995;
Sambamurthy et al. 2003). As discussed in Sambamurthy et al. (2003), IT investments
can enhance digital richness, a concept which refers to the quality, transparency, and
visibility of information embedded in business processes. In the context of bank-merger
integration, digital richness enables managers to have greater insight into how processes
112
inter-connect, and into how they can be reconfigured and streamlined for greater
efficiency. This creates the conditions for better management, oversight, and
understanding of business processes (Dietz 2006), leading to more efficient use of non-IT
resources such as reallocations of personnel and physical premises in organizational
restructuring, training, and reconfiguration of business processes.
IV.3.1 Effect of IT investment on Merger Cost-Efficiency Gains
While banks may engage in acquisitions for various strategic reasons such as
increasing market share, the most commonly cited reason for bank consolidation is the
aim of improving cost efficiency (Hancock et al. 1999; Linder and Crane 1993). The
centrality of cost-efficiency as a performance objective of mergers has been demonstrated
in both empirical and case studies (Gilson and Escalle 1998; Houston et al. 2001).
Substantial unexplained variation in cost-efficiency outcomes may be attributed to
investments in IT, which can enhance business process capabilities useful in merger
integration. Business processes can be made more efficient through automation, better
governance of business processes, and digitization of processes; which are possible
through investments in IT (Brynjolfsson and Hitt 1996; Melville et al. 2007; Melville et
al. 2004). In considering the role of IT in rationalizing processes, enhancing flexibility,
and generating economies of scale, the implications for cost-efficiency are clear. First,
rationalization of business processes entails the elimination of redundancy as business
processes are streamlined, leading to greater cost-efficiency (Hammer and Champy
1993). Second, banks capture economies of scale by reducing the redundancies that may
exist in systems or personnel, so that a greater number of customers can be served with
existing infrastructure capabilities (Berger et al. 1999; Rhoades 1998). Third,
113
reconfiguration and flexibility of processes are enabled by IT investment in a way that
allows more cost-efficient processes to be created in the process of integration (Byrd and
Turner 2000). As a greater portion of business processes are rendered in digital form,
business processes will be easier to transform in the course of large scale organizational
change in a way that is less labor-intensive, less error-prone, and less draining of firm
resources.
H1: Greater pre-merger IT investment is associated with greater improvement in cost-efficiency following a merger.
IV.3.2 Effect of Integration Costs on Merger Performance Gains Integration is a process that leads to the merger of distinct corporate entities into a
single operating entity, rather than what would otherwise be a nominal acquisition or
purchase of one firm by another. Integration costs are the costs incurred as merging banks
re-engineer business processes and restructure their organizations in the course of
mergers. Such costs arise from systems conversion projects, personnel changes, physical
restructuring, training, and transformation of business processes as a result of the merger.
The overall costs of integration may depend on the extent to which the acquiring bank
makes a strategic or operational decision to integrate a newly acquired firm or to keep it
running as an independent entity, or on an acquiring bank’s infrastructural capabilities to
integrate the target firm. The decision to integrate involves a trade-off between the
potential benefits from leveraging synergies as a result of integration, against the
potential costs and risks of integration (Zollo and Singh 2004). Hence, integration costs
can be considered to some extent as a choice variable on the part of the merging banks, as
it is possible for a firm to be acquired without being integrated (Shaver 2006).
114
Integration costs also indicate the size and complexity of the merger integration
project. A corporate merger can be a turbulent event within the organization in terms of
its effect on employee morale, its upheaval of organizational routines and structures, and
the disruption of business processes (Tanriverdi and Uysal 2009). Due to the complexity
of business processes within banks, the mission critical nature of such business processes
can be disastrous for a bank’s reputation if glitches in bank processes affect customers.
For example, the merger between PNC and Riggs national bank left customers unable to
access their account balance information for several days while these firms were
converting systems (O'Hara 2005). The merger between Wells Fargo and First Interstate
involved glitches in systems integration that caused many customer deposits to be posted
into incorrect accounts (Authers 1998). Although integration costs usually subside after a
two or three year gestation period (Focarelli and Panetta 2003), the impact of glitches in
the integration process can be palpable in ongoing profitability, cost-efficiency, and
customer retention well beyond this time period.
As the size of an integration project increases, governance and rationalization of
processes may become more difficult, leading to the possibility of customer defection.
Several mergers in the 1990’s were known to have particularly cumbersome integration
projects in which systems conversion problems became public, resulting in loss of
customers and compromising the banks’ reputation: Among them, the Wells Fargo-First
Interstate Merger in 1996 (Authers 1998; Wahl 1998), the Fleet-BankBoston merger in
1999 (Marlin 2003; Moyer 2001) and the Nations Bank-Barnett merger in 1997
(Breitkopf 2001). Integration process disruptions also hamper the firms’ ability to derive
synergy from the merger, as potential synergies in cross-selling fail to be realized or joint
115
optimization of processes fail to occur. While integration processes can deepen the
interdependence between firms, integration processes can create contagion effects in
which negative shocks in the organizational environment, such as operational glitches or
disruptions in routines, are more likely to reverberate across the boundaries of the
merging firm (Shaver 2006). A large integration project can create a disruptive effect in
firm operations, increase the occurrence of errors, and make it more difficult for the firm
to realize gains from the merger (Alaranta 2006).
Larger scale systems integration projects can consume organizational resources
such as staff labor and training. When firms allocate substantial resources to ‘fire
fighting’, or to resolving crises and operational disruptions as they arise in the process of
integration, these resources are diverted from other activities such as process
rationalization that may lead to long-term gains in operational efficiency. Integration
complications can lead to tangible consequences in the ability to govern the business
processes. Therefore, integration costs potentially lead to a dissipation of firm value that
may have large performance implications over time—as a result of fundamental and
deeply persistent problems in merger execution.
H2: Merger integration costs have a negative relationship to firm performance following a merger.
IV.3.3 Moderating Influence of IT Investment in the Effect of Integration Costs on
Merger Performance Gains While integration costs can be disruptive and detrimental to merger value,
investments in IT can influence the effect of such integration costs: first, by mitigating
the associated risks, and second, by helping to realize synergies that are latent in the
integration process. As banks invest in IT, they are more likely to have established
flexible technology architectures that enable greater strategic agility for organizational
116
restructuring related to M&A (Broadbent et al. 1999; Byrd and Turner 2000). IT
capabilities can enable banks to generate new sources of customer value and maintain
greater customer retention during the merger, leading to fewer service disruptions and an
enhanced capability to generate new products. As business processes become more
digitized and IT infrastructure capabilities increase, a bank’s flexibility for organizational
transformation may also increase, reducing the detrimental impact of integration costs. IT
investments can also enhance the dynamic capabilities of process reconfiguration or
resource recombination, which become increasingly valuable as integration processes
increase in scale (Malhotra et al. 2005).
Large integration complexity suggests a potential for creating synergies and
value-creation, in which the role of IT in realizing those synergies increases (Tanriverdi
2006). Integration costs may be indicative of the depth of the merger integration
processes. Investments in IT systems such as business process management, customer
relationship management systems, and enterprise-resource planning systems can enable
firms cope with larger integration processes (Tanriverdi and Uysal 2009). As firms
become more capable of coping with large scale organizational change, they can better
evaluate and optimize those processes in both greater scale and greater detail. Enhanced
capabilities in realizing merger synergies can have implications not only for operating
efficiency, but also for profitability and customer retention. IT capabilities can enable
banks to increase the diversity of new IT-enabled products and services that reach a
broader base of customers (Berger 2003; Sambamurthy et al. 2003). Therefore,
investments in IT can increase a bank’s ability to leverage synergies from an acquisition
in a way that leads to greater operating efficiency, customer retention, and profitability.
117
H3: IT investment positively moderates the influence of integration costs on post-merger performance. IV.3.4 Moderating Influence of IT Investment in the Effect of Integration Costs on
Stock-Market Reactions to Bank Mergers According to the theory of efficient markets, stock market reactions incorporate
all publicly known information and rational predictions about the long-term performance
implications of a merger (Delong and Deyoung 2007). In comparison to long-term
accounting returns, short-term returns can be more easily isolated and attributed to a
specific event. Hence, gauging the stock market reactions to an event can help validate
inferences related to long-term returns, by reducing the possibility that other non-related
events may be explaining the hypothesized relationships. However, prior empirical
studies do not generally show that markets can accurately predict bank merger value,
perhaps because bank mergers are such complex events. On the other hand, evidence
suggests that in the past decade the stock market has improved in its ability to predict
successful value-generating bank mergers, particularly when analysts are able to observe
the best and worst practices of a large number of recent preceding mergers (Delong and
Deyoung 2007).
This raises the question regarding what observable investments or capabilities
may underlie such best practices. Prior evidence suggests that the strategic role of IT
investments is observed by stock market investors, and is reflected in abnormal returns
around the announcement of major strategic moves or investments (Dehning et al. 2003).
Numerous analyst reports and articles in the banking industry trade press suggest that
integration difficulty and related IT capabilities are among the important factors
considered by analysts when assessing the value of bank mergers (Breitkopf 2001;
Kendler 2005; Moyer 2001; Piggott 2000). A substantial part of banking analyst
118
commentary on mergers deals with the prospect of IT systems integration, as well as
other related challenges of integration related to organizational structure and culture. To
the extent that IT investment is an observable factor that can affect the execution or
success of merger integration, we hypothesize:
H4: IT investment positively moderates the relationship between integration costs and stock-market reactions to merger announcements.
The influence of IT investment on merger performance depends upon the manner
in which merging firms consolidate their IT systems—such as whether acquiring firms
decide to leverage and integrate systems (“absorption” model) or to phase out and replace
the IT systems of the target firms (the “best of breeds” model) (Johnston and Yetton
1996). For this reason, we might expect that the influence of IT investment will differ
between acquiring or target firms. It is plausible that the IT investment of the acquiring
firm may have greater influence than the IT investment of the target firm, particularly if
the acquiring firm becomes dominant in establishing organizational policies, making
decisions on bank operations, and implementing business process routines, and if this
dominance is also extended to the implementation of IT systems and IT practices.
Therefore, empirical analysis which utilizes measures of IT investment of both the target
and acquiring firms, as well as merger-level integration data and performance metrics,
can be useful as a basis for further theory development.
IV.4. Methods The unit of analysis in this study is the merger event. The aim in sample selection is
to cover as large an amount of economic activity as possible in the U.S. banking industry.
From the Thomson SDC Platinum database of mergers and acquisitions, I retrieved
records of all merger announcements between the years 1994 through 2006 in which the
119
acquiring and target firms are depository institutions (SIC codes 6000, 6011, 6021, 6022,
6029, 6035, 6036) or office of a bank holding company (6712). From this initial
population of 24,045 merger announcements, only 1,968 of them meet the following
criteria for the sample: 1) The merger was successfully completed, 2) the merger resulted
in the acquiring firm having a majority stake in the target firm, 3) the transaction
involved more than 10% of the target firm’s shares, and 4) both the acquirer and target
firm are based in the United States.
Of these mergers, only 285 of them involved transaction (or deal) values of over
$100,000,000 (a cut-off chosen in order to include the most economically significant
acquisitions), and in which the identifying information given in the SDC database for
both banks (name, home state, symbol, and CUSIP) could be matched unambiguously to
a U.S. bank holding company in the databases of the Federal Reserve Board (FRB). For
firm performance and other bank metrics, I utilized the quarterly Y-9C that U.S. bank
holding companies submit to the Federal Reserve, which allows for consistency in the
reporting of the bank metrics. Since the Federal Reserve tracks all accredited U.S.
commercial banks, the FRB dataset can also be used to assess how well any particular
data sample represents and compares against the population of banks in the U.S. banking
system. The sample size was reduced further due to missing data on IT investments or
integration costs, as well as the existence of outliers. The final sample size of 118
mergers, involving 55 different acquiring bank holding companies, represents a
substantial portion of economic activity among U.S. Banks.
Figure IV.1 shows the year by year proportion of M&A deal activity in the
sample. This figure shows representation both in terms of annual number of mergers, as
120
well as the sum of bank merger deal values. The overall population of domestic U.S.
commercial banking mergers consists of those which meet the four sampling-criterions
listed above, but which may also involve deal values smaller than $100 million, or for
which IT investment or integration data could not be obtained. Figure IV.1 shows that the
relatively small number of bank M&A’s in the sample comprises a large portion of the
total domestic M&A activity in the U.S. banking system. For example, in 1998, the total
number of completed domestic bank mergers was 306, only 14 of which are in the
sample. However, the sample represents nearly half of the total bank merger deal values
for the year 1998; with $142 billion in total deal values compared to $153 billion in deal
values for mergers outside the sample. The dip in 2002 suggests a year of little M&A
activity between U.S. banks; while 1998 had noticeably greater activity.
With the help of supervised research assistants, I hand-collected IT investment
data published in the 10K annual reports of both target and acquiring firms in the years
preceding each merger. IT investments are reported as a combination of equipment,
hardware, software, telecommunications, data processing, and payments to outside IT-
service providers. In addition, we collected merger-related and integration costs for each
merger; these were published in annual 10K and quarterly 10Q reports from one year
prior to between one to three years following the merger effective date. These costs
include the following that are incurred in the process of merger integration: IT systems
conversion projects, computer hardware and equipment replacement, severance and
personnel changes, the closing or opening of building space, branch sales, or operations
restructuring. Integration costs are reported by banks in association with a particular
merger. I included any associated integration costs that may have been incurred over
121
multiple years by checking all 10K and 10Q statements up to four years subsequent to the
merger date.
Variable definitions and their data sources are listed in Table IV.1. All monetary
values are adjusted for annual inflation. Construction of the dependent variables is
discussed next, and the main independent variables of interest are discussed in the
presentation of the econometric models that follow. Selected summary statistics are
presented in Table IV.2, and selected pair-wise correlations are presented in Table IV.3.
IV.4.1 Post-merger Financial Performance: Long-term Changes For merging banks, I calculate the long-term change in three aspects of financial
performance of the merging banks: 1) cost-efficiency (CostEff), as the ratio of non-
interest operating expenses over operating income, 2) profitability, measured using the
return-on-assets (ROA), a ratio of net interest income over total firm assets, 3) and
customer-retention, measured as the ratio of total customer deposits over assets; all three
measures are consistent with those used in Delong and Deyoung (2007). The change in
performance ratio was calculated as a difference between performance ratio three years
after the end-of-quarter date closest to the merger announcement date, and the
performance ratio on the end-of-quarter date closest to one year prior to the merger
announcement date:
∆ Performance Ratio = Performance Ratio t+3 - Performance Ratio t-1. where subscript t is the closest end-of-quarter date to the date of merger announcement.
These particular time-windows to measure performance gains are used because it has
been shown that bank mergers have a gestation period of two or three years (Focarelli
and Panetta 2003; Rhoades 1998).
122
Next, I adjusted the change in performance ratio for any time-specific industry-
wide trends. This was done by subtracting the change in the performance ratio, over the
same time period, for the mean of an annual set of banks which I refer to henceforth as
the cohort out-sample. The annual cohort out-sample includes the population of all U.S.
bank holding companies in the same asset size range of banks in the sample, excluding
any bank holding companies that were also involved in mergers in that year or that
appeared in the sample. A different cohort out-sample is determined for each year. The
industry-adjusted long-term change in performance ratio was calculated as follows:
where n is the number of commercial banks in the cohort out-sample, and f is the
acquiring bank or an asset-weighted combination of the target and acquiring bank.
Figure IV.2 shows the mean cost-efficiency ratio, net of the industry median, of
acquiring firms above the median in IT investment, from one year prior to two years after
the merger. Among these banks, long-term improvements in cost-efficiency were greater
(i.e. in the downward direction) in mergers involving above-the-median integration costs.
This graph is intended to depict the interaction effect of IT investment and integration
costs: the influence of IT investment on merger value appears to increase with integration
costs. In the econometric analysis that follows, I examine the robustness of the pattern
shown in Figure IV.2 to a variety of controls, alternative measures, and corrections for
endogeneity.
123
IV.4.2 Short-term Stock Market Reactions to Merger Announcements: Cumulative Abnormal Returns
In addition to long-term changes in financial performance, I also use an event
study methodology to consider short-term stock market reactions to merger
announcements. Ordinary-least squares regression is used in order to estimate a daily
market model for the test period t = (-300, -46), where t is the number of days prior to the
announcement of the merger, Ri,t is the daily return of the bank’s stock, and Rm,t is the
daily return of the value-weighted index of the Center for Research on Security Pricing:
This regression is used to estimate and for each firm in the test period. The
cumulative abnormal returns (CAR1) for firm i around the event date is calculated as the
sum of the daily estimated abnormal returns from 10 days before the merger
announcement to 30 days after the merger announcement.
The CAR is calculated for both the acquirer and the asset-weighted combination of target
and acquirer, using the alternative event windows t = (-10 days, +30 days) as CAR1, t =
(-5 days, +5 days) as CAR2, and t = (-30 days,+10 days) as CAR3. To calculate
cumulative abnormal returns, the Eventus query tool was used; and data on daily stock
market values comes from the Center for Research in Security Prices.
IV.4.3 Estimation Model I utilize both ordinary least squares (OLS) and instrumental-variables (IVREG)
regression models, with robust standard errors clustered on the identifier of the acquiring
bank. The models provide a test for the effect of IT investment, merger integration costs
124
and their interaction; on either long-term changes in financial performance, or short-term
stock-market reactions:
Y = Constant + β 1 IntegrCosts + β2 AcqIT + β3 IntegrCosts × AcqIT + β4 TgtIT + β5 IntegrCosts × TgtIT + Controls + ε (1)
where Controls represents all control variables, and the dependent variable Y is either a
raw or industry-adjusted long-term change in financial performance ratio (∆ Adj.
Performance Ratio), or one of three alternative measures of cumulative abnormal returns
(CAR1, CAR2, and CAR3). Dependent variables are measured for both the acquiring
firm, and an asset-weighted combination of the acquiring and target firms. The variable
IntegrCosts represents merger-related restructuring and integration costs, given as a
percentage of total acquiring firm assets. The variables AcqIT and TgtIT represent
information technology investment, as a percentage of total assets of acquiring and target
firms respectively, one year prior to the merger. This includes the amount invested
annually in data processing, IT equipment, software, hardware, outside IT services, and
other related IT expenses. All control variables and dependent variables are listed and
defined in Table IV.1.
A potential endogeneity in the model stems from the simultaneous determination
of integration costs and post-merger performance; as integration costs may reflect the
inherent difficulty of a merger integration project, or may reflect an acquiring firm’s
decision to invest in a merger integration process in anticipation of generating synergies.
This would complicate the notion that integration costs directly represent the magnitude
of difficulty of integration projects. Therefore, an instrumental variable is considered that
should clearly affect integration costs, and for which it can be reasonably assumed that
the primary channel of influence on performance gains would be through the integration
125
process. One potentially valid instrumental variable is a measure of a merger’s potential
integration difficulty due to compatibility of IT systems, organizational structures, or firm
cultures, as indicated prior to the merger based in analyst reports and managerial
statements. To construct this measure, a comprehensive search was conducted in Factiva
of analyst and managerial statements about each merger published from one year prior up
to and including the effective date of the merger. Statements were identified that make
reference to the degree of integration difficulty that is expected in the merger as a result
of the respective firms’ compatibility in IT systems and in organizational culture or
structure. The binary variable of integration difficulty was coded to be equal to one if the
managerial and analyst statements regarding the merger showed clear evidence of severe
integration challenges in the pending merger, and zero otherwise. This coding method
was verified independently by two independent coders other than the author.17
This instrumental variable meets basic criteria for validity and relevance. To the
extent the path of influence of ex-ante integration difficulty on merger performance is
through its effect on integration costs, and that that no other significant path of influence
would be hidden in the error term ε i of equation (1), then the condition of instrument
validity requiring that IntegrDifficult be uncorrelated with the error term ε i of equation
(1) is satisfied. The relevance condition of the instrument requires that θ1 ≠ 0 in the
reduced form equation:
IntegrCosts = δ0 + θ1 IntegrDifficult + δ1 AcqIT + δ2 TgtIT + Controls + r (2)
17 A random number generator was used to select 10% of the merger cases reviewed and corroborated by the independent coders, and only a single discrepancy was found out of all responses given, resulting in a correlation of 0.92 between survey respondents and authors’ coding.
126
Standard under-identification and weak-identification tests confirmed that θ1 > 0, and
suggest that this binary variable is a strong instrument for integration costs. These tests
include the F-tests of excluded instruments in the first-stage regression, the Cragg-Donald
under-identification test, the Cragg-Donald weak identification statistic, the Anderson-
Rubin test of joint significance of endogenous regressors, and the Anderson canonical
correlation LR statistic. To instrument for the main interaction terms of interest, a set of
linear predictions for IntegrCosts is generated by conducting an OLS regression of
IntegrCosts on IntegrDifficult and all included instruments (AcqIT, TgtIT, and Controls).
This predicted value is then multiplied by the acquiring and target firms’ asset-
normalized IT investment; this is a standard procedure that corresponds with the
guidelines in Wooldridge (2002).
IV.5. Results
Estimation results are shown in Tables IV.4 through IV.14. In the following
discussion of results, I focus mainly on Tables IV.4 through IV.8. Tables IV.5 through
IV.8 are abridged for ease of viewing, and show a selection of model specifications and
main independent variables. Full and unabridged IVREG and OLS results are provided in
Tables IV.9 through IV.14; I also refer to these unabridged results when appropriate.
Figures IV.3 through IV.5 show graphs of marginal conditional effects of
acquirers’ IT investment and integration respectively on cost-efficiency, profitability, and
customer-retention. The graphs are constructed using procedures outlined in Kam and
Franzese (2007). Values along the x-axis of the graphs of IT investment or integration
costs, each as a ratio over firm assets, correspond to the range of values within the
127
sample. Marginal effects and their confidence intervals are based on coefficient estimates
and standard errors in ordinary-least squares (OLS) regressions of three-year performance
changes of the acquiring firm. As is discussed next, the results suggest that all of the
hypotheses are supported with respect to IT investment of the acquiring bank, but not
with respect to the IT investment of the target bank.
Estimates of β2 and β3 in Table IV.4 show that IT investment of the acquiring
bank has a negative (i.e. beneficial) effect on the cost-efficiency ratio. Estimates of β2 are
negative and significant in the columns (1) and (2) of Table IV.4, in which the dependent
variable is three-year unadjusted change in cost-efficiency. In models involving industry-
adjusted changes in cost-efficiency in columns (3) through (6), a comparison of the
models with and without interaction terms reveals that the effect of the acquirers’ IT
investment is negative and significant only when integration costs are high. When
integration costs are very small or near zero (i.e. acquisitions with little or no integration
taking place), the effect of the acquirers’ IT appears to be insignificant. This is evident in
the marginal effects graph in Figure IV.3a. At the smallest values of integration costs,
the marginal effect of acquirers’ IT investment is not significantly different from zero; as
integration costs increase, the marginal effect of IT investment on cost-efficiency
becomes increasingly negative, or increasingly beneficial to cost-efficiency. This
suggests that the effect of IT investment on the mergers’ contribution to cost-efficiency
occurs primarily through interaction with integration costs. Hence, I next consider the
effect of integration costs, and their interaction with IT investments, on merger value.
Hypothesis 2 predicts that integration costs have a negative relationship to the
value of bank mergers. Due to the potential endogeneity of integration costs, I consider
128
for interpretation the IVREG regressions results shown in Table IV.5, which shows
abridged results; in addition to abridged OLS regression results in Table IV.6.
Unabridged OLS and IVREG model results are shown in Tables IV.9 through IV.13, and
also support this hypothesis. For IVREG models, first-stage regression model results are
shown in columns (2) through (4) of Tables IV.11, IV.12, and IV.13. F-statistics for the
first-stage regression models and for the set of excluded instruments (IntegrDifficult, and
interaction terms IntegrCostsPredicted X AcqIT and IntegrCostsPredicted X TgtIT) are highly
significant at α= 0.000 in all IVREG models. IVREG models are exactly identified,
which means that tests of over-identification are not applicable. Estimates of β 1 show that
integration costs have negative effects on merger value, and are associated with higher
cost-efficiency ratios, smaller ROA and smaller deposits to assets ratios. Hence,
Hypothesis 2 is supported.
Hypothesis 3 predicts that the beneficial effect of acquirers’ IT investment on
merger-value increases with integration costs. The coefficient estimates of β3 (for
IntegrCosts X Acq IT) in all regression tables are significant, in the negative (beneficial)
direction for cost-efficiency, and in the positive direction for ROA and deposits to assets
(DOA). Therefore, Hypothesis 3 is supported. As seen in abridged and unabridged
regression results, the hypotheses are supported in model estimations that use integration
costs and as well as those which use the proxy of integration difficulty as an instrument
for integration costs. Marginal effects graphs in Figures IV.3a, IV.4a and IV.5a suggest
that the effect of acquirers’ IT investment on merger value is greatest in mergers with a
relatively high degree of depth in integration. Similarly, marginal effects graphs in
Figures IV.3b, IV.4b and IV.5b suggest that the marginal effect of integration on merger
129
value increases with acquirers’ IT investment.
Hypothesis 4 predicts that the positive effect of IT investment on stock-market
reactions to merger announcements increases with the degree of merger integration. That
is, we expect that stock-market reactions corroborate the prediction of Hypothesis 3,
regarding changes in long-term firm-performance ratios. Table IV.7 displays regressions
for six different specifications of CAR. Three different time windows are used, and for
each, both the acquirers’ CAR as well an asset-weighted combination of the acquirers’
and targets’ CAR are shown. Though not displayed, the same control variables are used
as in the long-tem performance regressions in the unabridged tables. This regression
utilizes more data points, since it was possible to incorporate a higher number of recent
mergers up to 2006, just before the onset of the banking financial crisis at the end of
2007, because multi-year post-merger performance metrics are not used here. Coefficient
estimates of β3 show a direct correspondence in stock-market reactions with the
prediction of Hypothesis 3 regarding the interaction of integration costs and acquirers’
IT. These results are further supported in estimation results shown in Table IV.8, which
shows IVREG estimates using the proxy of integration difficulty as an instrument for
integration costs. Table IV.8 also shows OLS estimates which are similar to the OLS
models shown in Table IV.7, except that the proxy for integration difficulty is used in
place of integration costs. Together, OLS estimates in Table IV.7 using the integration
costs variable, along with estimates in Table IV.8 using integration difficulty as both an
excluded instrument in IVREG models and as an included regressor in OLS models,
suggest support for Hypothesis 4. Unabridged IVREG results are shown in Table IV.14.
In addition to the hypothesized effects, it is also worth considering how the stock-
130
market reactions corroborate Hypotheses 1 and 2 regarding the direct effects of IT
investment and integration costs. Estimates of β 1 in Tables IV.7 and IV.8 suggest weak
agreement with Hypothesis 2 regarding the effect of integration costs. When we exclude
the interaction terms, estimates of β2 show acquirers’ IT investment has a significant and
positive effect on CAR. As in the regressions involving long-term performance gains, this
effect weakens when the interaction with integration costs is included in the specification.
This suggests that the positive effect of acquirers’ IT on stock-market reactions to bank
mergers increases with integration costs; and that the effect of IT on merger value is
conditional on the degree of integration involved in the merger.
Surprisingly, results do not show that target firms’ IT investment has a significant
effect on merger value. There are several possible explanations for this. It could be that
acquiring firms are not leveraging or integrating target firms’ IT capabilities to the extent
that we might expect; nor would they necessarily be following the ‘best of breeds’ model,
as defined in Johnston and Yetton (1996), in which the superior IT infrastructure takes
hold and the inferior one is discarded or phased out. Instead, it may be that IT
infrastructure and capabilities of the target firm are phased out in favor of the acquiring
firms’ IT infrastructure, perhaps due to the cultural or political dominance of the
acquiring firms’ IT organizations. Further empirical exploration on this latter point would
be merited.
IV.5.1 Additional Analyses and Robustness Checks
Several alternative analyses and robustness checks were conducted. First, an
alternative form of industry adjustment, discussed in Delong and Deyoung (2007), is
considered. In this alternative form, performance ratios are first adjusted by the industry
131
means, and then the change over time is calculated. Second, the financial performance
ratios were adjusted using industry medians rather than industry means. Third, the equity-
weighted combinations of target and acquirer, rather than asset-weighted combinations,
were considered. Fourth, analyses were conducted using winsorized variables. Winsoring
is a process which identifies the highest and lowest 1% of values for each variable, and
replaces those values by the next value inwards from the extremes (Cox 1998). Empirical
results were supported in each of these alternative analyses and robustness checks.
IV.6. Discussion
IV.6.1 Findings The goal of this study was to examine the effect of IT investment and merger
integration costs on merger value, using data on 118 M&As of publicly traded U.S.
commercial banks, announced and completed between 1994 and 2007. Empirical results
show that acquirers’ IT investment has a beneficial effect on cost-efficiency outcomes of
mergers. Integration costs have a negative relationship to merger performance gains. The
effect of acquirers’ IT investment on merger value, both in terms of market value as well
as in changes in long-term performance ratios measuring cost-efficiency, profitability,
and customer retention, becomes increasingly positive with integration costs. The direct
effect of acquirers’ IT investment on merger value becomes negative or insignificant
when integration costs become very small or close to zero.
IV.6.2 Implications
Four research implications emerge from this study. First, building on prior
business value of IT studies focusing on single-firm organizational outcomes, this study
finds that the contribution of IT investment to firm value becomes greater in the context
of mergers involving high levels of integration. This suggests that business value can be
132
generated through mechanisms beyond what is revealed in single-firm contexts. Building
on the business value of IT literature, three possible mechanisms are given to explain
how IT investment enables merging firms to generate new synergies and create merger
value: economies of scale of IT, the rationalization of business processes, and enhanced
reconfiguration of IT-enabled business processes. The dynamic characteristics of the
merger and acquisition setting demand that firms be able to reconfigure IT systems,
business processes, and organizational structures on a massive scale. This context
highlights new perspectives on the ways that IT can generate business value, which
complement our understanding of the role of IT in reducing transaction and coordination
costs.
Second, the complexities and risks of merger integration can be substantial,
particularly in the commercial banking industry. The findings of this study show that
integration costs have a direct negative effect on merger value. I argue that this is due to
the complexity and risk that high integration costs bring to a merger. However, I also find
that integration costs can be mitigated by IT investment. This suggests the importance of
further exploration into the ways that IT can enable firms to transform complex and risky
events such as mergers into value-generating opportunities.
Third, this study shows that short term stock-market reactions are in line with
long-term financial performance, in their association with acquirers’ IT investment and
integration costs interactions. This corresponds with the abundant evidence in banking
industry trade journals suggesting that market analysts do in fact show awareness of IT
capabilities and integration costs in evaluating the potential merits of a merger
(Hovanesian 2006; Kendler 2005; Marlin 2003; Piggott 2000). This also brings greater
133
insight into findings by Delong and Deyoung (2007) that stock markets have over time
gotten better at predicting which mergers are successful; and findings by Dehning et al.
(2003) that the stock markets recognize the strategic role of IT investments. In particular,
I argue that capabilities in IT and integration may be among the merger capabilities that
market observers have improved in assessing.
Fourth, this research addresses a conundrum that has emerged in the literature in
finance and economics, regarding the mixed evidence in the question of whether bank
mergers create value. One of the possible answers to this conundrum is the role of IT in
enabling firms to derive value from mergers. This is consistent with other recent findings
showing that bank merger practices have improved over time, and that codification of
bank merger practices through digitization has had a role in this improvement (Delong
and Deyoung 2007; Zollo and Singh 2004). The literature in economics and finance has
been largely silent on the role of integration costs and IT capabilities in bank mergers,
although these have long been considered among managerial circles to be key factors in
the success of mergers. The empirical evidence suggests that the emphasis on integration
and IT capabilities prominent in the banking trade journals has been appropriate, and that
an aspect of merger success, often mentioned only in passing in prior academic studies on
M&A, should now be considered more centrally in understanding the determinants of
merger value.
This study has several limitations that should be addressed in future research.
First, while the final sample size was chosen both for availability of data as well as for
coherence in bank and merger characteristics, a larger sample size would have been
preferable for analysis, given the number of parameters that must be used to control for
134
the known factors affecting bank merger performance. Second, this study uses aggregate
IT investment data. A useful extension of this study would be to consider the role of
specific IT capabilities, such as enterprise resource planning (ERP) systems, or of flexible
IT infrastructures such as service-oriented architectures that can potentially facilitate
reconfiguration of business processes and streamline the process of merger integration.
Another useful extension would be to consider managerial capabilities with respect to IT
and integration projects, and how they contribute to merger value. Since this study is
among the first to consider business value of IT in merger contexts, much work still
needs to be done to fully explore this phenomenon in a way that can guide further theory
building and provide more precise forms of managerial guidance.
In conclusion, this study provides a new method of examining the business value
of IT in multi-firm contexts; in considering the role of IT in enhancing merger value as
firms integrate disparate cultures, organizations, and systems. This study contributes to
the extant literature by focusing on a specific inter-organizational context in which IT
investment contributes to firm value. The context of bank mergers is an important setting
to study IT business value, because it is a context in which massive organizational
changes take place very quickly. The dynamic features of this setting are consistent with
known mechanisms in the literature on IT business value, but call for greater emphasis on
the transformative role of IT in enabling economies of scale, rationalization of business
processes, and reconfiguration of business processes. Overall, the findings suggest that IT
investment, of the acquiring firm in particular, has a positive and significant effect on the
value of mergers involving high integration costs.
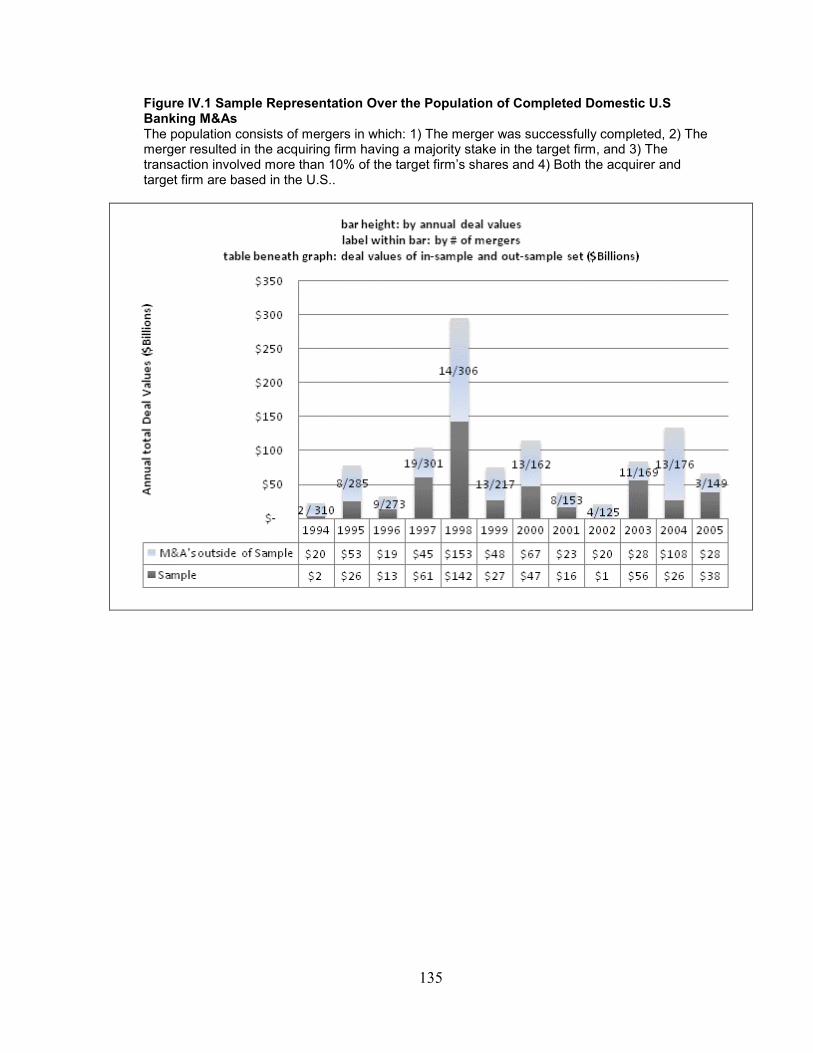
135
Figure IV.1 Sample Representation Over the Population of Completed Domestic U.S Banking M&As The population consists of mergers in which: 1) The merger was successfully completed, 2) The merger resulted in the acquiring firm having a majority stake in the target firm, and 3) The transaction involved more than 10% of the target firm’s shares and 4) Both the acquirer and target firm are based in the U.S..
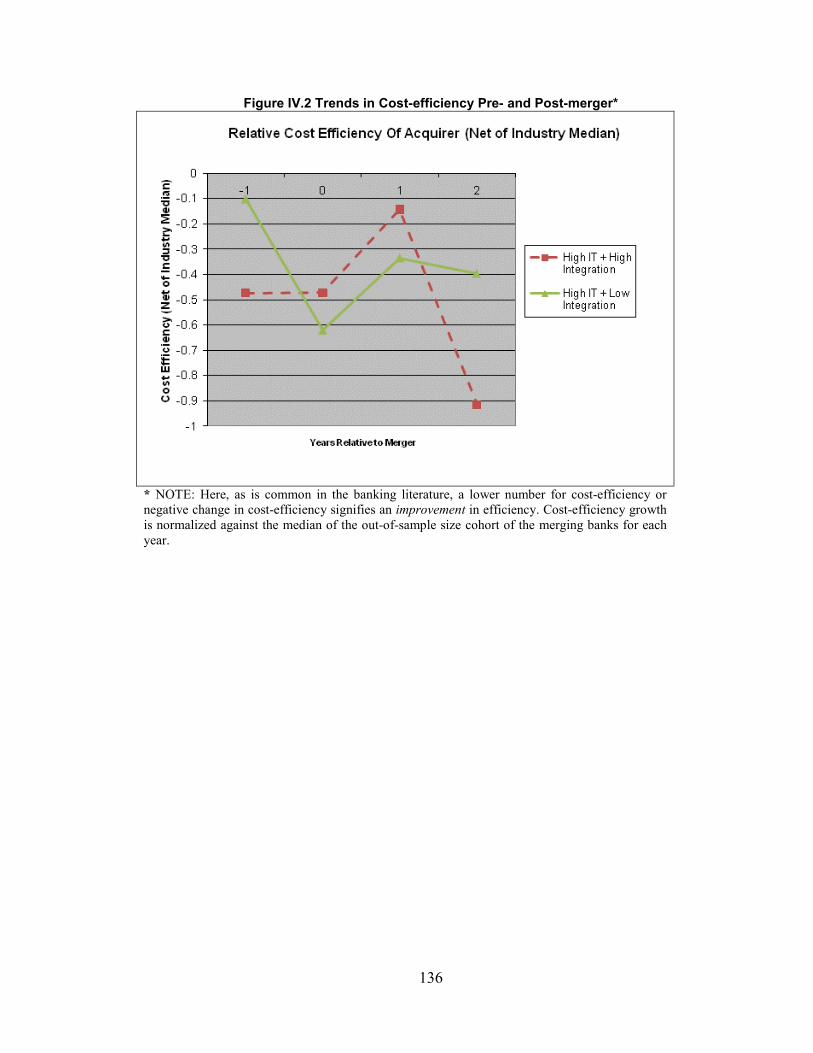
136
Figure IV.2 Trends in Cost-efficiency Pre- and Post-merger*
* NOTE: Here, as is common in the banking literature, a lower number for cost-efficiency or negative change in cost-efficiency signifies an improvement in efficiency. Cost-efficiency growth is normalized against the median of the out-of-sample size cohort of the merging banks for each year.
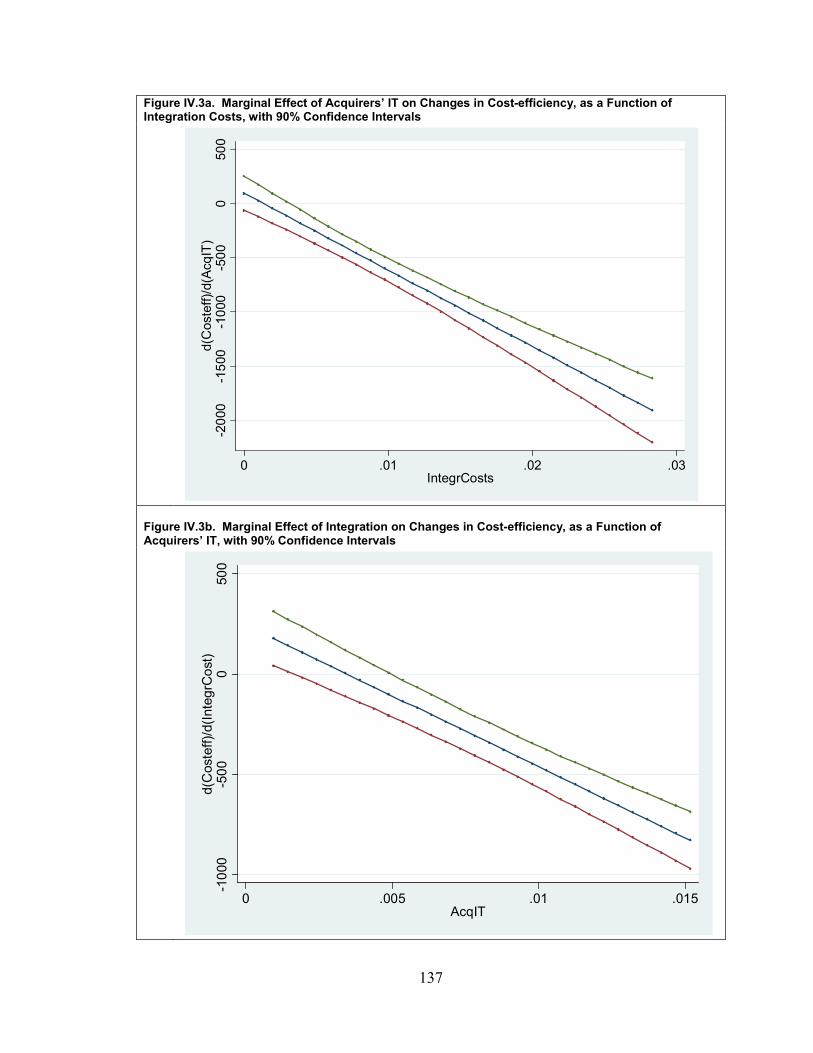
137
Figure IV.3a. Marginal Effect of Acquirers’ IT on Changes in Cost-efficiency, as a Function of Integration Costs, with 90% Confidence Intervals
Figure IV.3b. Marginal Effect of Integration on Changes in Cost-efficiency, as a Function of Acquirers’ IT, with 90% Confidence Intervals
-200
0-1
500
-100
0-5
000
500
d(C
oste
ff)/d
(Acq
IT)
0 .01 .02 .03IntegrCosts
-100
0-5
000
500
d(C
oste
ff)/d
(Inte
grC
ost)
0 .005 .01 .015AcqIT
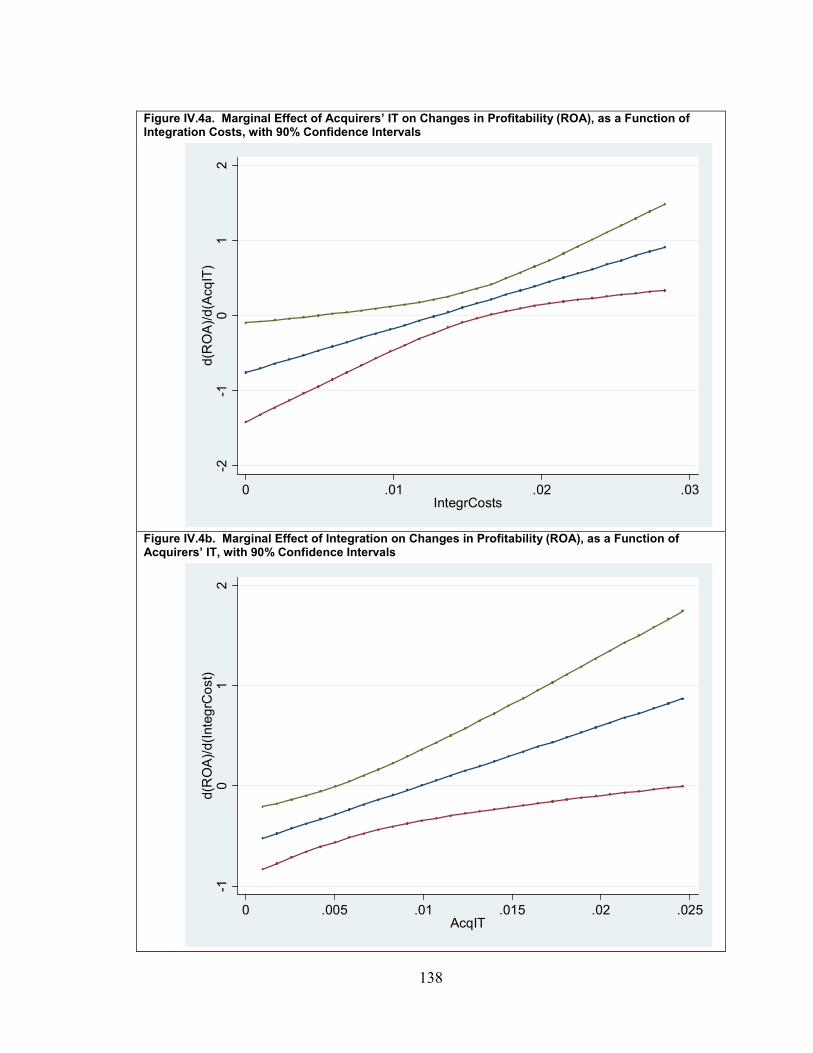
138
Figure IV.4a. Marginal Effect of Acquirers’ IT on Changes in Profitability (ROA), as a Function of Integration Costs, with 90% Confidence Intervals
Figure IV.4b. Marginal Effect of Integration on Changes in Profitability (ROA), as a Function of Acquirers’ IT, with 90% Confidence Intervals
-2-1
01
2d(
RO
A)/d
(Acq
IT)
0 .01 .02 .03IntegrCosts
-10
12
d(R
OA
)/d(In
tegr
Cos
t)
0 .005 .01 .015 .02 .025AcqIT
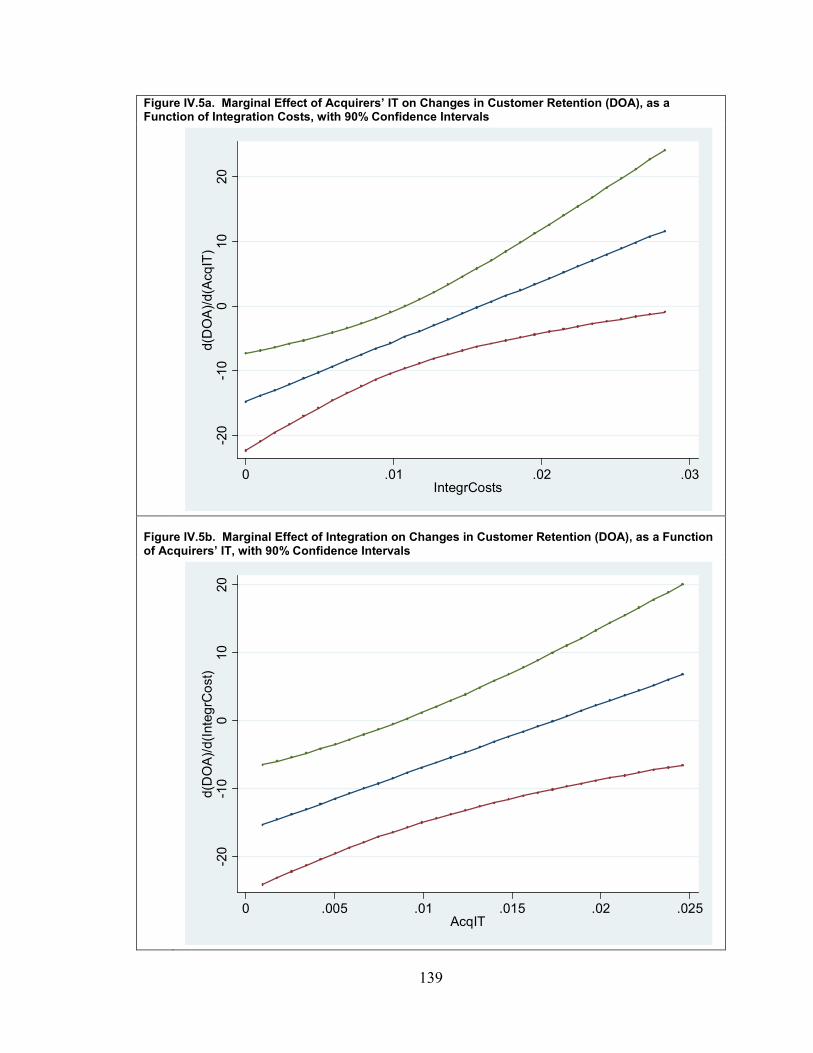
139
Figure IV.5a. Marginal Effect of Acquirers’ IT on Changes in Customer Retention (DOA), as a Function of Integration Costs, with 90% Confidence Intervals
Figure IV.5b. Marginal Effect of Integration on Changes in Customer Retention (DOA), as a Function of Acquirers’ IT, with 90% Confidence Intervals
-20
-10
010
20d(
DO
A)/d
(Acq
IT)
0 .01 .02 .03IntegrCosts
-20
-10
010
20d(
DO
A)/d
(Inte
grC
ost)
0 .005 .01 .015 .02 .025AcqIT
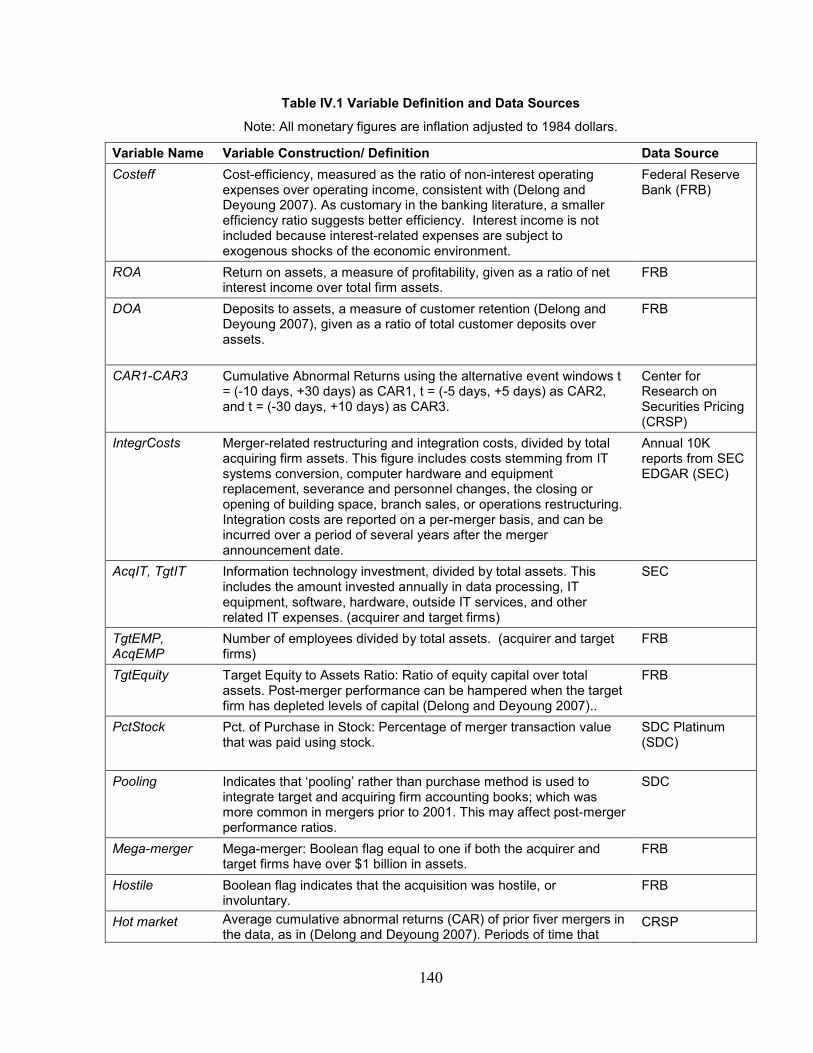
140
Table IV.1 Variable Definition and Data Sources
Note: All monetary figures are inflation adjusted to 1984 dollars.
Variable Name Variable Construction/ Definition Data Source Costeff Cost-efficiency, measured as the ratio of non-interest operating
expenses over operating income, consistent with (Delong and Deyoung 2007). As customary in the banking literature, a smaller efficiency ratio suggests better efficiency. Interest income is not included because interest-related expenses are subject to exogenous shocks of the economic environment.
Federal Reserve Bank (FRB)
ROA Return on assets, a measure of profitability, given as a ratio of net interest income over total firm assets.
FRB
DOA Deposits to assets, a measure of customer retention (Delong and Deyoung 2007), given as a ratio of total customer deposits over assets.
FRB
CAR1-CAR3 Cumulative Abnormal Returns using the alternative event windows t = (-10 days, +30 days) as CAR1, t = (-5 days, +5 days) as CAR2, and t = (-30 days, +10 days) as CAR3.
Center for Research on Securities Pricing (CRSP)
IntegrCosts Merger-related restructuring and integration costs, divided by total acquiring firm assets. This figure includes costs stemming from IT systems conversion, computer hardware and equipment replacement, severance and personnel changes, the closing or opening of building space, branch sales, or operations restructuring. Integration costs are reported on a per-merger basis, and can be incurred over a period of several years after the merger announcement date.
Annual 10K reports from SEC EDGAR (SEC)
AcqIT, TgtIT Information technology investment, divided by total assets. This includes the amount invested annually in data processing, IT equipment, software, hardware, outside IT services, and other related IT expenses. (acquirer and target firms)
SEC
TgtEMP, AcqEMP
Number of employees divided by total assets. (acquirer and target firms)
FRB
TgtEquity Target Equity to Assets Ratio: Ratio of equity capital over total assets. Post-merger performance can be hampered when the target firm has depleted levels of capital (Delong and Deyoung 2007)..
FRB
PctStock Pct. of Purchase in Stock: Percentage of merger transaction value that was paid using stock.
SDC Platinum (SDC)
Pooling Indicates that ‘pooling’ rather than purchase method is used to integrate target and acquiring firm accounting books; which was more common in mergers prior to 2001. This may affect post-merger performance ratios.
SDC
Mega-merger Mega-merger: Boolean flag equal to one if both the acquirer and target firms have over $1 billion in assets.
FRB
Hostile Boolean flag indicates that the acquisition was hostile, or involuntary.
FRB
Hot market Average cumulative abnormal returns (CAR) of prior fiver mergers in the data, as in (Delong and Deyoung 2007). Periods of time that
CRSP
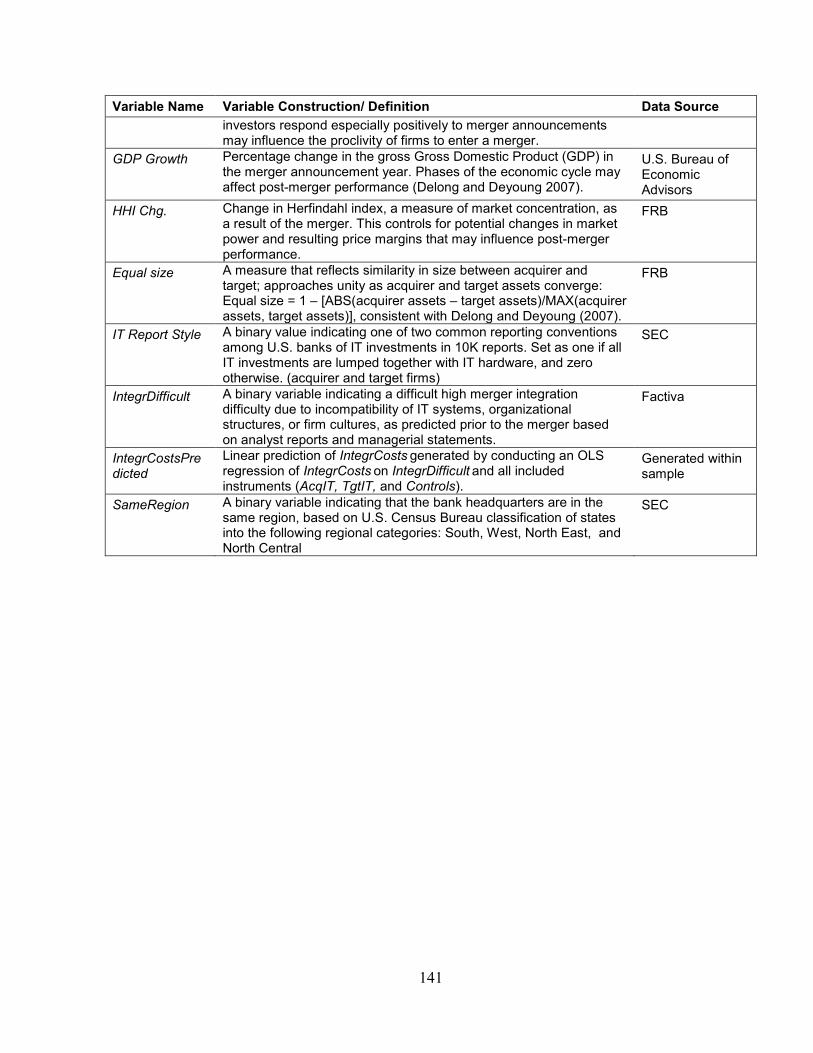
141
Variable Name Variable Construction/ Definition Data Source investors respond especially positively to merger announcements may influence the proclivity of firms to enter a merger.
GDP Growth Percentage change in the gross Gross Domestic Product (GDP) in the merger announcement year. Phases of the economic cycle may affect post-merger performance (Delong and Deyoung 2007).
U.S. Bureau of Economic Advisors
HHI Chg. Change in Herfindahl index, a measure of market concentration, as a result of the merger. This controls for potential changes in market power and resulting price margins that may influence post-merger performance.
FRB
Equal size A measure that reflects similarity in size between acquirer and target; approaches unity as acquirer and target assets converge: Equal size = 1 – [ABS(acquirer assets – target assets)/MAX(acquirer assets, target assets)], consistent with Delong and Deyoung (2007).
FRB
IT Report Style A binary value indicating one of two common reporting conventions among U.S. banks of IT investments in 10K reports. Set as one if all IT investments are lumped together with IT hardware, and zero otherwise. (acquirer and target firms)
SEC
IntegrDifficult A binary variable indicating a difficult high merger integration difficulty due to incompatibility of IT systems, organizational structures, or firm cultures, as predicted prior to the merger based on analyst reports and managerial statements.
Factiva
IntegrCostsPredicted
Linear prediction of IntegrCosts generated by conducting an OLS regression of IntegrCosts on IntegrDifficult and all included instruments (AcqIT, TgtIT, and Controls).
Generated within sample
SameRegion A binary variable indicating that the bank headquarters are in the same region, based on U.S. Census Bureau classification of states into the following regional categories: South, West, North East, and North Central
SEC
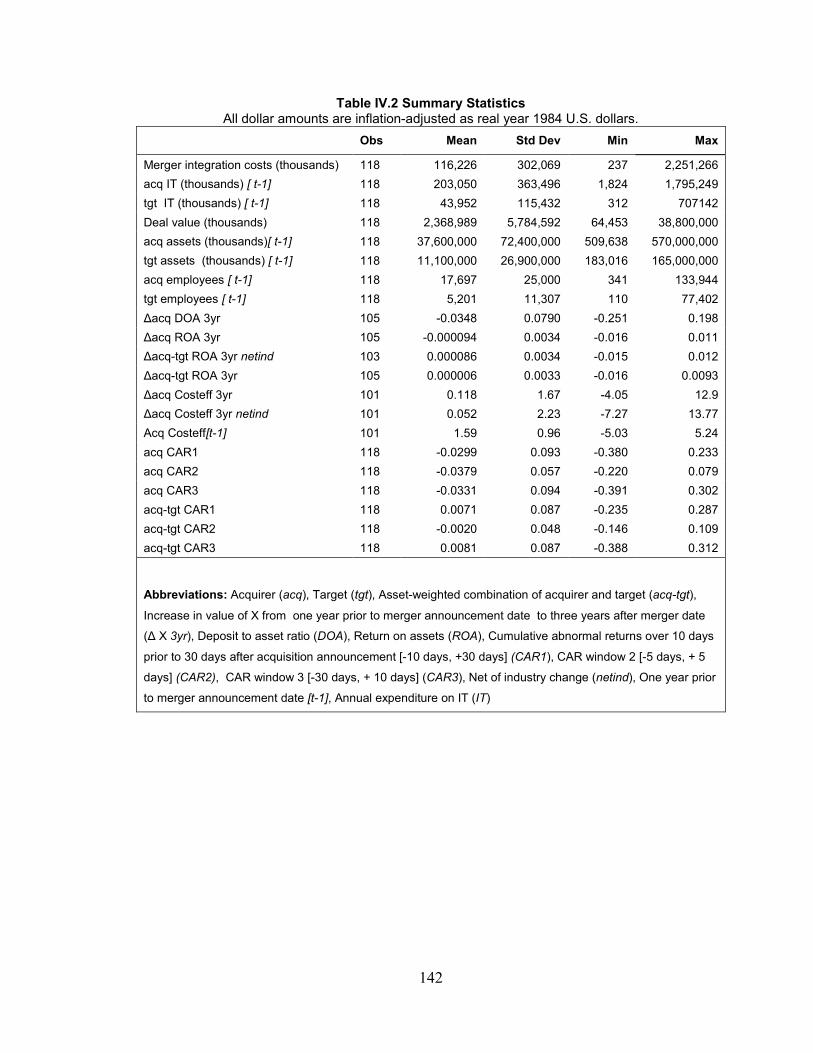
142
Table IV.2 Summary Statistics All dollar amounts are inflation-adjusted as real year 1984 U.S. dollars.
Obs Mean Std Dev Min Max
Merger integration costs (thousands) 118 116,226 302,069 237 2,251,266 acq IT (thousands) [ t-1] 118 203,050 363,496 1,824 1,795,249 tgt IT (thousands) [ t-1] 118 43,952 115,432 312 707142 Deal value (thousands) 118 2,368,989 5,784,592 64,453 38,800,000 acq assets (thousands)[ t-1] 118 37,600,000 72,400,000 509,638 570,000,000 tgt assets (thousands) [ t-1] 118 11,100,000 26,900,000 183,016 165,000,000 acq employees [ t-1] 118 17,697 25,000 341 133,944 tgt employees [ t-1] 118 5,201 11,307 110 77,402 Δacq DOA 3yr 105 -0.0348 0.0790 -0.251 0.198 Δacq ROA 3yr 105 -0.000094 0.0034 -0.016 0.011 Δacq-tgt ROA 3yr netind 103 0.000086 0.0034 -0.015 0.012 Δacq-tgt ROA 3yr 105 0.000006 0.0033 -0.016 0.0093 Δacq Costeff 3yr 101 0.118 1.67 -4.05 12.9 Δacq Costeff 3yr netind 101 0.052 2.23 -7.27 13.77 Acq Costeff[t-1] 101 1.59 0.96 -5.03 5.24 acq CAR1 118 -0.0299 0.093 -0.380 0.233 acq CAR2 118 -0.0379 0.057 -0.220 0.079 acq CAR3 118 -0.0331 0.094 -0.391 0.302 acq-tgt CAR1 118 0.0071 0.087 -0.235 0.287 acq-tgt CAR2 118 -0.0020 0.048 -0.146 0.109 acq-tgt CAR3 118 0.0081 0.087 -0.388 0.312
Abbreviations: Acquirer (acq), Target (tgt), Asset-weighted combination of acquirer and target (acq-tgt),
Increase in value of X from one year prior to merger announcement date to three years after merger date
(Δ X 3yr), Deposit to asset ratio (DOA), Return on assets (ROA), Cumulative abnormal returns over 10 days
prior to 30 days after acquisition announcement [-10 days, +30 days] (CAR1), CAR window 2 [-5 days, + 5
days] (CAR2), CAR window 3 [-30 days, + 10 days] (CAR3), Net of industry change (netind), One year prior
to merger announcement date [t-1], Annual expenditure on IT (IT)
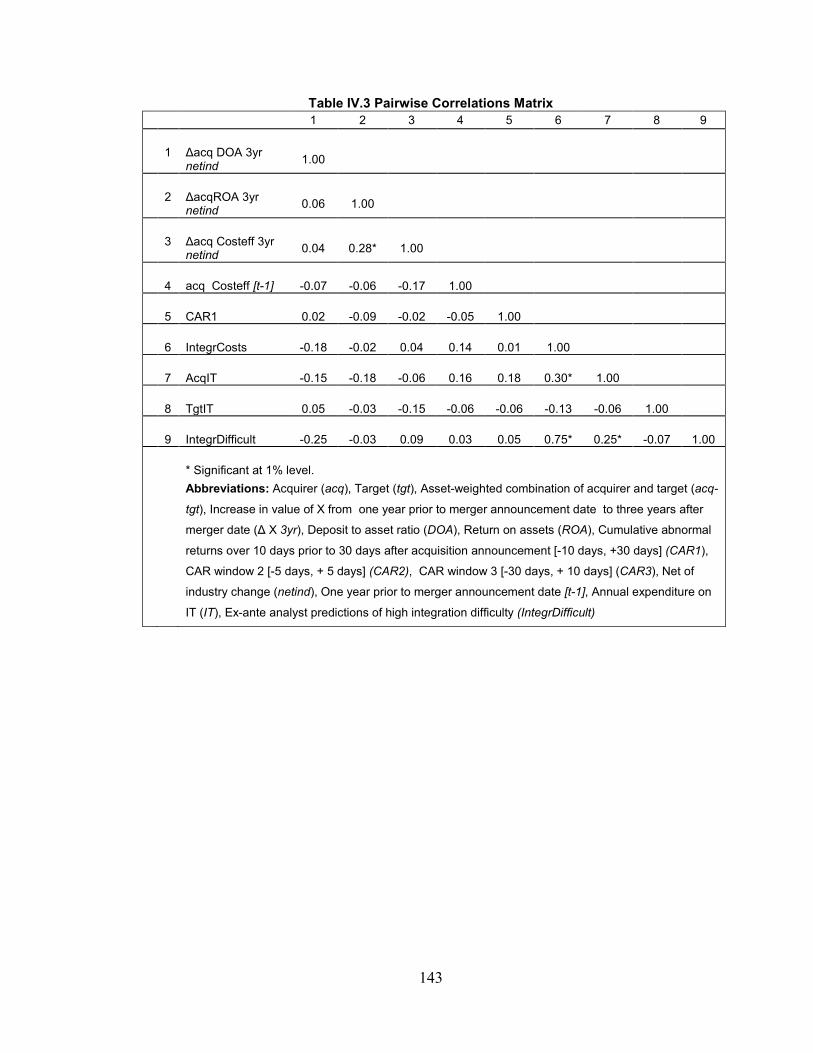
143
Table IV.3 Pairwise Correlations Matrix 1 2 3 4 5 6 7 8 9
1 Δacq DOA 3yr netind 1.00
2 ΔacqROA 3yr netind 0.06 1.00
3 Δacq Costeff 3yr netind 0.04 0.28* 1.00
4 acq Costeff [t-1] -0.07 -0.06 -0.17 1.00
5 CAR1 0.02 -0.09 -0.02 -0.05 1.00
6 IntegrCosts -0.18 -0.02 0.04 0.14 0.01 1.00
7 AcqIT -0.15 -0.18 -0.06 0.16 0.18 0.30* 1.00
8 TgtIT 0.05 -0.03 -0.15 -0.06 -0.06 -0.13 -0.06 1.00
9 IntegrDifficult -0.25 -0.03 0.09 0.03 0.05 0.75* 0.25* -0.07 1.00
* Significant at 1% level. Abbreviations: Acquirer (acq), Target (tgt), Asset-weighted combination of acquirer and target (acq-
tgt), Increase in value of X from one year prior to merger announcement date to three years after
merger date (Δ X 3yr), Deposit to asset ratio (DOA), Return on assets (ROA), Cumulative abnormal
returns over 10 days prior to 30 days after acquisition announcement [-10 days, +30 days] (CAR1),
CAR window 2 [-5 days, + 5 days] (CAR2), CAR window 3 [-30 days, + 10 days] (CAR3), Net of
industry change (netind), One year prior to merger announcement date [t-1], Annual expenditure on
IT (IT), Ex-ante analyst predictions of high integration difficulty (IntegrDifficult)
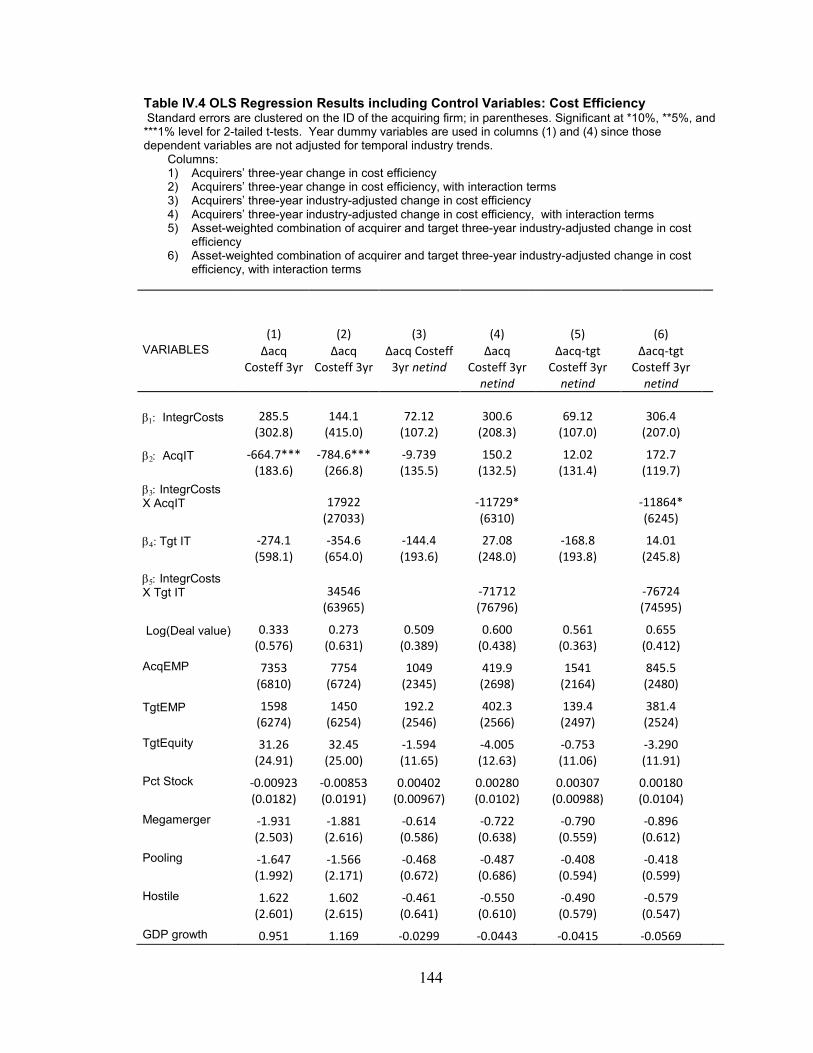
144
Table IV.4 OLS Regression Results including Control Variables: Cost Efficiency Standard errors are clustered on the ID of the acquiring firm; in parentheses. Significant at *10%, **5%, and ***1% level for 2-tailed t-tests. Year dummy variables are used in columns (1) and (4) since those dependent variables are not adjusted for temporal industry trends.
Columns: 1) Acquirers’ three-year change in cost efficiency 2) Acquirers’ three-year change in cost efficiency, with interaction terms 3) Acquirers’ three-year industry-adjusted change in cost efficiency 4) Acquirers’ three-year industry-adjusted change in cost efficiency, with interaction terms 5) Asset-weighted combination of acquirer and target three-year industry-adjusted change in cost
efficiency 6) Asset-weighted combination of acquirer and target three-year industry-adjusted change in cost
efficiency, with interaction terms
(1) (2) (3) (4) (5) (6) VARIABLES Δacq
Costeff 3yr Δacq
Costeff 3yr
Δacq Costeff 3yr netind
Δacq Costeff 3yr
netind
Δacq-tgt Costeff 3yr
netind
Δacq-tgt Costeff 3yr
netind
β1: IntegrCosts 285.5 144.1 72.12 300.6 69.12 306.4 (302.8) (415.0) (107.2) (208.3) (107.0) (207.0)
β2: AcqIT -664.7*** -784.6*** -9.739 150.2 12.02 172.7 (183.6) (266.8) (135.5) (132.5) (131.4) (119.7)
β3: IntegrCosts X AcqIT 17922 -11729* -11864* (27033) (6310) (6245)
β4: Tgt IT -274.1 -354.6 -144.4 27.08 -168.8 14.01 (598.1) (654.0) (193.6) (248.0) (193.8) (245.8)
β5: IntegrCosts X Tgt IT
34546 -71712 -76724
(63965) (76796) (74595)
Log(Deal value) 0.333 0.273 0.509 0.600 0.561 0.655 (0.576) (0.631) (0.389) (0.438) (0.363) (0.412)
AcqEMP 7353 7754 1049 419.9 1541 845.5 (6810) (6724) (2345) (2698) (2164) (2480)
TgtEMP 1598 1450 192.2 402.3 139.4 381.4 (6274) (6254) (2546) (2566) (2497) (2524)
TgtEquity 31.26 32.45 -1.594 -4.005 -0.753 -3.290 (24.91) (25.00) (11.65) (12.63) (11.06) (11.91) Pct Stock -0.00923 -0.00853 0.00402 0.00280 0.00307 0.00180 (0.0182) (0.0191) (0.00967) (0.0102) (0.00988) (0.0104) Megamerger -1.931 -1.881 -0.614 -0.722 -0.790 -0.896 (2.503) (2.616) (0.586) (0.638) (0.559) (0.612) Pooling -1.647 -1.566 -0.468 -0.487 -0.408 -0.418 (1.992) (2.171) (0.672) (0.686) (0.594) (0.599) Hostile 1.622 1.602 -0.461 -0.550 -0.490 -0.579
(2.601) (2.615) (0.641) (0.610) (0.579) (0.547) GDP growth 0.951 1.169 -0.0299 -0.0443 -0.0415 -0.0569
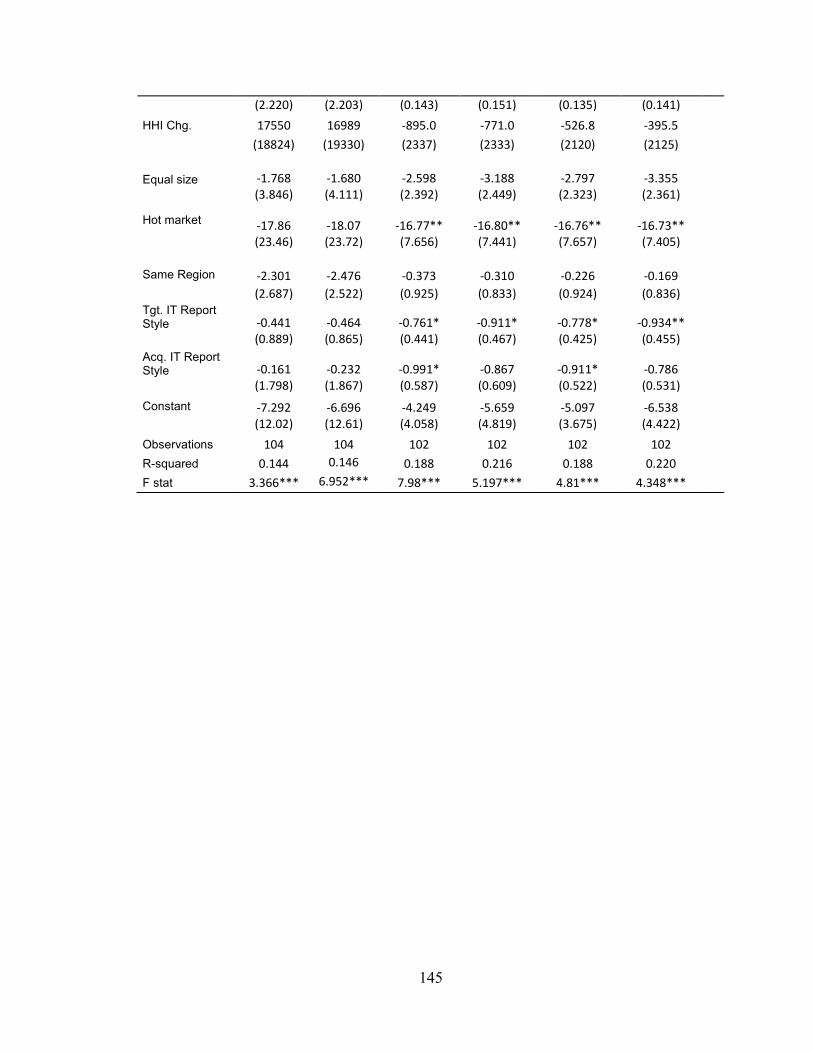
145
(2.220) (2.203) (0.143) (0.151) (0.135) (0.141) HHI Chg. 17550 16989 -895.0 -771.0 -526.8 -395.5 (18824) (19330) (2337) (2333) (2120) (2125)
Equal size -1.768 -1.680 -2.598 -3.188 -2.797 -3.355 (3.846) (4.111) (2.392) (2.449) (2.323) (2.361)
Hot market -17.86 -18.07 -16.77** -16.80** -16.76** -16.73** (23.46) (23.72) (7.656) (7.441) (7.657) (7.405)
Same Region -2.301 -2.476 -0.373 -0.310 -0.226 -0.169 (2.687) (2.522) (0.925) (0.833) (0.924) (0.836) Tgt. IT Report Style -0.441 -0.464 -0.761* -0.911* -0.778* -0.934** (0.889) (0.865) (0.441) (0.467) (0.425) (0.455) Acq. IT Report Style -0.161 -0.232 -0.991* -0.867 -0.911* -0.786 (1.798) (1.867) (0.587) (0.609) (0.522) (0.531) Constant -7.292 -6.696 -4.249 -5.659 -5.097 -6.538 (12.02) (12.61) (4.058) (4.819) (3.675) (4.422) Observations 104 104 102 102 102 102 R-squared 0.144 0.146 0.188 0.216 0.188 0.220 F stat 3.366*** 6.952*** 7.98*** 5.197*** 4.81*** 4.348***
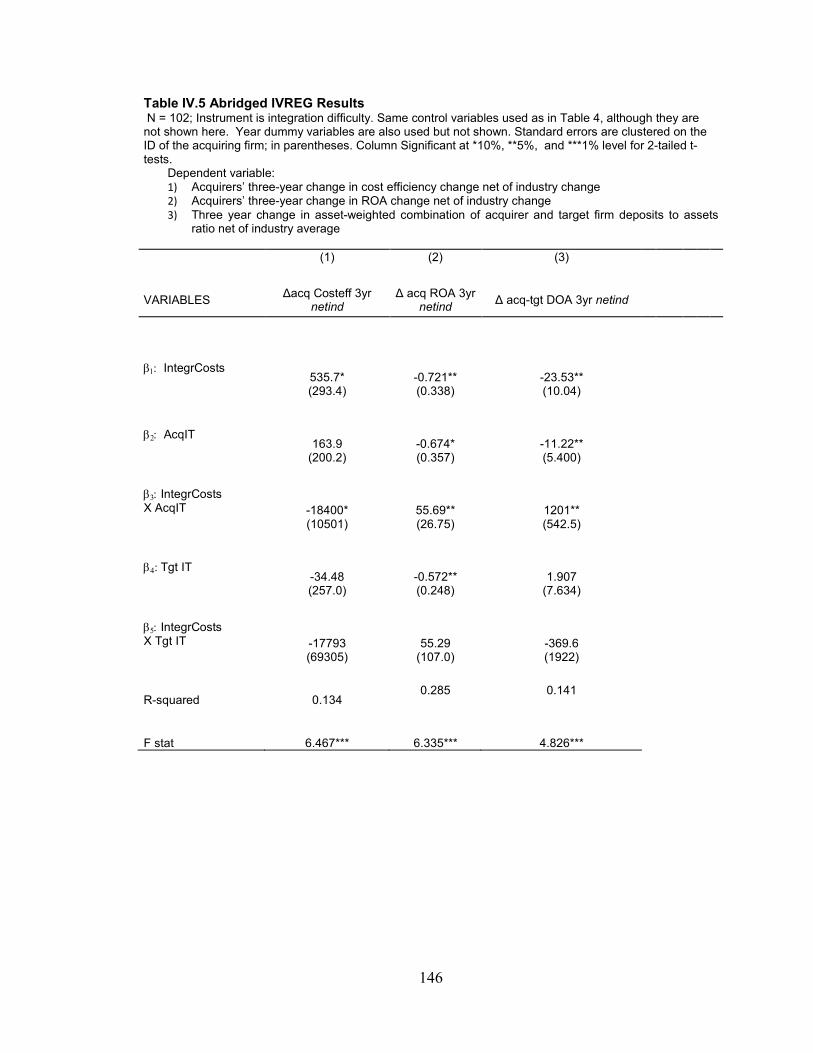
146
Table IV.5 Abridged IVREG Results N = 102; Instrument is integration difficulty. Same control variables used as in Table 4, although they are not shown here. Year dummy variables are also used but not shown. Standard errors are clustered on the ID of the acquiring firm; in parentheses. Column Significant at *10%, **5%, and ***1% level for 2-tailed t-tests.
Dependent variable: 1) Acquirers’ three-year change in cost efficiency change net of industry change 2) Acquirers’ three-year change in ROA change net of industry change 3) Three year change in asset-weighted combination of acquirer and target firm deposits to assets
ratio net of industry average (1) (2) (3)
VARIABLES Δacq Costeff 3yr netind
Δ acq ROA 3yr netind Δ acq-tgt DOA 3yr netind
β1: IntegrCosts 535.7* -0.721** -23.53**
(293.4) (0.338) (10.04)
β2: AcqIT 163.9 -0.674* -11.22**
(200.2) (0.357) (5.400)
β3: IntegrCosts X AcqIT -18400* 55.69** 1201**
(10501) (26.75) (542.5)
β4: Tgt IT -34.48 -0.572** 1.907
(257.0) (0.248) (7.634)
β5: IntegrCosts X Tgt IT -17793 55.29 -369.6
(69305) (107.0) (1922)
R-squared 0.134 0.285 0.141
F stat 6.467*** 6.335*** 4.826***
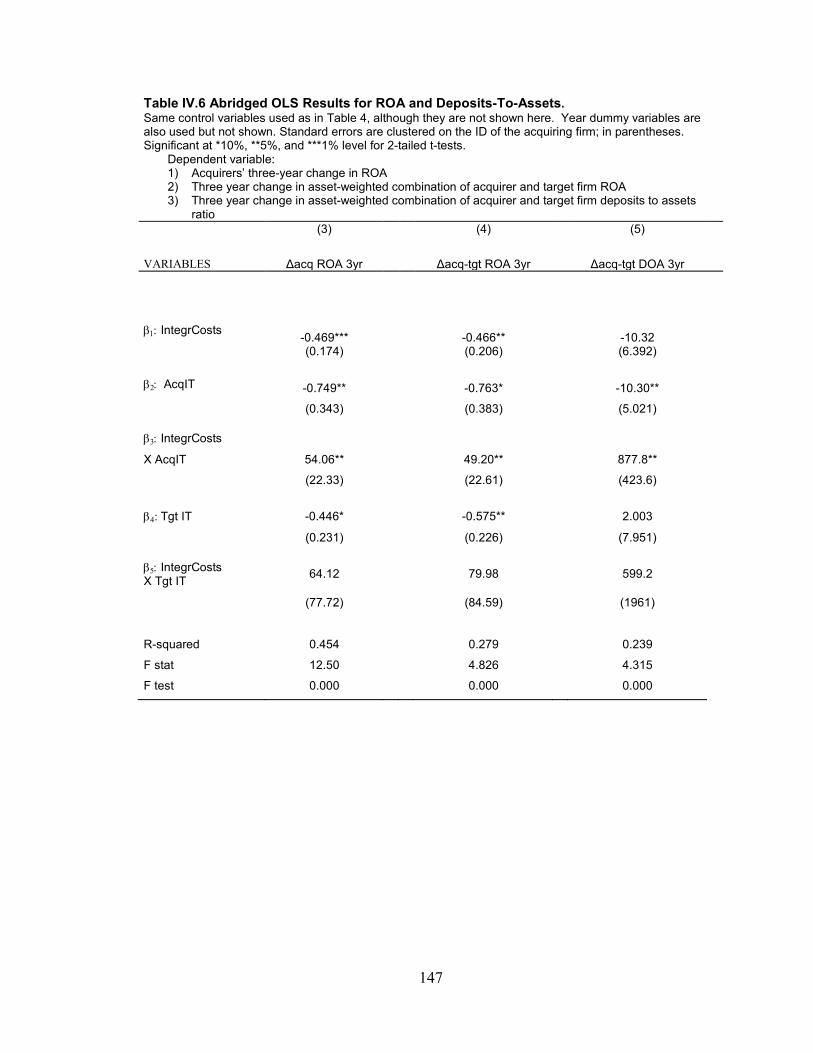
147
Table IV.6 Abridged OLS Results for ROA and Deposits-To-Assets. Same control variables used as in Table 4, although they are not shown here. Year dummy variables are also used but not shown. Standard errors are clustered on the ID of the acquiring firm; in parentheses. Significant at *10%, **5%, and ***1% level for 2-tailed t-tests.
Dependent variable: 1) Acquirers’ three-year change in ROA 2) Three year change in asset-weighted combination of acquirer and target firm ROA 3) Three year change in asset-weighted combination of acquirer and target firm deposits to assets
ratio (3) (4) (5)
VARIABLES Δacq ROA 3yr Δacq-tgt ROA 3yr Δacq-tgt DOA 3yr
β1: IntegrCosts -0.469*** -0.466** -10.32
(0.174) (0.206) (6.392)
β2: AcqIT -0.749** -0.763* -10.30**
(0.343) (0.383) (5.021)
β3: IntegrCosts
X AcqIT 54.06** 49.20** 877.8**
(22.33) (22.61) (423.6)
β4: Tgt IT -0.446* -0.575** 2.003
(0.231) (0.226) (7.951)
β5: IntegrCosts X Tgt IT 64.12 79.98 599.2
(77.72) (84.59) (1961)
R-squared 0.454 0.279 0.239
F stat 12.50 4.826 4.315
F test 0.000 0.000 0.000
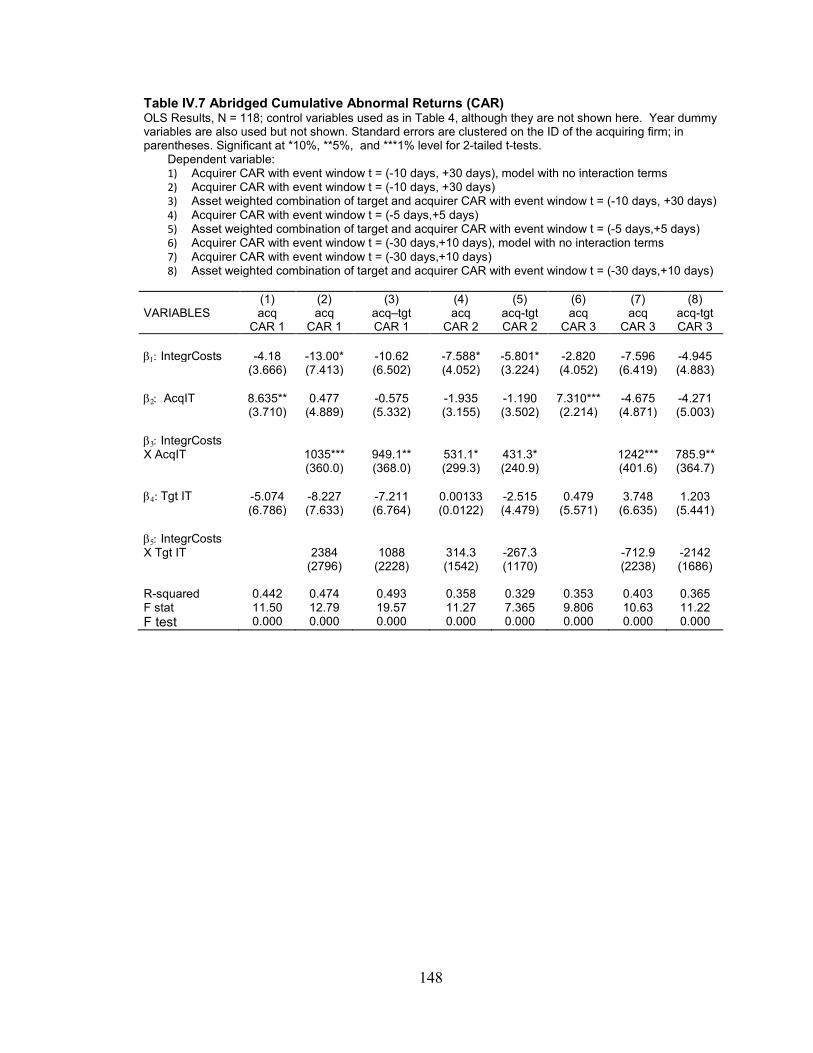
148
Table IV.7 Abridged Cumulative Abnormal Returns (CAR) OLS Results, N = 118; control variables used as in Table 4, although they are not shown here. Year dummy variables are also used but not shown. Standard errors are clustered on the ID of the acquiring firm; in parentheses. Significant at *10%, **5%, and ***1% level for 2-tailed t-tests.
Dependent variable: 1) Acquirer CAR with event window t = (-10 days, +30 days), model with no interaction terms 2) Acquirer CAR with event window t = (-10 days, +30 days) 3) Asset weighted combination of target and acquirer CAR with event window t = (-10 days, +30 days) 4) Acquirer CAR with event window t = (-5 days,+5 days) 5) Asset weighted combination of target and acquirer CAR with event window t = (-5 days,+5 days) 6) Acquirer CAR with event window t = (-30 days,+10 days), model with no interaction terms 7) Acquirer CAR with event window t = (-30 days,+10 days) 8) Asset weighted combination of target and acquirer CAR with event window t = (-30 days,+10 days)
(1) (2) (3) (4) (5) (6) (7) (8) VARIABLES acq
CAR 1 acq
CAR 1 acq–tgt CAR 1
acq CAR 2
acq-tgt CAR 2
acq CAR 3
acq CAR 3
acq-tgt CAR 3
β1: IntegrCosts -4.18 -13.00* -10.62 -7.588* -5.801* -2.820 -7.596 -4.945 (3.666) (7.413) (6.502) (4.052) (3.224) (4.052) (6.419) (4.883) β2: AcqIT 8.635** 0.477 -0.575 -1.935 -1.190 7.310*** -4.675 -4.271 (3.710) (4.889) (5.332) (3.155) (3.502) (2.214) (4.871) (5.003) β3: IntegrCosts X AcqIT 1035*** 949.1** 531.1* 431.3* 1242*** 785.9** (360.0) (368.0) (299.3) (240.9) (401.6) (364.7) β4: Tgt IT -5.074 -8.227 -7.211 0.00133 -2.515 0.479 3.748 1.203 (6.786) (7.633) (6.764) (0.0122) (4.479) (5.571) (6.635) (5.441) β5: IntegrCosts X Tgt IT 2384 1088 314.3 -267.3 -712.9 -2142 (2796) (2228) (1542) (1170) (2238) (1686) R-squared 0.442 0.474 0.493 0.358 0.329 0.353 0.403 0.365 F stat 11.50 12.79 19.57 11.27 7.365 9.806 10.63 11.22 F test 0.000 0.000 0.000 0.000 0.000 0.000 0.000 0.000
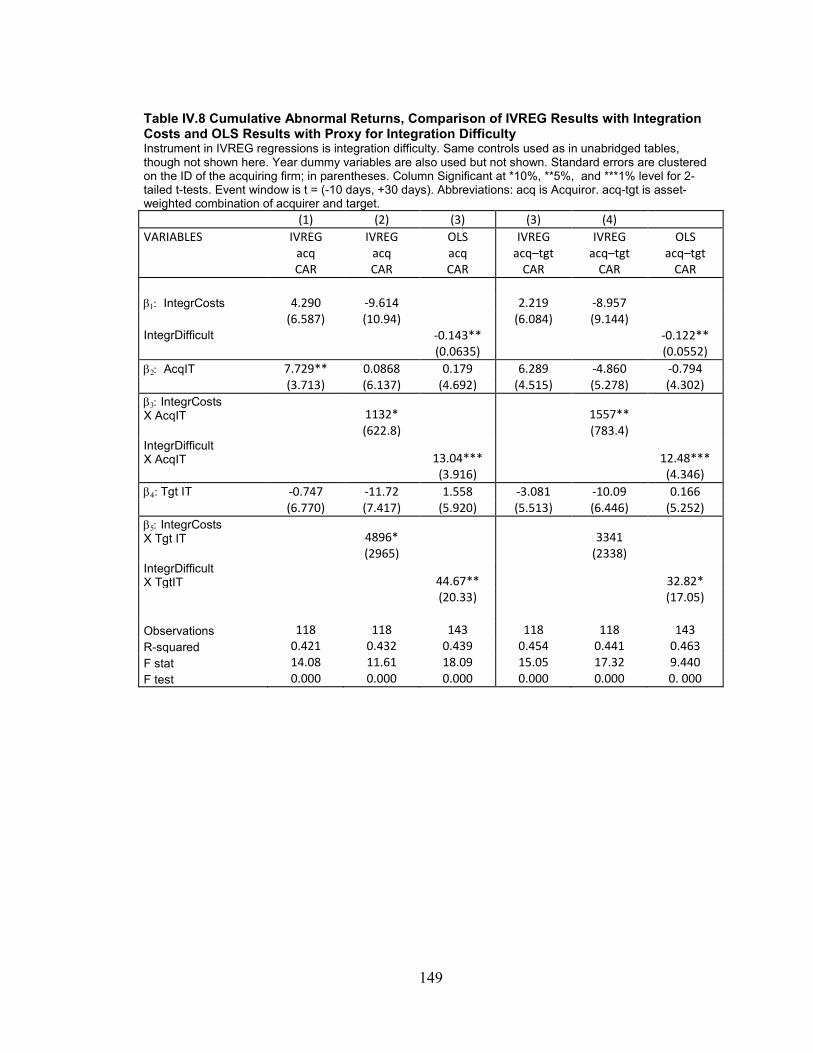
149
Table IV.8 Cumulative Abnormal Returns, Comparison of IVREG Results with Integration Costs and OLS Results with Proxy for Integration Difficulty Instrument in IVREG regressions is integration difficulty. Same controls used as in unabridged tables, though not shown here. Year dummy variables are also used but not shown. Standard errors are clustered on the ID of the acquiring firm; in parentheses. Column Significant at *10%, **5%, and ***1% level for 2-tailed t-tests. Event window is t = (-10 days, +30 days). Abbreviations: acq is Acquiror. acq-tgt is asset-weighted combination of acquirer and target. (1) (2) (3) (3) (4) VARIABLES IVREG
acq CAR
IVREG acq CAR
OLS acq CAR
IVREG acq–tgt
CAR
IVREG acq–tgt
CAR
OLS acq–tgt
CAR β1: IntegrCosts 4.290 -9.614 2.219 -8.957 (6.587) (10.94) (6.084) (9.144) IntegrDifficult -0.143** -0.122** (0.0635) (0.0552) β2: AcqIT 7.729** 0.0868 0.179 6.289 -4.860 -0.794 (3.713) (6.137) (4.692) (4.515) (5.278) (4.302) β3: IntegrCosts X AcqIT 1132*
1557**
(622.8) (783.4) IntegrDifficult X AcqIT 13.04*** 12.48*** (3.916) (4.346) β4: Tgt IT -0.747 -11.72 1.558 -3.081 -10.09 0.166 (6.770) (7.417) (5.920) (5.513) (6.446) (5.252) β5: IntegrCosts X Tgt IT 4896*
3341
(2965) (2338) IntegrDifficult X TgtIT
44.67** 32.82*
(20.33) (17.05) Observations 118 118 143 118 118 143 R-squared 0.421 0.432 0.439 0.454 0.441 0.463 F stat 14.08 11.61 18.09 15.05 17.32 9.440 F test 0.000 0.000 0.000 0.000 0.000 0. 000
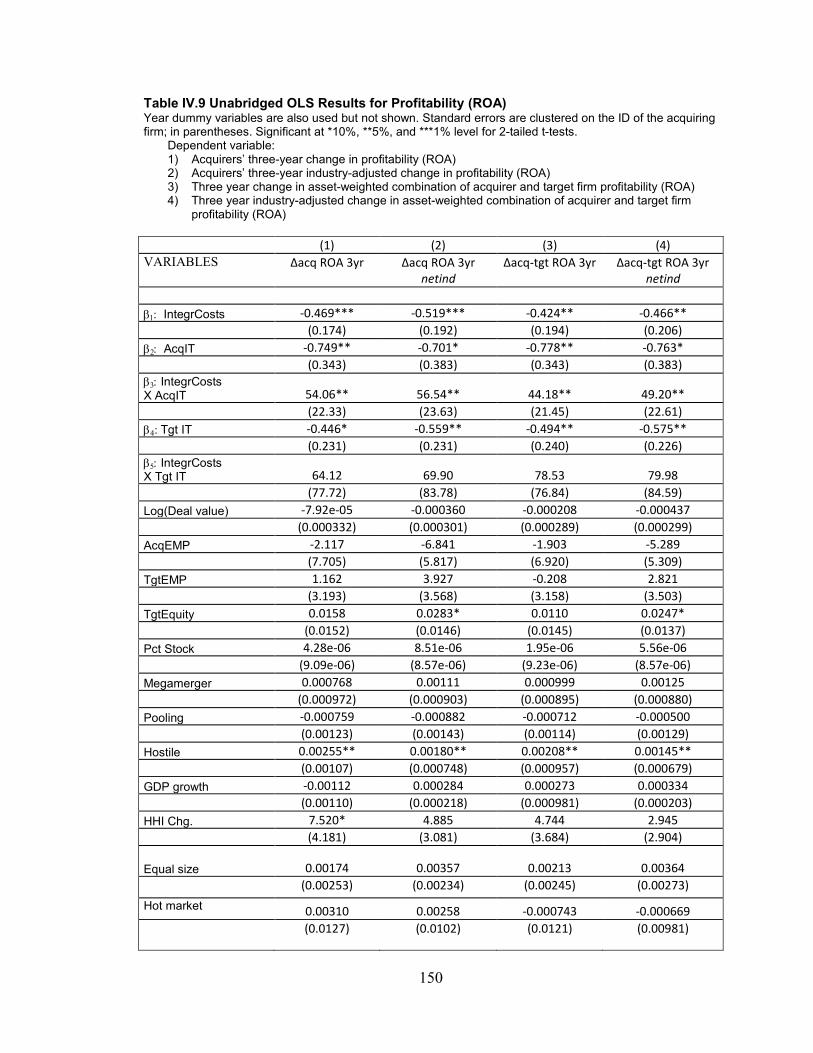
150
Table IV.9 Unabridged OLS Results for Profitability (ROA) Year dummy variables are also used but not shown. Standard errors are clustered on the ID of the acquiring firm; in parentheses. Significant at *10%, **5%, and ***1% level for 2-tailed t-tests.
Dependent variable: 1) Acquirers’ three-year change in profitability (ROA) 2) Acquirers’ three-year industry-adjusted change in profitability (ROA) 3) Three year change in asset-weighted combination of acquirer and target firm profitability (ROA) 4) Three year industry-adjusted change in asset-weighted combination of acquirer and target firm
profitability (ROA) (1) (2) (3) (4) VARIABLES Δacq ROA 3yr Δacq ROA 3yr
netind Δacq-tgt ROA 3yr
Δacq-tgt ROA 3yr
netind β1: IntegrCosts -0.469*** -0.519*** -0.424** -0.466** (0.174) (0.192) (0.194) (0.206) β2: AcqIT -0.749** -0.701* -0.778** -0.763* (0.343) (0.383) (0.343) (0.383) β3: IntegrCosts X AcqIT 54.06** 56.54** 44.18** 49.20** (22.33) (23.63) (21.45) (22.61) β4: Tgt IT -0.446* -0.559** -0.494** -0.575** (0.231) (0.231) (0.240) (0.226) β5: IntegrCosts X Tgt IT 64.12 69.90 78.53 79.98 (77.72) (83.78) (76.84) (84.59) Log(Deal value) -7.92e-05 -0.000360 -0.000208 -0.000437 (0.000332) (0.000301) (0.000289) (0.000299) AcqEMP -2.117 -6.841 -1.903 -5.289 (7.705) (5.817) (6.920) (5.309) TgtEMP 1.162 3.927 -0.208 2.821 (3.193) (3.568) (3.158) (3.503) TgtEquity 0.0158 0.0283* 0.0110 0.0247* (0.0152) (0.0146) (0.0145) (0.0137) Pct Stock 4.28e-06 8.51e-06 1.95e-06 5.56e-06 (9.09e-06) (8.57e-06) (9.23e-06) (8.57e-06) Megamerger 0.000768 0.00111 0.000999 0.00125 (0.000972) (0.000903) (0.000895) (0.000880) Pooling -0.000759 -0.000882 -0.000712 -0.000500 (0.00123) (0.00143) (0.00114) (0.00129) Hostile 0.00255** 0.00180** 0.00208** 0.00145** (0.00107) (0.000748) (0.000957) (0.000679) GDP growth -0.00112 0.000284 0.000273 0.000334 (0.00110) (0.000218) (0.000981) (0.000203) HHI Chg. 7.520* 4.885 4.744 2.945 (4.181) (3.081) (3.684) (2.904)
Equal size 0.00174 0.00357 0.00213 0.00364 (0.00253) (0.00234) (0.00245) (0.00273)
Hot market 0.00310 0.00258 -0.000743 -0.000669 (0.0127) (0.0102) (0.0121) (0.00981)
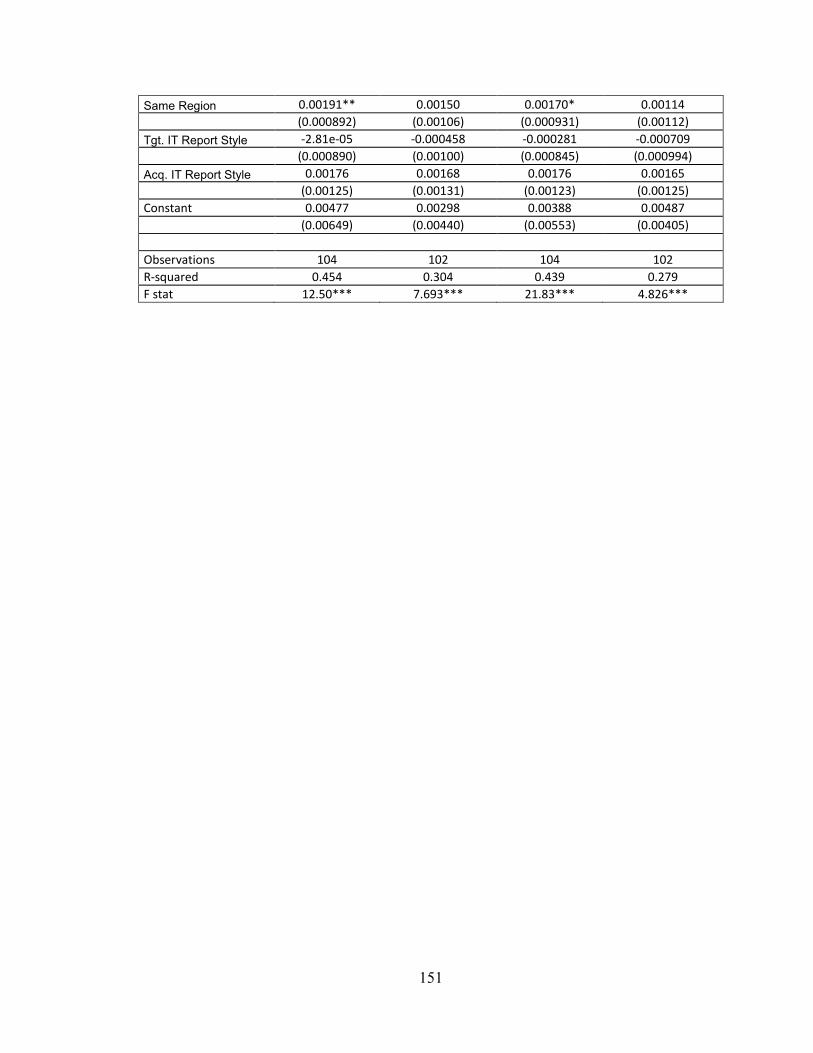
151
Same Region 0.00191** 0.00150 0.00170* 0.00114 (0.000892) (0.00106) (0.000931) (0.00112) Tgt. IT Report Style -2.81e-05 -0.000458 -0.000281 -0.000709 (0.000890) (0.00100) (0.000845) (0.000994) Acq. IT Report Style 0.00176 0.00168 0.00176 0.00165 (0.00125) (0.00131) (0.00123) (0.00125) Constant 0.00477 0.00298 0.00388 0.00487 (0.00649) (0.00440) (0.00553) (0.00405) Observations 104 102 104 102 R-squared 0.454 0.304 0.439 0.279 F stat 12.50*** 7.693*** 21.83*** 4.826***
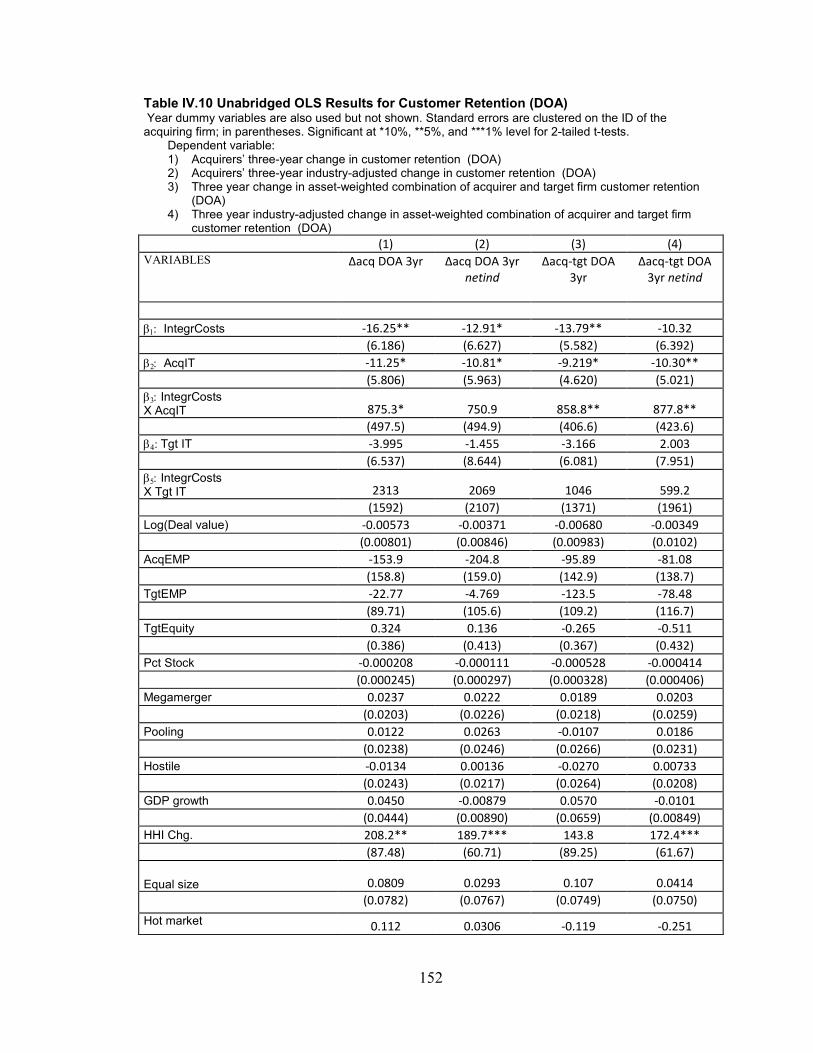
152
Table IV.10 Unabridged OLS Results for Customer Retention (DOA) Year dummy variables are also used but not shown. Standard errors are clustered on the ID of the acquiring firm; in parentheses. Significant at *10%, **5%, and ***1% level for 2-tailed t-tests.
Dependent variable: 1) Acquirers’ three-year change in customer retention (DOA) 2) Acquirers’ three-year industry-adjusted change in customer retention (DOA) 3) Three year change in asset-weighted combination of acquirer and target firm customer retention
(DOA) 4) Three year industry-adjusted change in asset-weighted combination of acquirer and target firm
customer retention (DOA) (1) (2) (3) (4) VARIABLES Δacq DOA 3yr Δacq DOA 3yr
netind Δacq-tgt DOA
3yr
Δacq-tgt DOA 3yr netind
β1: IntegrCosts -16.25** -12.91* -13.79** -10.32 (6.186) (6.627) (5.582) (6.392) β2: AcqIT -11.25* -10.81* -9.219* -10.30** (5.806) (5.963) (4.620) (5.021) β3: IntegrCosts X AcqIT 875.3* 750.9 858.8** 877.8** (497.5) (494.9) (406.6) (423.6) β4: Tgt IT -3.995 -1.455 -3.166 2.003 (6.537) (8.644) (6.081) (7.951) β5: IntegrCosts X Tgt IT 2313 2069 1046 599.2 (1592) (2107) (1371) (1961) Log(Deal value) -0.00573 -0.00371 -0.00680 -0.00349 (0.00801) (0.00846) (0.00983) (0.0102) AcqEMP -153.9 -204.8 -95.89 -81.08 (158.8) (159.0) (142.9) (138.7) TgtEMP -22.77 -4.769 -123.5 -78.48 (89.71) (105.6) (109.2) (116.7) TgtEquity 0.324 0.136 -0.265 -0.511 (0.386) (0.413) (0.367) (0.432) Pct Stock -0.000208 -0.000111 -0.000528 -0.000414 (0.000245) (0.000297) (0.000328) (0.000406) Megamerger 0.0237 0.0222 0.0189 0.0203 (0.0203) (0.0226) (0.0218) (0.0259) Pooling 0.0122 0.0263 -0.0107 0.0186 (0.0238) (0.0246) (0.0266) (0.0231) Hostile -0.0134 0.00136 -0.0270 0.00733 (0.0243) (0.0217) (0.0264) (0.0208) GDP growth 0.0450 -0.00879 0.0570 -0.0101 (0.0444) (0.00890) (0.0659) (0.00849) HHI Chg. 208.2** 189.7*** 143.8 172.4*** (87.48) (60.71) (89.25) (61.67)
Equal size 0.0809 0.0293 0.107 0.0414 (0.0782) (0.0767) (0.0749) (0.0750)
Hot market 0.112 0.0306 -0.119 -0.251
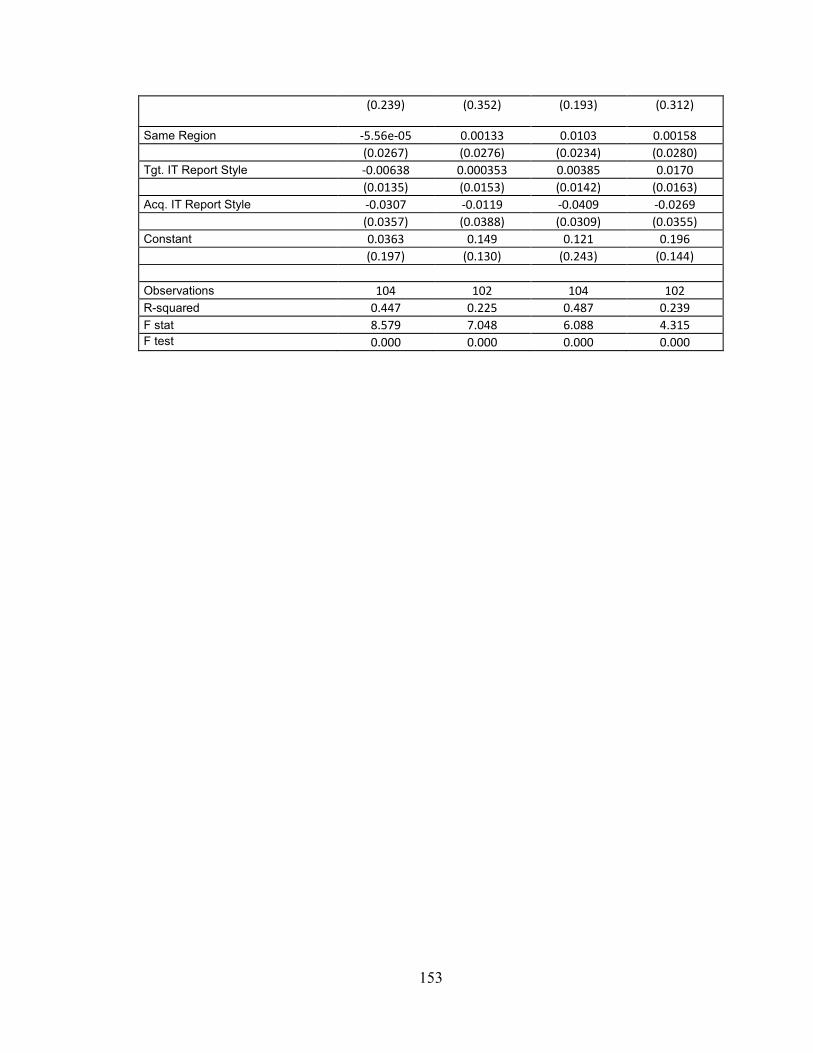
153
(0.239) (0.352) (0.193) (0.312)
Same Region -5.56e-05 0.00133 0.0103 0.00158 (0.0267) (0.0276) (0.0234) (0.0280) Tgt. IT Report Style -0.00638 0.000353 0.00385 0.0170 (0.0135) (0.0153) (0.0142) (0.0163) Acq. IT Report Style -0.0307 -0.0119 -0.0409 -0.0269 (0.0357) (0.0388) (0.0309) (0.0355) Constant 0.0363 0.149 0.121 0.196 (0.197) (0.130) (0.243) (0.144) Observations 104 102 104 102 R-squared 0.447 0.225 0.487 0.239 F stat 8.579 7.048 6.088 4.315 F test 0.000 0.000 0.000 0.000
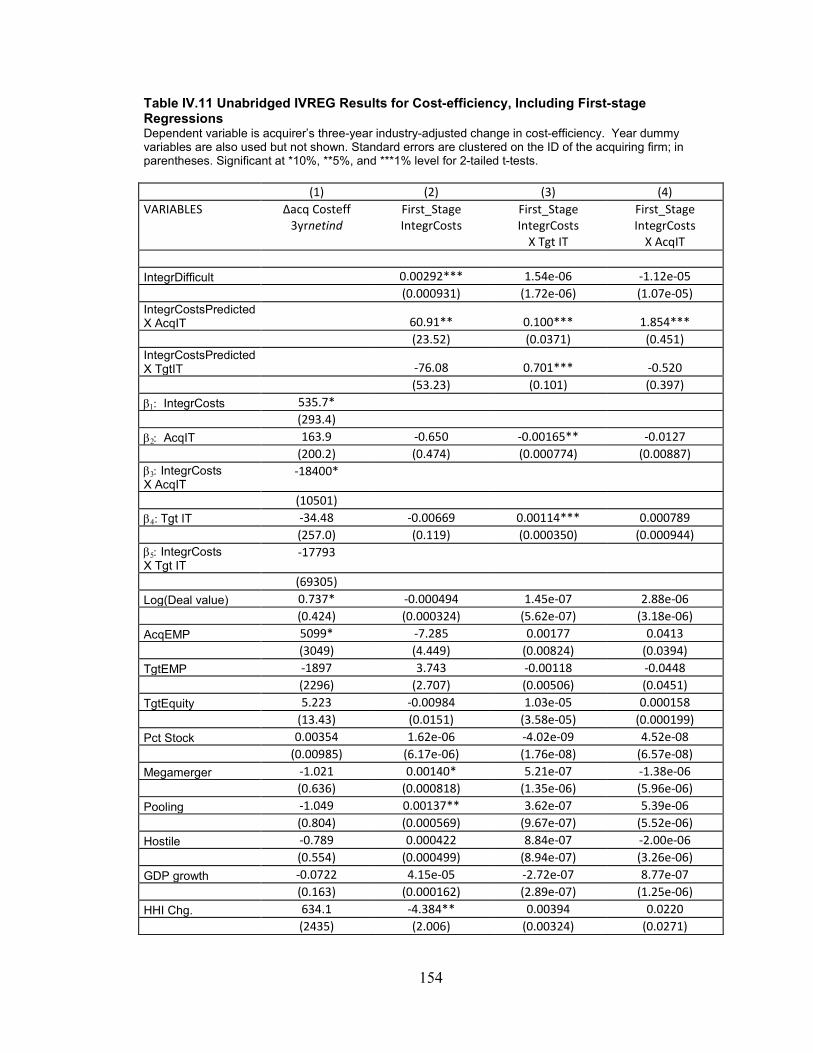
154
Table IV.11 Unabridged IVREG Results for Cost-efficiency, Including First-stage Regressions Dependent variable is acquirer’s three-year industry-adjusted change in cost-efficiency. Year dummy variables are also used but not shown. Standard errors are clustered on the ID of the acquiring firm; in parentheses. Significant at *10%, **5%, and ***1% level for 2-tailed t-tests. (1) (2) (3) (4) VARIABLES Δacq Costeff
3yrnetind First_Stage IntegrCosts
First_Stage IntegrCosts
X Tgt IT
First_Stage IntegrCosts
X AcqIT IntegrDifficult 0.00292*** 1.54e-06 -1.12e-05 (0.000931) (1.72e-06) (1.07e-05) IntegrCostsPredicted X AcqIT
60.91** 0.100*** 1.854***
(23.52) (0.0371) (0.451) IntegrCostsPredicted X TgtIT
-76.08 0.701*** -0.520
(53.23) (0.101) (0.397) β1: IntegrCosts 535.7* (293.4) β2: AcqIT 163.9 -0.650 -0.00165** -0.0127 (200.2) (0.474) (0.000774) (0.00887) β3: IntegrCosts X AcqIT
-18400*
(10501) β4: Tgt IT -34.48 -0.00669 0.00114*** 0.000789 (257.0) (0.119) (0.000350) (0.000944) β5: IntegrCosts X Tgt IT
-17793
(69305) Log(Deal value) 0.737* -0.000494 1.45e-07 2.88e-06 (0.424) (0.000324) (5.62e-07) (3.18e-06) AcqEMP 5099* -7.285 0.00177 0.0413 (3049) (4.449) (0.00824) (0.0394) TgtEMP -1897 3.743 -0.00118 -0.0448 (2296) (2.707) (0.00506) (0.0451) TgtEquity 5.223 -0.00984 1.03e-05 0.000158 (13.43) (0.0151) (3.58e-05) (0.000199) Pct Stock 0.00354 1.62e-06 -4.02e-09 4.52e-08 (0.00985) (6.17e-06) (1.76e-08) (6.57e-08) Megamerger -1.021 0.00140* 5.21e-07 -1.38e-06 (0.636) (0.000818) (1.35e-06) (5.96e-06) Pooling -1.049 0.00137** 3.62e-07 5.39e-06 (0.804) (0.000569) (9.67e-07) (5.52e-06) Hostile -0.789 0.000422 8.84e-07 -2.00e-06 (0.554) (0.000499) (8.94e-07) (3.26e-06) GDP growth -0.0722 4.15e-05 -2.72e-07 8.77e-07 (0.163) (0.000162) (2.89e-07) (1.25e-06) HHI Chg. 634.1 -4.384** 0.00394 0.0220 (2435) (2.006) (0.00324) (0.0271)
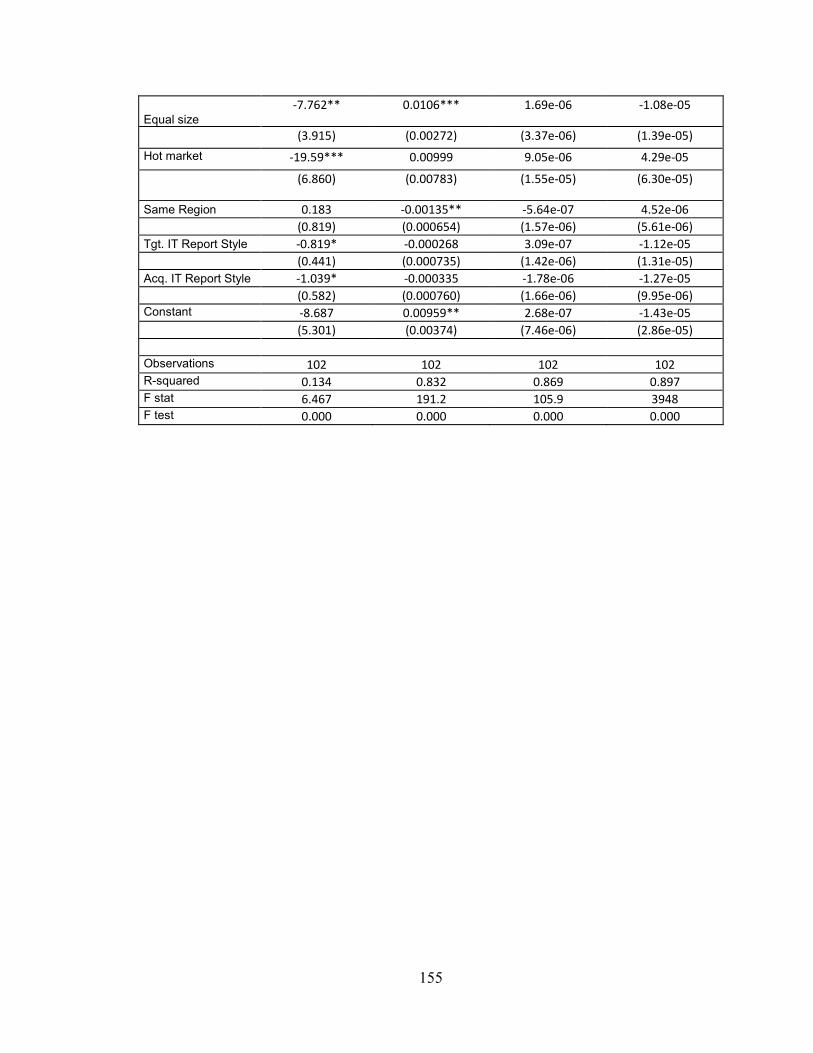
155
Equal size -7.762** 0.0106*** 1.69e-06 -1.08e-05
(3.915) (0.00272) (3.37e-06) (1.39e-05)
Hot market -19.59*** 0.00999 9.05e-06 4.29e-05
(6.860) (0.00783) (1.55e-05) (6.30e-05)
Same Region 0.183 -0.00135** -5.64e-07 4.52e-06 (0.819) (0.000654) (1.57e-06) (5.61e-06) Tgt. IT Report Style -0.819* -0.000268 3.09e-07 -1.12e-05 (0.441) (0.000735) (1.42e-06) (1.31e-05) Acq. IT Report Style -1.039* -0.000335 -1.78e-06 -1.27e-05 (0.582) (0.000760) (1.66e-06) (9.95e-06) Constant -8.687 0.00959** 2.68e-07 -1.43e-05 (5.301) (0.00374) (7.46e-06) (2.86e-05) Observations 102 102 102 102 R-squared 0.134 0.832 0.869 0.897 F stat 6.467 191.2 105.9 3948 F test 0.000 0.000 0.000 0.000
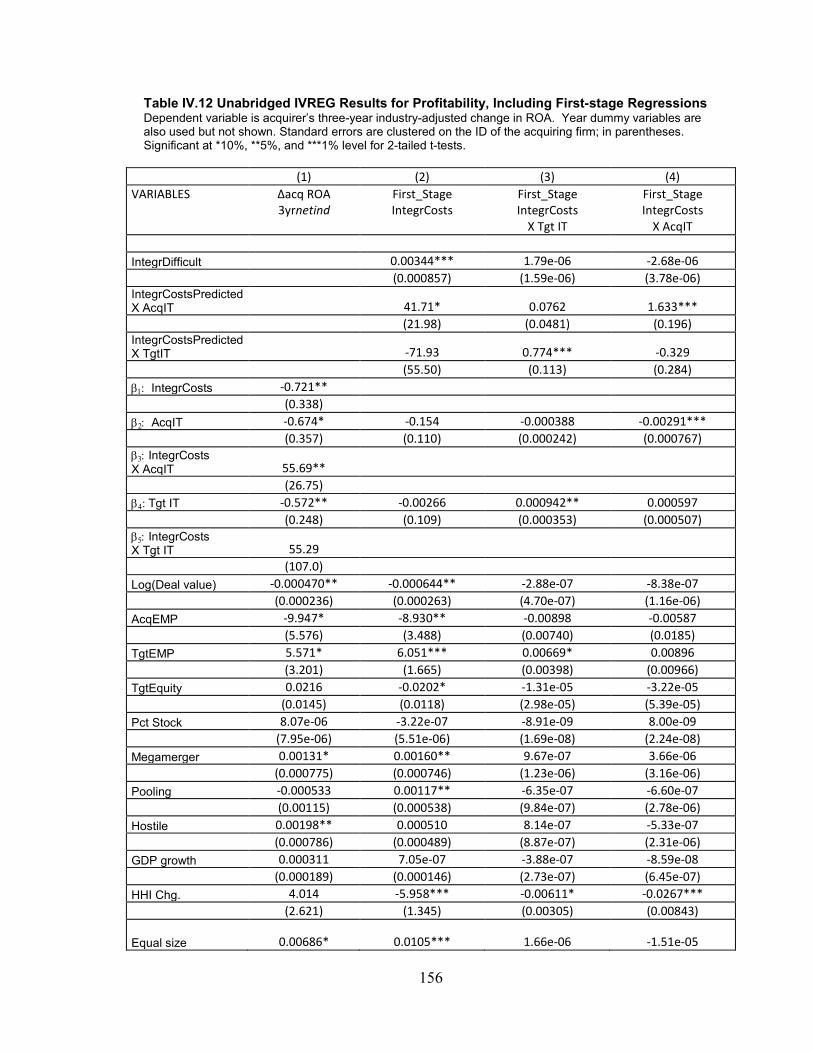
156
Table IV.12 Unabridged IVREG Results for Profitability, Including First-stage Regressions Dependent variable is acquirer’s three-year industry-adjusted change in ROA. Year dummy variables are also used but not shown. Standard errors are clustered on the ID of the acquiring firm; in parentheses. Significant at *10%, **5%, and ***1% level for 2-tailed t-tests.
(1) (2) (3) (4) VARIABLES Δacq ROA
3yrnetind First_Stage IntegrCosts
First_Stage IntegrCosts
X Tgt IT
First_Stage IntegrCosts
X AcqIT IntegrDifficult 0.00344*** 1.79e-06 -2.68e-06 (0.000857) (1.59e-06) (3.78e-06) IntegrCostsPredicted X AcqIT
41.71* 0.0762 1.633***
(21.98) (0.0481) (0.196) IntegrCostsPredicted X TgtIT
-71.93 0.774*** -0.329
(55.50) (0.113) (0.284) β1: IntegrCosts -0.721** (0.338) β2: AcqIT -0.674* -0.154 -0.000388 -0.00291*** (0.357) (0.110) (0.000242) (0.000767) β3: IntegrCosts X AcqIT 55.69**
(26.75) β4: Tgt IT -0.572** -0.00266 0.000942** 0.000597 (0.248) (0.109) (0.000353) (0.000507) β5: IntegrCosts X Tgt IT 55.29
(107.0) Log(Deal value) -0.000470** -0.000644** -2.88e-07 -8.38e-07 (0.000236) (0.000263) (4.70e-07) (1.16e-06) AcqEMP -9.947* -8.930** -0.00898 -0.00587 (5.576) (3.488) (0.00740) (0.0185) TgtEMP 5.571* 6.051*** 0.00669* 0.00896 (3.201) (1.665) (0.00398) (0.00966) TgtEquity 0.0216 -0.0202* -1.31e-05 -3.22e-05 (0.0145) (0.0118) (2.98e-05) (5.39e-05) Pct Stock 8.07e-06 -3.22e-07 -8.91e-09 8.00e-09 (7.95e-06) (5.51e-06) (1.69e-08) (2.24e-08) Megamerger 0.00131* 0.00160** 9.67e-07 3.66e-06 (0.000775) (0.000746) (1.23e-06) (3.16e-06) Pooling -0.000533 0.00117** -6.35e-07 -6.60e-07 (0.00115) (0.000538) (9.84e-07) (2.78e-06) Hostile 0.00198** 0.000510 8.14e-07 -5.33e-07 (0.000786) (0.000489) (8.87e-07) (2.31e-06) GDP growth 0.000311 7.05e-07 -3.88e-07 -8.59e-08 (0.000189) (0.000146) (2.73e-07) (6.45e-07) HHI Chg. 4.014 -5.958*** -0.00611* -0.0267*** (2.621) (1.345) (0.00305) (0.00843)
Equal size 0.00686* 0.0105*** 1.66e-06 -1.51e-05
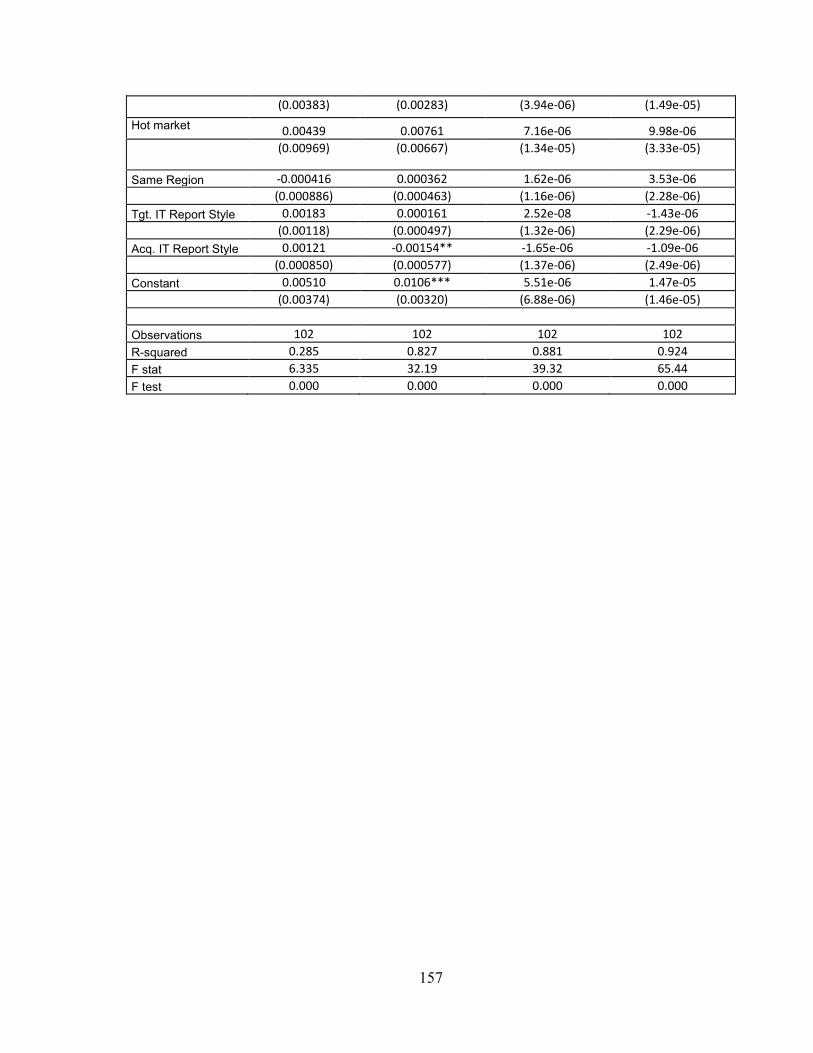
157
(0.00383) (0.00283) (3.94e-06) (1.49e-05)
Hot market 0.00439 0.00761 7.16e-06 9.98e-06 (0.00969) (0.00667) (1.34e-05) (3.33e-05)
Same Region -0.000416 0.000362 1.62e-06 3.53e-06 (0.000886) (0.000463) (1.16e-06) (2.28e-06) Tgt. IT Report Style 0.00183 0.000161 2.52e-08 -1.43e-06 (0.00118) (0.000497) (1.32e-06) (2.29e-06) Acq. IT Report Style 0.00121 -0.00154** -1.65e-06 -1.09e-06 (0.000850) (0.000577) (1.37e-06) (2.49e-06) Constant 0.00510 0.0106*** 5.51e-06 1.47e-05 (0.00374) (0.00320) (6.88e-06) (1.46e-05) Observations 102 102 102 102 R-squared 0.285 0.827 0.881 0.924 F stat 6.335 32.19 39.32 65.44 F test 0.000 0.000 0.000 0.000
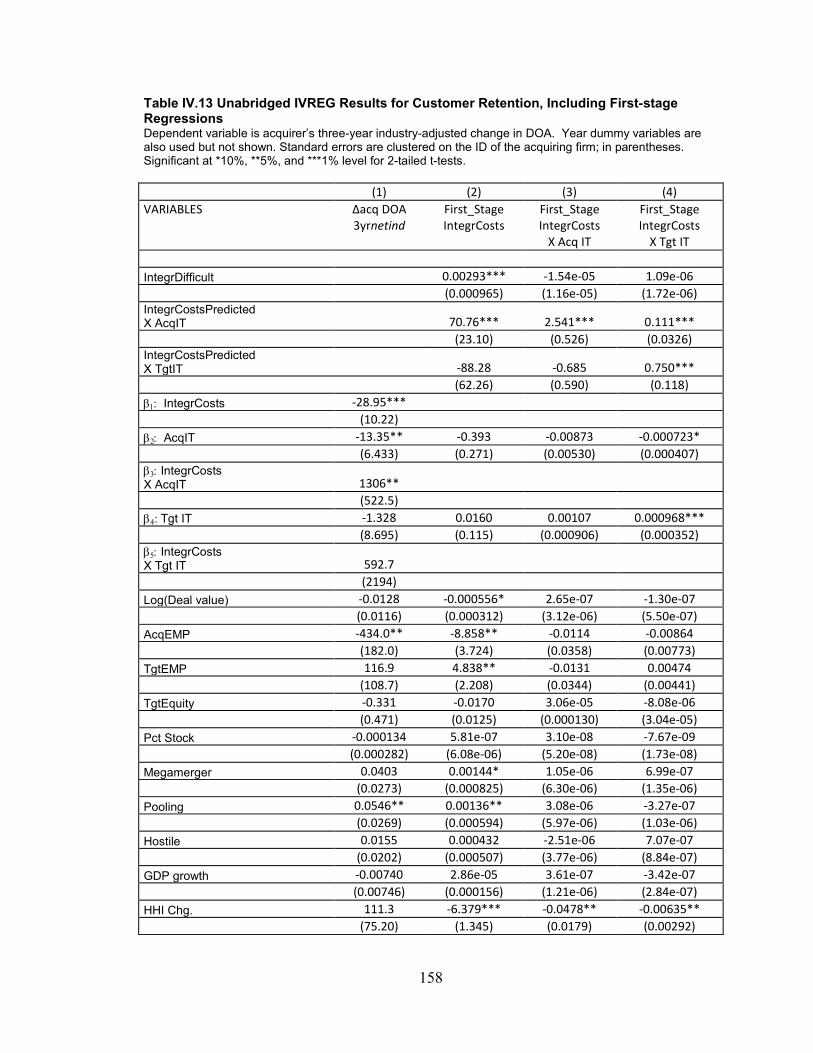
158
Table IV.13 Unabridged IVREG Results for Customer Retention, Including First-stage Regressions Dependent variable is acquirer’s three-year industry-adjusted change in DOA. Year dummy variables are also used but not shown. Standard errors are clustered on the ID of the acquiring firm; in parentheses. Significant at *10%, **5%, and ***1% level for 2-tailed t-tests. (1) (2) (3) (4) VARIABLES Δacq DOA
3yrnetind First_Stage IntegrCosts
First_Stage IntegrCosts
X Acq IT
First_Stage IntegrCosts
X Tgt IT IntegrDifficult 0.00293*** -1.54e-05 1.09e-06 (0.000965) (1.16e-05) (1.72e-06) IntegrCostsPredicted X AcqIT
70.76*** 2.541*** 0.111***
(23.10) (0.526) (0.0326) IntegrCostsPredicted X TgtIT
-88.28 -0.685 0.750***
(62.26) (0.590) (0.118) β1: IntegrCosts -28.95*** (10.22) β2: AcqIT -13.35** -0.393 -0.00873 -0.000723* (6.433) (0.271) (0.00530) (0.000407) β3: IntegrCosts X AcqIT 1306**
(522.5) β4: Tgt IT -1.328 0.0160 0.00107 0.000968*** (8.695) (0.115) (0.000906) (0.000352) β5: IntegrCosts X Tgt IT 592.7
(2194) Log(Deal value) -0.0128 -0.000556* 2.65e-07 -1.30e-07 (0.0116) (0.000312) (3.12e-06) (5.50e-07) AcqEMP -434.0** -8.858** -0.0114 -0.00864 (182.0) (3.724) (0.0358) (0.00773) TgtEMP 116.9 4.838** -0.0131 0.00474 (108.7) (2.208) (0.0344) (0.00441) TgtEquity -0.331 -0.0170 3.06e-05 -8.08e-06 (0.471) (0.0125) (0.000130) (3.04e-05) Pct Stock -0.000134 5.81e-07 3.10e-08 -7.67e-09 (0.000282) (6.08e-06) (5.20e-08) (1.73e-08) Megamerger 0.0403 0.00144* 1.05e-06 6.99e-07 (0.0273) (0.000825) (6.30e-06) (1.35e-06) Pooling 0.0546** 0.00136** 3.08e-06 -3.27e-07 (0.0269) (0.000594) (5.97e-06) (1.03e-06) Hostile 0.0155 0.000432 -2.51e-06 7.07e-07 (0.0202) (0.000507) (3.77e-06) (8.84e-07) GDP growth -0.00740 2.86e-05 3.61e-07 -3.42e-07 (0.00746) (0.000156) (1.21e-06) (2.84e-07) HHI Chg. 111.3 -6.379*** -0.0478** -0.00635** (75.20) (1.345) (0.0179) (0.00292)
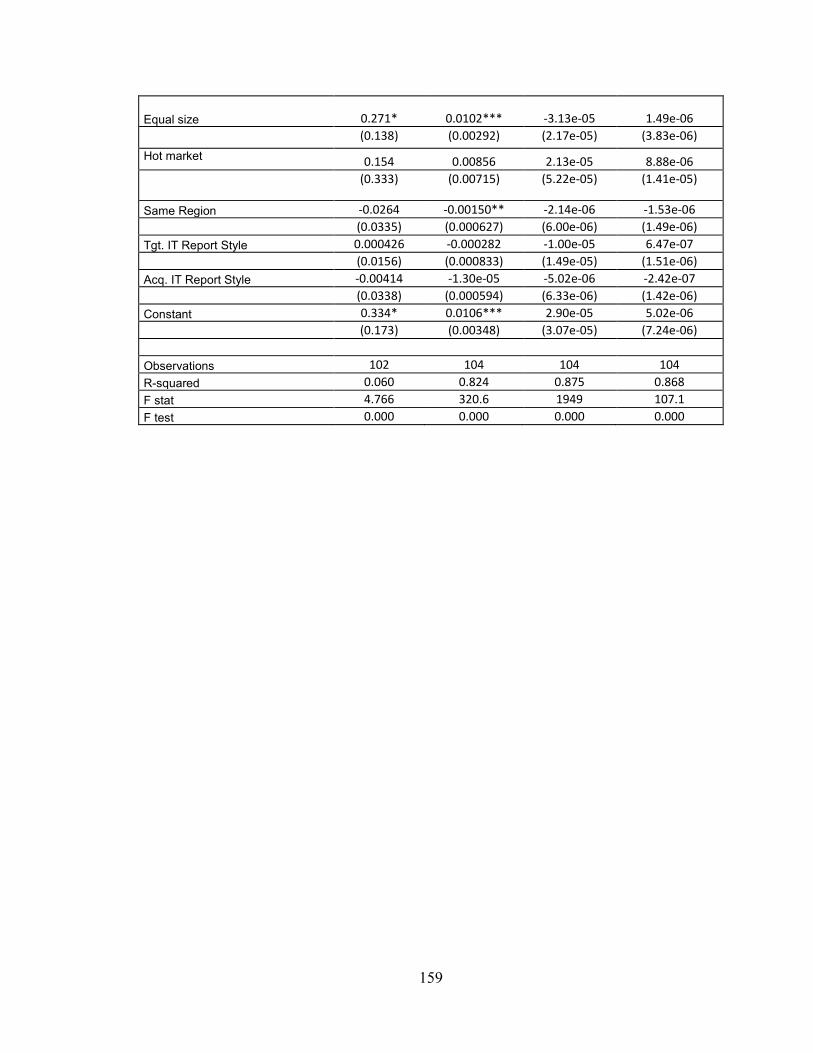
159
Equal size 0.271* 0.0102*** -3.13e-05 1.49e-06 (0.138) (0.00292) (2.17e-05) (3.83e-06)
Hot market 0.154 0.00856 2.13e-05 8.88e-06 (0.333) (0.00715) (5.22e-05) (1.41e-05)
Same Region -0.0264 -0.00150** -2.14e-06 -1.53e-06 (0.0335) (0.000627) (6.00e-06) (1.49e-06) Tgt. IT Report Style 0.000426 -0.000282 -1.00e-05 6.47e-07 (0.0156) (0.000833) (1.49e-05) (1.51e-06) Acq. IT Report Style -0.00414 -1.30e-05 -5.02e-06 -2.42e-07 (0.0338) (0.000594) (6.33e-06) (1.42e-06) Constant 0.334* 0.0106*** 2.90e-05 5.02e-06 (0.173) (0.00348) (3.07e-05) (7.24e-06) Observations 102 104 104 104 R-squared 0.060 0.824 0.875 0.868 F stat 4.766 320.6 1949 107.1 F test 0.000 0.000 0.000 0.000
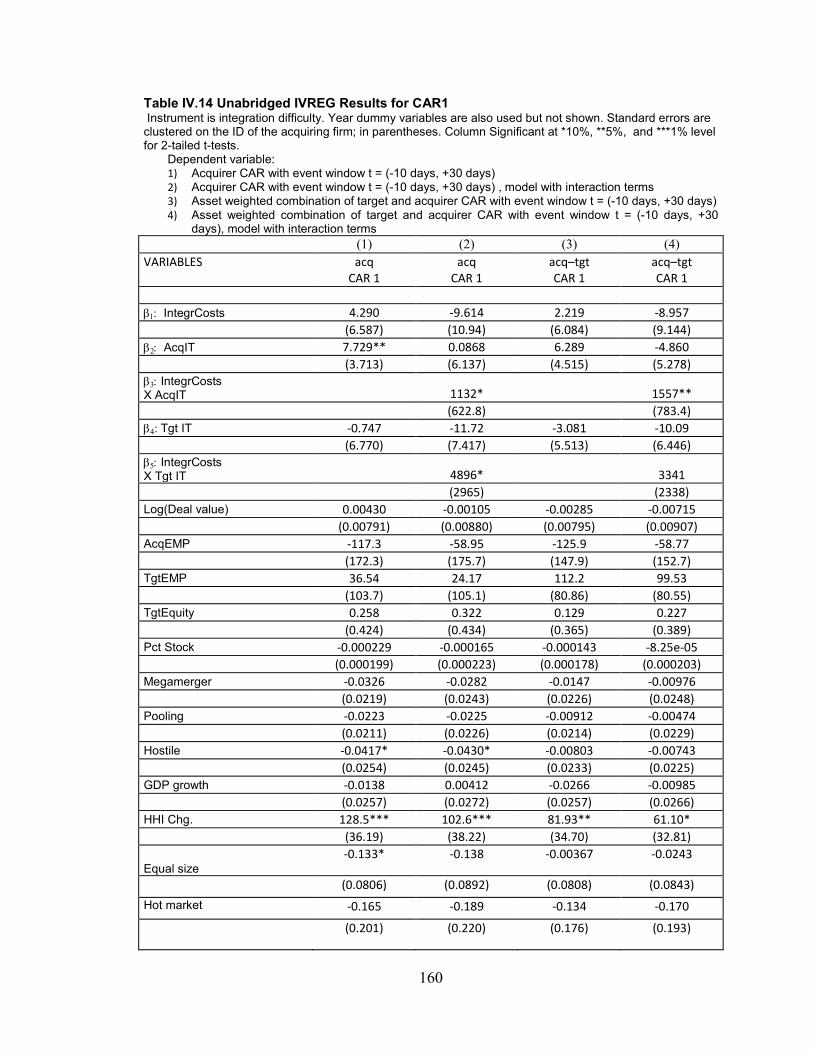
160
Table IV.14 Unabridged IVREG Results for CAR1 Instrument is integration difficulty. Year dummy variables are also used but not shown. Standard errors are clustered on the ID of the acquiring firm; in parentheses. Column Significant at *10%, **5%, and ***1% level for 2-tailed t-tests.
Dependent variable: 1) Acquirer CAR with event window t = (-10 days, +30 days) 2) Acquirer CAR with event window t = (-10 days, +30 days) , model with interaction terms 3) Asset weighted combination of target and acquirer CAR with event window t = (-10 days, +30 days) 4) Asset weighted combination of target and acquirer CAR with event window t = (-10 days, +30
days), model with interaction terms (1) (2) (3) (4) VARIABLES acq
CAR 1 acq
CAR 1 acq–tgt CAR 1
acq–tgt CAR 1
β1: IntegrCosts 4.290 -9.614 2.219 -8.957 (6.587) (10.94) (6.084) (9.144) β2: AcqIT 7.729** 0.0868 6.289 -4.860 (3.713) (6.137) (4.515) (5.278) β3: IntegrCosts X AcqIT 1132* 1557** (622.8) (783.4) β4: Tgt IT -0.747 -11.72 -3.081 -10.09 (6.770) (7.417) (5.513) (6.446) β5: IntegrCosts X Tgt IT 4896* 3341 (2965) (2338) Log(Deal value) 0.00430 -0.00105 -0.00285 -0.00715 (0.00791) (0.00880) (0.00795) (0.00907) AcqEMP -117.3 -58.95 -125.9 -58.77 (172.3) (175.7) (147.9) (152.7) TgtEMP 36.54 24.17 112.2 99.53 (103.7) (105.1) (80.86) (80.55) TgtEquity 0.258 0.322 0.129 0.227 (0.424) (0.434) (0.365) (0.389) Pct Stock -0.000229 -0.000165 -0.000143 -8.25e-05 (0.000199) (0.000223) (0.000178) (0.000203) Megamerger -0.0326 -0.0282 -0.0147 -0.00976 (0.0219) (0.0243) (0.0226) (0.0248) Pooling -0.0223 -0.0225 -0.00912 -0.00474 (0.0211) (0.0226) (0.0214) (0.0229) Hostile -0.0417* -0.0430* -0.00803 -0.00743 (0.0254) (0.0245) (0.0233) (0.0225) GDP growth -0.0138 0.00412 -0.0266 -0.00985 (0.0257) (0.0272) (0.0257) (0.0266) HHI Chg. 128.5*** 102.6*** 81.93** 61.10* (36.19) (38.22) (34.70) (32.81)
Equal size -0.133* -0.138 -0.00367 -0.0243
(0.0806) (0.0892) (0.0808) (0.0843)
Hot market -0.165 -0.189 -0.134 -0.170
(0.201) (0.220) (0.176) (0.193)
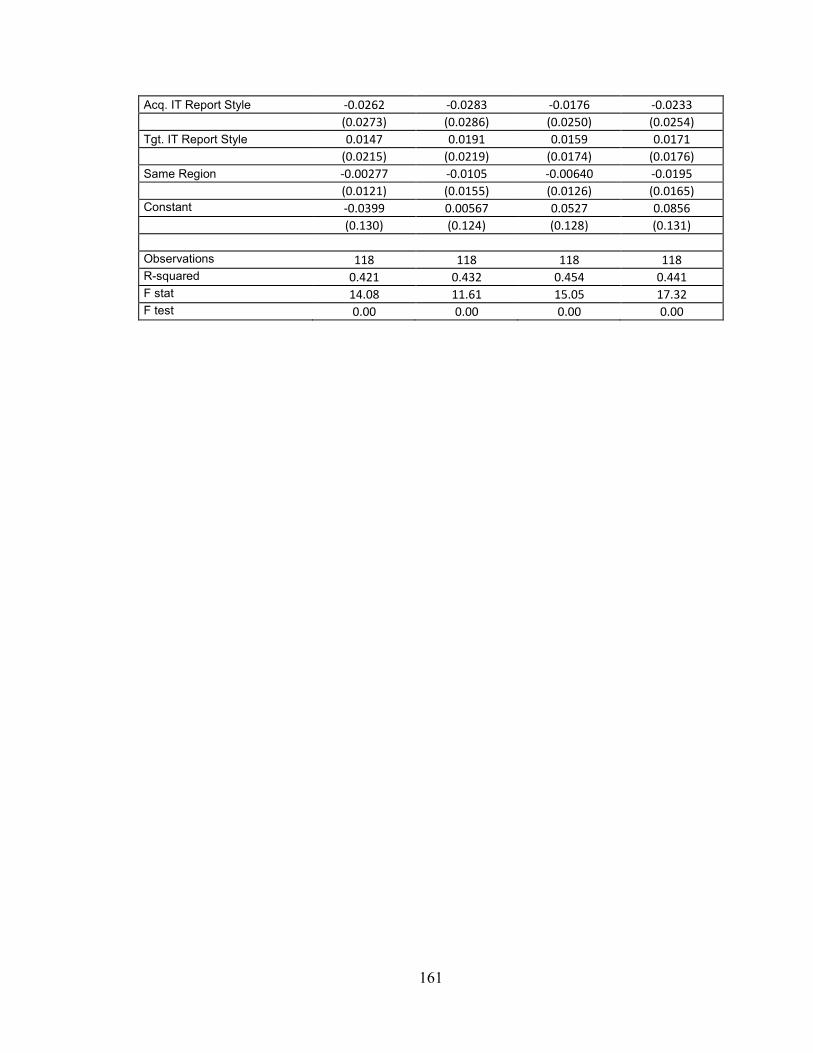
161
Acq. IT Report Style -0.0262 -0.0283 -0.0176 -0.0233 (0.0273) (0.0286) (0.0250) (0.0254) Tgt. IT Report Style 0.0147 0.0191 0.0159 0.0171 (0.0215) (0.0219) (0.0174) (0.0176) Same Region -0.00277 -0.0105 -0.00640 -0.0195 (0.0121) (0.0155) (0.0126) (0.0165) Constant -0.0399 0.00567 0.0527 0.0856 (0.130) (0.124) (0.128) (0.131) Observations 118 118 118 118 R-squared 0.421 0.432 0.454 0.441 F stat 14.08 11.61 15.05 17.32 F test 0.00 0.00 0.00 0.00
162
References
Aberg, L., and Sias, D. 2005. "Taming Postmerger IT Integration," The McKinsey Quarterly (January 18, 2005).
Akhavein, J.D., Berger, A.N., and Humphrey, D.B. 1997. "The Effects of Megamergers on Efficiency and Prices: Evidence from a Bank Profit Function," Review of Industrial Organization (12), pp. 95-139.
Alaranta, M. 2006. "Managing the Change Process of the Post-Merger Enterprise Systems Integration: A Case Study," International Journal of Information Systems and Change Management (1:1), pp. 62-81.
Altunbas, Y., and Marques, D. 2008. "Mergers and Acquisitions and Bank Performance in Europe: The Role of Strategic Similarities," Journal of Economics and Business (60:3), pp. 204-222.
Authers, J. 1998. "Wells Fargo Learns Lesson," The Financial Times (June 9, 1998), p. 14.
Berger, A.N. 2003. "The Economic Effects of Technological Progress: Evidence from the Banking Industry" Journal of Money, Credit, and Banking (35:2), pp. 141-176.
Berger, A.N., Demsetz, R.S., and Strahan, P.E. 1999. "The Consolidation of the Financial Services Industry: Causes, Consequences, and Implications for the Future," Journal of Banking and Finance (23:46), pp. 135-194.
Berger, A.N., and Mester, L.J. 2003. "Explaining the Dramatic Changes in Performance of US Banks: Technological Change, Deregulation, and Dynamic Changes in Competition," Journal of Financial Intermediation (12), pp. 57-95.
Breitkopf, D. 2001. " Program Revives Names of Banks B of A Swallowed " American Banker (167:243).
Broadbent, M., Weill, P., and St. Clair, D. 1999. "The Implications of Information Technology Infrastructure for Business Process Redesign," MIS Quarterly (23:2), pp. 159-182.
Brynjolfsson, E., and Hitt, L. 1996. "Paradox Lost? Firm-level Evidence on the Returns to Information Systems Spending," Management Science (42:4), pp. 541-558.
Byrd, T.A., and Turner, D.E. 2000. "Measuring the Flexibility of Information Technology Infrastructure: Exploratory Analysis of a Construct," Journal of Management Information Systems (17:1), pp. 167-208.
Cox, N.J. 1998. "WINSOR: Stata module to Winsorize a Variable," Statistical Software Components s361402 (Boston College Department of Economics:rev Aug. 09 2006).
Davamanirajan, P., Kauffman, R.J., Kriebel, C.H., and Mukhopadhyay, T. 2006. "Systems Design, Process Performance, and Economic Outcomes in International Banking," Journal of Management Information Systems (23:2), pp. 65-90.
Davamanirajan, P., Mukhopadhyay, T., and Kriebel, C.H. 2002. "Assessing the Business Value of Information Technology in Global Wholesale Banking: The Case of Trade Services," Journal of Organizational Computing and Electronic Commerce (12:1), pp. 5-16.
163
Dehning, B., Richardson, V.J., and Zmud, R.W. 2003. "The Value Relevance of Announcements of Transformational Information Technology Investments," MIS Quarterly (27:4), pp. 637-656.
Delong, G., and Deyoung, R. 2007. "Learning by Observing: Information Spillovers in the Execution and Evaluation of Commercial Bank M&As," The Journal of Finance (62:1), pp. 181-216.
Dewan, S., Michael, S.S., and Min, C.-K. 1998. "Firm Characteristics and Investments in Information Technology: Scale and Scope Effects," Information Systems Research (9:3), pp. 219-232.
Dietz, J.L.G. 2006. "The Deep Structure of Business Processes," Communications of the ACM (49:5), pp. 59-64.
Duncan, N.B. 1995. "Capturing Flexibility of Information Technology Infrastructure: A Study of Resource Characteristics and their Measure," Journal of Management Information Systems (12:2), pp. 37-58.
Focarelli, D., and Panetta, F. 2003. "Are Mergers Beneficial to Consumers? Evidence from the Market for Bank Deposits," American Economic Review (93:4), pp. 1152-1172.
Giacomazzi, F., Panella, C., Pernici, B., and Sansoni, M. 1997. "Information Systems Integration in Mergers and Acquisitions: A Normative Model," Information & Management (32), pp. 289-302.
Gilson, S.C., and Escalle, C.X. 1998. "Chase Manhattan Corporate: The Making of America's Largest Bank," Harvard Business School Case (9-298:016).
Gosain, S., Malhotra, A., and El Sawy, O.A. 2005. "Coordinating for Flexibility in e-Business Supply Chains," Journal of Management Information Systems (21:3), pp. 7-45.
Hammer, M., and Champy, J. 1993. Reengineering the Corporation: A Manifesto for Business Revolution. London, U.K.: Nicholas Brealey.
Hancock, D., Humphrey, D.B., and Wilcox, J.A. 1999. "Cost Reductions in Electronic Payments: The Roles of Consolidation, Economies of Scale, and Technical Change," Journal of Banking and Finance (23:2), pp. 391-421.
Holmstrom, B., and Kaplan, S.N. 2001. "Corporate Governance and Merger Activity in the United States: Making Sense of the 1980's and the 1990's," The Journal of Economic Perspectives (15:2), pp. 121-144.
Houston, J.F., James, C.M., and Ryngaert, M.D. 2001. "Where do Merger Gains Come From? Bank Mergers from the Perspective of Insiders and Outsiders," Journal of Financial Economics (60:May-June), pp. 285-331.
Hovanesian, M.D. 2006. "JP Morgan: The Bank of Technology," BusinessWeek (June 19, 2006), p. 39.
Johnston, K.D., and Yetton, P.W. 1996. "Integrating Information Technology Divisions in a Bank Merger Fit, Compatibility and Models of Change," Journal of Strategic Information Systems (5:3), pp. 189-211.
Kam, C.D., and Franzese, R.J. 2007. Modeling and Interpreting Interactive Hypotheses in Regression Analysis: A Brief Refresher and Some Practical Advice. Ann Arbor, MI: University of Michigan Press.
Kendler, P.B. 2005. "Mergers & Acquisitions," Bank Systems & Technology (September 29:2005), p. 14.
164
Linder, J.C., and Crane, D.B. 1993. "Bank Mergers: Integration and Profitability " Journal of Financial Services Research (7:1), pp. 35-55.
Malhotra, A., Gosain, S., and El Sawy, O.A. 2005. "Absorptive Capacity Configurations in Supply Chains: Gearing for Partner- Enabled Market Knowledge Creation," MIS Quarterly (29:1), pp. 145-187.
Marlin, S. 2003. "Bank Merger Faces IT Obstacles on Way to Savings," InformationWeek (October 30, 2003).
Mata, F.J., Fuerst, W.L., and Barney, J.B. 1995. "Information Technology and Sustained Competitive Advantage: A Resource-Based Analysis," MIS Quarterly (19:4), pp. 487-506.
Melville, N., Gurbaxani, V., and Kraemer, K. 2007. "The Productivity Impact of Information Technology across Competitive Regimes: The Role of Industry Concentration and Dynamism," Decision Support Systems (43:1), pp. 229-242.
Melville, N., Kraemer, K., and Gurbaxani, V. 2004. "Review: Information Technology and Organizational Performance: An Integrative Model of IT Business Value," MIS Quarterly (28:2), pp. 283-322.
Moyer, L. 2001. "Fleet Gives N.J. Foes Little Ammo " American Banker (166:163). O'Hara, T. 2005. "For Riggs Customers, an Uneven Transaction," The Washington Post
(May 14, 2005), p. 14. Pavlou, P., and El Sawy, O. 2006. "From IT Leveraging Competence to Competitive
Advantage in Turbulent Environments: The Case of New Product Development," Information Systems Research (17:3), pp. 198-227.
Piggott, C. 2000. "Will They Be Happy?," The Banker (898:150), pp. 2- 7. Rhoades, S.A. 1998. "The Efficiency Effects of Bank Mergers: An Overview of Case
Studies of Nine Mergers," Journal of Banking and Finance (22), pp. 273-291. Robbins, S.S., and Stylianou, A.C. 1999. "Post-Merger Systems Integration: The Impact
of IS Capabilities," Information & Management (36:4), pp. 205-212. Sambamurthy, V., Bharadwaj, A., and Grover, V. 2003. "Shaping Agility through Digital
Options: Reconceptualizing the Role of Information Technology in Contemporary Firms," MIS Quarterly (27:2), pp. 237-263.
Shaver, M. 2006. "A Paradox of Synergy: Contagion and Capacity Effects in Mergers and Acquisitions," Academy of Management Review (31:4), pp. 962-976.
Stylianou, A.C., Jeffries, C.J., and Robbins, S.S. 1996. "Corporate Mergers and the Problems of IS Integration," Information & Management (31:4), pp. 203-213.
Tanriverdi, H. 2006. "Performance Effects of Information Technology Synergies in Multibusiness Firms," MIS Quarterly (30:1), pp. 57-77.
Tanriverdi, H., and Uysal, V.B. 2009. "Cross-business Information Technology Integration and Acquirer Value Creation in Corporate Mergers and Acquisitions," Information Systems Research (forthcoming).
Wahl, M. 1998. "Analysts Look for Next Big Bank Merger " The Charlotte (N.C.) Observer. (March 18, 1998).
Wooldridge, J.M. 2002. Econometric Analysis of Cross Section and Panel Data. Cambridge, MA: The MIT Press.
Zollo, M., and Singh, H. 2004. "Deliberate Learning in Corporate Acquisitions: Post-Acquisition Strategies and Integration Capability in U.S. Bank Mergers," Strategic Management Journal (25:13), pp. 1233-1256.
165
CHAPTER V
Final Considerations
I studied the effect of IT investment on the value that firms derive from alliances
and mergers. Prior to this study, it has been widely understood that IT capabilities can
enhance inter-firm cooperation by reducing transaction and coordination costs. While the
focus of most studies on IT in inter-firm cooperation has been on supply-chain
relationships, the context of alliances and mergers adds a new dimension of dynamism to
the challenges to inter-firm cooperation. To varying degrees, alliances and mergers
involve recombination and reconfiguration of resources, the sharing of tacit knowledge,
and integration of a broad scope of firm capabilities. Given these requirements for
success, it becomes important to consider the impact of flexible IT architecture such as
service-oriented architecture, as well as the effect of integration costs such as in the case
of mergers in the commercial banking industry.
In both theory and empirics, my approach in this dissertation was to conceptually
distinguish the incentives of firms to enter alliances and mergers from their ability to
derive value from them. Without making this distinction, and without placing greater
emphasis on the transformative role of IT in addition to the effect of IT on transaction
and coordination costs, some of the propositions and results of this dissertation would be
surprising. For example, I found that service-oriented architectures have greater firm-
value impacts in the case of collaborative alliances than in the case of arms-length
166
alliances. This is counter-intuitive, since we might be pre-inclined to associate arms-
length alliances with greater flexibility. On the other hand, when we consider that
collaborative alliances involve greater commitment and inter-dependence of resources,
then it becomes clear that firms are more likely to derive value from those alliances if
they have flexibility to reconfigure resources, modify business processes, and adapt in
response to changing conditions.
The context of bank mergers is an important setting to study IT business value
because it is a context in which massive organizational changes take place very quickly.
The dynamic features of this setting are consistent with known mechanisms in the
literature on IT business value, but call for greater emphasis on the transformative role of
IT. My research findings suggest that IT investment, of the acquiring firm in particular,
has a positive and significant effect on the value of mergers involving high integration
costs. This suggests that business value can be generated through mechanisms beyond
what is revealed in single-firm contexts. Building on the business value of IT literature, I
described three possible mechanisms in which IT investment enables merging firms to
generate new synergies and create merger value: economies of scale of IT, the
rationalization of business processes, and enhanced reconfiguration of IT-enabled
business processes.
Among the first quantitative empirical studies on the role of IT investment on the
firm-performance of mergers and alliances, this dissertation brings a new emphasis on the
transformative role of IT in enhancing the business value of alliances and mergers. In
addition, the results of this study can be instructive to managers, suggesting that
managers need to consider the importance of IT capabilities and IT flexibility, and how
167
such capabilities can be critical in facing the challenges of resource recombination or
business process integration that arise in collaborative alliances or mergers. This
dissertation is intended to be a foundation for an ongoing research agenda on the role of
IT in alliances and mergers, particularly as the organizational landscape continues to be
transformed by new and diverse forms of inter-firm collaboration enabled by IT.