Embed Size (px)
Citation preview

The Roadside Inspection Selection System (ISS)
for Commercial Vehicles
Brenda M. LantzUpper Great Plains Transportation Institute
Michael W. Blevins and Thomas J. HillegassFederal Highway Administration, Office of Motor Carriers
March 1997

Acknowledgments
The authors are grateful to the FHWA/OMC for providing the funding for this study and areespecially appreciative to all those individuals who contributed their comments and suggestions as thestudy progressed.

i
TABLE OF CONTENTS
INTRODUCTION . . . . . . . . . . . . . . . . . . . . . . . . . . . . . . . . . . . . . . . . . . . . . . . . . . . . . . . . . . . . . . . . . . . 1
PURPOSE AND DEFINITION OF THE ISS . . . . . . . . . . . . . . . . . . . . . . . . . . . . . . . . . . . . . . . . . . . . . . 3
DEVELOPMENT OF THE ISS . . . . . . . . . . . . . . . . . . . . . . . . . . . . . . . . . . . . . . . . . . . . . . . . . . . . . . . . 4
DETAILED EXPLANATION OF THE ISS . . . . . . . . . . . . . . . . . . . . . . . . . . . . . . . . . . . . . . . . . . . . . . . 7Description of the Standalone Windows ISS . . . . . . . . . . . . . . . . . . . . . . . . . . . . . . . . . . . . . . . . 8Description of ISS Algorithm . . . . . . . . . . . . . . . . . . . . . . . . . . . . . . . . . . . . . . . . . . . . . . . . . . . 11
TESTING AND REFINEMENT OF THE ISS . . . . . . . . . . . . . . . . . . . . . . . . . . . . . . . . . . . . . . . . . . . . 14Results from the First Phase Testing . . . . . . . . . . . . . . . . . . . . . . . . . . . . . . . . . . . . . . . . . . . . . 17Results from the Second Phase Testing . . . . . . . . . . . . . . . . . . . . . . . . . . . . . . . . . . . . . . . . . . . 19Results from the Third Phase Testing . . . . . . . . . . . . . . . . . . . . . . . . . . . . . . . . . . . . . . . . . . . . . 21
Carrier-Specific Analysis . . . . . . . . . . . . . . . . . . . . . . . . . . . . . . . . . . . . . . . . . . . . . . . 22Actual Inspection OOS Rate Analysis . . . . . . . . . . . . . . . . . . . . . . . . . . . . . . . . . . . . . . 24
Results from the Fourth Phase Testing . . . . . . . . . . . . . . . . . . . . . . . . . . . . . . . . . . . . . . . . . . . . 26
DISCUSSION OF BENEFITS . . . . . . . . . . . . . . . . . . . . . . . . . . . . . . . . . . . . . . . . . . . . . . . . . . . . . . . . 27
EVALUATION SURVEY RESULTS . . . . . . . . . . . . . . . . . . . . . . . . . . . . . . . . . . . . . . . . . . . . . . . . . . 30
SUMMARY . . . . . . . . . . . . . . . . . . . . . . . . . . . . . . . . . . . . . . . . . . . . . . . . . . . . . . . . . . . . . . . . . . . . . . . 32
REFERENCES . . . . . . . . . . . . . . . . . . . . . . . . . . . . . . . . . . . . . . . . . . . . . . . . . . . . . . . . . . . . . . . . . . . . . 33

ii
LIST OF TABLES
Table 1. Distribution of Out-of-Service (OOS) Rates . . . . . . . . . . . . . . . . . . . . . . . . . . . . . . . . . . . . . . . 34
Table 2. Distribution of Inspections (Level I, II, and V) per Power Unit . . . . . . . . . . . . . . . . . . . . . . . . 35
Table 3. Distribution of Inspections (Level I, II, and III) per Driver . . . . . . . . . . . . . . . . . . . . . . . . . . . 36
LIST OF FIGURES
Figure 1. Main Screen for the Standalone Windows ISS . . . . . . . . . . . . . . . . . . . . . . . . . . . . . . . . . . . . 37
Figure 2. History Screen for the Standalone Windows ISS . . . . . . . . . . . . . . . . . . . . . . . . . . . . . . . . . . . 38
Figure 3. Details Screen for the Standalone Windows ISS . . . . . . . . . . . . . . . . . . . . . . . . . . . . . . . . . . . 39
Figure 4. Violation Details Screen for the Standalone Windows ISS . . . . . . . . . . . . . . . . . . . . . . . . . . . 40
Figure 5. About Screen for the Standalone Windows ISS . . . . . . . . . . . . . . . . . . . . . . . . . . . . . . . . . . . . 41
Figure 6. ISS Algorithm Flow Chart . . . . . . . . . . . . . . . . . . . . . . . . . . . . . . . . . . . . . . . . . . . . . . . . . . . . 42

iii
ABSTRACT
The Inspection Selection System (ISS) was developed as part of the Aspen roadside inspection
software system, in response to a 1995 Congressional mandate calling for the use of prior carrier safety
data to guide the selection of vehicles and drivers for roadside inspections. The Aspen system includes
software to help conduct roadside commercial vehicle/driver inspections with portable microcomputers,
including hand-held pen-computers. Aspen includes electronic transfer of inspection results, and
electronic access to carrier safety performance data and commercial driver license status data.
The ISS algorithm was designed at the Upper Great Plains Transportation Institute, North Dakota
State University, in cooperation with a 10-State Roadside Technology Technical Working Group and the
Federal Highway Administration’s Office of Motor Carriers (OMC). The OMC’s Field Systems Group
managed the overall project and completed the ISS and Aspen software development.
The main objectives of the ISS are to recommend roadside inspections for those commercial
vehicles and drivers with:
1. Poor prior safety performance as evidenced by an unsatisfactory safety compliance
fitness rating and/or higher than average vehicle/driver out-of-service rates, and/or,
2. Very few or no roadside inspections in the previous two years relative to the carrier’s
size.
In short, the ISS is designed to help better distribute roadside inspections among motor carriers
and target those with prior poor safety performance.
It is anticipated that in the future, the ISS will be used to screen transponder-equipped vehicles at
mainline speeds. Currently, however, the roadside inspector simply enters the Department of
Transportation (DOT) or Interstate Commerce Commission (ICC) number displayed on the commercial
vehicle into a microcomputer running the ISS software. An “inspection value” and recommendation are
then displayed for that particular carrier. The system is not vehicle-specific, so the “inspection value” is
based on the carrier’s safety performance history, not the specific vehicle’s history. The ISS also
iv
provides specific recommendations based on previous regulatory problems in the carrier’s history. For
example, driver hours-of-service problems or hazardous materials shipping papers problems might be
highlighted. The idea is to suggest the inspector focus on those areas based on a known history of
violations.
It should be emphasized that the ISS, either in Aspen or as a standalone system, is simply a tool
for the inspector. The final decision whether to inspect the vehicle/driver is always made by the
inspector.
Ten states were involved with the initial testing of the ISS, but currently a majority of states
throughout the United States are using the system. Results from the testing show that as inspectors use
the ISS to a greater degree, the desired impacts described above will be achieved. Specifically, out-of-
service rates are substantially higher when an inspection is recommended by the ISS. An analysis of data
from 39,819 inspections conducted in 10 states the first eight months of 1996 revealed the vehicle out-of-
service rate was 33.7 percent for those ISS recommended to inspect versus 20.0 percent for those it did
not. For driver out-of-service, the rate was 13.5 percent for those recommended versus 9.9 percent for
those not recommended. Clearly, the ISS will help to target relatively unsafe carriers, as well as those for
which there is insufficient data, and reduce the inspection burden on proven safe carriers. This means
more efficient use of scarce resources by focusing on less safe vehicles/drivers.
Based on an evaluation survey completed by inspectors and presentations of the system, the ISS
also appears to be well accepted by both inspectors and the motor carrier community. More than 70
percent of inspectors surveyed stated that they would recommend the ISS for use in other states.
Additionally, there are substantial benefits to society in terms of safety and to “safe” motor carriers in
terms of cost-savings to be realized from use of the ISS. A conservative estimate of these benefits
amounts to approximately $60 million per year. The testing and refinement of the ISS will be continued
for some time as new data and technologies become more widely available. It is hoped that this will even

v
further enhance its effectiveness at focusing inspections to achieve maximum value while causing
minimum disruption to the flow of commerce.

1
The Roadside Inspection Selection System (ISS)
for Commercial Vehicles
Final Report
INTRODUCTION
To help accomplish the Federal Highway Administration's (FHWA) safety objectives, the Motor
Carrier Safety Assistance Program (MCSAP) was established by the Surface Transportation Assistance
Act of 1982. The MCSAP provides Federal funds to the states so they can conduct increased commercial
motor vehicle safety activities. These safety activities include roadside inspections, educational contacts,
and compliance reviews.
Roadside inspections of commercial motor vehicles in the United States follow a standard known
as the North American Standard Inspection. Inspections involve an examination of vehicles, drivers, and
hazardous material cargo. They focus on critical safety regulations and include provisions for placing
vehicles and/or drivers out-of-service (OOS) if unsafe conditions are discovered. OOS problems must be
corrected prior to continuation of a trip.
There are several types or “levels” of roadside inspections conducted. The four types considered
in the current project are Levels I, II, III, and V. A Level I inspection includes a thorough check of the
driver and the vehicle, including an underneath-the-vehicle inspection. A Level II inspection also
examines the driver, but the inspector only walks around the vehicle to search for defects and does not
examine underneath. A Level III inspection only examines the driver. Finally, a Level V inspection is
conducted on a vehicle at the carrier’s terminal or place of business.
Additional safety activities performed by the states include educational contacts and compliance
reviews. Educational contacts replaced what were termed “safety reviews” and a carrier is no longer
assigned a safety rating during this procedure. It is used to simply provide educational and technical
assistance to the motor carrier. A compliance review, however, is an audit of required records which
includes a process to measure a carrier’s compliance with the safety regulations and apparent risk to

2
highway safety. A sampling process is used to measure violation severity and help determine the best
corrective approach. Compliance reviews result in safety fitness ratings, voluntary compliance programs
or legal enforcement action.
Data obtained from compliance reviews and roadside inspections of motor carriers are input (or
uploaded from a computer) by the states locally into an information system termed SafetyNet. The states
then transmit relevant data for interstate carriers electronically to the Motor Carrier Management
Information System (MCMIS) at FHWA Headquarters.
It has long been realized that there is a distinct relationship between the results of roadside
inspections, the results of safety/compliance reviews, and accident rates. In several studies conducted at
the Upper Great Plains Transportation Institute and by other researchers, it has been found that a
company's inspection out-of-service (OOS) rate is correlated both with the safety/compliance fitness
rating they have and their accident rate. Specifically, those carriers with high OOS rates are more likely
to have conditional or unsatisfactory ratings and higher accident rates.
Considering these facts, one has to realize the wealth of information that can be obtained from
knowledge of a company's inspection OOS rate. This OOS rate is determined by dividing the number of
vehicles or drivers placed out-of-service in a specific time period as a result of a roadside inspection by
the number of roadside inspections conducted in that time period. It can be an excellent indicator of a
company that may have some safety problems and must be examined closer. However, to calculate this
rate, the company has to have had an acceptably representative number of roadside inspections in an
acceptably recent time period. Three roadside inspections in a two-year period, although viewed to be too
few by some, is generally accepted to be sufficient. Although many companies have met this three-
inspection criterion (in fact some have far exceeded it), there are still many more that have not.
A casual analysis of the MCMIS data from a recent two-year period (June 1994 to June 1996)
shows the number of carriers listed as active during this time period was 372,841 57.6 percent
(214,909) had zero roadside inspections. However, based on a field survey conducted in January 1994, it

3
was estimated that about 50 percent of these carriers with zero roadside inspections were not actually
active carriers. This would bring the real number of active carr iers with zero roadside inspections down
to 107,455 and the total number of active carriers to 265,386. Therefore, 40.5 percent (107,455) of
carriers had zero roadside inspections in that time period. An additional 73,084 carriers (27.5 percent)
had only one or two roadside inspections.
Thus, using the criterion of three or more roadside inspections, an OOS rate cannot be reliably
determined for approximately two-thirds of all carriers. Conversely, in that same two-year period, there
were 152 carriers with more than 1,000 roadside inspections, 57 carriers with more than 2,000 roadside
inspections, 10 carriers with more than 5,000 roadside inspections, and two carriers with more than
10,000 roadside inspections. It has been shown that these carriers have lower OOS rates on average than
the rest of the population. Thus, it seems logical to divert some of the inspection resources away from
these carriers toward carriers with a worse safety performance history or those that have little or no
information. In fact, Congress mandated a system, as part of the 200 MCSAP site project, to reduce
oversampling of carriers for inspections and better distribute the inspections among carriers.
PURPOSE AND DEFINITION OF THE ISS
A possible solution to the aforementioned problems is an Inspection Selection System (ISS),
which is available as an aid to the inspector at the roadside. The main purpose of the ISS is twofold to
target those carriers with the worst past safety performance and to reduce the oversampling of some
carriers and the undersampling of others at the roadside.
The ISS serves as a tool to help the inspector select the “best” commercial vehicles/drivers to
inspect based on several carrier characteristics. These variables presently include:
1. The OOS rate (vehicle and driver) of the company,
2. The company's current safety compliance fitness rating, and

4
3. The number of previous roadside inspections (vehicle and driver) the carrier has had
relative to their size (as measured by power units and drivers).
How these variables are used is explained in detail in a following section, but basically the
system highly recommends an inspection for those carriers with unsatisfactory safety compliance fitness
ratings, high OOS rates, and/or very few previous roadside inspections relative to their size. Once a
carrier has been recommended for inspection, the system also may recommend to the inspector specific
regulatory areas to concentrate on based on previous OOS violations.
It must be stressed that the ISS simply makes a recommendation. The inspector always is able to
make the final decision. This is especially important in cases where there is an obvious defect present or
a valid Commercial Vehicle Safety Alliance (CVSA) decal, which indicates that a Level I roadside
inspection was conducted on that vehicle in the past three months.
DEVELOPMENT OF THE ISS
The development of the ISS was guided by the Roadside Technology Technical Working Group
(TWG), which consisted of representatives from states involved in testing high-technology solutions to
roadside inspection problems. The TWG operated under the leadership of the Department of
Transportation (DOT), Federal Highway Administration (FHWA), Office of Motor Carriers (OMC),
Field Systems Group (FSG), and consisted of representatives from the states of Alabama, Connecticut,
Idaho, Kansas, Michigan, Nebraska, New Mexico, Ohio, Virginia, and Wyoming.
The first proposed ISS algorithm was presented to the TWG July 1994. This algorithm was
developed by examining frequency distributions and placing more emphasis on those carriers with few or
no previous roadside inspections relative to their size. Additional emphasis was added if they then also
had higher OOS rates than average and/or unsatisfactory or conditional safety compliance fitness ratings.
To accomplish this, several methods were first examined before arriving at a reasonable technique.

5
The initial method considered was an “expert” approach. This involved simply speaking with
experts in the field (i.e., safety investigators, roadside inspectors) and seeking their opinions on how
carriers with different attributes should be rated in terms of probability of a roadside inspection. This
technique proved to be difficult for people to quantify their intuitive thoughts in a way that could lead to
a workable algorithm.
The second approach was to examine the nationwide mean and standard deviation of the
inspections per power unit/driver and vehicle/driver OOS rate variables. It was envisioned that carriers
would then have their individual mean on these variables compared to the overall nationwide mean and
be rated based on how many standard deviations above or below the overall mean they fell. This
approach also proved fruitless as the overall variation in these variables was too large to be useful for use
with individual carriers. This was the case even when the variables were divided into size categories.
The third and current approach involves examining nationwide distribution tables for the
inspection per power unit/driver variables by size, and the vehicle/driver OOS rate variables overall.
Carriers are then rated depending on how many percentile points above or below the nationwide median
(50th percentile) they fall. At first, carriers received higher inspection values (the higher the inspection
value, the higher the probability that the particular vehicle should be inspected) the more percentile
points below the median overall inspection rates in their size category they fell. Then, if the carrier’s
OOS rates fell above the nationwide median, even higher inspection values were assigned.
Unfortunately, running a sample of carriers through this initial algorithm revealed that there was little
variation in the inspection values assigned. It was determined that this was due to the percentile groups
being too close together as the initial algorithm was assigning values based on every tenth percentile
group. So, the algorithm was adjusted to assign values based on every fifth percentile group and this
provided a much improved degree of variation.
Once the Technical Working Group approved of the concept of the ISS and its basic principles as
described above, a smaller focus group was formed to act as an “expert panel” to calibrate and finalize

6
the ISS algorithm. This was completed by having each member submit approximately 20 carriers, which
they had some detailed safety performance knowledge of, for analysis using the initial ISS algorithm.
The focus group then met to determine if the system was ranking the carriers in a logical and intuitive
sequence and to adjust it accordingly. This intuition comes from the expert knowledge this group has
attained by working as and/or with roadside inspectors and safety investigators directly or indirectly over
many years.
It quickly was realized at this meeting that the ISS was putting too much emphasis on carriers
with little or no data available about them. Consequently, some carriers, which the members considered
to be “worse than average,” were receiving inspection values they thought were too low simply because
they had many previous inspections. After a discussion where the main goals of the ISS had priority, it
was decided that carriers with a known poor past safety performance should be ranked higher than those
where there was little information available. From this decision, the ISS was adjusted so emphasis was
first placed on those with the highest OOS rates (based on percentile) and/or unsatisfactory or
conditional safety compliance fitness ratings. Then, further emphasis was placed on those with few
inspections relative to their size. Those carriers with too little or no data available still received
somewhat high inspection values, but with an additional explanation that it was due to the little data
available, not necessarily because they are a “worse” carrier.
The focus group agreed with the percentile approach, as previously described, and some time
was spent discussing the values to be assigned based on the percentile groups the carrier falls into.
Several iterations of frequency distributions were run to create ISS values on the representative carriers
using several sets and combinations of values the group came up with. Each of these was examined until
it was believed that the ISS algorithm was ranking the carriers in the intuitively “correct” order with the
right amount of variation between them. During this process, it was decided to increase the number of
size categories from four to seven to achieve a more desirable degree of variation.

7
The actual algorithm developed, with a few minor modifications, is described in detail below and
is the one that is currently in use throughout the United States.
DETAILED EXPLANATION OF THE ISS
The OMC Field Systems Group, in close association with the Upper Great Plains Transportation
Institute, integrated the Inspection Selection System in the Roadside Driver/Vehicle Inspection software
program titled Aspen. The Aspen system includes software to help conduct roadside commercial
vehicle/driver inspections with portable microcomputers, including hand-held pen-computers. Aspen
includes electronic transfer of inspection results, and electronic access to carrier safety performance data
and commercial driver license status data. Aspen was officially released January 1995 and widely
implemented in summer 1995. For a detailed description of Aspen, please contact the Field Systems
Group at 303-969-5140, ext. 407. A standalone Windows version of the ISS has been developed, as well
as a Windows version of Aspen containing the ISS, which was released early 1996. Whether as part of
Aspen or as a standalone, the ISS algorithm is the same.
The software is designed to operate with either the full MCMIS carrier database or a subset
targeted to a specific geographical area. The FHWA/OMC offers a CD-ROM database and specialized
software (entitled RIDGE) for easily creating this ISS subset database if desired. Each computer that is
using the software contains an internal carrier database. This database includes the carrier's name,
address, ICC number, DOT number, and the information crucial to calculating the carrier's ISS
inspection value, such as vehicle and driver out-of-service rate, carrier safety compliance fitness rating,
total number of drivers/power units, number of previous roadside inspections, etc. The ISS has been
designed to automatically calculate each field required and assign an inspection value. The database is
refreshed periodically to ensure that the carrier data contained in the computer is current and accurate.

8
Description of the Standalone Windows ISS
A description of the standalone Windows ISS follows. This version is intended for use as a
standalone system on desktop or laptop computers at fixed sites (i.e., scale houses, ports of entry, etc.).
The first screen to appear when the program is activated is the Inspection Selection System Main
screen (Figure 1). The inspector at the roadside then enters the Department of Transportation (DOT) or
Interstate Commerce Commission (ICC) number usually found on the side of the commercial vehicle. If
a match is found, the ISS will display the carrier’s name, address, and current ISS inspection value. A
recommendation also is given according to the following formula:
Inspection Value Recommendation
90 - 100 Inspect -- Clearly an inspection is warranted
80 - 89 Optional -- Inspection would probably be worthwhile
Below 80 Pass -- An inspection would be of limited value
Obviously, local judgement also should be used. Factors to consider are: (1) Does the carrier
have a CVSA decal or evidence of a recent inspection? (2) Is there visual evidence of possible vehicle
defects? (3) What is the nature of the cargo and trip? (4) How many inspections is the ISS analysis based
on? (5) How long has it been since the last ISS database refresh?
The current distribution of ISS inspection values for the entire motor carrier population is
illustrated in the following table. Inspect/do not inspect decision thresholds might change from one
location to another since each site has a unique carrier population. For example, if a particular site was
observing mostly vehicles with ISS values in the eighties range, the inspector would select a vehicle with
a value of 88 over one that had a value of 82. Similarly, if the site was observing a wide range of values,
the inspector may choose a vehicle with a value of 90 or greater over one with a value in the seventies or
eighties.

9
ISS Value Distribution
ISS Value
Number of
Carriers
Percent of
Carriers
Number of
Vehicles
Percent of
Vehicles
Below 80 (Pass) 37,707 10.1% 759,114 32.5%
80 - 89 (Optional) 148,681 39.9% 617,700 26.4%
90 - 100 (Inspect) 186,453 50.0% 962,143 41.1%
Total 372,841 100.0% 2,338,957 100.0%
As shown in the table, although only about 10 percent of the carriers have an ISS value below 80
(i.e., “Pass”), they represent about one-third of all the vehicles recorded in the MCMIS. This is because a
few of the larger carriers have low ISS values, while some of the smaller ones (and also those with no
power unit information) have high ISS values. In addition, the carriers with zero previous inspections
also receive high ISS values. However, it is estimated that about half of these are no longer actually
active. Thus, the number of vehicles observed at the roadside with high ISS values may actually be quite
a bit lower than represented here.
When practical, ISS also will give recommendations for particular areas to concentrate on during
the inspection. Comments about specific violation categories are derived from analysis of violation rates
for the chosen carrier compared to a mean value for similar carriers. Inspectors can activate the Violation
Details screen to see the actual comparison numbers. The expert system recommendations also may
display SafeStat, MCSIP, and no safety performance information messages as appropriate. Note that not
all violation categories are represented by the expert system. For example, there is no category for lights,
since inferring that past light violations is indicative of future light problems is dubious.
In addition, there is access to a notepad on this Main screen for any notes the user wishes to
make.

10
Similar to Aspen, the ISS is designed as a tabbed notebook consisting of four screens. To move
through the screens, inspectors simply click on one of the lower tabs, which will then become the active
tab. The active tabbed page will appear as one screen.
Figure 2 illustrates the History screen of the standalone ISS. This screen displays a log of
previous queries and any related user notes. In the ISS connected with Aspen, this screen is replaced by
an Inspect tab, which transfers the user to the Aspen inspection screens.
A Details screen (Figure 3) also is available to the inspector. This screen provides a variety of
safety performance statistics with comparisons to “baseline” statistics for carriers nationwide. This gives
the inspector the opportunity to understand and gain confidence in the ISS. Specifically, the OOS rates;
inspection rates; safety compliance fitness rating (if available); number of drivers; number of power
units; and number of previous inspections are displayed. This screen also contains a bar graph showing
the distribution of the different type inspections on the carrier. Categories include: Vehicle Inspections,
Driver Inspections, and Inspections involving Hazardous Materials. These categories do not add together
to get the total inspections conducted, as one inspection may involve multiple categories. The idea is to
provide a look at the type of inspections that went into the ISS data. Obviously HM problems or driver
problems based on limited inspections are less significant than decisions based on more data.
Figure 4 illustrates the Violation Details screen mentioned previously. This screen displays how
the particular carrier in question compares to the nationwide averages for specific violations (i.e., brakes,
hours-of-service, HM, etc.). If the carrier has had any particular type of violation more often than the
“average” carrier (displayed on the screen as the “warning threshold”), a message displays on the main
screen to make the inspector aware of this. It should be noted that this screen includes all violations
found in previous inspections, not just OOS violations.
Finally, Figure 5 illustrates the About screen, which is accessed from the help menu. This screen
gives notes about the program, the developers, and how to access the support hotline.

11
It is anticipated that in the future the ISS will be used to screen transponder-equipped vehicles at
mainline speeds. Currently, however, the ISS operates most effectively at locations where many
commercial vehicles/drivers are being stopped or slowed for weighing purposes and several
vehicles/drivers can be rated with ISS inspection values once the inspector is free to conduct an
inspection. However, the ISS is useful even at sites where this selection process is not feasible as it can
be used to automatically identify the carrier and fill in the name and address fields, and recommend
specific areas to examine based on results from previous inspections.
Description of ISS Algorithm
The actual ISS algorithm can be visualized as a type of structured flow chart as shown in
Figure 6. It consists of the following logic steps:
Step 1. After the DOT or ICC number is entered, if no match can be made, the ISS does not
provide any output. A successful match requires a DOT or ICC number, but also requires that the carrier
be included in the local computer's ISS database. As described earlier, each state decides on the content
of their local ISS database, but it should include, at a minimum, all interstate carriers domiciled in the
state, those in adjoining states, all carriers seen by state inspectors in the last three years, and the 5,000
most inspected carriers nationally. This local database is refreshed frequently to ensure inspection
decisions are made with current data.
Step 2. If a match is found, the system automatically displays the carrier name and address. It
then checks to see if the carrier is currently being monitored by the Commercial Vehicle Information
System (CVIS). This is a pilot program the FHWA/OMC currently is sponsoring in cooperation with the
state of Iowa DOT and the Volpe National Transportation Systems Center. The CVIS is being designed
to identify unsafe carriers and encourage them to improve their safety performance or have their
registration privileges revoked. When a carrier is found to be operating unsafely, they are entered into the
Motor Carrier Safety Improvement Process (MCSIP), which regularly evaluates them to see if they are
12
improving. The initial step in the process is to assign a SafeStat score using data obtained from roadside
inspections, compliance reviews, accidents, etc. Depending on this score, it will either lead to a warning
letter stating the carrier will be evaluated over a six-month period for improvement and/or an on-site
audit. The ISS supports CVIS/SafeStat by assigning an ISS inspection value of 100 to carriers currently
in the MCSIP sanctioning process to prioritize them for roadside inspections. This will increase the
amount of data available for the monitoring function. The reader is encouraged to contact any of the
above agencies for more information. If the carrier is not in the MCSIP, the system continues to the next
step.
Step 3. The ISS then checks for a safety compliance fitness rating. If this rating currently is
unsatisfactory, the carrier is assigned an ISS inspection value of 100 and strongly recommended for
inspection. If this rating is conditional, the carrier is assigned a CR value of 90. If this rating is
satisfactory or not available, no CR value is assigned and the system continues to the next step.
Step 4. If the carrier has more than two vehicle and/or driver inspections in the past two years,
the system determines a Vehicle OOS value and/or Driver OOS value for the carrier based on Table 1.
Table 1 illustrates the distribution of OOS rates nationwide by percentile. OOS rates are only determined
if the carrier has had at least three roadside inspections in the previous two years Level I, II, or V for
vehicles and Level I, II, or III for drivers. Examining the Vehicle OOS column at the 80th percentile, for
example, 80 percent of the carriers have a 42.2 percent vehicle OOS rate or below, and 20 percent of
carriers have a vehicle OOS rate above this. Similarly, examining the Driver OOS column at the same
percentile reveals that 80 percent of the carriers have an 18.2 percent driver OOS rate or below, and 20
percent have a driver OOS rate above this. Using this information, carriers are assigned a Vehicle OOS
value of 100 if they have a vehicle OOS rate of 100 percent. For each five percentile points they fall
below this, they receive two points subtracted from 100. Thus, a carrier that falls between the 90th and
95th percentile, a vehicle OOS rate of 57.9 percent to 66.7 percent, would receive a Vehicle OOS value
of 96 (four points subtracted from 100 for the 10 percentile points lower than the 100th percentile). The

13
Driver OOS value is determined in the same manner. These two values, the Vehicle OOS value and the
Driver OOS value, are then averaged to arrive at the OOS Average value. If only the Vehicle OOS value
or the Driver OOS value can be determined due to a lack of enough driver (or vehicle) inspections, the
OOS Average value is simply the value of the variable that can be determined.
Step 5. The Safety Fitness Average value is then assigned as the higher of the CR value (from
step 3) and the OOS Average value (from step 4).
Step 6. If the carrier does not have at least three roadside inspections in the last two years nor
any compliance review, they are assigned an ISS inspection value depending on the size group they fall
into. The largest carriers are assigned a value of 100, then two points are subtracted for each smaller size
group with the smallest carriers assigned a value of 88. This number is displayed with an explanation
stating that there is insufficient data available and an inspection is recommended to gain additional safety
performance knowledge.
Step 7. The system then determines an Inspection per Power Unit value and an Inspection per
Driver value based on Tables 2 and 3 respectively. The Inspection per Power Unit variable is determined
by dividing the number of Level I, II, and V inspections the carrier has had in the previous two years by
the number of power units they indicate. Similarly, the Inspection per Driver variable is determined by
dividing the number of Level I, II, and III inspections the carrier has had in the previous two years by the
number of drivers they indicate. First, the size category is determined as defined in the tables and then
values are assigned based on the percentile group the carrier falls under. Carriers receive higher values
the lower their inspection per power unit and/or driver rate. The value starts at zero when the carrier is at
or above the 50th percentile and then two points are added for each five percentile points below the 50th
percentile they fall. For example, a carrier with 14 power units (size category three) and an inspection
per power unit rate between 0.100 and 0.134, between the 35th and 40th percentile, would receive an
Inspection per Power Unit value of six (two points for each of the five percentile points lower than the
50th). The Inspection per Driver value would be determined similarly. The Inspection Average value is
14
then the average of these two values the Inspection per Power Unit value and the Inspection per
Driver value. As previously, if one of the values is unable to be determined, the Inspection Average
value is simply the value of the variable which can be determined.
Step 8. The final ISS inspection value, which is displayed is calculated by adding the Safety
Fitness Average value (from step 5) and the Inspection Average Value (from step 7) with a maximum
value of 100. A recommendation legend also is displayed with an option to see additional information on
how the carrier compares to others nationwide.
TESTING AND REFINEMENT OF THE ISS
ISS demonstration software prepared by the OMC Field Systems Group was presented at the
Technical Working Group (TWG) meeting in February 1995 for review by the group. The first on-site
testing of the system began in New Mexico and Virginia in May 1995. Additional states began testing
the system in fall 1995, with new states acquiring the system more recently. Results from the initial
testing are described below, with more recent testing results described subsequently.
Much time and effort went into the development of the ISS and just as much, if not more, time
and effort were devoted to the testing and evaluation of the system. A good experimental design and plan
for the testing of the ISS were in place before the actual testing began. This was important to ensure that
the testing revealed the areas where the ISS is working and also the areas where it may need to be refined
or adjusted. Continued communication with the TWG members was essential during the testing phase.
The refinement process also is an important step in the movement toward a completed final
system. It must take into account measurable variables that go into the actual algorithm, but also
subjective variables that may influence the results. These variables could include the inspectors’ attitudes
or feelings about the system, or even their correct interpretation of its output. These outside influences on
how the ISS works were identified before considering any modifications to be made. This is the area
where the TWG members were especially helpful.

15
There are several fundamental guidelines that are routinely used to design an experiment. These
are as follows, with explanations as to their applicability to the ISS.
Recognition and statement of the problem. This is an important first step that involves everyone
in trying to solve the same problem. As discussed previously, the problem that generated the ISS is
actually twofold. One problem is that there are many carriers with fewer than three roadside inspections
conducted on them in any given two-year period. This results in an inability to compute reliable OOS
rates, which are helpful in determining the safety fitness of a carrier, for these carriers. The second part
of the problem is that too many inspections are continually conducted on carriers with good safety
records (low OOS rates, satisfactory ratings) when these resources could be better allocated toward those
carriers with worse safety records (high OOS rates, unsatisfactory or conditional ratings).
Choice of factors and levels. One must choose the factors to be varied in the experiment, the
ranges over which they will be varied, and the specific levels at which experimental runs will be made.
For the current experiment, the only factor to be varied was the use of the ISS. Data were collected for
inspections where the ISS was in use (i.e., recommended the inspection) and also for when the ISS was
not used.
Selection of the response variable. There are several response variables to be measured and
compared in this experiment. These are as follows: (1) the average OOS rates (vehicle and driver) of
carriers stopped, (2) the average inspection rates of carriers stopped, (3) the percentage of carriers
stopped with certain safety compliance fitness ratings, and (4) the percentage of carriers stopped with
fewer than three previous roadside inspections. It was expected that the average OOS rates of the carriers
stopped would increase, the average inspection rates of the carriers stopped would decrease, the
percentage of carriers stopped with unsatisfactory or conditional ratings would increase, and the
percentage of carriers stopped with fewer than three previous roadside inspections also would increase
with use of the ISS. It was expected that all of these changes would or would not be detected depending

16
on how well the ISS was accomplishing its stated goals. Thus, the ISS may need to be adjusted to better
meet these goals.
Choice of experimental design. The design for the experiment consisted of collecting data for a
time period prior to the implementation of the ISS and also for a time period during the ISS
implementation. Data were collected from different inspection sites available in many states. The first
testing phase primarily was considered a pilot test and involved two states. This test was used to validate
the ISS and determine the exact mechanics of its implementation. The data for each inspection conducted
consist of the following items: (1) the site and inspector identification, (2) the carrier DOT or ICC
number of the vehicle stopped from this information, one can attain the current compliance rating of
the carrier, its current vehicle/driver OOS rates and inspection rates, (3) the current date of the
inspection, (4) the level of inspection conducted, (5) the facility, fixed or roadside, where the inspection
was conducted, and (6) an indication if the driver/vehicle was placed OOS as a result of the inspection.
An additional data item collected after the ISS was in use was the ISS value for the carrier
inspected. The inspectors also were asked for their opinion of the ISS and for any suggestions they may
have to improve it. This was accomplished via an evaluation form.
Performing the experiment. The experiment should be monitored carefully while it is running to
ensure that it is operating according to design. Checks were made that the inspectors were attempting to
use the system whenever possible and that they were interpreting it correctly. Careful training before the
implementation of the ISS helped in this area. It also was checked that all the data needed for analysis
were being correctly and consistently collected.
Data analysis. Statistical methods were used to analyze the data so that conclusions are objective
as much as possible.
Conclusions and recommendations. After the experiment is completed, one must draw practical
conclusions about the results. Knowledge of the inspection process and any extraneous variables that
could have possibly influenced the results are helpful. Input from the inspectors also aids in this

17
conclusion process. Additionally, follow-up runs and confirmation testing are highly desirable to validate
any conclusions that are made. This is why different experimental runs are conducted.
Results from the First Phase Testing
As previously mentioned, two states, Virginia and New Mexico, began testing the system in May
1995. Due to the small amount of data available from New Mexico during the initial testing, analysis
only was conducted from the Virginia data. The procedure and results of this analysis follow.
Data were collected from roadside inspections conducted in Virginia both before and after the
ISS implementation. Data were collected from roadside inspections conducted with portable computers
using Aspen during the time period of December 1994 through April 1995. This consisted of 371
inspections. Data were then collected from inspections conducted with portable computers using Aspen
with ISS during the time period of May 1995 through September 1995. This data consisted of 508
inspections.
Performing an analysis comparing these two data sets overall reveals that the mean driver and
vehicle out-of-service rates of the carriers whose vehicles were stopped did increase from the pre-ISS
inspections to the post-ISS inspections as expected. The mean driver OOS rate of carriers whose vehicles
were stopped pre-ISS was 6.8 percent, and post-ISS was 7.7 percent. Similarly, the mean vehicle OOS
rate of carriers whose vehicles were stopped pre-ISS was 24.9 percent, and post-ISS was 25.5 percent.
However, conducting a statistical analysis on these differences revealed that they were not statistically
significant.
Similar analysis was conducted on the inspection rates of the carriers stopped before and after
the ISS. Again, the differences were not statistically significant; and although the inspection per power
unit rates of the carriers stopped decreased in the post-ISS inspections as expected, the inspection per
driver rates actually increased.
18
Although only a small percentage of the carriers stopped had a safety compliance fitness rating,
it was found that the percentage of carriers stopped with conditional or unsatisfactory ratings did not
increase as expected. Similarly, the percent of carriers stopped with less than three roadside inspections
also did not increase as expected.
A further analysis of the data reveals some possible explanations for the above results. The ISS
inspection values were collected for the carriers that were inspected. These values reveal that only 137 of
the 508 post-ISS inspections (27 percent) received an ISS inspection value. This may be due to the initial
database containing too few carriers so that many non-matches were occurring. Further, the ISS
inspection values ranged from very low to very high, so even those carriers that were not recommended
for inspection were inspected. Although inspectors were told to try to follow the system’s
recommendations as much as possible, they may have been inspecting carriers with different ranges of
ISS inspection values in order to “try out” the system.
Thus, to get a better idea of the impact of the ISS, an analysis was run comparing pre-ISS
inspection results to only those post-ISS inspections, which had an ISS inspection value of 80 or above.
There were 45 inspections conducted on carriers with an ISS inspection value of 80 or greater these
carriers had a mean driver OOS rate of 8.4 percent and a mean vehicle OOS rate of 34.7 percent. Both of
these rates are notably higher than those of the pre-ISS carriers inspected; and the difference in the
vehicle OOS rates is statistically significant at a significance level of 0.0001. As above, the inspection
rates did not show a significant difference when comparing these two data sets. However, the percentage
of carriers stopped with less than three roadside inspections and also those stopped with conditional or
unsatisfactory safety compliance fitness ratings did increase as expected.
A similar analysis of those inspections of carriers which received an ISS inspection value of 85
or greater revealed the same conclusions as above, but to a greater degree. In this comparison, the
differences between the driver and vehicle OOS rates were statistically significant for both.

19
Results from the Second Phase Testing
Sufficient data were available from Ohio and Wyoming from inspections conducted in fall 1995.
Although pre-ISS data were not available for these states, there was sufficient post-ISS data to draw
additional conclusions to the above.
In the case of Ohio, approximately 70 percent of the inspections conducted fall 1995 using Aspen
with ISS received an ISS value. This is substantially higher than the percentage noted in Virginia and
may be due to a larger carrier database. However, similar to Virginia, inspections were conducted across
the entire range of ISS values. Specifically, there were 1,431 inspections conducted that had ISS values.
Of these, 814 (57 percent) had ISS values equal to or greater than 80 and 617 (43 percent) had values less
than 80.
Thus, as pre-ISS data were unavailable, an analysis was completed between inspections with
values less than 80 and with values equal to or greater than 80. This will give an idea of the benefits that
could have been realized had inspections only been conducted on those vehicles with values greater than
80. The following table relates the findings for this comparison.
Examining the table, there were significant differences in carrier characteristics between carriers
that received an ISS value of 80 or above and carriers below that level. The out-of-service rates of
carriers with ISS values greater than or equal to 80 were significantly higher than carriers with values
less than 80. Similarly, inspection rates were notably lower for carriers with higher ISS values.
Additionally, the percentages of carriers with unsatisfactory or conditional compliance ratings and also
for carriers with less than three previous roadside inspections were notably higher for the higher ISS
value group. These findings seem to demonstrate the substantial benefits that could be realized by
focusing inspection efforts on carriers with higher ISS values.

20
Carrier-Specific Comparison Data for Vehicles/Drivers Inspected in Ohio Fall 1995
CategoryISS Value < 80
(n=617)ISS Value >= 80
(n=814) Significance Level
Driver OOS Rate n=608 6.9% n=767 11.7% 0.0001
Vehicle OOS Rate n=607 14.5% n=767 32.8% 0.0001
Inspections per Power Unit n=589 5.58 n=772 3.44 0.1971
Inspections per Driver n=583 6.17 n=767 4.07 0.2756
Unsat or Cond Rating 11/317 3.5% 128/472 27.1%
< 3 vehicle inspections n=10 1.6% n=47 5.8%
< 3 driver inspections n=9 1.5% n=47 5.8%
For comparative purposes, a similar analysis was completed on the data available for Wyoming.
Data from inspections conducted using Aspen with ISS in fall 1995 revealed that approximately 60
percent received ISS values. Again this was notably higher than the results realized in Virginia, but
slightly lower than Ohio. Of these 149 inspections, 86 (58 percent) were conducted on carriers with ISS
values greater than or equal to 80, and 63 (42 percent) on carriers with values below 80.
Examining the following table with the data for Wyoming illustrates the same results as for
Ohio. Again the out-of-service rates are significantly higher for carriers with the higher ISS values, and
the inspection rates are notably lower. Similarly, the percentage of carriers with unsatisfactory or
conditional ratings and also carriers with less than three previous inspections is substantially higher for
those with higher ISS values. These results again lend support to the conclusion that concentrating
inspection resources on carriers with higher ISS values will result in substantial benefit.
In addition, although a notable increase occurred in the Ohio data, a substantial increase was
observed in Wyoming in the percent of carriers inspected with less than three previous inspections
between carriers with ISS values less than 80 and above 80. Namely, the number of vehicle inspections
of carriers with less than three previous inspections jumped 918 percent, and the number of driver
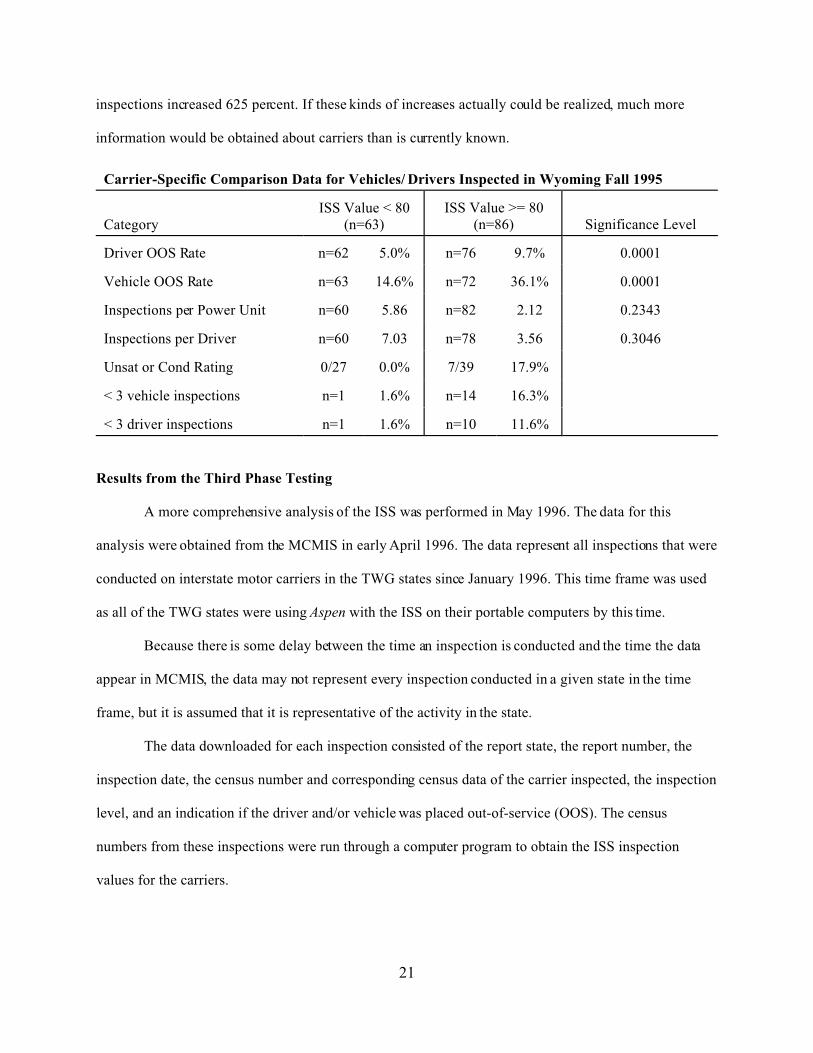
21
inspections increased 625 percent. If these kinds of increases actually could be realized, much more
information would be obtained about carriers than is currently known.
Carrier-Specific Comparison Data for Vehicles/ Drivers Inspected in Wyoming Fall 1995
CategoryISS Value < 80
(n=63)ISS Value >= 80
(n=86) Significance Level
Driver OOS Rate n=62 5.0% n=76 9.7% 0.0001
Vehicle OOS Rate n=63 14.6% n=72 36.1% 0.0001
Inspections per Power Unit n=60 5.86 n=82 2.12 0.2343
Inspections per Driver n=60 7.03 n=78 3.56 0.3046
Unsat or Cond Rating 0/27 0.0% 7/39 17.9%
< 3 vehicle inspections n=1 1.6% n=14 16.3%
< 3 driver inspections n=1 1.6% n=10 11.6%
Results from the Third Phase Testing
A more comprehensive analysis of the ISS was performed in May 1996. The data for this
analysis were obtained from the MCMIS in early April 1996. The data represent all inspections that were
conducted on interstate motor carriers in the TWG states since January 1996. This time frame was used
as all of the TWG states were using Aspen with the ISS on their portable computers by this time.
Because there is some delay between the time an inspection is conducted and the time the data
appear in MCMIS, the data may not represent every inspection conducted in a given state in the time
frame, but it is assumed that it is representative of the activity in the state.
The data downloaded for each inspection consisted of the report state, the report number, the
inspection date, the census number and corresponding census data of the carrier inspected, the inspection
level, and an indication if the driver and/or vehicle was placed out-of-service (OOS). The census
numbers from these inspections were run through a computer program to obtain the ISS inspection
values for the carriers.

22
Using the report numbers, inspections that were conducted using portable computers were
separated from inspections without use of the portable computer. Normally, a state identified their
portable computer inspections by using two alpha characters after their state abbreviation in the report
number for the inspection. The following analysis is for inspections conducted using portable computers,
as these are the only ones for certain that would have received an ISS inspection value and
recommendation for the inspector.
There were 22,309 roadside inspections conducted in the 10 TWG states from January 1996
through March 1996. Slightly more than 34 percent (n=7,649) of these were conducted with portable
computers. Ohio conducted about 90 percent of its inspections on portable computers, Connecticut and
Idaho conducted about 75 percent, Kansas about 50 percent, Wyoming about 30 percent, and the
remainder conducted fewer than this amount on portable computers. The computer system matched and
calculated ISS inspection values for slightly more than 93 percent of the carriers inspected with the use
of portable computers. Thus, the following analysis is based on a total of 7,142 inspections.
Carrier-Specific Analysis
As in the previous testing, to determine if the ISS system was recommending the desired “types”
of carriers for inspection, an analysis was completed on the differences in carrier characteristics between
those that were recommended for inspection versus those that were not. It was expected that the average
OOS rates of the carriers recommended for inspection should be higher, the average inspection rates
should be lower, and the percentage of carriers recommended that had fewer than three previous roadside
inspections should be higher than carriers not recommended for inspection.
The average driver OOS rate was determined by dividing the number of inspections where the
driver was placed OOS plus the number of inspections where both the driver and vehicle were placed
OOS by the number of Level I, II, and III inspections that were conducted on the carrier in the previous
two years. The average vehicle OOS rate was determined by dividing the number of inspections where

23
the vehicle was placed OOS plus the number of inspections where both the driver and vehicle were
placed OOS by the number of Level I, II, and V inspections that were conducted on the carrier in the
previous two years.
Considering carrier-specific data about the carriers stopped for inspection, there was a significant
difference (p-value<0.0001) in the driver OOS rates of carriers stopped for inspection with ISS
inspection values greater than 80 (i.e., recommended for inspection) versus those stopped with ISS
inspection values less than 80. On average, carriers recommended for inspection had an 11 percent driver
OOS rate; while carriers not recommended for inspection had a 7 percent driver OOS rate on average.
Similarly, there was a significant difference (p-value<0.0001) in the vehicle OOS rates. Carriers
recommended for inspection had a 34 percent vehicle OOS rate on average, compared with a 15 percent
vehicle OOS rate on average for those carriers not recommended for inspection.
Examining the overall differences in the inspection rates of the carriers stopped, there was a
significant difference in the inspections per power unit and inspections per driver rates (p-value=0.0053
and p-value=0.0097 respectively) between carriers recommended for inspection and those which were
not. The inspections per power unit rate was calculated by dividing the number of Level I, II, and V
inspections the carrier had in the previous two years by the number of power units they operate.
Similarly, the inspections per driver rate was calculated by dividing the number of Level I, II, and III
inspections the carrier had in the previous two years by the number of drivers they employ. As desired,
the inspection rates were significantly lower for those carriers recommended for inspection (i.e., the
carriers the system recommended for inspection were on the average inspected significantly less often
than carriers not recommended for inspection).
Considering the difference in the number of inspections conducted on carriers with fewer than
three previous inspections and carriers recommended for inspection (ISS inspection value greater than
80) and carriers that were not, the results show that 6.4 percent (n=228) of the inspections conducted on
carriers with ISS inspection values greater than 80, were on carriers with fewer than three previous
24
inspections. This compares to 1.0 percent (n=34) of the inspections that were conducted on carriers with
less than three previous inspections when the ISS did not recommend the inspection.
All the above results clearly illustrate that the ISS will be quite successful in meeting its goals as
the inspectors begin to follow recommendations more often.
Actual Inspection OOS Rate Analysis
As a point of interest, an additional analysis was completed to compare actual OOS rates
realized for vehicles/drivers stopped when the ISS recommended the inspection versus when it did not.
The authors wanted to know if more vehicles and drivers would be put OOS when the ISS recommended
the inspection based on carrier characteristics.
Uniformly across the states, about 50 percent of the inspections conducted on portable computers
were on carriers with ISS inspection values greater than 80 (i.e., an inspection was recommended) and 50
percent were on carriers with values less than 80. One reason for this occurrence is that in some states
inspections must be done by random selection. However based on the ISS results described below, at
least one state, Ohio, is moving to modify that policy and focus inspections toward carriers with high ISS
inspection values. It is hoped that in other states the percentage of inspections conducted on carriers with
values greater than 80 will increase over time as inspectors gain confidence in the system.
The actual driver OOS rate was determined by dividing the number of inspections where the
driver was placed OOS plus the number of inspections where both the driver and vehicle were placed
OOS by the number of Level I, II, and III inspections that were conducted in the three-month time frame.
The actual vehicle OOS rate was determined by dividing the number of inspections where the vehicle
was placed OOS plus the number of inspections where both the driver and vehicle were placed OOS by
the number of Level I, II, and V inspections that were conducted in the three-month time frame. Finally,
the total OOS rate was determined by dividing the number of inspections where the driver and/or vehicle
was put OOS by the total number of inspections conducted in the three-month time frame.
25
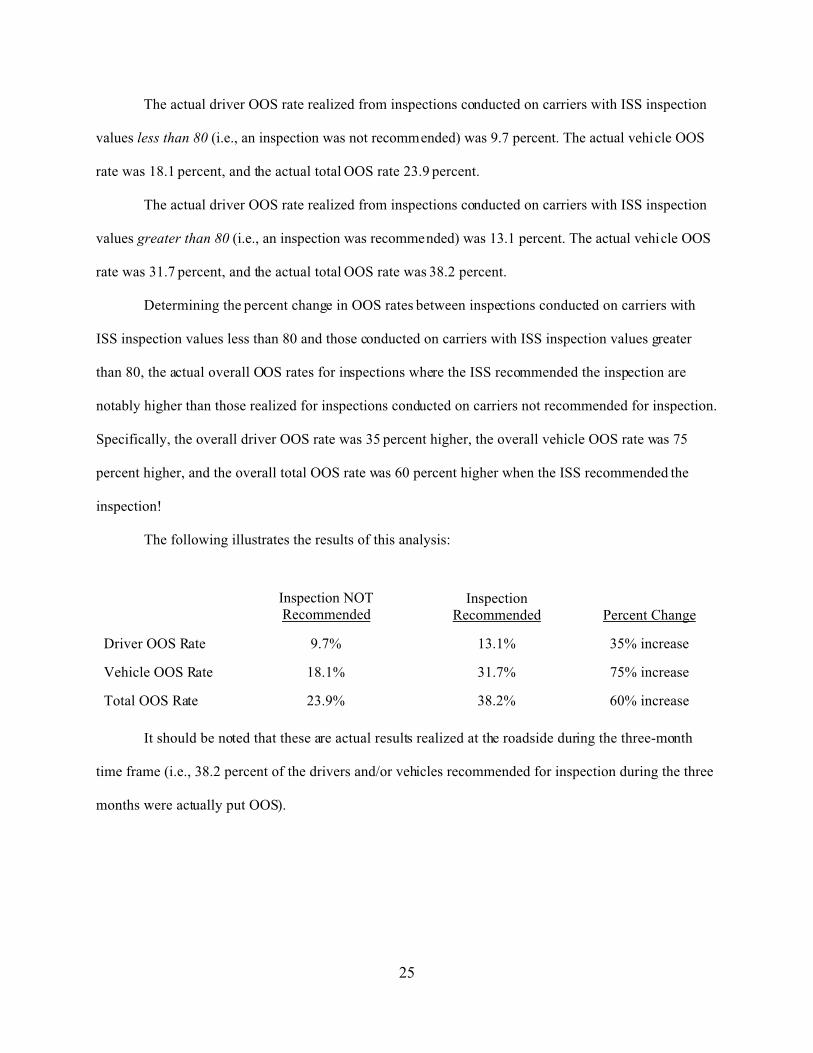
The actual driver OOS rate realized from inspections conducted on carriers with ISS inspection
values less than 80 (i.e., an inspection was not recommended) was 9.7 percent. The actual vehicle OOS
rate was 18.1 percent, and the actual total OOS rate 23.9 percent.
The actual driver OOS rate realized from inspections conducted on carriers with ISS inspection
values greater than 80 (i.e., an inspection was recommended) was 13.1 percent. The actual vehicle OOS
rate was 31.7 percent, and the actual total OOS rate was 38.2 percent.
Determining the percent change in OOS rates between inspections conducted on carriers with
ISS inspection values less than 80 and those conducted on carriers with ISS inspection values greater
than 80, the actual overall OOS rates for inspections where the ISS recommended the inspection are
notably higher than those realized for inspections conducted on carriers not recommended for inspection.
Specifically, the overall driver OOS rate was 35 percent higher, the overall vehicle OOS rate was 75
percent higher, and the overall total OOS rate was 60 percent higher when the ISS recommended the
inspection!
The following illustrates the results of this analysis:
Inspection NOTRecommended
InspectionRecommended Percent Change
Driver OOS Rate 9.7% 13.1% 35% increase
Vehicle OOS Rate 18.1% 31.7% 75% increase
Total OOS Rate 23.9% 38.2% 60% increase
It should be noted that these are actual results realized at the roadside during the three-month
time frame (i.e., 38.2 percent of the drivers and/or vehicles recommended for inspection during the three
months were actually put OOS).

26
Results from the Fourth Phase Testing
To confirm the dramatic results discussed above, a final analysis was completed in early
September 1996. This analysis involved all roadside inspections conducted in the TWG states from
January 1996 through August 1996. As before, these data were downloaded from MCMIS.
There was a total of 103,842 roadside inspections conducted in the 10 TWG states during the
eight-month period. Of these, 41.6 percent (n=43,188) were conducted on portable computers. The
majority of this increase in the amount of inspections conducted on portable computers can be attributed
to Nebraska who increased their portable computer usage from about 9 percent in the previous analysis
to nearly 42 percent in the current analysis. The remaining states' percentages were similar to before,
with Ohio still using the portable computers the greatest percentage of the time (approximately 90
percent), followed by Connecticut with 80 percent.
Slightly more than 92 percent of the carriers inspected with portable computers had an ISS value
associated with them. Thus, the following analysis is based on a total of 39,819 inspections.
There were 20,031 inspections conducted on carriers with ISS values greater than 80 (the
inspection was recommended). Of these, 7,674 (38.3 percent) resulted in an out-of-service vehicle, driver
or both. Dividing the number of drivers and vehicles placed out-of-service by their respective inspections
yielded a total of 33.7 percent of the vehicle inspections resulting in a vehicle OOS, and 13.5 percent of
the driver inspections resulting in a driver OOS.
The remainder of the inspections (n=19,788) were conducted on carriers with ISS values less
than 80. Of these, 4,910 (24.8 percent) resulted in an OOS vehicle, driver, or both. Of the vehicle
inspections, 20.0 percent resulted in an OOS vehicle, and of the driver inspections, 9.9 percent resulted in
an OOS driver.
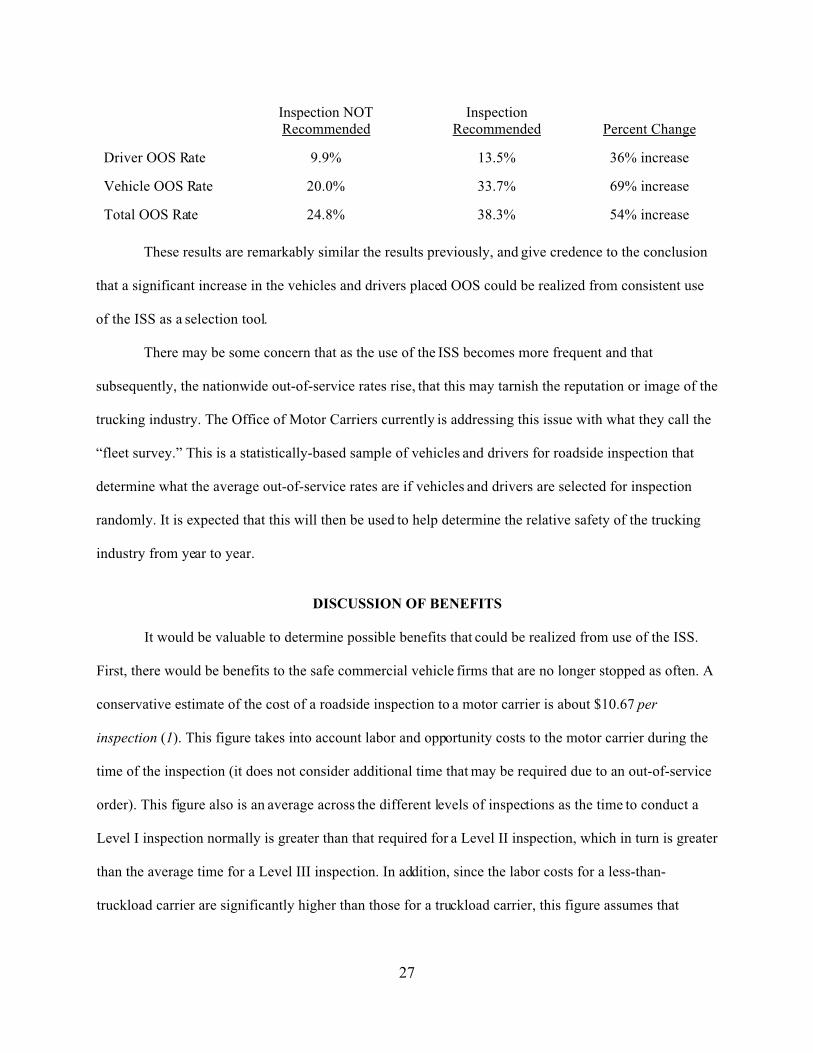
The following table illustrates these results and the corresponding percentage change in the OOS
rates between when inspections were recommended and when they were not.
27
Inspection NOTRecommended
InspectionRecommended Percent Change
Driver OOS Rate 9.9% 13.5% 36% increase
Vehicle OOS Rate 20.0% 33.7% 69% increase
Total OOS Rate 24.8% 38.3% 54% increase
These results are remarkably similar the results previously, and give credence to the conclusion
that a significant increase in the vehicles and drivers placed OOS could be realized from consistent use
of the ISS as a selection tool.
There may be some concern that as the use of the ISS becomes more frequent and that
subsequently, the nationwide out-of-service rates rise, that this may tarnish the reputation or image of the
trucking industry. The Office of Motor Carriers currently is addressing this issue with what they call the
“fleet survey.” This is a statistically-based sample of vehicles and drivers for roadside inspection that
determine what the average out-of-service rates are if vehicles and drivers are selected for inspection
randomly. It is expected that this will then be used to help determine the relative safety of the trucking
industry from year to year.
DISCUSSION OF BENEFITS
It would be valuable to determine possible benefits that could be realized from use of the ISS.
First, there would be benefits to the safe commercial vehicle firms that are no longer stopped as often. A
conservative estimate of the cost of a roadside inspection to a motor carrier is about $10.67 per
inspection (1). This figure takes into account labor and opportunity costs to the motor carrier during the
time of the inspection (it does not consider additional time that may be required due to an out-of-service
order). This figure also is an average across the different levels of inspections as the time to conduct a
Level I inspection normally is greater than that required for a Level II inspection, which in turn is greater
than the average time for a Level III inspection. In addition, since the labor costs for a less-than-
truckload carrier are significantly higher than those for a truckload carrier, this figure assumes that

28
approximately 75 percent of Level I, 70 percent of Level II, and 60 percent of Level III roadside
inspections are conducted on truckload carriers with the remainder on less-than-truckload carriers (1).
Assuming that all the carriers stopped with ISS inspection values less than 80 were “safe”
carriers is an erroneous assumption. Even the safest carriers are going to have problems with some
vehicles once in a while. There also is some “deterrence” value to inspections that must be considered.
This is why it is emphasized to inspectors to stop vehicles with obvious defects no matter what the ISS
inspection value. In fact, of the 19,788 carriers stopped with ISS inspection values less than 80 in the
previous analysis, 24.8 percent of them had the driver and/or vehicle placed out-of-service. Although this
is substantially lower than the 38.3 percent OOS rate realized for those carriers stopped with ISS
inspection values greater than 80, it is still notable.
It is actually somewhat surprising that the OOS rate of the carriers stopped with ISS inspection
values greater than 80 is so much larger, considering a carrier with few or no previous inspections also
can receive a high ISS inspection value. Of the 20,031 carriers stopped with ISS inspection values
greater than 80, 8.2 percent (n=1,647) were recommended for inspection due to no or very few previous
inspections relative to their size (i.e., “little data”). Although these carriers had OOS rates lower than
carriers recommended due to poor safety records with the exception of the driver OOS rate the
OOS rates were still notably higher than those not recommended for inspection. Specifically, those
carriers recommended for inspection because of “little data” had a driver OOS rate of 9.0 percent, a
vehicle OOS rate of 30.6 percent, and a total OOS rate of 33.5 percent. Obviously, there is a distinct
advantage to recommending carriers for inspection that have “little data.”
A 60 percent increase in the number of drivers and/or vehicles put OOS would definitely have a
significant impact on cost savings to the “safe” motor carriers and on safety for society as a whole. For
example, still considering the data above, subtracting the 4,910 inspections that resulted in an OOS and
ignoring any deterrence effects the roadside inspection program may have, there were 14,878 roadside
inspections conducted that could have possibly been better put to use on carriers with higher ISS

29
inspection values. This is approximately one-third of all inspections that were conducted on portable
computers in the time frame. If the inspection resources for one-third of all roadside inspections
currently being conducted could be diverted toward carriers with a worse safety history or little
information, the cost savings to the motor carriers no longer stopped would be overwhelming. With
approximately two million roadside inspections being conducted per year, and at $10.67 per inspection,
this would result in a possible savings to “safe” motor carriers of $7.1 million per year.
Considering possible safety impacts, it has been estimated that the National roadside inspection
program directly benefits society $151.5 to $219.8 million per year (2). This figure includes fatalities,
injuries, property damage, traffic delays, and business disruption, which is avoided due to roadside
inspections. If it were possible to realize a 60 percent increase in the number of drivers and/or vehicles
put OOS, it is safe to assume that these significant benefits to society also would increase substantially,
although to what degree is hard to determine. Assuming the safety benefits increase even half the amount
of the increase in drivers and/or vehicles put OOS realized in the above data, this would result in total
safety benefits to society of $197.0 to $285.7 million per year. This increase of $45.5 to $65.9 million
per year would be directly attributable to the use of the ISS.
Adding an average increased safety benefit to society of $55.7 million to the $7.1 million cost
savings to “safe” motor carriers results in an average total possible benefit of the ISS of $62.8 million per
year.
There is still another notable benefit of the ISS. This is the value of obtaining information on
carriers, which previously had no or not enough data to make any conclusions from. This benefits not
only the ISS program, which relies on data to determine its values, but also other OMC programs such as
the emerging CVIS/SafeStat program described previously.

30
EVALUATION SURVEY RESULTS
A brief three-page survey was given to inspectors in the TWG states April/May of 1996 to assess
their perceptions of the Aspen and ISS program. A total of 168 inspectors responded to the survey. Ohio
had the most respondents (n=50) for about 30 percent of the total, this was followed by Kansas (n=33),
Nebraska (n=24), Connecticut (n=19), Idaho (n=13), Wyoming (n=10), New Mexico (n=8), Alabama
(n=6), and Michigan (n=5).
Inspectors had a wide range of experience with the Aspen and ISS programs ranging from two
weeks to more than two years of experience.
When asked how often an ISS match is made when the DOT or ICC number is typed in, the
average response was 77.4 percent of the time. This ranged from an average of 56 percent in Idaho to 82
percent in Connecticut and Nebraska. The states with lower averages may want to look at enlarging the
carrier database contained on their computers.
Across the states, approximately 64 percent of the inspectors felt the ISS inspection values in
general were somewhat to very accurate, while only 14 percent thought they were somewhat to very
inaccurate, 22 percent were neutral. Again, answers differed substantially between states. For example,
all eight of the inspectors in New Mexico answered on the very accurate end of the scale, while only six
of the 13 inspectors in Idaho (46 percent) did. Similarly, about 54 percent of the inspectors in Ohio and
Nebraska; about two-thirds in Alabama, Kansas, and Wyoming; and more than 80 percent in Michigan
and Connecticut answered somewhat to very accurate.
Inspectors overall are using the ISS system about 26 percent of the time to decide whether or not
to inspect a vehicle/driver. This ranged from an average of nearly 50 percent in Kansas to less than 5
percent in Ohio. As aforementioned, the low percentage in some states may be due to state policies that
require random inspections and/or “probable cause” to stop a vehicle. Another factor is that, for many
inspectors, once they stop the vehicle, they have already invested effort and decided to inspect that

31
vehicle and/or driver. It is anticipated that as the ISS becomes available for use in mainline speed
systems, this percentage should increase dramatically.
Slightly more than 71 percent of the inspectors indicated that Aspen and the portable computer
itself was somewhat to very helpful in the inspection process. Only 13.6 percent answered toward the not
helpful end of the scale, and about 15 percent were neutral. Considering individual states, the responses
ranged from 90.0 percent of the inspectors in Wyoming answering on the very helpful end of the scale to
only 37.5 percent of those in New Mexico doing so.
Similar responses were obtained when the inspectors were asked if they would recommend Aspen
and portable computers to other states. Fully 77.4 percent of the inspectors answered somewhat to very
much. This ranged from 40.0 percent in Michigan to 90.0 percent in Wyoming.
When asked in particular about the ISS, slightly more than 54 percent of the inspectors indicated
that it was somewhat to very helpful to them. Once again the percentages ranged from 34.0 percent in
Ohio up to 87.5 percent in New Mexico. Interestingly, when asked if they would recommend the ISS for
use in other states, the percentage jumps to 70.1 percent indicating the very much end of the scale,
ranging from 56.0 percent in Ohio to 89.5 percent in Connecticut. As mentioned above, these results may
be simply an indication of whether or not inspectors are actually able to use the ISS for inspection
selection purposes in that particular state.

32
SUMMARY
Results described in this report explicitly demonstrate that as inspectors use the ISS to a greater
degree, the desired impacts of the system will be achieved. Clearly, ISS will help to target relatively
unsafe carriers, and ones that have insufficient data, and reduce the inspection burden on proven safe
carriers. This means more efficient use of scarce resources by focusing on less safe vehicles and drivers.
Additionally, there are quite substantial benefits to society in terms of safety, and to “safe” motor carriers
in terms of cost-savings to be realized from use of the ISS. A conservative estimate of these benefits
amounts to approximately $60 million per year.
Based on the results of an evaluation survey completed by inspectors and presentations of the
system, the ISS also appears to be well-accepted by both inspectors and the motor carrier community.
More than 70 percent of the inspectors surveyed stated that they would recommend the ISS for use in
other states.
The testing and refinement of the ISS will be continued for some time as new data and
technologies become more widely available. It is hoped that this will further enhance its effectiveness at
focusing inspections to achieve maximum value while causing minimum disruption to the flow of
commerce.

33
REFERENCES
(1) Titus, Matthew J. Implications of Electronic Clearance for Regulatory Enforcement of the
Trucking Industry. Upper Great Plains Transportation Institute Publication No.103.Fargo, ND: North Dakota State University, October 1994.
(2) Moses, Leon and Ian Savage. A Cost-Benefit Analysis of United States Motor Carrier Safety
Programs. Department of Economics and the Transportation Center, NorthwesternUniversity, Evanston, IL, November 1995.

34
Table 1. Distribution of Out-of-Service (OOS) Rates
Category Vehicle Out-of-Service Driver Out-of-Service
Number of carriers 77,940 84,420
Mean OOS R ate 25.9% 9.0%
Media n OO S Rate 25.0% 0.0%
Percen tile (percent of carriers having
the coinciding O OS rate or less)
Vehicle OOS Rates Driver OOS Rates
20th (20 perc ent) 0.0% 0.0%
25th (25 perc ent) 7.2% 0.0%
30th (30 perc ent) 12.4% 0.0%
35th (35 perc ent) 15.4% 0.0%
40th (40 perc ent) 18.2% 0.0%
45th (45 perc ent) 20.0% 0.0%
50th (50 perc ent) 25.0% 0.0%
55th (55 perc ent) 25.0% 3.7%
60th (60 perc ent) 28.9% 6.7%
65th (65 perc ent) 33.4% 9.1%
70th (70 perc ent) 33.4% 11.8%
75th (75 perc ent) 37.5% 14.3%
80th (80 perc ent) 42.2% 18.2%
85th (85 perc ent) 50.0% 22.3%
90th (90 perc ent) 57.9% 27.3%
95th (95 perc ent) 66.7% 33.4%
100th (100 pe rcent) 100.0% 100.0%

35
Table 2. Distribution of Inspections (Level I, II, and V) per Power Unit
Size Grou p (by pow er units)
Category 1 2-6 7-15 16-63 64-200 201-1000 1001+
Number of carriers 133,026 120,139 28,590 15,586 3,099 890 135
Mean 0.757 0.725 0.818 0.865 0.780 0.721 0.591
Median 0.000 0.000 0.273 0.353 0.350 0.380 0.304
Percen tile (percent of carriers
having the coinciding inspection
per powe r unit rate or less)
5th (5 perce nt) 0.000 0.000 0.000 0.000 0.000 0.000 0.002
10th (10 perc ent) 0.000 0.000 0.000 0.000 0.000 0.002 0.011
15th (15 perc ent) 0.000 0.000 0.000 0.000 0.000 0.008 0.023
20th (20 perc ent) 0.000 0.000 0.000 0.000 0.014 0.023 0.037
25th (25 perc ent) 0.000 0.000 0.000 0.046 0.036 0.043 0.051
30th (30 perc ent) 0.000 0.000 0.000 0.069 0.070 0.069 0.087
35th (35 perc ent) 0.000 0.000 0.100 0.120 0.115 0.111 0.116
40th (40 perc ent) 0.000 0.000 0.134 0.182 0.175 0.164 0.145
45th (45 perc ent) 0.000 0.000 0.200 0.254 0.250 0.256 0.199
50th (50 perc ent) 0.000 0.000 0.273 0.353 0.350 0.380 0.304
55th (55 perc ent) 0.000 0.200 0.364 0.471 0.496 0.504 0.403
60th (60 perc ent) 0.000 0.334 0.455 0.612 0.637 0.648 0.479
65th (65 perc ent) 0.000 0.500 0.600 0.784 0.848 0.805 0.645
70th (70 perc ent) 0.000 0.500 0.778 1.000 1.040 1.056 0.783
75th (75 perc ent) 1.000 0.750 1.000 1.233 1.281 1.277 0.972
80th (80 perc ent) 1.000 1.000 1.300 1.524 1.504 1.469 1.092
85th (85 perc ent) 1.000 1.500 1.728 1.895 1.840 1.695 1.332
90th (90 perc ent) 2.000 2.000 2.334 2.412 2.203 1.966 1.608
95th (95 perc ent) 4.000 3.250 3.455 3.250 2.662 2.342 2.094

36
Table 3. Distribution of Inspections (Level I, II, and III) per Driver
Size Grou p (by drivers)
Category 1 2-5 6-15 16-71 72-200 201-1000 1001+
Number of carriers 96,969 112,036 32,060 13,568 2,307 919 159
Mean 0.993 0.854 1.060 1.164 1.059 0.897 0.670
Median 0.000 0.000 0.334 0.500 0.555 0.490 0.247
Percen tile (percent of carriers
having the coinciding inspection
per driver rate or less)
5th (5 perce nt) 0.000 0.000 0.000 0.000 0.000 0.000 0.000
10th (10 perc ent) 0.000 0.000 0.000 0.000 0.000 0.000 0.001
15th (15 perc ent) 0.000 0.000 0.000 0.000 0.009 0.006 0.001
20th (20 perc ent) 0.000 0.000 0.000 0.020 0.025 0.024 0.006
25th (25 perc ent) 0.000 0.000 0.000 0.053 0.061 0.052 0.022
30th (30 perc ent) 0.000 0.000 0.000 0.100 0.123 0.099 0.042
35th (35 perc ent) 0.000 0.000 0.100 0.167 0.200 0.158 0.078
40th (40 perc ent) 0.000 0.000 0.167 0.250 0.294 0.237 0.116
45th (45 perc ent) 0.000 0.000 0.223 0.360 0.409 0.363 0.179
50th (50 perc ent) 0.000 0.000 0.334 0.500 0.555 0.490 0.247
55th (55 perc ent) 0.000 0.250 0.429 0.654 0.753 0.645 0.330
60th (60 perc ent) 0.000 0.334 0.572 0.850 0.949 0.832 0.414
65th (65 perc ent) 0.000 0.500 0.750 1.087 1.153 1.088 0.607
70th (70 perc ent) 1.000 0.600 1.000 1.350 1.419 1.326 1.012
75th (75 perc ent) 1.000 1.000 1.286 1.688 1.705 1.529 1.290
80th (80 perc ent) 1.000 1.000 1.667 2.084 2.064 1.799 1.372
85th (85 perc ent) 2.000 1.600 2.250 2.576 2.395 2.086 1.657
90th (90 perc ent) 3.000 2.400 3.000 3.278 2.809 2.377 1.925
95th (95 perc ent) 5.000 4.000 4.500 4.334 3.418 2.902 2.385

37
Figure 1. Main Screen for the Standalone Windows ISS

38
Figure 2. History Screen for the Standalone Windows ISS

39
Figure 3. Details Screen for the Standalone Windows ISS

40
Figure 4. Violation Details Screen for the Standalone Windows ISS

41
Figure 5. About Screen for the Standalone Windows ISS

42
Figure 6. ISS Algorithm Flow Chart