Embed Size (px)
Citation preview
Wireless Roadside Inspection Proof of Concept Test
Final Report
Rev 1.5 May 2007
FOREWORD
This study focuses on the ability of a Universal Wireless Inspection System to collect driver, vehicle, and carrier information; format a Safety Data Message Set from this information; and wirelessly transmit a Safety Data Message Set to a roadside receiver unit or mobile enforcement vehicle.
The work performed under the project included:
• Development of the Wireless Roadside Inspection Proof of Concept Fast Track Plan to conduct the Proof of Concept Testing using off-the-shelf technology to the fullest extent possible and by forming partnerships with the providers of such technology.
• Drafting of the project Statement of Work • Drafting of the Proof of Concept Test Plan • Development of technology to identify a vehicle and that vehicle’s driver and carrier • Development of technology to give the status of a vehicle and that vehicle’s driver and
carrier • Development of technology to format a Safety Data Message Set from driver, vehicle,
and carrier information • Development of technology to transfer the Safety Data Message Set to the roadside or
Mobile Enforcement Vehicle • Conducting the Proof of Concept Test • Analyzing the Data from the Proof of Concept Test • Drafting of a Final Report
NOTICE
This document is disseminated under the sponsorship of the Department of Transportation in the interest of information exchange. The United States Government assumes no liability for its contents or the use thereof.
The contents of this Report reflect the views of the contractor, who is responsible for the accuracy of the data presented herein. The contents do not necessarily reflect the official policy of the Department of Transportation.
This Report does not constitute a standard, specification, or regulation.
The United States Government does not endorse products or manufacturers named herein. Trade or manufacturers’ names appear herein only because they are considered essential to the objective of this document.
Technical Report Documentation Page 1. Report No.
2. Government Accession No.
3. Recipient's Catalog No.
5. Report Date
February, 2007 4. Title and Subtitle
Wireless Roadside Inspection Proof of Concept Test Final Report
6. Performing Organization Code
7. Author(s)
Gary Capps, Oscar Franzese, Bill Knee, Randall Plate, Mary Beth Lascurain (Oak Ridge National Laboratory)
8. Performing Organization Report No. ORNL/TM-2008/128 10. Work Unit No. (TRAIS)
9. Performing Organization Name and Address
Oak Ridge National Laboratory Center for Transportation Analysis 2360 Cherahala Boulevard Knoxville, TN 37932
11. Contract or Grant No.
DTMC75-03-X-00047/Mod 9 13. Type of Report and Period Covered
Final Report, June 06 to December 07
12. Sponsoring Agency Name and Address
Department of Transportation Federal Motor Carrier Safety Administration Office of Research and Analysis 1200 New Jersey Ave. SE, Room 600 West Washington, DC 20590
14. Sponsoring Agency Code
FMCSA
15. Supplementary Notes
This program was administered through the Federal Motor Carrier Safety Administration (FMCSA). The FMCSA Program Manager is Jeff Loftus. 16. Abstract
The Federal Motor Carrier Safety Administration (FMCSA) funded this project to
Determine the feasibility of gathering vehicle, driver and carrier data to be used to format and wirelessly transmit from a commercial motor vehicle a safety data message set. The results of this effort will be used in the decision to move forward to conduct a pilot test.
17. Key Words
Wireless Roadside Inspection, WRI, Wireless, Inspection, SDMS, Safety Inspection
18. Distribution Statement
19. Security Classif. (of this report)
Unclassified 20. Security Classif. (of this page)
Unclassified 21. No. of Pages
22. Price
N/A Form DOT F 1700.7 (8-72) Reproduction of completed page authorized.
SI* (MODERN METRIC) CONVERSION FACTORS
APPROXIMATE CONVERSIONS TO SI UNITS APPROXIMATE CONVERSIONS FROM SI UNITS Symbol When You Know Multiply By To Find Symbol Symbol When You Know Multiply By To Find Symbol
LENGTH LENGTH in inches 25.4 millimeters mm mm millimeters 0.039 inches in ft feet 0.305 meters m m meters 3.28 feet ft yd yards 0.914 meters m m meters 1.09 yards yd mi miles 1.61 kilometers km km kilometers 0.621 miles mi
AREA AREA in2 square inches 645.2 square millimeters mm2 mm2 square millimeters 0.0016 square inches in2 ft2 square feet 0.093 square meters m2 m2 square meters 10.764 square feet ft2 yd2 square yards 0.836 square meters m2 m2 square meters 1.195 square yards yd2 ac acres 0.405 hectares ha ha hectares 2.47 acres ac mi2 square miles 2.59 square kilometers km2 km2 square kilometers 0.386 square miles mi2
VOLUME VOLUME fl oz fluid ounces 29.57 milliliters ml ml milliliters 0.034 fluid ounces fl oz gal gallons 3.785 liters l l liters 0.264 gallons gal ft3 cubic feet 0.028 cubic meters m3 m3 cubic meters 35.71 cubic feet ft3 yd3 cubic yards 0.765 cubic meters m3 m3 cubic meters 1.307 cubic yards yd3
MASS MASS oz ounces 28.35 grams g g grams 0.035 ounces oz lb pounds 0.454 kilograms kg kg kilograms 2.202 pounds lb T short tons (2,000 lbs) 0.907 megagrams Mg Mg megagrams 1.103 short tons (2,000 lbs) T
TEMPERATURE (exact) TEMPERATURE (exact) °F Fahrenheit 5(F-32)/9 Celsius °C °C Celsius 1.8 C + 32 Fahrenheit °F temperature or (F-32)/1.8 temperature temperature temperature
ILLUMINATION ILLUMINATION fc foot-candles 10.76 lux lx lx lux 0.0929 foot-candles fc fl foot-lamberts 3.426 candela/m2 cd/m2 cd/m2 candela/m2 0.2919 foot-lamberts fl
FORCE and PRESSURE or STRESS FORCE and PRESSURE or STRESS lbf pound-force 4.45 newtons N N newtons 0.225 pound-force lbf
psi pound-force per square inch 6.89 kilopascals kPa kPa kilopascals 0.145 pound-force
per square inch psi
* SI is the symbol for the International System of Units. Appropriate rounding should be done to comply with Section 4 of ASTM E380.
ACKNOWLEDGEMENTS
The Oak Ridge National Laboratory would like to thank Mark Jones and Jim Bunch (Noblis), Valerie Barns (Johns Hopkins APL), Joe Lovecchio (Volpe National Transportation System Center), Steve Kepler (Commercial Vehicle Safety Alliance), Randall Plate (Cedarville University), and Mary Beth Lascurain (Pensacola Christian College) for their technical support and guidance during the Wireless Roadside Inspection Proof of Concept Test - WRI POC. We would like to thank PeopleNet and Air-Weigh, Inc. for their gratis partnership; the contributions made by these firms are greatly appreciated. We would also like to thank the troopers from the Tennessee Department of Safety (Knox Co. and Greene Co. Inspection Stations and Headquarters Nashville) and personnel from the Tennessee Department of Transportation for all of their hard work and support during the WRI POC. Lastly, we would like to thank Gerald Keifer, Lisa Rouse, and Stephanie Mann, FMCSA Field Staff (Tennessee), for their support of the Technology Showcase and all of the hard work leading up to its success on August 7, 2007.
i
TABLE OF CONTENTS
ACRONYMS............................................................................................................................... vii
EXECUTIVE SUMMARY ......................................................................................................... ix
1.0 Project Overview.................................................................................................................13 1.1 Introduction..................................................................................................................13
1.2 Goals and Objectives ...................................................................................................14
1.3 Partners ........................................................................................................................15
1.4 Project Team ................................................................................................................16
1.5 Approach......................................................................................................................17
1.6 Schedule.......................................................................................................................20
2.0 Proof of Concept Test Description ....................................................................................21 2.1 WRI Network and UWIs Operation ............................................................................21
2.2 Equipment and Technology .........................................................................................23
2.3 SDMS Data Category and Source................................................................................30
2.4 Test Vehicles................................................................................................................31
2.5 Roadside Configurations..............................................................................................33
2.6 Testing elements ..........................................................................................................35
3.0 Proof of Concept Test .........................................................................................................37 3.1 Phase 1A ......................................................................................................................37
3.2 Phase 1B.......................................................................................................................52
4.0 Technology Showcase .........................................................................................................62
5.0 WRI Interface......................................................................................................................65
6.0 WRI POC Participant Questionaires................................................................................68 6.1 TDOS Survey...............................................................................................................68
6.2 Driver Surveys .............................................................................................................70
7.0 Lessons Learned..................................................................................................................72
8.0 Summary of Results and Conclusion ................................................................................75
9.0 Suggested Future Research/Recommendations ...............................................................77
APPENDICES..............................................................................................................................79
ii
Appendix A: Wireless Roadside Inspection Proof-of-Concept Testing Fast Track Plan Discussion Paper..........................................................................................................79
Appendix B: Generic WRI POC Partner MOU....................................................................86
Appendix C: WRI POC Test Plan ........................................................................................93
iii
LIST OF TABLES
Table 1. WRI POC Schedule ....................................................................................................... 20 Table 2. SDMS Data and Input Method ...................................................................................... 30 Table 3. Information Collected in Phase 1A Test........................................................................ 39 Table 4. Accuracy of Kernel Databus and Location Information Considering All Messages ... 43 Table 5. Accuracy of Kernel Databus and Location Information without Repeated Messages . 44 Table 6. Accuracy of Kernel Databus and Location Information without Repeated Messages
and with Time Shift ................................................................................................................ 47 Table 7. Kernel Message Delays in Providing Driver 1 Duty Status Change (DRDUTYTIME
Field Used).............................................................................................................................. 48 Table 8. Kernel Message Delays in Providing Driver 2 Duty Status Change (DRDUTYTIME
Field Used).............................................................................................................................. 48 Table 9. Results of Drive-by Dynamic Transmission Tests at Tested Speeds ............................ 59
iv
LIST OF FIGURES
Figure 1. The WRI POC Testing Platforms (configurations and components) ........................... 19 Figure 2. WRI Network Configuration........................................................................................ 21 Figure 3. WRI POC UWIS Block Diagram................................................................................. 22 Figure 4. UWIS as Installed on the Test Tractor ......................................................................... 23 Figure 5. PeopleNet OBC and Display Used in the WRI POC ................................................... 24 Figure 6. MCNU Interface Panel ................................................................................................. 27 Figure 7. MCNU RF Panel .......................................................................................................... 28 Figure 8. Air-Weigh In-Cab Display ........................................................................................... 28 Figure 9. ORNL Comparison System DAS................................................................................. 29 Figure 10. ORNL Comparison System Mounted in Test Vehicle ............................................... 30 Figure 11. WRI POC Test Tractor............................................................................................... 31 Figure 12. DOE Van Used to Simulate a MEV........................................................................... 32 Figure 13. Tennessee Highway Patrol Car Similar to That Used as a MEV............................... 33 Figure 14. Roadside Unit at the Knox County Inspection Station............................................... 34 Figure 15. Roadside Unit at the Greene County Inspection Station ............................................ 34 Figure 16. Phase 1A Test Route and CMV Inspection Stations .................................................. 38 Figure 17. Test Vehicle Speed Profile and Communication/GPS Blackout Periods................... 41 Figure 18. Vehicle Position as Provided by the Kernel and Ground-Truth Original Messages.. 45 Figure 19. Vehicle Position as Provided by the K and GT Messages that Have Been Shifted
15 Seconds .............................................................................................................................. 46 Figure 20. HOS Diagram for Driver 1 Constructed Using Kernel (K) and Ground-Truth (GT)
Messages (K DRDUTYTIME and DRDUTYSTATUS Fields Used) ................................... 50 Figure 21. HOS Diagram for Driver 2 Constructed Using Kernel (K) and Ground-Truth (GT)
Messages (K DRDUTYTIME and DRDUTYSTATUS Fields Used) ................................... 50 Figure 22. Placement of the MCNU Dome Antenna on WRI Test Truck................................... 53 Figure 23. Truck and MEV Positioning for Static Tests ............................................................. 54 Figure 24. File Transmission to the MEV at 5.9 GHz Using the Dome Antenna ....................... 55 Figure 25. Location of Signs at Knox County Inspection Station ............................................... 56 Figure 26. Layout of Test Site at Eastbound Knox County CMV Inspection Station (Diagram
Not to Scale). .......................................................................................................................... 57 Figure 27. MEV-Truck Positions for Over-The-Road Tests Performed at Highway Speeds .... 58 Figure 28. Diagrams of Dome Antenna Placement and Results for Over-The-Road (55 mph)
Orientation Testing at 5.9 GHz............................................................................................... 59 Figure 29. Aerial View of the Greene County CMV Inspection Station..................................... 63 Figure 30. WRI POC MEV Ready for Demo.............................................................................. 63 Figure 31. Wal-Mart Truck on the PBBT at the Aug 7th Showcase ............................................ 64 Figure 32. WRI GUI Overview Screen........................................................................................ 65 Figure 33. WRI GUI Driver Screen............................................................................................. 66 Figure 34. WRI GUI Carrier Screen ............................................................................................ 66
v

Figure 35. WRI GUI Vehicle Screen........................................................................................... 67 Figure 36. WRI GUI HOS Screen ............................................................................................... 67
vi
ACRONYMS
ABS Antilock Braking System
ASCII American Standard Code for Information Interchange
BOA Back Office Application
CAN Controller Area Network
CDL Commercial Driver’s License
CMV Commercial Motor Vehicle
COTS Commercially Available Off-the-Shelf
CVO Commercial Vehicle Operations
CVSA Commercial Vehicle Safety Alliance
DAS Data Acquisition System
DDTS Day-to-Day Test Schedule
DOE Department of Energy
DOT Department of Transportation
DSRC Dedicated Short-Range Communications
ECM Electronic Control Module
EDT Eastern Daylight Time
EOBR Electronic On-Board Recorder
FMCSA Federal Motor Carrier Safety Administration
FOT Field Operational Test
FTP File Transfer Protocol
GUI Graphical User Interface
GPS Global Positioning System
HOS Hours of Service
IEEE Institute of Electrical and Electronics Engineers
IFTA International Fuel Tax Agreement
KUT Kernel Under Test
LCD Liquid Crystal Display
ME Mobile Equipment
MEV Mobile Enforcement Vehicle
MOU Memorandum of Understanding
vii
MCNU Multi-band Configurable Networking Unit
NAS North American Standard
NTRC National Transportation Research Center
ORNL Oak Ridge National Laboratory
OBC On-Board Computer
Partners Industry Suppliers of the UWIS in Partnership with ORNL/FMCSA
PBBT Performance-Based Brake Tester
PDA Personal Digital Assistant
POC Proof of Concept Test
QoS Quality of Service
RF Radio Frequency
RTL Roadside Testing Laboratory
RSE Roadside Equipment
RSU Roadside Unit
Schrader Schrader Trucking
SDMS Safety Data Message Set
SDO Scheduled Day Off
SOW Statement of Work
TELS Test Event Log Sheet
TDOS Tennessee Department of Safety
TDOT Tennessee Department of Transportation
USB Universal Serial Bus
UWIS Universal Wireless Inspection System
VII Vehicle Infrastructure Integration
WRI Wireless Roadside Inspection
viii
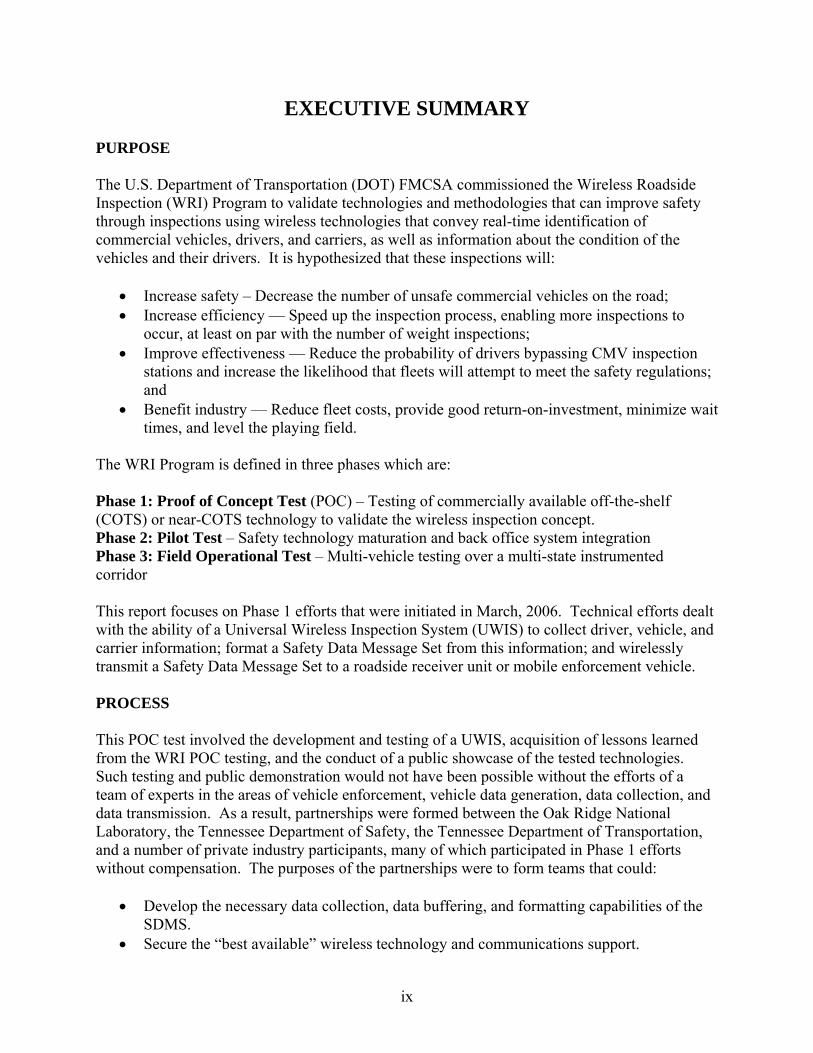
EXECUTIVE SUMMARY PURPOSE The U.S. Department of Transportation (DOT) FMCSA commissioned the Wireless Roadside Inspection (WRI) Program to validate technologies and methodologies that can improve safety through inspections using wireless technologies that convey real-time identification of commercial vehicles, drivers, and carriers, as well as information about the condition of the vehicles and their drivers. It is hypothesized that these inspections will:
• Increase safety – Decrease the number of unsafe commercial vehicles on the road; • Increase efficiency — Speed up the inspection process, enabling more inspections to
occur, at least on par with the number of weight inspections; • Improve effectiveness — Reduce the probability of drivers bypassing CMV inspection
stations and increase the likelihood that fleets will attempt to meet the safety regulations; and
• Benefit industry — Reduce fleet costs, provide good return-on-investment, minimize wait times, and level the playing field.
The WRI Program is defined in three phases which are: Phase 1: Proof of Concept Test (POC) – Testing of commercially available off-the-shelf (COTS) or near-COTS technology to validate the wireless inspection concept. Phase 2: Pilot Test – Safety technology maturation and back office system integration Phase 3: Field Operational Test – Multi-vehicle testing over a multi-state instrumented corridor
This report focuses on Phase 1 efforts that were initiated in March, 2006. Technical efforts dealt with the ability of a Universal Wireless Inspection System (UWIS) to collect driver, vehicle, and carrier information; format a Safety Data Message Set from this information; and wirelessly transmit a Safety Data Message Set to a roadside receiver unit or mobile enforcement vehicle. PROCESS This POC test involved the development and testing of a UWIS, acquisition of lessons learned from the WRI POC testing, and the conduct of a public showcase of the tested technologies. Such testing and public demonstration would not have been possible without the efforts of a team of experts in the areas of vehicle enforcement, vehicle data generation, data collection, and data transmission. As a result, partnerships were formed between the Oak Ridge National Laboratory, the Tennessee Department of Safety, the Tennessee Department of Transportation, and a number of private industry participants, many of which participated in Phase 1 efforts without compensation. The purposes of the partnerships were to form teams that could:
• Develop the necessary data collection, data buffering, and formatting capabilities of the SDMS.
• Secure the “best available” wireless technology and communications support.
ix
• Define the required inputs for the UWIS based on commercially available off-the-shelf (COTS) sensor and systems technology
• Instrument a class-8 tractor with the partner-developed and supplied kernels and transceivers.
• Cooperatively test each Partner-kernel at the I-40/I-75 Inspection station in Knox County Tennessee with the test vehicle in a static mode, traveling in the bypass lane, traveling at highway speed, and in proximity of a patrol car at highway speed.
RESULTS The POC testing was conducted via a WRI POC Test Plan that was developed by ORNL and that was followed during the associated efforts. The WRI POC effort involved a number of activities that included the following:
• Definition of a SDMS, • Development of partner-based UWIS kernels, • Testing of the UWIS on a Commercial Motor Vehicle Roadside Technology Corridor
(CMVRTC) to assess input to and output from the UWIS under varying conditions/situations,
• Conduct of a POC Data Analyses • Public Demonstration Testing on the CMVRTC on August 7, 2008 • Production of a Final Report
This report provides details of these efforts. Some of the major results from the WRI POC testing include the following:
• The POC testing demonstrated that it was possible for the kernel to gather information from different sources, including an EOBR and a vehicle databus, assemble the required SDMS, and make it available for transmission to an RSU or MEV.
• The transmission frequency at which these messages were generated was very high, i.e., an average of one SDMS every 10.2 seconds.
• The largest observed delay in generating a new SDMS was just over five minutes, which was considered acceptable.
• The accuracy of the information posted on the SDMS was measured within a certain tolerance that was arbitrarily set at three levels.
• Information related to the spatial position of the vehicle (obtained from GPS readings) was 100% accurate when considering a tolerance of 1,000 ft.
• Vehicle Speed (also determined via GPS readings) was provided at an accuracy level of above 80% when considering a tolerance of 1 mph or less, and close to 100% with a tolerance of 5 mph or less.
• Odometer information (read from the vehicle’s databus) was 79% accurate when considering a tolerance of 0.25 miles.
x
• Assessment of HOS information in the POC presented some problems. Inaccuracies, albeit minor, in the generation of a HOS diagram were experienced. More critical, however, was the delay in relaying of the messages, which ranged from 5 to 20 minutes.
• Tripod mounting of the antenna received the SDMS more reliably than when the antenna was mounted on the van (MEV).
• In the bypass-lane tests, the body of the truck itself and objects near the roadway limited the time during which transmission could occur; also several pit-scale weight information signs were along the right side of the bypass lane.
• Results of the dynamic orientation tests indicated that a central placement of the dome antenna on the MEV roof was preferred.
• Both the static and dynamic tests showed that there were unresolved issues regarding file transfers when the MEV is directly in front of the truck.
• Use of the stick antenna is very inefficient at 2.4 GHz • Use of the dome-type antenna at both 2.4 GHz and 5.9 GHz indicated much improved
performance at 2.4 GHz. • The POC test demonstrated that the wireless inspection system tested was sufficiently
robust to function as designed in real-world driving environments. • The reliability of file transfer varied with antenna type, placement, and frequency, the
results of this POC test demonstrated that it is possible to reliably transfer an SDMS at highway speeds.
CONCLUSION AND FUTURE DIRECTIONS The primary conclusion of the WRI POC Testing was that the information contained in the SDMS was sufficiently accurate and acceptable to engage in future related research. Suggested research topics, and the reason for their inclusion are as follows:
• Timeliness of the HOS information that is added to the SDMS: Most of the observed problems were attributed to communication and software issues; however, these problems are not insurmountable.
• Reduction of the delays inherent to the system due to the back-office communication of the kernel.
• More extensive testing regarding ideal antenna parameters including type, height, and orientation: Antenna and communication requirements should be developed and refined to include required frequency (2.4 GHz vs. 5.9 GHz), antenna type, and optimal placement of the antenna on each instrumented vehicle.
• Testing a larger number of vehicles to verify system feasibility on a wider scale: Larger-scale testing should be designed to test performance when several instrumented vehicles pass an RSU.
• Development of the ability to visually identify which truck (in a group) is providing the information viewed by enforcement personnel for each wireless inspection.
In future tests, several administrative issues also need to be emphasized. These are:
xi
xii
• It is important that more detailed technical discussions be carried out between the tester (ORNL) and the developers of the system. Such communication would facilitate a better understanding of the idiosyncrasies of both the DAS and the kernel.
• Emphasis should also be placed on gratuitous partnerships to minimize cost and maximize industry buy-in.
As a result of the WRI POC Testing, it is concluded that wireless roadside inspection holds considerable merit in increasing the safety of our highways by the following:
• improving the quality of the inspections performed, • allowing more inspections to be conducted due to the increased efficiency of the system, • assuring that a larger percentage of the trucks on our highways are inspected, • providing industry benefits for these technologies that encourage early adoption.
Because of these positive results, it is recommended that Phase 2 (Pilot Testing) - Safety technology maturation and back office system integration be engaged in, and if these efforts are also successful that it be followed by a Field Operational Test (Phase 3) – Multi-vehicle testing over a multi-state instrumented corridor.
1.0 PROJECT OVERVIEW
1.1 INTRODUCTION
The mission of the Federal Motor Carrier Safety Administration (FMCSA) is to reduce crashes, injuries, and fatalities involving large trucks and buses. Its goal is to reduce commercial motor vehicle (CMV)-related fatalities to 1.65 fatalities per 100 million CMV-miles traveled, by 2008.
Presently there exists a safety inspection violation rate of 73%, or approximately 2.2 million out of 3 million annual inspections. This indicates that numerous CMVs are on the road with driver and/or vehicle infractions. Using wireless technology, FMCSA could potentially increase the number of inspections per year (to approximately the number of weight inspections, which is 82 million) and subsequently reduce the percentage of vehicles on the road with violations. It is expected that this will greatly reduce the violation rate by encouraging better vehicle maintenance and driver behavior.
The U.S. Department of Transportation (DOT) FMCSA has commissioned the Wireless Roadside Inspection (WRI) Program to validate technologies and methodologies that can improve safety through inspections using wireless technologies that convey real-time identification of commercial vehicles, drivers, and carriers, as well as information about the condition of the vehicles and their drivers. It is hypothesized that these inspections will:
• Increase safety – Decrease the number of unsafe commercial vehicles on the road; • Increase efficiency — Speed up the inspection process, enabling more inspections
to occur, at least on par with the number of weight inspections; • Improve effectiveness — Reduce the probability of drivers bypassing CMV
inspection stations and increase the likelihood that fleets will attempt to meet the safety regulations; and
• Benefit industry — Reduce fleet costs, provide good return-on-investment,
minimize wait times, and level the playing field. To this end, the WRI program is defined in three parts
1. Phase 1: Proof of Concept Test (POC) – Testing of commercially available off-the-shelf (COTS) or near-COTS technology to validate the wireless inspection concept
2. Phase 2: Pilot Test – Safety technology maturation and back office system integration
3. Phase 3: Field Operational Test – Multi-vehicle testing over a multi-state instrumented corridor
The Oak Ridge National Laboratory (ORNL) began discussions with FMCSA staff concerning the WRI Program in March 2006 and drafted a WRI discussion paper in May 2006. ORNL was
13
asked to participate in an initial planning meeting for the WRI Program in June 2006. This meeting was held at FMCSA Headquarters in Washington DC. From this meeting ORNL was tasked to conduct the WRI POC testing within the Commercial Motor Vehicle Roadside Testing Corridor (CMV RTC) located in East Tennessee. ORNL drafted the WRI POC Fast Track Plan, which called for partnering with private industry to quickly develop and field technology to accomplish the goals of the WRI POC. See Appendix A for a copy of the Fast Track Plan. ORNL was asked to lead the WRI POC and to conduct a Technology Showcase/Media Event on August 7, 2007, to showcase the WRI technology and other emerging and state-of-the-practice technologies being used at the Greene Co. Tennessee CMV inspection station located at mile marker 21 on southbound interstate 81. This inspection station is the northeast anchor point for the CMV RTC. ORNL drafted the project Statement of Work (SOW) in the fall of 2006, drafted the Test Plan and formed partnerships in the spring of 2007, and conducted the POC and the Technology Showcase in the summer of 2007. This final report addresses the Phase 1 POC that was conducted by ORNL to validate the technology needed to collect, assemble, and wirelessly transmit the vehicle, carrier, and driver safety data to fixed and mobile receivers. Phases 2 and 3 of the WRI Program were not conducted under this effort and will only be addressed in this report as efforts of these phases relate to the POC.
1.2 GOALS AND OBJECTIVES
1.2.1 Goals The five goals of the Phase 1 WRI POC Program were to:
• Demonstrate the ability to gather appropriate vehicle, driver, and carrier data germane to the Phase 1 POC testing via a vehicle’s data bus, Global Positioning System (GPS) receiver, the vehicle operator’s input to the vehicle’s Universal Wireless Inspection System (UWIS), and the carrier’s input to the vehicle’s UWIS.
• Demonstrate the industry Partner supplied kernel’s ability to collect; store; and transfer vehicle, driver, and carrier information to the transceiver in the format specified for the Safety Data Message Set (SDMS) (see Section 2.0 for description of kernel and transceiver).
• Demonstrate the transceiver’s ability to wirelessly transmit data from the UWIS to a second unit (roadside and mobile) at interstate speed.
• Obtain feedback from WRI stakeholders involved in the POC to verify the overall Concept of Operations and some of the high level requirements.
• Obtain feedback from the test vehicle operators concerning UWIS.
1.2.2 Objectives The objectives of the Phase 1 WRI POC Program were to:
• Formalize a partnership agreement with a kernel provider via a Memorandum of Understanding (MOU)
14
• Develop the WRI POC Test Plan • Conduct the WRI POC per the Test Plan • Analyze data from the WRI POC • Obtain stakeholder and operator feedback to the extent possible within the limited
scope of the test
1.3 PARTNERS
Through an MOU, ORNL partnered with PeopleNet, a mobile computing and communications provider, to provide the kernel for the UWIS, and with Air-Weigh, Inc. to provide the on-board vehicle weighing system to provide the tractor’s real-time weight; these partnerships were gratis. See Appendix B for a generic copy of the WRI POC Partner MOU. ORNL also partnered with TechnoCom Corporation to provide the transceiver technology on a contractual basis.
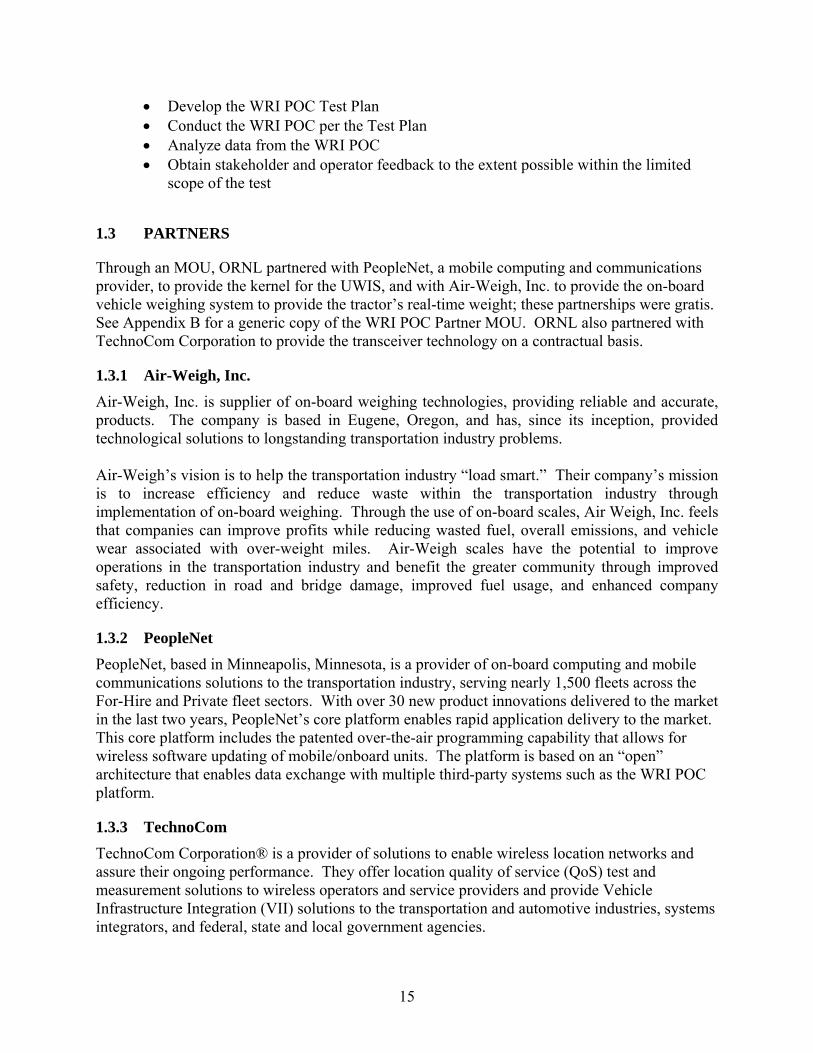
1.3.1 Air-Weigh, Inc. Air-Weigh, Inc. is supplier of on-board weighing technologies, providing reliable and accurate, products. The company is based in Eugene, Oregon, and has, since its inception, provided technological solutions to longstanding transportation industry problems. Air-Weigh’s vision is to help the transportation industry “load smart.” Their company’s mission is to increase efficiency and reduce waste within the transportation industry through implementation of on-board weighing. Through the use of on-board scales, Air Weigh, Inc. feels that companies can improve profits while reducing wasted fuel, overall emissions, and vehicle wear associated with over-weight miles. Air-Weigh scales have the potential to improve operations in the transportation industry and benefit the greater community through improved safety, reduction in road and bridge damage, improved fuel usage, and enhanced company efficiency.
1.3.2 PeopleNet PeopleNet, based in Minneapolis, Minnesota, is a provider of on-board computing and mobile communications solutions to the transportation industry, serving nearly 1,500 fleets across the For-Hire and Private fleet sectors. With over 30 new product innovations delivered to the market in the last two years, PeopleNet’s core platform enables rapid application delivery to the market. This core platform includes the patented over-the-air programming capability that allows for wireless software updating of mobile/onboard units. The platform is based on an “open” architecture that enables data exchange with multiple third-party systems such as the WRI POC platform.
1.3.3 TechnoCom TechnoCom Corporation® is a provider of solutions to enable wireless location networks and assure their ongoing performance. They offer location quality of service (QoS) test and measurement solutions to wireless operators and service providers and provide Vehicle Infrastructure Integration (VII) solutions to the transportation and automotive industries, systems integrators, and federal, state and local government agencies.
15
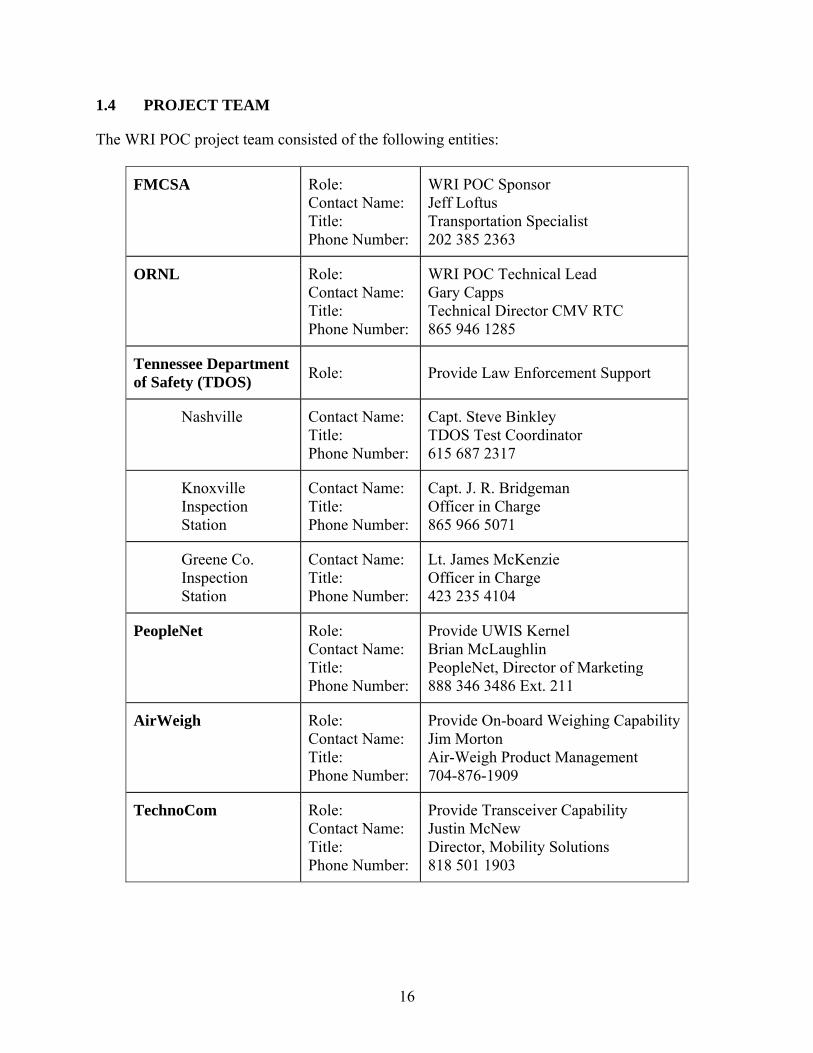
1.4 PROJECT TEAM
The WRI POC project team consisted of the following entities:
FMCSA Role: Contact Name: Title: Phone Number:
WRI POC Sponsor Jeff Loftus Transportation Specialist 202 385 2363
ORNL Role: Contact Name: Title: Phone Number:
WRI POC Technical Lead Gary Capps Technical Director CMV RTC 865 946 1285
Tennessee Department of Safety (TDOS) Role: Provide Law Enforcement Support
Nashville Contact Name: Title: Phone Number:
Capt. Steve Binkley TDOS Test Coordinator 615 687 2317
Knoxville Inspection Station
Contact Name: Title: Phone Number:
Capt. J. R. Bridgeman Officer in Charge 865 966 5071
Greene Co. Inspection Station
Contact Name: Title: Phone Number:
Lt. James McKenzie Officer in Charge 423 235 4104
PeopleNet Role: Contact Name: Title: Phone Number:
Provide UWIS Kernel Brian McLaughlin PeopleNet, Director of Marketing 888 346 3486 Ext. 211
AirWeigh Role: Contact Name: Title: Phone Number:
Provide On-board Weighing Capability Jim Morton Air-Weigh Product Management 704-876-1909
TechnoCom Role: Contact Name: Title: Phone Number:
Provide Transceiver Capability Justin McNew Director, Mobility Solutions 818 501 1903
16
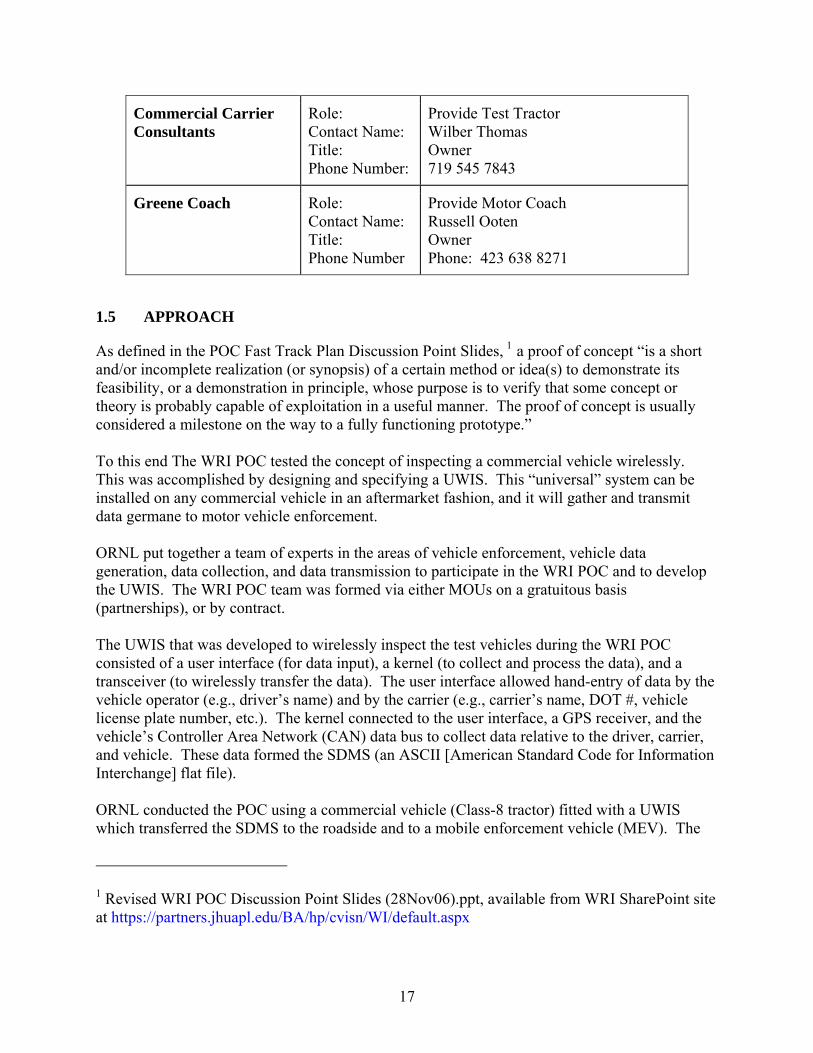
Commercial Carrier Consultants
Role: Contact Name: Title: Phone Number:
Provide Test Tractor Wilber Thomas Owner 719 545 7843
Greene Coach Role: Contact Name: Title: Phone Number
Provide Motor Coach Russell Ooten Owner Phone: 423 638 8271
1.5 APPROACH
As defined in the POC Fast Track Plan Discussion Point Slides, 1 a proof of concept “is a short and/or incomplete realization (or synopsis) of a certain method or idea(s) to demonstrate its feasibility, or a demonstration in principle, whose purpose is to verify that some concept or theory is probably capable of exploitation in a useful manner. The proof of concept is usually considered a milestone on the way to a fully functioning prototype.” To this end The WRI POC tested the concept of inspecting a commercial vehicle wirelessly. This was accomplished by designing and specifying a UWIS. This “universal” system can be installed on any commercial vehicle in an aftermarket fashion, and it will gather and transmit data germane to motor vehicle enforcement. ORNL put together a team of experts in the areas of vehicle enforcement, vehicle data generation, data collection, and data transmission to participate in the WRI POC and to develop the UWIS. The WRI POC team was formed via either MOUs on a gratuitous basis (partnerships), or by contract. The UWIS that was developed to wirelessly inspect the test vehicles during the WRI POC consisted of a user interface (for data input), a kernel (to collect and process the data), and a transceiver (to wirelessly transfer the data). The user interface allowed hand-entry of data by the vehicle operator (e.g., driver’s name) and by the carrier (e.g., carrier’s name, DOT #, vehicle license plate number, etc.). The kernel connected to the user interface, a GPS receiver, and the vehicle’s Controller Area Network (CAN) data bus to collect data relative to the driver, carrier, and vehicle. These data formed the SDMS (an ASCII [American Standard Code for Information Interchange] flat file). ORNL conducted the POC using a commercial vehicle (Class-8 tractor) fitted with a UWIS which transferred the SDMS to the roadside and to a mobile enforcement vehicle (MEV). The
1 Revised WRI POC Discussion Point Slides (28Nov06).ppt, available from WRI SharePoint site at https://partners.jhuapl.edu/BA/hp/cvisn/WI/default.aspx
17
18
POC was divided into two sets of testing: Phase 1A, UWIS kernel testing; and Phase 1B, transceiver testing (to include the Phase 1A UWIS kernel).
The WRI POC Test Plan was developed to guide the testing and data collection. The WRI POC Test Plan was submitted to FMCSA in its final form on December 4, 2007 as Rev 1.5. The Test Plan was posted on the WRI SharePoint Site at:
https://partners.jhuapl.edu/BA/hp/cvisn/WI/default.aspx
1.5.1 Phase 1A An MOU was put in place with PeopleNet who supplied the UWIS kernel for testing. The MOU defined the roles of ORNL and PeopleNet for the POC, established the POC timeline, and acknowledged the gratuitous nature of the Partnership. Once the UWIS kernel was developed, PeopleNet hand-delivered their system to the National Transportation Research Center (NTRC), located in Knoxville, Tennessee. They provided instructions to the ORNL staff regarding how to integrate their systems onto the test vehicle and how to operate the technology. A pre-POC shakedown was conducted to verify that the equipment was operational. After this preliminary equipment check, the POC testing was conducted as specified in the WRI POC Test Plan. The test vehicle was operated in various modes of driver status (e.g. on-duty, on-duty driving, off-duty) within a 100 air-mile radius of the NTRC. The POC testing for the Partner’s UWIS kernel was completed in approximately ten hours. The technology of the Partners remained on the test vehicle for Phase 1B testing.
1.5.2 Phase 1B This phase involved the testing of the transceiver by transmitting the SDMS to the roadside or MEV. The transceiver was tested at 5.9GHz and 2.4GHz in the following scenarios:
o Test Vehicle-to-Roadside (vehicle stopped at weigh station; “static test” for baseline)
o Test Vehicle-to-Roadside (low-speed by-pass lane: 25 MPH) o Test Vehicle-to-Roadside (high-speed: 55 MPH) o Vehicle-to-MEV (neither vehicle moving for baseline) o Vehicle-to-MEV (low-speed: 25 MPH, both traveling in same direction) o Vehicle-to-MEV (high-speed: 55 MPH, both traveling in same direction) o Vehicle-to-MEV (test vehicle stopped, enforcement vehicle moving) o Vehicle-to-MEV (test vehicle moving, enforcement vehicle stopped)
SDMS received at the roadside was checked against the output of the kernel. Results from this testing were reviewed throughout the testing process. Changes were made (as practical) to antenna placement, antenna cable length, antenna height, and frequency in attempt to optimize the transmission in each scenario. All changes or adjustments during actual testing were done by ORNL personnel and recorded as to type, amount, and time of the change.
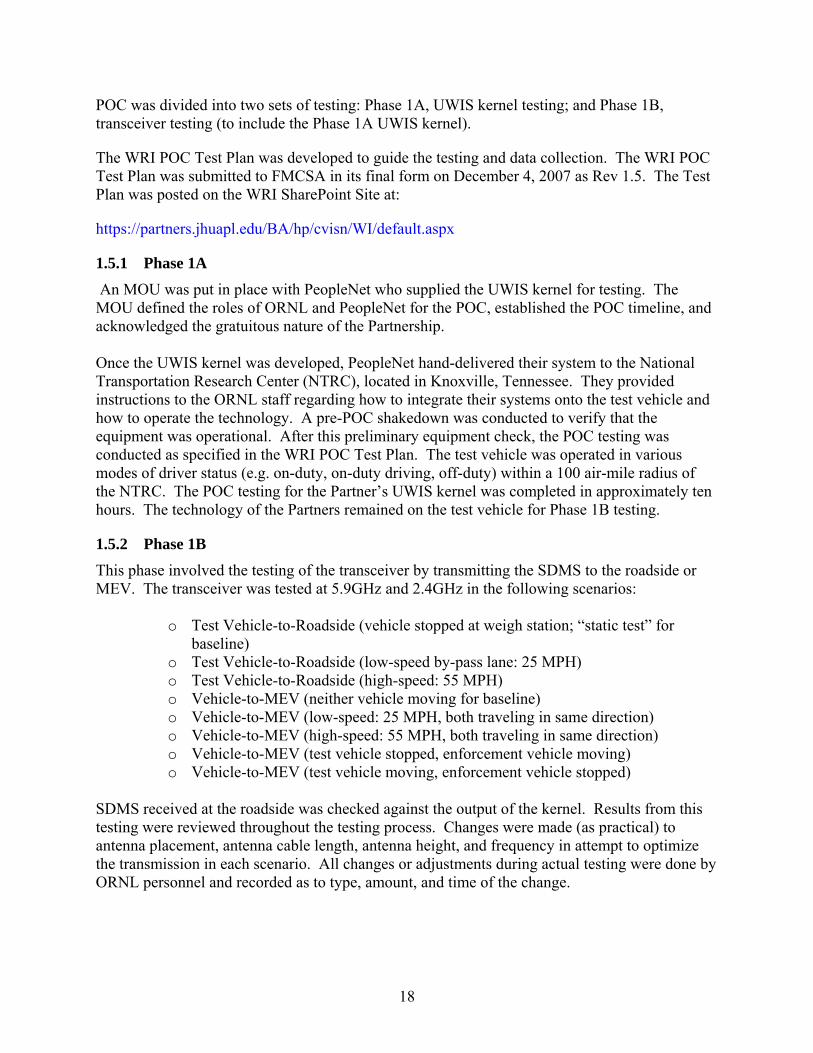
1.5.3 WRI POC Testing Platforms Figure 1 shows the testing platforms involved in the WRI POC, their configuration, and the components involved. These platforms were present on the Truck/Motor Coach (test vehicles), at the Roadside (CMV inspection station), and the MEV. See Section 2.0 for additional details.
Figure 1. The WRI POC Testing Platforms (configurations and components)
19
1.6 SCHEDULE
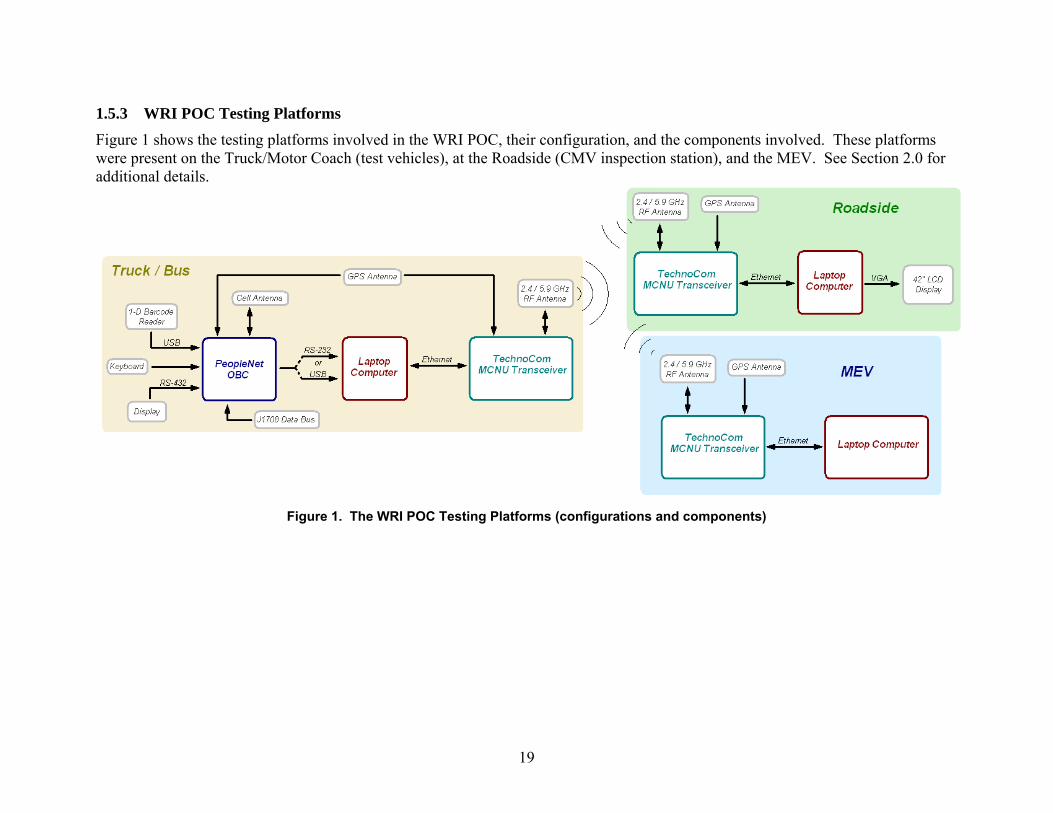
Table 1 shows the schedule for the WRI POC and Technology Showcase.
Table 1. WRI POC Schedule
2006 2007 June-Dec
Jan Feb Mar Apr May Jun Jul Aug Sep Oct Nov Dec
POC Work Steps 1-7 8 9 10 11 12 13 14 15 16 17 18 19 Kickoff Meeting, Program Scoping and Planning, WRI POC SOW, POC Notice to Proceed
MOUs Drafted and In Place Test Plan Drafted and Approved Partner Technology Buildup ORNL DAS Installation and Shakedown UWIS Kernel Installation, Testing, and Initial Data Analysis
TechnoCom 5.9 GHz Transceiver Installation and Testing
Reconfiguration of TechnoCom Transceiver to 2.4GHz and Testing
Technology Showcase De-Instrumentation Data Analysis Participant Feedback Data Analysis Report Final Report
20
2.0 PROOF OF CONCEPT TEST DESCRIPTION
The POC was conducted beginning in late May 2007 and was completed just before the August 7, 2007, Technology Showcase.
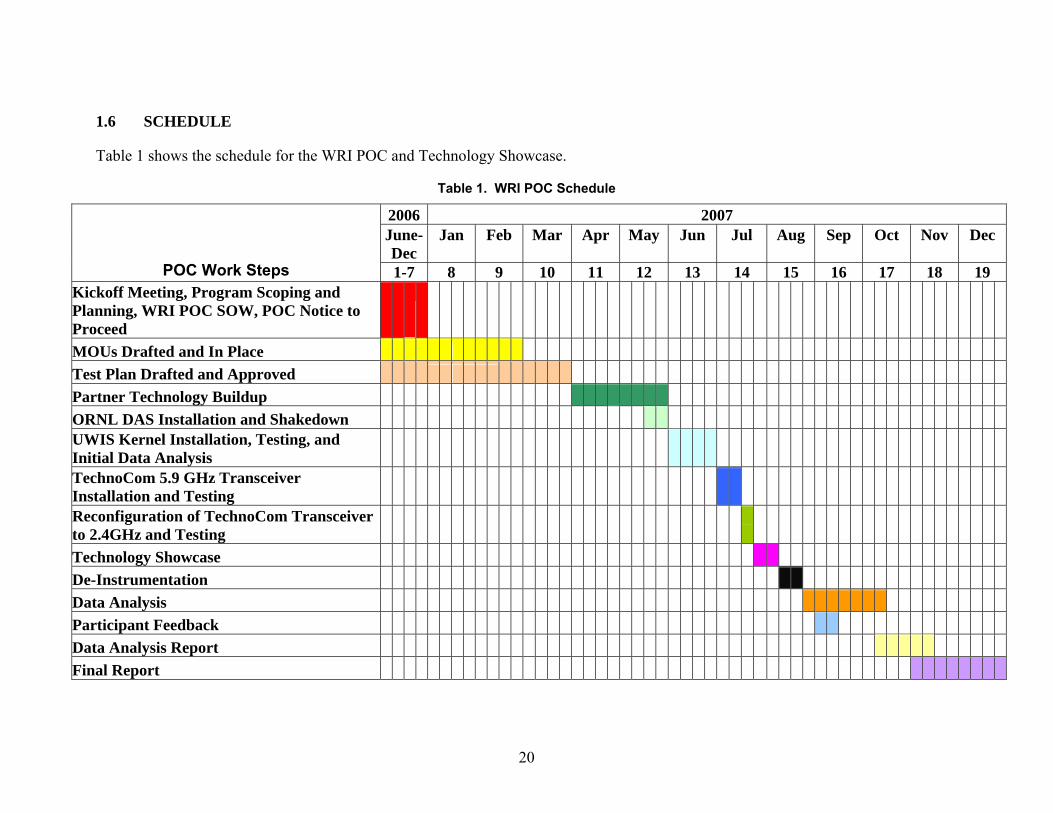
2.1 WRI NETWORK AND UWIS OPERATION
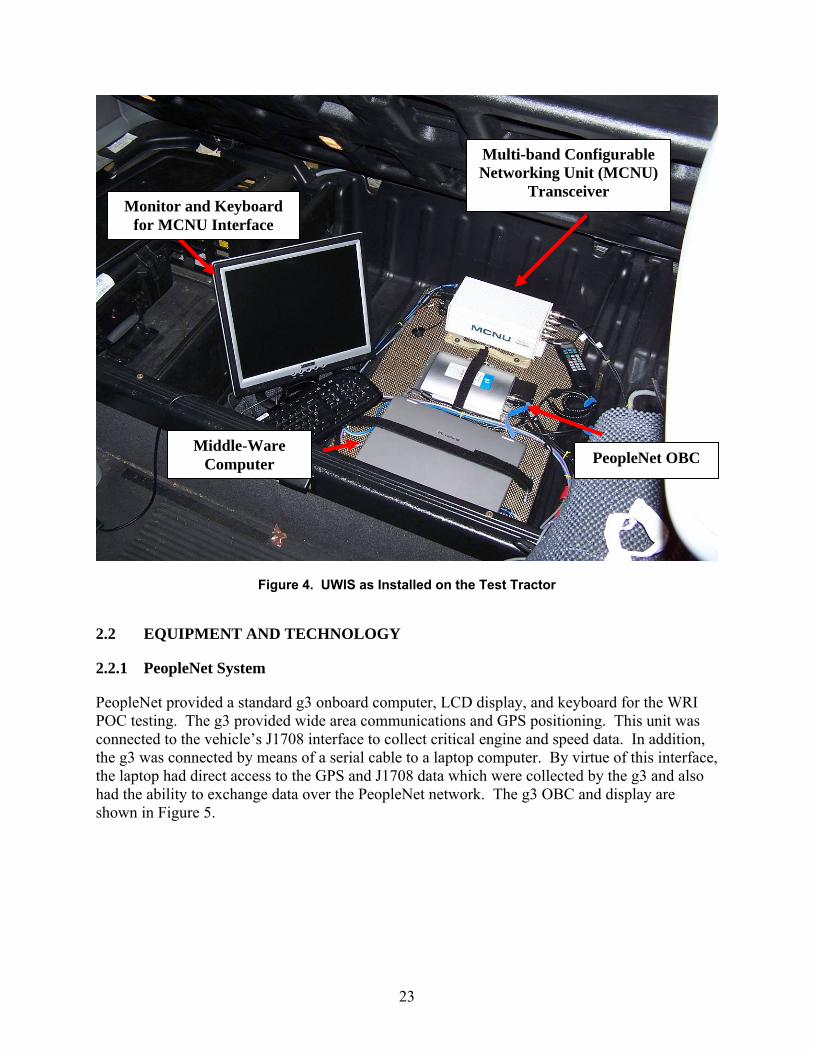
The WRI application utilized a network configuration that consisted of the UWIS, Roadside Equipment (RSE) or Mobile Equipment (ME) and a “back office application” (BOA) server (see Figure 2). The UWIS within the Commercial Motor Vehicle (CMV) consisted of three primary parts: the data collection kernel, a middle-ware computer, and the wireless transceiver. The kernel (provided by PeopleNet) interacted with the various data sources to collect and package information to form a single-line SDMS. PeopleNet also provided custom software to allow the transfer of this data from their on-board computer (OBC) to a middle-ware laptop where a single-line SDMS was generated every ten seconds. These SDMSs were then collected on the middle-ware computer, further packaged and formatted by ORNL software, and sent to a wireless transceiver provided by TechnoCom. See Figure 3 for a block diagram of the UWIS and Figure 4 for an image of the UWIS as tested in the WRI POC. The transceiver on-board the CV would immediately attempt to transfer this data to a transceiver at the roadside (or in a MEV). The RSE subsequently transferred the data to a BOA server for processing and display on a second laptop running ORNL-developed software. In addition, the network supported querying the CMV by a MEV that contained the ME.
RSE
Cellular Communication
BOA
CMV (UWIS)
5.9 GHz
MEV
Figure 2. WRI Network Configuration
For the POC, transfer of the SDMS was attempted as soon as the middle-ware computer provided new data to the transceiver (approximately every ten seconds). However, the
21
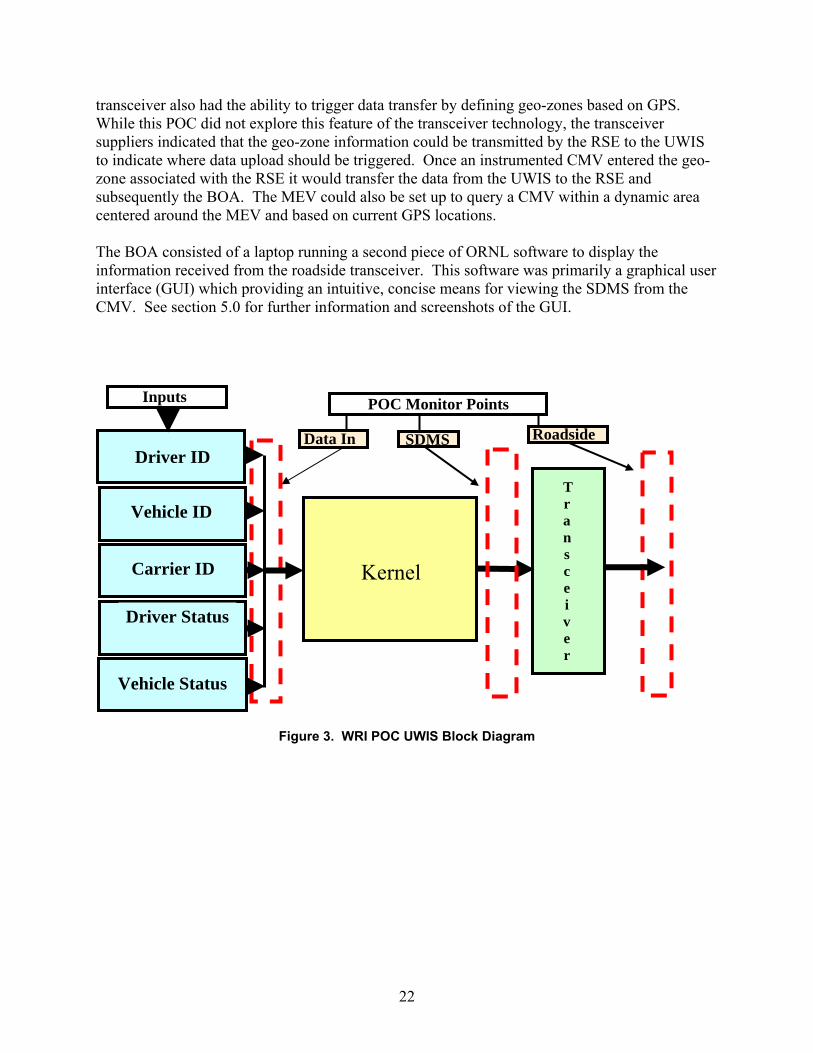
transceiver also had the ability to trigger data transfer by defining geo-zones based on GPS. While this POC did not explore this feature of the transceiver technology, the transceiver suppliers indicated that the geo-zone information could be transmitted by the RSE to the UWIS to indicate where data upload should be triggered. Once an instrumented CMV entered the geo-zone associated with the RSE it would transfer the data from the UWIS to the RSE and subsequently the BOA. The MEV could also be set up to query a CMV within a dynamic area centered around the MEV and based on current GPS locations. The BOA consisted of a laptop running a second piece of ORNL software to display the information received from the roadside transceiver. This software was primarily a graphical user interface (GUI) which providing an intuitive, concise means for viewing the SDMS from the CMV. See section 5.0 for further information and screenshots of the GUI.
Driver ID
Vehicle ID
Carrier ID
Driver Status
Vehicle Status
Kernel
T ra n s
Inputs
c
POC Monitor Points
Data In Roadside SDMS
ei v er
Figure 3. WRI POC UWIS Block Diagram
22
Multi-band Configurable Networking Unit (MCNU)
Transceiver Monitor and Keyboard
for MCNU Interface
Middle-Ware Computer PeopleNet OBC
Figure 4. UWIS as Installed on the Test Tractor
2.2 EQUIPMENT AND TECHNOLOGY
2.2.1 PeopleNet System
PeopleNet provided a standard g3 onboard computer, LCD display, and keyboard for the WRI POC testing. The g3 provided wide area communications and GPS positioning. This unit was connected to the vehicle’s J1708 interface to collect critical engine and speed data. In addition, the g3 was connected by means of a serial cable to a laptop computer. By virtue of this interface, the laptop had direct access to the GPS and J1708 data which were collected by the g3 and also had the ability to exchange data over the PeopleNet network. The g3 OBC and display are shown in Figure 5.
23
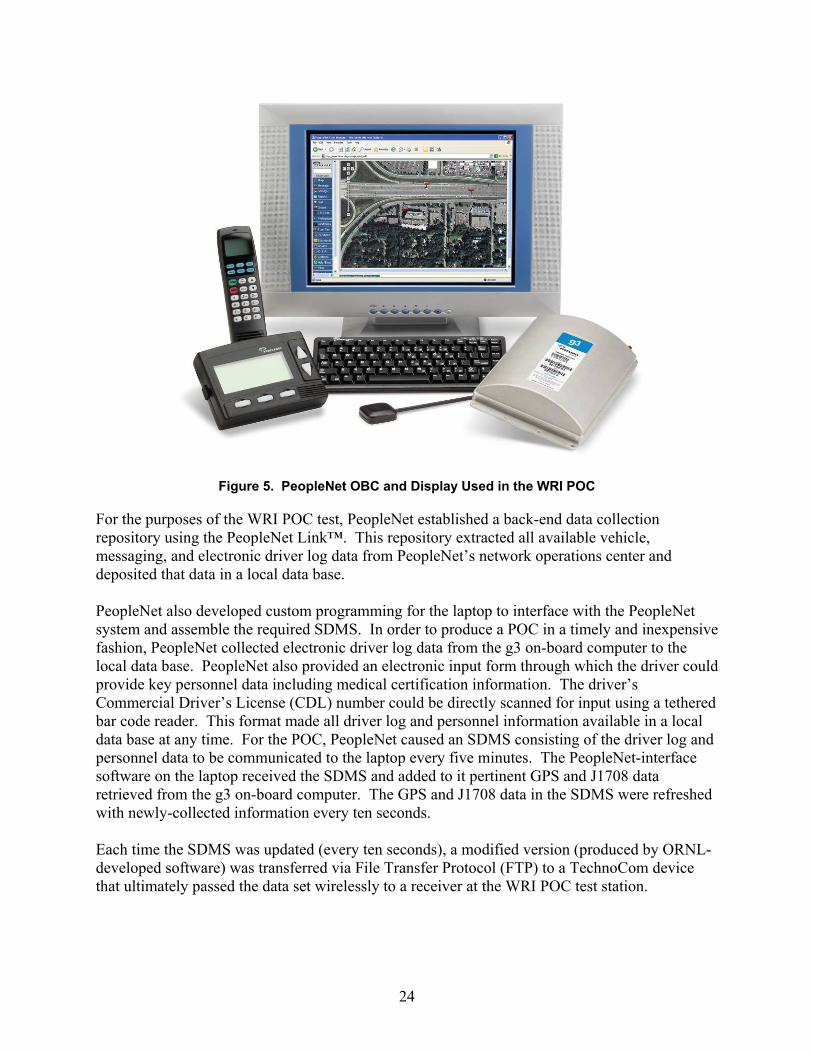
Figure 5. PeopleNet OBC and Display Used in the WRI POC
For the purposes of the WRI POC test, PeopleNet established a back-end data collection repository using the PeopleNet Link™. This repository extracted all available vehicle, messaging, and electronic driver log data from PeopleNet’s network operations center and deposited that data in a local data base. PeopleNet also developed custom programming for the laptop to interface with the PeopleNet system and assemble the required SDMS. In order to produce a POC in a timely and inexpensive fashion, PeopleNet collected electronic driver log data from the g3 on-board computer to the local data base. PeopleNet also provided an electronic input form through which the driver could provide key personnel data including medical certification information. The driver’s Commercial Driver’s License (CDL) number could be directly scanned for input using a tethered bar code reader. This format made all driver log and personnel information available in a local data base at any time. For the POC, PeopleNet caused an SDMS consisting of the driver log and personnel data to be communicated to the laptop every five minutes. The PeopleNet-interface software on the laptop received the SDMS and added to it pertinent GPS and J1708 data retrieved from the g3 on-board computer. The GPS and J1708 data in the SDMS were refreshed with newly-collected information every ten seconds. Each time the SDMS was updated (every ten seconds), a modified version (produced by ORNL-developed software) was transferred via File Transfer Protocol (FTP) to a TechnoCom device that ultimately passed the data set wirelessly to a receiver at the WRI POC test station.
24

2.2.2 Middle-Ware Computer
The computer chosen to interface between the PeopleNet OBC and the transceiver was a Lenovo 3000 N100 laptop Model 076807U. This computer contained both the PeopleNet-interface software mentioned above as well as software developed by ORNL to further manipulate the data provided by PeopleNet. ORNL’s task was to generate an on-board history of SDMS messages as provided by PeopleNet and to send this history to the transceiver for subsequent transmission to an RSU or MEV. To this end, the software developed by ORNL first created a simple appended SDMS by appending the new SDMS line, provided by PeopleNet every ten seconds, to a text file. This format was used in Phase 1A to provide a large number of SDMS messages for accuracy checking.
ORNL’s software also provided the capability of generating a status-change SDMS, in which only messages from PeopleNet which differed in driver duty status from the previously-stored line were appended to a text file. This resulted in a much shorter cumulative SDMS where each line represented a different driver status. The software was also configured to retain a maximum of eight days worth of such lines, deleting any entries that were more than eight days old each time a new line was added. This format closely approximates that which would be expected by FMCSA’s Proposed Rule Making on Electronic On-Board Recorders (EOBRs) for commercial vehicles’ eight-day history(395.16).
The third function of ORNL’s software was to transfer data from the laptop to the transceiver which would then transmit it to the roadside or MEV. The software allows three options of which file to transfer:
1) Only the single-line output from PeopleNet 2) The complete appended SDMS, or 3) The eight-day history SDMS.
Whichever option is selected is sent to the transceiver every ten seconds, when it is updated with the most recent PeopleNet information. The actual transfer was accomplished using the standard FTP. Because the laptop was running Windows XP and the transceiver ran on a Linux platform, this communication method provided a convenient method of transferring the data between the different operating systems.
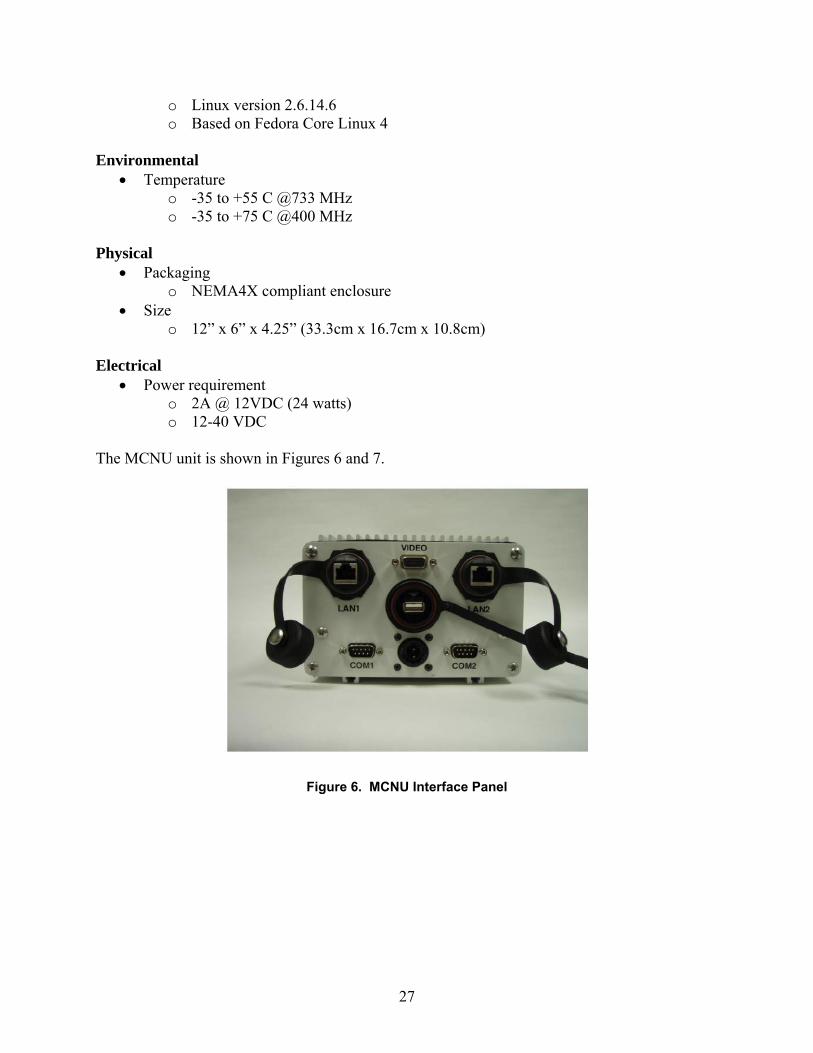
2.2.3 TechnoCom Transceiver The TechnoCom Multi-band Configurable Networking Unit (MCNU) served as the transceiver for the WRI POC and was tested at both 2.4 GHz and 5.9 GHz Dedicated Short-Range Communications (DSRC). The MCNU is a lightweight and weatherproof device that is used to build standards-compliant, high-speed, multi-band wireless communication networks. Optimized antennas for each frequency were supplied by TechnoCom and utilized by ORNL for the POC.
25
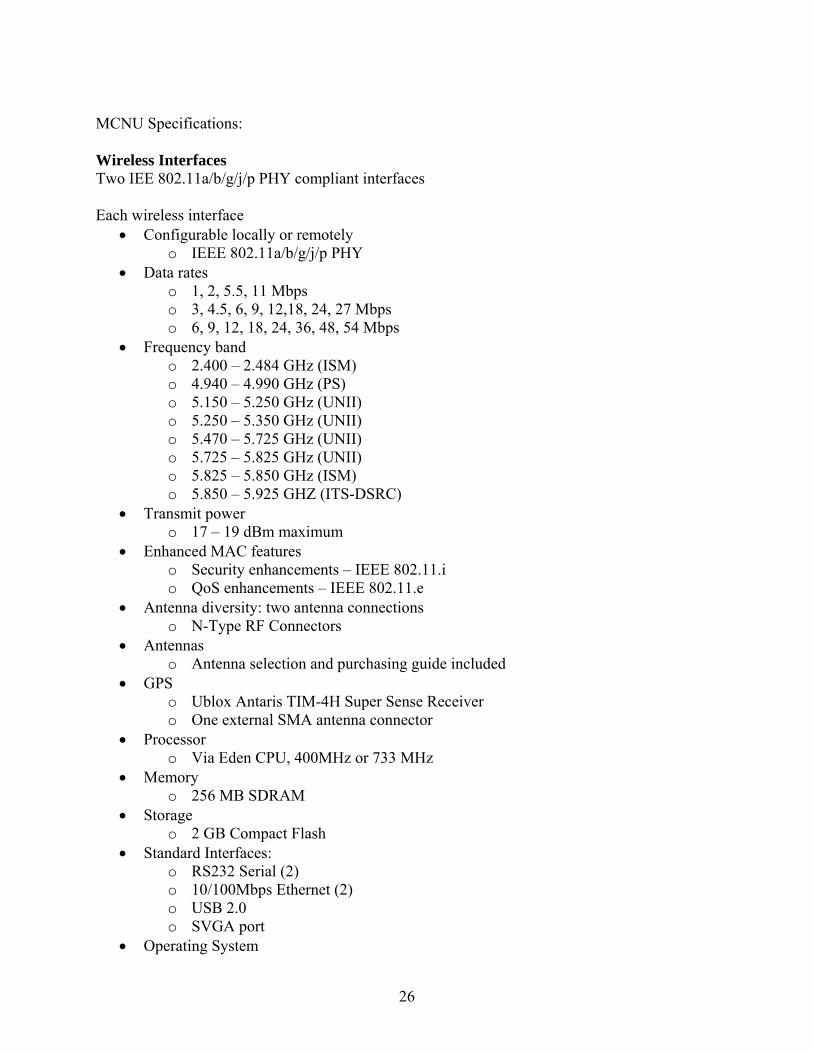
MCNU Specifications: Wireless Interfaces Two IEE 802.11a/b/g/j/p PHY compliant interfaces Each wireless interface
• Configurable locally or remotely o IEEE 802.11a/b/g/j/p PHY
• Data rates o 1, 2, 5.5, 11 Mbps o 3, 4.5, 6, 9, 12,18, 24, 27 Mbps o 6, 9, 12, 18, 24, 36, 48, 54 Mbps
• Frequency band o 2.400 – 2.484 GHz (ISM) o 4.940 – 4.990 GHz (PS) o 5.150 – 5.250 GHz (UNII) o 5.250 – 5.350 GHz (UNII) o 5.470 – 5.725 GHz (UNII) o 5.725 – 5.825 GHz (UNII) o 5.825 – 5.850 GHz (ISM) o 5.850 – 5.925 GHZ (ITS-DSRC)
• Transmit power o 17 – 19 dBm maximum
• Enhanced MAC features o Security enhancements – IEEE 802.11.i o QoS enhancements – IEEE 802.11.e
• Antenna diversity: two antenna connections o N-Type RF Connectors
• Antennas o Antenna selection and purchasing guide included
• GPS o Ublox Antaris TIM-4H Super Sense Receiver o One external SMA antenna connector
• Processor o Via Eden CPU, 400MHz or 733 MHz
• Memory o 256 MB SDRAM
• Storage o 2 GB Compact Flash
• Standard Interfaces: o RS232 Serial (2) o 10/100Mbps Ethernet (2) o USB 2.0 o SVGA port
• Operating System
26
o Linux version 2.6.14.6 o Based on Fedora Core Linux 4
Environmental
• Temperature o -35 to +55 C @733 MHz o -35 to +75 C @400 MHz
Physical
• Packaging o NEMA4X compliant enclosure
• Size o 12” x 6” x 4.25” (33.3cm x 16.7cm x 10.8cm)
Electrical
• Power requirement o 2A @ 12VDC (24 watts) o 12-40 VDC
The MCNU unit is shown in Figures 6 and 7.
Figure 6. MCNU Interface Panel
27
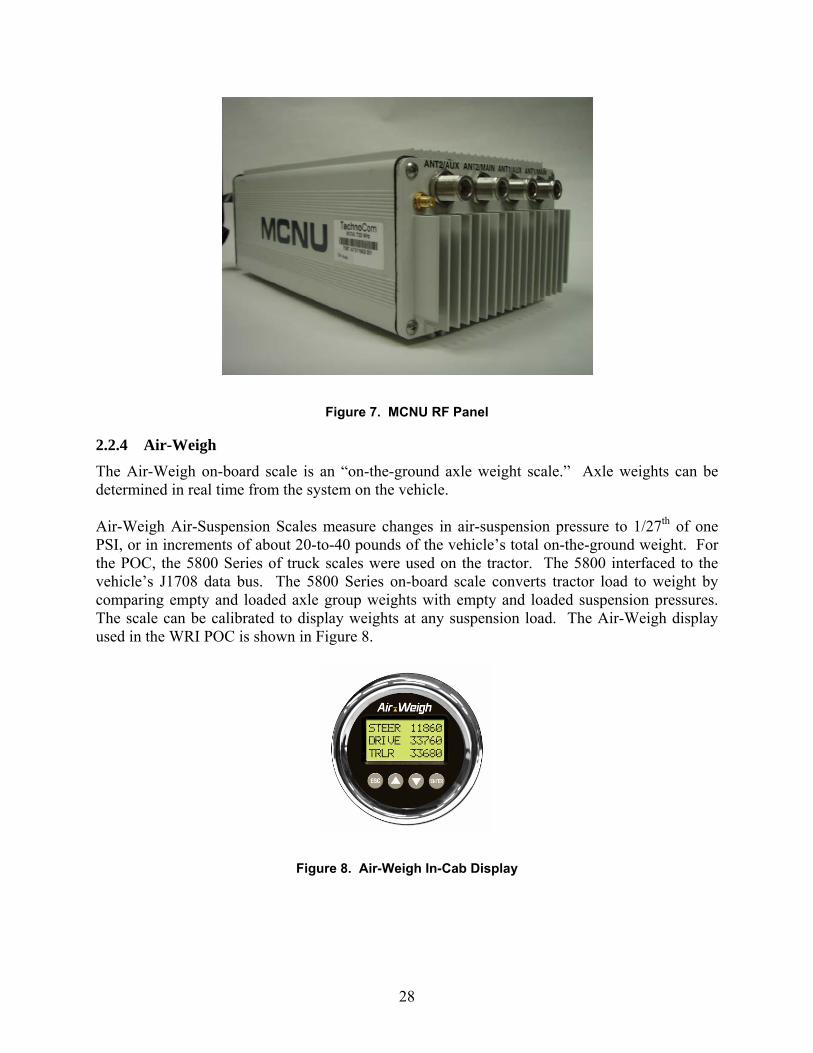
Figure 7. MCNU RF Panel
2.2.4 Air-Weigh The Air-Weigh on-board scale is an “on-the-ground axle weight scale.” Axle weights can be determined in real time from the system on the vehicle. Air-Weigh Air-Suspension Scales measure changes in air-suspension pressure to 1/27th of one PSI, or in increments of about 20-to-40 pounds of the vehicle’s total on-the-ground weight. For the POC, the 5800 Series of truck scales were used on the tractor. The 5800 interfaced to the vehicle’s J1708 data bus. The 5800 Series on-board scale converts tractor load to weight by comparing empty and loaded axle group weights with empty and loaded suspension pressures. The scale can be calibrated to display weights at any suspension load. The Air-Weigh display used in the WRI POC is shown in Figure 8.
Figure 8. Air-Weigh In-Cab Display
28
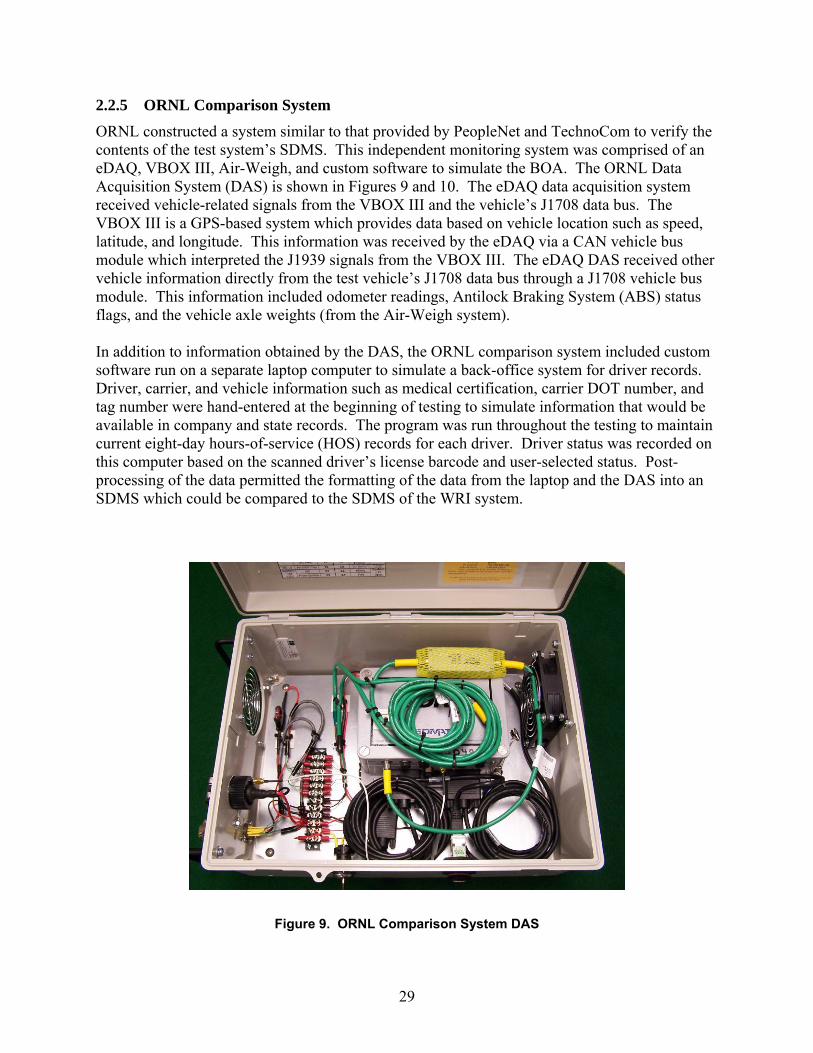
2.2.5 ORNL Comparison System ORNL constructed a system similar to that provided by PeopleNet and TechnoCom to verify the contents of the test system’s SDMS. This independent monitoring system was comprised of an eDAQ, VBOX III, Air-Weigh, and custom software to simulate the BOA. The ORNL Data Acquisition System (DAS) is shown in Figures 9 and 10. The eDAQ data acquisition system received vehicle-related signals from the VBOX III and the vehicle’s J1708 data bus. The VBOX III is a GPS-based system which provides data based on vehicle location such as speed, latitude, and longitude. This information was received by the eDAQ via a CAN vehicle bus module which interpreted the J1939 signals from the VBOX III. The eDAQ DAS received other vehicle information directly from the test vehicle’s J1708 data bus through a J1708 vehicle bus module. This information included odometer readings, Antilock Braking System (ABS) status flags, and the vehicle axle weights (from the Air-Weigh system). In addition to information obtained by the DAS, the ORNL comparison system included custom software run on a separate laptop computer to simulate a back-office system for driver records. Driver, carrier, and vehicle information such as medical certification, carrier DOT number, and tag number were hand-entered at the beginning of testing to simulate information that would be available in company and state records. The program was run throughout the testing to maintain current eight-day hours-of-service (HOS) records for each driver. Driver status was recorded on this computer based on the scanned driver’s license barcode and user-selected status. Post-processing of the data permitted the formatting of the data from the laptop and the DAS into an SDMS which could be compared to the SDMS of the WRI system.
Figure 9. ORNL Comparison System DAS
29
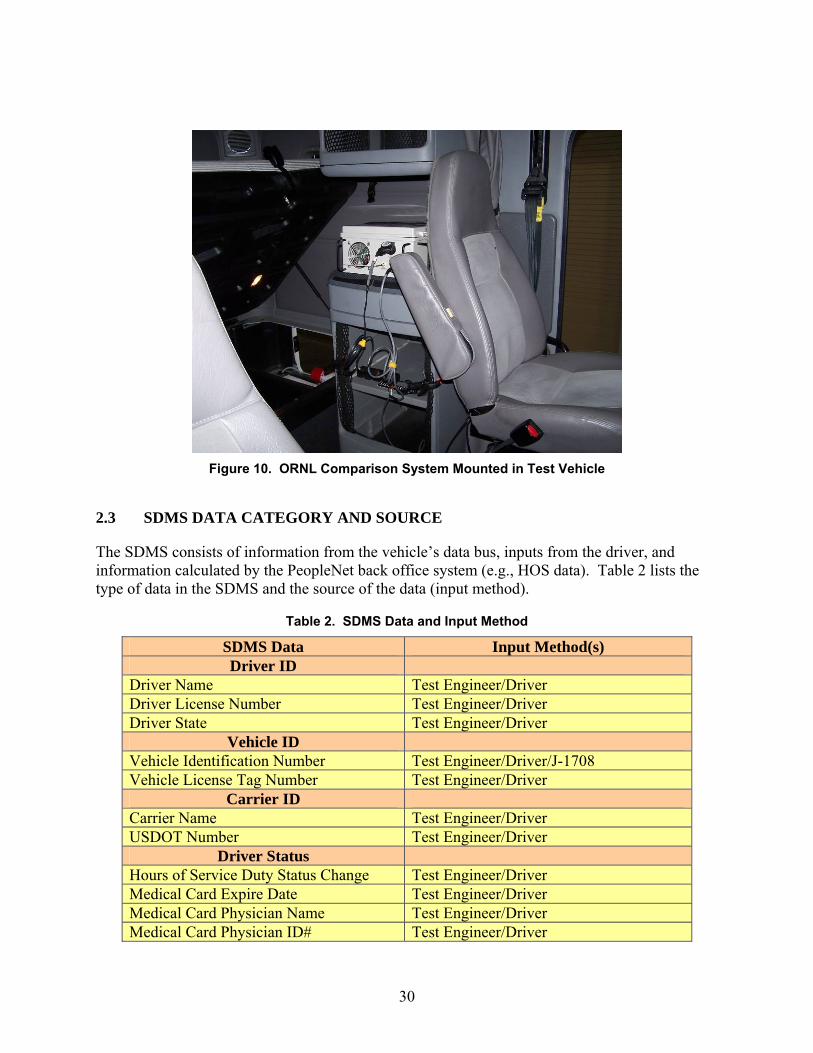
Figure 10. ORNL Comparison System Mounted in Test Vehicle
2.3 SDMS DATA CATEGORY AND SOURCE
The SDMS consists of information from the vehicle’s data bus, inputs from the driver, and information calculated by the PeopleNet back office system (e.g., HOS data). Table 2 lists the type of data in the SDMS and the source of the data (input method).
Table 2. SDMS Data and Input Method
SDMS Data Input Method(s) Driver ID
Driver Name Test Engineer/Driver Driver License Number Test Engineer/Driver Driver State Test Engineer/Driver
Vehicle ID Vehicle Identification Number Test Engineer/Driver/J-1708 Vehicle License Tag Number Test Engineer/Driver
Carrier ID Carrier Name Test Engineer/Driver USDOT Number Test Engineer/Driver
Driver Status Hours of Service Duty Status Change Test Engineer/Driver Medical Card Expire Date Test Engineer/Driver Medical Card Physician Name Test Engineer/Driver Medical Card Physician ID# Test Engineer/Driver
30
Medical Card State of Issue Test Engineer/Driver Vehicle Status
IFTA (International Fuel Tax Agreement)Year
Test Engineer/Driver
IFTA State of Issue Test Engineer/Driver IFTA Number Test Engineer/Driver Annual Inspection Date Test Engineer/Driver Annual Inspection Performed By Test Engineer/Driver Annual Inspection Number Test Engineer/Driver ABS Warning Lamp Status J-1708 ABS Brake control Status J-1708 ABS Retarder Control Status J-1708 ABS Off-Road Function Switch Status J-1708 Axle Weights J-1708
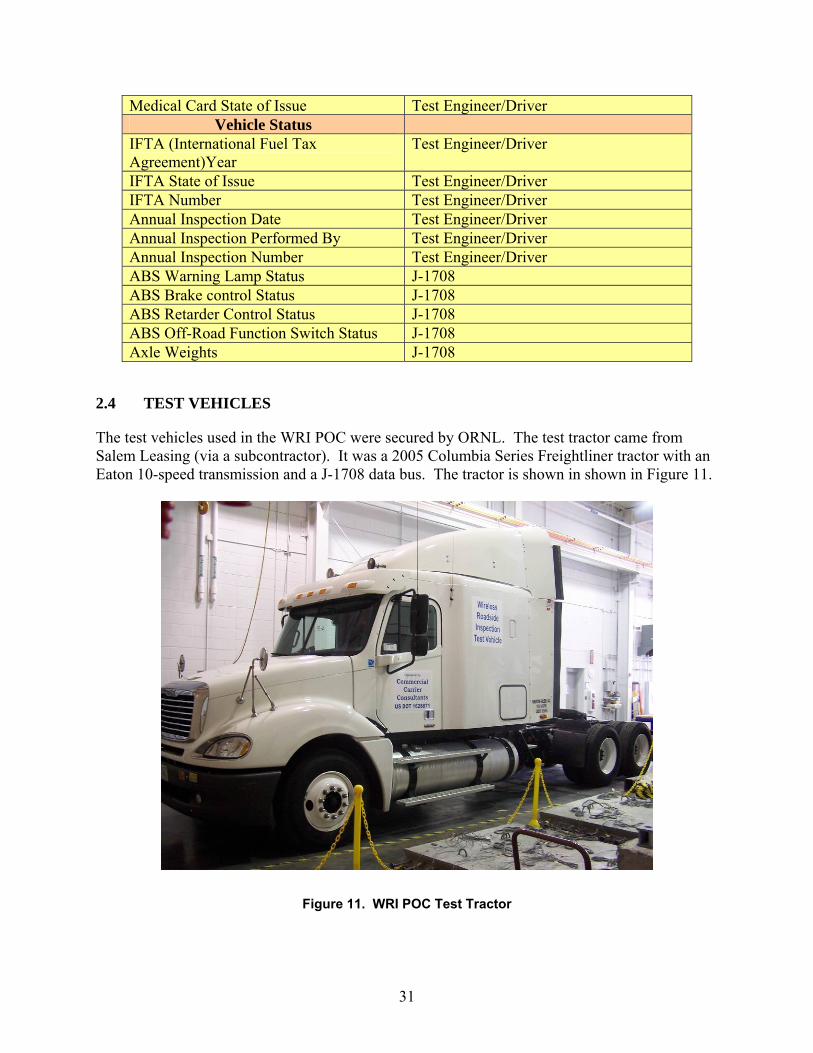
2.4 TEST VEHICLES
The test vehicles used in the WRI POC were secured by ORNL. The test tractor came from Salem Leasing (via a subcontractor). It was a 2005 Columbia Series Freightliner tractor with an Eaton 10-speed transmission and a J-1708 data bus. The tractor is shown in shown in Figure 11.
Figure 11. WRI POC Test Tractor
31
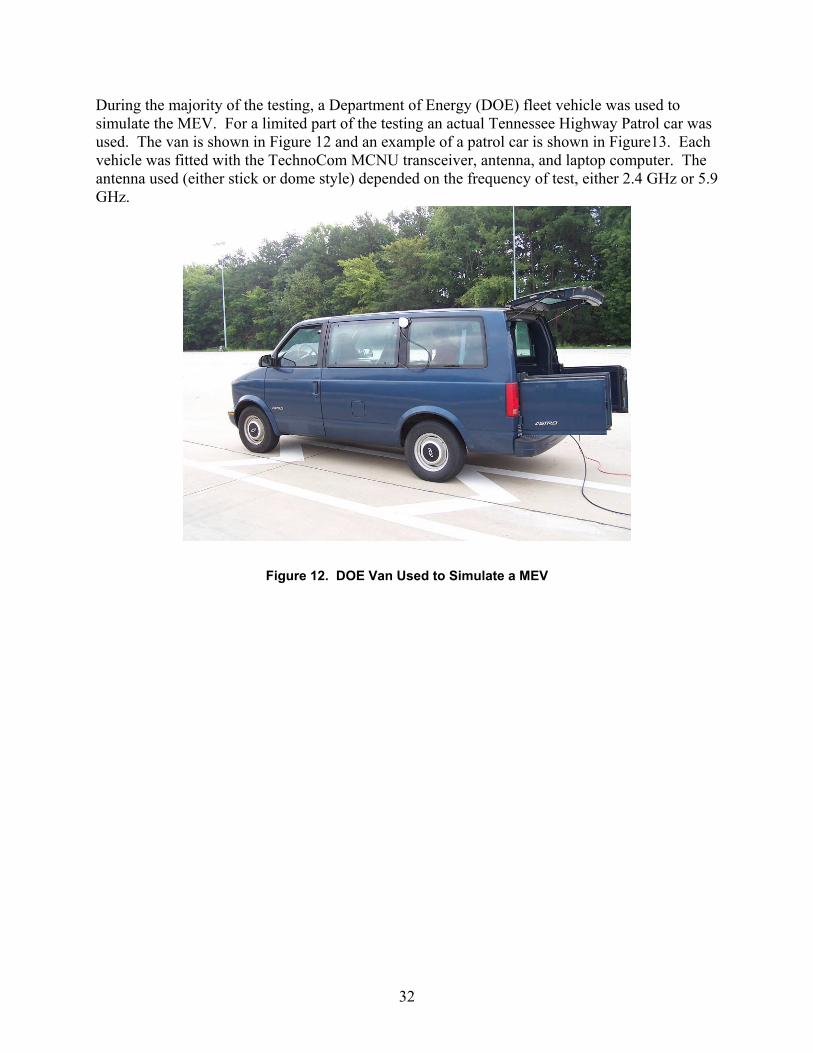
During the majority of the testing, a Department of Energy (DOE) fleet vehicle was used to simulate the MEV. For a limited part of the testing an actual Tennessee Highway Patrol car was used. The van is shown in Figure 12 and an example of a patrol car is shown in Figure13. Each vehicle was fitted with the TechnoCom MCNU transceiver, antenna, and laptop computer. The antenna used (either stick or dome style) depended on the frequency of test, either 2.4 GHz or 5.9 GHz.
Figure 12. DOE Van Used to Simulate a MEV
32
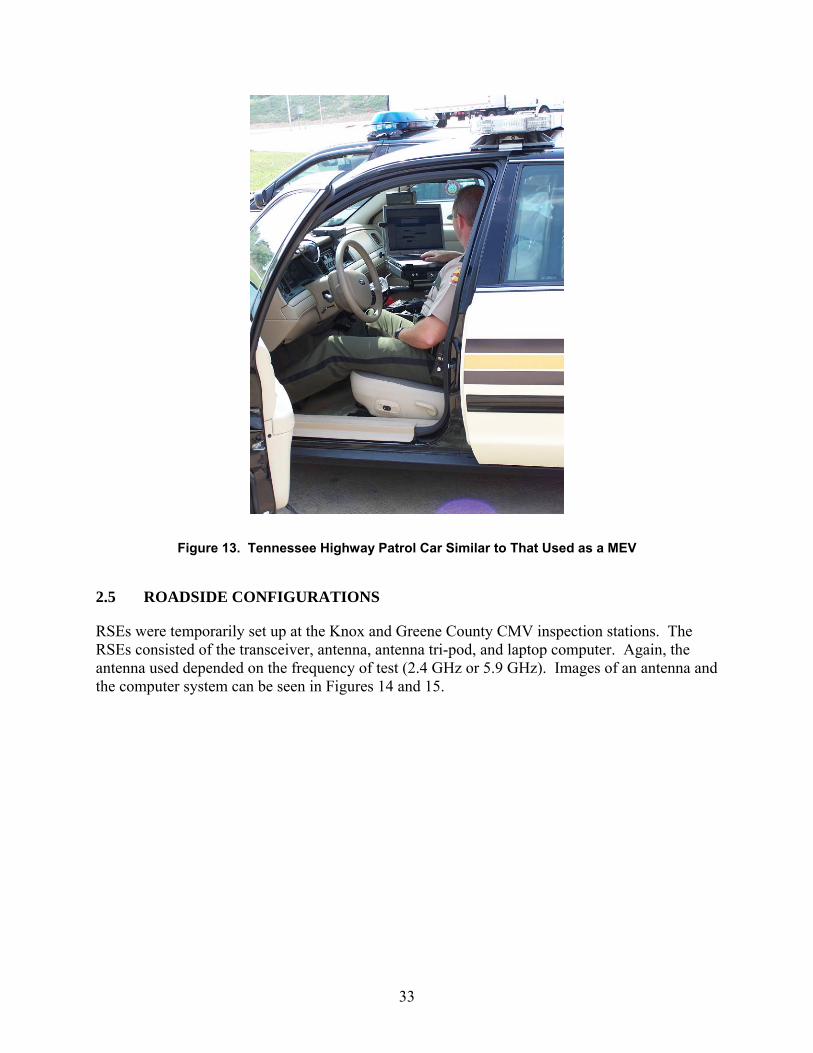
Figure 13. Tennessee Highway Patrol Car Similar to That Used as a MEV
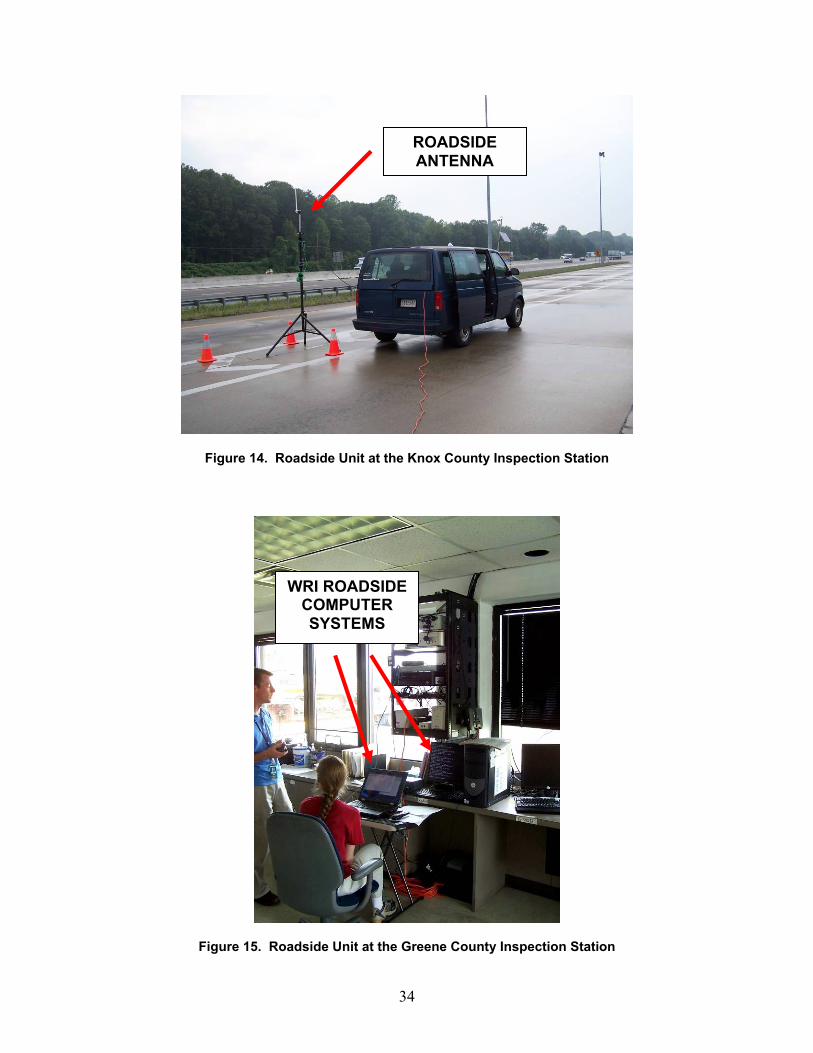
2.5 ROADSIDE CONFIGURATIONS
RSEs were temporarily set up at the Knox and Greene County CMV inspection stations. The RSEs consisted of the transceiver, antenna, antenna tri-pod, and laptop computer. Again, the antenna used depended on the frequency of test (2.4 GHz or 5.9 GHz). Images of an antenna and the computer system can be seen in Figures 14 and 15.
33
ROADSIDE ANTENNA
Figure 14. Roadside Unit at the Knox County Inspection Station
WRI ROADSIDE COMPUTER SYSTEMS
Figure 15. Roadside Unit at the Greene County Inspection Station
34
2.6 TESTING ELEMENTS
2.6.1 Tested Features For the POC, the following features and capabilities were tested:
1. The UWIS kernel’s ability to capture and store the list of SDMS data called out in section 2.3 of this document.
2. The UWIS kernel’s ability to accurately process the required elements of the SDMS. 3. The UWIS kernel’s ability to transfer the SDMS to the wireless transceiver using either
an RS-232 or USB connection. 4. The wireless transceiver’s ability to receive the SDMS from the UWIS kernel. 5. The wireless transceiver’s ability to receive requests for the SDMS from the roadside
under multiple conditions, as called out in the Test Plan, Section 15.3 (Appendix C). 6. The wireless transceiver’s ability to transmit the SDMS to the roadside under multiple
conditions, as called out in the Test Plan, Section 15.3 7. The wireless transceiver’s ability to receive requests for the SDMS from the MEV under
multiple conditions, as called out in the Test Plan, Section 15.3 8. The wireless transceiver’s ability to transmit the SDMS to an MEV under multiple
conditions, as called out in The Test Plan, Section 15.3
2.6.2 Features Not Tested For the POC, the following features were not tested:
1. The UWIS kernel’s ability to fully comply with FMCSA’s Proposed Rule Making on EOBRs for CMVs (395.16). It is desirable that the kernel devices meet, or closely approximate, 395.16. However, relative to the HOS for the POC, the testing was only concerned with finding status changes and total time in a status in order to construct the grid log.
2. Vehicle status information beyond what is already present on the test tractor. 3. Any features associated with the back office analysis and storage systems (The BOAs
were simulated for the WRI POC). 4. The ability of the UWIS to transmit and receive the SDMS in various terrains, in varying
levels of traffic congestion, and in the presence of electronic interference. 5. Transmission of data above 55 mph (test vehicle or MEV speed). 6. Definitive range limitations of the wireless transceivers.
2.6.3 Testing Entry and Exit Criteria Entry conditions included the following:
1. At least one UWIS kernel partner with operational equipment was desired. However, the absence of this would not have prevented Phase 1B testing of the transceiver using a simulated SDMS.
2. A contract for 5.9GHz and 2.4 GHz transceiver technology was desired. However, the absence of this would not have prevented the Phase 1A testing of the kernel.
3. Availability of necessary test equipment 4. Access to an acceptable test vehicle 5. Finalized test plan and test procedures 6. Suitable, safe test location(s)
35
Exit conditions include the following: 1. POC Phase 1A and 1B testing successfully completed 2. Expired POC test window (see section 1.6 for dates)
2.6.4 Technology Pass/Fail and Evaluation Criteria In the event that the partner’s kernel had failed to properly collect, structure, and output the SDMS information (e.g., no viable data output for monitoring; no SDMS, or SDMS with no data) a second testing opportunity would have taken place within seven calendar days. If the Partner’s technology had failed again to be able to produce the SDMS, no further testing would have been conducted and ORNL would have deemed this Partner to not be viable for the POC, per the MOU agreement. Note: The test team had a high expectancy with regard to the level of reliability (i.e., a match of input data to the SDMS of greater than 99.5%; see Section 3.1.3 for the data analysis). However, if the partner was able to construct the SDMS with a lower level of reliability, they would not have been rejected from the POC or from future efforts.
36
3.0 PROOF OF CONCEPT TEST
3.1 PHASE 1A
3.1.1 Introduction The objective of the Phase 1A test was to assess the UWIS kernel’s ability to format the SDMS. To accomplish this objective, ORNL configured a DAS to gather the comparison data (“ground truth”) using the system outlined in Section 2.2.5. This comparison system consisted of a SoMat eDAQ DAS configured to collect data at 5 Hz, and a laptop computer. ORNL had extensive experience with the DAS, which was used in other projects to collect over 250GB of spatial and databus information similar to the data needed for this project. The Kernel and the DAS were integrated onto a 2005 Freightliner Class-8 truck with a box trailer. The kernel included a system designed by mobile computing and communications provider PeopleNet. Due to time constraints, and in order to conserve funding2, PeopleNet created a system to demonstrate the potential of WRI with the understanding that a different approach and additional design and coding would be required for its commercial release. The demonstration system took advantage of PeopleNet’s existing eDriverLogs product in which available HOS are tracked on the OBC and can be communicated periodically to a back office system. The driver completed an electronic form on the OBC to provide key personal information such as name, medical exam doctor, medical exam date, and date of annual inspection among other information. In addition, a tethered bar code scanner allowed bar-coded CDL license number to be scanned in directly from the license itself. Once this data was entered and transmitted, the back office system recorded it, and the driver did not have to use the form again unless updates were required. In the truck itself, a laptop computer, running software supplied by PeopleNet was connected via a serial port to the PeopleNet OBC. This software polled the OBC every ten seconds (configurable interval) to obtain current GPS position and J1708 engine control module (ECM) data. Meanwhile, every five minutes (also configurable) the back office system sent the most current driver personnel data and HOS data on file to the laptop software, via the OBC. When the OBC received this data from the back office, it simultaneously sent back the most recent driver HOS data which would then be communicated back to the laptop five minutes later. The software on the laptop provided a continuously updated SDMS file containing personal and HOS data from seven-to-nine minutes old, as well as GPS and J1708 data that was approximately ten seconds old. This file was sent to the transceiver via FTP as soon as it was updated every ten seconds. For this POC, PeopleNet combined several existing processes which were created for other reasons in order to form a demonstration of WRI. Because the HOS data is already tracked on the OBC and the driver personal data could be stored on the OBC as well, a commercially releasable system would extract all data from the OBC at a higher frequency (i.e., every few
2 PeopleNet provided the system at no cost to the government.
37
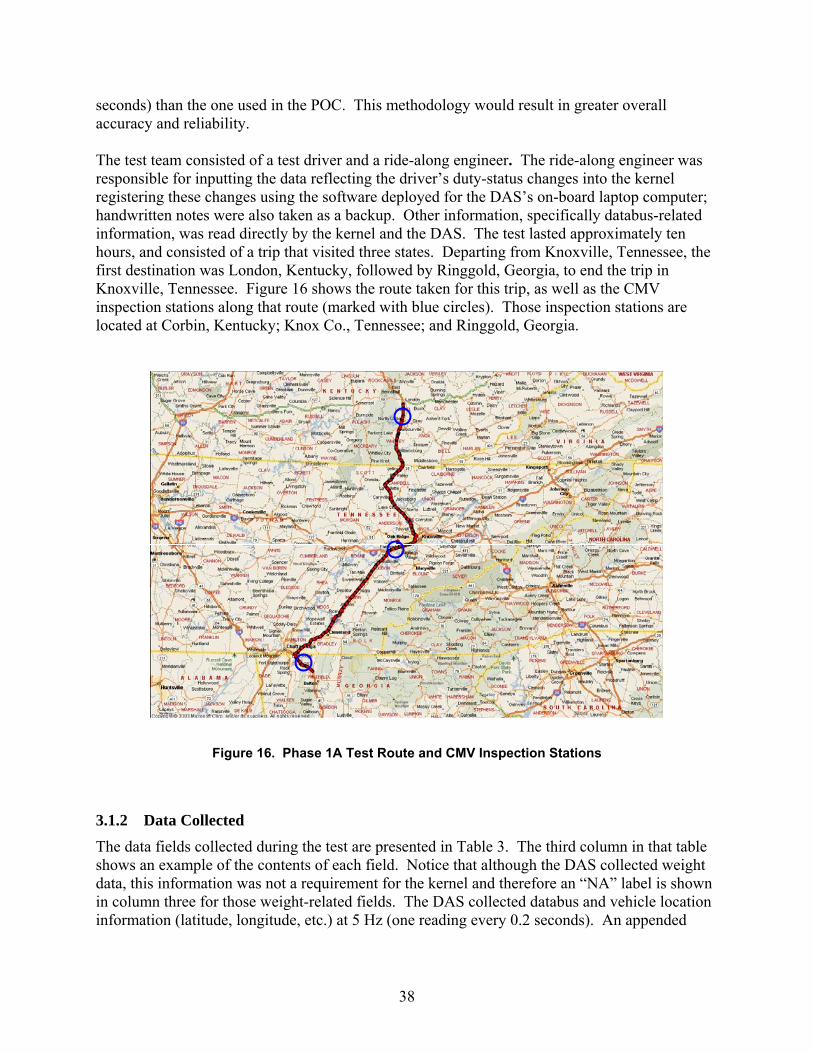
seconds) than the one used in the POC. This methodology would result in greater overall accuracy and reliability. The test team consisted of a test driver and a ride-along engineer. The ride-along engineer was responsible for inputting the data reflecting the driver’s duty-status changes into the kernel registering these changes using the software deployed for the DAS’s on-board laptop computer; handwritten notes were also taken as a backup. Other information, specifically databus-related information, was read directly by the kernel and the DAS. The test lasted approximately ten hours, and consisted of a trip that visited three states. Departing from Knoxville, Tennessee, the first destination was London, Kentucky, followed by Ringgold, Georgia, to end the trip in Knoxville, Tennessee. Figure 16 shows the route taken for this trip, as well as the CMV inspection stations along that route (marked with blue circles). Those inspection stations are located at Corbin, Kentucky; Knox Co., Tennessee; and Ringgold, Georgia.
Figure 16. Phase 1A Test Route and CMV Inspection Stations
3.1.2 Data Collected
The data fields collected during the test are presented in Table 3. The third column in that table shows an example of the contents of each field. Notice that although the DAS collected weight data, this information was not a requirement for the kernel and therefore an “NA” label is shown in column three for those weight-related fields. The DAS collected databus and vehicle location information (latitude, longitude, etc.) at 5 Hz (one reading every 0.2 seconds). An appended
38
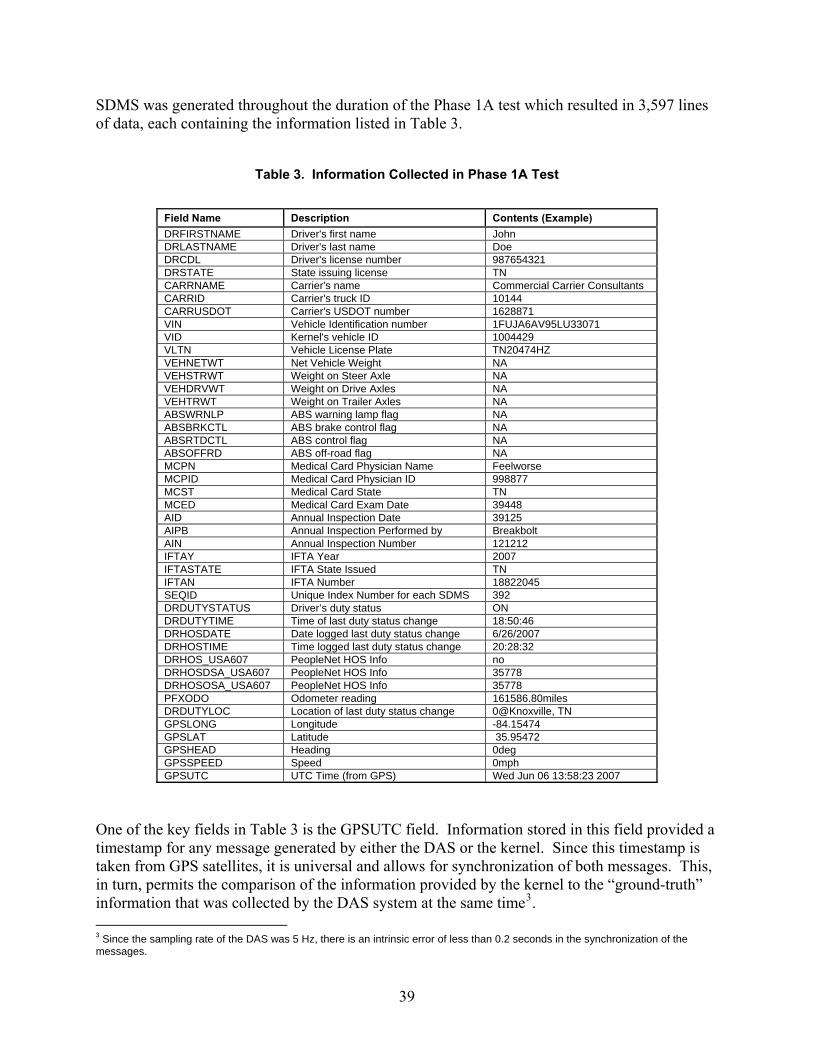
SDMS was generated throughout the duration of the Phase 1A test which resulted in 3,597 lines of data, each containing the information listed in Table 3.
Table 3. Information Collected in Phase 1A Test
Field Name Description Contents (Example) DRFIRSTNAME Driver's first name John DRLASTNAME Driver's last name Doe DRCDL Driver's license number 987654321 DRSTATE State issuing license TN CARRNAME Carrier's name Commercial Carrier Consultants CARRID Carrier's truck ID 10144 CARRUSDOT Carrier's USDOT number 1628871 VIN Vehicle Identification number 1FUJA6AV95LU33071 VID Kernel's vehicle ID 1004429 VLTN Vehicle License Plate TN20474HZ VEHNETWT Net Vehicle Weight NA VEHSTRWT Weight on Steer Axle NA VEHDRVWT Weight on Drive Axles NA VEHTRWT Weight on Trailer Axles NA ABSWRNLP ABS warning lamp flag NA ABSBRKCTL ABS brake control flag NA ABSRTDCTL ABS control flag NA ABSOFFRD ABS off-road flag NA MCPN Medical Card Physician Name Feelworse MCPID Medical Card Physician ID 998877 MCST Medical Card State TN MCED Medical Card Exam Date 39448 AID Annual Inspection Date 39125 AIPB Annual Inspection Performed by Breakbolt AIN Annual Inspection Number 121212 IFTAY IFTA Year 2007 IFTASTATE IFTA State Issued TN IFTAN IFTA Number 18822045 SEQID Unique Index Number for each SDMS 392 DRDUTYSTATUS Driver’s duty status ON DRDUTYTIME Time of last duty status change 18:50:46 DRHOSDATE Date logged last duty status change 6/26/2007 DRHOSTIME Time logged last duty status change 20:28:32 DRHOS_USA607 PeopleNet HOS Info no DRHOSDSA_USA607 PeopleNet HOS Info 35778 DRHOSOSA_USA607 PeopleNet HOS Info 35778 PFXODO Odometer reading 161586.80miles DRDUTYLOC Location of last duty status change 0@Knoxville, TN GPSLONG Longitude -84.15474 GPSLAT Latitude 35.95472 GPSHEAD Heading 0deg GPSSPEED Speed 0mph GPSUTC UTC Time (from GPS) Wed Jun 06 13:58:23 2007
One of the key fields in Table 3 is the GPSUTC field. Information stored in this field provided a timestamp for any message generated by either the DAS or the kernel. Since this timestamp is taken from GPS satellites, it is universal and allows for synchronization of both messages. This, in turn, permits the comparison of the information provided by the kernel to the “ground-truth” information that was collected by the DAS system at the same time3. 3 Since the sampling rate of the DAS was 5 Hz, there is an intrinsic error of less than 0.2 seconds in the synchronization of the messages.
39
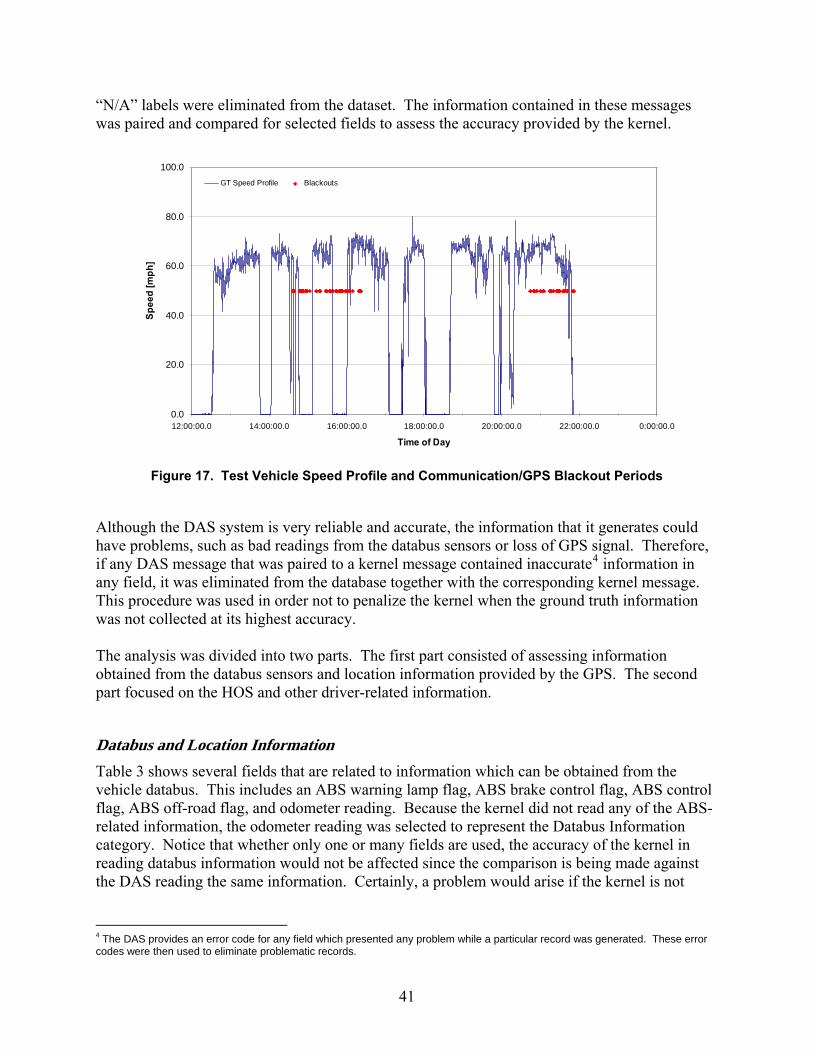
It should be noted that the GPSUTC value provided by the kernel is not a satellite timestamp, but rather the value of the OBC’s internal real-time clock. The difference between this clock and the UTC timestamp received from GPS satellite is checked once every second and if it becomes greater than 15 seconds (configurable interval), the clock is reset to the satellite time. This is done in order supply time as accurately as possible to other applications, even when satellite signals are degraded due to obstructions or atmospheric conditions. The test was run between 12:00:07 to 22:10:18.0 UTC (Universal Time Coordinates) corresponding to 08:00:07 to 18:10:18.0 Eastern Daylight Time (EDT). (Note: for the remaining of this chapter, all the times are shown in UTC.) During this interval, the kernel generated 3,597 messages composed of the information shown in Table 3. This represented an average rate of one message every 10.2 seconds, as expected based on the configuration discussed above; in the same period of time, the DAS generated 188,330 messages. Of the 3,597 messages, four had an “N/A” label in most of the fields indicating that the kernel was not able to generate the required information; the remaining 3,593 (or 99.9% of the messages) always contained information in all the fields showed in Table 3. There were 259 instances in which messages were repeated: that is, instances when due to communication or GPS problems the kernel was not able to generate a new message and therefore repeated the last one that was correctly created. Those “blackout” periods, which covered 7.2% of the test time, resulted in 44 intervals with no updated messages. The longest blackout interval was 317 seconds, the shortest was 30 seconds, and the average was 75.6 seconds. The blackout intervals occurred both with the truck moving and when it was stationary and were largely concentrated in two distinct periods of time. Figure 17 shows the speed profile of the test vehicle during the entire test, with the blackout periods superimposed. Some of the blackouts were explained by the area in which the truck was traveling. For example, between 14:37 and 16:21, the vehicle was traveling in the Cumberland Gap/Jellico Mountain Region (mostly going southbound on I-75) in the border between Kentucky and Tennessee; this mountainous area has known problems with cell-phone coverage. However, there were almost no blackout messages on the northbound leg of the trip within the same area. The other time interval with a high number of blackouts occurred between 20:44 and 21:50, when the vehicle was traveling on I-75 North, between Cleveland, Tennessee and Knoxville, Tennessee. This area has no particular known problems with cell-phone coverage.
3.1.3 Data Analysis
Kernel Generated Information In order to assess the accuracy of the information generated by the kernel, the messages that it generated were compared against “ground-truth” information collected by the DAS system. Out of the 188,330 messages collected by the comparison DAS, those with the closest timestamps to the ones corresponding to the 3,593 kernel messages were selected; the four messages with
40
“N/A” labels were eliminated from the dataset. The information contained in these messages was paired and compared for selected fields to assess the accuracy provided by the kernel.
0.0
20.0
40.0
60.0
80.0
100.0
12:00:00.0 14:00:00.0 16:00:00.0 18:00:00.0 20:00:00.0 22:00:00.0 0:00:00.0
Time of Day
Spee
d [m
ph]
0
1GT Speed Profile Blackouts
Figure 17. Test Vehicle Speed Profile and Communication/GPS Blackout Periods
Although the DAS system is very reliable and accurate, the information that it generates could have problems, such as bad readings from the databus sensors or loss of GPS signal. Therefore, if any DAS message that was paired to a kernel message contained inaccurate4 information in any field, it was eliminated from the database together with the corresponding kernel message. This procedure was used in order not to penalize the kernel when the ground truth information was not collected at its highest accuracy. The analysis was divided into two parts. The first part consisted of assessing information obtained from the databus sensors and location information provided by the GPS. The second part focused on the HOS and other driver-related information.
Databus and Location Information Table 3 shows several fields that are related to information which can be obtained from the vehicle databus. This includes an ABS warning lamp flag, ABS brake control flag, ABS control flag, ABS off-road flag, and odometer reading. Because the kernel did not read any of the ABS-related information, the odometer reading was selected to represent the Databus Information category. Notice that whether only one or many fields are used, the accuracy of the kernel in reading databus information would not be affected since the comparison is being made against the DAS reading the same information. Certainly, a problem would arise if the kernel is not
4 The DAS provides an error code for any field which presented any problem while a particular record was generated. These error codes were then used to eliminate problematic records.
41
querying the right sector of the databus, but that would result in an accuracy level of 0% and would rapidly be attributed to a gross reading error. Regarding the location of the vehicle, its position in terms of latitude and longitude coordinates were used to determine the accuracy of the kernel in providing spatial/temporal information. Also related to GPS-obtained information, vehicle speed was also used to determine the accuracy of the kernel in providing this type of information. While the kernel gathered this information based on its GPS, the comparison (DAS provided) information was obtained from the vehicle databus. In order to measure the accuracy of the kernel, the following procedure was used. First, using the timestamps added to both kernel and ground-truth messages by their respective data collection systems, the messages were paired such that their timestamps were ordered chronologically (as closely as possible). A database was created with these paired messages. Second, the ground-truth messages that presented any problems (such as no GPS readings, out-of-bound readings, or other types of errors) were eliminated from the database, together with their paired kernel messages. Finally, the remaining records were used for the assessment of the kernel accuracy. Two different approaches were used for this assessment. For both database and speed information, the absolute difference between the kernel (denoted by the subscript K) readings and ground-truth (denoted by the subscript GT) readings of the same field (dKGT) was computed and compared against a tolerance level (TL) for that measure. If dKGT was within the tolerance level (i.e., dKGT ≤ TL), then the kernel message was considered accurate at that level. The percentage of accurate messages at level TL was then calculated by simply dividing the number of accurate kernel messages by the total number of kernel messages in the database. In the case of the spatial location of the vehicle, rather than using the same procedure and comparing the latitude and longitude readings separately, the distance between the positions of the vehicle provided by the ground-truth system and the kernel (DKGT) was computed using the Haversine formula [1]. The remainder of the procedure was the same as in the previous case. That is, the distance DKGT was compared against a tolerance level TL, which allowed the determination of whether the information in the kernel message was accurate at that level. The accuracy of the kernel was then assessed as the percentage of spatially accurate messages out of the total number of kernel messages. It should be noted that, unlike the databus information, the GPS information depends on the device used. That is, although all the GPS devices use the same satellites, they may be optimized for different situations. If a high accuracy in the horizontal plane (lat, long) is desired, then the GPS device gives more weight to the satellites that are closest to the zenith. On the other hand, a higher accuracy in altitude involves using the satellites that are closest to the horizon. Since both the kernel and the DAS used different GPS devices, an error may have been introduced in the assessment of DKGT if these GPS devices had a different optimization algorithm. The source of this error is unknown, although it is probably negligible compared to the tolerance levels used in the evaluations.
42
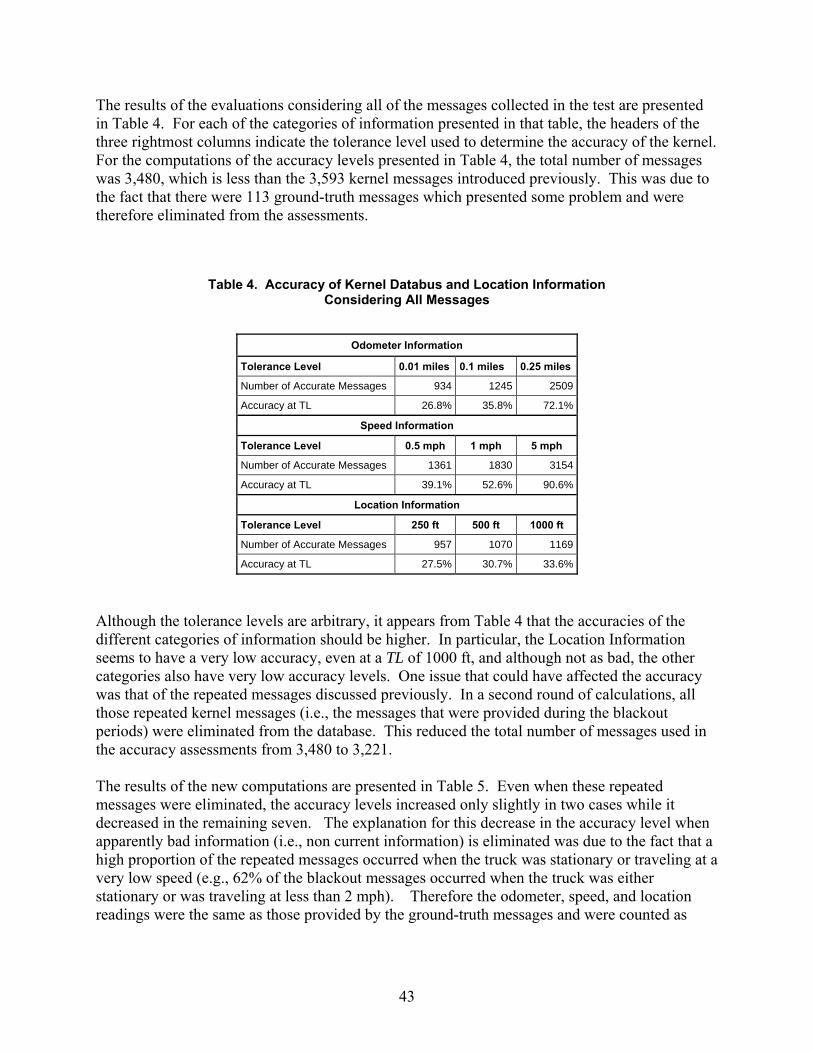
The results of the evaluations considering all of the messages collected in the test are presented in Table 4. For each of the categories of information presented in that table, the headers of the three rightmost columns indicate the tolerance level used to determine the accuracy of the kernel. For the computations of the accuracy levels presented in Table 4, the total number of messages was 3,480, which is less than the 3,593 kernel messages introduced previously. This was due to the fact that there were 113 ground-truth messages which presented some problem and were therefore eliminated from the assessments.
Table 4. Accuracy of Kernel Databus and Location Information Considering All Messages
Odometer Information
Tolerance Level 0.01 miles 0.1 miles 0.25 miles
Number of Accurate Messages 934 1245 2509
Accuracy at TL 26.8% 35.8% 72.1%
Speed Information
Tolerance Level 0.5 mph 1 mph 5 mph
Number of Accurate Messages 1361 1830 3154
Accuracy at TL 39.1% 52.6% 90.6%
Location Information
Tolerance Level 250 ft 500 ft 1000 ft
Number of Accurate Messages 957 1070 1169
Accuracy at TL 27.5% 30.7% 33.6%
Although the tolerance levels are arbitrary, it appears from Table 4 that the accuracies of the different categories of information should be higher. In particular, the Location Information seems to have a very low accuracy, even at a TL of 1000 ft, and although not as bad, the other categories also have very low accuracy levels. One issue that could have affected the accuracy was that of the repeated messages discussed previously. In a second round of calculations, all those repeated kernel messages (i.e., the messages that were provided during the blackout periods) were eliminated from the database. This reduced the total number of messages used in the accuracy assessments from 3,480 to 3,221. The results of the new computations are presented in Table 5. Even when these repeated messages were eliminated, the accuracy levels increased only slightly in two cases while it decreased in the remaining seven. The explanation for this decrease in the accuracy level when apparently bad information (i.e., non current information) is eliminated was due to the fact that a high proportion of the repeated messages occurred when the truck was stationary or traveling at a very low speed (e.g., 62% of the blackout messages occurred when the truck was either stationary or was traveling at less than 2 mph). Therefore the odometer, speed, and location readings were the same as those provided by the ground-truth messages and were counted as
43
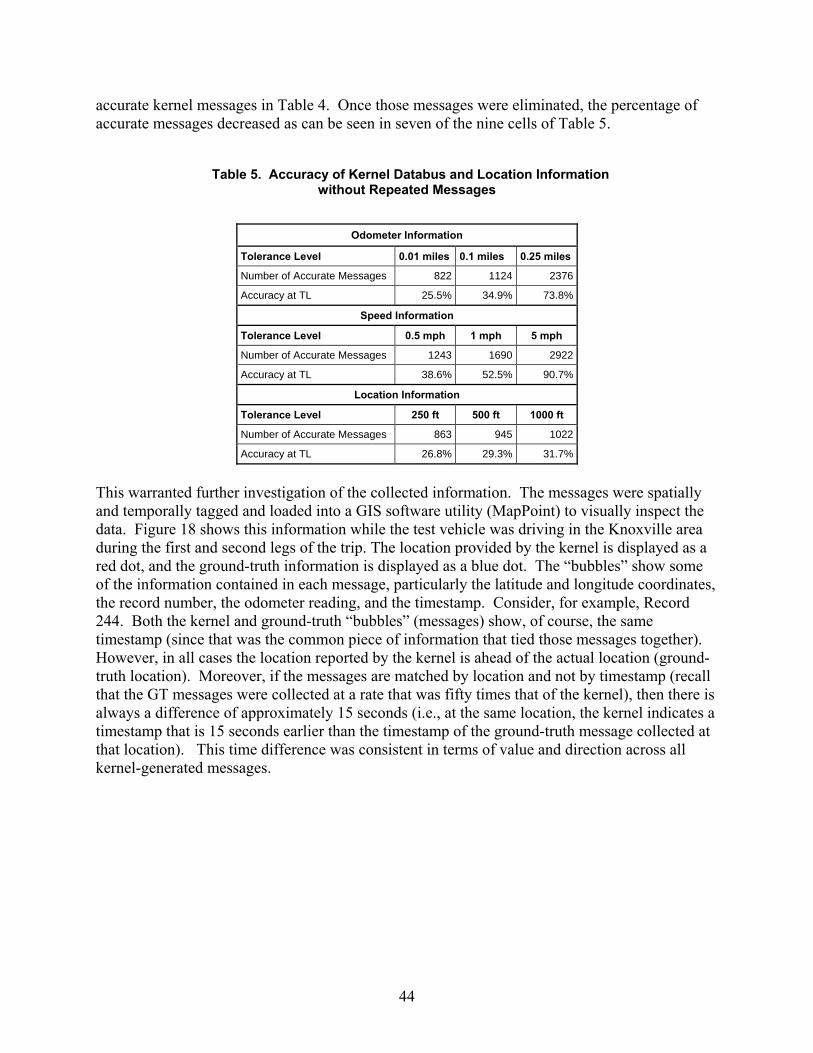
accurate kernel messages in Table 4. Once those messages were eliminated, the percentage of accurate messages decreased as can be seen in seven of the nine cells of Table 5.
Table 5. Accuracy of Kernel Databus and Location Information without Repeated Messages
Odometer Information
Tolerance Level 0.01 miles 0.1 miles 0.25 miles
Number of Accurate Messages 822 1124 2376
Accuracy at TL 25.5% 34.9% 73.8%
Speed Information
Tolerance Level 0.5 mph 1 mph 5 mph
Number of Accurate Messages 1243 1690 2922
Accuracy at TL 38.6% 52.5% 90.7%
Location Information
Tolerance Level 250 ft 500 ft 1000 ft
Number of Accurate Messages 863 945 1022
Accuracy at TL 26.8% 29.3% 31.7%
This warranted further investigation of the collected information. The messages were spatially and temporally tagged and loaded into a GIS software utility (MapPoint) to visually inspect the data. Figure 18 shows this information while the test vehicle was driving in the Knoxville area during the first and second legs of the trip. The location provided by the kernel is displayed as a red dot, and the ground-truth information is displayed as a blue dot. The “bubbles” show some of the information contained in each message, particularly the latitude and longitude coordinates, the record number, the odometer reading, and the timestamp. Consider, for example, Record 244. Both the kernel and ground-truth “bubbles” (messages) show, of course, the same timestamp (since that was the common piece of information that tied those messages together). However, in all cases the location reported by the kernel is ahead of the actual location (ground-truth location). Moreover, if the messages are matched by location and not by timestamp (recall that the GT messages were collected at a rate that was fifty times that of the kernel), then there is always a difference of approximately 15 seconds (i.e., at the same location, the kernel indicates a timestamp that is 15 seconds earlier than the timestamp of the ground-truth message collected at that location). This time difference was consistent in terms of value and direction across all kernel-generated messages.
44
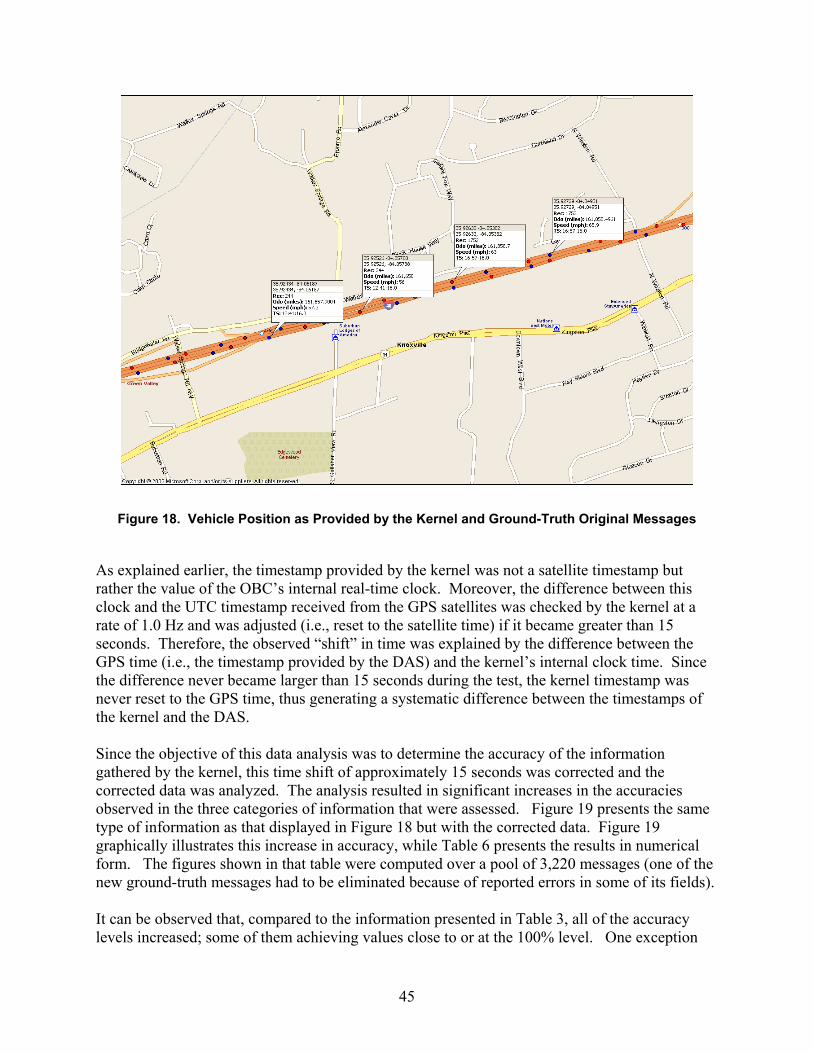
Figure 18. Vehicle Position as Provided by the Kernel and Ground-Truth Original Messages
As explained earlier, the timestamp provided by the kernel was not a satellite timestamp but rather the value of the OBC’s internal real-time clock. Moreover, the difference between this clock and the UTC timestamp received from the GPS satellites was checked by the kernel at a rate of 1.0 Hz and was adjusted (i.e., reset to the satellite time) if it became greater than 15 seconds. Therefore, the observed “shift” in time was explained by the difference between the GPS time (i.e., the timestamp provided by the DAS) and the kernel’s internal clock time. Since the difference never became larger than 15 seconds during the test, the kernel timestamp was never reset to the GPS time, thus generating a systematic difference between the timestamps of the kernel and the DAS. Since the objective of this data analysis was to determine the accuracy of the information gathered by the kernel, this time shift of approximately 15 seconds was corrected and the corrected data was analyzed. The analysis resulted in significant increases in the accuracies observed in the three categories of information that were assessed. Figure 19 presents the same type of information as that displayed in Figure 18 but with the corrected data. Figure 19 graphically illustrates this increase in accuracy, while Table 6 presents the results in numerical form. The figures shown in that table were computed over a pool of 3,220 messages (one of the new ground-truth messages had to be eliminated because of reported errors in some of its fields). It can be observed that, compared to the information presented in Table 3, all of the accuracy levels increased; some of them achieving values close to or at the 100% level. One exception
45
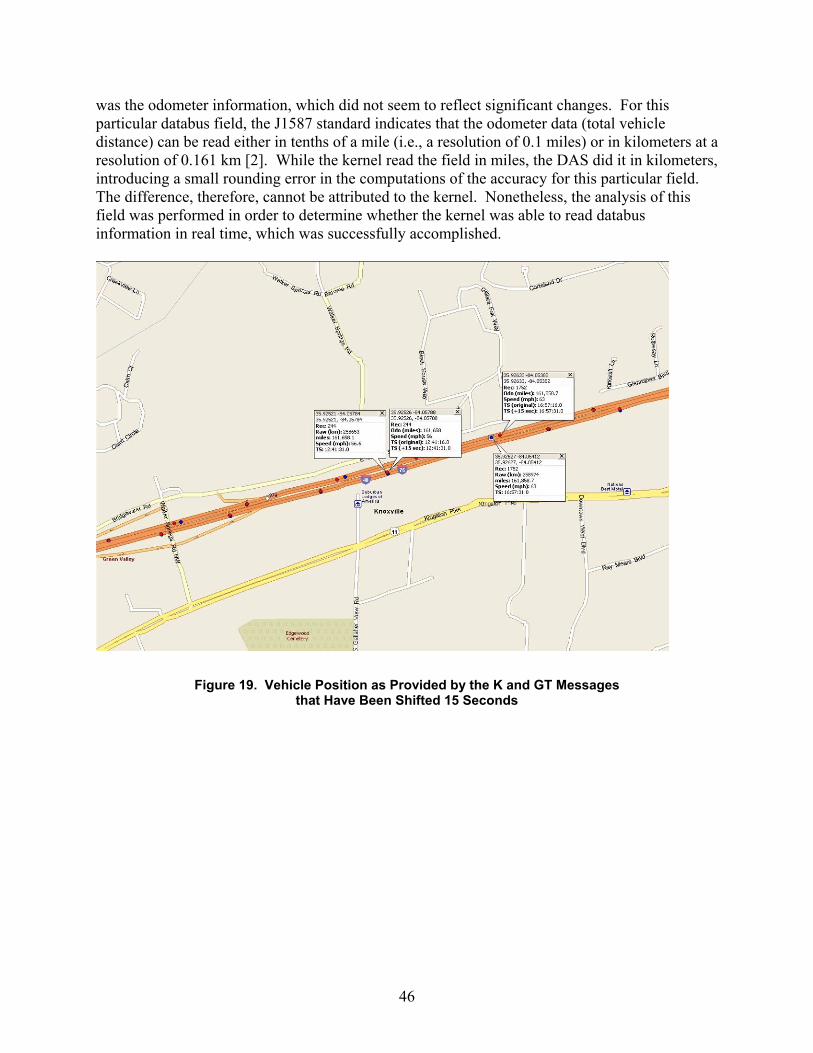
was the odometer information, which did not seem to reflect significant changes. For this particular databus field, the J1587 standard indicates that the odometer data (total vehicle distance) can be read either in tenths of a mile (i.e., a resolution of 0.1 miles) or in kilometers at a resolution of 0.161 km [2]. While the kernel read the field in miles, the DAS did it in kilometers, introducing a small rounding error in the computations of the accuracy for this particular field. The difference, therefore, cannot be attributed to the kernel. Nonetheless, the analysis of this field was performed in order to determine whether the kernel was able to read databus information in real time, which was successfully accomplished.
Figure 19. Vehicle Position as Provided by the K and GT Messages that Have Been Shifted 15 Seconds
46
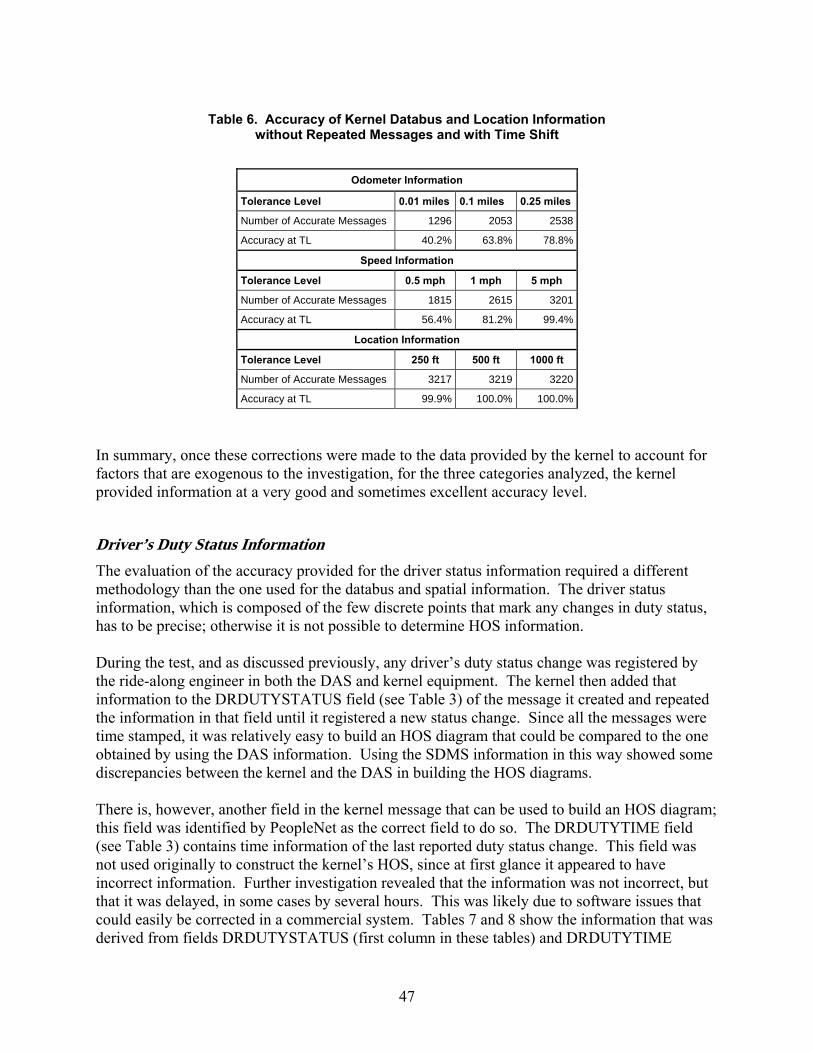
Table 6. Accuracy of Kernel Databus and Location Information without Repeated Messages and with Time Shift
Odometer Information
Tolerance Level 0.01 miles 0.1 miles 0.25 miles
Number of Accurate Messages 1296 2053 2538
Accuracy at TL 40.2% 63.8% 78.8%
Speed Information
Tolerance Level 0.5 mph 1 mph 5 mph
Number of Accurate Messages 1815 2615 3201
Accuracy at TL 56.4% 81.2% 99.4%
Location Information
Tolerance Level 250 ft 500 ft 1000 ft
Number of Accurate Messages 3217 3219 3220
Accuracy at TL 99.9% 100.0% 100.0%
In summary, once these corrections were made to the data provided by the kernel to account for factors that are exogenous to the investigation, for the three categories analyzed, the kernel provided information at a very good and sometimes excellent accuracy level.
Driver’s Duty Status Information The evaluation of the accuracy provided for the driver status information required a different methodology than the one used for the databus and spatial information. The driver status information, which is composed of the few discrete points that mark any changes in duty status, has to be precise; otherwise it is not possible to determine HOS information. During the test, and as discussed previously, any driver’s duty status change was registered by the ride-along engineer in both the DAS and kernel equipment. The kernel then added that information to the DRDUTYSTATUS field (see Table 3) of the message it created and repeated the information in that field until it registered a new status change. Since all the messages were time stamped, it was relatively easy to build an HOS diagram that could be compared to the one obtained by using the DAS information. Using the SDMS information in this way showed some discrepancies between the kernel and the DAS in building the HOS diagrams. There is, however, another field in the kernel message that can be used to build an HOS diagram; this field was identified by PeopleNet as the correct field to do so. The DRDUTYTIME field (see Table 3) contains time information of the last reported duty status change. This field was not used originally to construct the kernel’s HOS, since at first glance it appeared to have incorrect information. Further investigation revealed that the information was not incorrect, but that it was delayed, in some cases by several hours. This was likely due to software issues that could easily be corrected in a commercial system. Tables 7 and 8 show the information that was derived from fields DRDUTYSTATUS (first column in these tables) and DRDUTYTIME
47
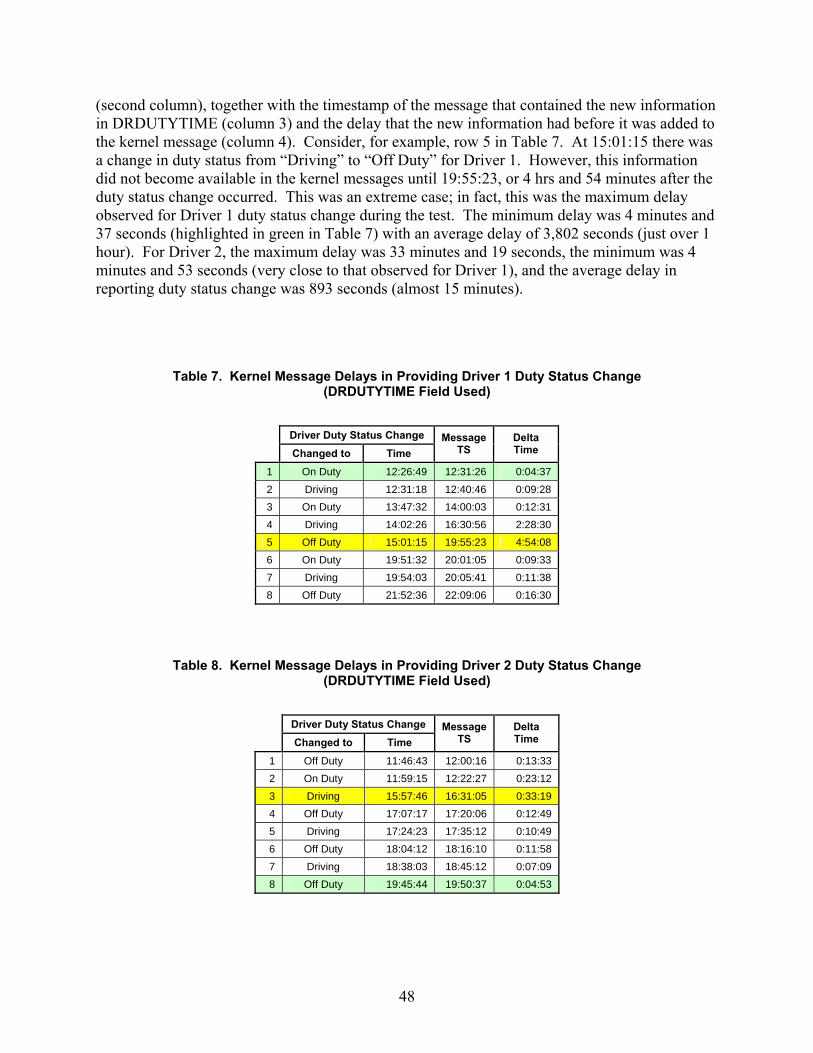
(second column), together with the timestamp of the message that contained the new information in DRDUTYTIME (column 3) and the delay that the new information had before it was added to the kernel message (column 4). Consider, for example, row 5 in Table 7. At 15:01:15 there was a change in duty status from “Driving” to “Off Duty” for Driver 1. However, this information did not become available in the kernel messages until 19:55:23, or 4 hrs and 54 minutes after the duty status change occurred. This was an extreme case; in fact, this was the maximum delay observed for Driver 1 duty status change during the test. The minimum delay was 4 minutes and 37 seconds (highlighted in green in Table 7) with an average delay of 3,802 seconds (just over 1 hour). For Driver 2, the maximum delay was 33 minutes and 19 seconds, the minimum was 4 minutes and 53 seconds (very close to that observed for Driver 1), and the average delay in reporting duty status change was 893 seconds (almost 15 minutes).
Table 7. Kernel Message Delays in Providing Driver 1 Duty Status Change (DRDUTYTIME Field Used)
Driver Duty Status Change
Changed to Time Message
TS Delta Time
1 On Duty 12:26:49 12:31:26 0:04:37
2 Driving 12:31:18 12:40:46 0:09:28 3 On Duty 13:47:32 14:00:03 0:12:31 4 Driving 14:02:26 16:30:56 2:28:30 5 Off Duty 15:01:15 19:55:23 4:54:08 6 On Duty 19:51:32 20:01:05 0:09:33 7 Driving 19:54:03 20:05:41 0:11:38 8 Off Duty 21:52:36 22:09:06 0:16:30
Table 8. Kernel Message Delays in Providing Driver 2 Duty Status Change (DRDUTYTIME Field Used)
Driver Duty Status Change
Changed to Time Message
TS Delta Time
1 Off Duty 11:46:43 12:00:16 0:13:33 2 On Duty 11:59:15 12:22:27 0:23:12 3 Driving 15:57:46 16:31:05 0:33:19 4 Off Duty 17:07:17 17:20:06 0:12:49 5 Driving 17:24:23 17:35:12 0:10:49 6 Off Duty 18:04:12 18:16:10 0:11:58 7 Driving 18:38:03 18:45:12 0:07:09 8 Off Duty 19:45:44 19:50:37 0:04:53
48

Even though there were substantial delays in reporting driver duty status changes, the information extracted from the DRDUTYTIME filed (combined to the DRDUTYSTATUS field) allowed the building of HOS diagrams that were much more accurate than the ones built using the duty status field combined with the message timestamp5. Those HOS diagrams are shown in Figures 20 and 21, with the disagreements between ground-truth and kernel data highlighted in light blue. Considering the total length of the test (i.e., 10 hours and 10 minutes), the agreements between the ground-truth and kernel diagrams amounted to 94.7% and 93.5% of that time for Driver 1 and 2, respectively. Although those accuracy levels are high, they still fall short of 100% accuracy. A closer observation of the diagrams presented in Figures 20 and 21 shows that most of the disagreements occur during a time period in which many “blackouts” were observed (see the “Kernel Generated Information” subsection of Section 3.1.3 and Figure 17). It is customary for devices that use wireless communication to store messages locally and relay them later if the communication links are unavailable. Because the observed disagreements occurred during these blackout periods, it appears that there was some software problem either in storing the information locally or relaying that information later once the communication links were reestablished. There was, however, another disagreement that occurred outside the blackout periods. In Figure 20, during the period from 13:45:15 to 14:01:38, where the truck was stopped (see Figure 17), the ground-truth data indicated that Driver 1 was “On Duty” while the kernel data showed that driver as “Driving.” This could be another software issue that would require further investigation since even during the blackout periods, the discrepancy observed in Figure 21 occurred at points that were preceded by or followed by a stopping period. That is, the largest discrepancy occurred between 15:05:30 and 15:38:51 where the ground truth system indicated that Driver 2 went from “On Duty” to “Driving” to “On Duty,” while the kernel showed that Driver 2 was “On Duty” for the entire period. Notice that immediately before the start of this period, the truck was stopped between 14:47:28 and 15:05:30, and it was also stopped after the end of the discrepancy period between 15:38:51 and 16:00:14 (see Figure 17). Both types of problems seem to be somehow related and are probably due to software issues which, once addressed and resolved, would allow the system to generate HOS diagrams with 100% accuracy.
5 These delay problems, which were software problems, were subsequently fixed by PeopleNet. However, since the Test Plan had only one day of testing for Phase 1A, it was not possible determine if these issues were resolved completely. This will be done in the next phase of the project.
49
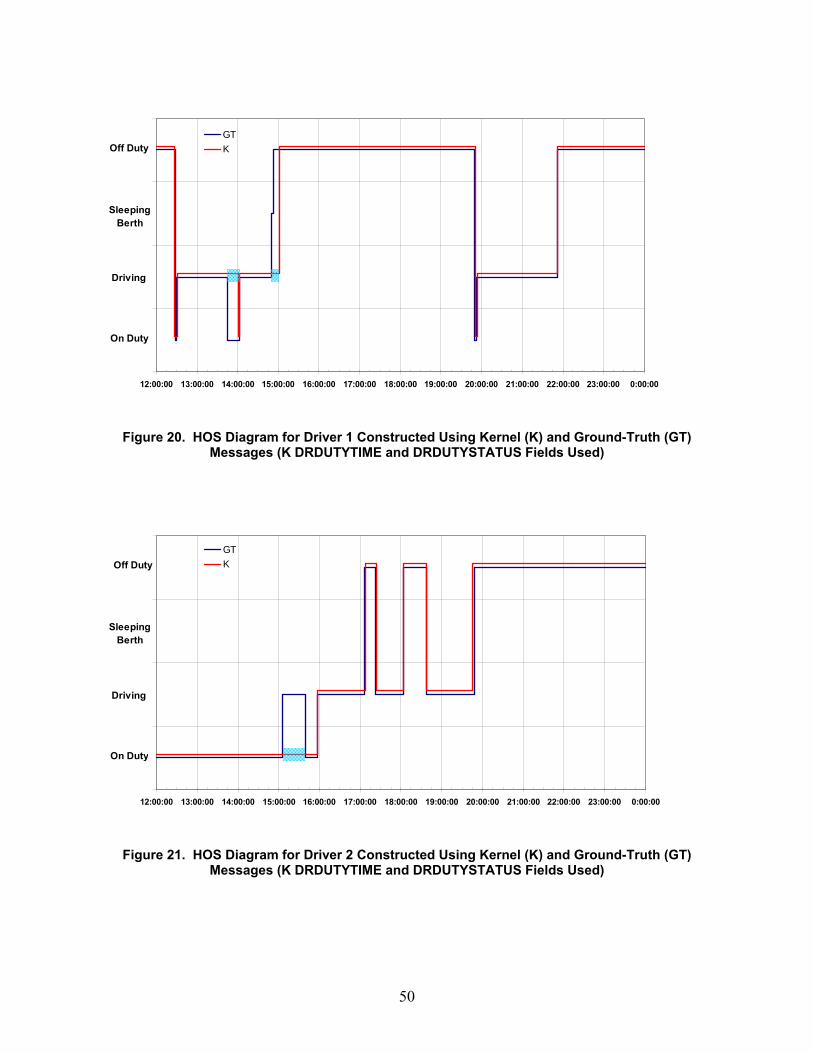
1.0000
2.0000
3.0000
4.0000
5.0000
12:00:00 13:00:00 14:00:00 15:00:00 16:00:00 17:00:00 18:00:00 19:00:00 20:00:00 21:00:00 22:00:00 23:00:00 0:00:00
GTKOff Duty
Sleeping Berth
Driving
On Duty
Figure 20. HOS Diagram for Driver 1 Constructed Using Kernel (K) and Ground-Truth (GT) Messages (K DRDUTYTIME and DRDUTYSTATUS Fields Used)
1.0000
2.0000
3.0000
4.0000
5.0000
12:00:00 13:00:00 14:00:00 15:00:00 16:00:00 17:00:00 18:00:00 19:00:00 20:00:00 21:00:00 22:00:00 23:00:00 0:00:00
GTKOff Duty
Sleeping Berth
Driving
On Duty
Figure 21. HOS Diagram for Driver 2 Constructed Using Kernel (K) and Ground-Truth (GT) Messages (K DRDUTYTIME and DRDUTYSTATUS Fields Used)
50
3.1.4 Phase 1A Test Conclusions and Future Work The results of the test performed in Phase 1A demonstrated that it was possible for the kernel to gather information from different sources (including EOBR and vehicle databus), assemble the required SDMS, and make it available for transmission to an RSU or MEV. The frequency at which these messages were generated was very high (i.e., one SDMS every 10.2 seconds on average) for the type of application considered here. The largest observed delay in generating a new SDMS was just over 5 minutes, which was considered to be adequate. The accuracy of the information posted on the SDMS was measured within a certain tolerance, which was arbitrarily set at three levels. After some synchronization problems between the ground-truth and kernel messages were addressed, the information related to the spatial position of the vehicle (obtained from GPS readings) was 100% accurate when considering a tolerance of 1,000 ft. Speed, which was also determined via the kernel’s GPS, presented an accuracy level above 80% when considering a tolerance of 1 mph or less, and close to 100% with a tolerance of 5 mph or less. Odometer information, which was read from the vehicle’s databus, was 79% accurate when considering a tolerance of 0.25 miles. The HOS information presented some problems. When a HOS diagram was built by combining driver status flags posted on the SDMS and the timestamp of that message, differences with the ground-truth’s HOS were found. Those differences were substantially reduced (although not completely eliminated) when a different SDMS field was used. However, the information posted in this field, although very accurate, was not relayed in a timely fashion. Most of the observed delays were in the 5-to-20 minute range (which was expected); although in two instances they were measured in hours. There were also a few occasions in which a status change was either not registered or was not posted in the SDMS. Since the accuracy of the information contained in the SDMS seems to be acceptable, the main area of future work should focus on the timeliness of the HOS information that is added to the message. Most of the observed problems were attributed to communication and software issues. In fact, during the pre-testing period, several related problems were identified by ORNL and addressed by the partner supplying the kernel information. It appears that some aspects of these problems were not fully resolved by the time of the test. Nevertheless, those problems do not seem to be insurmountable and should be easily resolved during the next phase. In future tests it is important that more detailed technical discussions are carried out between the testers (ORNL) and the developers of the system so that there is a better understanding of the idiosyncrasies of both the DAS and the kernel. This approach would avoid issues such as reading the same field in different units (e.g., odometer) or providing timestamps that are generated by different devices (thus introducing synchronization problems).
51
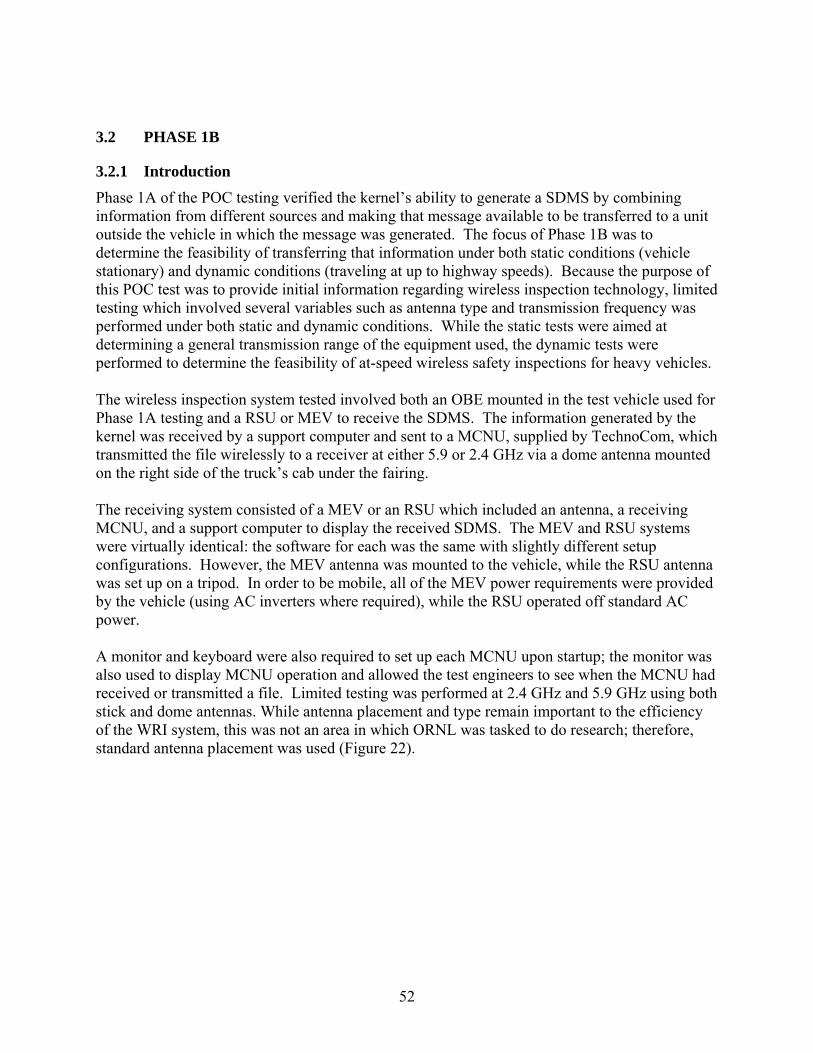
3.2 PHASE 1B
3.2.1 Introduction Phase 1A of the POC testing verified the kernel’s ability to generate a SDMS by combining information from different sources and making that message available to be transferred to a unit outside the vehicle in which the message was generated. The focus of Phase 1B was to determine the feasibility of transferring that information under both static conditions (vehicle stationary) and dynamic conditions (traveling at up to highway speeds). Because the purpose of this POC test was to provide initial information regarding wireless inspection technology, limited testing which involved several variables such as antenna type and transmission frequency was performed under both static and dynamic conditions. While the static tests were aimed at determining a general transmission range of the equipment used, the dynamic tests were performed to determine the feasibility of at-speed wireless safety inspections for heavy vehicles. The wireless inspection system tested involved both an OBE mounted in the test vehicle used for Phase 1A testing and a RSU or MEV to receive the SDMS. The information generated by the kernel was received by a support computer and sent to a MCNU, supplied by TechnoCom, which transmitted the file wirelessly to a receiver at either 5.9 or 2.4 GHz via a dome antenna mounted on the right side of the truck’s cab under the fairing. The receiving system consisted of a MEV or an RSU which included an antenna, a receiving MCNU, and a support computer to display the received SDMS. The MEV and RSU systems were virtually identical: the software for each was the same with slightly different setup configurations. However, the MEV antenna was mounted to the vehicle, while the RSU antenna was set up on a tripod. In order to be mobile, all of the MEV power requirements were provided by the vehicle (using AC inverters where required), while the RSU operated off standard AC power. A monitor and keyboard were also required to set up each MCNU upon startup; the monitor was also used to display MCNU operation and allowed the test engineers to see when the MCNU had received or transmitted a file. Limited testing was performed at 2.4 GHz and 5.9 GHz using both stick and dome antennas. While antenna placement and type remain important to the efficiency of the WRI system, this was not an area in which ORNL was tasked to do research; therefore, standard antenna placement was used (Figure 22).
52
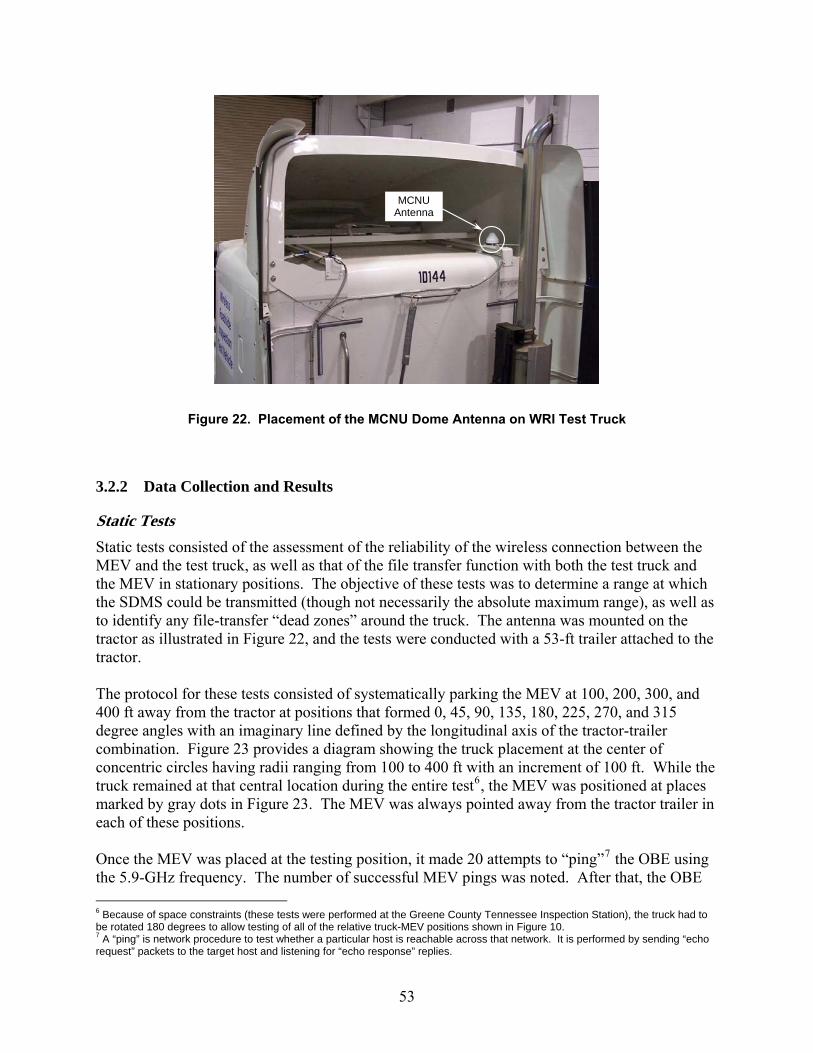
MCNU Antenna
Figure 22. Placement of the MCNU Dome Antenna on WRI Test Truck
3.2.2 Data Collection and Results
Static Tests Static tests consisted of the assessment of the reliability of the wireless connection between the MEV and the test truck, as well as that of the file transfer function with both the test truck and the MEV in stationary positions. The objective of these tests was to determine a range at which the SDMS could be transmitted (though not necessarily the absolute maximum range), as well as to identify any file-transfer “dead zones” around the truck. The antenna was mounted on the tractor as illustrated in Figure 22, and the tests were conducted with a 53-ft trailer attached to the tractor. The protocol for these tests consisted of systematically parking the MEV at 100, 200, 300, and 400 ft away from the tractor at positions that formed 0, 45, 90, 135, 180, 225, 270, and 315 degree angles with an imaginary line defined by the longitudinal axis of the tractor-trailer combination. Figure 23 provides a diagram showing the truck placement at the center of concentric circles having radii ranging from 100 to 400 ft with an increment of 100 ft. While the truck remained at that central location during the entire test6, the MEV was positioned at places marked by gray dots in Figure 23. The MEV was always pointed away from the tractor trailer in each of these positions. Once the MEV was placed at the testing position, it made 20 attempts to “ping”7 the OBE using the 5.9-GHz frequency. The number of successful MEV pings was noted. After that, the OBE 6 Because of space constraints (these tests were performed at the Greene County Tennessee Inspection Station), the truck had to be rotated 180 degrees to allow testing of all of the relative truck-MEV positions shown in Figure 10. 7 A “ping” is network procedure to test whether a particular host is reachable across that network. It is performed by sending “echo request” packets to the target host and listening for “echo response” replies.
53
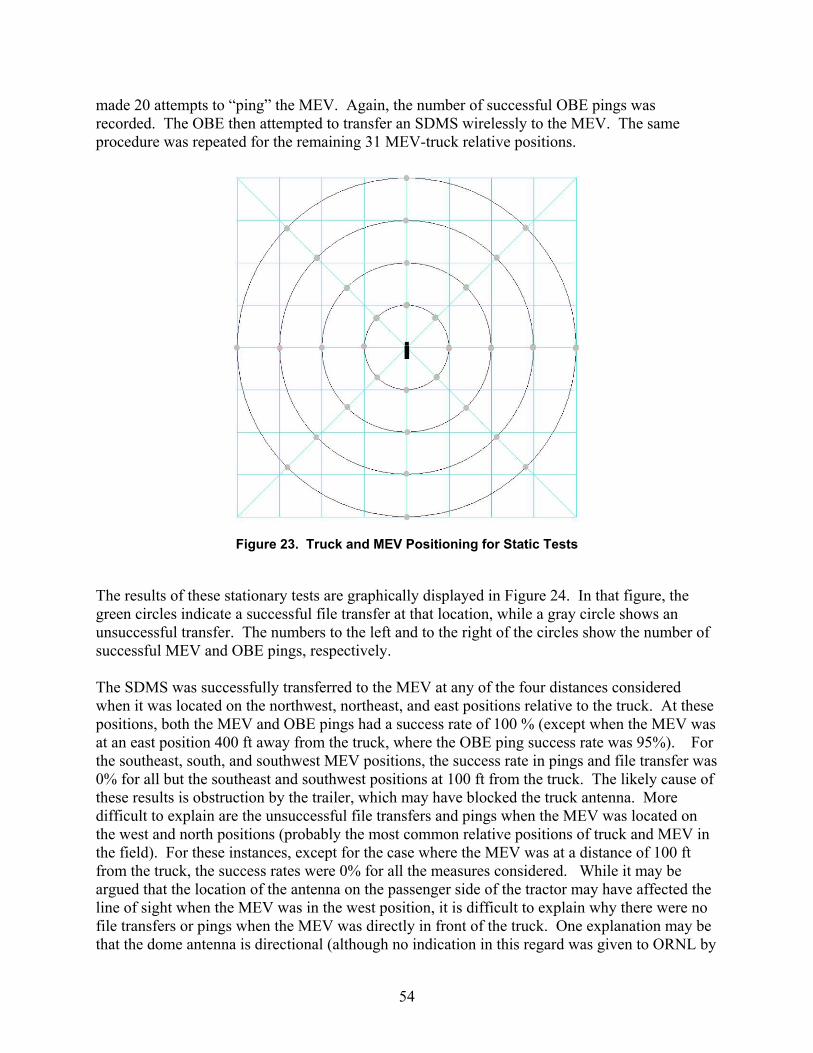
made 20 attempts to “ping” the MEV. Again, the number of successful OBE pings was recorded. The OBE then attempted to transfer an SDMS wirelessly to the MEV. The same procedure was repeated for the remaining 31 MEV-truck relative positions.
Figure 23. Truck and MEV Positioning for Static Tests
The results of these stationary tests are graphically displayed in Figure 24. In that figure, the green circles indicate a successful file transfer at that location, while a gray circle shows an unsuccessful transfer. The numbers to the left and to the right of the circles show the number of successful MEV and OBE pings, respectively. The SDMS was successfully transferred to the MEV at any of the four distances considered when it was located on the northwest, northeast, and east positions relative to the truck. At these positions, both the MEV and OBE pings had a success rate of 100 % (except when the MEV was at an east position 400 ft away from the truck, where the OBE ping success rate was 95%). For the southeast, south, and southwest MEV positions, the success rate in pings and file transfer was 0% for all but the southeast and southwest positions at 100 ft from the truck. The likely cause of these results is obstruction by the trailer, which may have blocked the truck antenna. More difficult to explain are the unsuccessful file transfers and pings when the MEV was located on the west and north positions (probably the most common relative positions of truck and MEV in the field). For these instances, except for the case where the MEV was at a distance of 100 ft from the truck, the success rates were 0% for all the measures considered. While it may be argued that the location of the antenna on the passenger side of the tractor may have affected the line of sight when the MEV was in the west position, it is difficult to explain why there were no file transfers or pings when the MEV was directly in front of the truck. One explanation may be that the dome antenna is directional (although no indication in this regard was given to ORNL by
54
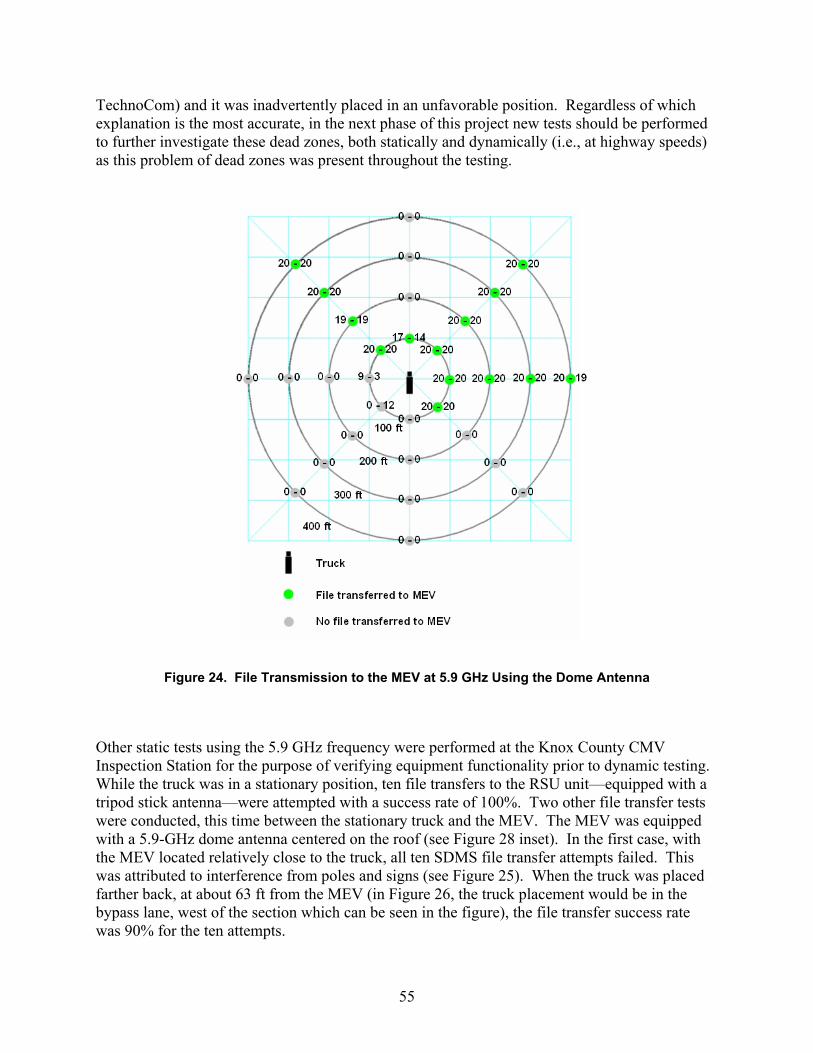
TechnoCom) and it was inadvertently placed in an unfavorable position. Regardless of which explanation is the most accurate, in the next phase of this project new tests should be performed to further investigate these dead zones, both statically and dynamically (i.e., at highway speeds) as this problem of dead zones was present throughout the testing.
Figure 24. File Transmission to the MEV at 5.9 GHz Using the Dome Antenna
Other static tests using the 5.9 GHz frequency were performed at the Knox County CMV Inspection Station for the purpose of verifying equipment functionality prior to dynamic testing. While the truck was in a stationary position, ten file transfers to the RSU unit—equipped with a tripod stick antenna—were attempted with a success rate of 100%. Two other file transfer tests were conducted, this time between the stationary truck and the MEV. The MEV was equipped with a 5.9-GHz dome antenna centered on the roof (see Figure 28 inset). In the first case, with the MEV located relatively close to the truck, all ten SDMS file transfer attempts failed. This was attributed to interference from poles and signs (see Figure 25). When the truck was placed farther back, at about 63 ft from the MEV (in Figure 26, the truck placement would be in the bypass lane, west of the section which can be seen in the figure), the file transfer success rate was 90% for the ten attempts.
55
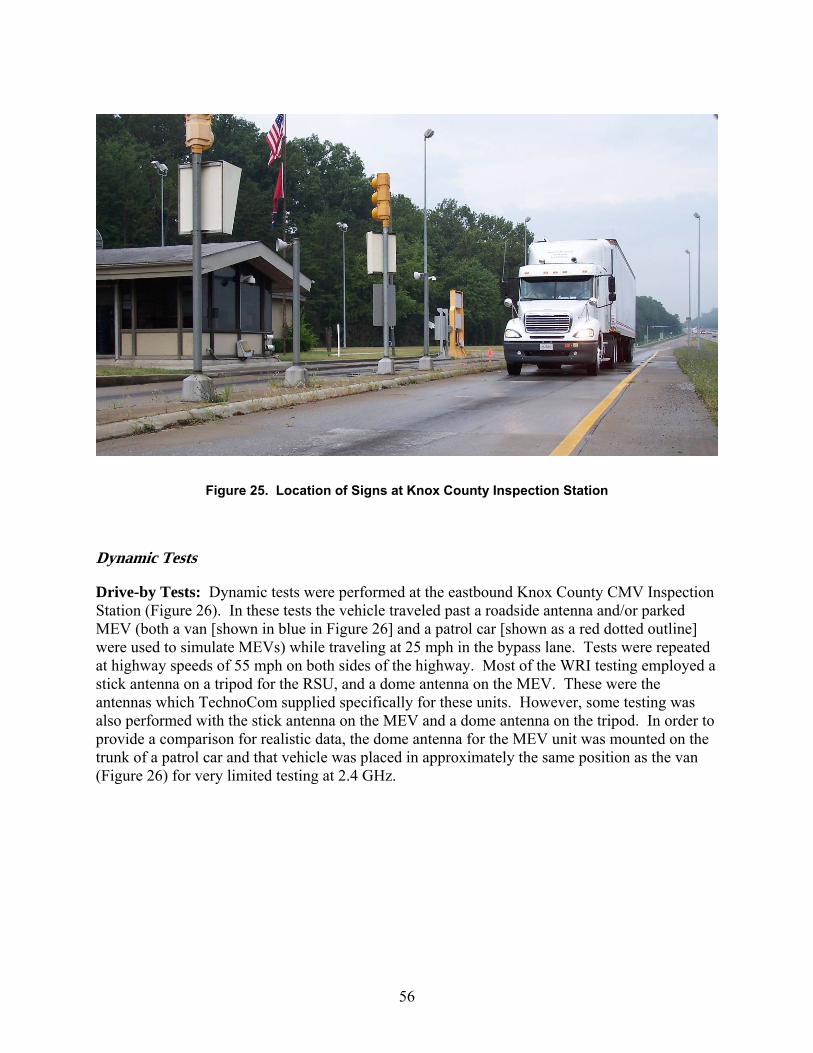
Figure 25. Location of Signs at Knox County Inspection Station
Dynamic Tests
Drive-by Tests: Dynamic tests were performed at the eastbound Knox County CMV Inspection Station (Figure 26). In these tests the vehicle traveled past a roadside antenna and/or parked MEV (both a van [shown in blue in Figure 26] and a patrol car [shown as a red dotted outline] were used to simulate MEVs) while traveling at 25 mph in the bypass lane. Tests were repeated at highway speeds of 55 mph on both sides of the highway. Most of the WRI testing employed a stick antenna on a tripod for the RSU, and a dome antenna on the MEV. These were the antennas which TechnoCom supplied specifically for these units. However, some testing was also performed with the stick antenna on the MEV and a dome antenna on the tripod. In order to provide a comparison for realistic data, the dome antenna for the MEV unit was mounted on the trunk of a patrol car and that vehicle was placed in approximately the same position as the van (Figure 26) for very limited testing at 2.4 GHz.
56
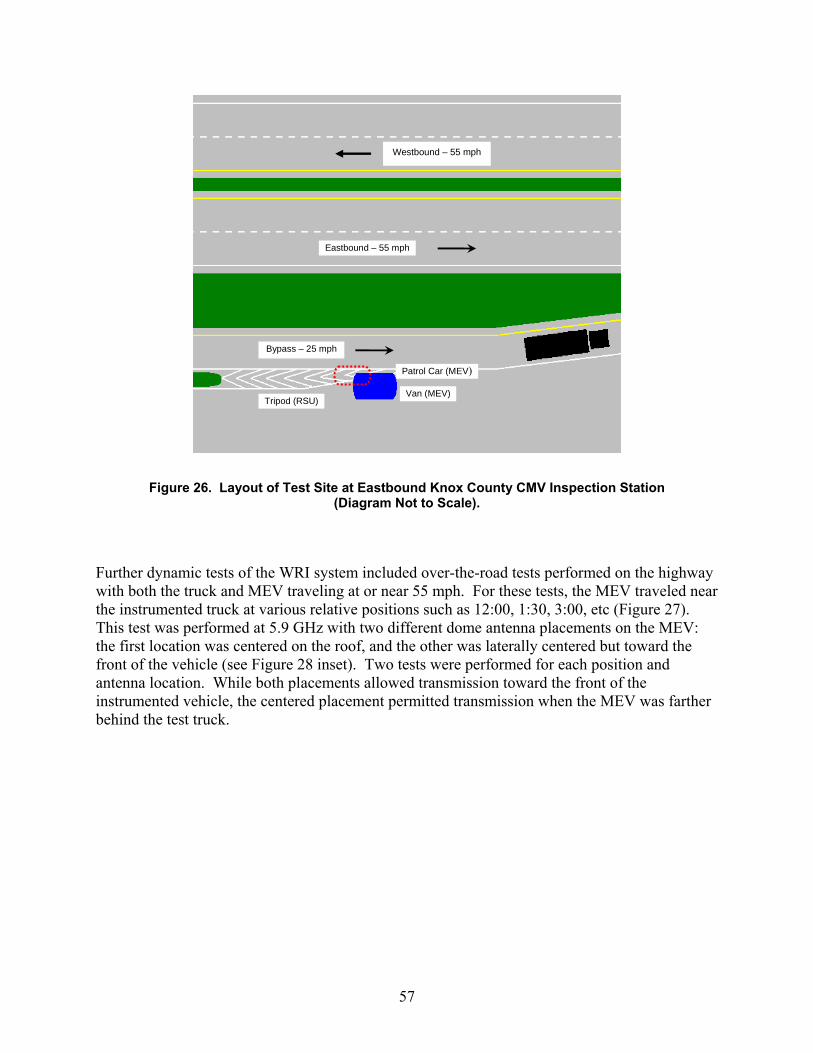
57
Eastbound – 55 mph
Bypass – 25 mph
Tripod (RSU)
Patrol Car (MEV)
Van (MEV)
Westbound – 55 mph
Figure 26. Layout of Test Site at Eastbound Knox County CMV Inspection Station
(Diagram Not to Scale).
Further dynamic tests of the WRI system included over-the-road tests performed on the highway with both the truck and MEV traveling at or near 55 mph. For these tests, the MEV traveled near the instrumented truck at various relative positions such as 12:00, 1:30, 3:00, etc (Figure 27). This test was performed at 5.9 GHz with two different dome antenna placements on the MEV: the first location was centered on the roof, and the other was laterally centered but toward the front of the vehicle (see Figure 28 inset). Two tests were performed for each position and antenna location. While both placements allowed transmission toward the front of the instrumented vehicle, the centered placement permitted transmission when the MEV was farther behind the test truck.
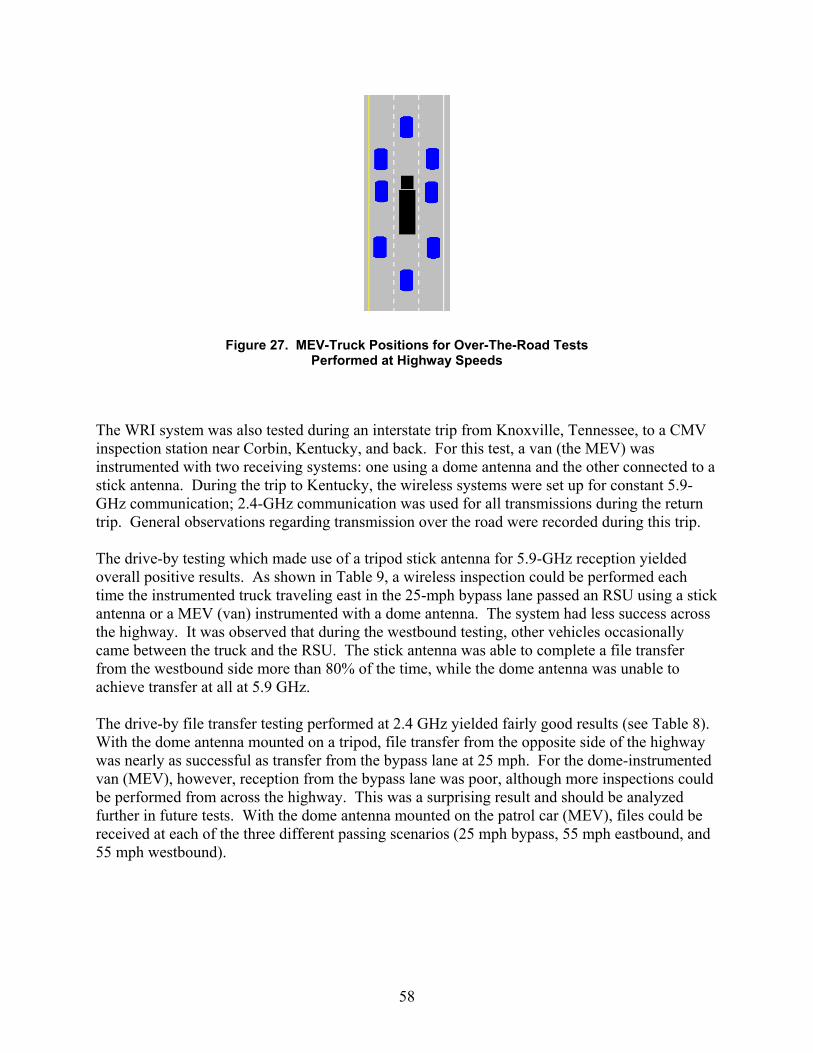
Figure 27. MEV-Truck Positions for Over-The-Road Tests Performed at Highway Speeds
The WRI system was also tested during an interstate trip from Knoxville, Tennessee, to a CMV inspection station near Corbin, Kentucky, and back. For this test, a van (the MEV) was instrumented with two receiving systems: one using a dome antenna and the other connected to a stick antenna. During the trip to Kentucky, the wireless systems were set up for constant 5.9-GHz communication; 2.4-GHz communication was used for all transmissions during the return trip. General observations regarding transmission over the road were recorded during this trip. The drive-by testing which made use of a tripod stick antenna for 5.9-GHz reception yielded overall positive results. As shown in Table 9, a wireless inspection could be performed each time the instrumented truck traveling east in the 25-mph bypass lane passed an RSU using a stick antenna or a MEV (van) instrumented with a dome antenna. The system had less success across the highway. It was observed that during the westbound testing, other vehicles occasionally came between the truck and the RSU. The stick antenna was able to complete a file transfer from the westbound side more than 80% of the time, while the dome antenna was unable to achieve transfer at all at 5.9 GHz. The drive-by file transfer testing performed at 2.4 GHz yielded fairly good results (see Table 8). With the dome antenna mounted on a tripod, file transfer from the opposite side of the highway was nearly as successful as transfer from the bypass lane at 25 mph. For the dome-instrumented van (MEV), however, reception from the bypass lane was poor, although more inspections could be performed from across the highway. This was a surprising result and should be analyzed further in future tests. With the dome antenna mounted on the patrol car (MEV), files could be received at each of the three different passing scenarios (25 mph bypass, 55 mph eastbound, and 55 mph westbound).
58
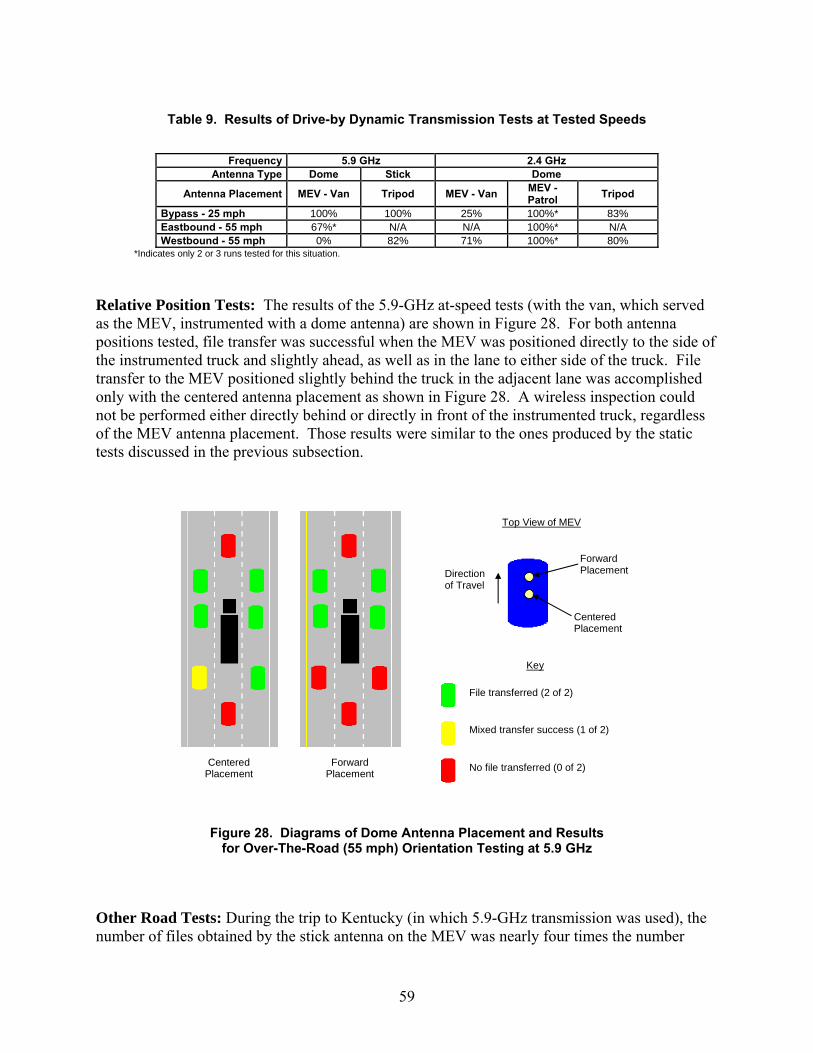
Table 9. Results of Drive-by Dynamic Transmission Tests at Tested Speeds
Frequency 5.9 GHz 2.4 GHz
Antenna Type Dome Stick Dome
MEV - Van Tripod MEV - Van MEV - Patrol Tripod Antenna Placement
Bypass - 25 mph 100% 100% 25% 100%* 83% Eastbound - 55 mph 67%* N/A N/A 100%* N/A Westbound - 55 mph 0% 82% 71% 100%* 80%
*Indicates only 2 or 3 runs tested for this situation.
Relative Position Tests: The results of the 5.9-GHz at-speed tests (with the van, which served as the MEV, instrumented with a dome antenna) are shown in Figure 28. For both antenna positions tested, file transfer was successful when the MEV was positioned directly to the side of the instrumented truck and slightly ahead, as well as in the lane to either side of the truck. File transfer to the MEV positioned slightly behind the truck in the adjacent lane was accomplished only with the centered antenna placement as shown in Figure 28. A wireless inspection could not be performed either directly behind or directly in front of the instrumented truck, regardless of the MEV antenna placement. Those results were similar to the ones produced by the static tests discussed in the previous subsection.
Centered Placement
Top View of MEV
Direction of Travel
Forward Placement
Centered Placement
Key
Mixed transfer success (1 of 2)
No file transferred (0 of 2)
File transferred (2 of 2)
Forward Placement
Figure 28. Diagrams of Dome Antenna Placement and Results for Over-The-Road (55 mph) Orientation Testing at 5.9 GHz
Other Road Tests: During the trip to Kentucky (in which 5.9-GHz transmission was used), the number of files obtained by the stick antenna on the MEV was nearly four times the number
59
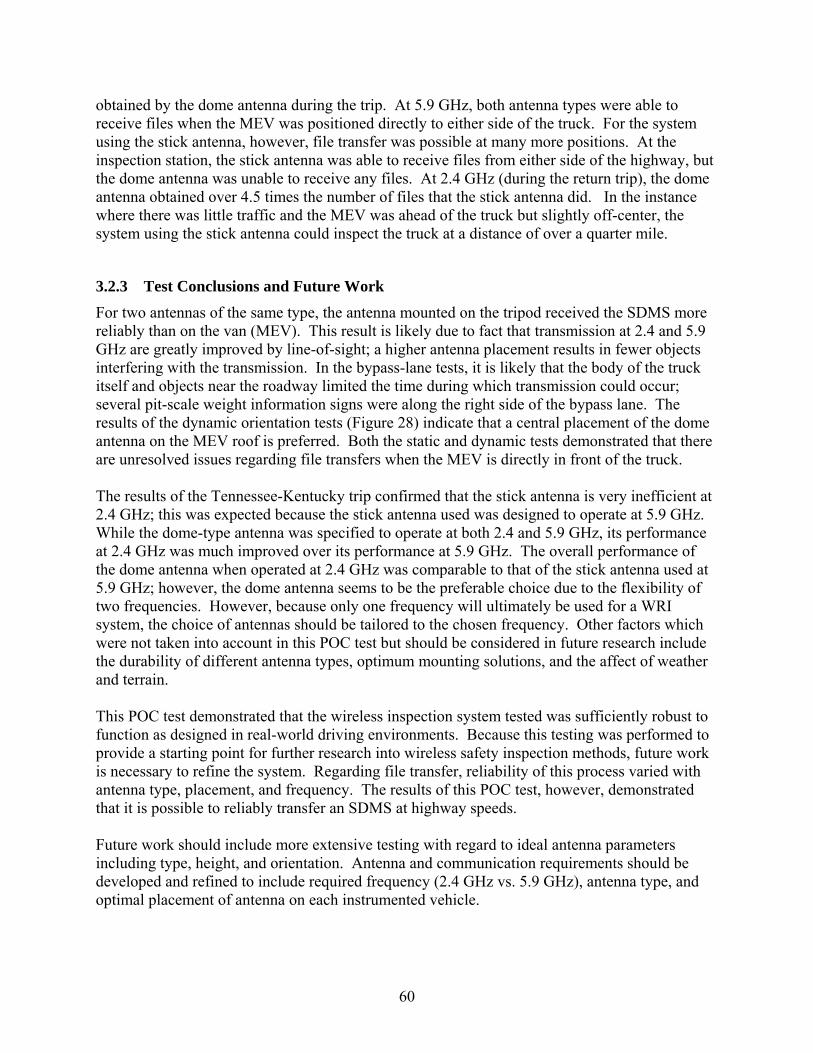
obtained by the dome antenna during the trip. At 5.9 GHz, both antenna types were able to receive files when the MEV was positioned directly to either side of the truck. For the system using the stick antenna, however, file transfer was possible at many more positions. At the inspection station, the stick antenna was able to receive files from either side of the highway, but the dome antenna was unable to receive any files. At 2.4 GHz (during the return trip), the dome antenna obtained over 4.5 times the number of files that the stick antenna did. In the instance where there was little traffic and the MEV was ahead of the truck but slightly off-center, the system using the stick antenna could inspect the truck at a distance of over a quarter mile.
3.2.3 Test Conclusions and Future Work For two antennas of the same type, the antenna mounted on the tripod received the SDMS more reliably than on the van (MEV). This result is likely due to fact that transmission at 2.4 and 5.9 GHz are greatly improved by line-of-sight; a higher antenna placement results in fewer objects interfering with the transmission. In the bypass-lane tests, it is likely that the body of the truck itself and objects near the roadway limited the time during which transmission could occur; several pit-scale weight information signs were along the right side of the bypass lane. The results of the dynamic orientation tests (Figure 28) indicate that a central placement of the dome antenna on the MEV roof is preferred. Both the static and dynamic tests demonstrated that there are unresolved issues regarding file transfers when the MEV is directly in front of the truck. The results of the Tennessee-Kentucky trip confirmed that the stick antenna is very inefficient at 2.4 GHz; this was expected because the stick antenna used was designed to operate at 5.9 GHz. While the dome-type antenna was specified to operate at both 2.4 and 5.9 GHz, its performance at 2.4 GHz was much improved over its performance at 5.9 GHz. The overall performance of the dome antenna when operated at 2.4 GHz was comparable to that of the stick antenna used at 5.9 GHz; however, the dome antenna seems to be the preferable choice due to the flexibility of two frequencies. However, because only one frequency will ultimately be used for a WRI system, the choice of antennas should be tailored to the chosen frequency. Other factors which were not taken into account in this POC test but should be considered in future research include the durability of different antenna types, optimum mounting solutions, and the affect of weather and terrain. This POC test demonstrated that the wireless inspection system tested was sufficiently robust to function as designed in real-world driving environments. Because this testing was performed to provide a starting point for further research into wireless safety inspection methods, future work is necessary to refine the system. Regarding file transfer, reliability of this process varied with antenna type, placement, and frequency. The results of this POC test, however, demonstrated that it is possible to reliably transfer an SDMS at highway speeds. Future work should include more extensive testing with regard to ideal antenna parameters including type, height, and orientation. Antenna and communication requirements should be developed and refined to include required frequency (2.4 GHz vs. 5.9 GHz), antenna type, and optimal placement of antenna on each instrumented vehicle.
60

There is a need to ultimately test a large number of vehicles to verify system feasibility on a wider scale. Larger-scale testing should be designed to test performance when several instrumented vehicles pass an RSU. This testing will likely involve a system which uses an inspection method which is more focused (such as a directional antenna placed over a specific lane) rather than widespread (such as an omni-directional antenna with a large coverage area), and would therefore be more appropriate for a large number of trucks. The TechnoCom transceiver that was used has the capability to selectively communicate with one of multiple vehicles via geo-zoning, direction of travel preference, and other such methods. However, the scope of this POC did not include testing of these features. Another problem which must be resolved before widespread implementation of such a wireless inspection method is that of the ability to visually identify which truck (in a group) is providing the information viewed by enforcement personnel for each wireless inspection. References 1. R.W. Sinnott, "Virtues of the Haversine", Sky and Telescope, vol. 68, no. 2, 1984, p. 159. 2. SAE J1587, Electronic Data Interchange between Microcomputer Systems in Heavy-Duty Vehicle Applications, February 2002, p. 138.
61
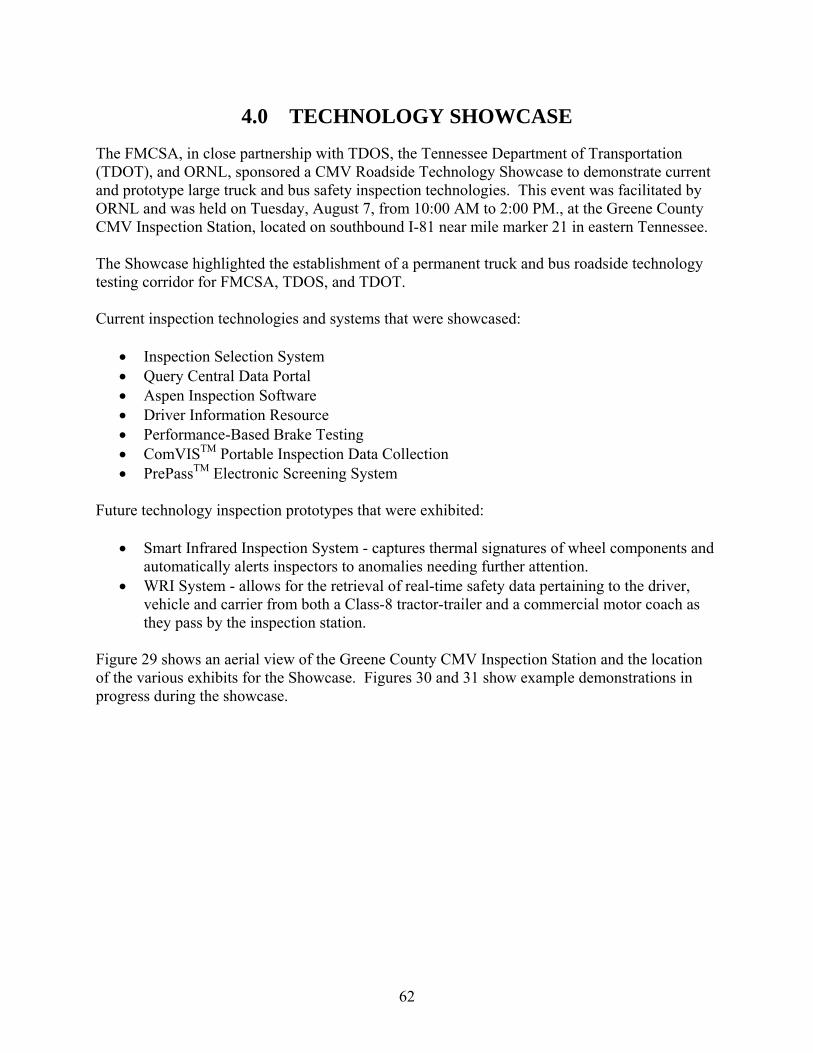
4.0 TECHNOLOGY SHOWCASE
The FMCSA, in close partnership with TDOS, the Tennessee Department of Transportation (TDOT), and ORNL, sponsored a CMV Roadside Technology Showcase to demonstrate current and prototype large truck and bus safety inspection technologies. This event was facilitated by ORNL and was held on Tuesday, August 7, from 10:00 AM to 2:00 PM., at the Greene County CMV Inspection Station, located on southbound I-81 near mile marker 21 in eastern Tennessee. The Showcase highlighted the establishment of a permanent truck and bus roadside technology testing corridor for FMCSA, TDOS, and TDOT. Current inspection technologies and systems that were showcased:
• Inspection Selection System • Query Central Data Portal • Aspen Inspection Software • Driver Information Resource • Performance-Based Brake Testing • ComVISTM Portable Inspection Data Collection • PrePassTM Electronic Screening System
Future technology inspection prototypes that were exhibited:
• Smart Infrared Inspection System - captures thermal signatures of wheel components and automatically alerts inspectors to anomalies needing further attention.
• WRI System - allows for the retrieval of real-time safety data pertaining to the driver, vehicle and carrier from both a Class-8 tractor-trailer and a commercial motor coach as they pass by the inspection station.
Figure 29 shows an aerial view of the Greene County CMV Inspection Station and the location of the various exhibits for the Showcase. Figures 30 and 31 show example demonstrations in progress during the showcase.
62
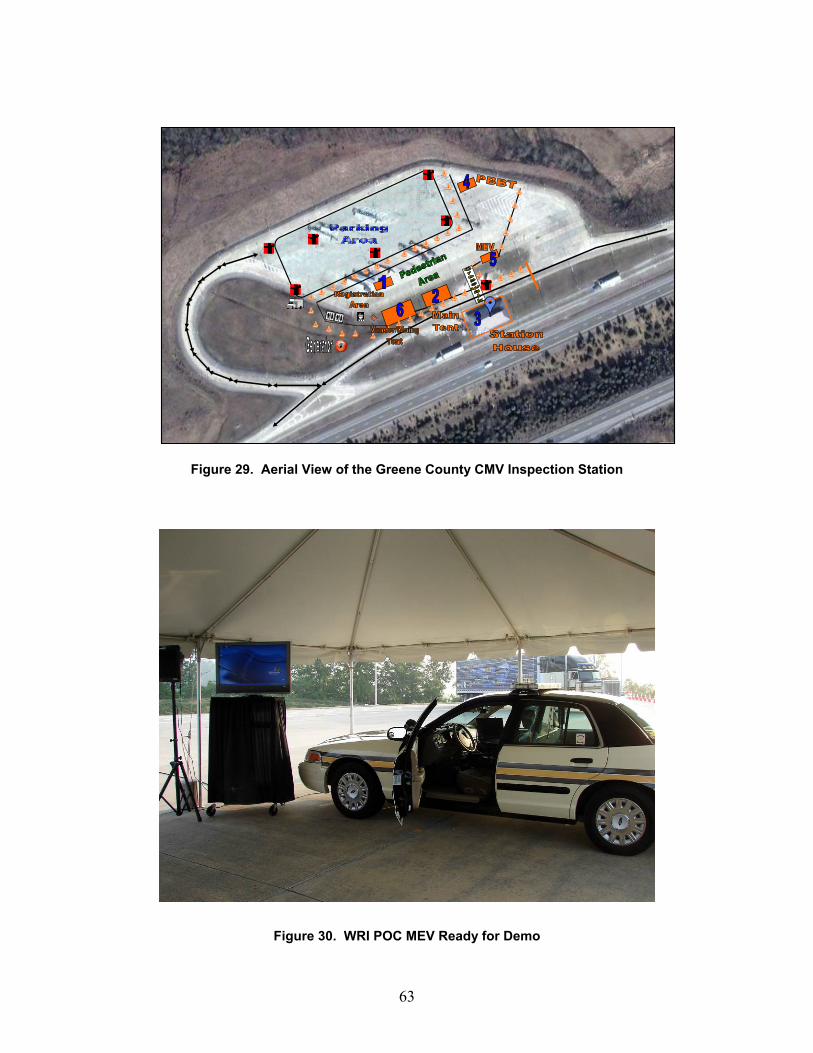
Figure 29. Aerial View of the Greene County CMV Inspection Station
Figure 30. WRI POC MEV Ready for Demo
63
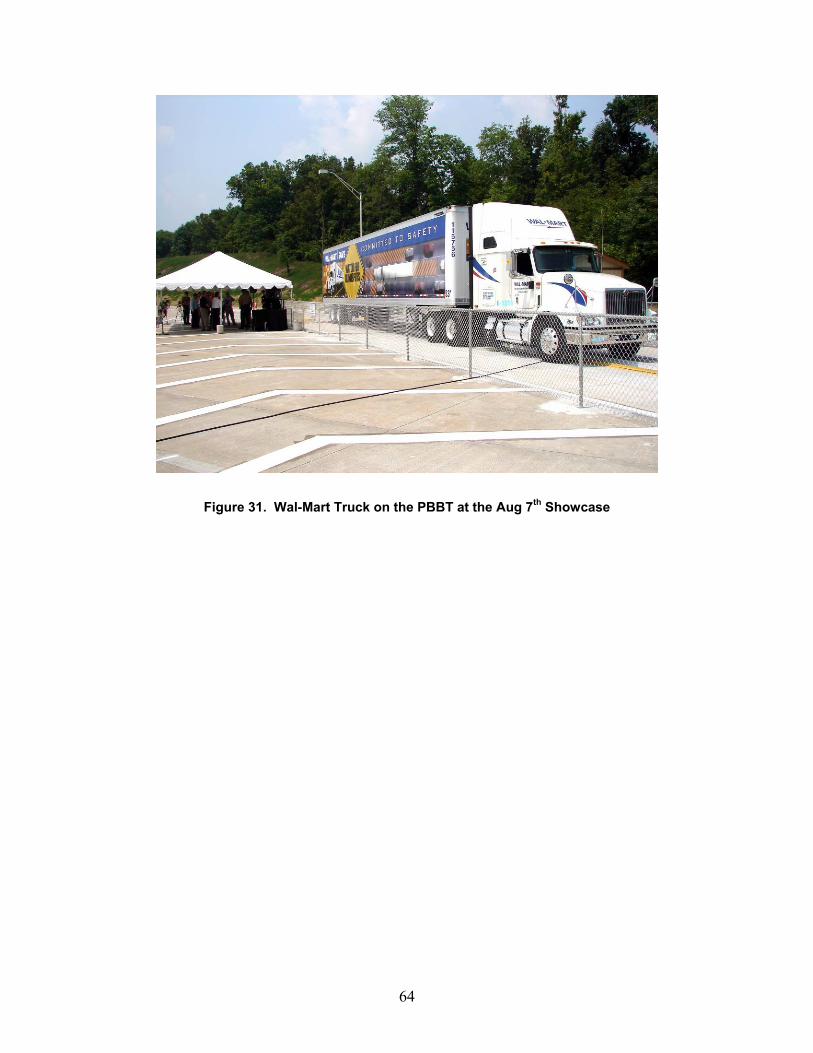
Figure 31. Wal-Mart Truck on the PBBT at the Aug 7th Showcase
64
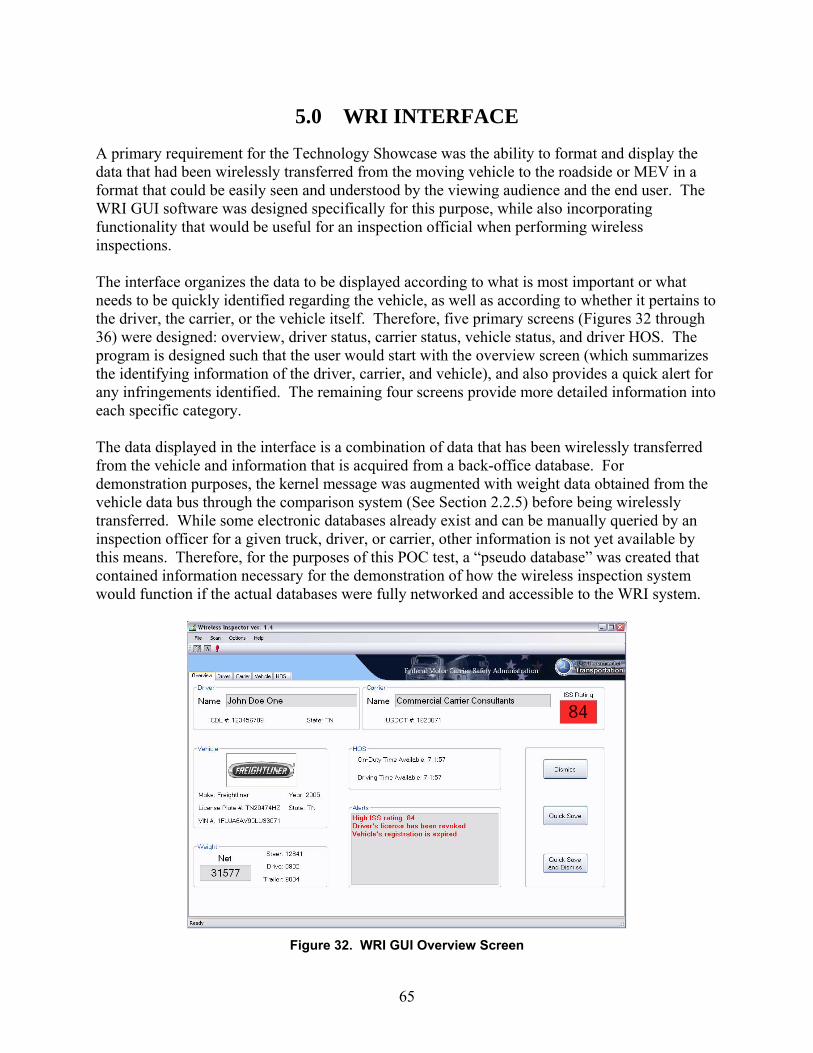
5.0 WRI INTERFACE
A primary requirement for the Technology Showcase was the ability to format and display the data that had been wirelessly transferred from the moving vehicle to the roadside or MEV in a format that could be easily seen and understood by the viewing audience and the end user. The WRI GUI software was designed specifically for this purpose, while also incorporating functionality that would be useful for an inspection official when performing wireless inspections. The interface organizes the data to be displayed according to what is most important or what needs to be quickly identified regarding the vehicle, as well as according to whether it pertains to the driver, the carrier, or the vehicle itself. Therefore, five primary screens (Figures 32 through 36) were designed: overview, driver status, carrier status, vehicle status, and driver HOS. The program is designed such that the user would start with the overview screen (which summarizes the identifying information of the driver, carrier, and vehicle), and also provides a quick alert for any infringements identified. The remaining four screens provide more detailed information into each specific category. The data displayed in the interface is a combination of data that has been wirelessly transferred from the vehicle and information that is acquired from a back-office database. For demonstration purposes, the kernel message was augmented with weight data obtained from the vehicle data bus through the comparison system (See Section 2.2.5) before being wirelessly transferred. While some electronic databases already exist and can be manually queried by an inspection officer for a given truck, driver, or carrier, other information is not yet available by this means. Therefore, for the purposes of this POC test, a “pseudo database” was created that contained information necessary for the demonstration of how the wireless inspection system would function if the actual databases were fully networked and accessible to the WRI system.
Figure 32. WRI GUI Overview Screen
65
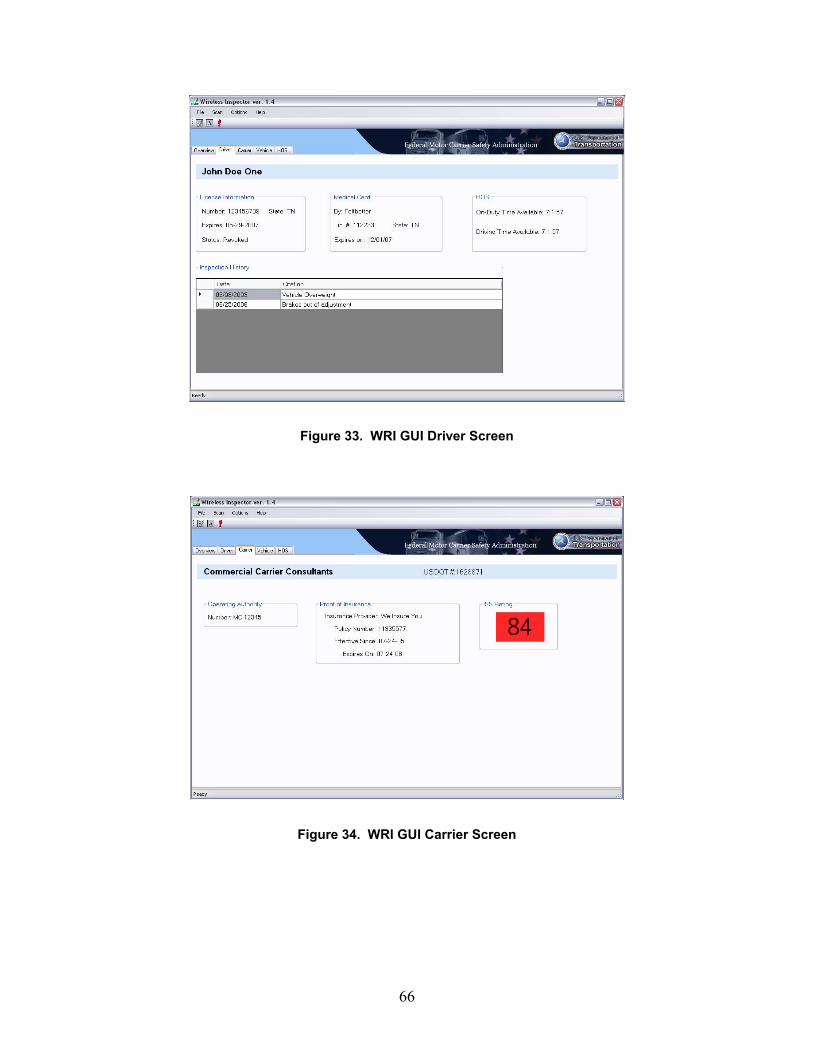
Figure 33. WRI GUI Driver Screen
Figure 34. WRI GUI Carrier Screen
66
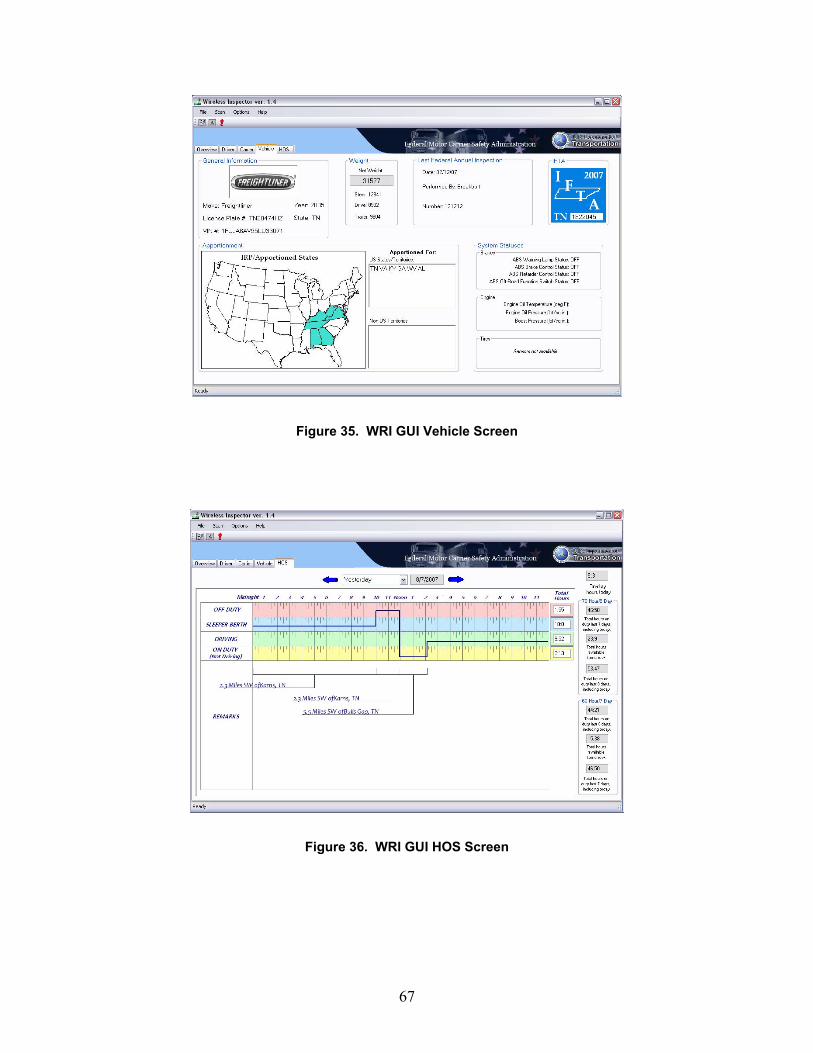
Figure 35. WRI GUI Vehicle Screen
Figure 36. WRI GUI HOS Screen
67
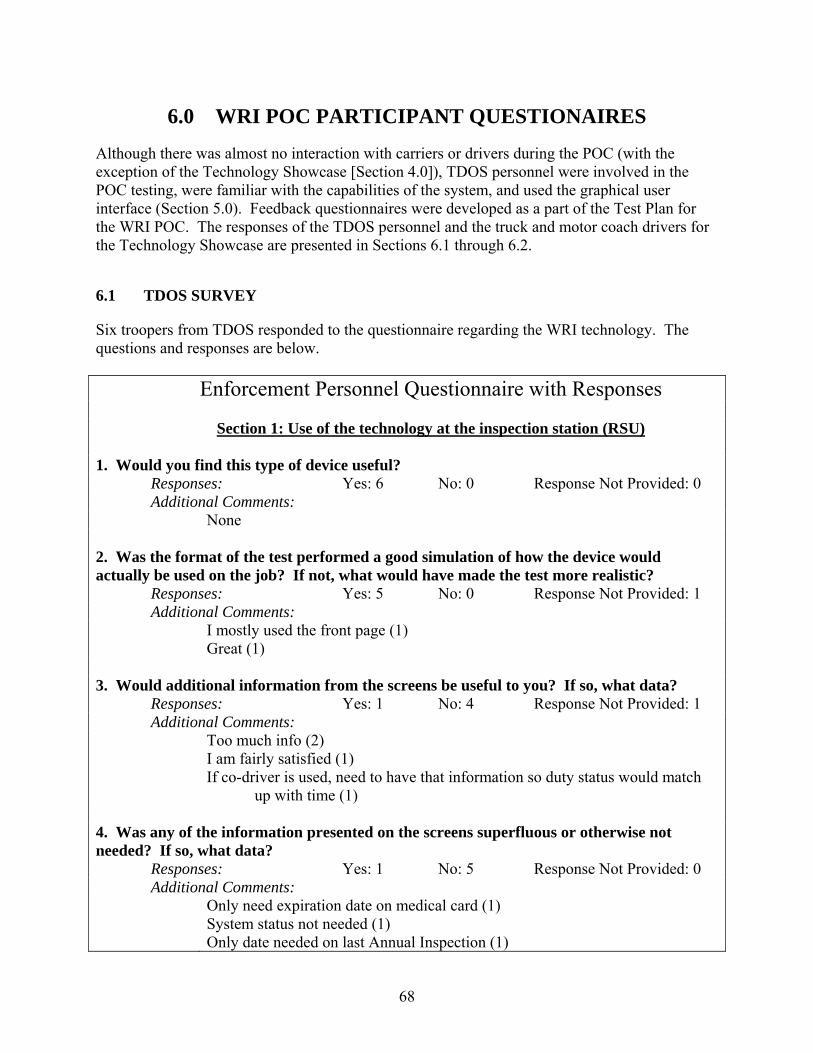
6.0 WRI POC PARTICIPANT QUESTIONAIRES
Although there was almost no interaction with carriers or drivers during the POC (with the exception of the Technology Showcase [Section 4.0]), TDOS personnel were involved in the POC testing, were familiar with the capabilities of the system, and used the graphical user interface (Section 5.0). Feedback questionnaires were developed as a part of the Test Plan for the WRI POC. The responses of the TDOS personnel and the truck and motor coach drivers for the Technology Showcase are presented in Sections 6.1 through 6.2.
6.1 TDOS SURVEY
Six troopers from TDOS responded to the questionnaire regarding the WRI technology. The questions and responses are below.
Enforcement Personnel Questionnaire with Responses
Section 1: Use of the technology at the inspection station (RSU)
1. Would you find this type of device useful?
Responses: Yes: 6 No: 0 Response Not Provided: 0 Additional Comments:
None 2. Was the format of the test performed a good simulation of how the device would actually be used on the job? If not, what would have made the test more realistic?
Responses: Yes: 5 No: 0 Response Not Provided: 1 Additional Comments:
I mostly used the front page (1) Great (1)
3. Would additional information from the screens be useful to you? If so, what data?
Responses: Yes: 1 No: 4 Response Not Provided: 1 Additional Comments:
Too much info (2) I am fairly satisfied (1) If co-driver is used, need to have that information so duty status would match up with time (1)
4. Was any of the information presented on the screens superfluous or otherwise not needed? If so, what data?
Responses: Yes: 1 No: 5 Response Not Provided: 0 Additional Comments:
Only need expiration date on medical card (1) System status not needed (1) Only date needed on last Annual Inspection (1)
68
5. Do you see any pitfalls or problems with such a device?
Responses: Yes: 3 No: 2 Response Not Provided: 1 Additional Comments:
The information can be changed y the company or driver (3) The vehicle information can be wrong (1) In order to be beneficial, the device would need to be mandatory to all motor vehicles (1)
Section 2: Use of the technology in a Mobile Enforcement Vehicle (MEV Unit)
1. Would you find this type of device useful?
Responses: Yes: 5 No: 0 Response Not Provided: 1 Additional Comments:
None 2. Was the format of the test performed a good simulation of how the device would actually be used on the job? If not, what would have made the test more realistic?
Responses: Yes: 5 No: 0 Response Not Provided: 1 Additional Comments:
I mostly used the front page (1) 3. Would additional information from the screens be useful to you? If so, what data?
Responses: Yes: 0 No: 5 Response Not Provided: 1 Additional Comments:
Too much info (2) 4. Was any of the information presented on the screens superfluous or otherwise not needed? If so, what data?
Responses: Yes: 4 No: 2 Response Not Provided: 0 Additional Comments:
Only need expiration date on medical card (1) System status not needed (1) Only date needed on last Annual Inspection (1)
5. Do you see any pitfalls or problems with such a device?
Responses: Yes: 4 No: 0 Response Not Provided: 2 Additional Comments:
The information can be changed y the company or driver (3) The vehicle information can be wrong (1) In order to be beneficial, the device would need to be mandatory to all motor vehicles (1)
6. Was the device a distraction for the Trooper?
Responses: Yes: 0 No: 5 Response Not Provided: 1 Additional Comments:
69
None
6.2 DRIVER SURVEYS
One tractor-trailer driver and one motor coach driver from industry responded to the questionnaire regarding the WRI technology. The questions and responses are below.
Tractor-Trailer Driver Questionnaire with Responses 1. Did the device impede your productivity?
Response: No. 2. Was the device easy to use?
Response: Yes. I have used a similar device in the past. 3. Would you object to the mandate of using such a device? Why or why not?
Response: I would be concerned about cost and the use of the information. 4. Was the device a distraction while driving? If so, how could this be combated?
Response: No. 5. Which do you feel would be the easiest interface for future designs? a. Keypad (cell phone) b. Touch screen c. Full keyboard d. Other _____
Response: Voice activation for duty status changes. Keyboard for information entry. 6. Was the format of the test performed a good simulation of how the device would actually be used on the job? If not, what would have made the test more realistic?
Response: Too limited to tell. 7. What would your biggest concerns about the implementation of such a device be?
Response: Out of pocket cost and invasion of privacy.
Motor Coach Driver Questionnaire with Responses 1. Would you object to the mandate of having all of your buses equipped with such a device? Why or why not? Response: As a commercial vehicle owner and operator, I would object to a proposed
mandate if I am expected to bear the expense of the mandate. Small operators are at the
70

point that they can not bear any additional cost to their operations. 2. Was the format of the test performed a good simulation of how the device will actually be used on the job?
Response: Yes, although I am sure its capabilities had to be limited for the demonstration.
3. Would the data obtained from the device be useful to you?
Response: There is no data (viewed in the demonstration) that we are currently not keeping, (i.e., DQF's, MVR's, maintenance files, HOS status). I am sure that there are many more options that would be available to us that would be beneficial.
4. Do you see a need for such technology in order to keep a closer eye on driver activity and vehicle status?
Response: I cannot speak for other operators. As far as our operation is concerned; the safety of our passengers is the primary goal of our company. When we are mixed with other commercial vehicles on the highways, then their safe operation becomes a major factor for us. It is getting much harder to find professional driver candidates as the transportation industry grows, therefore I feel a watchful eye would be in the best interest of all parties involved.
5. Do you think your drivers would object to the use of such a device? Why or why not?
Response: Yes, drivers would object at first. But, after the initial intimidation of a change, I think they would quickly begin to realize the benefits. One area that I think would appeal to drivers, is the fact that the gray areas of doubt in infractions should disappear and the enforcement officer is no longer the judge, jury and executioner. From what I've seen, it just seems to level the playing field.
6. Do you see a value to your company from such a device? Response: Yes, definitely. Unlike the freight haulers, our cargo is human. Anything
that promotes safety and makes us look good, has to be good for us and our industry. We currently encourage our customers to go to safersys.org and review our company snapshot and safety record. Any system that would make us more visible would keep us on our toes and become one more tool for us to promote our company.
71
7.0 LESSONS LEARNED
The following is a general discussion of the lessons learned from the WRI POC. Input for this section was provided by the ORNL technical team, PeopleNet, and TechnoCom.
Several positive lessons learned during the WRI POC proved to be of benefit to the project, and many will be of benefit to future related projects.
• Private industry is willing to participate gratis in research that they find to be of value to their field of interest. This was certainly true of Air-Weigh and PeopleNet. They provided technology, software, and engineering support throughout the WRI POC. While it is difficult to put a value on this support, ORNL estimates that for the WRI POC, the value of this support was greater than $300,000.
• The State of Tennessee’s Departments of Safety and Transportation and FMCSA’s Tennessee-based field staff are willing to help in any way possible. Neither the POC nor the Media Event would have been possible without their support and hard work. The WRI POC can serve as a model for bringing federal and state government and private industry together to accomplish difficult tasks in a short time within a fixed budget.
• The Greene County Tennessee CMV Inspection Station was found to be an excellent location for CMV research and technology testing. The 80-acre concrete pad, power availability, internet access, and Interstate access made the site indispensable for this project.
• The feasibility of composing a message in real-time and transmitting that message wirelessly to a fixed or a mobile station was demonstrated.
• The SDMS does not have to be a very large file in order to contain the needed vehicle, carrier, and driver information. ORNL found that a single record (a complete SDMS with one duty status change) was approximately 600 bytes. A complete, eight-day SDMS consisted of multiple records appended together equivalent to the number of duty status changes made during that eight-day period. For this case, an estimate of the SDMS total file size could be found by simply multiplying 600 bytes by the number of duty status changes made.
• The PeopleNet OBC uses an internal real-time clock that is reset to GPS once the difference between it and the GPS UTC time reaches a pre-determined value. As a result, this system is more reliable than one which relies on GPS time signals alone, because the OBC is able to continue to provide time information in the absence of the GPS signal. However, the default configuration for the time difference before time reset for the kernel was set to 15 seconds. In retrospect, the difference could have been reduced considerably, thereby preventing the 15-second position discrepancy.
There were several lessons learned, however, that could have impacted the WRI POC in a detrimental way. They are:
72
• Greater depth of partnerships – Only one kernel provider partnership was provided. This left the WRI POC in a very vulnerable position. If the PeopleNet device had failed to gather and format the SDMS, the POC would not have been able to finish the POC with a commercially viable system and the project would have had to rely on the ORNL-developed DAS. This was similarly true of the transceiver provider. Although TechnoCom did not participate gratis, the project budget would not have allowed for a second paid transceiver partner in the event that the TechnoCom equipment/software failed to transmit the SDMS. Such an event would have been catastrophic to Phase 1B of the POC.
• Remoteness of the Greene County Tennessee CMV Inspection Station proved to be costly in time, manpower, and dollars. Travel time from ORNL to the site was approximately 90 minutes. Furthermore, the site is located about 30 minutes from the nearest hardware and retail stores and restaurants (food was not available on-site).
• It is very difficult to find large, flat, paved areas for CMV static and dynamic testing. The Greene County site proved to be acceptable, but required some novel testing schemes to accomplish all of the static testing called for in the test plan. A test track would have been a better option, but would have required funding for the track time, travel time, and travel expenses for the technical team.
• It is difficult and potentially unsafe to conduct some types of CMV testing at highway speeds on public roadways. It is difficult to determine vehicle separation distance and difficult to maintain separation angle and distance. A test track is recommended for all future testing of this nature.
• The WRI POC team attempted to accomplish too much during the POC (develop the system, test the system, include a MEV, include a motor coach, include an unproven transceiver, conduct the Technology Showcase, and demo the tractor, MEV, and motor coach based systems at the Technology Showcase). Given the time and budget, the number of deliverables for the POC caused great uncertainty in achieving success in all areas of the POC.
• Conducting the Technology Showcase endangered the success of the POC. A large portion of the technical team’s effort went into preparing for the Technology Showcase and the vehicle perturbations (MEV and motor coach) for the Showcase. Much of the preparation for the Technology Showcase had to be done during the POC in order to meet the August 7th date for the Showcase.
• The transceiver equipment requires significantly more analytical testing for this type of application (antenna attenuation, cable attenuation, obstruction interference, bandwidth, range, deployment methods, antenna transmission/reception angles, antenna types). A large portion of the ORNL technical team’s time was spent trying to get transmission via the transceiver.
• Partners should be encouraged to install the equipment that they are providing, or at least spend a day or two on-site to assist with troubleshooting. The ORNL technical team
73
spent a significant amount of time working through problems with the transceiver (exploring the problem, communicating with the provider, testing the problem further, trying a possible solution, etc). While completely avoiding set-up and configuration problems in a project such as this is not possible, an on-site visit from a representative from the transceiver provider would very likely have resulted in a more efficient resolution of these problems.
• The analysis outlined in Section 3.0 reveals there was some misunderstanding as to which fields in the SDMS contained the PeopleNet-provided driver HOS data. There was also confusion as to how the J1708 odometer data is supplied and how it is formatted per the J1587 specification. Clarity in such matters before testing begins would result in more accurate results suitable for comparative analysis of competing vendors for future phases of this project.
74
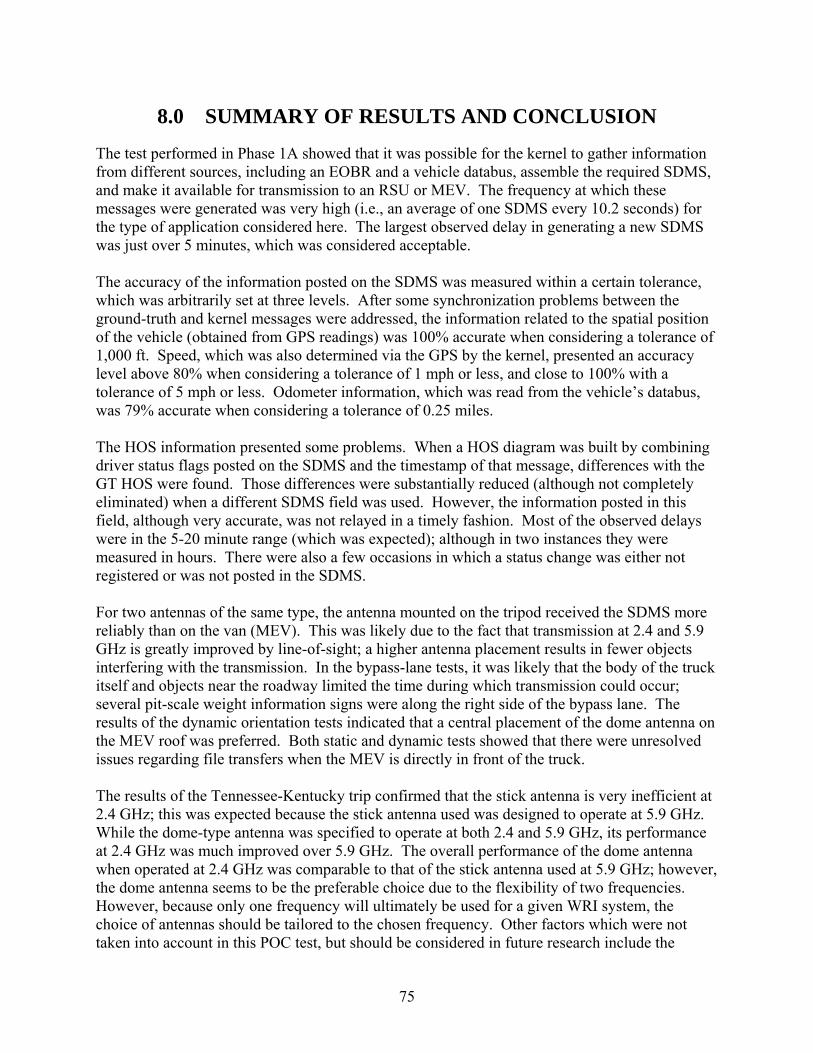
8.0 SUMMARY OF RESULTS AND CONCLUSION
The test performed in Phase 1A showed that it was possible for the kernel to gather information from different sources, including an EOBR and a vehicle databus, assemble the required SDMS, and make it available for transmission to an RSU or MEV. The frequency at which these messages were generated was very high (i.e., an average of one SDMS every 10.2 seconds) for the type of application considered here. The largest observed delay in generating a new SDMS was just over 5 minutes, which was considered acceptable. The accuracy of the information posted on the SDMS was measured within a certain tolerance, which was arbitrarily set at three levels. After some synchronization problems between the ground-truth and kernel messages were addressed, the information related to the spatial position of the vehicle (obtained from GPS readings) was 100% accurate when considering a tolerance of 1,000 ft. Speed, which was also determined via the GPS by the kernel, presented an accuracy level above 80% when considering a tolerance of 1 mph or less, and close to 100% with a tolerance of 5 mph or less. Odometer information, which was read from the vehicle’s databus, was 79% accurate when considering a tolerance of 0.25 miles. The HOS information presented some problems. When a HOS diagram was built by combining driver status flags posted on the SDMS and the timestamp of that message, differences with the GT HOS were found. Those differences were substantially reduced (although not completely eliminated) when a different SDMS field was used. However, the information posted in this field, although very accurate, was not relayed in a timely fashion. Most of the observed delays were in the 5-20 minute range (which was expected); although in two instances they were measured in hours. There were also a few occasions in which a status change was either not registered or was not posted in the SDMS. For two antennas of the same type, the antenna mounted on the tripod received the SDMS more reliably than on the van (MEV). This was likely due to the fact that transmission at 2.4 and 5.9 GHz is greatly improved by line-of-sight; a higher antenna placement results in fewer objects interfering with the transmission. In the bypass-lane tests, it was likely that the body of the truck itself and objects near the roadway limited the time during which transmission could occur; several pit-scale weight information signs were along the right side of the bypass lane. The results of the dynamic orientation tests indicated that a central placement of the dome antenna on the MEV roof was preferred. Both static and dynamic tests showed that there were unresolved issues regarding file transfers when the MEV is directly in front of the truck. The results of the Tennessee-Kentucky trip confirmed that the stick antenna is very inefficient at 2.4 GHz; this was expected because the stick antenna used was designed to operate at 5.9 GHz. While the dome-type antenna was specified to operate at both 2.4 and 5.9 GHz, its performance at 2.4 GHz was much improved over 5.9 GHz. The overall performance of the dome antenna when operated at 2.4 GHz was comparable to that of the stick antenna used at 5.9 GHz; however, the dome antenna seems to be the preferable choice due to the flexibility of two frequencies. However, because only one frequency will ultimately be used for a given WRI system, the choice of antennas should be tailored to the chosen frequency. Other factors which were not taken into account in this POC test, but should be considered in future research include the
75
durability of different antenna types, optimum mounting solutions, and the affect of weather and terrain. This POC test demonstrated that the wireless inspection system tested was sufficiently robust to function as designed in real-world driving environments. As this testing was performed to provide a starting point for further research into wireless safety inspection methods, future work is necessary to refine the system. While the reliability of file transfer varied with antenna type, placement, and frequency, the results of this POC test demonstrated that it is possible to reliably transfer an SDMS at highway speeds.
76
9.0 SUGGESTED FUTURE RESEARCH/RECOMMENDATIONS
Since the accuracy of the information contained in the SDMS seems to be acceptable, the main area of future research should focus on the timeliness of the HOS information that is added to that message. Most of the observed problems were attributed to communication and software issues. In fact, during the pre-testing period, several related problems were identified by ORNL and addressed by the partner supplying the kernel information. It appears that some aspects of these problems were not fully resolved by the time the test took place. Nevertheless, those problems are not insurmountable but should be easily resolved during the next phase. Also, as previously mentioned, certain delays were inherent to the system due to the back-office communication of the kernel. These delays would not be present in a commercially produced product. Also, in future tests, it is important that more detailed technical discussions are carried out between the testers (ORNL) and the developers of the system. Such communication would facilitate a better understanding of the idiosyncrasies of both the DAS and the kernel in order to avoid issues such as reading the same field in different units (e.g., odometer) or providing timestamps that are generated by different devices (thus introducing synchronization problems). Future work should include more extensive testing regarding ideal antenna parameters including type, height, and orientation. Antenna and communication requirements should be developed and refined to include required frequency (2.4 GHz vs. 5.9 GHz), antenna type, and optimal placement of the antenna on each instrumented vehicle. There is a need to ultimately test a large number of vehicles to verify system feasibility on a wider scale. Larger-scale testing should be designed to test performance when several instrumented vehicles pass an RSU. This testing will likely involve a system which uses an inspection method which is more focused (such as a directional antenna placed over a specific lane) rather than widespread (such as an omni-directional antenna with a large coverage area), resulting in a system which is appropriate for a large number of trucks. The TechnoCom transceiver that was used has the capability to selectively communicate with one of multiple vehicles via geo-zoning, direction of travel preference, and other such methods. However, the scope of this POC did not include testing of these features. Another problem which must be resolved before widespread implementation of a wireless inspection method is that of the ability to visually identify which truck (in a group) is providing the information viewed by enforcement personnel for each wireless inspection. For the next phase of the program, in order to better assure success, it is recommended that more time be given to the formation of partnerships to provide good depth of technology. Emphasis should be placed on gratuitous partnerships to minimize cost and maximize industry buy-in. Each critical area of the Pilot Test (as described in Section 1.1) should be identified and when technology is present, redundancy should be emphasized as well. In the case of the WRI POC, only one kernel provider and only one transceiver provider participated. This provided no depth
77
of options as to the method and also would have caused the effort to fail if either provider’s technology had failed. It is envisioned that the Pilot Test will have a much higher level of complexity and will involve many more entities. It is suggested that the Pilot Test be conducted using a “subsystems” approach with multiple teams working in parallel. Work-arounds should be planned if any teams fail their primary task. This would allow other teams to proceed, ensuring that the overall project comes to a successful conclusion. For example: if DSRC is chosen to be the communications method for the SDMS transmission, a team should be appointed to develop, test, and integrate this technology into the greater project. This team should only be responsible for the DSRC portion of the project. Further, DSRC should not be the only communications method selected. A “back-up” method should be explored in the event DSRC fails to function as expected.
78
APPENDICES
APPENDIX A: WIRELESS ROADSIDE INSPECTION PROOF-OF-CONCEPT TESTING FAST TRACK PLAN DISCUSSION PAPER
Background The I-95 Corridor Coalition wireless inspection demonstration hosted by Volvo North America has proven that the wireless inspection of trucks and buses is feasible with today’s technology. Further, it has been shown that there is much work ahead to develop a seamless inspection system capable of gathering the inspection data of interest, transmitting it off-board in a reliable manner, and evaluating the data in real time. Dealing with the back-office and interdiction issues related to wireless inspection of commercial vehicles has, only to this point, been discussed with no hard data or experience to aid in the development of a Concept of Operations (ConOps) document. There is a need to quickly conduct a Proof-of-Concept (POC) test to demonstrate the Safety Data Message Set (SDMS) and then conduct a pilot test to generate thousands of inspections to aid the development and testing of back office protocols and interdiction strategies. In order to mitigate the large development cost of vehicle-based inspection technology and to reduce the time to develop a fully functional system ready for Field Operational Testing (FOT), ORNL recommends the following “Fast Track” plan for the POC test which will help enhance the full development of the ConOps with real-world experience and will quicken the march to the Pilot Test where large numbers of actual inspections can be generated. ORNL POC Goals
• To Partner with private industry to develop the kernel of the Universal Wireless Inspection System (UWIS) at no cost to the government and make the developed system(s) available for testing in the POC.
• To Partner with providers of wireless transceivers (2.4 GHz and 5.9 GHz) and integrate
this wireless technology into the UWIS.
• To Demonstrate a UWIS that collects and stores predefined safety data using currently available sensors and technology; formats this data into the SDMS; and wirelessly transmits the SDMS from a commercial vehicle (truck or bus) to the roadside or to a an enforcement vehicle.
ORNL POC Objectives
• Form partnerships with suppliers of technology capable of performing the needed data collection, data buffering, and formatting of the SDMS in order to have the partners develop and supply systems (kernels) for testing in the POC.
79
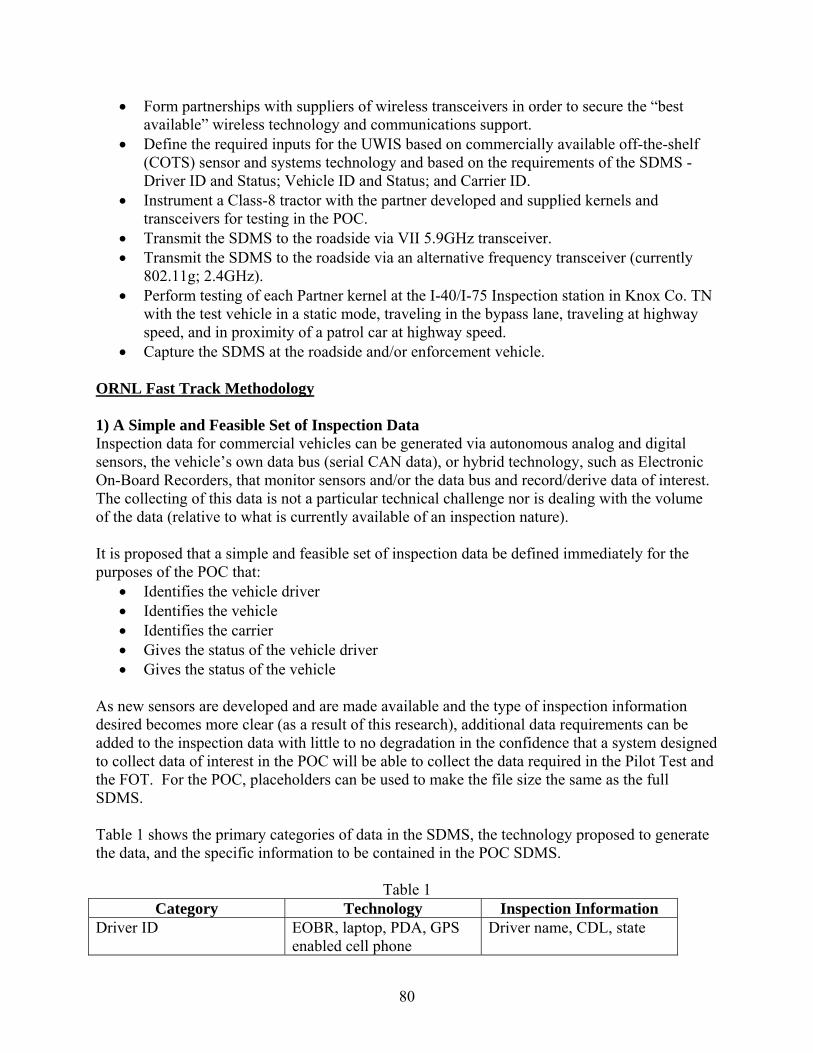
• Form partnerships with suppliers of wireless transceivers in order to secure the “best available” wireless technology and communications support.
• Define the required inputs for the UWIS based on commercially available off-the-shelf (COTS) sensor and systems technology and based on the requirements of the SDMS - Driver ID and Status; Vehicle ID and Status; and Carrier ID.
• Instrument a Class-8 tractor with the partner developed and supplied kernels and transceivers for testing in the POC.
• Transmit the SDMS to the roadside via VII 5.9GHz transceiver. • Transmit the SDMS to the roadside via an alternative frequency transceiver (currently
802.11g; 2.4GHz). • Perform testing of each Partner kernel at the I-40/I-75 Inspection station in Knox Co. TN
with the test vehicle in a static mode, traveling in the bypass lane, traveling at highway speed, and in proximity of a patrol car at highway speed.
• Capture the SDMS at the roadside and/or enforcement vehicle. ORNL Fast Track Methodology 1) A Simple and Feasible Set of Inspection Data Inspection data for commercial vehicles can be generated via autonomous analog and digital sensors, the vehicle’s own data bus (serial CAN data), or hybrid technology, such as Electronic On-Board Recorders, that monitor sensors and/or the data bus and record/derive data of interest. The collecting of this data is not a particular technical challenge nor is dealing with the volume of the data (relative to what is currently available of an inspection nature). It is proposed that a simple and feasible set of inspection data be defined immediately for the purposes of the POC that:
• Identifies the vehicle driver • Identifies the vehicle • Identifies the carrier • Gives the status of the vehicle driver • Gives the status of the vehicle
As new sensors are developed and are made available and the type of inspection information desired becomes more clear (as a result of this research), additional data requirements can be added to the inspection data with little to no degradation in the confidence that a system designed to collect data of interest in the POC will be able to collect the data required in the Pilot Test and the FOT. For the POC, placeholders can be used to make the file size the same as the full SDMS. Table 1 shows the primary categories of data in the SDMS, the technology proposed to generate the data, and the specific information to be contained in the POC SDMS.
Table 1 Category Technology Inspection Information
Driver ID EOBR, laptop, PDA, GPS enabled cell phone
Driver name, CDL, state
80
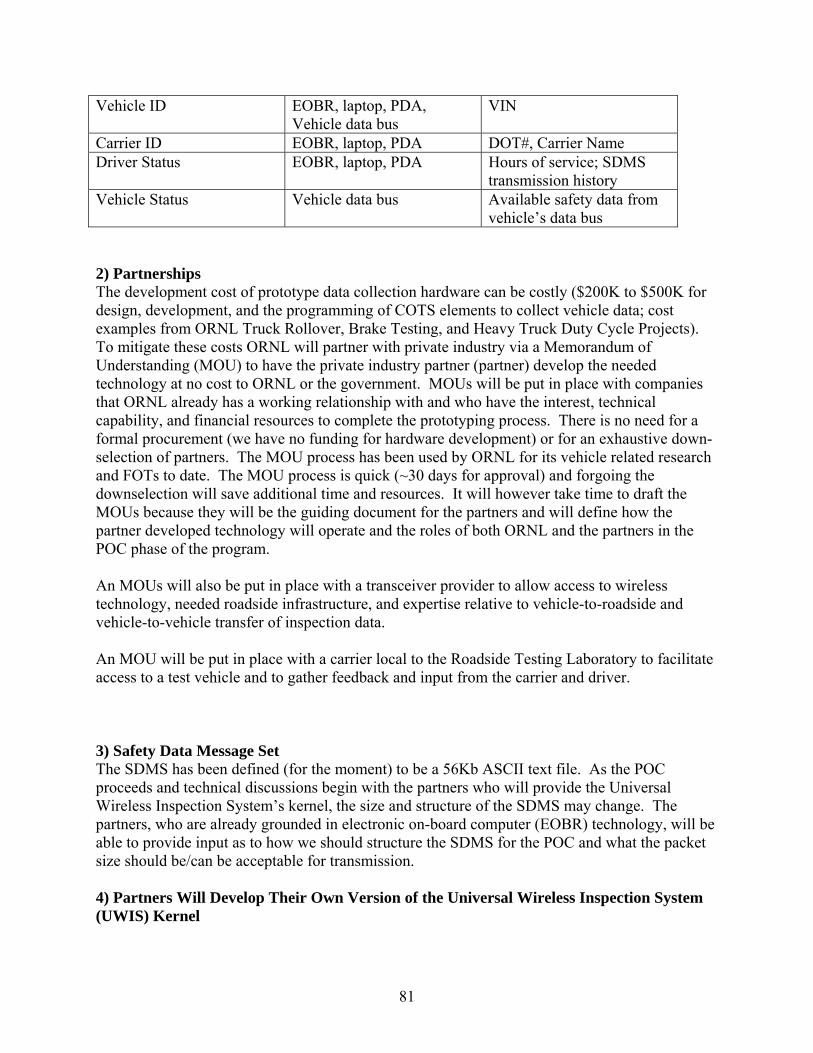
Vehicle ID EOBR, laptop, PDA, Vehicle data bus
VIN
Carrier ID EOBR, laptop, PDA DOT#, Carrier Name Driver Status EOBR, laptop, PDA Hours of service; SDMS
transmission history Vehicle Status Vehicle data bus Available safety data from
vehicle’s data bus 2) Partnerships The development cost of prototype data collection hardware can be costly ($200K to $500K for design, development, and the programming of COTS elements to collect vehicle data; cost examples from ORNL Truck Rollover, Brake Testing, and Heavy Truck Duty Cycle Projects). To mitigate these costs ORNL will partner with private industry via a Memorandum of Understanding (MOU) to have the private industry partner (partner) develop the needed technology at no cost to ORNL or the government. MOUs will be put in place with companies that ORNL already has a working relationship with and who have the interest, technical capability, and financial resources to complete the prototyping process. There is no need for a formal procurement (we have no funding for hardware development) or for an exhaustive down-selection of partners. The MOU process has been used by ORNL for its vehicle related research and FOTs to date. The MOU process is quick (~30 days for approval) and forgoing the downselection will save additional time and resources. It will however take time to draft the MOUs because they will be the guiding document for the partners and will define how the partner developed technology will operate and the roles of both ORNL and the partners in the POC phase of the program. An MOUs will also be put in place with a transceiver provider to allow access to wireless technology, needed roadside infrastructure, and expertise relative to vehicle-to-roadside and vehicle-to-vehicle transfer of inspection data. An MOU will be put in place with a carrier local to the Roadside Testing Laboratory to facilitate access to a test vehicle and to gather feedback and input from the carrier and driver. 3) Safety Data Message Set The SDMS has been defined (for the moment) to be a 56Kb ASCII text file. As the POC proceeds and technical discussions begin with the partners who will provide the Universal Wireless Inspection System’s kernel, the size and structure of the SDMS may change. The partners, who are already grounded in electronic on-board computer (EOBR) technology, will be able to provide input as to how we should structure the SDMS for the POC and what the packet size should be/can be acceptable for transmission. 4) Partners Will Develop Their Own Version of the Universal Wireless Inspection System (UWIS) Kernel
81
The selected partners from industry (EOBR providers, data acquisition manufacturers, and/or telematics providers) will develop at their own cost the data collecting, buffering, and SDMS formatting/outputting device (kernel) which will be the heart of the UWIS. The partners will be provided with the input parameters to the UWIS kernel, the sample rate, the buffer size, the SDMS format, and the Kernel output format (driven by the transceiver’s input requirements). From this information they will develop their own proprietary, but universal, UWIS kernel. We will not require them to disclose their design or the internal operation/contents of their kernel. For our purposes, it will be a black box that gives the required SDMS upon request and based on the specified inputs. The kernel can be as complex or as simple as they choose while still meeting the specifications called out in the ORNL MOU. 5) ORNL Will Test the UWIS at the Tennessee-Based Roadside Testing Laboratory ORNL will design and conduct the POC test of the UWIS at the I-40/I-75 Knoxville portion of the Roadside Testing Laboratory (RTL). ORNL will facilitate and supply the test vehicle for the POC along with “break-out” connections to all the signals related to the SDMS and to the input of the transceiver. ORNL will monitor and record the inputs to the partner developed kernels, the output of the kernels (SDMS), and the output of the transceiver at the distant end. This data will be analyzed and compared to give results based on the functionality of the kernel and the transceiver in an independent and dependent manner as called out in the next section. 6) POC to Be Done in a Phased Approach In order to produce clear results and to move the project along at the fastest pace possible, the POC will be done in two phases: Phase 1A) testing of kernels, Phase 1B) testing of transceivers using various kernels. Phase 1A will be conducted looking only at the input and output of each Kernel under test. Each Kernel will be tested in the same vehicle under exact conditions. Data will be recorded and analyzed. Phase 1B will be conducted looking at the output of the Kernels and what is sent to the roadside by the transceiver. Testing of multiple transceivers will take place in Phase 1B (VII 5.9GHz, 802.11g 2.4GHz) as well as testing in various operational scenarios (vehicle-to-vehicle, vehicle-to-roadside). 7) POC Testing Rough Outline of Events:
• It is envisioned that the POC test will involve three to five technology (kernel) providers, two wireless transceiver providers, and one fleet.
• Inputs to the SDMS and the SDMS file size and structure will be determined in final form
after discussions with the partners and WRI team.
• Phase 1A - Once the UWIS kernels are developed, a date will be given for each partner to come to the RTL to oversee the integration of their system into the test vehicle and to conduct a pre-POC shakedown. The following day the POC will begin and the test
82
vehicle will be operated in various modes of driver status (on-duty, on-duty driving, off-duty) within a 100 mile radius of the RTL for a period of 8 hrs. The data collection will be continuous for the 8 hrs at a sample rate of 0.2Hz. The data will be monitored during the POC to verify collection quality and kernel operation. This will equate to 5,760 recordings of the SDMS to be compared with the input to the kernel at a given time. The target percentage of accuracy (correct data in the correct location within the SDMS) will be 99.5% or better for the POC. We will be able to report on this with a high level of confidence due to the large number of data points.
• Subsequent partners will follow until all kernels have been tested over a two to three
week period.
• Any partner whose kernel failed to properly collect and structure the information for the POC will be given a chance to return to the RTL in 30 days for an additional 8 hrs of testing.
• The testing will be repeated. If the partner fails again. No further testing will be done
and ORNL will deem this partner not viable for the POC per the MOU agreement.
• Phase 1B - Next will follow the testing of the transceivers. Again, we are expecting to have one 5.9GHz transceiver and one 2.4GHz transceiver. Each transceiver will be tested in the following scenarios:
o Vehicle-to-roadside (vehicle stopped at weigh station; “static test” for baseline) o Vehicle-to-roadside (low-speed by-pass lane, 25MPH) o Vehicle-to-roadside (high-speed, 55MPH) o Vehicle-to-vehicle (neither vehicle moving for baseline) o Vehicle-to-vehicle (low-speed, 25 MPH) o Vehicle-to-vehicle (high-speed, 55 MPH)
Each transceiver will be tested with each kernel in the above scenarios. The tests will be repeated 10 or more times for each scenario. Monitoring will be done at the output of the kernel and will be compared with the SDMS received at the roadside as to content and location of data. Results from this testing will be reviewed in process. Thus, speeds, antenna locations, vehicle placement, etc. can be adjusted as needed to assess the wireless transceiver’s viability in each desired scenario.
• Data from Phase 1A and Phase 1B will be analyzed and included in a final report.
8) Data Sharing with Stakeholders In order to maintain a level playing field and defend against the appearance of favoritism, ORNL will share all test data and the test plan (as well as future vision???) with stakeholders via a website/or other administered by the FMCSA. The data will be made available as to how well each kernel collected, formatted, and output the SDMS; and how each transceiver transmitted the SDMS. Partner names may not be mentioned in the data release.
83
9) Teaming ORNL will work closely with Mitretek and Volpe Center to design and conduct the POC, drawing on their expertise in system design, testing, and wireless communications. 10) POC Outputs Below is a bulletized list of expected Outputs from the POC. It is not complete and is evolving.
• POC Test Plan • Raw Data from POC
o ~80 hrs of wireless vehicle inspection technology testing and some 29,400 data samples (5,760 (8hrs of kernel testing) + 60 (transceiver 1) + 60 (transceiver 2) per Partner kernel
• Analyzed Data and POC Data Report • Functional UWIS(s) • Candidates for Pilot Test
11) POC Benefits
• Short time to technology development and demonstration (<1 yr.) • Reduced cost due to partnerships • Established UWIS partnerships • Real world experience with wireless vehicle inspection for ConOps development, etc. • Real world experience for drafting of technical requirements • Real world experience for drafting of standards • Wireless vehicle inspection technology maturation • Scenario based experience with 2.4 and 5.9 GHz transceivers • Informed decision to continue to Pilot Test (go/no-go) • Assessment of partner interest in Pilot Test
12) POC Work Steps • Define SDMS Inputs (complete) • Determine Transceiver Frequency(s) (complete) • Establish Partnerships (IP)
o Select Partners for Initial Contact (complete) o Draft Partner Letter (complete) o Draft MOU (IP) o Sign MOU
• Define POC (IP) • Define Data Collection Method (IP) • Define Data Analysis (IP) • Partners Develop UWIS Kernels • Establish TDOS Roles and Secure TDOS Support • Draft Test Plan • Select and Secure Test Vehicle • Instrument Test Vehicle • Instrument Inspection Station, Roadway, and Patrol Car
84
• Conduct POC Phase 1A • Collect Data and Video of Testing (if budget allows) • Analyze Data • Conduct POC Phase 1B • Analyze Data • Archive Data • Partner Survey • Final Report and Recommendations
13) Timeline Establish Partnerships (MOUs in Place) Feb 23, 07 Kernels Developed April 27, 07 POC 1A Complete June 29, 07 POC 1B Complete July 27, 07 Analysis Complete August 30, 07 Final Report October 26 ‘07
85
APPENDIX B: GENERIC WRI POC PARTNER MOU
Memorandum of Understanding No. MOU-UTB-2007XXX
between UT-Battelle, LLC
and XXX
regarding the Wireless Roadside Inspection Proof-of-Concept Test
This Memorandum of Understanding (MOU) is by and between XXX, INC. (Partner) and UT-BATTELLE, LLC (UT-Battelle), hereinafter jointly referred to as the “Parties”. Oak Ridge National Laboratory (ORNL) is a facility of the Department of Energy (DOE), managed and operated by UT-Battelle, a limited liability company, organized and existing under the laws of the State of Tennessee, pursuant to its contract DE-AC05-00OR22725 with the DOE. All actions by UT-Battelle under this MOU will be conducted under the authority of, and in accordance with, the terms of its contract with the DOE. In the event of an inconsistency between this MOU and the terms of UT-Battelle’s contract, UT-Battelle will apply the contract’s terms. BACKGROUND. The purpose of this MOU is for ORNL, in support of the U.S. Department of Transportation’s (DOT) Federal Motor Carrier Safety Administration (FMCSA) and in partnership with Satellite Security Systems, to demonstrate technology capable of conducting a wireless inspection of a commercial vehicle. This MOU will explain the project and set forth the roles and responsibilities of Satellite Security Systems and ORNL for the Wireless Roadside Inspection (WRI) Proof-of-Concept Test (POC). This effort, the WRI POC, is being conducted as Phase I of the three phase WRI Program. In the event of a successful WRI POC, FMCSA may elect to proceed with Phases 2 and 3 of the Program. Phase 2, termed the WRI Pilot Test (PT), will involve instrumenting multiple vehicles with favorable technology from the POC and operating in a real-world environment for ~12 months. Phase 3, termed the WRI Field Operation Test (FOT), will involve instrumenting a fleet of vehicles with ‘mature’ technology and sensors and conducting a multi-state-corridor test for 12-18 months. This MOU and the understandings herein concerning the Partner and ORNL are limited to the Phase 1 POC. While other Phases of the Program have been planned for, there is no promise made within this MOU that the Partner or ORNL will participate in them due to uncertainties of future program direction, findings from the POC, and funding for future Phases.
86
The goal of the Phase 1 POC is to demonstrate and showcase technology that can improve commercial vehicle safety through better inspection methods using on-board data collection and wireless data transmission technologies. Future deployment of this type of technology could provide major benefits to stakeholders such as:
• Increased safety – Decreasing the number of unsafe commercial vehicles on U.S. roadways.
• Increased efficiency — Enabling more inspections, at least on par with the number of weight inspections (~82M/year);
• Improved effectiveness — Reducing the probability of drivers bypassing an inspection station and increasing the likelihood that fleets will attempt to meet the safety regulations; and
• Maximized industry support — Minimizing fleet costs and wait times, and leveling the playing field.
This Partnership is being conducted on a gratuitous basis for no remuneration. Additionally, ORNL assumes no liability for the Partner’s technology while the technology is being used in the WRI POC. The Partner retains ownership of any equipment supplied for the WRI POC. The Partner supplied equipment will be returned to the Partner at the end of the POC testing. TIMELINE. The WRI Program began in August, 2006, with the formation of the WRI Technical Team consisting of FMCSA, ORNL, Volpe National Transportation Systems Center, Mitretek Systems, Johns Hopkins Applied Physics Laboratory, and the Commercial Vehicle Safety Alliance. Testing of the Phase 1 WRI POC technology is planned for June and July of 2007. The data from the POC will be analyzed and a final report will be drafted in September, 2007. ORNL will make the test vehicle available the last full week of May, 2007, for the Partner to install and test its technology. SCOPE. The system envisioned to accomplish the wireless inspection of a commercial vehicle is shown in Figure 1 and is titled the Universal Wireless Inspection System (UWIS). The UWIS will consist of technology and sensors to input and collect vehicle inspection information; the UWIS kernel (kernel), which will collect this data, buffer it, format it into the Safety Data Message Set (SDMS) (a 5BKb ASCII text file), and transfer it to the transceiver; and the transceiver to transmit the SDMS to the distant end (roadside inspection infrastructure or mobile enforcement vehicle).
87
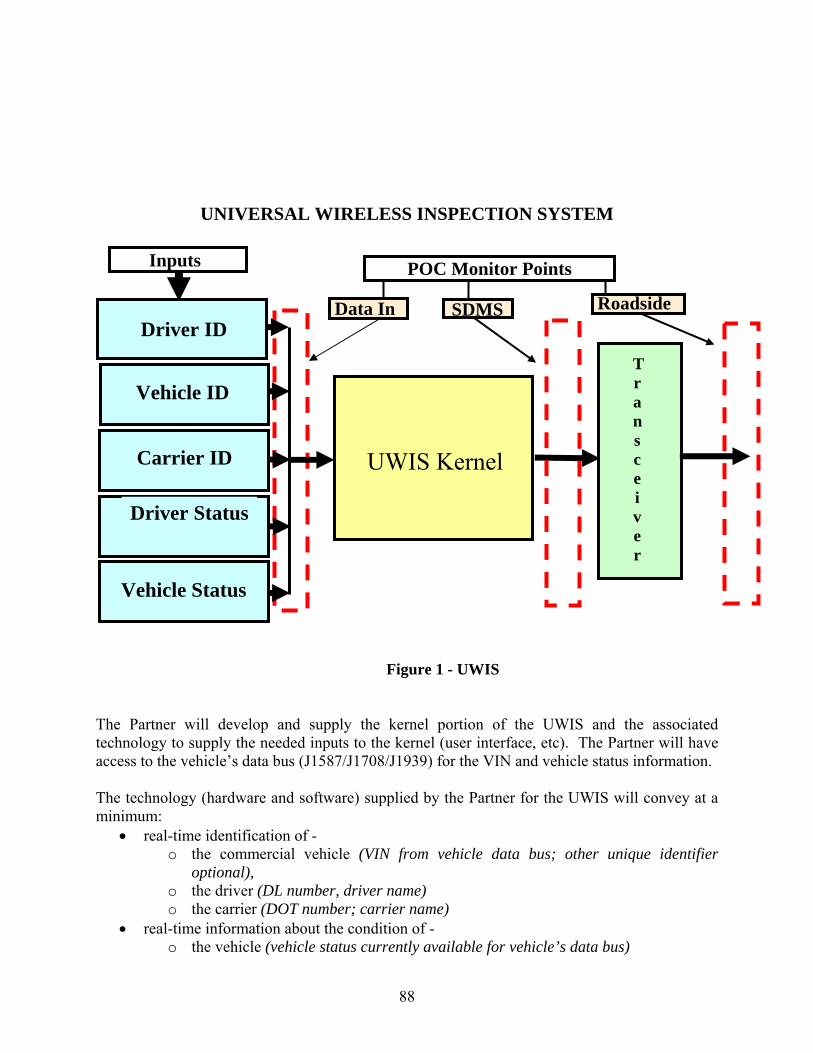
UNIVERSAL WIRELESS INSPECTION SYSTEM
Inputs
UWIS Kernel
Transceiver
POC Monitor Points
Data In RoadsideSDMS
Vehicle Status
Driver Status
Carrier ID
Vehicle ID
Driver ID
Figure 1 - UWIS
The Partner will develop and supply the kernel portion of the UWIS and the associated technology to supply the needed inputs to the kernel (user interface, etc). The Partner will have access to the vehicle’s data bus (J1587/J1708/J1939) for the VIN and vehicle status information. The technology (hardware and software) supplied by the Partner for the UWIS will convey at a minimum:
• real-time identification of - o the commercial vehicle (VIN from vehicle data bus; other unique identifier
optional), o the driver (DL number, driver name) o the carrier (DOT number; carrier name)
• real-time information about the condition of - o the vehicle (vehicle status currently available for vehicle’s data bus)
88
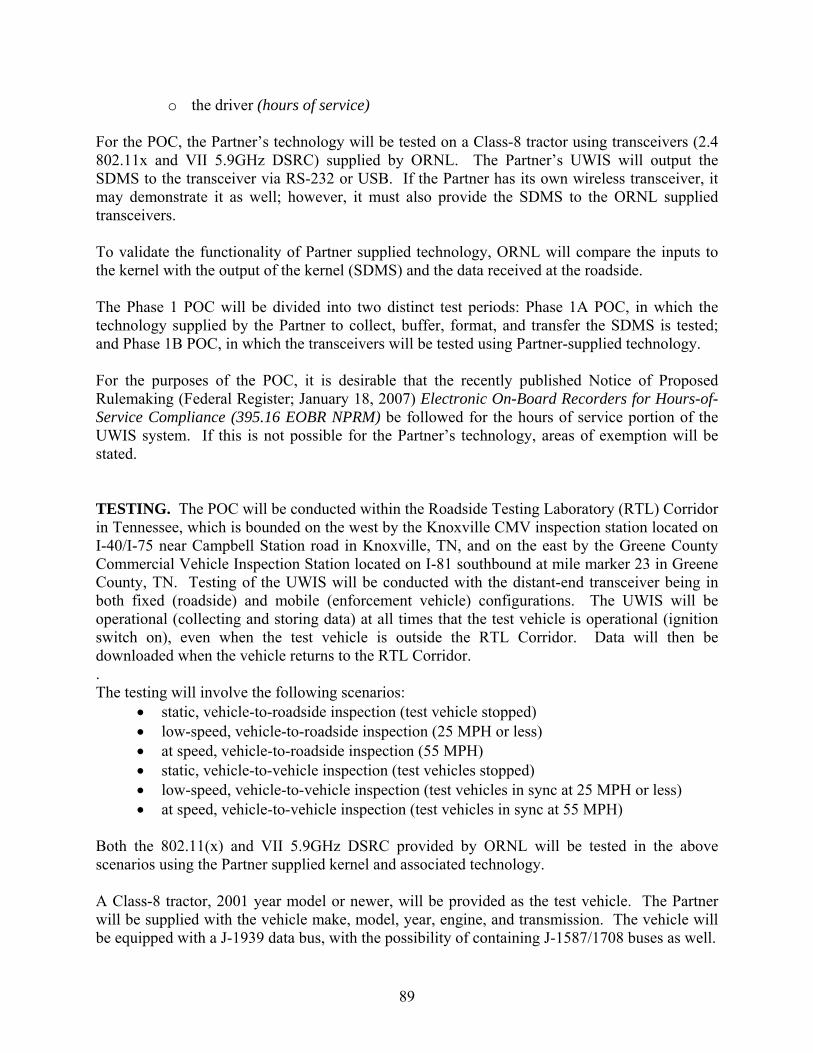
o the driver (hours of service) For the POC, the Partner’s technology will be tested on a Class-8 tractor using transceivers (2.4 802.11x and VII 5.9GHz DSRC) supplied by ORNL. The Partner’s UWIS will output the SDMS to the transceiver via RS-232 or USB. If the Partner has its own wireless transceiver, it may demonstrate it as well; however, it must also provide the SDMS to the ORNL supplied transceivers. To validate the functionality of Partner supplied technology, ORNL will compare the inputs to the kernel with the output of the kernel (SDMS) and the data received at the roadside. The Phase 1 POC will be divided into two distinct test periods: Phase 1A POC, in which the technology supplied by the Partner to collect, buffer, format, and transfer the SDMS is tested; and Phase 1B POC, in which the transceivers will be tested using Partner-supplied technology. For the purposes of the POC, it is desirable that the recently published Notice of Proposed Rulemaking (Federal Register; January 18, 2007) Electronic On-Board Recorders for Hours-of-Service Compliance (395.16 EOBR NPRM) be followed for the hours of service portion of the UWIS system. If this is not possible for the Partner’s technology, areas of exemption will be stated. TESTING. The POC will be conducted within the Roadside Testing Laboratory (RTL) Corridor in Tennessee, which is bounded on the west by the Knoxville CMV inspection station located on I-40/I-75 near Campbell Station road in Knoxville, TN, and on the east by the Greene County Commercial Vehicle Inspection Station located on I-81 southbound at mile marker 23 in Greene County, TN. Testing of the UWIS will be conducted with the distant-end transceiver being in both fixed (roadside) and mobile (enforcement vehicle) configurations. The UWIS will be operational (collecting and storing data) at all times that the test vehicle is operational (ignition switch on), even when the test vehicle is outside the RTL Corridor. Data will then be downloaded when the vehicle returns to the RTL Corridor. . The testing will involve the following scenarios:
• static, vehicle-to-roadside inspection (test vehicle stopped) • low-speed, vehicle-to-roadside inspection (25 MPH or less) • at speed, vehicle-to-roadside inspection (55 MPH) • static, vehicle-to-vehicle inspection (test vehicles stopped) • low-speed, vehicle-to-vehicle inspection (test vehicles in sync at 25 MPH or less) • at speed, vehicle-to-vehicle inspection (test vehicles in sync at 55 MPH)
Both the 802.11(x) and VII 5.9GHz DSRC provided by ORNL will be tested in the above scenarios using the Partner supplied kernel and associated technology. A Class-8 tractor, 2001 year model or newer, will be provided as the test vehicle. The Partner will be supplied with the vehicle make, model, year, engine, and transmission. The vehicle will be equipped with a J-1939 data bus, with the possibility of containing J-1587/1708 buses as well.
89
An enforcement vehicle will be supplied by the Tennessee Highway Patrol and fitted with the distant-end portion of the transceiver pair for the vehicle-to-vehicle transceiver tests. Additionally, a simple demonstration will be conducted to show that the UWIS is capable of functioning on a Class-8 motor coach as well as a tractor trailer. Partner will be supplied with the vehicle make, model, year, engine, and transmission. Testing of the UWIS and all Partner’s supplied technology will begin on June 4th, 2007 and will finish on July 27, 2007. A one-day demonstration of the UWIS on-board a motor coach will be conducted in mid-July in conjunction with the RTL Ribbon Cutting Ceremony and Technology Showcase. This event will be held at the Greene Co. CMV inspection station and will involve officials from DOE and DOT, wireless inspection stakeholders, and local and national media. In the event that the Partner supplied technology fails to collect, buffer, format the SDMS, transfer the SDMS to the transceiver, or otherwise fails to fulfill the terms of this MOU, the Partner will be given an opportunity to correct the malfunction and rejoin the POC within seven calendar days. In the event of a second failure, the Partner’s technology will not be considered viable, the POC will end for the Partner, and the Partner will not be included in subsequent Phases of the WRI Program. ROLES AND RESPONSIBILITIES. ORNL will be responsible for all phases of the POC (UWIS specifications, site selection, test design, test conducting, data collection, and data analysis). Specifically, ORNL will:
• Design and specify the POC • Secure test locations • Establish any needed infrastructure • Provide all needed equipment (with the exception of Partner required equipment) • Provide test vehicles • Provide necessary permits and authorizations • Provide test engineer and test staff for the POC • Collect data • Analyze data and draw conclusions as to the success of the POC
The Partner will be responsible for: supplying and installing all Partner owned equipment, verifying operation, and being available with Partner supplied equipment for initial testing at the Corridor on or around June 4, 2007. The Partner is also invited to Participate in the Demonstration to be held at the RTL Ribbon Cutting. The Partner specifically will be responsible for:
• Developing and providing technology to collect, buffer, format, and deliver the SDMS to the transceiver via RS-232 or USB communications for a two-month period (June through July 2007)
• Install provided technology onto test vehicle • Verify operation of technology
90
• Provide technical support for provided technology to assure successful and complete operation
POINTS-OF-CONTACT. Each Party will designate a Point-of-Contact for implementation of this MOU. The designated Points-of-Contact are:
UT-BATTELLE, LLC
NAME: XXX TITLE: XXX PHONE: XXX
XXX, INC.
NAME: XXX TITLE: XXX PHONE: XXX
AMENDMENTS. This MOU may be amended in writing, requiring signatures by both parties. TRANSFER RIGHTS. It is understood and agreed that this MOU is entered into by UT-Battelle and that administration of this MOU may be transferred from UT-Battelle to DOE or to its designee. EXPORT CONTROL. (a) The Parties agree to adhere to all applicable U.S. export laws and regulations; (b) each Party acknowledges that it is responsible for its own compliance with all U.S. export control laws and regulations; and (c) each Party acknowledges it will not knowingly export directly or indirectly, through its affiliates, licensees, or subsidiaries, any export controlled hardware, software, or technical data in the performance of this MOU without a required license which will be obtained by the responsible party from the appropriate U.S. Authority. EFFECTIVE DATE & TERMINATION. This MOU will be in effect through December 2007 and is effective upon the date of the last signature. It may be extended by mutual agreement of the Parties. Either Party may terminate this MOU by giving written notice to the other Party with the termination occurring 30 days thereafter.
91
AUTHORIZED SIGNATURES. The individuals whose signatures appear below hereby certify that they are authorized to sign on behalf of the respective Parties to this MOU. This MOU will be executed in duplicate, and is not effective until signed by both Parties.
UT-BATTELLE, LLC
By: __________________________
Name (printed): _________________
Title: __________________________ __________________________
Date: __________________________
XXX, INC.
By: _________________________
Name (printed): _______________ Title: ________________________ Date: ________________________
92
APPENDIX C: WRI POC TEST PLAN
WIRELESS ROADSIDE INSPECTION PROGRAM
Test Plan for the Phase 1 Proof of Concept Test (This document Fulfills Milestone M.5 and Deliverable D.4 of the Project SOW)
Prepared by
Oak Ridge National Laboratory
For Federal Motor Carrier Administration’s Office of Research and Analysis, Technology
Division
Table of Contents
WIRELESS ROADSIDE INSPECTION PROGRAM..................................................................93
Test Plan for the Phase 1 Proof of Concept Test ...........................................................................93
Table of Contents ...........................................................................................................................93
1.0 Introduction..............................................................................................................................95 1.1 Background................................................................................................................. 95 1.2 Acronyms and Definitions .......................................................................................... 96
2.0 Approach..................................................................................................................................97 2.1 WRI POC Overview ................................................................................................... 97
3.0 Goals and Objectives ..............................................................................................................99
4.0 Risk Items ..............................................................................................................................100
5.0 Testing Elements ....................................................................................................................100 5.1 Features to be Tested ................................................................................................ 100 5.2 Features Not to be Tested ......................................................................................... 101 5.3 Testing Entry and Exit Criteria ................................................................................ 101 5.4 Item Pass/Fail and Evaluation Criteria .................................................................... 101
93
5.5 Test Deliverables ..................................................................................................... 102
6.0 Environmental Considerations ............................................................................................102
7.0 Participant Responsibilities .................................................................................................102
8.0 Test Locations .......................................................................................................................103
9.0 Points-of-Contact ..................................................................................................................106 On-Board Scales – Name: Jim Morton........................................................................... 107
10.0 Test Signals and Sensors....................................................................................................108 10.1 SDMS Data of Interest............................................................................................ 108 10.2 SDMS Message Content ........................................................................................ 109 10.5 Sensors and Monitoring DAS ................................................................................ 111 10.6 System and Test Requirements.............................................................................. 114
11.0 Test Vehicle ..........................................................................................................................117 11.1 Test Vehicle ............................................................................................................ 117 11.2 Test Vehicle DAS Installation ............................................................................... 119 11.3 UWIS Kernel Integration........................................................................................ 119 11.4 Transceiver Integration ........................................................................................... 121
12.0 Roadside..............................................................................................................................122
13.0 Mobile Enforcement Vehicle................................................................................................123
14.0 POC Time Line and Schedule .............................................................................................124 14.1 Timeline .................................................................................................................. 124 14.2 Day-to-Day-Test Schedule..................................................................................... 124
15.0 Testing Steps ........................................................................................................................126 15.1 Validation and Calibration...................................................................................... 126 15.2 Test Event Log Sheet .............................................................................................. 127 15.3 POC Work Steps .................................................................................................... 128 15.4 Data Collection ...................................................................................................... 139 15.5 Data Storage........................................................................................................... 140
16.0 Test Feedback ......................................................................................................................140 16.1 Driver Feedback Sheet........................................................................................... 140 16.2 Carrier Feedback Sheet .......................................................................................... 141 16.3 TDOS Feedback Sheet........................................................................................... 142
17.0 Test Vehicle De-Instrumentation ........................................................................................143
Appendix A – UWIS Kernel System Requirements ......................................................................143
94
1.0 Introduction
1.1 Background The Federal Motor Carrier Safety Administration’s (FMCSA’s) mission is to reduce crashes, injuries, and fatalities involving large trucks and buses. Its goal is to reduce commercial motor vehicle-related fatalities to 1.65 fatalities per 100 million commercial motor vehicle miles traveled by 2008.
Presently there exists a safety inspection violation rate of 73%, or approximately 2.2 million out of 3 million annual inspections. This indicates that numerous commercial motor vehicles are on the road with driver and/or vehicle infractions. Using wireless technology, FMCSA could potentially increase the number of inspections per year (to approximately the number of weigh inspections, which is 82 million) and subsequently reduce the percentage of vehicles on the road with violations. It is expected that this will greatly reduce the violation rate by encouraging better vehicle maintenance and driver behavior.
The U.S. Department of Transportation (DOT) Federal Motor Carrier Safety Administration has commissioned the Wireless Roadside Inspection (WRI) Program to validate technology and methodology that can improve safety through inspections using wireless technologies that convey real-time identification of commercial vehicles, drivers, and carriers, as well as information about the condition of the vehicles and their drivers. It is hypothesized that these inspections will:
• Increase safety – Decrease the number of unsafe commercial vehicles on the road; • Increase efficiency — Speed up the inspection process, enabling more inspections
to occur, at least on par with the number of weight inspections; • Improve effectiveness — Reduce the probability of drivers bypassing an inspection
station and increase the likelihood that fleets will attempt to meet the safety regulations; and
• Maximize industry support — Reduce fleet costs, provide good return-on-
investment, minimize wait times, and level the playing field. To this end, the WRI program is defined in three parts
1. Phase 1: Proof of Concept Test - Testing of commercially available off-the-shelf (COTS) or near-COTS technology to validate the wireless inspection concept
2. Phase 2: Pilot Test – Safety technology maturation and back office system integration 3. Phase 3: Field Operational Test – Multi-vehicle testing over a multi-state instrumented
corridor The Phase 1 Proof of Concept Test (POC) will be conducted to demonstrate and validate the technology needed to collect, assemble, and wirelessly transmit the vehicle, carrier, and driver safety data to a fixed or mobile receiver. The purpose of this Test Plan is to describe the steps
95
necessary to complete the WRI POC test. Phases 2 and 3 will not be further addressed in this document.
1.2 Acronyms and Definitions ASCII – American Standard Code for Information Interchange CAN – Controller Area Network CDL – Commercial Driver’s License CMV RTC – Commercial Motor Vehicle Roadside Testing Corridor COTS – Commercially Available Off-the-Shelf CVO – Commercial Vehicle Operations DAS – Data Acquisition System DDTS – Day-to-Day Test Schedule DOT – Department of Transportation EOBR –Electronic On-board Recorder FMCSA –Federal Motor Carrier Safety Administration FOT – Field Operational Test HOS – Hours of Service KUT – Kernel Under Test MEV – Mobile Enforcement Vehicle MOU – Memorandum of Understanding MCNU – Multi-band Configurable Networking Unit NAS – North American Standard NTRC – National Transportation Research Center ORNL – Oak Ridge National Laboratory Partners – Industry suppliers of the UWIS in Partnership with ORNL/FMCSA PBBT – Performance-Based Brake Tester POC Proof of Concept Test RF – Radio Frequency RSE – Roadside Equipment Schrader – Schrader Trucking SDMS – Safety Data Message Set SDO – Scheduled Day Off TELS – Test Event Log Sheet TDOS – Tennessee Department of Safety TDOT - Tennessee Department of Transportation UWIS – Universal Wireless Inspection System VII – Vehicle Integration Infrastructure WRI – Wireless Roadside Inspection
96
2.0 Approach
2.1 WRI POC Overview The WRI POC will test the concept of inspecting a commercial vehicle wirelessly. To accomplish this, a Universal Wireless Inspection System (UWIS) has been designed and specified. The name UWIS implies that the system can be installed on any commercial vehicle in an aftermarket fashion and the system will then gather and transmit data germane to motor vehicle enforcement. ORNL has put together a team of experts in the areas of vehicle enforcement, vehicle data generation, data collection, and data transmission to participate in the WRI POC and to develop the UWIS. The team members are called out in section 9.0 of this document. The team members come to the WRI POC via Memorandum of Understanding (MOU) on a gratuitous basis, by contract, and by partnership. The UWIS(s) that will be used to wirelessly inspect the test vehicles during the WRI POC will consist of a user interface (to input data), kernel (to collect and process the data), and a transceiver (to wirelessly transfer the data). The user interface will allow hand-entry of data by the vehicle operator (e.g. name) and by the carrier (e.g. carrier name, DOT #, vehicle license plate number, etc.). The kernel will have GPS capability and connect to both the user interface and the vehicle’s Controller Area Network (CAN) data bus to collect data relative to the driver, carrier, and vehicle and form the Safety Data Message Set (SDMS) (an ASCII flat file). ORNL will conduct the POC using a commercial vehicle (class-8 tractor) fitted with a UWIS which will transfer the SDMS to the roadside and to a mobile enforcement vehicle (MEV). The POC will be divided into two sets of testing: Phase 1A- UWIS kernel testing, and Phase 1B- transceiver testing (to include the Phase 1A UWIS kernel). 2.2 Phase 1A An MOU will be put in place with each private industry Partner who will be supplying a UWIS kernel for testing. The MOU will define the roles of ORNL and the Partner for the POC, establish the POC timeline, and state the gratuitous nature of the Partnership. Once the UWIS kernels are developed, a date will be given for each Partner to come to the National Transportation Research Center (NTRC), located in Knoxville, TN, integrate their systems onto the test vehicle (under the supervision of ORNL staff), and conduct a pre-POC shakedown at the Commercial Motor Vehicle Roadside Testing Corridor (CMV RTC) (CMV RTC - a 70 mile designated testing corridor between the Knox Co. TN inspection station on I-40 and the Greene Co. TN inspection station on I-81) to verify that the equipment is operational (see section 14.2 for the day-to-day test schedule). The following day, the POC testing will begin at the CMV RTC and the test vehicle will be operated in various modes of driver status (on-duty, on-duty driving, off-duty) within a 100 air-mile radius of the NTRC. The POC testing for each Partner’s UWIS kernel will be completed in approximately eight hours. The Partners’ technology will remain on the test vehicle for Phase 1B testing. The step-by-step procedure for the Phase 1A POC testing is called out in section 13.0.
97
Any Partner whose kernel fails to properly collect and structure the information required for the POC (SDMS) during their assigned test dates will be given a chance to return to the CMV RTC within seven calendar days for an additional 8 hours of testing. If the Partner fails again, no further testing will be performed, and ORNL will deem this Partner not viable for the POC per the MOU agreement. 2.3 Phase 1B Next will follow the testing of the transceiver(s), which will transmit the SDMS as it is formatted by the kernels tested in Phase 1A. In the event that no Partner is able to successfully format the SDMS and make it available for transmission by the transceivers, a simulated SDMS will be provided by ORNL and will be used in the Phase 1B testing. Two transceiver frequencies will be tested: 5.9GHz and 2.4GHz. Each frequency will be tested in the following scenarios:
o Test Vehicle-to-roadside (vehicle stopped at weigh station; “static test” for baseline)
o Test Vehicle-to-roadside (low-speed by-pass lane: 25MPH) o Test Vehicle-to-roadside (high-speed: 55 MPH) o Vehicle-to-MEV (neither vehicle moving for baseline) o Vehicle-to-MEV (low-speed: 25 MPH, same direction, in sync) o Vehicle-to-MEV (high-speed: 55 MPH, same direction, in sync) o Vehicle-to-MEV (test vehicle stopped, enforcement vehicle moving and visa-
versa) o Vehicle-to-MEV (vehicle approaching each other in opposing directions at 55
MPH) Each transceiver frequency will be tested with each successful kernel from Phase 1A in the above scenarios. Monitoring will be done at the output of the kernel and will be compared with the Safety Data Message Set (SDMS) received at the roadside as to content and location of data. Results from this testing will be reviewed in process. Thus, speeds, antenna locations, vehicle placement, etc. can be adjusted as needed to assess the wireless transceiver’s viability in each desired scenario. All changes or adjustments during actual testing will be done by ORNL personnel and recorded as to type, amount, and time of change. The step-by-step procedure for the Phase 1B POC testing is called out in section 13.0. Data from Phases 1A and 1B will be analyzed and included in a final report. ORNL will supply the test vehicle, driver, insurance, and fuel for the POC via short-term lease. Testing locations are called out in section 8.0. 2.4 WRI POC Testing Platforms Figure 2.1 shows the testing platforms involved in the WRI POC. They consist of Truck/Motor Coach (test vehicles), Roadside, and Mobile Enforcement Vehicle. See sections 11.0, 12.0, and 13.0 respectively for additional detail.
98
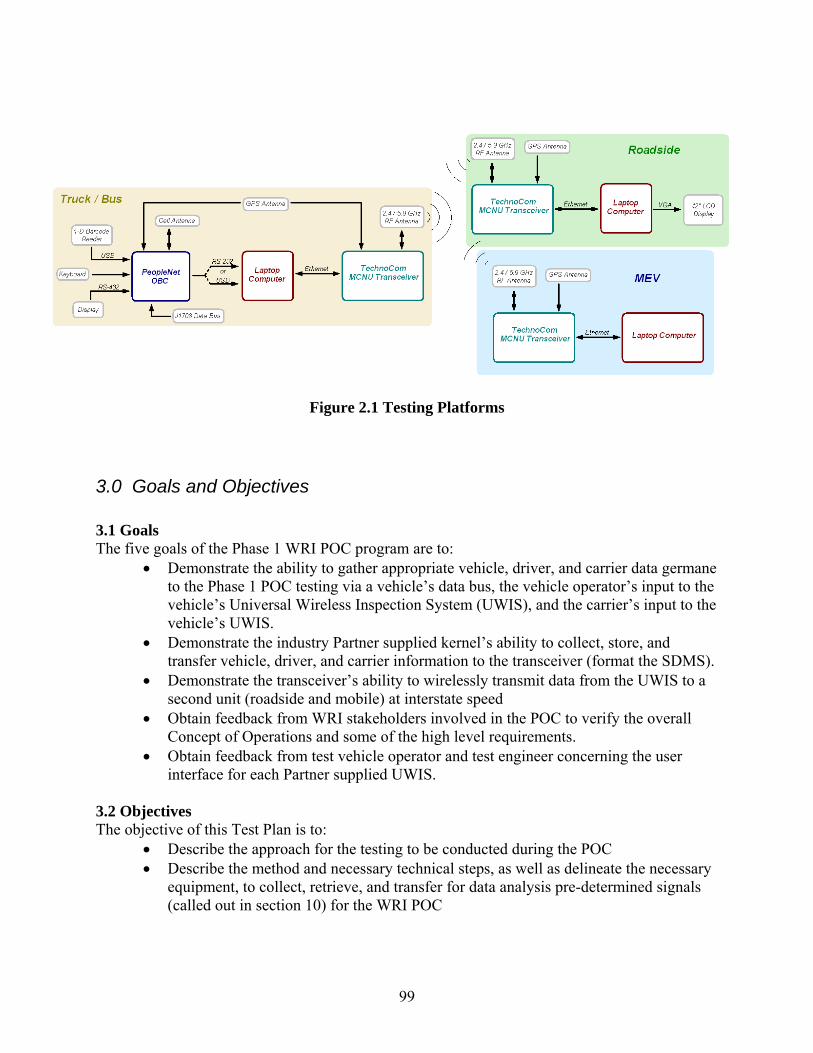
Figure 2.1 Testing Platforms 3.0 Goals and Objectives
3.1 Goals The five goals of the Phase 1 WRI POC program are to:
• Demonstrate the ability to gather appropriate vehicle, driver, and carrier data germane to the Phase 1 POC testing via a vehicle’s data bus, the vehicle operator’s input to the vehicle’s Universal Wireless Inspection System (UWIS), and the carrier’s input to the vehicle’s UWIS.
• Demonstrate the industry Partner supplied kernel’s ability to collect, store, and transfer vehicle, driver, and carrier information to the transceiver (format the SDMS).
• Demonstrate the transceiver’s ability to wirelessly transmit data from the UWIS to a second unit (roadside and mobile) at interstate speed
• Obtain feedback from WRI stakeholders involved in the POC to verify the overall Concept of Operations and some of the high level requirements.
• Obtain feedback from test vehicle operator and test engineer concerning the user interface for each Partner supplied UWIS.
3.2 Objectives The objective of this Test Plan is to:
• Describe the approach for the testing to be conducted during the POC • Describe the method and necessary technical steps, as well as delineate the necessary
equipment, to collect, retrieve, and transfer for data analysis pre-determined signals (called out in section 10) for the WRI POC
99
• Define the performance measures that will be used for determining how well the technology works, as set forth in the Fast Track Plan8
• Define what data will be collected and how that data will be collected to measure performance
• Define what steps will be taken to ensure the quality of the data. 4.0 Risk Items There are a number of risk issues relative to a successful completion of the POC process:
1. Partner technology being ready on schedule with the Partner having an acceptable product that meets the requirements of the POC. Having multiple technology partners will help reduce this risk.
2. Vehicle Integration Infrastructure (VII) 5.9 GHz transceiver technology and support being available for the POC.
3. Weather may cause delay of specific testing. 4. Vehicle-Hardware integration complications. 5. Radio Frequency (RF) issues including antenna placement, type, etc. may delay or
complicate testing. 6. Test vehicle availability (vehicle breakdown, maintenance) may cause some delay or
shift in test schedule 7. Product or equipment issues such that the concept cannot be proven 8. Competition with the August 7, 2007, Technology Showcase.
Preparation for the Showcase will take away from available WRI POC resources (staff, time, funding, and equipment).
5.0 Testing Elements 5.1 Features to be Tested For the POC, the following features and capabilities will be tested:
1. The UWIS kernel’s ability to capture and store the list of data (SDMS) called out in section 10.1 of this document.
2. The UWIS kernel’s ability to accurately process the required elements of the SDMS. 3. The UWIS kernel’s ability to transfer the SDMS to the wireless transceiver using
either an RS-232 or USB connection. 4. The wireless transceiver’s ability to receive the SDMS from the UWIS kernel. 5. The wireless transceiver’s ability to receive requests for the SDMS from the roadside
under multiple conditions, as called out in Section 15.3 6. The wireless transceiver’s ability to transmit the SDMS to the roadside under
multiple conditions, as called out in section 15.3. 7. The wireless transceiver’s ability to receive requests for the SDMS from the MEV
under multiple conditions, as called out in Section 15.3 8 ORNL Fast Track Plan Rev2 dated November 16, 2007, and posted on the WRI SharePoint site
100
8. The wireless transceiver’s ability to transmit the SDMS to an MEV under multiple conditions, as called out in Section 15.3
5.2 Features Not to be Tested
For the POC, the following features will not be tested: 1. The UWIS kernel’s ability to fully comply with FMCSA’s Proposed Rule Making on
EOBRs for commercial vehicles (395.16). It is desirable that the kernel devices meet, or closely approximate, 395.16. However, relative to the hours of service for the POC, we will only be looking for status changes and total time in a status (at a minimum).
2. Vehicle status information beyond what is already present on the test tractor. 3. Any features associated with the back office analysis and storage systems (The back
office systems will be simulated for the WRI POC). 4. The ability of the UWIS to transmit and receive the SDMS in various terrains, in
vehicle congestion, and in the presence of electronic interference. 5. Transmission of data above 55 mph (test vehicle or MEV speed). 6. Definitive Range limitations of the wireless transceivers.
It is expected that there will be several limitations of the wireless testing relative to real world conditions, including minimal interference that could be caused from several different factors (e.g. multi-path, rain, etc.).
5.3 Testing Entry and Exit Criteria Entry conditions include the following:
• At least one UWIS kernel partner with operational equipment is desirable. However, the absence of this would not prevent Phase 1B testing of the transceiver using a simulated SDMS.
• A contract for 5.9GHz and 2.4 GHz transceiver technology is desirable. However, the absence this would not prevent the Phase 1A testing of the kernel(s).
• All necessary test equipment is available • Access to an acceptable test vehicle • The test plan and test procedures have been finalized. • Suitable, safe test location(s)
Exit conditions include the following:
• POC Phase 1A and 1B testing successfully completed • POC test window expires (see section 14.2 for dates)
5.4 Item Pass/Fail and Evaluation Criteria Any partner whose kernel fails to properly collect, structure, and output the SDMS information (output viable data for monitoring; no SDMS, SDMS with no data) will be given a chance to re-enter the POC testing within seven calendar days. At that point, the POC testing for that Partner’s technology will be repeated. If the Partner’s technology fails again to be able to produce the SDMS, no further testing will be done and ORNL will deem this Partner not viable for the POC per the MOU agreement.
101
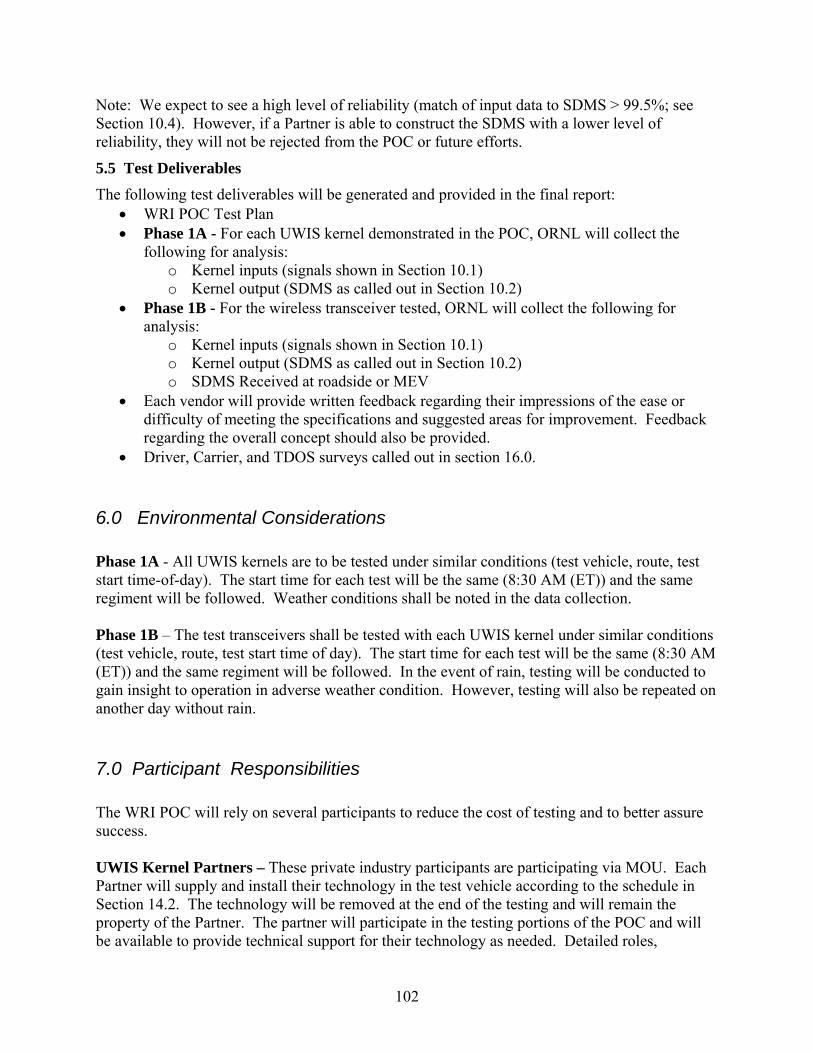
Note: We expect to see a high level of reliability (match of input data to SDMS > 99.5%; see Section 10.4). However, if a Partner is able to construct the SDMS with a lower level of reliability, they will not be rejected from the POC or future efforts.
5.5 Test Deliverables The following test deliverables will be generated and provided in the final report:
• WRI POC Test Plan • Phase 1A - For each UWIS kernel demonstrated in the POC, ORNL will collect the
following for analysis: o Kernel inputs (signals shown in Section 10.1) o Kernel output (SDMS as called out in Section 10.2)
• Phase 1B - For the wireless transceiver tested, ORNL will collect the following for analysis:
o Kernel inputs (signals shown in Section 10.1) o Kernel output (SDMS as called out in Section 10.2) o SDMS Received at roadside or MEV
• Each vendor will provide written feedback regarding their impressions of the ease or difficulty of meeting the specifications and suggested areas for improvement. Feedback regarding the overall concept should also be provided.
• Driver, Carrier, and TDOS surveys called out in section 16.0. 6.0 Environmental Considerations
Phase 1A - All UWIS kernels are to be tested under similar conditions (test vehicle, route, test start time-of-day). The start time for each test will be the same (8:30 AM (ET)) and the same regiment will be followed. Weather conditions shall be noted in the data collection. Phase 1B – The test transceivers shall be tested with each UWIS kernel under similar conditions (test vehicle, route, test start time of day). The start time for each test will be the same (8:30 AM (ET)) and the same regiment will be followed. In the event of rain, testing will be conducted to gain insight to operation in adverse weather condition. However, testing will also be repeated on another day without rain.
7.0 Participant Responsibilities
The WRI POC will rely on several participants to reduce the cost of testing and to better assure success. UWIS Kernel Partners – These private industry participants are participating via MOU. Each Partner will supply and install their technology in the test vehicle according to the schedule in Section 14.2. The technology will be removed at the end of the testing and will remain the property of the Partner. The partner will participate in the testing portions of the POC and will be available to provide technical support for their technology as needed. Detailed roles,
102
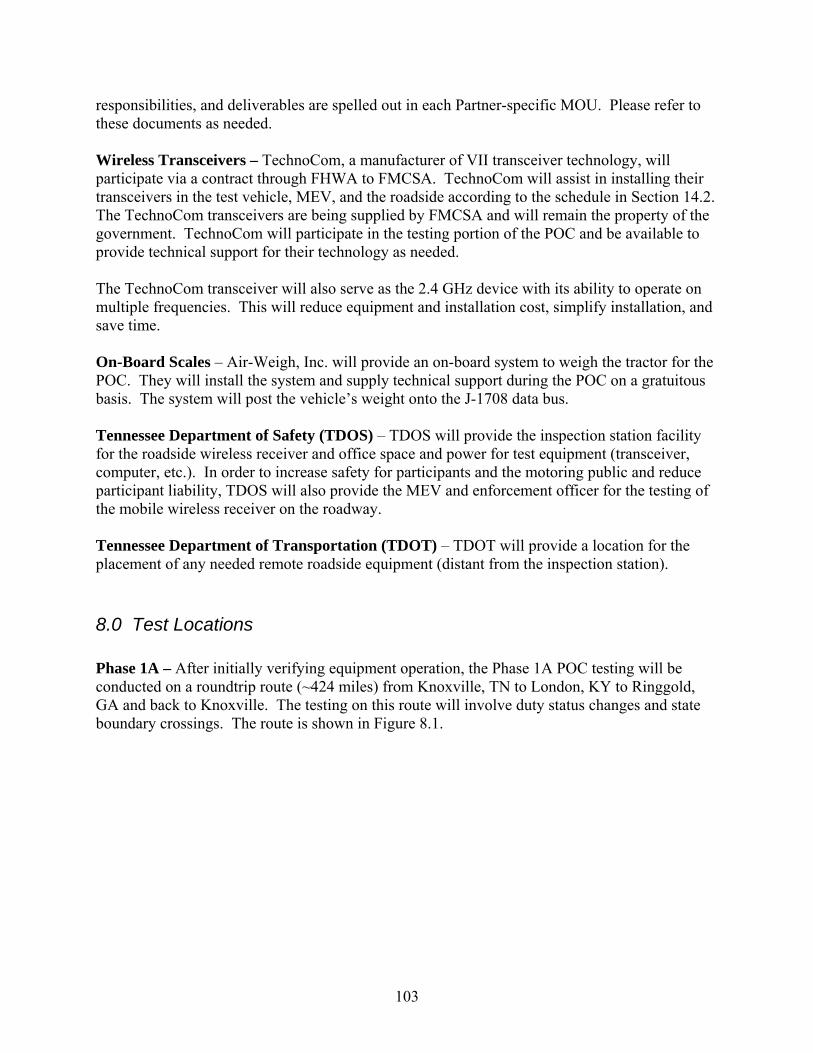
responsibilities, and deliverables are spelled out in each Partner-specific MOU. Please refer to these documents as needed. Wireless Transceivers – TechnoCom, a manufacturer of VII transceiver technology, will participate via a contract through FHWA to FMCSA. TechnoCom will assist in installing their transceivers in the test vehicle, MEV, and the roadside according to the schedule in Section 14.2. The TechnoCom transceivers are being supplied by FMCSA and will remain the property of the government. TechnoCom will participate in the testing portion of the POC and be available to provide technical support for their technology as needed. The TechnoCom transceiver will also serve as the 2.4 GHz device with its ability to operate on multiple frequencies. This will reduce equipment and installation cost, simplify installation, and save time. On-Board Scales – Air-Weigh, Inc. will provide an on-board system to weigh the tractor for the POC. They will install the system and supply technical support during the POC on a gratuitous basis. The system will post the vehicle’s weight onto the J-1708 data bus. Tennessee Department of Safety (TDOS) – TDOS will provide the inspection station facility for the roadside wireless receiver and office space and power for test equipment (transceiver, computer, etc.). In order to increase safety for participants and the motoring public and reduce participant liability, TDOS will also provide the MEV and enforcement officer for the testing of the mobile wireless receiver on the roadway. Tennessee Department of Transportation (TDOT) – TDOT will provide a location for the placement of any needed remote roadside equipment (distant from the inspection station). 8.0 Test Locations
Phase 1A – After initially verifying equipment operation, the Phase 1A POC testing will be conducted on a roundtrip route (~424 miles) from Knoxville, TN to London, KY to Ringgold, GA and back to Knoxville. The testing on this route will involve duty status changes and state boundary crossings. The route is shown in Figure 8.1.
103
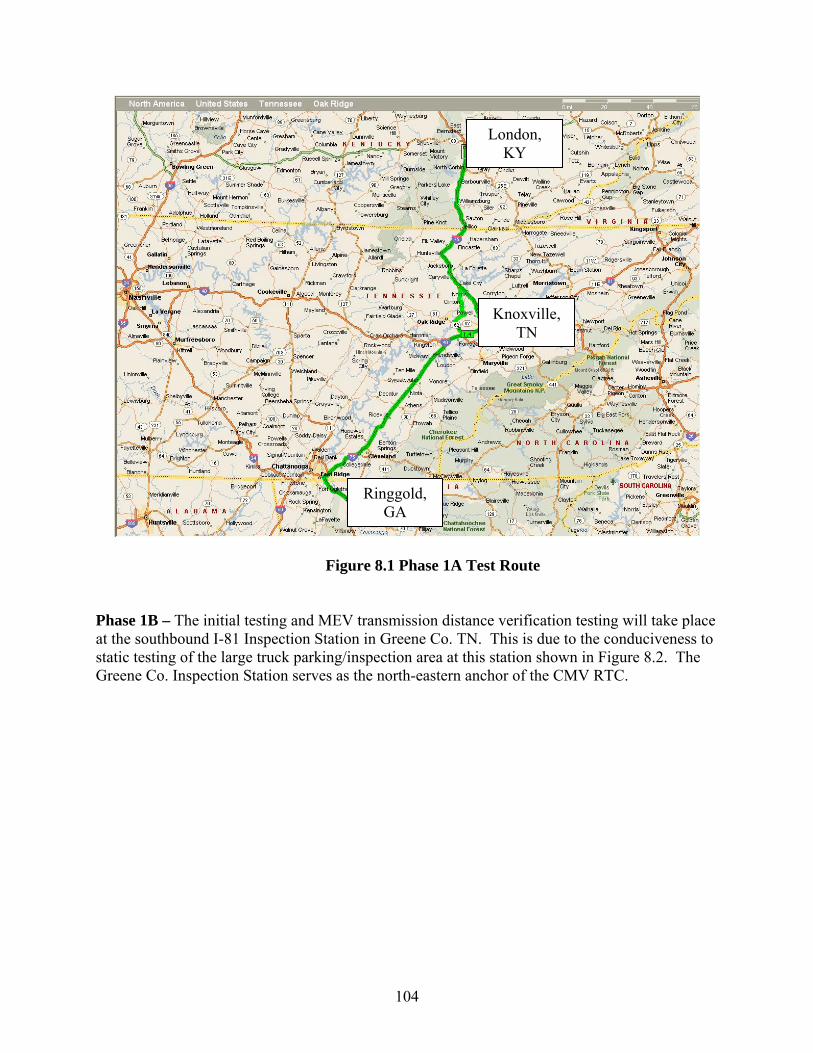
London, KY
Knoxville, TN
Ringgold, GA
Figure 8.1 Phase 1A Test Route
Phase 1B – The initial testing and MEV transmission distance verification testing will take place at the southbound I-81 Inspection Station in Greene Co. TN. This is due to the conduciveness to static testing of the large truck parking/inspection area at this station shown in Figure 8.2. The Greene Co. Inspection Station serves as the north-eastern anchor of the CMV RTC.
104
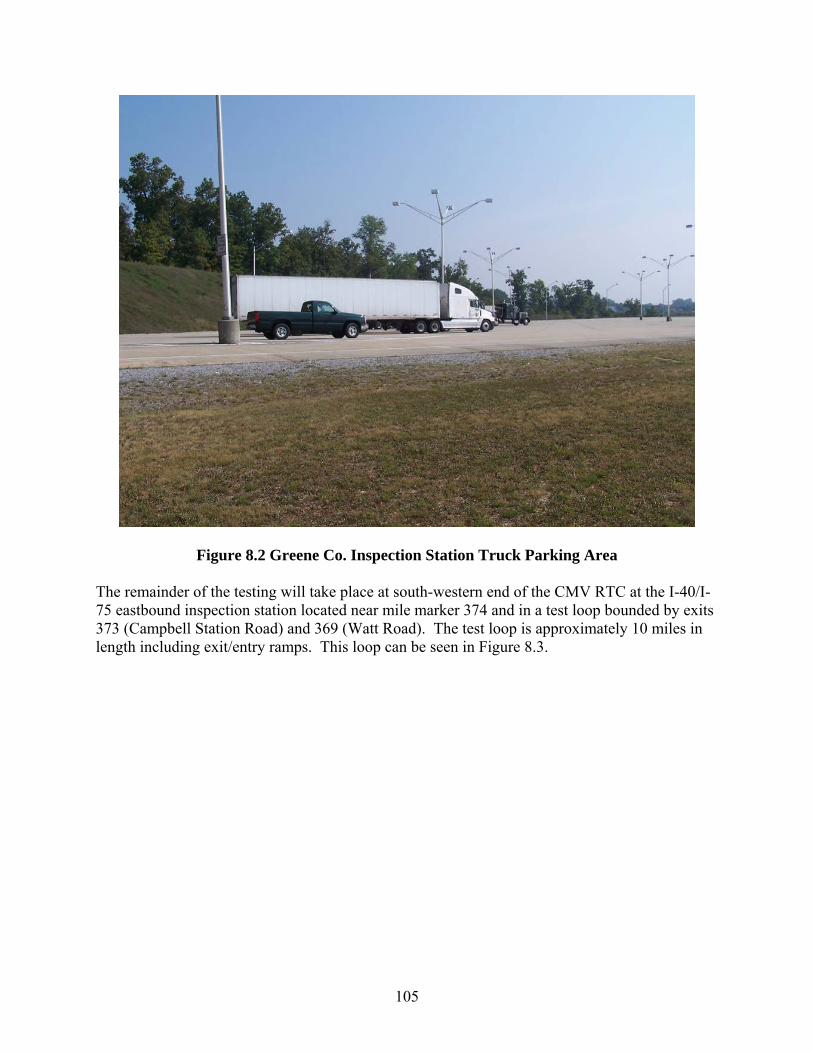
Figure 8.2 Greene Co. Inspection Station Truck Parking Area The remainder of the testing will take place at south-western end of the CMV RTC at the I-40/I-75 eastbound inspection station located near mile marker 374 and in a test loop bounded by exits 373 (Campbell Station Road) and 369 (Watt Road). The test loop is approximately 10 miles in length including exit/entry ramps. This loop can be seen in Figure 8.3.
105
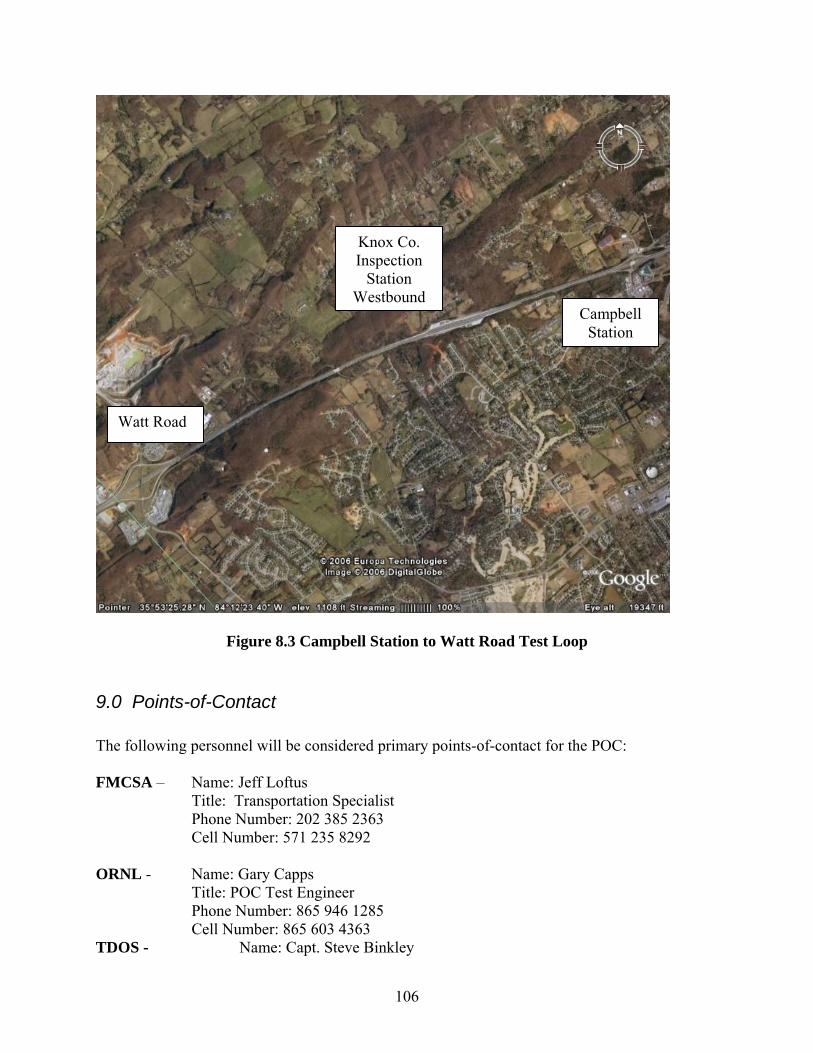
Knox Co. Inspection
Station Westbound
Campbell Station
Watt Road
Figure 8.3 Campbell Station to Watt Road Test Loop
9.0 Points-of-Contact
The following personnel will be considered primary points-of-contact for the POC: FMCSA – Name: Jeff Loftus Title: Transportation Specialist Phone Number: 202 385 2363 Cell Number: 571 235 8292 ORNL - Name: Gary Capps Title: POC Test Engineer Phone Number: 865 946 1285 Cell Number: 865 603 4363 TDOS - Name: Capt. Steve Binkley
106
(Nashville) Title: TDOS Test Coordinator Phone Number: 615 687 2317
TDOS - Name: Capt. J. R. Bridgeman (Knoxville Title: Officer in Charge Inspection Phone Number: 865 966 5071 Station) TDOS - Name: Lt. James McKenzie (Greene Co. Title: Officer in Charge Inspection Phone Number: 423 235 4104 Station) Wireless Transceiver – Name: Justin McNew Title: Director, Mobility Solutions Phone Number: 818 501 1903 Cell Number: 310 922 4953 Kernel Partner 1 – Name: Brian McLaughlin Title: PeopleNet, Director of Marketing Phone Number: 888 346 3486 (Ex 211) Kernel Partner 2 – Name: Tom King Title: VP Marketing, Satellite Security Systems Phone Number: 760 822 0457 On-Board Scales – Name: Jim Morton Title: Air-Weigh Product Management Phone Number: 704-876-1909 Test vehicles: Tractor – Commercial Carrier Consultants (Wilber Thomas) Phone: 719 545 7843
Cell Number: 719 251 1270
Motor Coach – Greene Coach (Russell Ooten) Phone: 423 638 8271 Phone: 800 338 5469
Cell Number: 423 823 2507
107
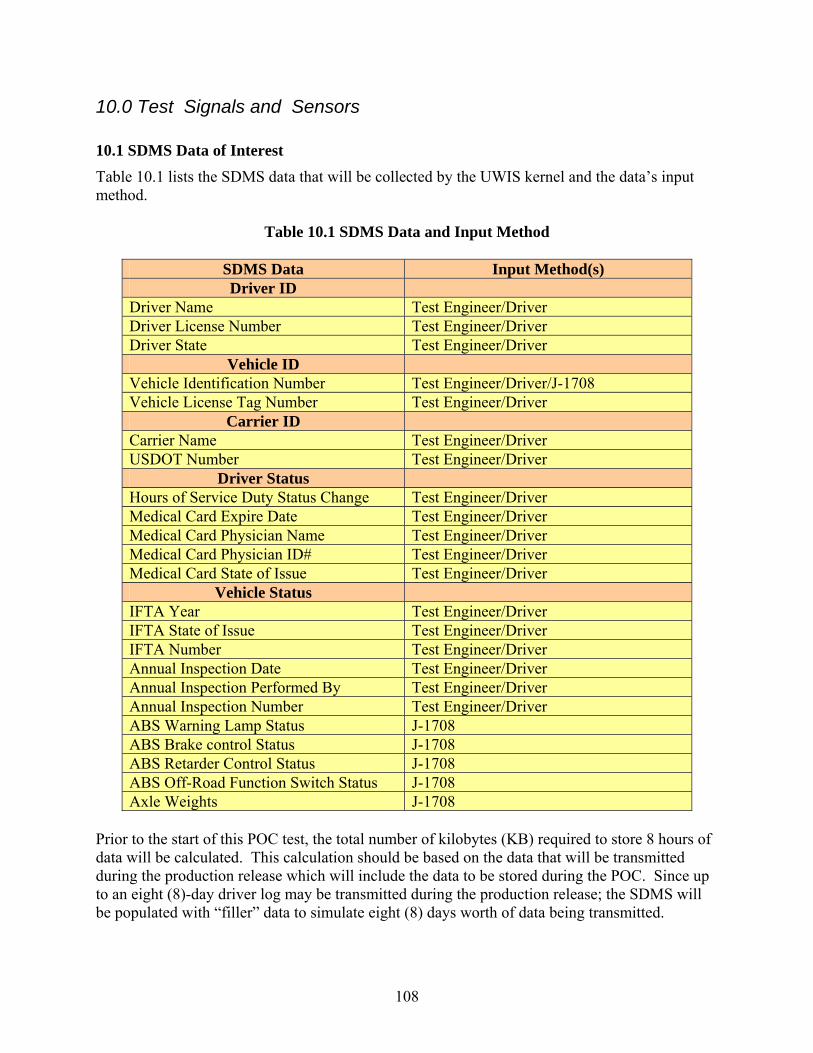
10.0 Test Signals and Sensors
10.1 SDMS Data of Interest Table 10.1 lists the SDMS data that will be collected by the UWIS kernel and the data’s input method.
Table 10.1 SDMS Data and Input Method
SDMS Data Input Method(s) Driver ID
Driver Name Test Engineer/Driver Driver License Number Test Engineer/Driver Driver State Test Engineer/Driver
Vehicle ID Vehicle Identification Number Test Engineer/Driver/J-1708 Vehicle License Tag Number Test Engineer/Driver
Carrier ID Carrier Name Test Engineer/Driver USDOT Number Test Engineer/Driver
Driver Status Hours of Service Duty Status Change Test Engineer/Driver Medical Card Expire Date Test Engineer/Driver Medical Card Physician Name Test Engineer/Driver Medical Card Physician ID# Test Engineer/Driver Medical Card State of Issue Test Engineer/Driver
Vehicle Status IFTA Year Test Engineer/Driver IFTA State of Issue Test Engineer/Driver IFTA Number Test Engineer/Driver Annual Inspection Date Test Engineer/Driver Annual Inspection Performed By Test Engineer/Driver Annual Inspection Number Test Engineer/Driver ABS Warning Lamp Status J-1708 ABS Brake control Status J-1708 ABS Retarder Control Status J-1708 ABS Off-Road Function Switch Status J-1708 Axle Weights J-1708
Prior to the start of this POC test, the total number of kilobytes (KB) required to store 8 hours of data will be calculated. This calculation should be based on the data that will be transmitted during the production release which will include the data to be stored during the POC. Since up to an eight (8)-day driver log may be transmitted during the production release; the SDMS will be populated with “filler” data to simulate eight (8) days worth of data being transmitted.
108
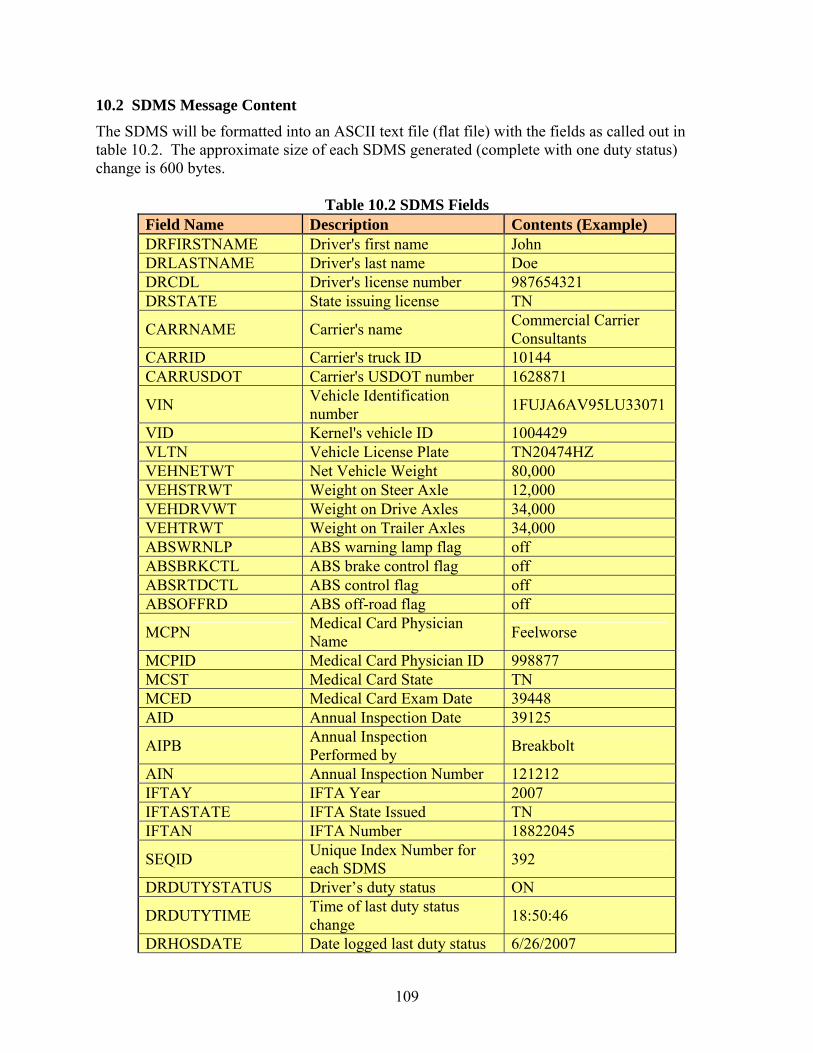
10.2 SDMS Message Content The SDMS will be formatted into an ASCII text file (flat file) with the fields as called out in table 10.2. The approximate size of each SDMS generated (complete with one duty status) change is 600 bytes.
Table 10.2 SDMS Fields Field Name Description Contents (Example) DRFIRSTNAME Driver's first name John DRLASTNAME Driver's last name Doe DRCDL Driver's license number 987654321 DRSTATE State issuing license TN
Carrier's name Commercial Carrier Consultants CARRNAME
CARRID Carrier's truck ID 10144 CARRUSDOT Carrier's USDOT number 1628871
Vehicle Identification number 1FUJA6AV95LU33071 VIN
VID Kernel's vehicle ID 1004429 VLTN Vehicle License Plate TN20474HZ VEHNETWT Net Vehicle Weight 80,000 VEHSTRWT Weight on Steer Axle 12,000 VEHDRVWT Weight on Drive Axles 34,000 VEHTRWT Weight on Trailer Axles 34,000 ABSWRNLP ABS warning lamp flag off ABSBRKCTL ABS brake control flag off ABSRTDCTL ABS control flag off ABSOFFRD ABS off-road flag off
Medical Card Physician Name Feelworse MCPN
MCPID Medical Card Physician ID 998877 MCST Medical Card State TN MCED Medical Card Exam Date 39448 AID Annual Inspection Date 39125
Annual Inspection Performed by Breakbolt AIPB
AIN Annual Inspection Number 121212 IFTAY IFTA Year 2007 IFTASTATE IFTA State Issued TN IFTAN IFTA Number 18822045
Unique Index Number for each SDMS 392 SEQID
DRDUTYSTATUS Driver’s duty status ON Time of last duty status change 18:50:46 DRDUTYTIME
DRHOSDATE Date logged last duty status 6/26/2007
109
change Time logged last duty status change 20:28:32 DRHOSTIME
DRHOS_USA607 PeopleNet HOS Info no DRHOSDSA_USA607 PeopleNet HOS Info 35778 DRHOSOSA_USA607 PeopleNet HOS Info 35778 PFXODO Odometer reading 161586.80miles
Location of last duty status change 0@Knoxville, TN DRDUTYLOC
GPSLONG Longitude -84.15474 GPSLAT Latitude 35.95472 GPSHEAD Heading 0deg GPSSPEED Speed 0mph
UTC Time (from GPS) Wed Jun 06 13:58:23 2007 GPSUTC
10.3 SDMS File Size and Transmission Speed In an effort to estimate the amount of time required to transmit a log file generated by a UWIS, several calculations were performed. Assuming 600 bytes per entry, table 10.3 shows the expected file sized for various days of stored data and various entries per day. Assuming a wireless transmission rate of 6Mb/sec, table 10.4 shows the expected transmission time of an SDMS for the same parameters.
Table 10.3 Expected SDMS File Size
File Size in KB Entries Per Day
5 10 15 20 25 30 35 40 1 3 6 9 12 15 18 21 24 8 24 48 72 96 120 144 168 192
14 42 84 126 168 210 252 294 336 30 90 180 270 360 450 540 630 720 45 135 270 405 540 675 810 945 1080
Num
ber o
f Day
s of
Dat
a Tr
ansf
erre
d
60 180 360 540 720 900 1080 1260 1440
Table 10.4 Expected SDMS Transfer Time Time in Seconds Required to Transmit
Entries Per Day 5 10 15 20 25 30 35 40
1 0.004 0.008 0.012 0.016 0.02 0.024 0.028 0.032
Num
ber
of D
ays
of D
ata
Tran
sfe
d
8 0.032 0.064 0.096 0.128 0.16 0.192 0.224 0.256
110
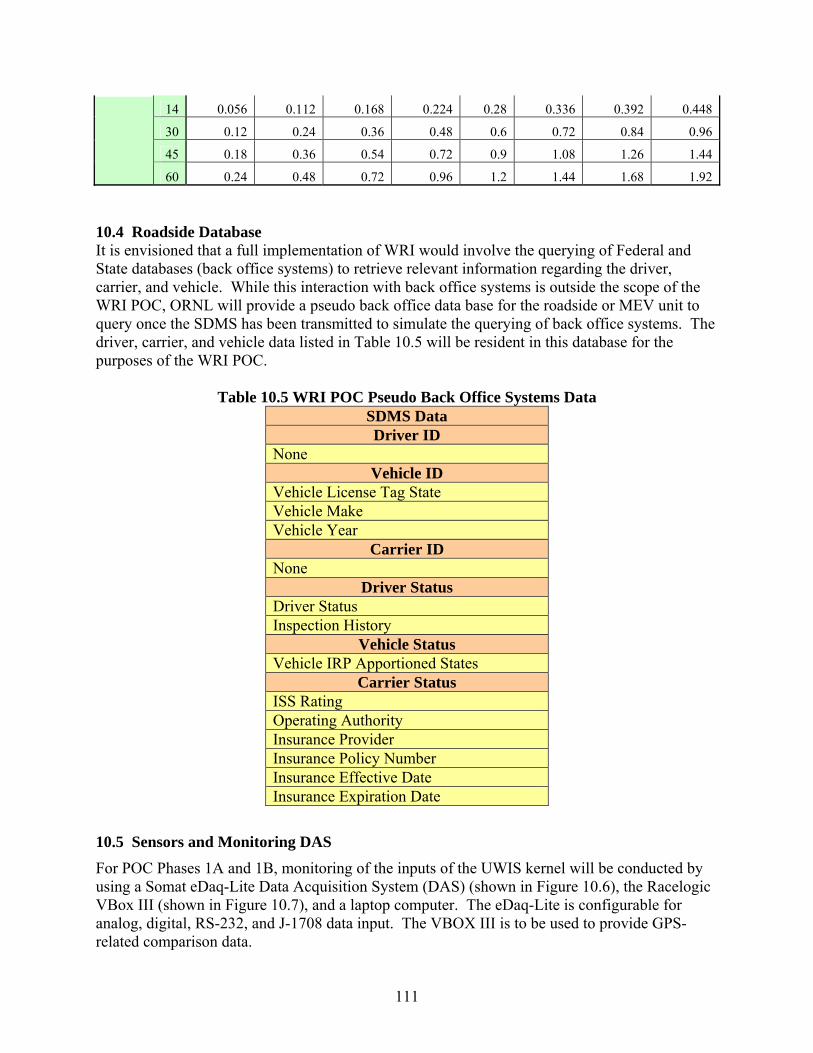
14 0.056 0.112 0.168 0.224 0.28 0.336 0.392 0.448
30 0.12 0.24 0.36 0.48 0.6 0.72 0.84 0.96
45 0.18 0.36 0.54 0.72 0.9 1.08 1.26 1.44
60 0.24 0.48 0.72 0.96 1.2 1.44 1.68 1.92 10.4 Roadside Database It is envisioned that a full implementation of WRI would involve the querying of Federal and State databases (back office systems) to retrieve relevant information regarding the driver, carrier, and vehicle. While this interaction with back office systems is outside the scope of the WRI POC, ORNL will provide a pseudo back office data base for the roadside or MEV unit to query once the SDMS has been transmitted to simulate the querying of back office systems. The driver, carrier, and vehicle data listed in Table 10.5 will be resident in this database for the purposes of the WRI POC.
Table 10.5 WRI POC Pseudo Back Office Systems Data SDMS Data Driver ID
None Vehicle ID
Vehicle License Tag State Vehicle Make Vehicle Year
Carrier ID None
Driver Status Driver Status Inspection History
Vehicle Status Vehicle IRP Apportioned States
Carrier Status ISS Rating Operating Authority Insurance Provider Insurance Policy Number Insurance Effective Date Insurance Expiration Date
10.5 Sensors and Monitoring DAS For POC Phases 1A and 1B, monitoring of the inputs of the UWIS kernel will be conducted by using a Somat eDaq-Lite Data Acquisition System (DAS) (shown in Figure 10.6), the Racelogic VBox III (shown in Figure 10.7), and a laptop computer. The eDaq-Lite is configurable for analog, digital, RS-232, and J-1708 data input. The VBOX III is to be used to provide GPS-related comparison data.
111
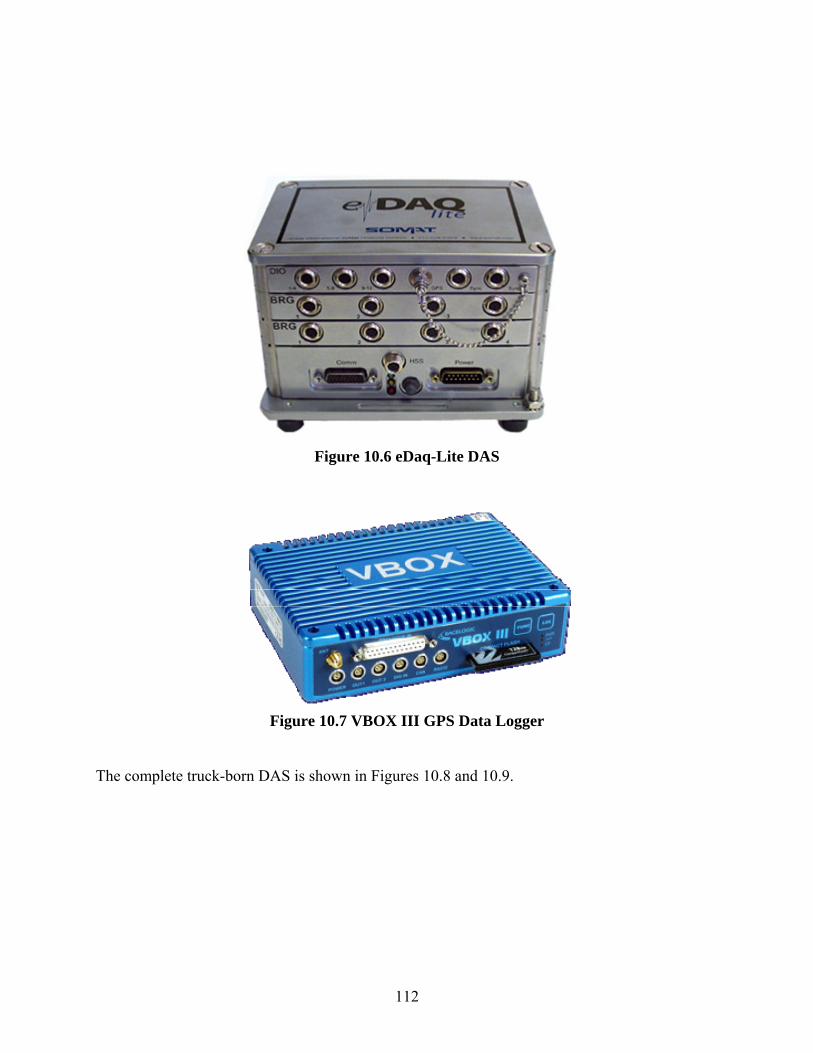
Figure 10.6 eDaq-Lite DAS
Figure 10.7 VBOX III GPS Data Logger
The complete truck-born DAS is shown in Figures 10.8 and 10.9.
112
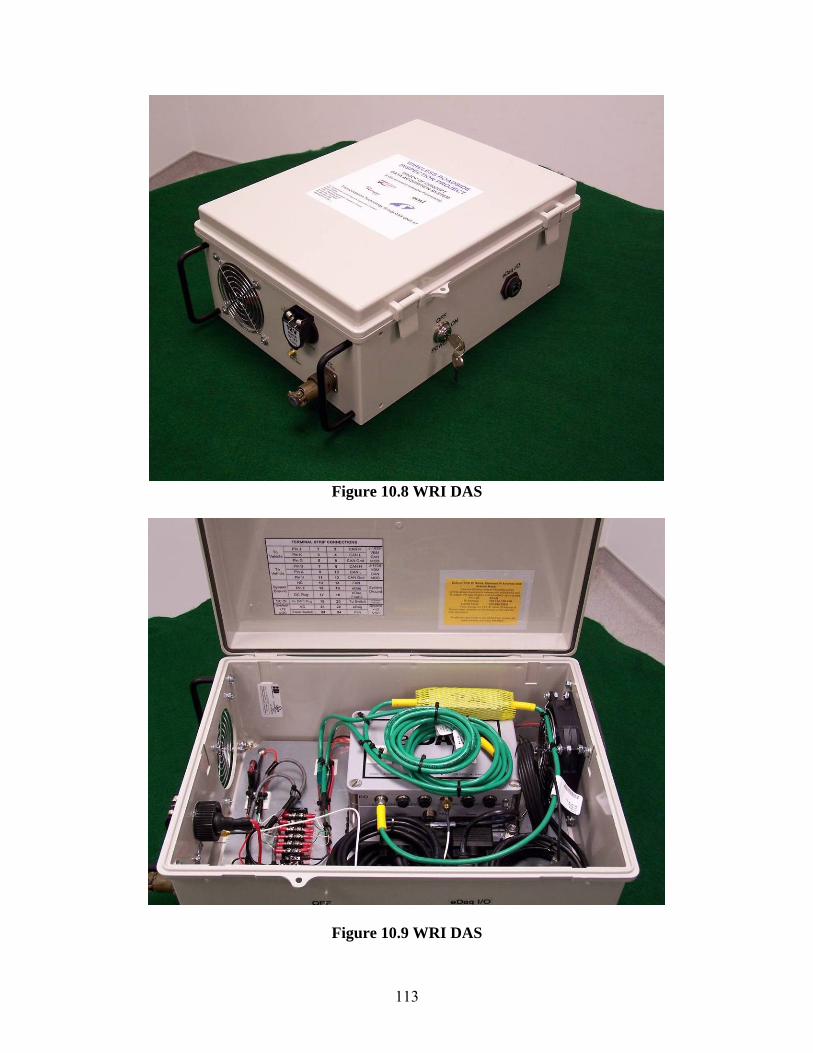
Figure 10.8 WRI DAS
Figure 10.9 WRI DAS
113
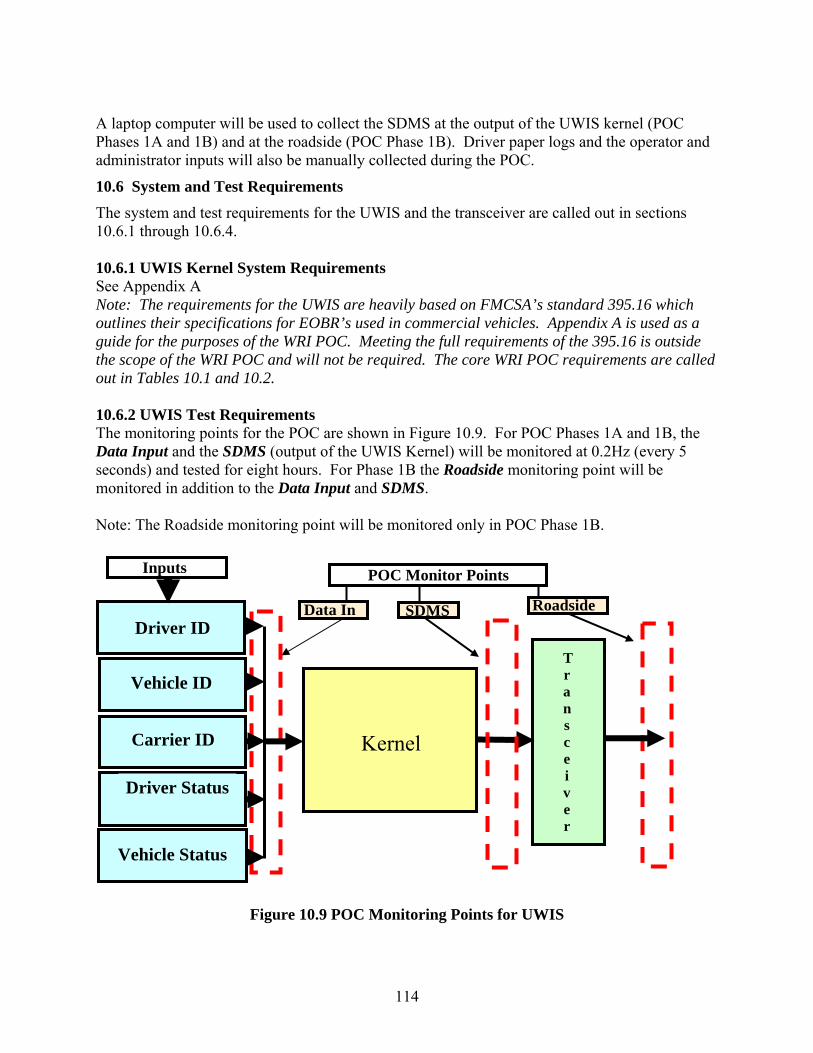
A laptop computer will be used to collect the SDMS at the output of the UWIS kernel (POC Phases 1A and 1B) and at the roadside (POC Phase 1B). Driver paper logs and the operator and administrator inputs will also be manually collected during the POC.
10.6 System and Test Requirements The system and test requirements for the UWIS and the transceiver are called out in sections 10.6.1 through 10.6.4. 10.6.1 UWIS Kernel System Requirements See Appendix A Note: The requirements for the UWIS are heavily based on FMCSA’s standard 395.16 which outlines their specifications for EOBR’s used in commercial vehicles. Appendix A is used as a guide for the purposes of the WRI POC. Meeting the full requirements of the 395.16 is outside the scope of the WRI POC and will not be required. The core WRI POC requirements are called out in Tables 10.1 and 10.2. 10.6.2 UWIS Test Requirements The monitoring points for the POC are shown in Figure 10.9. For POC Phases 1A and 1B, the Data Input and the SDMS (output of the UWIS Kernel) will be monitored at 0.2Hz (every 5 seconds) and tested for eight hours. For Phase 1B the Roadside monitoring point will be monitored in addition to the Data Input and SDMS. Note: The Roadside monitoring point will be monitored only in POC Phase 1B.
Driver ID
Vehicle ID
Carrier ID
Driver Status
Vehicle Status
Kernel
Transceiver
POC Monitor Points
SDMS Roadside Data In
Inputs
Figure 10.9 POC Monitoring Points for UWIS
114
10.6.3 Transceiver System The TechnoCom Multi-band Configurable Networking Unit (MCNU) will serve as the transceiver for the WRI POC operating both at the 2.4 GHz and 5.9 GHz frequencies. The MCNU is a lightweight and weatherproof device that is used to build standards-compliant, high-speed, multi-band wireless communication networks. Optimized antennas for each frequency will be used. MCNU Specifications: Wireless Interfaces Two IEE 802.11a/b/g/j/p PHY compliant interfaces Each wireless interface
• Configurable locally or remotely o IEEE 802.11a/b/g/j/p PHY
• Data rates o 1, 2, 5.5, 11 Mbps o 3, 4.5, 6, 9, 12,18, 24, 27 Mbps o 6, 9, 12, 18, 24, 36, 48, 54 Mbps
• Frequency band o 2.400 – 2.484 GHz (ISM) o 4.940 – 4.990 GHz (PS) o 5.150 – 5.250 GHz (UNII) o 5.250 – 5.350 GHz (UNII) o 5.470 – 5.725 GHz (UNII) o 5.725 – 5.825 GHz (UNII) o 5.825 – 5.850 GHz (ISM) o 5.850 – 5.925 GHZ (ITS-DSRC)
• Transmit power o 17 – 19 dBm maximum
• Enhanced MAC features o Security enhancements – IEEE 802.11.i o QoS enhancements – IEEE 802.11.e
• Antenna diversity: two antenna connections o N-Type RF Connectors
• Antennas o Antenna selection and purchasing guide included
• GPS o Ublox Antaris TIM-4H Super Sense Receiver o One external SMA antenna connector
• Processor o Via Eden CPU, 400MHz or 733 MHz
• Memory o 256 MB SDRAM
• Storage o 2 GB Compact Flash
115
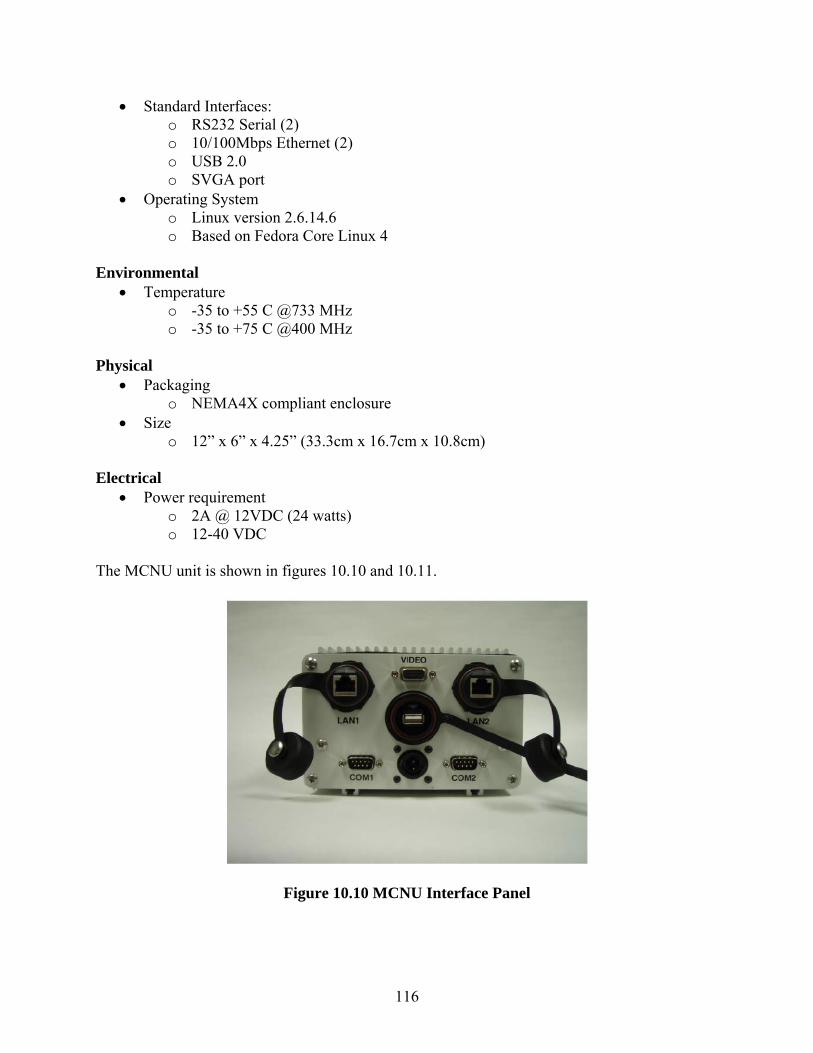
• Standard Interfaces: o RS232 Serial (2) o 10/100Mbps Ethernet (2) o USB 2.0 o SVGA port
• Operating System o Linux version 2.6.14.6 o Based on Fedora Core Linux 4
Environmental
• Temperature o -35 to +55 C @733 MHz o -35 to +75 C @400 MHz
Physical
• Packaging o NEMA4X compliant enclosure
• Size o 12” x 6” x 4.25” (33.3cm x 16.7cm x 10.8cm)
Electrical
• Power requirement o 2A @ 12VDC (24 watts) o 12-40 VDC
The MCNU unit is shown in figures 10.10 and 10.11.
Figure 10.10 MCNU Interface Panel
116
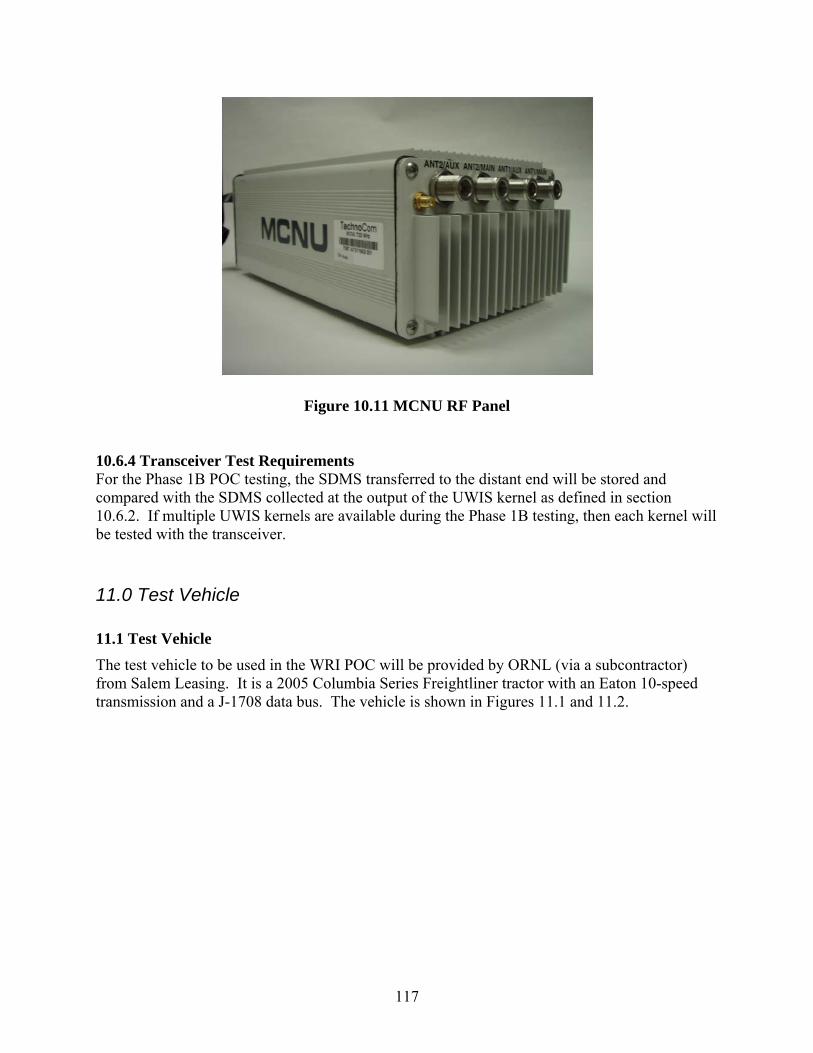
Figure 10.11 MCNU RF Panel 10.6.4 Transceiver Test Requirements For the Phase 1B POC testing, the SDMS transferred to the distant end will be stored and compared with the SDMS collected at the output of the UWIS kernel as defined in section 10.6.2. If multiple UWIS kernels are available during the Phase 1B testing, then each kernel will be tested with the transceiver. 11.0 Test Vehicle
11.1 Test Vehicle The test vehicle to be used in the WRI POC will be provided by ORNL (via a subcontractor) from Salem Leasing. It is a 2005 Columbia Series Freightliner tractor with an Eaton 10-speed transmission and a J-1708 data bus. The vehicle is shown in Figures 11.1 and 11.2.
117
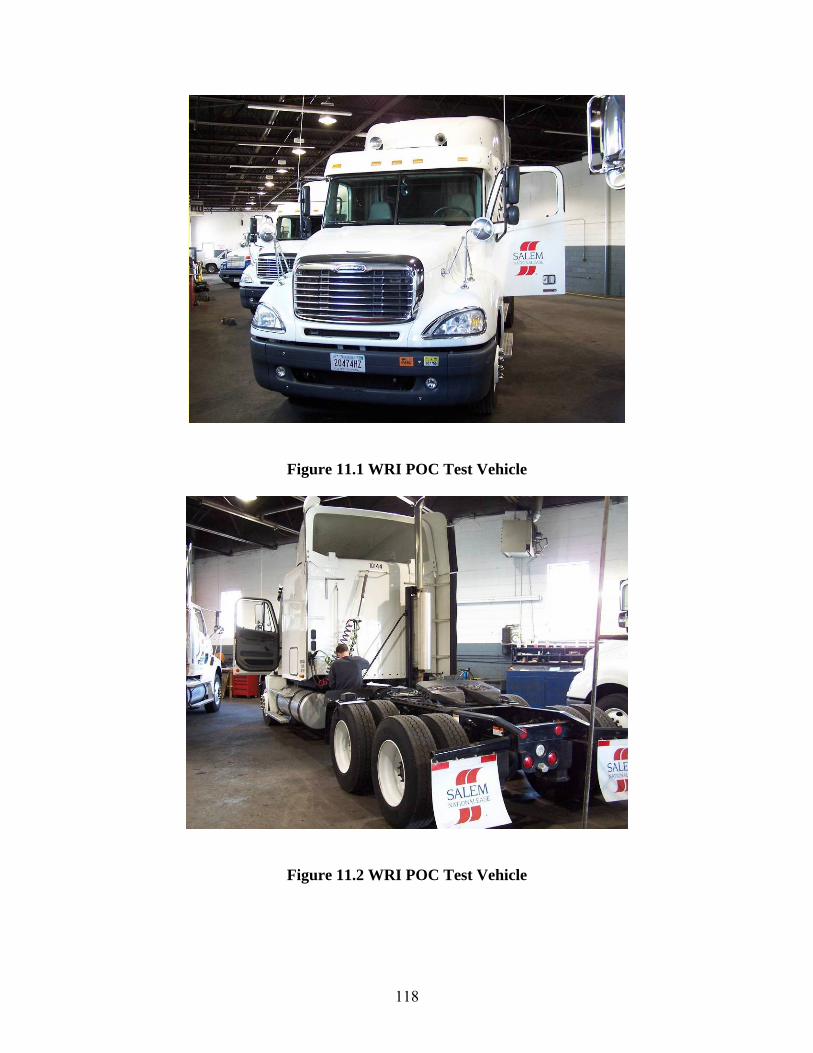
Figure 11.1 WRI POC Test Vehicle
Figure 11.2 WRI POC Test Vehicle
118
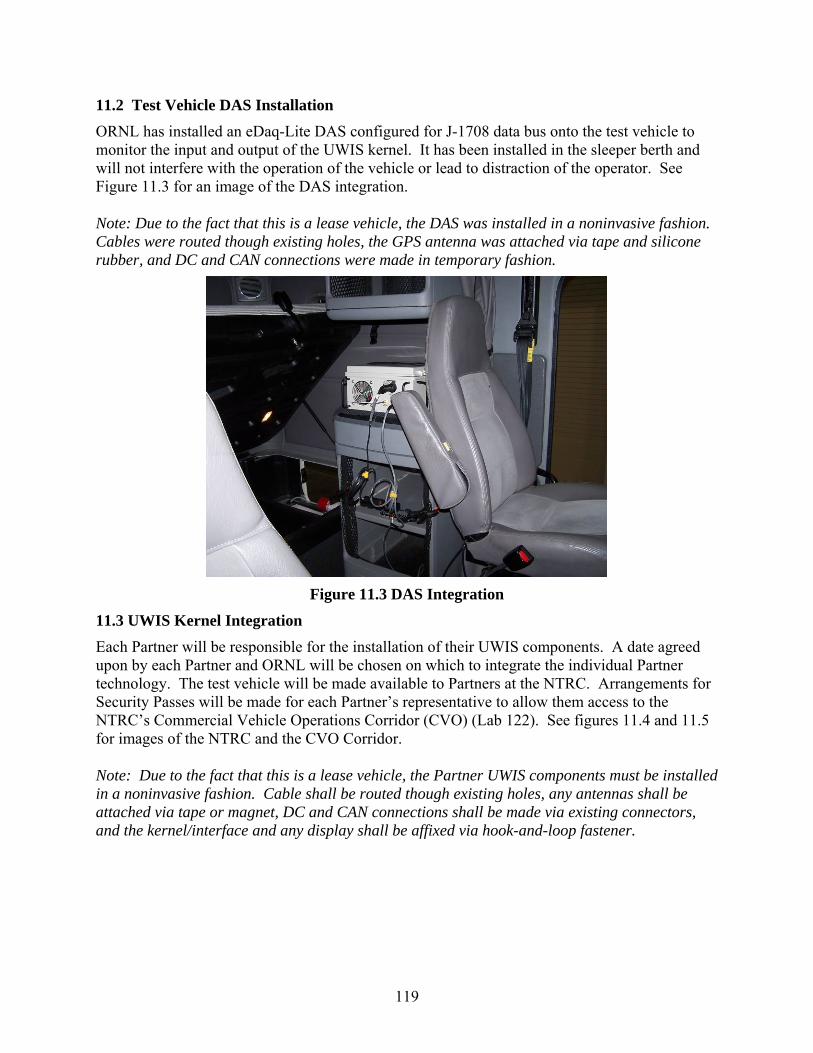
11.2 Test Vehicle DAS Installation ORNL has installed an eDaq-Lite DAS configured for J-1708 data bus onto the test vehicle to monitor the input and output of the UWIS kernel. It has been installed in the sleeper berth and will not interfere with the operation of the vehicle or lead to distraction of the operator. See Figure 11.3 for an image of the DAS integration. Note: Due to the fact that this is a lease vehicle, the DAS was installed in a noninvasive fashion. Cables were routed though existing holes, the GPS antenna was attached via tape and silicone rubber, and DC and CAN connections were made in temporary fashion.
Figure 11.3 DAS Integration
11.3 UWIS Kernel Integration Each Partner will be responsible for the installation of their UWIS components. A date agreed upon by each Partner and ORNL will be chosen on which to integrate the individual Partner technology. The test vehicle will be made available to Partners at the NTRC. Arrangements for Security Passes will be made for each Partner’s representative to allow them access to the NTRC’s Commercial Vehicle Operations Corridor (CVO) (Lab 122). See figures 11.4 and 11.5 for images of the NTRC and the CVO Corridor. Note: Due to the fact that this is a lease vehicle, the Partner UWIS components must be installed in a noninvasive fashion. Cable shall be routed though existing holes, any antennas shall be attached via tape or magnet, DC and CAN connections shall be made via existing connectors, and the kernel/interface and any display shall be affixed via hook-and-loop fastener.
119
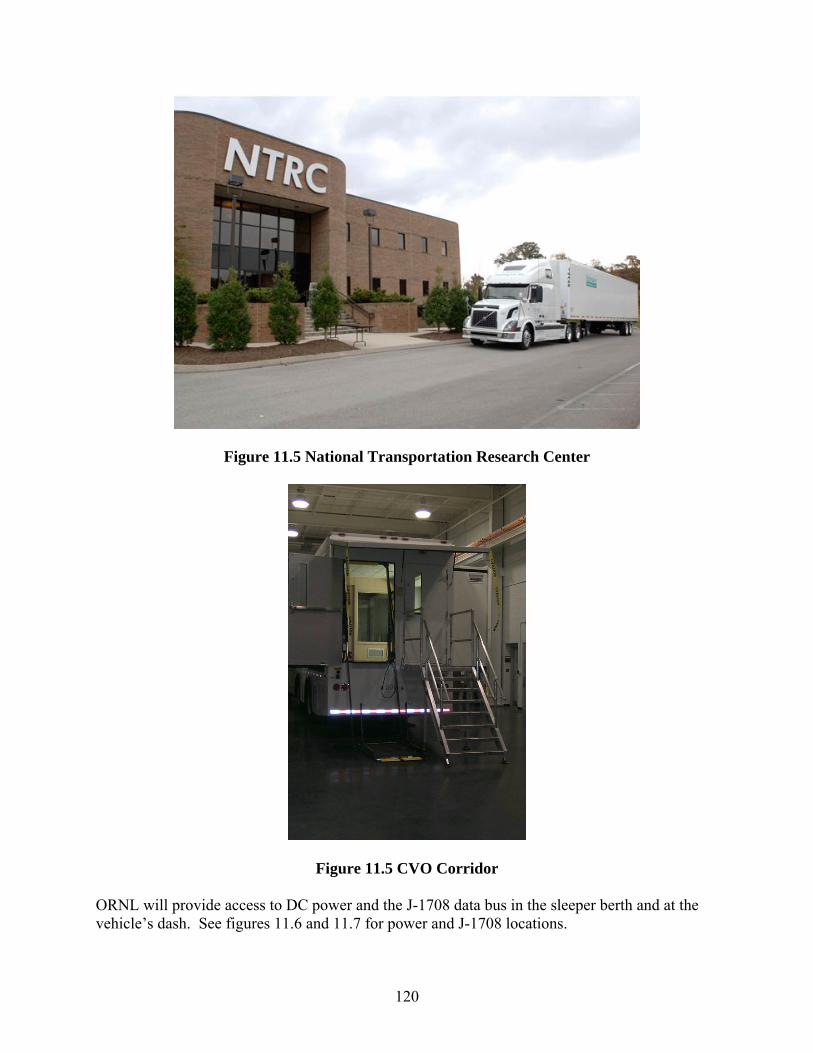
Figure 11.5 National Transportation Research Center
Figure 11.5 CVO Corridor
ORNL will provide access to DC power and the J-1708 data bus in the sleeper berth and at the vehicle’s dash. See figures 11.6 and 11.7 for power and J-1708 locations.
120
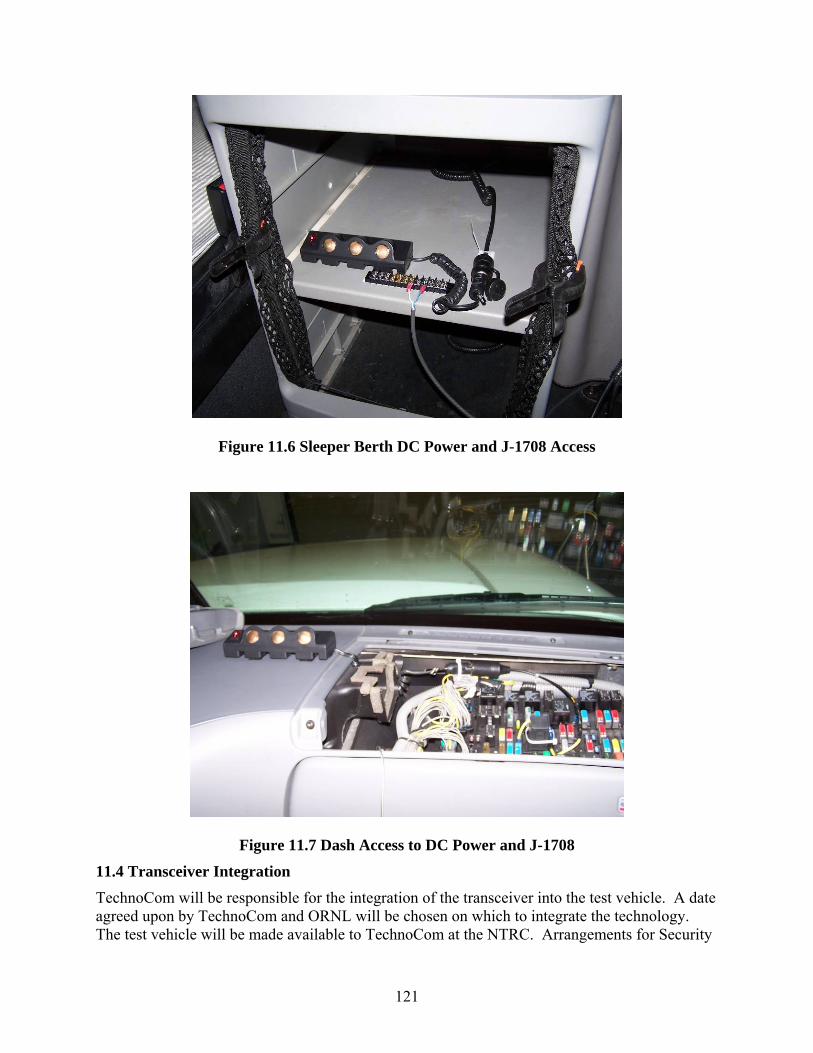
Figure 11.6 Sleeper Berth DC Power and J-1708 Access
Figure 11.7 Dash Access to DC Power and J-1708
11.4 Transceiver Integration
TechnoCom will be responsible for the integration of the transceiver into the test vehicle. A date agreed upon by TechnoCom and ORNL will be chosen on which to integrate the technology. The test vehicle will be made available to TechnoCom at the NTRC. Arrangements for Security
121
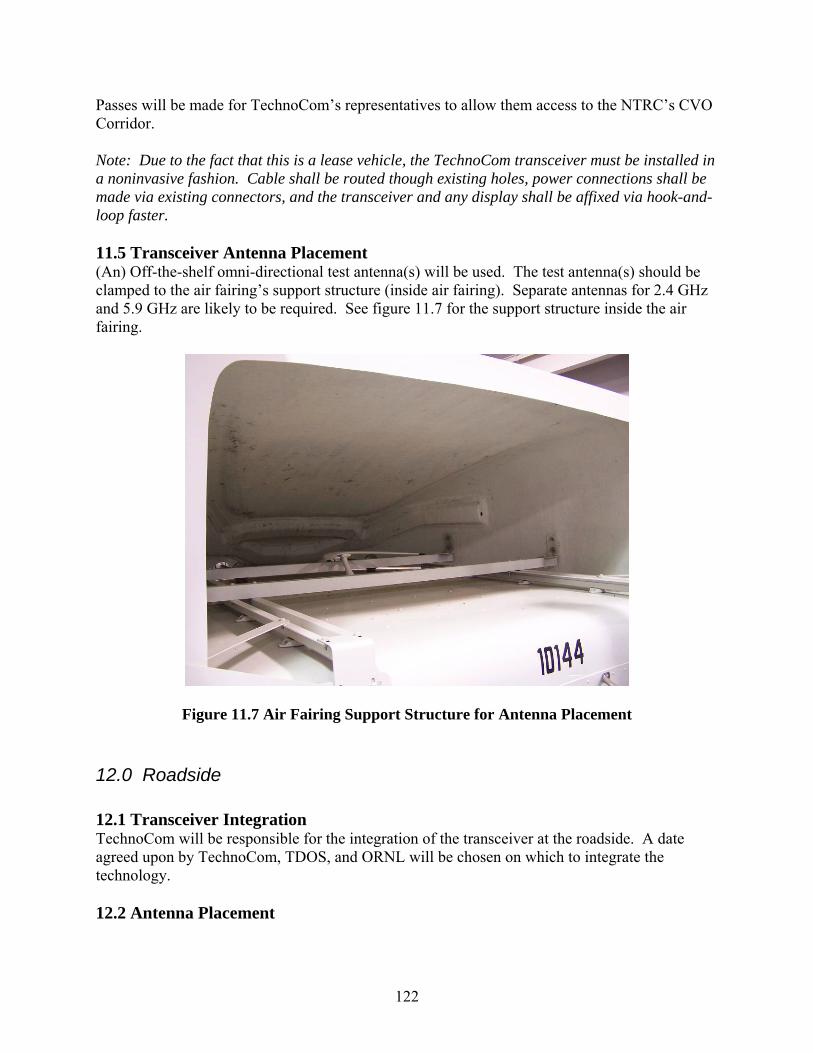
Passes will be made for TechnoCom’s representatives to allow them access to the NTRC’s CVO Corridor. Note: Due to the fact that this is a lease vehicle, the TechnoCom transceiver must be installed in a noninvasive fashion. Cable shall be routed though existing holes, power connections shall be made via existing connectors, and the transceiver and any display shall be affixed via hook-and-loop faster. 11.5 Transceiver Antenna Placement (An) Off-the-shelf omni-directional test antenna(s) will be used. The test antenna(s) should be clamped to the air fairing’s support structure (inside air fairing). Separate antennas for 2.4 GHz and 5.9 GHz are likely to be required. See figure 11.7 for the support structure inside the air fairing.
Figure 11.7 Air Fairing Support Structure for Antenna Placement 12.0 Roadside
12.1 Transceiver Integration TechnoCom will be responsible for the integration of the transceiver at the roadside. A date agreed upon by TechnoCom, TDOS, and ORNL will be chosen on which to integrate the technology. 12.2 Antenna Placement
122
The test antenna will be located on a stand or clamped to an existing structure. It is likely that separate 2.4 GHz and 5.9 GHz antennas will be required. 12.3 Roadside computer ORNL will provide, configure, and install a PC at the roadside for the purpose of interfacing with the transceiver, storing the received SDMS, housing the pseudo-back office database, and generating/displaying the WRI interface screens to the end-users. 13.0 Mobile Enforcement Vehicle
13.1 Transceiver Integration TechnoCom will be responsible for the integration of the transceiver into the MEV. A date agreed upon by TechnoCom, TDOS, and ORNL will be chosen on which to integrate the technology. 13.2 Antenna Placement The test antenna should be clamped above and to the rear of the passenger side window so it extends above the car roof. The height may have to be adjusted after initial testing is conducted. Separate antennas for 2.4 and 5.9 GHz are likely to be required. 13.3 Roadside computer ORNL will provide, configure, and install a PC in the MEV for the purpose of interfacing with the transceiver, storing the received SDMS, housing the pseudo-back office database, and generating/displaying the WRI interface screens to the end-users.
123
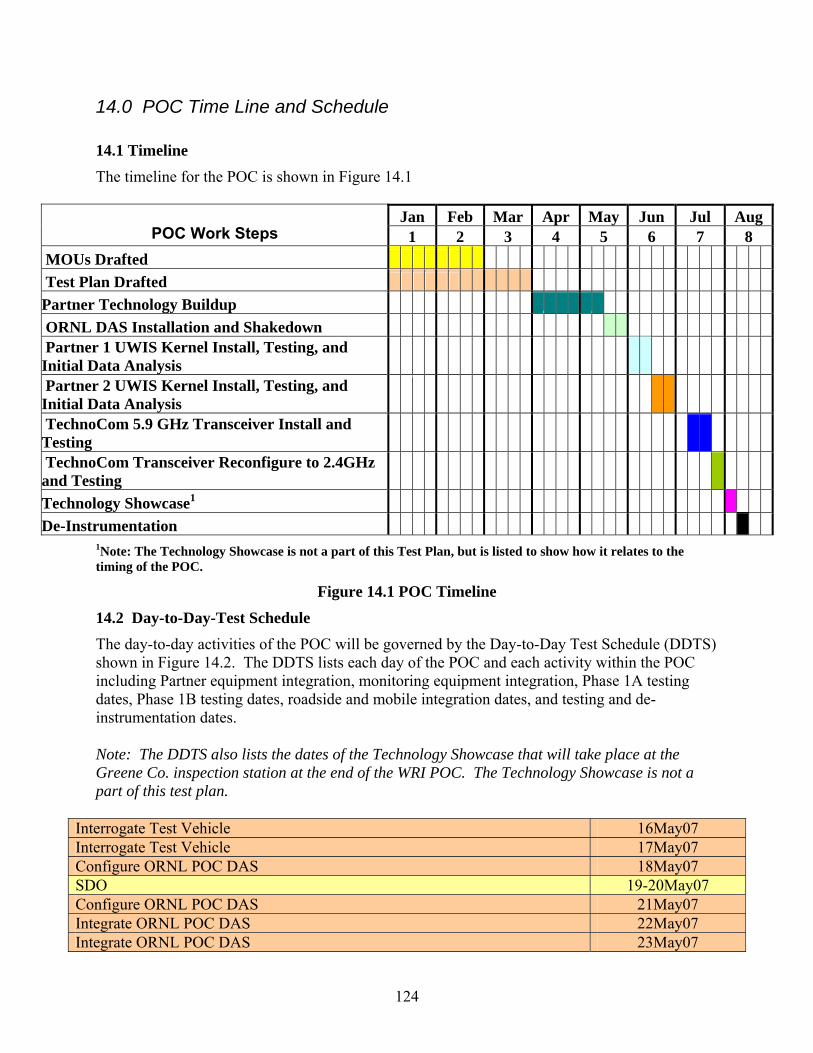
14.0 POC Time Line and Schedule
14.1 Timeline The timeline for the POC is shown in Figure 14.1
Jan Feb Mar Apr May Jun Jul Aug POC Work Steps 1 2 3 4 5 6 7 8
MOUs Drafted Test Plan Drafted Partner Technology Buildup ORNL DAS Installation and Shakedown
Partner 1 UWIS Kernel Install, Testing, and Initial Data Analysis
Partner 2 UWIS Kernel Install, Testing, and Initial Data Analysis
TechnoCom 5.9 GHz Transceiver Install and Testing
TechnoCom Transceiver Reconfigure to 2.4GHz and Testing
Technology Showcase1 De-Instrumentation
1Note: The Technology Showcase is not a part of this Test Plan, but is listed to show how it relates to the timing of the POC.
Figure 14.1 POC Timeline
14.2 Day-to-Day-Test Schedule The day-to-day activities of the POC will be governed by the Day-to-Day Test Schedule (DDTS) shown in Figure 14.2. The DDTS lists each day of the POC and each activity within the POC including Partner equipment integration, monitoring equipment integration, Phase 1A testing dates, Phase 1B testing dates, roadside and mobile integration dates, and testing and de-instrumentation dates. Note: The DDTS also lists the dates of the Technology Showcase that will take place at the Greene Co. inspection station at the end of the WRI POC. The Technology Showcase is not a part of this test plan.
Interrogate Test Vehicle 16May07 Interrogate Test Vehicle 17May07 Configure ORNL POC DAS 18May07 SDO 19-20May07 Configure ORNL POC DAS 21May07 Integrate ORNL POC DAS 22May07 Integrate ORNL POC DAS 23May07
124
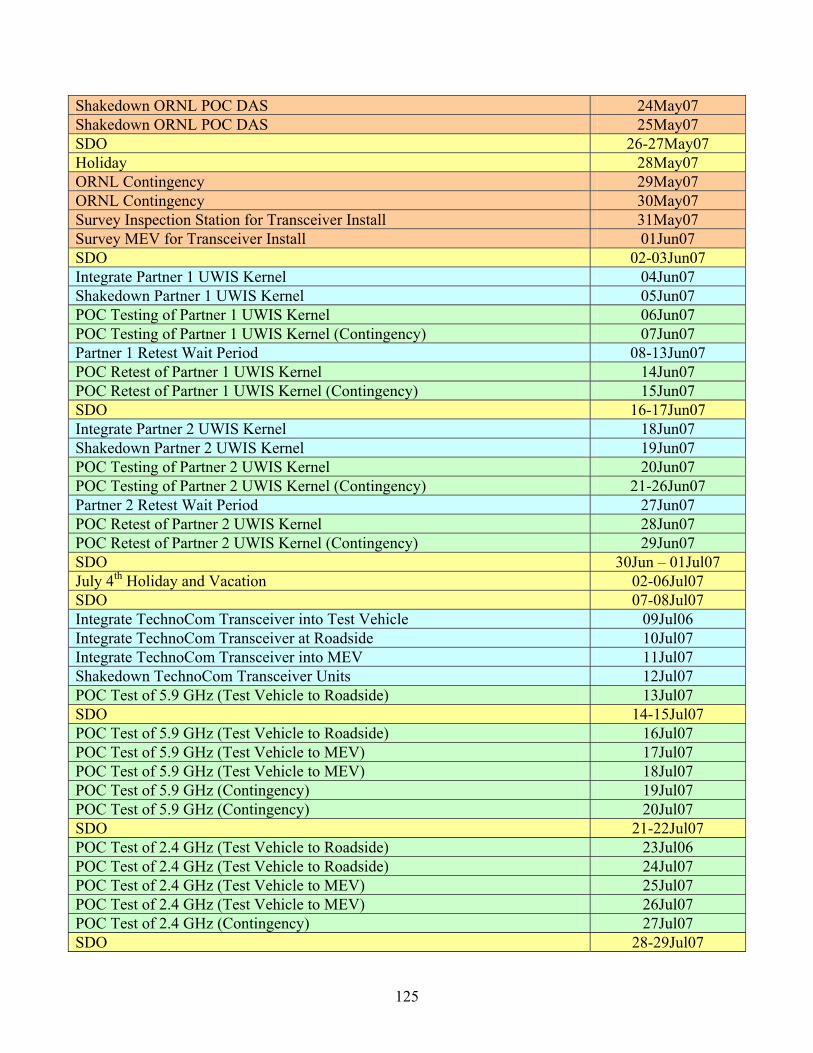
Shakedown ORNL POC DAS 24May07 Shakedown ORNL POC DAS 25May07 SDO 26-27May07 Holiday 28May07 ORNL Contingency 29May07 ORNL Contingency 30May07 Survey Inspection Station for Transceiver Install 31May07 Survey MEV for Transceiver Install 01Jun07 SDO 02-03Jun07 Integrate Partner 1 UWIS Kernel 04Jun07 Shakedown Partner 1 UWIS Kernel 05Jun07 POC Testing of Partner 1 UWIS Kernel 06Jun07 POC Testing of Partner 1 UWIS Kernel (Contingency) 07Jun07 Partner 1 Retest Wait Period 08-13Jun07 POC Retest of Partner 1 UWIS Kernel 14Jun07 POC Retest of Partner 1 UWIS Kernel (Contingency) 15Jun07 SDO 16-17Jun07 Integrate Partner 2 UWIS Kernel 18Jun07 Shakedown Partner 2 UWIS Kernel 19Jun07 POC Testing of Partner 2 UWIS Kernel 20Jun07 POC Testing of Partner 2 UWIS Kernel (Contingency) 21-26Jun07 Partner 2 Retest Wait Period 27Jun07 POC Retest of Partner 2 UWIS Kernel 28Jun07 POC Retest of Partner 2 UWIS Kernel (Contingency) 29Jun07 SDO 30Jun – 01Jul07 July 4th Holiday and Vacation 02-06Jul07 SDO 07-08Jul07 Integrate TechnoCom Transceiver into Test Vehicle 09Jul06 Integrate TechnoCom Transceiver at Roadside 10Jul07 Integrate TechnoCom Transceiver into MEV 11Jul07 Shakedown TechnoCom Transceiver Units 12Jul07 POC Test of 5.9 GHz (Test Vehicle to Roadside) 13Jul07 SDO 14-15Jul07 POC Test of 5.9 GHz (Test Vehicle to Roadside) 16Jul07 POC Test of 5.9 GHz (Test Vehicle to MEV) 17Jul07 POC Test of 5.9 GHz (Test Vehicle to MEV) 18Jul07 POC Test of 5.9 GHz (Contingency) 19Jul07 POC Test of 5.9 GHz (Contingency) 20Jul07 SDO 21-22Jul07 POC Test of 2.4 GHz (Test Vehicle to Roadside) 23Jul06 POC Test of 2.4 GHz (Test Vehicle to Roadside) 24Jul07 POC Test of 2.4 GHz (Test Vehicle to MEV) 25Jul07 POC Test of 2.4 GHz (Test Vehicle to MEV) 26Jul07 POC Test of 2.4 GHz (Contingency) 27Jul07 SDO 28-29Jul07
125
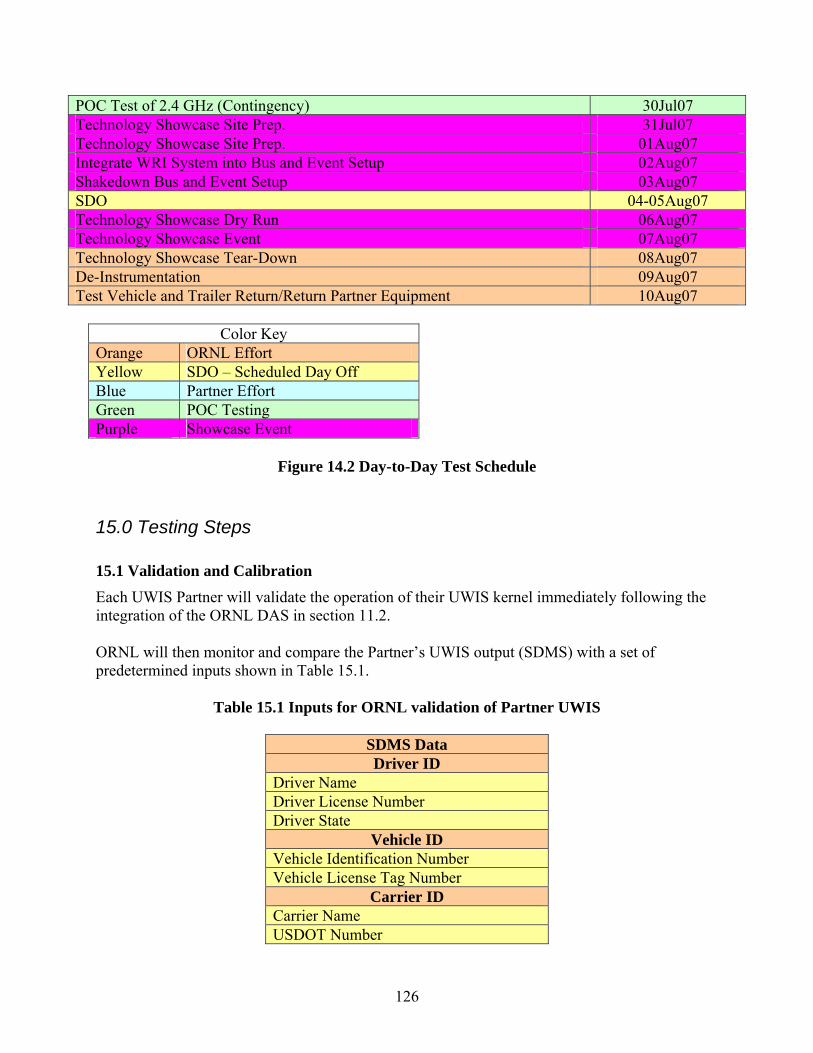
POC Test of 2.4 GHz (Contingency) 30Jul07 Technology Showcase Site Prep. 31Jul07 Technology Showcase Site Prep. 01Aug07 Integrate WRI System into Bus and Event Setup 02Aug07 Shakedown Bus and Event Setup 03Aug07 SDO 04-05Aug07 Technology Showcase Dry Run 06Aug07 Technology Showcase Event 07Aug07 Technology Showcase Tear-Down 08Aug07 De-Instrumentation 09Aug07 Test Vehicle and Trailer Return/Return Partner Equipment 10Aug07
Color Key
Orange ORNL Effort Yellow SDO – Scheduled Day Off Blue Partner Effort Green POC Testing Purple Showcase Event
Figure 14.2 Day-to-Day Test Schedule 15.0 Testing Steps
15.1 Validation and Calibration Each UWIS Partner will validate the operation of their UWIS kernel immediately following the integration of the ORNL DAS in section 11.2. ORNL will then monitor and compare the Partner’s UWIS output (SDMS) with a set of predetermined inputs shown in Table 15.1.
Table 15.1 Inputs for ORNL validation of Partner UWIS
SDMS Data Driver ID
Driver Name Driver License Number Driver State
Vehicle ID Vehicle Identification Number Vehicle License Tag Number
Carrier ID Carrier Name USDOT Number
126
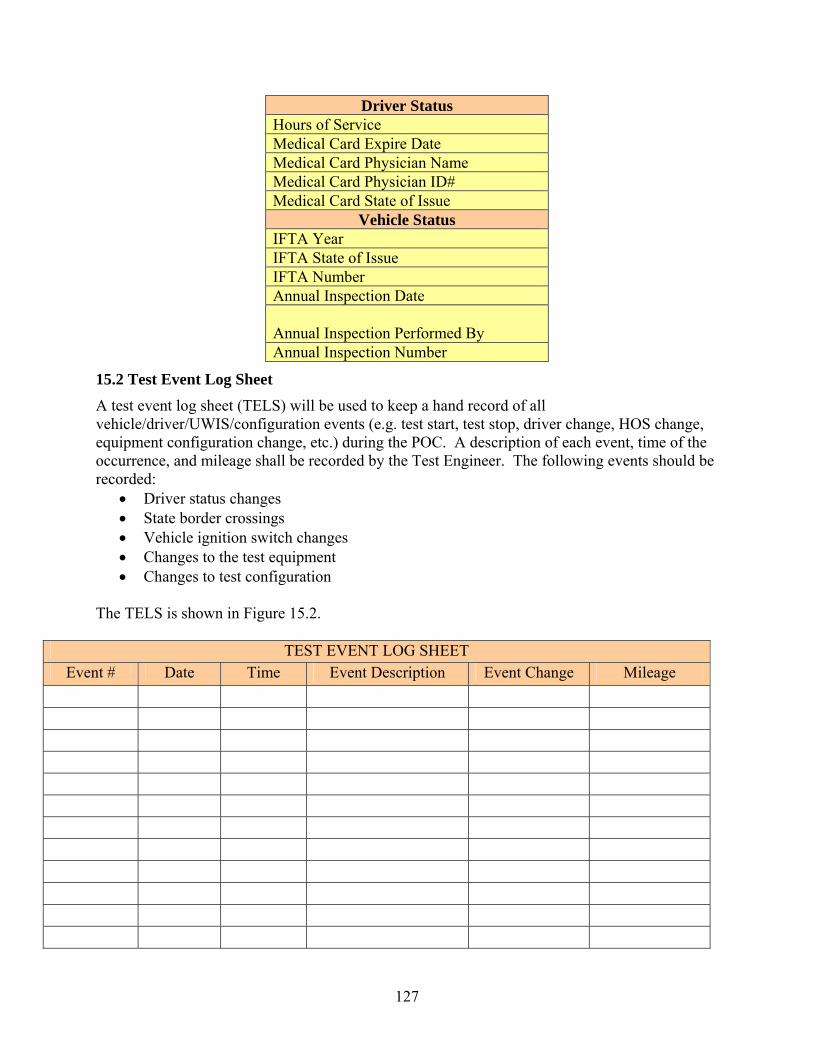
Driver Status Hours of Service Medical Card Expire Date Medical Card Physician Name Medical Card Physician ID# Medical Card State of Issue
Vehicle Status IFTA Year IFTA State of Issue IFTA Number Annual Inspection Date Annual Inspection Performed By Annual Inspection Number
15.2 Test Event Log Sheet A test event log sheet (TELS) will be used to keep a hand record of all vehicle/driver/UWIS/configuration events (e.g. test start, test stop, driver change, HOS change, equipment configuration change, etc.) during the POC. A description of each event, time of the occurrence, and mileage shall be recorded by the Test Engineer. The following events should be recorded:
• Driver status changes • State border crossings • Vehicle ignition switch changes • Changes to the test equipment • Changes to test configuration
The TELS is shown in Figure 15.2.
TEST EVENT LOG SHEET Event # Date Time Event Description Event Change Mileage
127
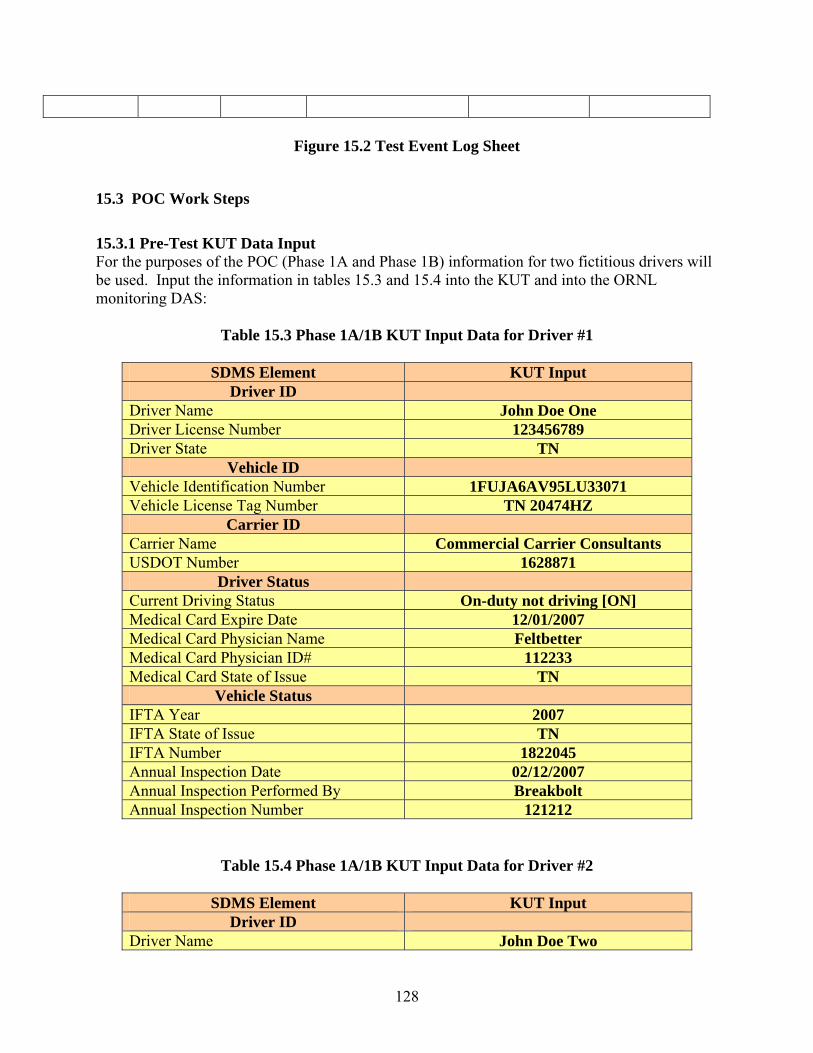
Figure 15.2 Test Event Log Sheet
15.3 POC Work Steps 15.3.1 Pre-Test KUT Data Input For the purposes of the POC (Phase 1A and Phase 1B) information for two fictitious drivers will be used. Input the information in tables 15.3 and 15.4 into the KUT and into the ORNL monitoring DAS:
Table 15.3 Phase 1A/1B KUT Input Data for Driver #1
SDMS Element KUT Input Driver ID
Driver Name John Doe One Driver License Number 123456789 Driver State TN
Vehicle ID Vehicle Identification Number 1FUJA6AV95LU33071 Vehicle License Tag Number TN 20474HZ
Carrier ID Carrier Name Commercial Carrier Consultants USDOT Number 1628871
Driver Status Current Driving Status On-duty not driving [ON] Medical Card Expire Date 12/01/2007 Medical Card Physician Name Feltbetter Medical Card Physician ID# 112233 Medical Card State of Issue TN
Vehicle Status IFTA Year 2007 IFTA State of Issue TN IFTA Number 1822045 Annual Inspection Date 02/12/2007 Annual Inspection Performed By Breakbolt Annual Inspection Number 121212
Table 15.4 Phase 1A/1B KUT Input Data for Driver #2
SDMS Element KUT Input Driver ID
Driver Name John Doe Two
128
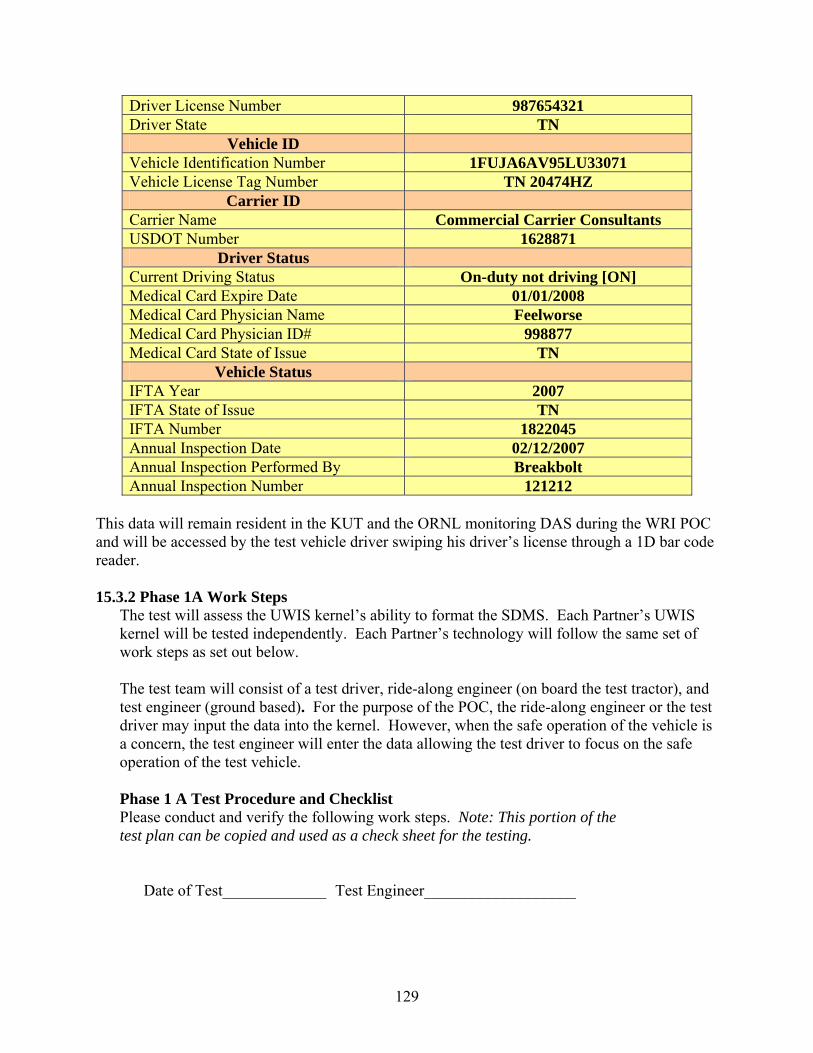
Driver License Number 987654321 Driver State TN
Vehicle ID Vehicle Identification Number 1FUJA6AV95LU33071 Vehicle License Tag Number TN 20474HZ
Carrier ID Carrier Name Commercial Carrier Consultants USDOT Number 1628871
Driver Status Current Driving Status On-duty not driving [ON] Medical Card Expire Date 01/01/2008 Medical Card Physician Name Feelworse Medical Card Physician ID# 998877 Medical Card State of Issue TN
Vehicle Status IFTA Year 2007 IFTA State of Issue TN IFTA Number 1822045 Annual Inspection Date 02/12/2007 Annual Inspection Performed By Breakbolt Annual Inspection Number 121212
This data will remain resident in the KUT and the ORNL monitoring DAS during the WRI POC and will be accessed by the test vehicle driver swiping his driver’s license through a 1D bar code reader. 15.3.2 Phase 1A Work Steps
The test will assess the UWIS kernel’s ability to format the SDMS. Each Partner’s UWIS kernel will be tested independently. Each Partner’s technology will follow the same set of work steps as set out below. The test team will consist of a test driver, ride-along engineer (on board the test tractor), and test engineer (ground based). For the purpose of the POC, the ride-along engineer or the test driver may input the data into the kernel. However, when the safe operation of the vehicle is a concern, the test engineer will enter the data allowing the test driver to focus on the safe operation of the test vehicle.
Phase 1 A Test Procedure and Checklist Please conduct and verify the following work steps. Note: This portion of the test plan can be copied and used as a check sheet for the testing.
Date of Test_____________ Test Engineer___________________
129
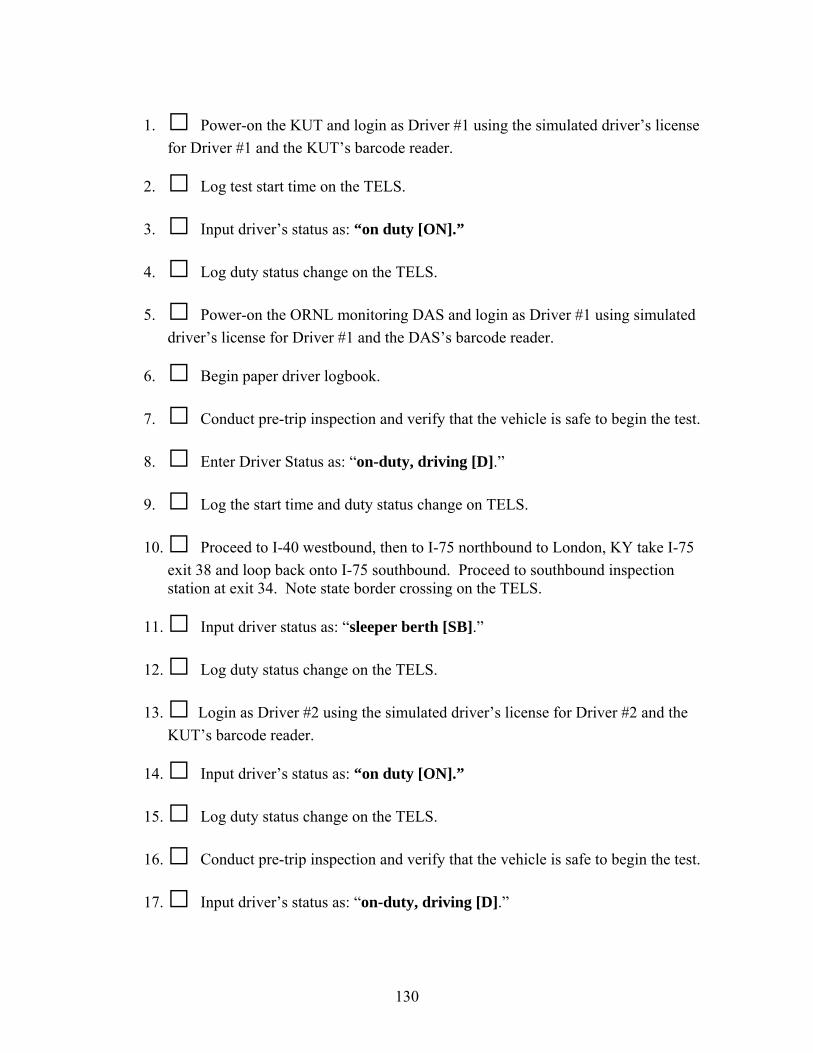
1. □ Power-on the KUT and login as Driver #1 using the simulated driver’s license for Driver #1 and the KUT’s barcode reader.
2. □ Log test start time on the TELS.
3. □ Input driver’s status as: “on duty [ON].”
4. □ Log duty status change on the TELS.
5. □ Power-on the ORNL monitoring DAS and login as Driver #1 using simulated driver’s license for Driver #1 and the DAS’s barcode reader.
6. □ Begin paper driver logbook.
7. □ Conduct pre-trip inspection and verify that the vehicle is safe to begin the test.
8. □ Enter Driver Status as: “on-duty, driving [D].”
9. □ Log the start time and duty status change on TELS.
10. □ Proceed to I-40 westbound, then to I-75 northbound to London, KY take I-75 exit 38 and loop back onto I-75 southbound. Proceed to southbound inspection station at exit 34. Note state border crossing on the TELS.
11. □ Input driver status as: “sleeper berth [SB].”
12. □ Log duty status change on the TELS.
13. □ Login as Driver #2 using the simulated driver’s license for Driver #2 and the KUT’s barcode reader.
14. □ Input driver’s status as: “on duty [ON].”
15. □ Log duty status change on the TELS.
16. □ Conduct pre-trip inspection and verify that the vehicle is safe to begin the test.
17. □ Input driver’s status as: “on-duty, driving [D].”
130
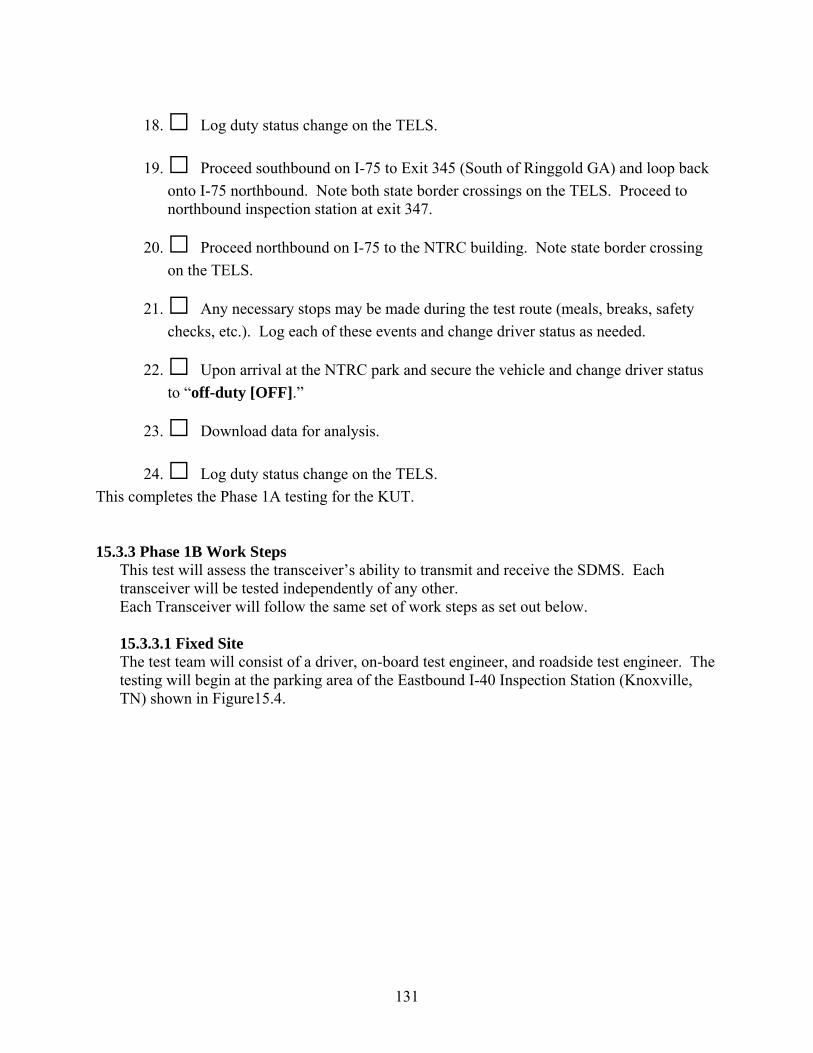
18. □ Log duty status change on the TELS.
19. □ Proceed southbound on I-75 to Exit 345 (South of Ringgold GA) and loop back onto I-75 northbound. Note both state border crossings on the TELS. Proceed to northbound inspection station at exit 347.
20. □ Proceed northbound on I-75 to the NTRC building. Note state border crossing on the TELS.
21. □ Any necessary stops may be made during the test route (meals, breaks, safety checks, etc.). Log each of these events and change driver status as needed.
22. □ Upon arrival at the NTRC park and secure the vehicle and change driver status to “off-duty [OFF].”
23. □ Download data for analysis.
24. □ Log duty status change on the TELS. This completes the Phase 1A testing for the KUT. 15.3.3 Phase 1B Work Steps
This test will assess the transceiver’s ability to transmit and receive the SDMS. Each transceiver will be tested independently of any other. Each Transceiver will follow the same set of work steps as set out below. 15.3.3.1 Fixed Site The test team will consist of a driver, on-board test engineer, and roadside test engineer. The testing will begin at the parking area of the Eastbound I-40 Inspection Station (Knoxville, TN) shown in Figure15.4.
131
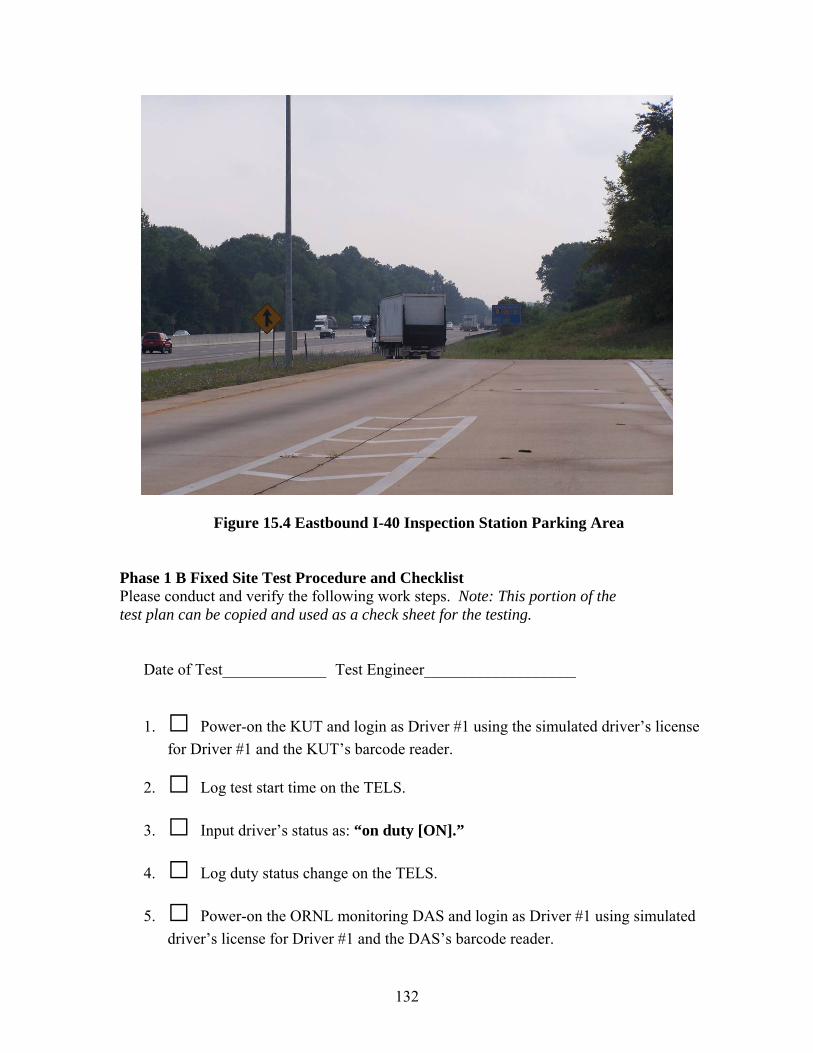
Figure 15.4 Eastbound I-40 Inspection Station Parking Area
Phase 1 B Fixed Site Test Procedure and Checklist Please conduct and verify the following work steps. Note: This portion of the test plan can be copied and used as a check sheet for the testing.
Date of Test_____________ Test Engineer___________________
1. □ Power-on the KUT and login as Driver #1 using the simulated driver’s license for Driver #1 and the KUT’s barcode reader.
2. □ Log test start time on the TELS.
3. □ Input driver’s status as: “on duty [ON].”
4. □ Log duty status change on the TELS.
5. □ Power-on the ORNL monitoring DAS and login as Driver #1 using simulated driver’s license for Driver #1 and the DAS’s barcode reader.
132
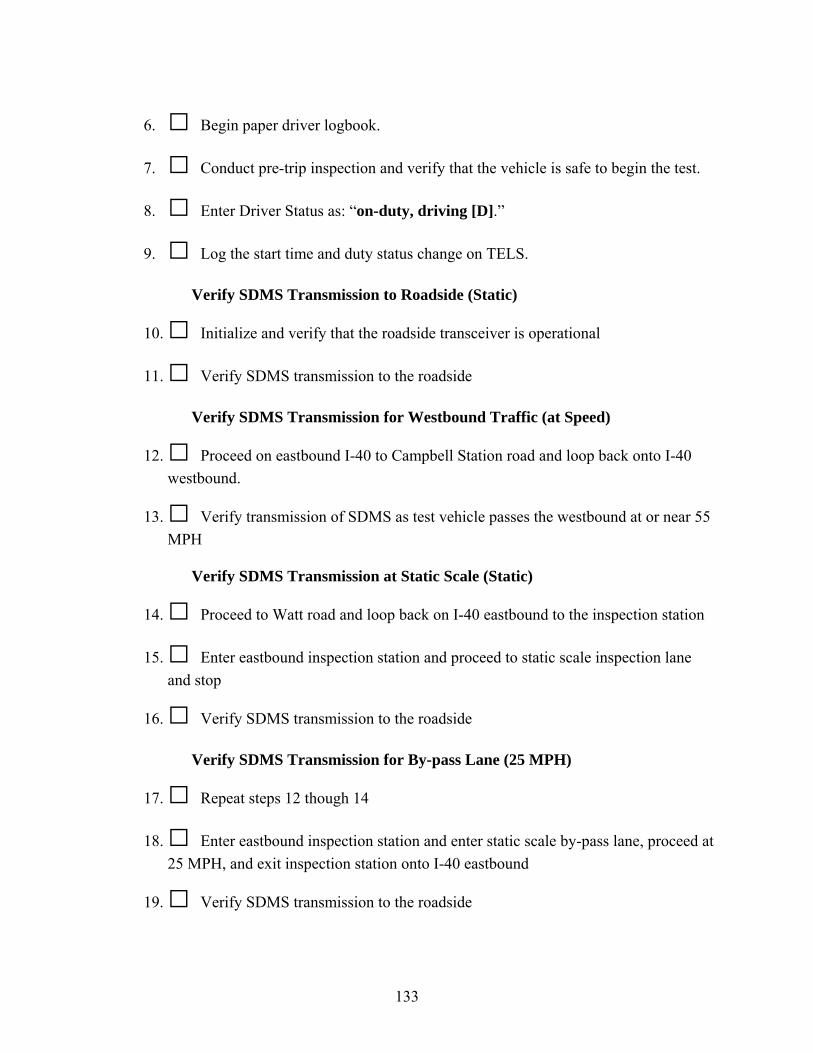
6. □ Begin paper driver logbook.
7. □ Conduct pre-trip inspection and verify that the vehicle is safe to begin the test.
8. □ Enter Driver Status as: “on-duty, driving [D].”
9. □ Log the start time and duty status change on TELS.
Verify SDMS Transmission to Roadside (Static)
10. □ Initialize and verify that the roadside transceiver is operational
11. □ Verify SDMS transmission to the roadside
Verify SDMS Transmission for Westbound Traffic (at Speed)
12. □ Proceed on eastbound I-40 to Campbell Station road and loop back onto I-40 westbound.
13. □ Verify transmission of SDMS as test vehicle passes the westbound at or near 55 MPH
Verify SDMS Transmission at Static Scale (Static)
14. □ Proceed to Watt road and loop back on I-40 eastbound to the inspection station
15. □ Enter eastbound inspection station and proceed to static scale inspection lane and stop
16. □ Verify SDMS transmission to the roadside
Verify SDMS Transmission for By-pass Lane (25 MPH)
17. □ Repeat steps 12 though 14
18. □ Enter eastbound inspection station and enter static scale by-pass lane, proceed at 25 MPH, and exit inspection station onto I-40 eastbound
19. □ Verify SDMS transmission to the roadside
133
20. □ Note any obstacles between the vehicle and the Roadside Equipment (RSE)
Verify SDMS Transmission for Eastbound Traffic (at Speed)
21. □ Repeat steps 12 though 14
22. □ By-pass the weight station at 55 MPH
23. □ Verify SDMS transmission to the roadside
24. □ Repeat steps 12 through 23 nine additional times.
25. □ Return to NTRC and park and secure test vehicle.
26. □ Download data for analysis. This completes the Phase 1B Fixed Sight Testing.
15.3.3.2 MEV Transmission Distance Verification This test will partially assess the distance and position capabilities of the transceiver when mounted on the MEV. The test team will consist of a driver and on-board test engineer (test vehicle), and an on-board test engineer (MEV). The testing will take place in the parking area of the southbound I-81 Inspection Station (Greene Co., TN). Phase 1 B MEV Transmission Distance Verification Test Procedure and Checklist Please conduct and verify the following work steps. Note: This portion of the test plan can be copied and used as a check sheet for the testing.
Date of Test_____________ Test Engineer___________________
1. □ Power-on the KUT and login as Driver #1 using the simulated driver’s license for Driver #1 and the KUT’s barcode reader.
2. □ Log test start time on the TELS.
3. □ Input driver’s status as: “on duty [ON].”
4. □ Log duty status change on the TELS.
134
5. □ Power-on the ORNL monitoring DAS and login as Driver #1 using simulated driver’s license for Driver #1 and the DAS’s barcode reader.
6. □ Begin paper driver logbook.
7. □ Conduct pre-trip inspection and verify that the vehicle is safe to begin the test.
8. □ Enter Driver Status as: “on-duty, driving [D].”
9. □ Log the start time and duty status change on TELS.
Verify SDMS Transmission to MEV (Static)
10. □ Position the MEV 100 ft from the center of the test vehicle cab at 12:00, 1:30, 3:00, 4:30, 6:00, 7:30, 9:00, and 10:30. Verify SDMS transfer at each of these positions.
11. □ Repeat the positions called out in line 10 above for 200 ft, 300 ft and 400 ft. Verify SDMS transfer at each of these positions and distances.
12. □ Return to NTRC and park and secure test vehicle.
13. □ Download data for analysis. This completes the Phase 1B MEV Transmission Distance Verification Testing.
15.3.3.3 MEV at the Weigh Station/Simulated Virtual WRI Inspection Point This test will assess the functionality of a transceiver mount in a MEV that is stationary at the weigh station. Also, this test will be used to simulate a virtual WRI inspection using the MEV as a fixed point. The test team will consist of a driver, on-board test engineer (test vehicle), and on-board test engineer (MEV). The testing will begin at the parking area of the eastbound I-40 Inspection Station (Knoxville, TN).
Phase 1 B MEV at the Weigh Station/Simulated Virtual WRI Inspection Point Test Procedure and Checklist Please conduct and verify the following work steps. Note: This portion of the test plan can be copied and used as a check sheet for the testing.
Date of Test_____________ Test Engineer___________________
135
1. □ Power-on the KUT and login as Driver #1 using the simulated driver’s license for Driver #1 and the KUT’s barcode reader.
2. □ Log test start time on the TELS.
3. □ Input driver’s status as: “on duty [ON].”
4. □ Log duty status change on the TELS.
5. □ Power-on the ORNL monitoring DAS and login as Driver #1 using simulated driver’s license for Driver #1 and the DAS’s barcode reader.
6. □ Begin paper driver logbook.
7. □ Conduct pre-trip inspection and verify that the vehicle is safe to begin the test.
8. □ Enter Driver Status as: “on-duty, driving [D].”
9. □ Log the start time and duty status change on TELS.
Verify SDMS Transmission to MEV (Static)
10. □ Position the MEV adjacent to the test vehicle and at the east side of the scale house near the static scale lane as shown in Figure 15.8
136
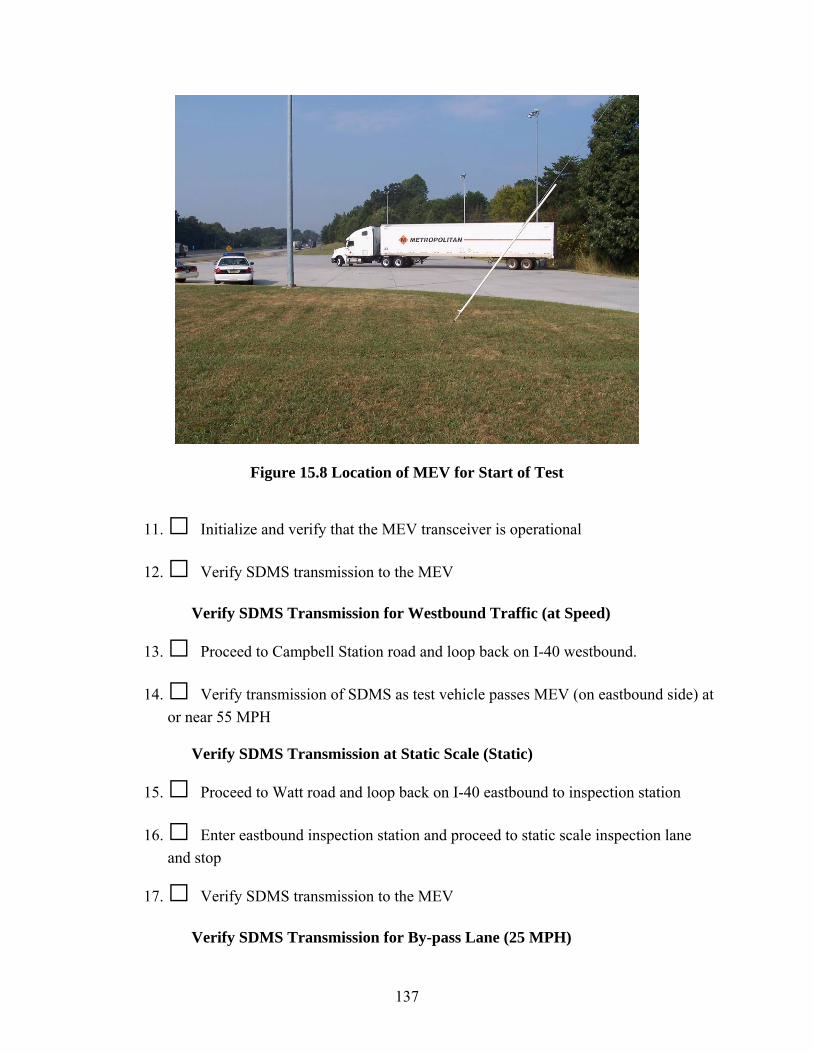
Figure 15.8 Location of MEV for Start of Test
11. □ Initialize and verify that the MEV transceiver is operational
12. □ Verify SDMS transmission to the MEV
Verify SDMS Transmission for Westbound Traffic (at Speed)
13. □ Proceed to Campbell Station road and loop back on I-40 westbound.
14. □ Verify transmission of SDMS as test vehicle passes MEV (on eastbound side) at or near 55 MPH
Verify SDMS Transmission at Static Scale (Static)
15. □ Proceed to Watt road and loop back on I-40 eastbound to inspection station
16. □ Enter eastbound inspection station and proceed to static scale inspection lane and stop
17. □ Verify SDMS transmission to the MEV
Verify SDMS Transmission for By-pass Lane (25 MPH)
137
18. □ Repeat steps 13 and 15
21. □ Enter eastbound inspection station and enter static scale by-pass lane at or near 25 MPH and exit inspection station onto I-40 eastbound
22. □ Verify SDMS transmission to the MEV
Verify SDMS Transmission for Eastbound Traffic (at Speed)
23. □ Repeat steps 13 and 15
24. □ By-pass the weight station at 55 MPH
25. □ Verify SDMS transmission to the MEV
26. □ Repeat steps 13 through 25 one additional time.
27. □ Return to NTRC and park and secure test vehicle.
28. □ Download data for analysis. This completes the Phase 1B testing of the MEV at the Weigh Station/Simulated Virtual WRI Inspection Point
15.3.3.4 MEV and Test Vehicle on the Roadway This test will assess the functionality of the transceiver with the MEV and test vehicle at speed on the roadway. The test team will consist of a driver, on-board test engineer (test vehicle), and on-board test engineer (MEV). The testing will begin at the parking area of the eastbound I-40 Inspection Station (Knoxville, TN).
Phase 1B MEV and Test Vehicle on the Roadway Test Procedure and Checklist Please conduct and verify the following work steps. Note: This portion of the test plan can be copied and used as a check sheet for the testing.
Date of Test_____________ Test Engineer___________________
1. □ Power-on the KUT and login as Driver #1 using the simulated driver’s license for Driver #1 and the KUT’s barcode reader.
138
2. □ Log test start time on the TELS.
3. □ Input driver’s status as: “on duty [ON].”
4. □ Log duty status change on the TELS.
5. □ Power-on the ORNL monitoring DAS and login as Driver #1 using simulated driver’s license for Driver #1 and the DAS’s barcode reader.
6. □ Begin paper driver logbook.
7. □ Conduct pre-trip inspection and verify that the vehicle is safe to begin the test.
8. □ Enter Driver Status as: “on-duty, driving [D].”
9. □ Log the start time and duty status change on TELS.
Verify SDMS Transmission to MEV (Static)
10. □ Initialize and verify that the MEV transceiver is operational
11. □ Position the MEV just behind the test vehicle and verify SDMS transmission.
Verify SDMS Transmission for Synchronized Speed
12. □ Proceed eastbound on I-40 and attain a speed of 55 MPH. Query the test vehicle with the MEV at the 12:00, 1:30, 3:00, 4:30, 6:00, 7:30, 9:00, and 10:30 positions while maintaining safe vehicle distances.
13. □ Repeat this test five (5) times.
14. □ Return to NTRC and park and secure test vehicle.
15. □ Download data for analysis. This completes the Phase 1B testing of the MEV and Test Vehicle on the Roadway.
15.4 Data Collection Tests will be performed to measure the reliability and accuracy of the UWIS for each of the two POC phases (1A and 1B). The UWIS data input will be collected (Table 15.1) using the ORNL e-DAQ DAS (Figure 10.9) and will be considered ‘ground-truth” information. It will be
139
collected at a rate of 0.2 Hz. This is the same input information that will be assembled into the SDMS data message by the UWIS kernel. Once the UWIS assembles the SDMS (and before it is sent to the transceiver) it will be sampled by ORNL using a laptop PC. This again, will be done in both phases (1A and 1B) of the POC. The SDMS message will then be parsed and the relevant variables (i.e., those corresponding to the inputs listed in Table 15.1) will be compared to the ground truth information to measure the accuracy of the UWIS kernel in composing the SDMS message. Data collected by the eDaq-Lite will be stored on its internal 2 GB card and will be retrieved at the end of the test of each Partner’s technology and downloaded to the project laptop. Accuracy tests will be performed on each one of the variables and will be defined as the number of times the corresponding SDMS value matches the ground-truth value, divided by the total number of observations. The same procedure will be used to analyze the accuracy of the transceiver (Phase 1B). For the latter, the accuracy will be measured under the different conditions in which the POC will be performed (e.g., data transmitted from test vehicle moving at highway speed to roadside unit, from test vehicle moving at highway speed to MEV, etc.) The reliability study will focus on whether the information is relayed to the corresponding downstream system (i.e., transceiver from the UWIS kernel and Roadside unit from the test vehicle) at the right times. Consider, for example, the test vehicle to the roadside case; the reliability study will measure the percentage of times the SDMS message (independent of its accuracy) is transmitted to the roadside divided by the times the vehicle is within the roadside transceiver’s range. Data transmitted to the roadside will be stored in the roadside computer and will be transferred to the project laptop at the conclusion of each test.
15.5 Data Storage Data from the project laptop will be transferred to the ORNL Heavy Vehicle Safety Research (HVSRC) internal server drive F: named “ORNL WRI POC.” A duplicate copy of the data will be stored on the ORNL campus apart from the NTRC on an external hard drive. 16.0 Test Feedback
16.1 Driver Feedback Sheet The test vehicle driver(s) will be asked to complete a driver feedback survey form to assess their impression of the technology (ease of use, effectiveness, distraction, value, etc.). The survey is shown in Figure 16.1.
140
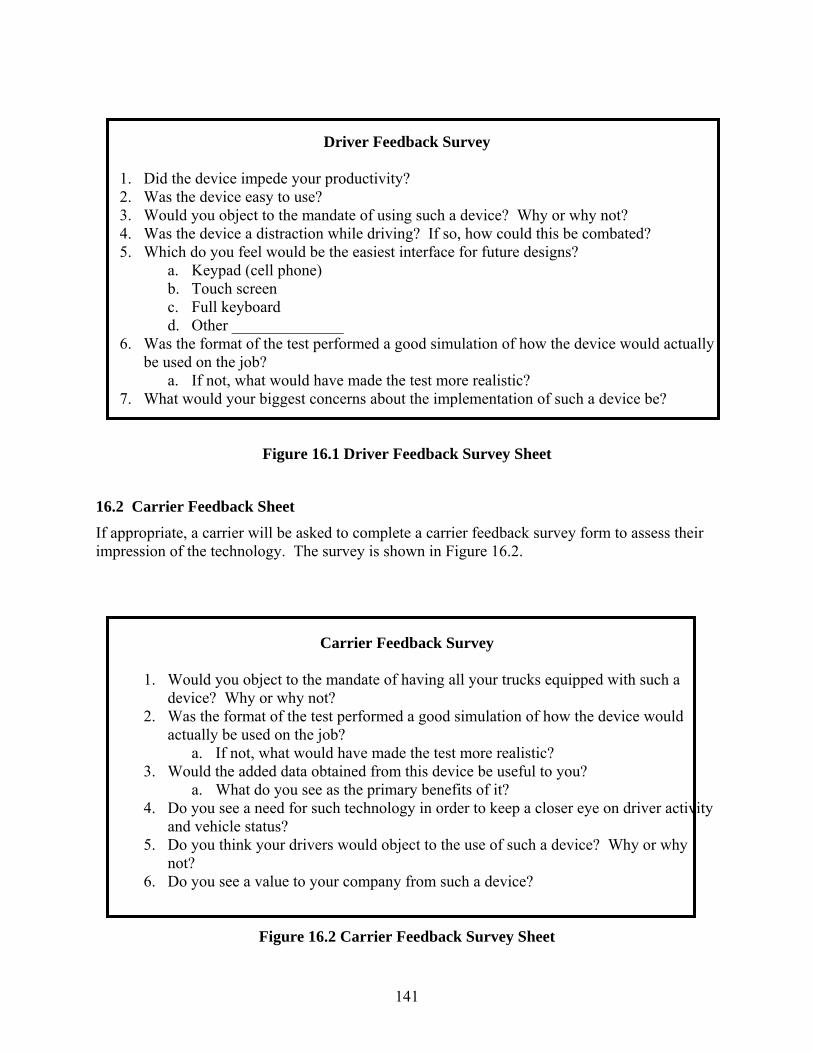
Driver Feedback Survey
1. Did the device impede your productivity? 2. Was the device easy to use? 3. Would you object to the mandate of using such a device? Why or why not? 4. Was the device a distraction while driving? If so, how could this be combated? 5. Which do you feel would be the easiest interface for future designs?
a. Keypad (cell phone) b. Touch screen c. Full keyboard d. Other ______________
6. Was the format of the test performed a good simulation of how the device would actually be used on the job?
a. If not, what would have made the test more realistic? 7. What would your biggest concerns about the implementation of such a device be?
Figure 16.1 Driver Feedback Survey Sheet
16.2 Carrier Feedback Sheet If appropriate, a carrier will be asked to complete a carrier feedback survey form to assess their impression of the technology. The survey is shown in Figure 16.2.
Carrier Feedback Survey
1. Would you object to the mandate of having all your trucks equipped with such a device? Why or why not?
2. Was the format of the test performed a good simulation of how the device would actually be used on the job?
a. If not, what would have made the test more realistic? 3. Would the added data obtained from this device be useful to you?
a. What do you see as the primary benefits of it? 4. Do you see a need for such technology in order to keep a closer eye on driver activity
and vehicle status? 5. Do you think your drivers would object to the use of such a device? Why or why
not? 6. Do you see a value to your company from such a device?
Figure 16.2 Carrier Feedback Survey Sheet
141
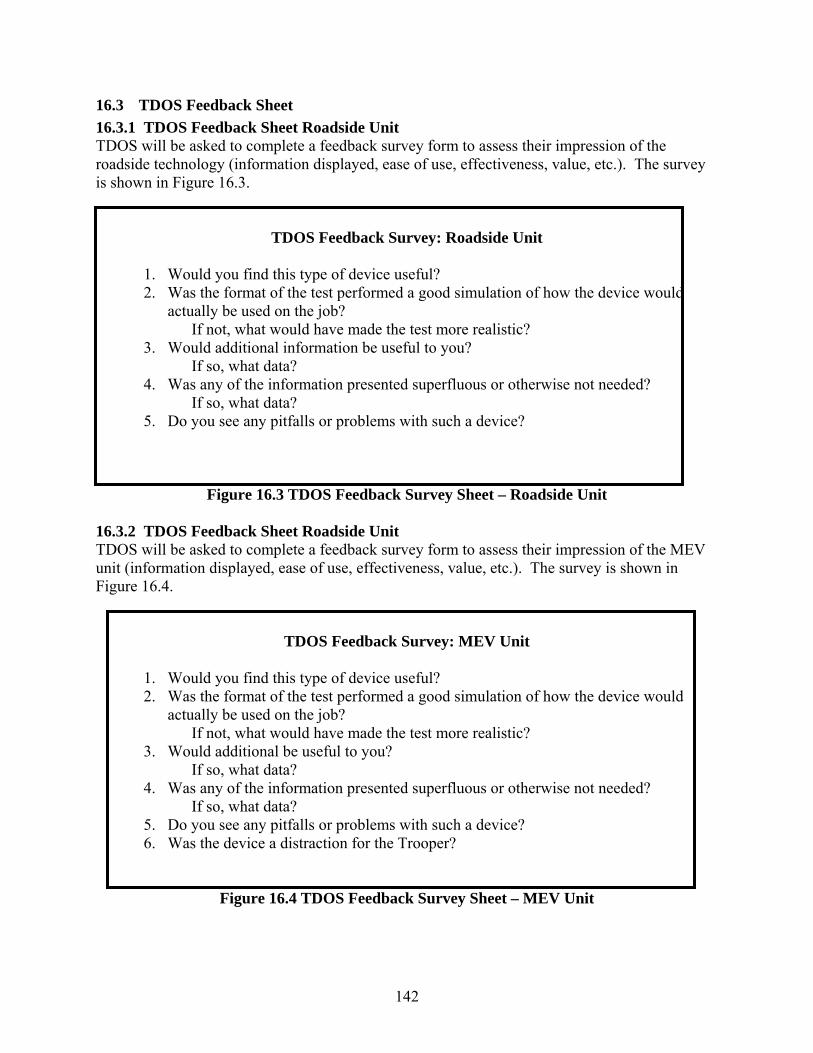
16.3 TDOS Feedback Sheet 16.3.1 TDOS Feedback Sheet Roadside Unit TDOS will be asked to complete a feedback survey form to assess their impression of the roadside technology (information displayed, ease of use, effectiveness, value, etc.). The survey is shown in Figure 16.3.
TDOS Feedback Survey: Roadside Unit
1. Would you find this type of device useful? 2. Was the format of the test performed a good simulation of how the device would
actually be used on the job? If not, what would have made the test more realistic?
3. Would additional information be useful to you? If so, what data?
4. Was any of the information presented superfluous or otherwise not needed? If so, what data?
5. Do you see any pitfalls or problems with such a device?
Figure 16.3 TDOS Feedback Survey Sheet – Roadside Unit 16.3.2 TDOS Feedback Sheet Roadside Unit TDOS will be asked to complete a feedback survey form to assess their impression of the MEV unit (information displayed, ease of use, effectiveness, value, etc.). The survey is shown in Figure 16.4.
TDOS Feedback Survey: MEV Unit
1. Would you find this type of device useful? 2. Was the format of the test performed a good simulation of how the device would
actually be used on the job? If not, what would have made the test more realistic?
3. Would additional be useful to you? If so, what data?
4. Was any of the information presented superfluous or otherwise not needed? If so, what data?
5. Do you see any pitfalls or problems with such a device? 6. Was the device a distraction for the Trooper?
Figure 16.4 TDOS Feedback Survey Sheet – MEV Unit
142
17.0 Test Vehicle De-Instrumentation
At the conclusion of all WRI POC testing, ORNL will de-instrument the test vehicle and return the UWIS kernels to the Partners under the terms of the MOU. The transceivers will be removed and held at ORNL for possible use in the Pilot Test.
Appendix A – UWIS Kernel System Requirements
Table of Contents
Appendix A – UWIS Kernel System Requirements ......................................................................143
Table of Contents .......................................................................................................................143
A1.0 Introduction.......................................................................................................................144 A1.1 Background ................................................................................................................144
A2.0 Kernel Requirements........................................................................................................144 A2.1 Inputs..........................................................................................................................144
A2.2 Outputs .......................................................................................................................144
A2.3 Data Acquisition and Storage ....................................................................................145
A2.4 Specifications .............................................................................................................145
A3.0 Wireless Transceiver Requirements................................................................................145 A3.1 Transceiver Inputs......................................................................................................145
A3.2 Transceiver Outputs ...................................................................................................145
A3.3 Data Acquisition and Transfer ...................................................................................146
A3.4 Specifications .............................................................................................................146
A4.0 Test Requirements ............................................................................................................146
A5.0 FMCSA SDMS Requirements as per § 395.16 ...............................................................147 A5.1 SDMS Requirements..................................................................................................147
A5.2 Functionality requirements ........................................................................................148
A5.3 Flat File Database Model ...........................................................................................150
143
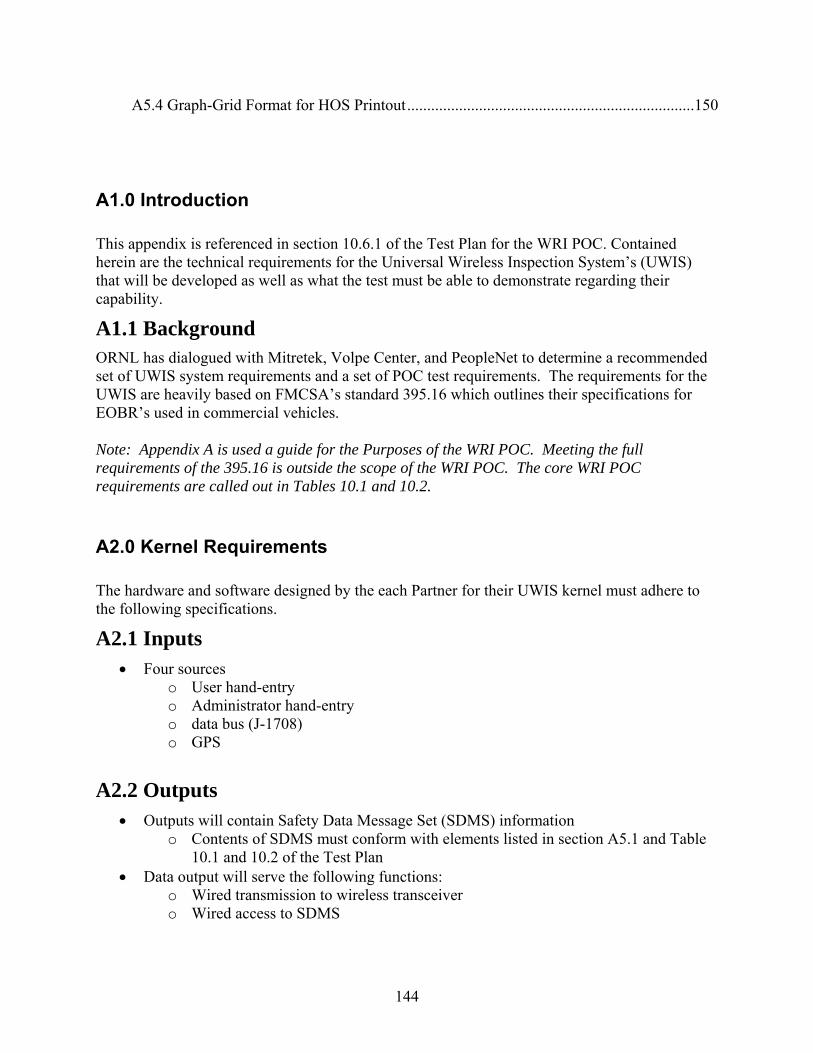
A5.4 Graph-Grid Format for HOS Printout........................................................................150
A1.0 Introduction
This appendix is referenced in section 10.6.1 of the Test Plan for the WRI POC. Contained herein are the technical requirements for the Universal Wireless Inspection System’s (UWIS) that will be developed as well as what the test must be able to demonstrate regarding their capability.
A1.1 Background ORNL has dialogued with Mitretek, Volpe Center, and PeopleNet to determine a recommended set of UWIS system requirements and a set of POC test requirements. The requirements for the UWIS are heavily based on FMCSA’s standard 395.16 which outlines their specifications for EOBR’s used in commercial vehicles. Note: Appendix A is used a guide for the Purposes of the WRI POC. Meeting the full requirements of the 395.16 is outside the scope of the WRI POC. The core WRI POC requirements are called out in Tables 10.1 and 10.2. A2.0 Kernel Requirements
The hardware and software designed by the each Partner for their UWIS kernel must adhere to the following specifications.
A2.1 Inputs • Four sources
o User hand-entry o Administrator hand-entry o data bus (J-1708) o GPS
A2.2 Outputs • Outputs will contain Safety Data Message Set (SDMS) information
o Contents of SDMS must conform with elements listed in section A5.1 and Table 10.1 and 10.2 of the Test Plan
• Data output will serve the following functions: o Wired transmission to wireless transceiver o Wired access to SDMS
144
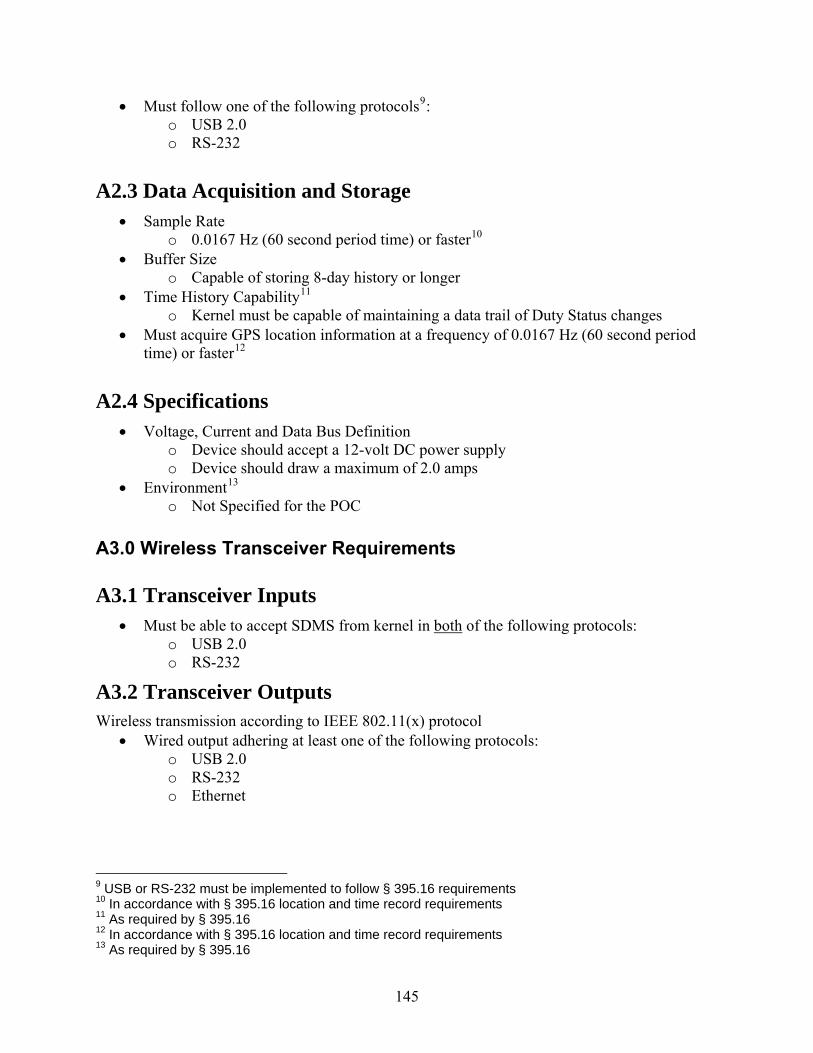
• Must follow one of the following protocols9: o USB 2.0 o RS-232
A2.3 Data Acquisition and Storage • Sample Rate
o 0.0167 Hz (60 second period time) or faster10 • Buffer Size
o Capable of storing 8-day history or longer • Time History Capability11
o Kernel must be capable of maintaining a data trail of Duty Status changes • Must acquire GPS location information at a frequency of 0.0167 Hz (60 second period
time) or faster12
A2.4 Specifications • Voltage, Current and Data Bus Definition
o Device should accept a 12-volt DC power supply o Device should draw a maximum of 2.0 amps
• Environment13 o Not Specified for the POC
A3.0 Wireless Transceiver Requirements
A3.1 Transceiver Inputs • Must be able to accept SDMS from kernel in both of the following protocols:
o USB 2.0 o RS-232
A3.2 Transceiver Outputs Wireless transmission according to IEEE 802.11(x) protocol
• Wired output adhering at least one of the following protocols: o USB 2.0 o RS-232 o Ethernet
9 USB or RS-232 must be implemented to follow § 395.16 requirements 10 In accordance with § 395.16 location and time record requirements 11 As required by § 395.16 12 In accordance with § 395.16 location and time record requirements 13 As required by § 395.16
145
A3.3 Data Acquisition and Transfer • Buffer Size
o Not Specified for the POC • Range
o Not Specified for the POC
A3.4 Specifications • Voltage and Current
o Device should accept a 12-volt DC power supply o Device should draw a maximum of 2.0 amps
• Antenna o Must provide antenna(s) optimized for both 2.4 and 5.9 GHz
• Environment14 o Not Specified for the POC
A4.0 Test Requirements
The POC test must demonstrate proper operation of the UWIS. To efficiently do this, it will be conducted in two parts. Phase 1 A will test only the kernel, comparing kernel input data to kernel output. Phase 1 B will then test the transceiver with each of the kernels, comparing the transceiver input to the data received at the distant end. To accomplish these tasks, the test will adhere to the following requirements:
• Sample Rate o 0.2Hz
• Monitoring Equipment Specifications o Must accept 12-volt power o Inputs must match both kernel output format and transceiver output format, which
could consist of a combination of the following protocols: RS-232 USB 2.0 Ethernet
o Output Graphical User Interface Data file
• Monitoring Points o Input of Kernel o Output of Kernel/Input to Transceiver o Output of Distant-End Receiver
• Test Duration (Estimated) o 12 hours
14 As required by § 395.16
146
A: 8 hours B: 4 hours
• Test Configuration o Operating Frequency – 2.4/5.9 GHz o Operating Power – 17dBm o Antenna
• Test Scenarios o A
8 hour drive with various status changes o B
Vehicle to Roadside static Vehicle to Roadside low speed Vehicle to Roadside high speed Vehicle to Vehicle static Vehicle to Vehicle low speed Vehicle to Vehicle high speed Vehicle to Vehicle differing speeds
o Target Data Transfer Accuracy 99.5% or greater
A5.0 FMCSA SDMS Requirements as per § 395.16
A5.1 SDMS Requirements • Driver ID
o First name o Last name o PIN/ID assigned by motor carrier
• Co-Driver ID o First name o Last name o PIN/ID assigned by carrier
• Vehicle ID o Tractor number assigned by motor carrier o Trailer number assigned by motor carrier o Tractor VIN
• Company ID o Carrier name o Carrier USDOT number
• 24-hour time period start time o Definition of when 24-hour period starts as decided by carrier
• Multi-day basis used by motor carrier to compute cumulative duty hours and driving time o Can either be 7 or 8 days
• Event data o Event sequence ID (0001 – 9999)
147
Unique number assigned to each event for a specific vehicle on a specific day
o Event status code OFF = off duty SB = sleeper berth D = on duty driving ON = on duty not driving DG = diagnostic
o Event date (UTC, YYYYMMDD) o Event time (UTC, HHMMSS)
Must be used to compute hours in each duty status for the 24-hour period and total
o Event latitude (xx.xxxxxx) o Event longitude (xxx.xxxxxx) o Place name
Must record nearest city, town, or village, with state abbreviation, from FIPS55 list using satellite or terrestrial sources (or a combination of these)
o Place distance (miles) Distance from event occurrence to nearest populated place
o Total vehicle miles Must be able to use this to calculate (in miles or kilometers):
• Distance traveled during each on-duty driving period • Total distance traveled for each 24-hour period
o Event update status code C = Current- record data is up-to-date H = Historical- record data is out-of-date. A new record contains the
corrected information, but original is maintained for data trail purposes o Diagnostic event code
If event status is “DG”, this entry records the type of diagnostic performed (see section 5.1 for more information on diagnostic event codes)
o Event error code Contains the type of error if one occurred (see section 5.1 for more
information on error event codes) o Event update date (UTC, YYYYMMDD) o Event update time (UTC, HHMMSS) o Event update person ID
ID of person who last updated or edited a record o Event update text
Note, if desired, regarding last update or edit
A5.2 Functionality requirements • Duty status defaults
o Automatically record driving time • Location
148
o When vehicle is in motion, record location and time at intervals of 1 minute or less.
o Information used to determine location must be derived from a source not subject to alteration by the motor carrier or driver
o Location description must be sufficiently precise (within 300 meters) to enable enforcement personnel to quickly determine the vehicle’s geographic location at each change of duty status on a standard map or road atlas
• Distance traveled o If distances are recorded in kilometers, kernel must also provide the ability to
display in miles • Information reporting
o UWIS must be capable of providing data to authorized Federal, State, or local officials immediately at any time regarding driver’s HOS
o UWIS must be capable or producing HOS data in graph-grid format upon demand (see section 5.2)
o Data produced for officials must be available without requiring the official to enter in or upon the CMV
o The UWIS must be capable of producing records for current day and previous 7 days
Can be information stored in kernel or from computer-generated records • Hardware requirements
o Acceptable information interchange methods RS-232 USB 2.0 IEEE 802.11(g) Bluetooth
o Display capabilities Driver’s and co-driver’s names and ID’s Driver’s total hours during each driving period and current duty day Total hours on duty for current duty day Total miles or kilometers driven during each driving period and current
duty day Total hours on duty and driving time for the 7-consecutive-day period,
including current day Total hours on duty and driving time for the prior 8-consecutive-day
period, including current day The sequence of duty status for each day, and the time and location of
each change in duty status for each driver using the device Date and time of crossing a state line (for purposes of fuel-tax reporting)
• Performance specifications o The device must, to the maximum extent practicable, be tamper resistant, not
permitting alteration or erasure of the original information collected concerning driver’s HOS, or alteration of the source data streams used to provide that information
149
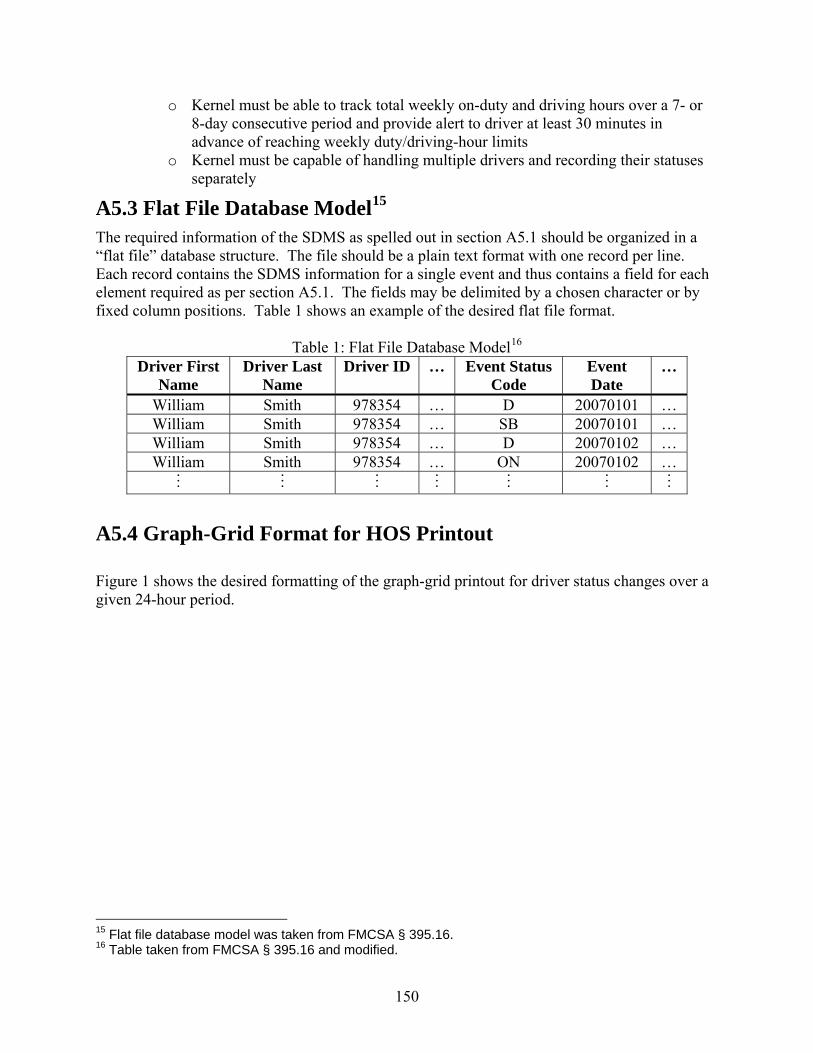
o Kernel must be able to track total weekly on-duty and driving hours over a 7- or 8-day consecutive period and provide alert to driver at least 30 minutes in advance of reaching weekly duty/driving-hour limits
o Kernel must be capable of handling multiple drivers and recording their statuses separately
A5.3 Flat File Database Model15 The required information of the SDMS as spelled out in section A5.1 should be organized in a “flat file” database structure. The file should be a plain text format with one record per line. Each record contains the SDMS information for a single event and thus contains a field for each element required as per section A5.1. The fields may be delimited by a chosen character or by fixed column positions. Table 1 shows an example of the desired flat file format.
Table 1: Flat File Database Model16 Driver First
Name Driver Last
Name Driver ID … Event Status
Code Event Date
…
William Smith 978354 … D 20070101 … William Smith 978354 … SB 20070101 … William Smith 978354 … D 20070102 … William Sm th i 978 54 3 … O N 2007 102 0 … . . .
. . . . . .
. . . . . .
. . . . . .
A5.4 Graph-Grid Format for HOS Printout Figure 1 shows the desired formatting of the graph-grid printout for driver status changes over a given 24-hour period.
15 Flat file database model was taken from FMCSA § 395.16. 16 Table taken from FMCSA § 395.16 and modified.
150
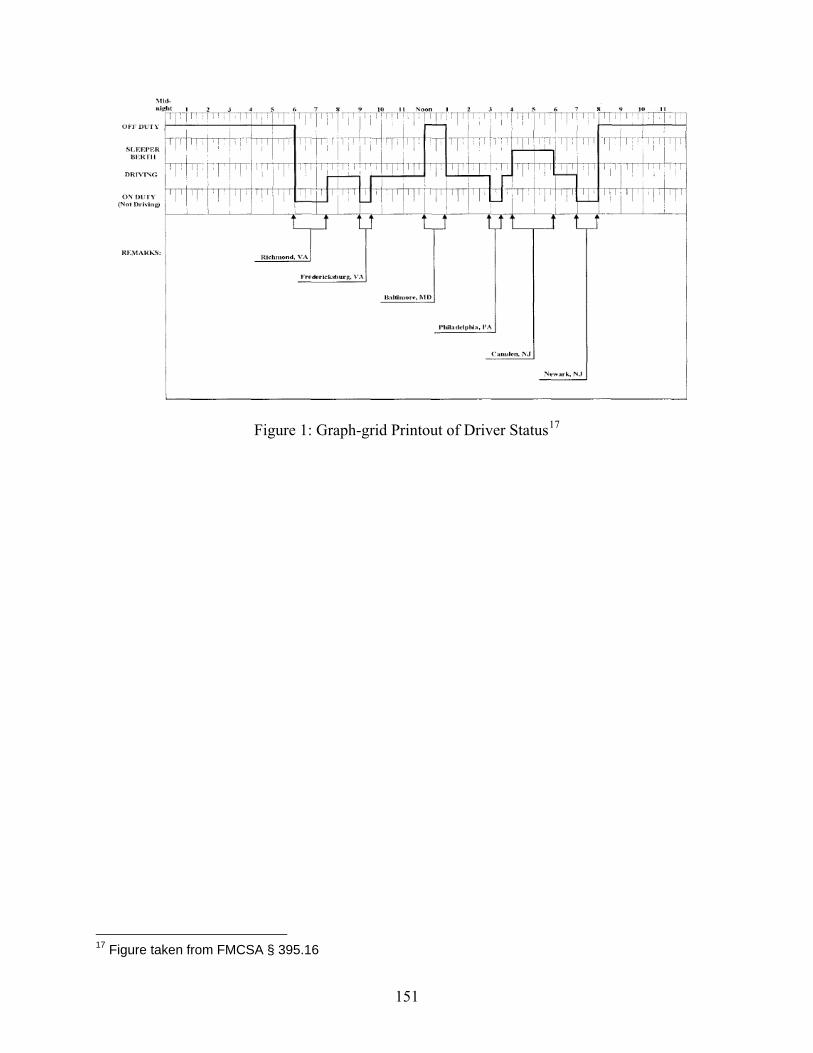
151
Figure 1: Graph-grid Printout of Driver Status17
17 Figure taken from FMCSA § 395.16