Embed Size (px)
Citation preview
The River Bathymetry Toolkit (RBT)
Rocky Mountain Research Station, Boise, IdahoAir, Water, and Aquatic Environments Program
Jim McKean, US Forest Service, Rocky Mountain Research Station, BoiseDave Nagel, US Forest Service, Rocky Mountain Research Station, Boise
Philip Bailey, ESSA Technologies, Ltd., Vancouver, BCFrank Poulsen, ESSA Technologies, Ltd., Vancouver, BC
Carolyn Bohn, US Forest Service, Rocky Mountain Research Station, BoiseKaty Bryan, ESSA Technologies, Ltd., Vancouver, BCLiz Martell, ESSA Technologies, Ltd., Vancouver, BC
Diana Abraham, ESSA Technologies, Ltd., Vancouver, BC
ESSA Technologies, Ltd.Vancouver, BC
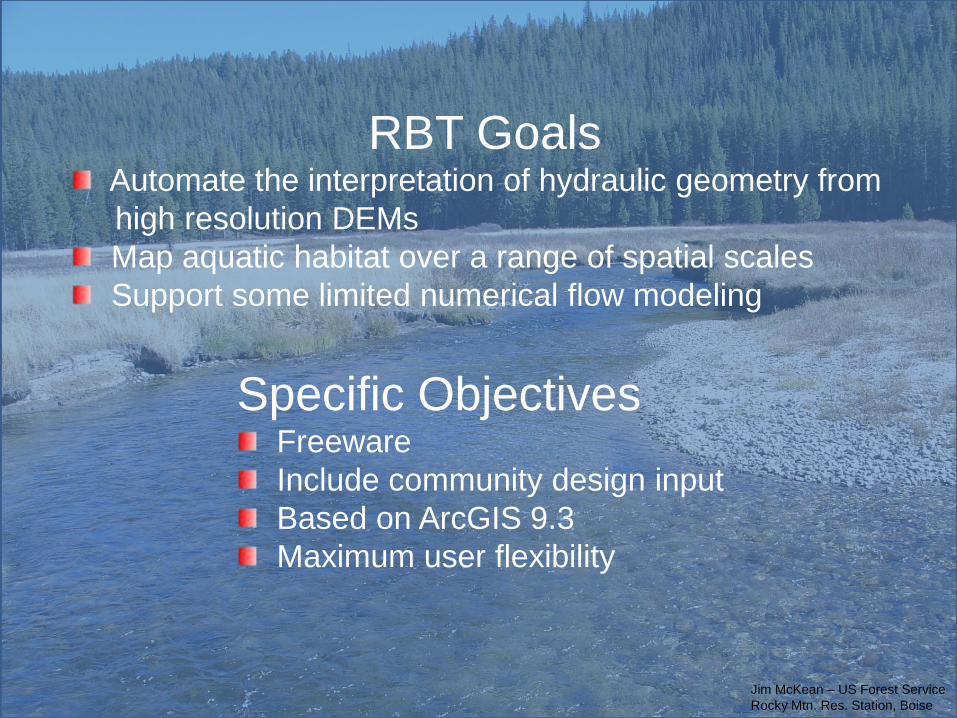
RBT GoalsAutomate the interpretation of hydraulic geometry from high resolution DEMsMap aquatic habitat over a range of spatial scalesSupport some limited numerical flow modeling
Specific ObjectivesFreewareInclude community design inputBased on ArcGIS 9.3Maximum user flexibility
Jim McKean – US Forest ServiceRocky Mtn. Res. Station, Boise
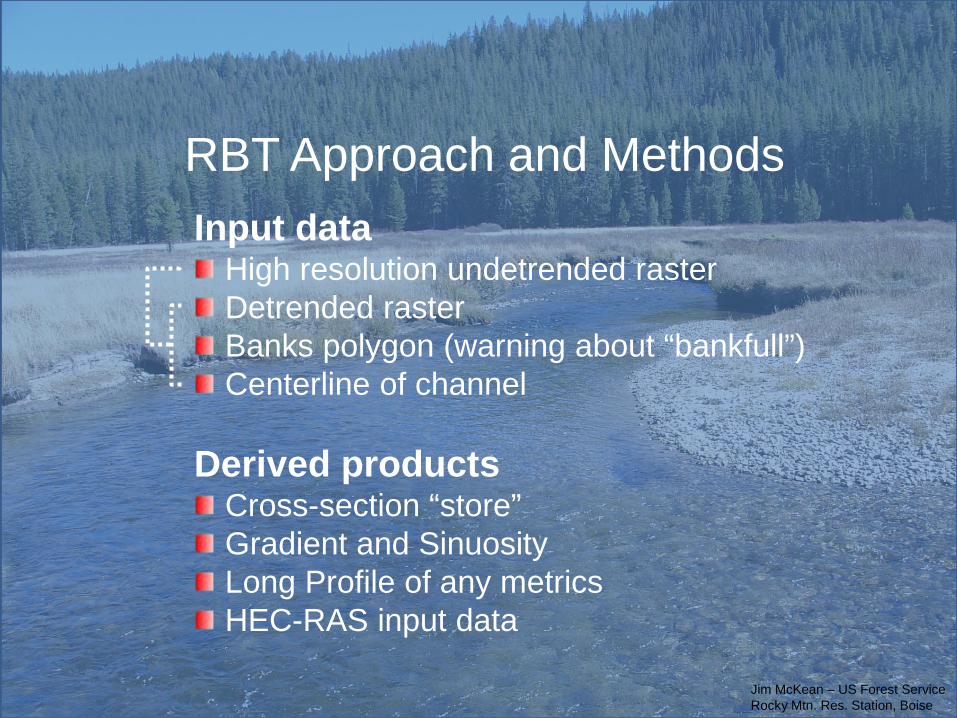
RBT Approach and MethodsInput data
High resolution undetrended rasterDetrended rasterBanks polygon (warning about “bankfull”)Centerline of channel
Derived productsCross-section “store”Gradient and SinuosityLong Profile of any metricsHEC-RAS input data
Jim McKean – US Forest ServiceRocky Mtn. Res. Station, Boise
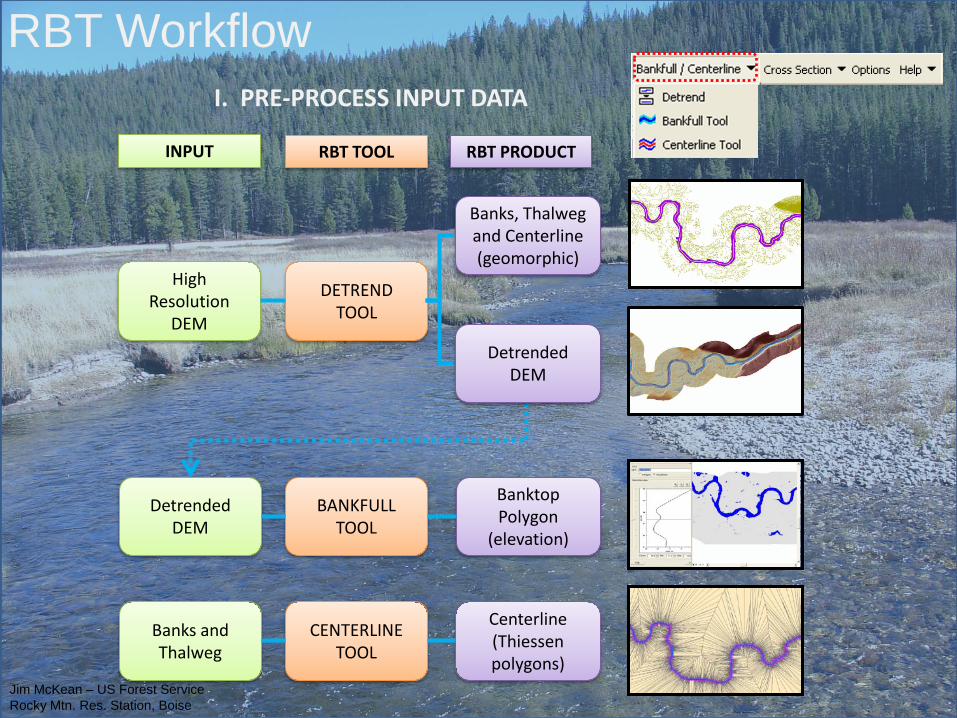
RBT PRODUCTINPUT RBT TOOL
BANKFULL TOOL
DetrendedDEM
DetrendedDEM
High Resolution
DEM
Banks, Thalwegand Centerline (geomorphic)
DETREND TOOL
BanktopPolygon
(elevation)
Centerline (Thiessenpolygons)
CENTERLINE TOOL
Banks and Thalweg
I. PRE-PROCESS INPUT DATA
RBT Workflow
Jim McKean – US Forest ServiceRocky Mtn. Res. Station, Boise
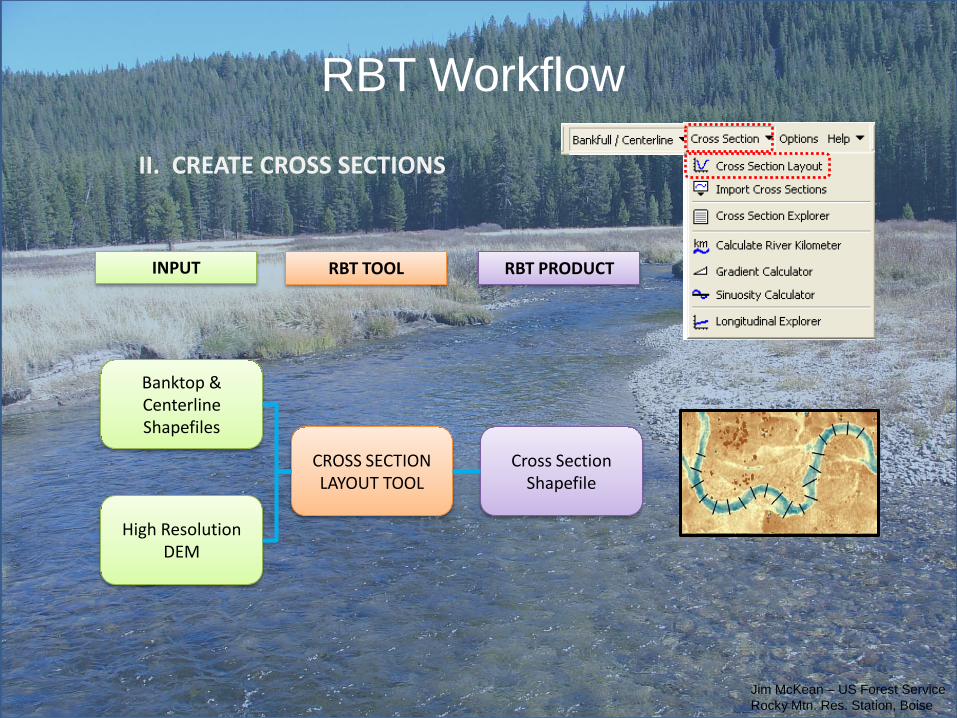
II. CREATE CROSS SECTIONS
Cross Section Shapefile
CROSS SECTION LAYOUT TOOL
RBT PRODUCTINPUT RBT TOOL
Banktop & Centerline Shapefiles
High Resolution DEM
RBT Workflow
Jim McKean – US Forest ServiceRocky Mtn. Res. Station, Boise
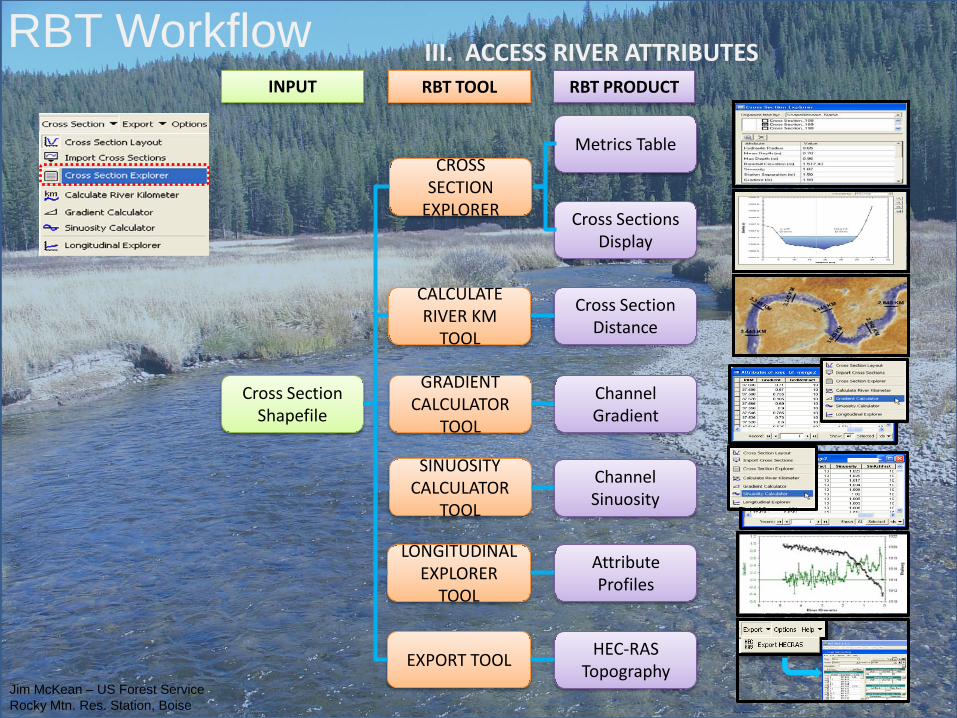
III. ACCESS RIVER ATTRIBUTESRBT PRODUCTINPUT RBT TOOL
Metrics Table
LONGITUDINAL EXPLORER
TOOL
SINUOSITY CALCULATOR
TOOL
CROSS SECTION
EXPLORER
CALCULATE RIVER KM
TOOL
GRADIENT CALCULATOR
TOOL
Attribute Profiles
Cross Sections Display
Cross Section Distance
Channel Gradient
Channel Sinuosity
Cross Section Shapefile
EXPORT TOOLHEC-RAS
Topography
RBT Workflow
Jim McKean – US Forest ServiceRocky Mtn. Res. Station, Boise
Current Status and WarningsThis is research software Hydraulic geometry module is largely finishedHEC-RAS interface is finishedYou are the first large beta testing groupBe sure you have adequate high resolution DEMs At least 5 pixels across a channel Fix data errors before using RBT Example: bridges mapped in airborne lidar data Example: very low area on edge of raster
Liability Disclaimer: Neither the United States Government nor any of its employees makes any warranty, express or implied, for any purposes regarding the River Bathymetry Toolkit (RBT). This includes warranties of merchantability and fitness for any particular purpose. Furthermore, neither the United States Government nor any of its employees assumes any legal liability or responsibility for the accuracy, completeness, or usefulness of any information or products derived from the River Bathymetry Toolkit.
Jim McKean – US Forest ServiceRocky Mtn. Res. Station, Boise
Known Unresolved Issues in RBTThalweg from connecting deepest points in cross sections isn’t accurateSometimes the cross sections are drawn facing upstream and sometimes
downstreamIn a detrended DEM the layout of cross sections doesn’t always proceed in
the direction you specified; there is no downstream or upstreamProgram crashes if detrending is run multiple times. User must delete
detrending workspace folder before rerunning detrending algorithm.
Jim McKean – US Forest ServiceRocky Mtn. Res. Station, Boise
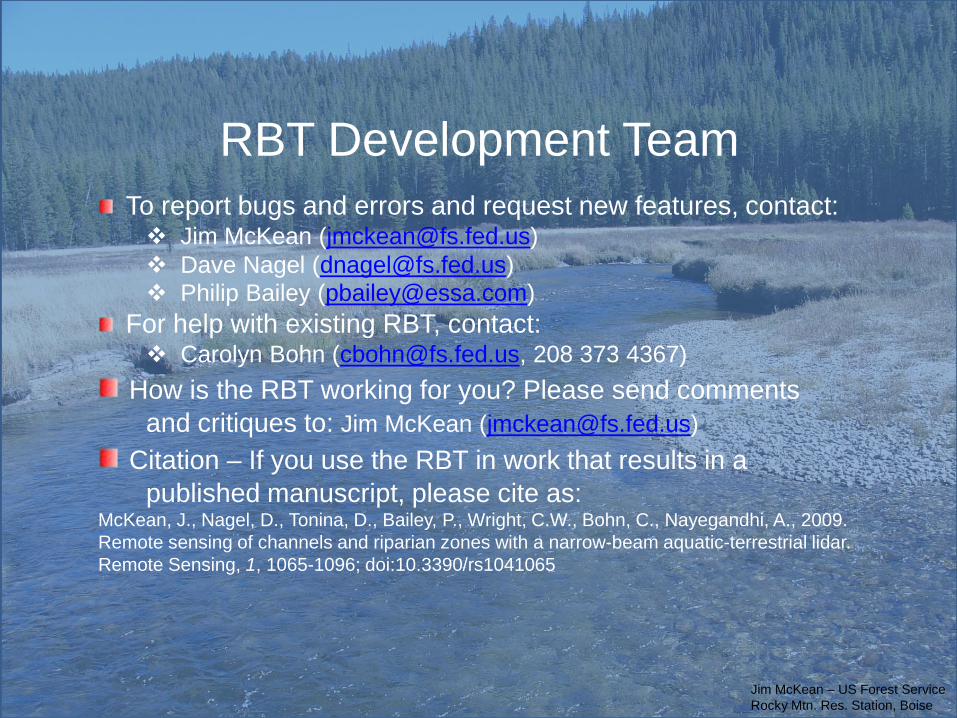
RBT Development TeamTo report bugs and errors and request new features, contact: Jim McKean ([email protected]) Dave Nagel ([email protected]) Philip Bailey ([email protected])
For help with existing RBT, contact: Carolyn Bohn ([email protected], 208 373 4367)
How is the RBT working for you? Please send comments and critiques to: Jim McKean ([email protected])
Citation – If you use the RBT in work that results in a published manuscript, please cite as:
McKean, J., Nagel, D., Tonina, D., Bailey, P., Wright, C.W., Bohn, C., Nayegandhi, A., 2009. Remote sensing of channels and riparian zones with a narrow-beam aquatic-terrestrial lidar. Remote Sensing, 1, 1065-1096; doi:10.3390/rs1041065
Jim McKean – US Forest ServiceRocky Mtn. Res. Station, Boise
AcknowledgementsFinancial support by:
Forest Service, Rocky Mtn. Research Station, BoiseNOAA & Bonneville Power Administration, ISEMP Project
ESSA Technologies, Ltd.
Jim McKean – US Forest ServiceRocky Mtn. Res. Station, Boise
Task 1(Page 7 in Workbook)
Jim McKean – US Forest ServiceRocky Mtn. Res. Station, Boise
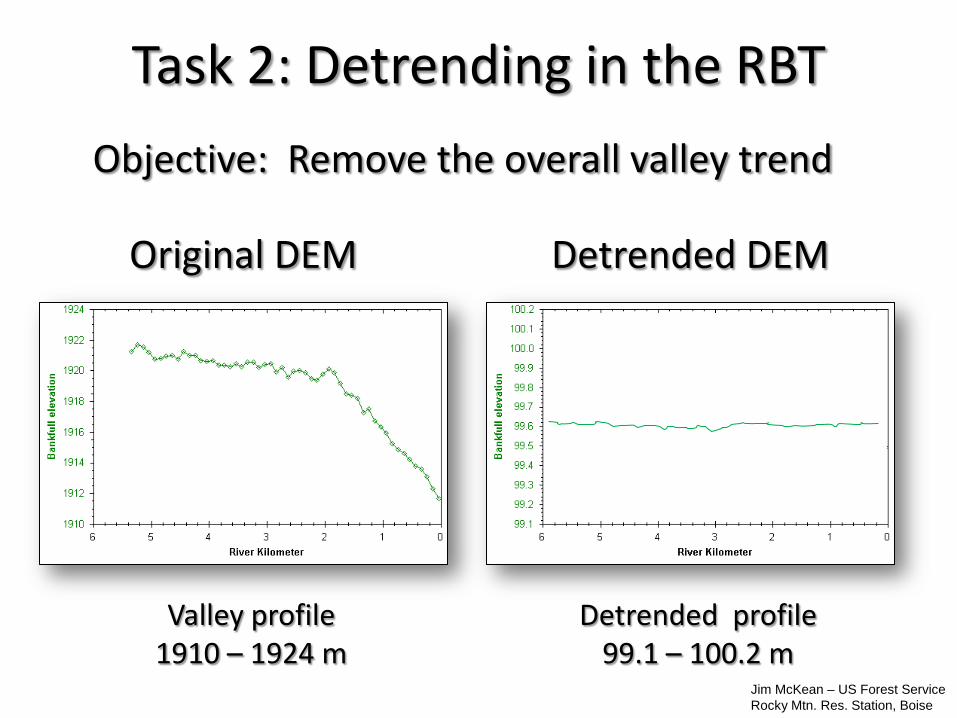
Task 2: Detrending in the RBT
Objective: Remove the overall valley trend
Original DEM Detrended DEM
Valley profile1910 – 1924 m
Detrended profile99.1 – 100.2 m
Jim McKean – US Forest ServiceRocky Mtn. Res. Station, Boise
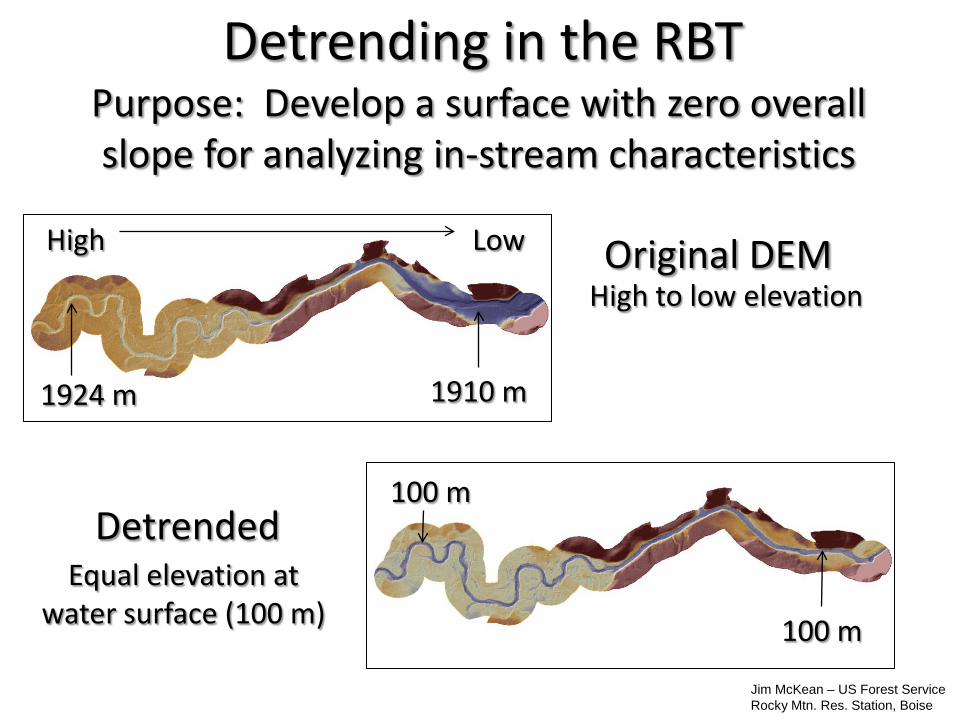
Detrending in the RBTPurpose: Develop a surface with zero overall slope for analyzing in-stream characteristics
Original DEM
Detrended
High to low elevation
High Low
Equal elevation at water surface (100 m)
100 m
100 m
1924 m 1910 m
Jim McKean – US Forest ServiceRocky Mtn. Res. Station, Boise
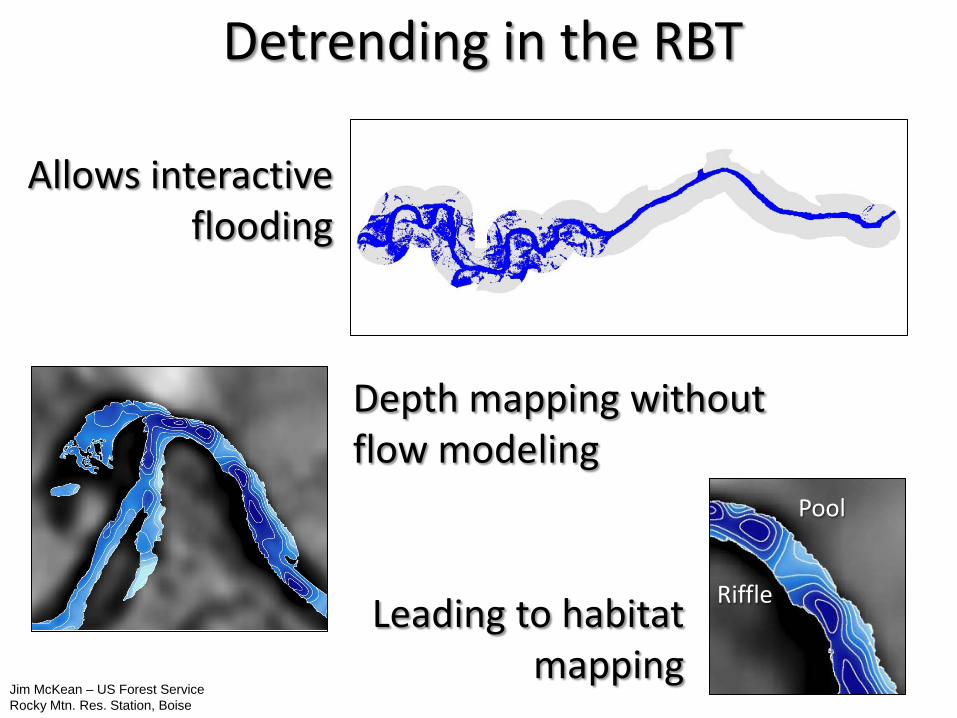
Detrending in the RBT
Allows interactive flooding
Depth mapping without flow modeling
Leading to habitat mapping
Pool
Riffle
Jim McKean – US Forest ServiceRocky Mtn. Res. Station, Boise
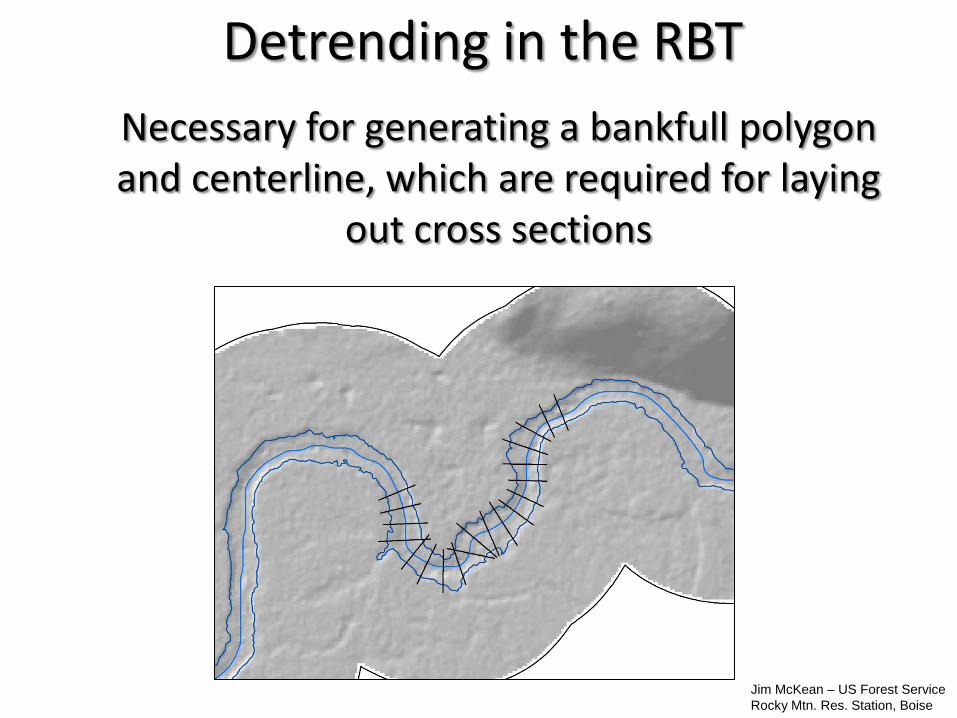
Detrending in the RBTNecessary for generating a bankfull polygon and centerline, which are required for laying
out cross sections
Jim McKean – US Forest ServiceRocky Mtn. Res. Station, Boise
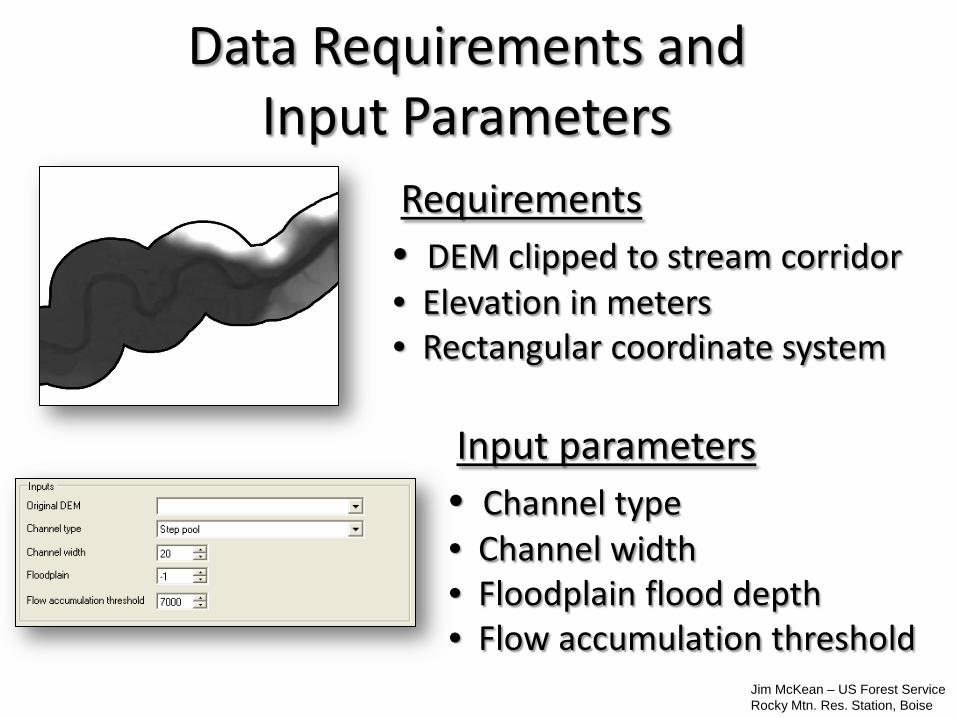
Data Requirements and Input Parameters
• DEM clipped to stream corridor• Elevation in meters• Rectangular coordinate system
Input parameters
Requirements
• Channel type• Channel width• Floodplain flood depth• Flow accumulation threshold
Jim McKean – US Forest ServiceRocky Mtn. Res. Station, Boise
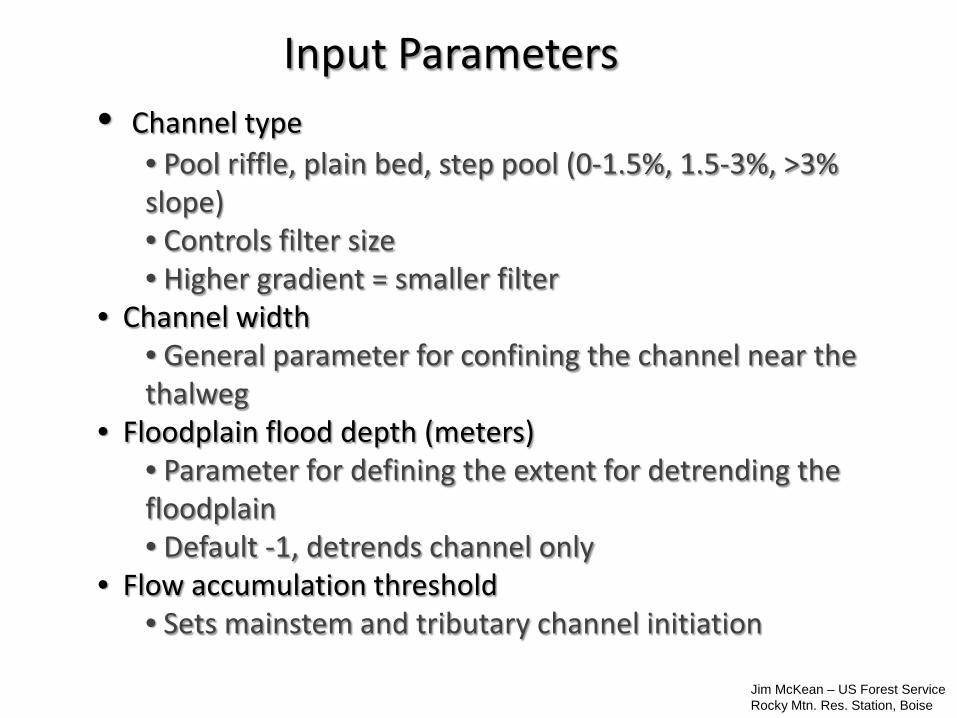
Input Parameters• Channel type
• Pool riffle, plain bed, step pool (0-1.5%, 1.5-3%, >3% slope)• Controls filter size• Higher gradient = smaller filter
• Channel width• General parameter for confining the channel near the thalweg
• Floodplain flood depth (meters)• Parameter for defining the extent for detrending the floodplain• Default -1, detrends channel only
• Flow accumulation threshold• Sets mainstem and tributary channel initiation
Jim McKean – US Forest ServiceRocky Mtn. Res. Station, Boise
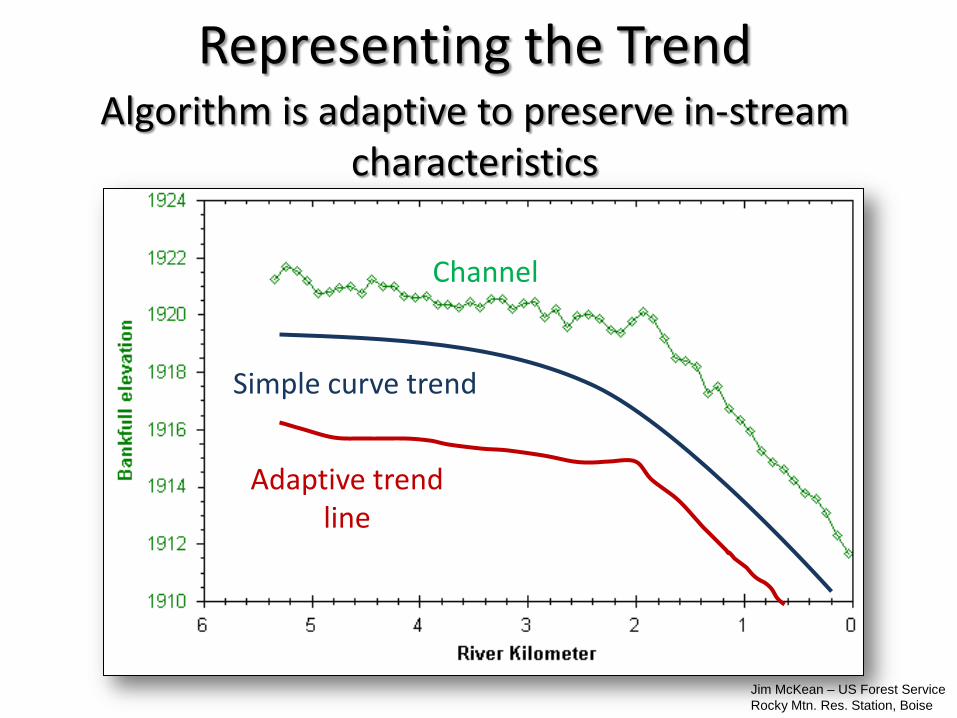
Adaptive trend line
Simple curve trend
Channel
Representing the TrendAlgorithm is adaptive to preserve in-stream
characteristics
Jim McKean – US Forest ServiceRocky Mtn. Res. Station, Boise
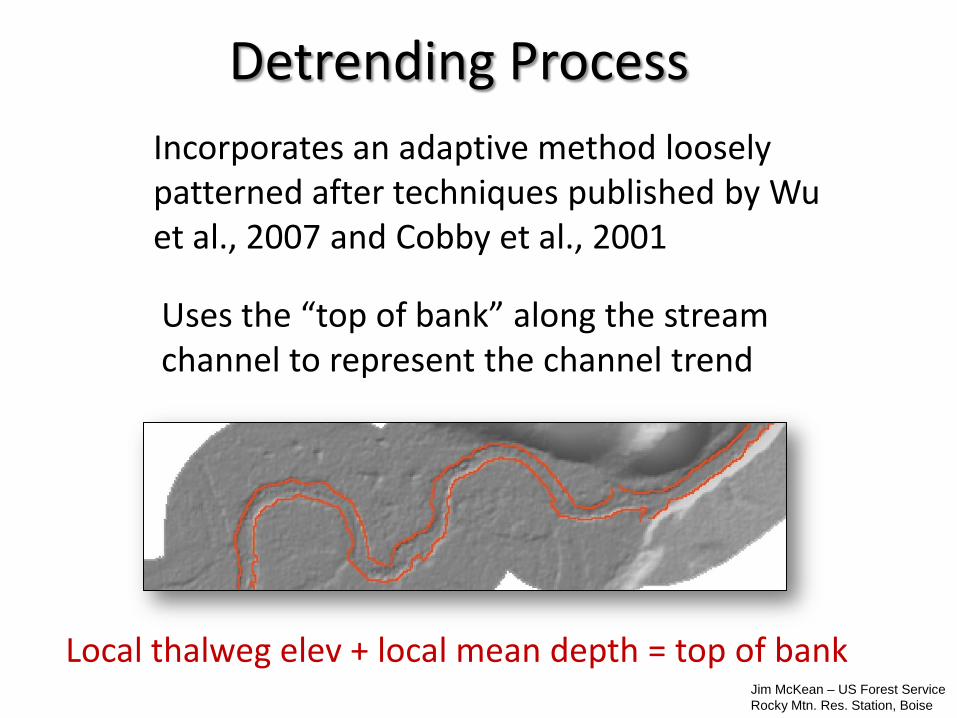
Incorporates an adaptive method loosely patterned after techniques published by Wu et al., 2007 and Cobby et al., 2001
Uses the “top of bank” along the stream channel to represent the channel trend
Detrending Process
Local thalweg elev + local mean depth = top of bank Jim McKean – US Forest ServiceRocky Mtn. Res. Station, Boise
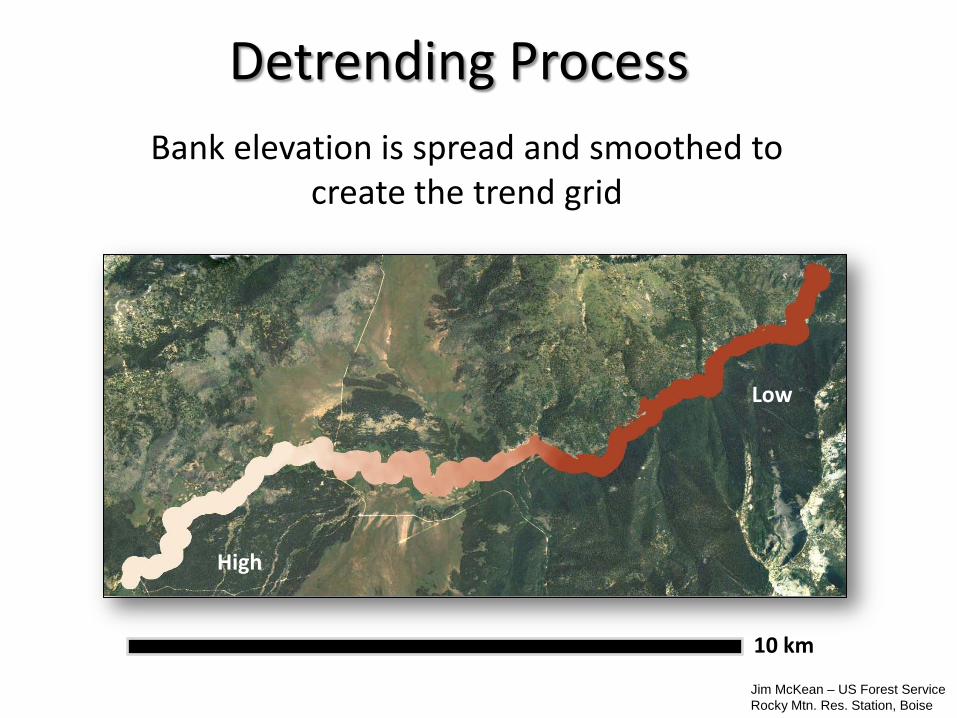
Bank elevation is spread and smoothed to create the trend grid
Detrending Process
10 km
High
Low
Jim McKean – US Forest ServiceRocky Mtn. Res. Station, Boise
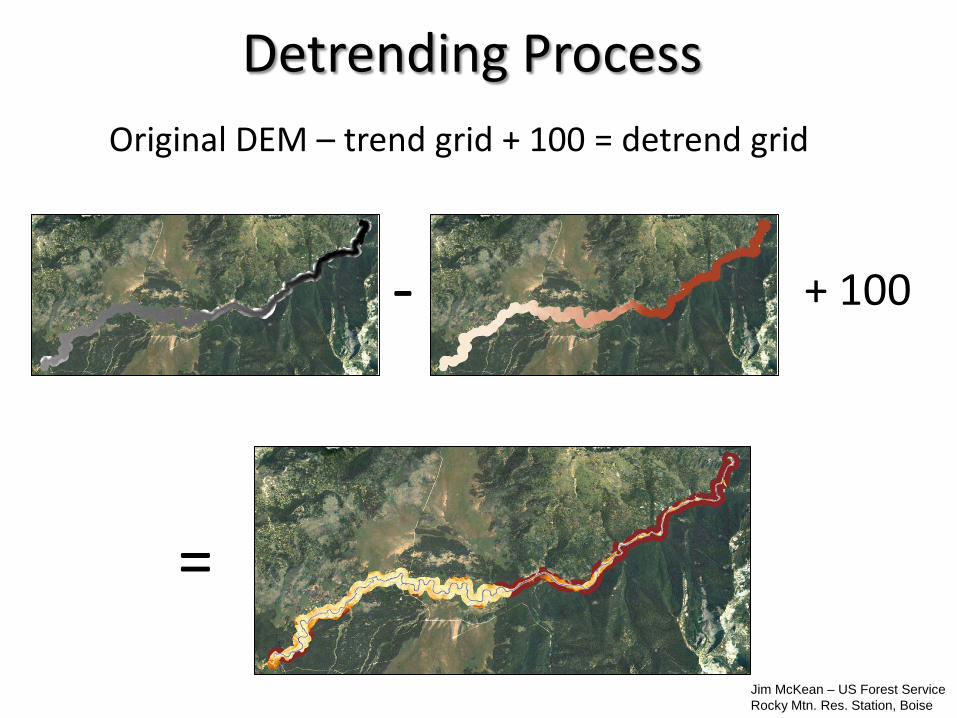
Detrending ProcessOriginal DEM – trend grid + 100 = detrend grid
- + 100
=
Jim McKean – US Forest ServiceRocky Mtn. Res. Station, Boise
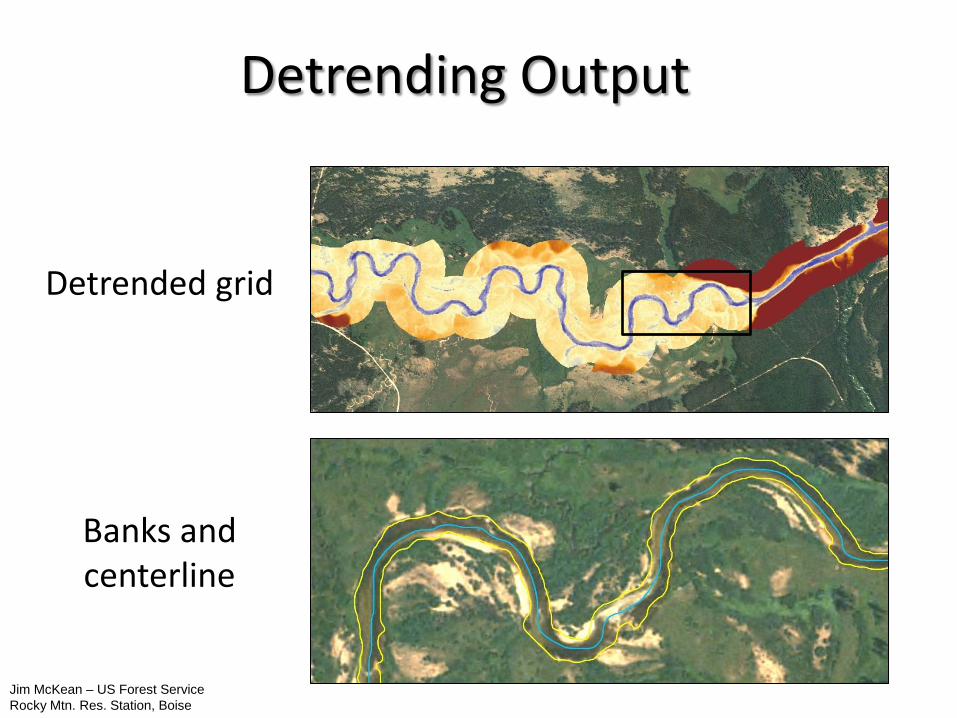
Detrending Output
Detrended grid
Banks and centerline
Jim McKean – US Forest ServiceRocky Mtn. Res. Station, Boise
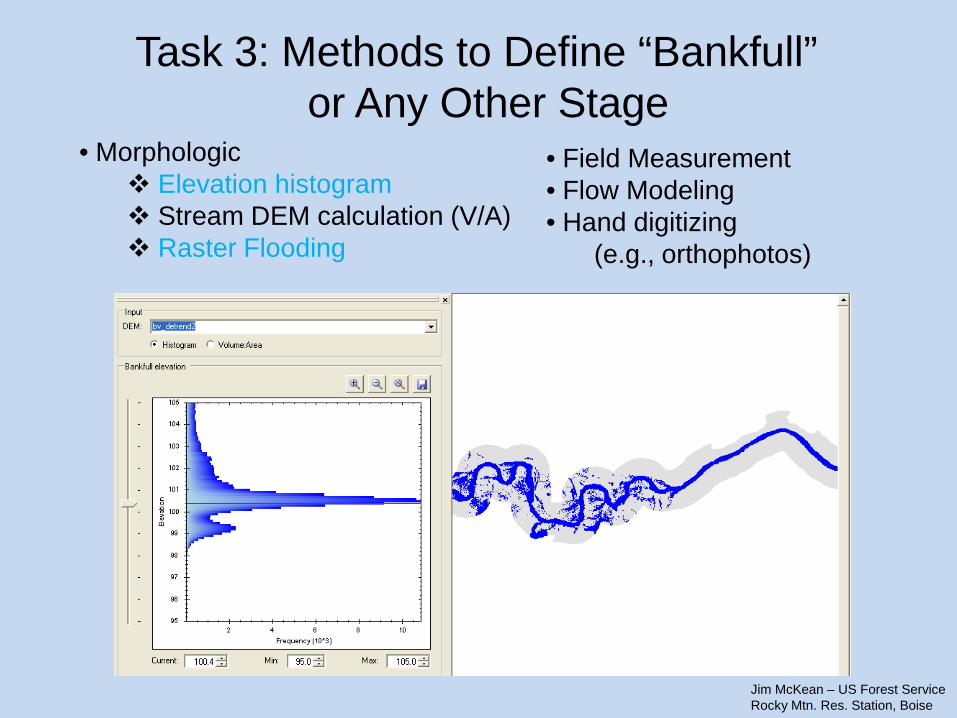
Task 3: Methods to Define “Bankfull”or Any Other Stage
• Morphologic Elevation histogram Stream DEM calculation (V/A) Raster Flooding
• Field Measurement• Flow Modeling• Hand digitizing
(e.g., orthophotos)
Jim McKean – US Forest ServiceRocky Mtn. Res. Station, Boise
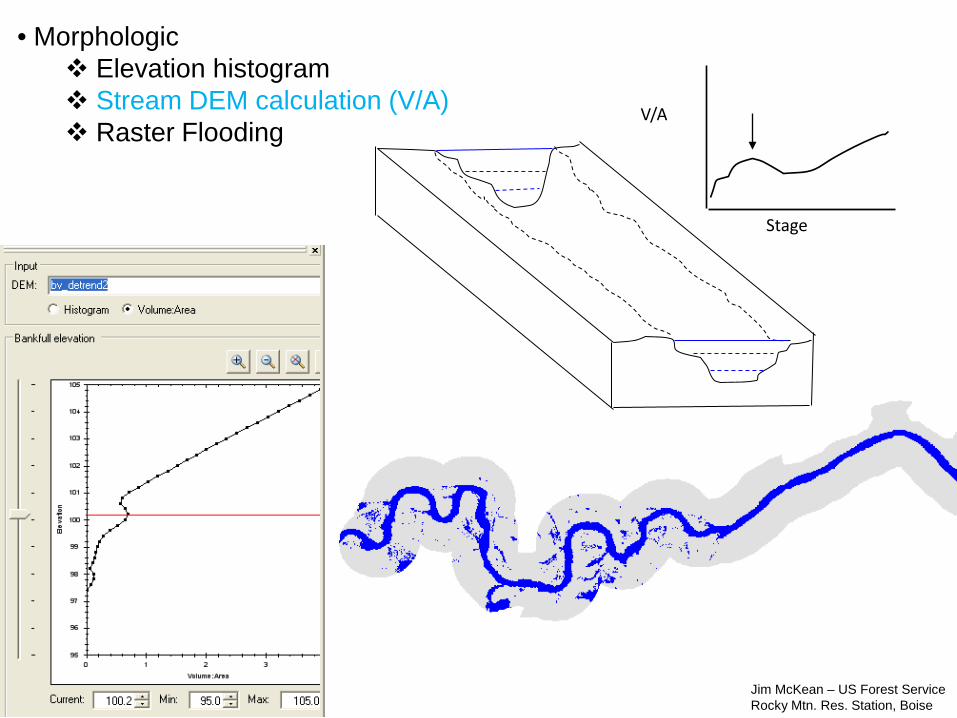
V/A
Stage
• Morphologic Elevation histogram Stream DEM calculation (V/A) Raster Flooding
Jim McKean – US Forest ServiceRocky Mtn. Res. Station, Boise
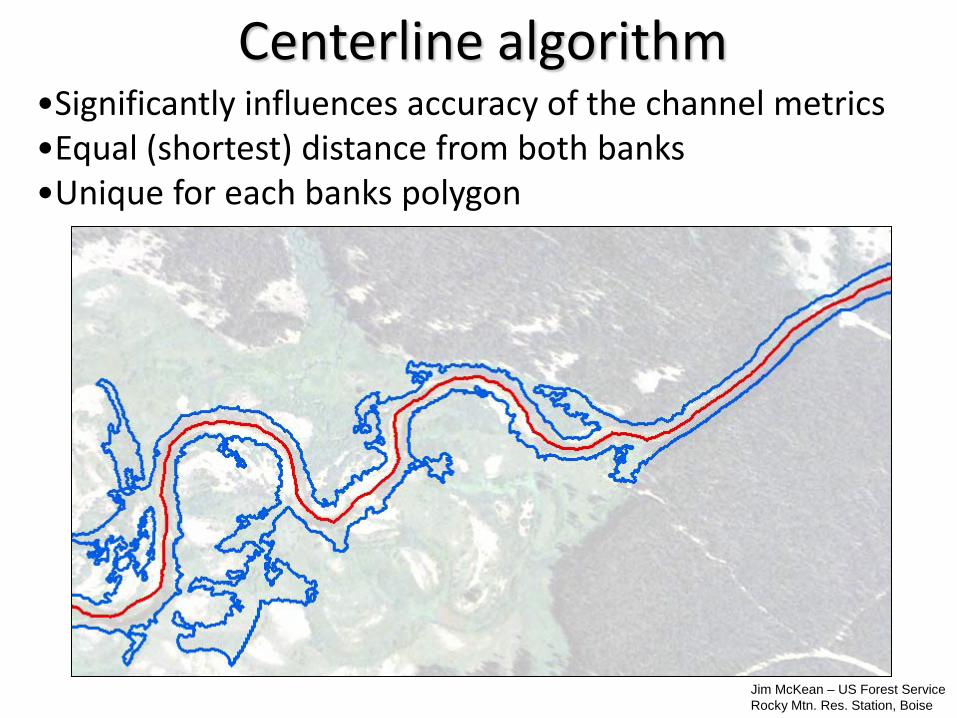
Centerline algorithm•Significantly influences accuracy of the channel metrics•Equal (shortest) distance from both banks•Unique for each banks polygon
Jim McKean – US Forest ServiceRocky Mtn. Res. Station, Boise
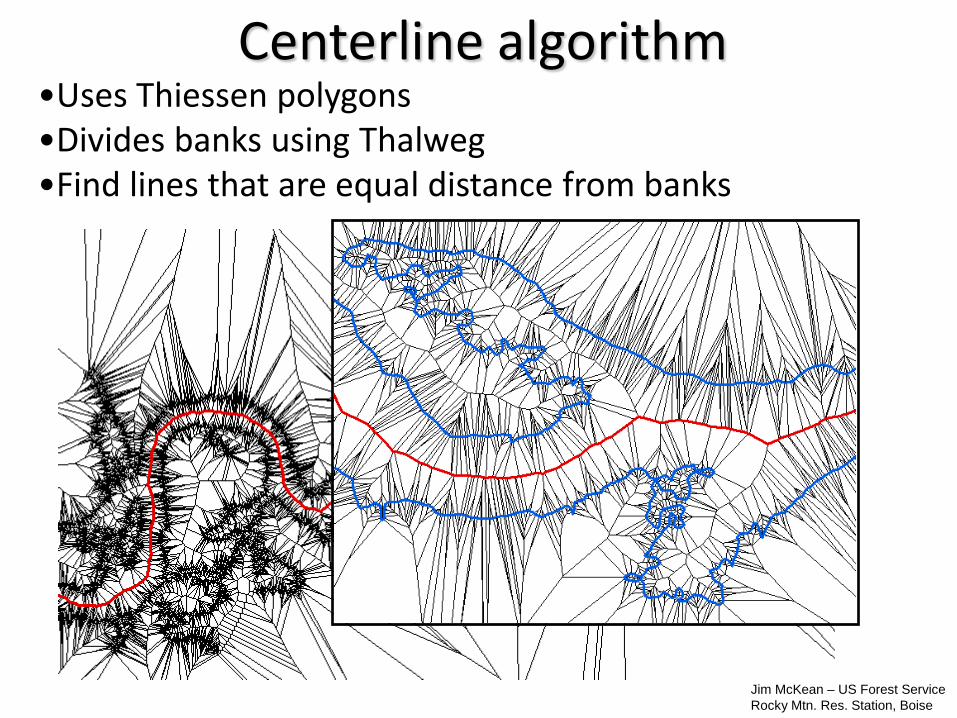
Centerline algorithm•Uses Thiessen polygons•Divides banks using Thalweg•Find lines that are equal distance from banks
Jim McKean – US Forest ServiceRocky Mtn. Res. Station, Boise
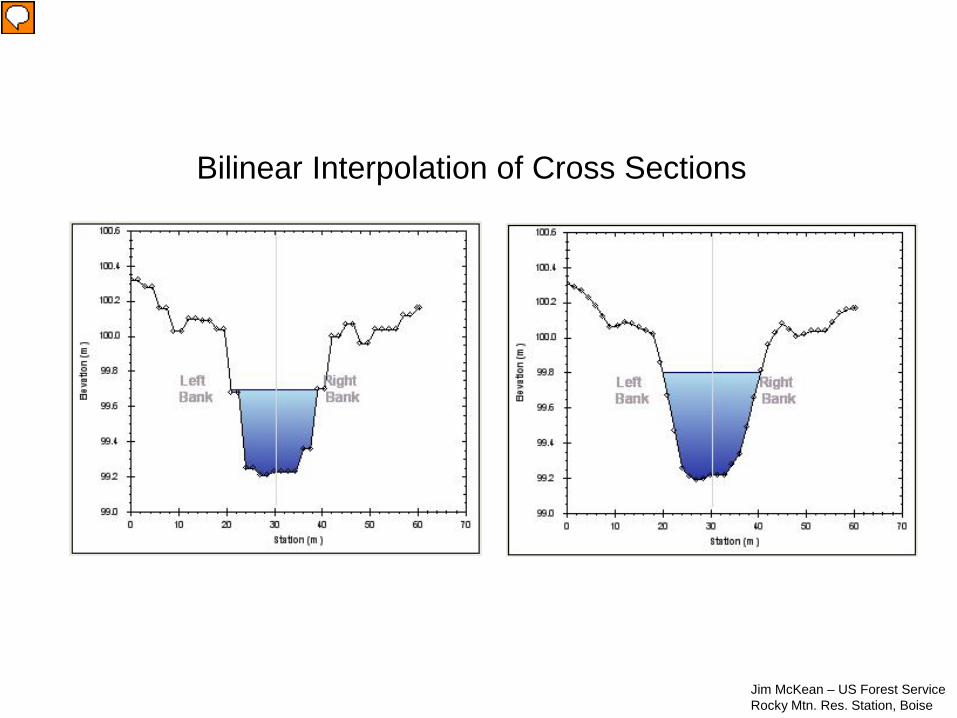
Bilinear Interpolation of Cross Sections
Jim McKean – US Forest ServiceRocky Mtn. Res. Station, Boise
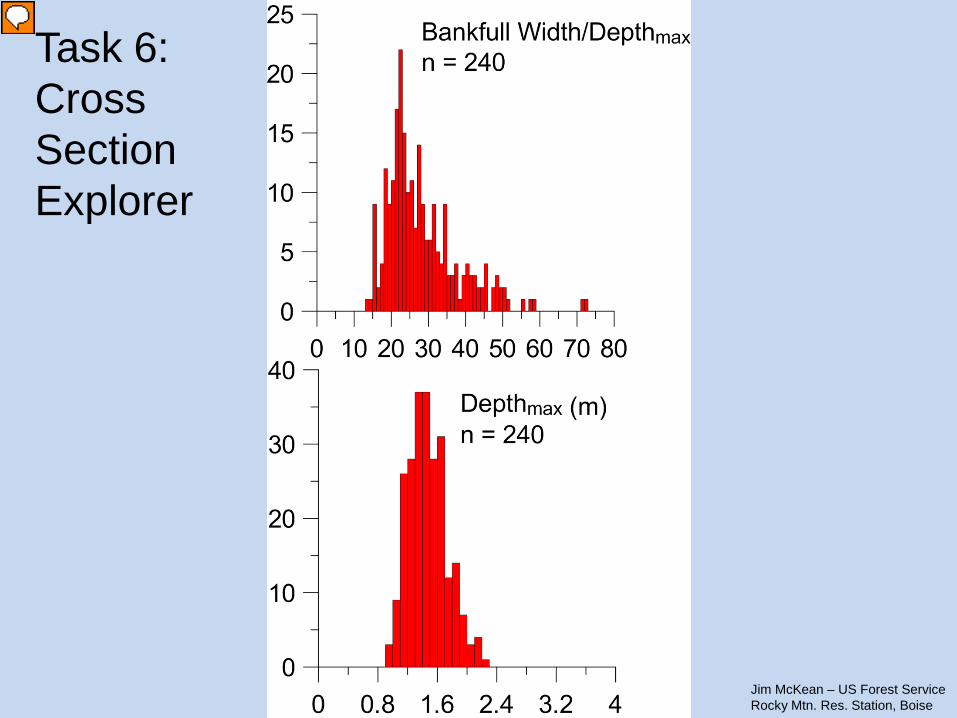
Task 6: Cross Section Explorer
Jim McKean – US Forest ServiceRocky Mtn. Res. Station, Boise
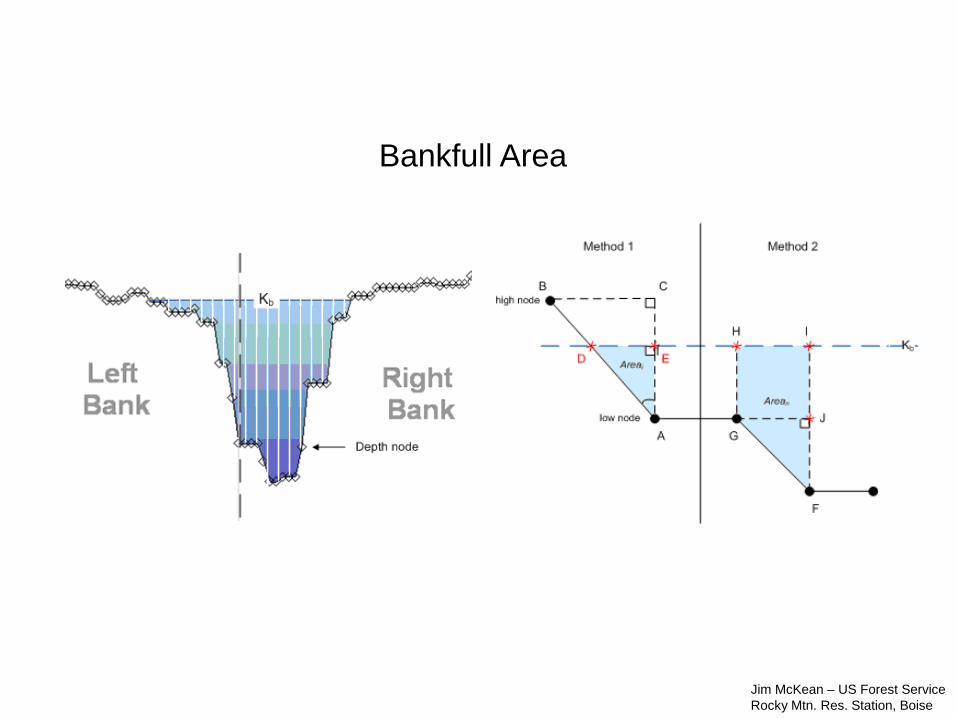
Bankfull Area
Jim McKean – US Forest ServiceRocky Mtn. Res. Station, Boise
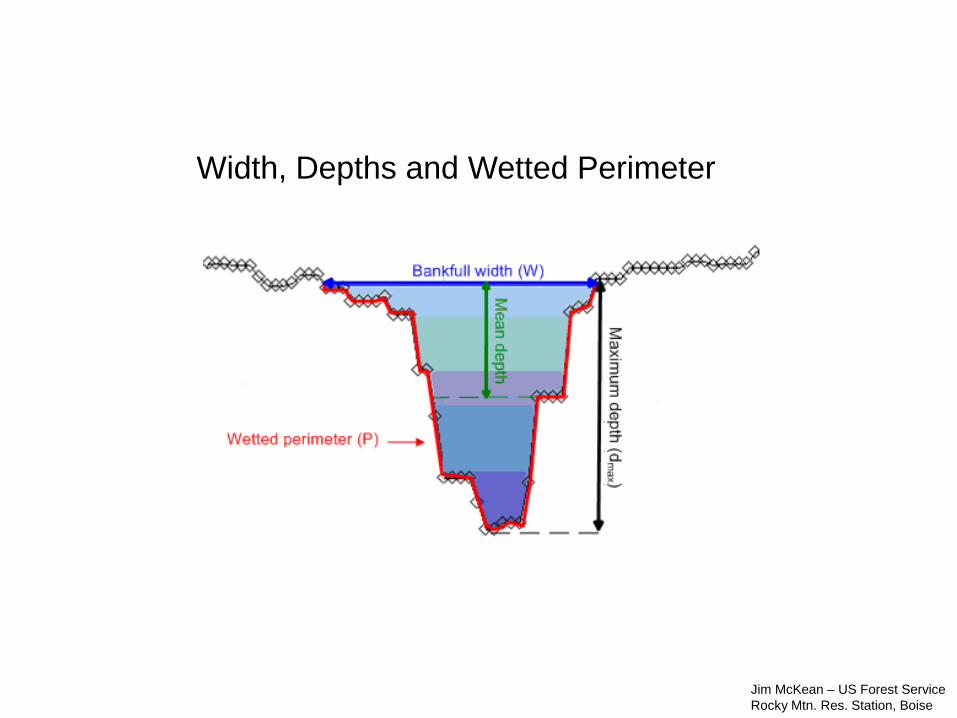
Width, Depths and Wetted Perimeter
Jim McKean – US Forest ServiceRocky Mtn. Res. Station, Boise
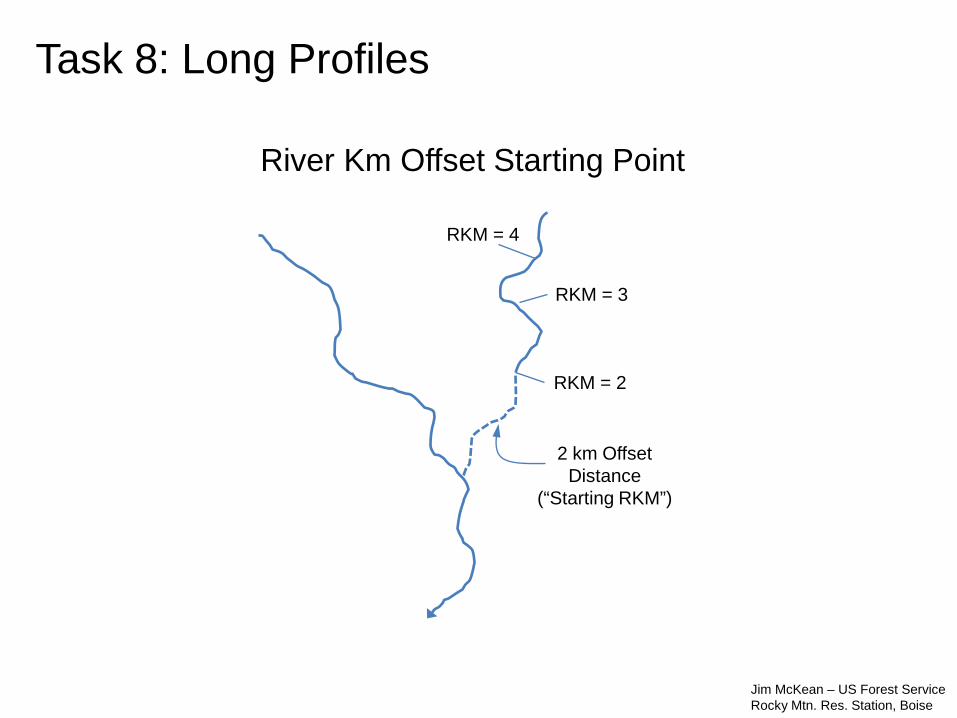
RKM = 2
RKM = 3
RKM = 4
2 km OffsetDistance
(“Starting RKM”)
River Km Offset Starting Point
Task 8: Long Profiles
Jim McKean – US Forest ServiceRocky Mtn. Res. Station, Boise
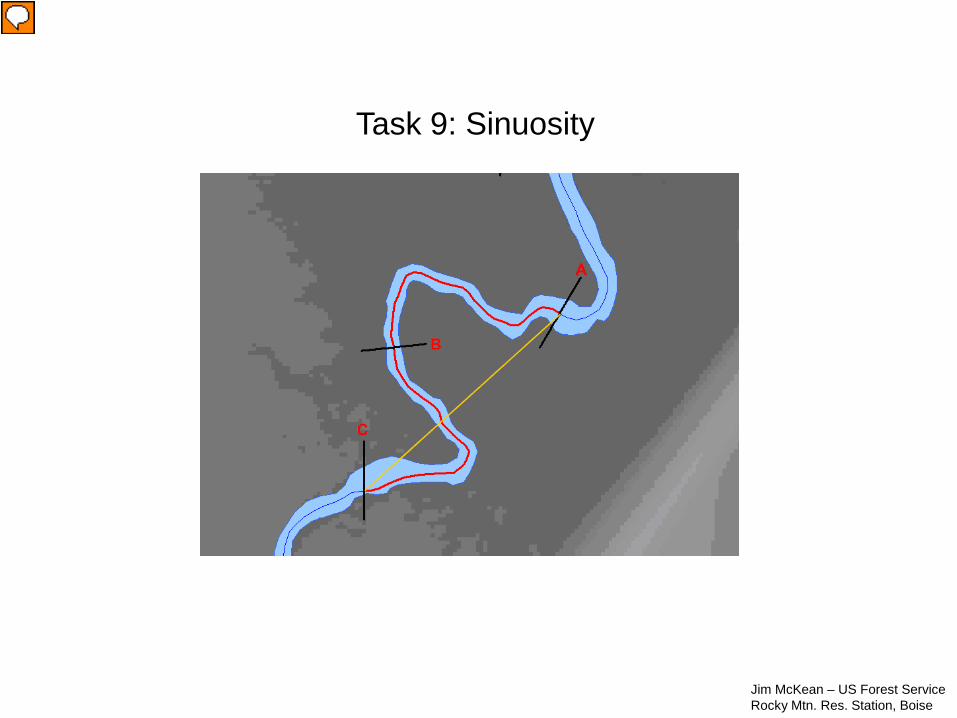
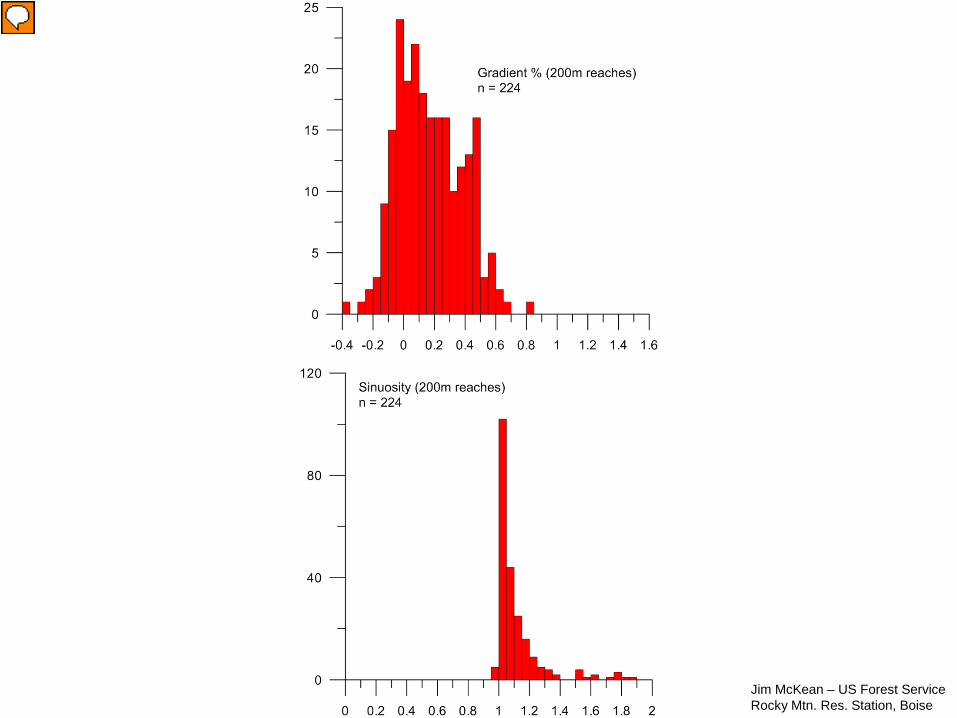
Task 9: Sinuosity
Jim McKean – US Forest ServiceRocky Mtn. Res. Station, Boise
Jim McKean – US Forest ServiceRocky Mtn. Res. Station, Boise


![RBT - LJ BATH sdn. bhd./ · PDF filerbt - v 270 rbt - q 21116 rbt - ar 413 ... rbt - t084 rgf - sm001 rgd - 308 t rr [ import ] artony [ import ] artony [ import ] rlf - u140 rmd -](https://img.pdfslide.us/doc/110x75/5a78ef837f8b9a5a148deef0/rbt-lj-bath-sdn-bhd-v-270-rbt-q-21116-rbt-ar-413-rbt-t084-rgf-.jpg)