Embed Size (px)
Citation preview

The Right Strategy for anThe Right Strategy for an Evolving Health Care Marketg
Larry MerloyPresident & Chief Executive Officer
Analyst DayDecember 16, 2015


Forward-looking Statements
During today’s presentation, we will make forward-looking statementswithin the meaning of the federal securities laws. By their nature, allforward looking statements involve risks and uncertainties Actualforward-looking statements involve risks and uncertainties. Actualresults may differ materially from those contemplated by the forward-looking statements for a number of reasons as described in our SECfilings including the risk factors section and cautionary statementfilings, including the risk factors section and cautionary statementdisclosure in those filings.
During this presentation, we will also use some non-GAAP financialh t lki b t ’ f i l dimeasures when talking about our company’s performance, including
free cash flow, cash available to enhance shareholder value andAdjusted EPS. In accordance with SEC regulations, you can find thedefinitions of these non-GAAP items as well as reconciliations todefinitions of these non-GAAP items, as well as reconciliations tocomparable GAAP measures, on the investor relations portion of ourwebsite.
3

Key Accomplishments in 2015
Strong financial results Adj. EPS growth of ~15%; Free Cash Flow of ~$6.0B
Big wins in ’16 selling season
Superior specialty growth
$11.5B net new business; client retention of 98%
Continuing to outperform in the rapidly-growing specialty market with revenue growth of ~33%
Enhanced generic sourcing
New adjacent channel
p y g
Red Oak is hitting milestones and achieving goals
Acquired Omnicare, a leader in long-term
New, adjacent channel
Broader retail footprint
care pharmacy
Definitive agreement to purchase more than 1,660 Target pharmacies and approximately 80 retail clinics
Continued focus on enhancing health and beauty
Advanced front store strategies Continued focus on enhancing health and beauty offerings, store brands, personalization and digital
Built CVS Health brand identity Elevated awareness while continuing to play a leadership role in shaping the future of health care
Notes: See endnotes.
4

The Most Extensive Suite of Leading Assets…
Retail MailMailLong-term
CareRetailClinics
Specialty
Infusion
Clinics
Clinical Programs
Patients Medical Claims
Digital
g
Payors ProvidersClaims Editing
…providing the right strategy for an evolving health care market
5

Today’s Key Takeaways
The Right Strategy for an Evolving Health Care MarketThe Right Strategy for an Evolving Health Care Market
Leadership in multiple competencies to drive superior l f h lth t
Demonstrating Valuevalue for health care partnersto People, Payors and Providers
Expanding core pharmacy business while broadening Growing the Core, p g p y greach into new health care channels
g ,Broadening the Base
I t d i i ti d t d ki l tAlways Looking Introducing innovative products and making long-term, value enhancing investments
Always Looking Ahead
Driving shareholder value with strong earnings and cash flow as well as disciplined capital allocation
Driving Sustainable Enterprise Growth
6

Today’s Agenda
Topic Speaker
M i i i L t Sh h ld V l D D tMaximizing Long-term Shareholder Value Dave Denton
Driving Enterprise Growth in an Evolving Health Care Market Larry Merlo
Delivering Value Today, Ensuring Growth for Tomorrow Jon Roberts
Capitalizing on Growth Opportunities in Specialty Alan Lotvin
Changing the Face of Retail Pharmacy Through Innovation Helena FoulkesChanging the Face of Retail Pharmacy Through Innovation Helena Foulkes
Serving Patients Across the Continuum of Care Rocky Kraft
7

Appendixpp
Endnotes
1. Adj. EPS equals income before income tax provision plus amortization, less adjusted income tax provision, and other, which is comprised of earnings allocated to participating securities, divided by the weighted average diluted common shares outstanding.
2. Adj. EPS excludes a $521 million loss on early extinguishment of debt (approximately $0.27 per dil ted share) d ring 2014 and $52 million of acq isition related bridge financing costs and $147diluted share) during 2014, and $52 million of acquisition-related bridge financing costs and $147 million of acquisition-related transaction and integration costs during the nine months ended September 30, 2015. relating to the acquisition of Omnicare, Inc., and proposed acquisition of the pharmacies and clinics of Target Corporation. Adj. EPS also excludes any acquisition-related transaction and integration costs for the acquisition of Omnicare, Inc., and the proposed acquisition of the pharmacies and clinics of Target Corporation for the period from October 1 2015 throughof the pharmacies and clinics of Target Corporation for the period from October 1, 2015 through December 31, 2015.
3. Free Cash Flow as net cash provided by operating activities less net additions to properties and equipment (i.e., additions to property and equipment plus proceeds from sale-leaseback transactions).
4 Adj EPS growth and Free Cash Flow are based on midpoints of 2015 guidance4. Adj. EPS growth and Free Cash Flow are based on midpoints of 2015 guidance.5. Client retention rate is defined as: 1 less (projected 2016 lost revenues from known terminations
occurring after January 1, 2015, divided by estimated 2016 PBM revenues) expressed as a percentage. Both terminations and PBM revenues exclude the individual PDP business.
6. The following trademarks appear throughout the 2015 Analyst Day presentations: : , CVS Health CVS/caremark Omnicare CVS/Omnicare CVS/specialty CVS/caremark CVSCVS Health, CVS/caremark, Omnicare, CVS/Omnicare, CVS/specialty, CVS/caremark, CVS, Maintenance Choice, Coram, Navarro, Novologix, Omniview, MyOmniview, CVS/minuteclinic, Health Engagement Engine, Accordant, RX Insights, ScriptSync, MinuteClinic and Specialty Connect. They are trademarks or registered trademarks of CVS Pharmacy, Inc.
9

Maximizing Long-termMaximizing Long term Shareholder Value
Dave DentonExecutive Vice President &Chief Financial OfficerChief Financial Officer

Non-GAAP Financial Measures
Free Cash Flow and Cash Available forEnhancing Shareholder Value Adjusted Earnings per Share
Income before income tax provision
+ Amortization
Net cash provided by operating activities
Enhancing Shareholder Value
+ Amortization
- Adjusted income tax provision
- Earnings allocated to participatingsecurities
- Additions to property andequipment
+ Proceeds from sale-leasebacks securities
÷ Weighted average diluted sharesoutstanding
Adj d i h
Free cash flow
+/- Change in net debtAdjusted earnings per shareCash available for enhancing
shareholder value
Note:1. CVS Health finances a portion of its store development program through sale-leaseback transactions. Use of sale-leaseback financing is subject to change
as a variety of financing vehicles for future development are evaluated. This may also result in changes to CVS Health’s definition of free cash flow.
2

Agenda
Strong Record of ExecutionStrong Record of ExecutionStrong Record of ExecutionStrong Record of Execution
Marketplace MisconceptionsMarketplace Misconceptions
Looking Ahead: 2016 Guidance Review
Driving Sustainable Enterprise Growth
Looking Ahead: 2016 Guidance Review
Driving Sustainable Enterprise Growth
3

Continuing Focus on Enhancing Shareholder Value
Productive Generating Si ifi t Optimizing
Long-term Growth
SignificantFree Cash
Flow
Op gCapital
Allocation
EnhancedEnhancedShareholder Value
4

Our Leadership in Multiple Competencies Continued to Drive Shareholder Value in 2015
• Driving top- and bottom-line results through an
Continued to Drive Shareholder Value in 2015
Revenues and
• Delivering Adjusted EPS at high end of initial targets
• Driving top- and bottom-line results through an enterprise focus
Revenues and Operating Profit
Earnings per Share • 1¢ accretion from Omnicare acquisition and new debt
• Generating substantial free cash flow
Earnings per Share
Free Cash Flow
• Returning more than $6 billion to shareholders through dividends and share repurchasesShareholder Value
5
Note:1. Earnings per share excludes acquisition-related bridge financing, transaction and integration costs.

2015 Guidance Reaffirmed
Full-year 2015
Net Revenue Growth 9.75% to 10.25%
Adjusted EPS FromContinuing OperationsYear-over-year Growth
$5.14 to $5.1814.25% to 15.25%Year-over-year Growth
Free Cash Flow $5.9 to $6.2 billionFree Cash FlowYear-over-year Growth
$ $Down 4% to 10%
Notes:Notes:1. Excludes acquisition-related bridge financing, transaction and integration costs.2. Excludes $521 million loss on early extinguishment of debt recognized in 2014.3. Free cash flow in 2014 was approximately $500 million above goal due to receipt of some early payments from CMS, benefiting 2014 and to the detriment of 2015.
6
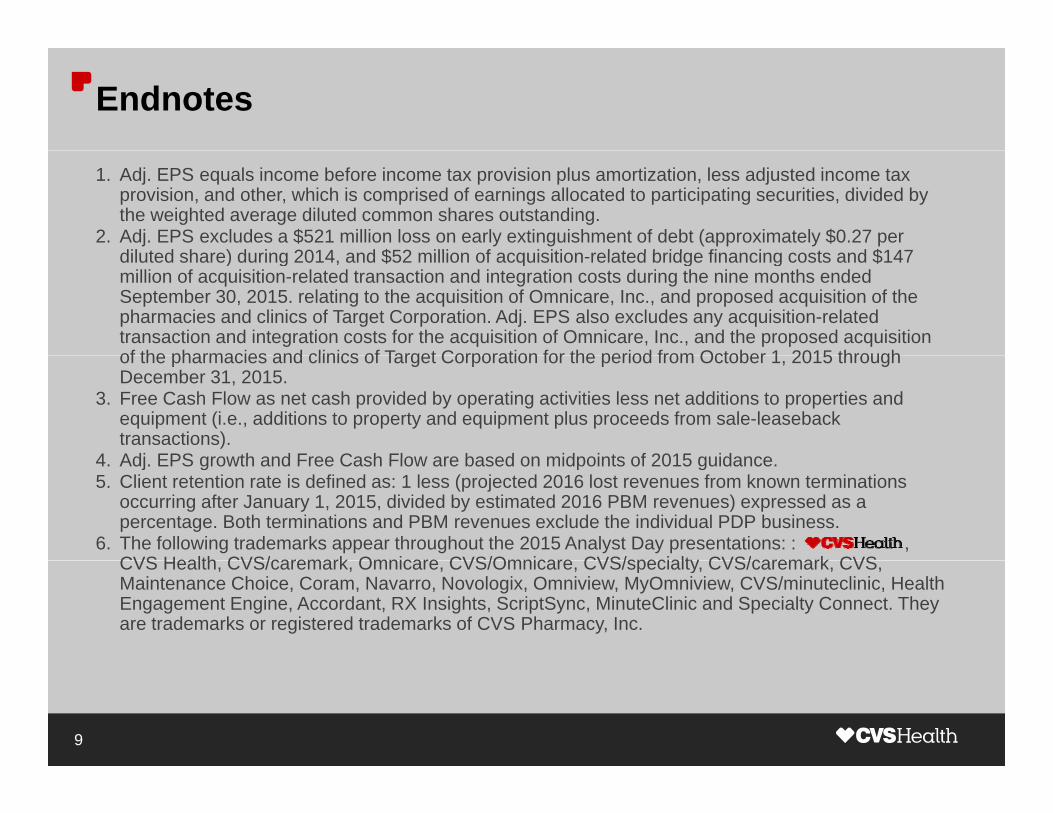
Original Steady State TargetsEnterprise Growth Model from 2010
Five-year CAGR2010 - 2015
Net Revenue
Operating Profit
8% to 11%
8% to 10%Operating Profit
Adjusted EPS From Cont Ops
8% to 10%
7% to 9%
Average Annual Cash Available For Enhancing Shareholder Value
$5.5 billionto
$6.5 billion
Share Repurchase Contribution
Total Adjusted EPS
$
3% to 6%
10% to 15%
7
Total Adjusted EPS 10% to 15%
* Cash available for enhancing shareholder value = Free cash flow +/- change in net debt
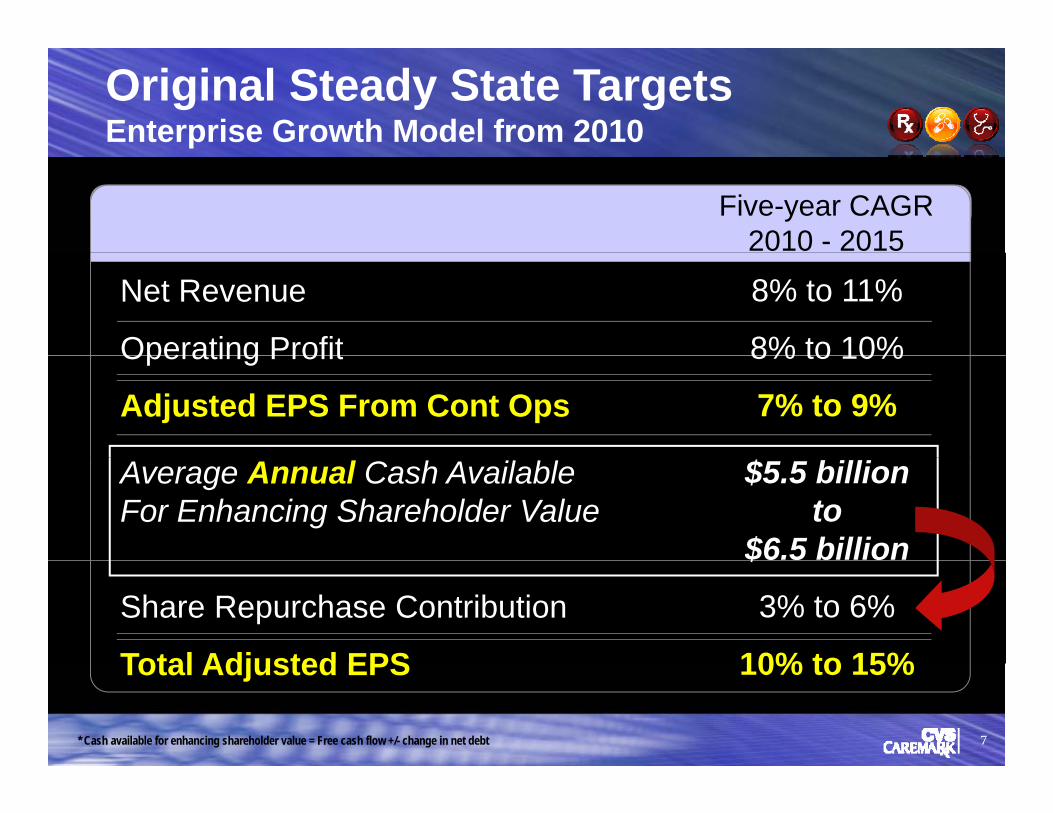
Enterprise Expansion Has Happenedas Originally Targetedas Originally Targeted
Operating Profit($, billions)
Adjusted EPS($) 5 189 8
10% 14%
5.18to
5.149.8to
9.7
10%CAGR
14%CAGR
6.12.68
Growth at higher end of original long-term targets
2010 2011 2012 2013 2014 2015E 2010 2011 2012 2013 2014 2015E
Note:1. CAGRs use midpoint of 2015 guidance range.
8

Strategic Capital Deployment with Acquisitions of Omnicare and Target Pharmacies and ClinicsOmnicare and Target Pharmacies and Clinics
OMNICARE TARGET
• Brings a new pharmacy dispensing channel to CVS as the leading provider of
• Enhances network and relevance of CVS Health’s integrated offeringsg p
pharmacy services to long-term care facilities
• CVS + Omnicare enhances
g g
• Enables Target guests to participate in unique CVS programs (e.g., Maintenance
ability to provide continuity of care for patients
• Complementary specialty
p g ( g ,Choice, Specialty Connect)– Provides convenience and
cost savings to consumers p y p ybusiness will augment our capabilities
and payors– Other pharmacies cannot
replicate what CVS provides
9

Well-laddered Debt Maturities Remain Core to Strong Balance SheetStrong Balance Sheet
Debt Maturity Profile (Bonds)($, billions)
1.71.2 1.1 1.3 1.2
0.5 0.6
1.31.0
0.50.7 0.5 0.8
2016 2017 2018 2019 2020 2021 2022 2023 2024 2027 2039 2041 2043
10

Well-laddered Debt Maturities Remain Core to Strong Balance SheetStrong Balance Sheet
Debt Maturity Profile (Bonds)($, billions)
3.53.2 3.2 3.0
3.5
2.0
1.2 1.1 1.2
0.6
1.31.0
0.50.7 0.5 0.8
Balance sheet remains healthy with addition of $15 billion of senior notes
2016 2017 2018 2019 2020 2021 2022 2023 2024 2025 2027 2035 2039 2041 2043 2045
y $
11

Committed to Maintaining a Healthy Balance Sheet
As expected new debtAdjusted Debt-to-EBITDA
3.2
3.4
As expected, new debt increased leverage ratio above target of 2.7X3.30
2.8
3.0• Committed to returning to a
leverage ratio at target
– Driven mostly by strong EBITDA Target = 2.70
2.94
2 2
2.4
2.6 growth
– Will also pay down debt with upcoming maturities
2.66
2.392.2'13 '14 '15E '16E
2.39
Focused on maintaining high BBB credit ratingNote:1. Figures shown are as of the end of the fourth quarter for each respective year and do not include bridge financing, transaction and integration costs
associated with the acquisitions of Omnicare and the pharmacies and clinics of Target.
12

$41 Billion Available to Enhance2014 Through 2018 Returns2014 Through 2018 Returns
($8) $10~$39billion
~$31
($8)billion
$41$10billion
$31billion billion
Operating Cash Flow Net Capex Free
Cash FlowIncremental Debt
Cash Available
13

Efficient Cash Deployment 2014 Through 2018
Cash Available for Enhancing Shareholder g
Value
$41 billion
Dividends
Target payout ratio
Return on Invested Capital
Share Repurchases
of 35% by 2018
~18% implied dividend CAGR
Drive ROIC with value-enhancing
projects
$4 billion to $5 billion per year
Value creating
14

~$23 Billion Available for Returns in 2014 and 2015
Effective allocation of cash available in ‘14 and ‘15 through:
Cash Available & Capital Allocation ($, billions)g
• 56% increase of annual dividend– Payout ratio estimated to be nearly
29% at year endShare
h
22.9
9.0
23.8
29% at year-end
• Target and Omnicare acquisitions consistent with growing core and Acquisitions
repurchases9.0
12 0broadening base
• Expect to complete a total of $9 billion of repurchases by year-end
Dividends
Acquisitions
2.9
12.0
Cash Available Capital Allocatedbillion of repurchases by year end
~ $24 billion of deployed capital 2014 and 2015
Note:1. Cash available = Free cash flow plus increase in debt. 2. Acquisitions are shown net of cash acquired. 3. Figures may not foot due to rounding.
15

Solid History of Enhancing Returns Using All Three Pillars for Efficient Cash Deployment Pillars for Efficient Cash Deployment
Annual Dividendper Share
($)
ShareRepurchases
($ )
Acquisitionsand Ventures
1.40
29%CAGR
($)
5 0
$20bTotal
($, billions)Apr ’12
HealthNetPDP
Apr ’11
Universal American
PDP
0.650.90
1.101.40
3.0
4.3 4.0 4.05.0
Jan ’14
Coram
Feb ’13
DrogariaOnofre
Mar ’13
NovoLogix
0.500.65
Aug ’15
Omnicare
Jul ’14
Red Oak S i
Sep ’14
Navarro
'11 '12 '13 '14 '15E '11 '12 '13 '14 '15ESourcing
Deployment of capital in line with long-term targets
16
p y p g g

2016 Capital Deployment to IncludeDividend Increase and Further Repurchases
• Increasing 21%
Dividend Increase and Further Repurchases
2016 Annual • Increasing 21%,from $1.40 to $1.70
Dividend
$1 70$1.702016 Share Repurchases
$4billion
• Currently $7.7 billion authorized and remaining from 2014 share repurchase program billionrepurchase program
More than $5 billion expected to be returned to shareholders in 2016
17
$ p

Agenda
Strong Record of ExecutionStrong Record of Execution
Marketplace MisconceptionsMarketplace MisconceptionsMarketplace Misconceptions
Looking Ahead: 2016 Guidance Review
Marketplace Misconceptions
Driving Sustainable Enterprise Growth
Looking Ahead: 2016 Guidance Review
Driving Sustainable Enterprise Growth
18

MYTH #1
ALL SPECIALTY PHARMACIES AREPHARMACIES ARE SIMILAR IN PRACTICE TOSIMILAR IN PRACTICE TO THE CAPTIVE “SPECIALTY” PHARMACIES THATPHARMACIES THATHAVE COME UNDER RECENT SCRUTINY
19

FACT #1
TRUE SPECIALTY PHARMACIES LIKEPHARMACIES LIKE CVS/SPECIALTY HAVECVS/SPECIALTY HAVEA DIFFERENT BUSINESS MODEL THAN THESE CAPTIVECAPTIVEPHARMACIES
20

Misconceptions in Marketplace Are Creating NoiseFACT #1: CVS/specialty Is Different
• These captive pharmacies are NOT specialty pharmaciesD i t j it f h l f f t
p y
– Derive vast majority of pharmacy volume from one manufacturer– Many don’t dispense specialty medications– Attempting to circumvent cost-saving solutions our clients have adopted
• To best manage access and cost, CVS/caremark determines which pharmacy is eligible to be an in-network provider
T i t h i lik th h f li– Terminate some pharmacies like these each year for non-compliance
• In contrast, CVS/specialty provides high-touch care to patients with complex specialty conditions requiring costly drug therapiescomplex specialty conditions requiring costly drug therapies– Extensive clinical services help to ensure proper adherence, better
health outcomes and lower trend
21

MYTH #2
THE RxCROSSROADSBUSINESS COULD BE ABUSINESS COULD BE A BIG RISK FOR CVSBIG RISK FOR CVS HEALTH GIVEN THATIT IS AT ODDS WITH CLIENTS’CLIENTSOBJECTIVES
22

FACT #2
THE RxCROSSROADSBUSINESS IS ALIGNEDBUSINESS IS ALIGNED WITH OUR FOCUS ONWITH OUR FOCUS ON COST, QUALITY AND ACCESS, AND IS IMMATERIAL TO OURIMMATERIAL TO OUR FINANCIAL RESULTS
23

Misconceptions in Marketplace Are Creating NoiseFACT #2: RxCrossroads Is Aligned
• RxCrossroads follows CVS Health’s philosophy of:C t lli t d tili ti f li t
g
– Controlling costs and utilization for our clients– Promoting better health outcomes for the patients we serve– Promoting access to appropriate prescription medication
• Patient assistance programs provide help to underinsured and uninsured patients who can’t afford drugs
• RxCrossroads is immaterial to CVS Health’s overall financial results– Analyzed as part of due diligence effortsy p g– Contributes less than 1¢ to earnings per share
24

MYTH #3
ALWAYS PARTICIPATE IN PREFERRED NETWORKSPREFERRED NETWORKS FOR OPTIMAL SUCCESSFOR OPTIMAL SUCCESS IN MEDICARE PART D
25

FACT #3
NOT ALL MEDICARE PART D NETWORKSPART D NETWORKSARE CREATED EQUAL …ARE CREATED EQUAL … FINANCIAL DISCIPLINEIS REQUIRED
26

Misconceptions in Marketplace Are Creating NoiseFACT #3: Med D Networks Are Not Equal
• In preferred networks, plan designs must offer pharmacies enough share gain to more than offset reduced margins
q
share gain to more than offset reduced margins– Significant incentive must be offered to patients to switch pharmacies
• Key areas of consideration with Med D networks:– Mix of lives important as some don’t experience any co-pay differential– Co-pay differential not always large enough to incent patients
• Will not participate in Aetna’s preferred Med D network for 2016• Will not participate in Aetna s preferred Med D network for 2016– Share gains won’t offset margin loss– Don’t expect to lose significant share; impact expected to be immaterial
• We participate in networks that make economic sense– Expect to have a significant presence in preferred Med D networks in
2016
27

MYTH #4
UNDERLYING GROWTHIN EACH SEGMENT ISIN EACH SEGMENT IS WHAT ULTIMATELYWHAT ULTIMATELYFUELS THE CVS HEALTH VALUE-CREATION ENGINEENGINE
28

FACT #4
CVS HEALTH’SSUCCESS WILL BESUCCESS WILL BE DRIVEN BY ENTERPRISEDRIVEN BY ENTERPRISE GROWTH … SOMETIMES AT THE EXPENSE OFONE OF THEONE OF THESEGMENTS
29

Misconceptions in Marketplace Are Creating NoiseFACT #4: Enterprise Growth Drives Success
• Critical to focus on enterprise growth
p
• Unique offerings are aligned across the company in support of the enterprise growth strategy
F l S i lt C t hift i t ll ll i lt l d– For example, Specialty Connectshifts virtually all specialty volume and growth to the PBM
• We are indifferent to channel and manage the business through an enterprise lens
30

Agenda
Strong Record of ExecutionStrong Record of Execution
Marketplace MisconceptionsMarketplace Misconceptions
Looking Ahead: 2016 Guidance ReviewLooking Ahead: 2016 Guidance Review
Driving Sustainable Enterprise Growth
Looking Ahead: 2016 Guidance ReviewLooking Ahead: 2016 Guidance Review
Driving Sustainable Enterprise Growth
31

2016 Guidance: Healthy Enterprise Growth
Full-year 2016
Net Revenue Growth 17.0% to 18.5%
Adjusted EPSYear-over-year Growth
$5.73 to $5.8811.25% to 14.25%
GAAP Diluted EPS $5.28 to $5.43
Notes:1. EPS growth estimates exclude acquisition-related transaction and integration costs.2 Year-over-year growth based on midpoint of 2015 guidance2. Year over year growth based on midpoint of 2015 guidance.3. Estimates assume that the acquisition of Target’s pharmacies and clinics closes at year-end 2015.4. EPS estimates assume completion of approximately $4 billion in share repurchases in 2016.5. EPS estimates include dilution of $0.01 in 2016 related to the termination of pension plans. The impact on 2017 is expected to be between $0.10 and $0.15.
32

2016 Guidance: Substantial Free Cash Flow … Growth Impacted by AcquisitionsGrowth Impacted by Acquisitions
Full-year 2016in billions
Operating Cash Flow $7.6 to $7.9
Gross Capital Expenditures ($2.6) to ($2.5)Sale-leaseback Proceeds $0.3 to $0.2
Net Capital Expenditures Approximately ($2.3)
Free Cash FlowYear-over-year Growth
$5.3 to $5.6Down 7% to 12%
Notes:1. Year-over-year growth based on midpoint of 2015 guidance.2 Estimates assume that the acquisition of Target’s pharmacies and clinics closes at year-end 20152. Estimates assume that the acquisition of Target s pharmacies and clinics closes at year-end 2015.3. Guidance includes approximately $500 million of cash outflows from acquisition-related transaction and integration expenses. 4. CVS Health finances a portion of its store development program through sale-leaseback transactions. Use of sale-leaseback financing is subject to change
as a variety of financing vehicles for future development are evaluated. This may also result in changes to CVS Health’s definition of free cash flow.
33

Healthy Enterprise Growth Expected to Continue
Operating Profit($, billions)
Adjusted EPS($)10.8
10%CAGR
14%CAGR
5.88to
5.73
10.8to
10.5
CAGR CAGR
8.0 3.96
2016 growth expected to be within or above target ranges
2013 2014 2015E 2016E 2013 2014 2015E 2016E
Notes:Notes:1. CAGRs are calculated using 2016E midpoint of guidance range.2. Excludes a $72 million gain from a legal settlement recognized in 2013. Excludes a $521 million loss on early extinguishment of debt during 2014. Excludes
acquisition-related bridge financing, transaction and integration costs in 2015 and 2016E (related to Omnicare and Target).
34

2016 Guidance: Strong Growth in Retail/LTC
Full-year 2016
Net Revenue Growth 14.25% to 15.5%
Same store sales 2.75% to 4.0%Same store salesSame store adjusted scripts
5% to 0%3.5% to 4.5%
Gross Profit Margin Significant declineg g
Operating Expense (% of revenue) Moderate improvement
Operating Profit Growth 6 25% to 8 25%Operating Profit GrowthOperating Profit Margin
6.25% to 8.25%Down 60 bps to 70 bps
Notes:1. Year-over-year growth based on midpoint of 2015 guidance.2. Same store sales and prescriptions exclude revenues from MinuteClinic®, and revenue and prescriptions from stores in Brazil, LTC operations and from
commercialization services.3 Same store adjusted scripts includes the adjustment to convert 90-day prescriptions to the equivalent of three 30-day prescriptions This adjustment reflects3. Same store adjusted scripts includes the adjustment to convert 90-day prescriptions to the equivalent of three 30-day prescriptions. This adjustment reflects
the fact that these prescriptions include approximately three times the amount of product days supplied compared to a normal 30-day prescription.4. Estimates assume that the acquisition of Target’s pharmacies and clinics closes at year-end 2015.5. Expectations exclude acquisition-related transaction and integration costs.
35

2016 Guidance: Even Stronger Growth in PBM
Full-year 2016
Net Revenue Growth 20.25% to 21.75%
Total Adjusted Claims 1.33 billion to 1.35 billion
Gross Profit Margin Moderate decline
Operating Expense (% of revenue) Modest improvementOperating Expense (% of revenue) Modest improvement
Operating Profit GrowthOperating Profit Margin
9.75% to 13.25%Down 25 bps to 35 bps
Notes:1 Year-over-year growth based on midpoint of 2015 guidance
Healthy enterprise growth in 2016
1. Year-over-year growth based on midpoint of 2015 guidance.2. Total adjusted claims includes the adjustment to convert 90-day, mail choice claims to the equivalent of three 30-day prescriptions. This adjustment reflects
the fact that these prescriptions include approximately three times the amount of product days supplied compared to a normal 30-day prescription.3. Expectations exclude acquisition-related transaction and integration costs.
36

Key Drivers of 2016 Expectations
• Reimbursement/pricing pressure andtiming of share gainstiming of share gains
• Growth in Specialty a plus
• Mix of business pressures margins
• Net benefit of Omnicare and Target assets
• Smaller incremental benefit from break-open generics
• Smaller incremental benefit from Red Oak Sourcing
37

Mix of Business Lowers Gross Margin %, but Drives Volumes and Gross Profit $ Over Time
• At enterprise level, lower-margin PBM segment is growing faster than Retail/LTC segment
Drives Volumes and Gross Profit $ Over Time
than Retail/LTC segment
• Multiple mix-driven impacts compressing underlying gross margins within underlying retail business:within underlying retail business:
– Pharmacy growth is expected to continue to outpace front store growth
– Medicare and Medicaid are becoming larger components of the patient g g p pmix; Lower margin rate and dollars per scripts, but higher margins per life due to higher utilization
– The mix of third party payors is also adversely changing in 2016y y y g g
38

Acquisitions Expected to Help Fuel Growth
• Omnicare expected to deliver ~20¢ to Adjusted EPS in 201619¢ i t ll ti– ~ 19¢ incrementally accretive year-over-year
– Includes associated financing and excludes amortization and integration expenses
• ~6¢ of Adjusted EPS dilution expected from Target in 2016– ~9¢ of dilution from reduced 2015 share repurchase and financing – ~3¢ of accretion from operation of assets, excluding amortization ¢ p g
and integration expenses– Pharmacies and clinics expected to be fully integrated and
rebranded within six to eight months– Significant purchasing synergies through Red Oak beginning in ‘16
• Fewer new store and clinic openings planned in 2016 as Target assets are integrated g
39

While the Level of Generic Introductions Ebbsand Flows Over Time …and Flows Over Time …
E t i fit thEnterprise profit growthwill continue to benefit
f ifrom generics
40

Generics Drive Financial Performance at CVS Health in Two WaysHealth in Two Ways
Brand-to-genericconversion
Increasingly effective sourcing of generics in CVS Health’s existing
base of business
41

Generics Remain an Opportunity1
Total Brand Market Sales of Expected Generic Launches($, billions)
16
23.9
17 3Abilify
16.5 17.3
Celebrex
Diovan
Nexium
Copaxone
Namenda
Crestor
Gleevec
5.53.6
Lovaza Zetia
Seroquel XRViagra
Cialis
2014 2015E 2016E 2017E 2018E
$26.4 billion Expected$40.4 billionNote:Note:1. 2014 includes all actual launches; 2015E forward includes all actual launches and only expected launches in total brand numbers whose annual sales exceed
$100M (key launches highlighted) and assumes 6 months pediatric extension on all launches. Forward-looking analysis assumes no “at risk” launches.Source: IMS Health; company estimates.
42

Incremental Break-open Benefit in 2016Less Than 2015
1
Less Than 2015
Total Brand Market Sales of Expected GenericLaunches in Break-open Periodp
($, billions)
8.7
14.4 15.5
11.1
5.0
2014 2015E 2016E 2017E 2018E
Notes:1. Break-open period for generic launches = 12 months from the point at which there are 3+ viable suppliers in the market (may span 2 calendar years), and
includes significant, “budgeted launch” products only. Brand market sales are at the time of first generic launch; break-open dates on the 15th or later were rounded to next full month; dates before the 15th credited for that monthrounded to next full month; dates before the 15th credited for that month.
2. 2014 includes all actual launches; 2015E forward includes all actual launches and only expected launches in total brand numbers whose annual sales exceed $100M and assumes 6 months pediatric extension on all launches. Forward-looking analysis assumes no “at risk” launches.
Source: IMS Health; company estimates.
43

Biosimilars Represent an AdditionalOpportunity
1
Opportunity
Total Market Sales($, billions)
19.5Total brand market sales ofexpected generic launchesin break open period
Total market sales of specialtydrugs losing exclusivity
8.7
14.4 15.5
11.1
in break-open period
5.0
Notes:1. Break-open period for generic launches = 12 months from the point at which there are 3+ viable suppliers in the market (may span 2 calendar years), and
includes significant, “budgeted launch” products only. Brand market sales are at the time of first generic launch; break-open dates on the 15th or later were rounded to next full month; dates before the 15th credited for that month
2016E – 2019E2014 2015E 2016E 2017E 2018E
rounded to next full month; dates before the 15th credited for that month.2. 2014 includes all actual launches; 2015E forward includes all actual launches and only expected launches in total brand numbers whose annual sales exceed
$100M and assumes 6 months pediatric extension on all launches. Forward-looking analysis assumes no “at risk” launches.Source: IMS Health; company estimates.
44

With Incremental Generic Benefits Declining, Biosimilars Will Become a Bigger Opportunity
1
• Biosimilars are expected to act more like brands than generics
Biosimilars Will Become a Bigger Opportunity
Total Market Sales of Specialty Drugs brands than generics
• Expected to increase competition in specialty categories 19.5
Losing Exclusivity($, billions)
• Expected to present opportunities for formulary strategies
– Lower cost for payors we support– Incremental margin opportunities for the
enterprise
Well-positioned to benefit from biosimilars
2016E – 2019E
45

Red Oak Sourcing to Add Smaller IncrementalValue in 2016 But Opportunity Remains
2
Venture with Cardinal Health continues to provide value to CVS Health in three ways:
Value in 2016 But Opportunity Remains
Venture with Cardinal Health continues toprovide value to CVS Health in three waysHealth in three ways:
• Fixed quarterly payments from Cardinal Health … $25.6 million per quarter
provide value to CVS Health in three ways
q– $75 million incremental benefit in 2015; neutral impact year-over-year
in 2016
• Additional milestone payments from Cardinal Health• Additional milestone payments from Cardinal Health– $20 million received in 2015; FY16 assumes $60 million
• Scale benefit from significantly higher combined volumes – Greatest marginal benefit recognized in 2014 and 2015 with initial bolus,
but opportunity remains
46

Combined Procurement Has Grown 50%Since Inception of Red Oak Sourcing
2
Relative Dollar Amount of Generics Procured Using Red Oak
Since Inception of Red Oak Sourcing
• Red Oak is the largest generic sourcing entity in the U Ssourcing entity in the U.S.
• Generic volumes sourced by Red Oak continue to grow
~50%
A i iti• Scale matters … incremental
value continues to be derived from additional volume Red Oak
Acquisitions
CardinalHealth
YE 2013 YE 2015
• More sophisticated procurement
• Introduce competition in f
CVSHealth
moleculesIncreasingly effective generic sourcing will add incremental value
Notes:1 Underlying data is not adjusted for any market activity (e g generic launches generic break opens)
proforma
47
1. Underlying data is not adjusted for any market activity (e.g., generic launches, generic break opens).2. Acquisitions include the generic volumes of Omnicare, the Target pharmacies and Cardinal Health’s acquisition of Harvard Drug Group before accounting for
any synergies derived from being added to Red Oak Sourcing.Source: CVS Health and Red Oak Sourcing estimates.

2016 Earnings Growth Significantly Back-half WeightedWeighted
EARNINGS GROWTHEARNINGS GROWTH
TIMING FACTORS
L dGeneric introductions / break-opens
TIMING FACTORSTIMING FACTORS
Leap day
Easter Shift benefits Q1to the detriment of Q2
Medicare Part D
Front store strategies’ benefits
Share repurchases
Tax rate
1st
2nd
Half
1Half
48

2016 Q1 Guidance: Challenging EPS Growth Due to Timing FactorsTiming Factors
Q1 2016
Net Revenue Growth 17% to 18.5%
Adjusted EPSYear-over-year Growth
$1.14 to $1.17Flat to up 3.0%p
GAAP Diluted EPS $1.03 to $1.06
Notes:Notes:1. EPS estimates exclude acquisition-related transaction and integration costs.2. Estimates assume that the acquisition of Target’s pharmacies and clinics closes at year-end 2015.3. EPS estimates assume completion of approximately $4 billion in share repurchases during full-year 2016.
49

Agenda
Strong Record of ExecutionStrong Record of Execution
Marketplace MisconceptionsMarketplace Misconceptions
Looking Ahead: 2016 Guidance Review
Driving Sustainable Enterprise Growth
Looking Ahead: 2016 Guidance Review
Driving Sustainable Enterprise GrowthDriving Sustainable Enterprise GrowthDriving Sustainable Enterprise Growth
50

Steady State Targets Affirmed
Five-year CAGR (2013-2018)
Net Revenue Growth 9% to 13%
Operating Profit Growth 7% to 9%Operating Profit Growth 7% to 9%
Preliminary Adjusted EPS Growth 6% to 8%
Average Annual Cash Available for Enhancing Shareholder Value Approximately $8 billion
Share Repurchase Contribution 4% to 6%Share Repurchase Contribution 4% to 6%
Final Adjusted EPS Growth 10% to 14%
51

Capital Allocation Priorities Guide Use of Cash
Operational InvestmentsOrganic Growth• Store growth and remodelsp Sto e g o t a d e ode s• Continued technology improvements
Capital StructureMaintain capital structure• Credit rating of BBB+
G l f 2 7X Adj t d D bt t EBITDA• Goal of 2.7X Adjusted Debt-to-EBITDA
Capital Returned to
Dividends• 18% target CAGR 2014 through 2018• 35% target payout ratio by the end of 2018Capital Returned to
Shareholders35% target payout ratio by the end of 2018
Repurchase stock• Take advantage of share valuation, absent more attractive
alternatives
External Investment ‘Bolt-on’ acquisitions in core businesses• Minimum risk-adjusted return hurdle in mid teens
52

Many Initiatives You’ll Hear About Today to Continue to Drive Enterprise Profit GrowthContinue to Drive Enterprise Profit Growth
Health plans represent significant opportunity to drive valueand capture share, whether or not we’re the PBM
Our specialty business has unmatched assetsand continues to outpace the market
Target and Omnicare acquisitions enable pharmacyTarget and Omnicare acquisitions enable pharmacyshare gains
Near-term opportunities to gain retail share frommarket disruptionmarket disruption
Low-cost provider status expected to help drive share
Strategic acquisitions will continue to supplement growth
Opportunities remain within generics, Red OakSourcing and biosimilars
53
Strategic acquisitions will continue to supplement growth

The Right Strategy for an Evolving Health Care Market
Capturing significant share of new prescriptionsDemonstrating ValueAbility to pivot and provide value as market evolvesto People, Payors and Providers
Driving business decisions with enterprise mindsetGrowing the Core, Acquisitions delivering growth into new channels
g ,Broadening the Base
Best positioned to grow with unique assetsAlways Looking Best positioned to grow with unique assets
Growth algorithm remains strongAlways Looking
Ahead
Solid long-term growth targets and substantial cash
Optimizing capital allocation to drive shareholder valueDriving Sustainable Enterprise Growth
Maximizing Long-term Shareholder Value

Appendixpp
, CVS Caremark, Omnicare, CVS/specialty, CVS/caremark, CVS, Maintenance Choice, Coram, Navarro, Novologix, Omnicare, and Specialty Connect are trademarks or registered trademarks of CVS Pharmacy, Inc.

2016 Guidance: Consolidated Income Statement
Full-year 2016
Corporate Segment Expense $860 million to $870 million
Intercompany Eliminations(% f bi d t ) ~ 11.6%(% of combined segment revenues)
Gross Profit Margin Significant decline
Operating ExpenseOperating Expense(% of consolidated revenue) Moderate improvement
Operating Profit Margin Down 40 bps to 50 bps
Notes:1. Year-over-year growth based on midpoint of 2015 guidance.2. Expectations exclude acquisition-related transaction and integration costs.
56

2016 Guidance: Consolidated Income Statement
Full-year 2016
Net Interest Expense $1.13 billion to $1.14 billion
Effective Tax Rate ~ 39.0%
Weighted Average Shares ~ 1.08 billion
Consolidated Amortization ~ $800 millionConsolidated Amortization ~ $800 million
Consolidated Depreciation & Amortization ~ $2.5 billion
Notes:Notes:1. EPS estimates assume completion of approximately $4 billion in share repurchases in 2016. Timing of repurchases are expected to be weighted more in the
first half of the year rather than the second half.2. Expectations exclude acquisition-related transaction and integration costs.
57

2016 Q1 Guidance: Segment Performance Reflects Impact of Timing FactorsImpact of Timing Factors
Q1 2016
l/LTC
Net Revenue Growth 19% to 20.5%
Same store sales 4.5% to 6.0%
Ret
ai Same store adjusted scripts 4.75% to 5.75%
Operating Profit Growth 5.0% to 7.0%
arm
acy
rvic
es Net Revenue Growth 18% to 19.25%
Pha
Se Operating Profit Growth Flat to up 4.0%Notes:1. Same store sales and prescriptions exclude revenues from MinuteClinic, and revenue and prescriptions from stores in Brazil, LTC operations and from
commercialization services.2 Same store adjusted scripts includes the adjustment to convert 90-day prescriptions to the equivalent of three 30-day prescriptions This adjustment reflects2. Same store adjusted scripts includes the adjustment to convert 90-day prescriptions to the equivalent of three 30-day prescriptions. This adjustment reflects
the fact that these prescriptions include approximately three times the amount of product days supplied compared to a normal 30-day prescription.3. Estimates assume that the acquisition of Target’s pharmacies and clinics closes at year-end 2015.4. Operating profit growth estimates exclude acquisition-related transaction and integration costs.
58

Steady State Targets:Key Assumptions to Keep in MindKey Assumptions to Keep in Mind
Anticipated Impact
F bl i d t d hi Utili tiFavorable industry demographics Utilization
Generic pipeline Gross margin
Utilize compelling scale Gross marginUtilize compelling scale Gross margin
Retail share gains / SG&A leverage Operating profit
Net-new PBM contracts Mix/volume/livesNet new PBM contracts Mix/volume/lives
Innovative products and technology Volume/lives
High-return, bolt-on acquisitions Operating profitHigh return, bolt on acquisitions Operating profit
Increased compliance requirements / regulations Gross margin
Pharmacy pricing / reimbursement trends Gross margin
59

Driving EnterpriseDriving Enterprise Growth in an Evolving Health Care Market
Larry MerloPresident &Chi f E ti OffiChief Executive Officer

Agenda
Our Compelling Value PropositionOur Compelling Value PropositionOur Compelling Value PropositionOur Compelling Value Proposition
Evolving Health Care Market Creates OpportunitiesEvolving Health Care Market Creates Opportunities
Strategic Framework for Long-term Enterprise GrowthStrategic Framework for Long-term Enterprise Growth
2

The Most Extensive Suite of Leading Assets …
Retail MailMailLong-term
CareRetailClinics
Specialty
Infusion
Clinics
Clinical Programs
Patients Medical Claims
Digital
g
Payors ProvidersClaims Editing
… enabling us to help deliver superior outcomes at a lower cost
3

Continue to Build One-of-a-kind Health Care Company with Unmatched Integrated AssetsCompany with Unmatched Integrated Assets
: Our Competitive Edge
Only company with the ability to impact patients, payors and providers with innovative, channel-agnostic solutions
Broadest capabilities to holistically manage patients inBroadest capabilities to holistically manage patients infast-growing specialty market
Unparalleled scale in the U.S. makes us a low-cost provider
Largest retail clinic operator in U.S. with 28 million patient visits to date
D li i l ti d i i ht th t iDeep clinical expertise and insights across the enterpriseenable us to help deliver superior outcomes at a lower cost
Leading provider of pharmacy services in long-term care
4
g p p y g

Pharmacy Is Our Focus and We’ve Captured 39% of Past 5-Year Prescription Growthof Past 5 Year Prescription Growth
Total U.S. Rx Industry(Rx dispensed, billions)
5.5~710Mnew Rx
4.8
2010 2015E
5
Note:1. All prescriptions dispensed on a 30-day equivalent basis. Does not include Omnicare.Source: IMS data, CVS Health Internal Analysis.

Pharmacy Is Our Focus and We’ve Captured 39% of Past 5-Year Prescription Growthof Past 5 Year Prescription Growth
Total U.S. Rx Industry(Rx dispensed, billions)
5.5 CVS Healthshare of
market growth275M
~710Mnew Rx
4.8
market growth
39%
2010 2015E
Gaining share in a growing Rx industry
6
Note:1. All prescriptions dispensed on a 30-day equivalent basis. Does not include Omnicare.Source: IMS data, CVS Health Internal Analysis.

Prescription Growth Through Enterprise Channels Demonstrates Power of Unique, Integrated Model …Demonstrates Power of Unique, Integrated Model …
CVS/caremark Claims(Rx, millions)
9051,080 ~1,165
740905 Channel agnostic
offerings allow us to capture growth in
CVS/caremark claims
275 365 445 470
CVS/caremark claims while helping to drive
client savings
Notes:
2008 2011 2014 2015ECVS Health dispensed All other
Notes:1. CVS Health dispensed prescriptions include CVS/pharmacy, mail, CVS/specialty and Omnicare prescriptions across all years.2. CVS retail and mail prescriptions on a 30-day equivalent basis.3. 2015E is midpoint of guidance range.
7

… and Has Allowed Us to Capture 700 bps of Revenue Share, Equating to $7 BillionRevenue Share, Equating to $7 Billion
CVS/caremark Revenue($, billions)
70088
~100
$7
700 bpsincrease
=4459
$7 Billion
2008 2011 2014 2015E
48% 50% 53% 55%
Notes:
CVS Health share All other
Our outperformance in specialty is a key driver of revenue share gainsNotes:1. CVS Health share of CVS/caremark revenue equals CVS/caremark revenue dispensed through Enterprise channels (CVS/pharmacy, mail, CVS/specialty,
Omnicare) ÷ total CVS/caremark revenue.2. 2015E is midpoint of guidance range.
8

Agenda
Our Compelling Value Proposition
Evolving Health Care Market Creates OpportunitiesEvolving Health Care Market Creates Opportunities
Our Compelling Value Proposition
Evolving Health Care Market Creates OpportunitiesEvolving Health Care Market Creates Opportunities
Strategic Framework for Long-term Enterprise GrowthStrategic Framework for Long-term Enterprise Growth
9

Evolving Health Care Market Creates Opportunities
Demographics and Health Reform Continue to Transform the Market1 to Transform the Market
Specialty Growth Will Be Primary Driver of Pharmacy Trend
1
2
Retailization of Health Care Is Accelerating3
Increasing Focus on Outcomes4
5 Consolidation in the Health Plan Market5
10

Health Reform and Demographics Expanding Insured Population
1
Insured Population
Growth in U.S. Insured Lives(lives, millions)
1419 35286
306Individuals/Exchanges264
49 53 62
53 63 6514
Medicaid
Medicare
148 151 143 Employer-sponsored
2013 2015E 2019E
Medicare and Exchanges will be primary drivers
11
Source: CVS Health Internal Analysis; Medicare Trustees Report, 2015; Avalere Medicaid Model, September 2015; McKinsey MPACT 6.2, September 2014; CBO Public Exchange Estimates, March 2015; Accenture, 2015; Congressional Budget Office. Model assumes no additional Medicaid expansion in the 20 non-expansion states, further Medicaid expansion could improve long-term covered lives outlook. Figures may not foot due to rounding.

Aging U.S. Population Will Drive Prescription Utilization …
1
Utilization …
U.S. Population Aged 65+(lives, millions)
Retail Prescription Utilizationby Age Group
65.9
y g p(Rx per member per year)
+18Mlives
47.8
56.4 36.665+
16.219-64
2015E 2020E 2025E
4.10-18
Sources:1. U.S. Census Bureau.2. Utilization based on CVS/caremark book of business; all prescriptions on a 30-day equivalent basis; excludes Aetna.
12

… and Fuel Growth in Prescription Expenditures 1
U.S. Prescription Drug Expenditures($, billions)
464
5646.2%CAGR
328385
464
2015E 2018E 2021E 2024E
13
Source: CMS, Office of the Actuary, Prescription Drug Expenditures (figures as of July 30, 2015).

Pharmacy Is One of the Most Cost-efficient Ways to Manage Overall Health Care Costs
1
Ways to Manage Overall Health Care Costs
Healthcare Savings from Improved Adherence(PMPY)
Hyperlipidemia Diabetes Hypertension
$5,883 $5,676ROI9X ROI
9X
$3,311ROI5.5X
9X
($601) ($656) ($629)Added Rx spend Medical and productivity savings
14
Source: Roebuck MC, Liberman JN, Gemmill-Toyama M, Brennan TA. Medication adherence leads to lower health care use and costs despite increased drug spending. Health Affairs. 2011;30(1):91-99. Carls GS, Roebuck MC, Brennan TA, Slezak JA, Matlin OS, Gibson TB. Impact of medication adherence on worker productivity: an instrumental variables analysis in five chronic diseases. JOEM, 2012. Cholesterol savings from generic medications only.

CVS Health Can More Broadly Reach Patients Across the Continuum of Care
1
Across the Continuum of Care
CVS Health Standalone StandaloneCVS Health Retailer PBM
Retail pharmacy
Mail Order
Specialty/Infusion
LTC pharmacy
Retail clinics
Clinical programs
Channel connectivity
15

Growth in U.S. Population Over 85 Underscores Need for Long-term Care
1
Need for Long term Care
U.S. Population Aged 85+(lives, millions)
Omnicare is a leading pharmacy services provider to LTC facilities
11.9
• Nationwide footprint with leading positions in Assisted Living and Skilled Nursing facilities
~2X
6 37.5
g
• Ability to leverage clinical insights to improve care for patients
• CVS Health brings capabilities to6.3 CVS Health brings capabilities to better serve patients across the continuum of care
2015E 2025E 2035E
Source: U.S. Census Bureau.
16

Evolving Health Care Market Creates Opportunities
Demographics and Health Reform Continue to Transform the Market1 to Transform the Market
Specialty Growth Will Be Primary Driver of Pharmacy Trend
1
2
Retailization of Health Care Is Accelerating3
Increasing Focus on Outcomes4
5 Consolidation in the Health Plan Market5
17

Specialty Growth Will Be Primary Driver of Pharmacy Trend
2
Pharmacy Trend
Addressable Specialty Industry($, billions)
22014%CAGR
130
65
2012 2016E 2020E
18
Note:1. Addressable specialty industry currently excludes infused oncology.Source: NHE, Artemetrx, CVS Health Internal Analysis, 2015.

We Are Well-positioned as the Largest and Fastest-growing Specialty Pharmacy in the U.S. …
2
Fastest growing Specialty Pharmacy in the U.S. …
CVS Health Specialty Revenue($, billions)
4927%
40
30
CAGR
2219
2012 2013 2014 2015E 2016EDispensed Managed ACS (Omnicare)
19
.Source: CVS Health Internal Analysis. Does not include specialty revenue from Target pharmacies.

… with the Broadest Capabilities to Manage Trend and Improve Care
2
• Formulary strategies offer drug exclusions, step therapy and new-to-market control
Trend and Improve Care
FormularySolutions
• Exclusive Choice network can help reduce trend and drive incremental savings
and new-to-market controlSolutions
NetworkDesign
H lt t it i f i i
• Cost-effective, clinically-appropriate therapy solutions for each patient
Utilization Management
Sit f • Home or alternate-site infusion services can dramatically lower costs
• Novologix platform enables editing and re-pricing for
Site-of-careManagement
Medical Claims medical pharmacy claimsClaimsEditing
• Certified nurse case managers provide clinical supportCareCoordination
20

Evolving Health Care Market Creates Opportunities
Demographics and Health Reform Continue to Transform the Market1 to Transform the Market
Specialty Growth Will Be Primary Driver of Pharmacy Trend
1
2
Retailization of Health Care Is Accelerating3
Increasing Focus on Outcomes4
5 Consolidation in the Health Plan Market5
21

Retailization of Health Care Continues with Growth in Consumer-directed Health Plans
3
Growth in Consumer directed Health Plans
CDHP Enrollment(lives, millions) Drivers of Trend
• Employers looking to CDHPsto help control mounting health care costs
30 5
37.525%
− Employees have accountability in their health care decision-making
• Growth in CDHPs also driven by 22.0
30.5CAGR
health insurance choosers on the exchanges
6.1
12.5
2006 2008 2010 2012 2014
22
Sources: AIS’s Inside Consumer Directed Care; Kaiser; AHIP surveys.

Promoting Healthy Behavior Is Critical in Avoiding Unintended Consequences with CDHPs
3
As Patient Cost Share Rises…
Avoiding Unintended Consequences with CDHPs
CVS Health Advantages
More than 9,500 convenient locations
Costsustaining adherence CVS/minuteclinic
Innovative plan design options
Cost… sustaining adherence becomes more challenging
… patients may choose to cut th i h lth d
Unique programs: Pharmacy Advisor
Trusted brandAdherence
corners on their health andwellness needs to avoid costs
CVS Health is best-positioned to meet consumer needs
Trusted brand
23
Note:1. Retail pharmacy locations include more than 1,660 Target locations.

Example: Reduced Co-pay for Key Maintenance Medications Improves Adherence in CDHPs
3
Medications Improves Adherence in CDHPs
Member Adherence to Prescribed Hyperlipidemia Medication
82%
+130bps
Initiators Continuers
80% 82%+560bps
57%63%
Notes:1 Initiators defined as patients starting therapy during study period Continuers defined as patients on therapy before study period
With preventative drug listWithout preventative drug list
24
1. Initiators defined as patients starting therapy during study period. Continuers defined as patients on therapy before study period.2. Member adherence defined as average monthly proportion of days covered (PDC).Source: CVS/caremark Enterprise Analytics: Study of CDHP Design Impact on Utilization and Medication Adherence, 2014. Study based on subset of CVS/caremark book of business.

Evolving Health Care Market Creates Opportunities
Demographics and Health Reform Continue to Transform the Market1 to Transform the Market
Specialty Growth Will Be Primary Driver of Pharmacy Trend
1
2
Retailization of Health Care Is Accelerating3
Increasing Focus on Outcomes4
5 Consolidation in the Health Plan Market5
25

Payment Models Continue to Evolve Away fromFee-for-service and Towards Value-based Payments
4
Fee for service and Towards Value based Payments
Medicare Reimbursement by Payment Model
52%33%
18%34%
52%
Two-thirds in alternative
30% 33%
2015E 2018E
alternative models
Medicare Advantage Value-based FFS Volume-based FFS
By 2018, two-thirds of Medicare payments in alternative models
26
Source: Burwell S. Setting Value-Based Payment Goals – HHS Efforts to Improve U.S. Health Care. The New England Journal of Medicine. 2015; 372:897-899.

Public and Private Payors Taking Steps to Managing Outcomes and Total Cost of Care
4
Managing Outcomes and Total Cost of Care
Medicaremandatory bundles
for hips/knees
Largest health systems pledge to move
75% of business intovalue-based arrangements
2016 2017 2020
Medicare Part D Enhanced MTM modelEnhanced MTM model
Sources:
27
Sources:1. HHS, CMS finalizes bundled payment initiative for hip and knee replacements, November 2015.2. CMS, CMS announces Part D Enhanced Medication Therapy Management Model, September 2015.3. Health Care Transformation Task Force, Major Health Care Players Unite to Accelerate Transformation of US Health Care System, January 2015.

CVS Health Can Support Health Systems Across the Payment Continuum
4
the Payment Continuum
Evolving Contracting ArrangementsBirmingham, Sacramento,CAEvolving Contracting Arrangements
AL CA
Fee for Service(FFS)
FFS with Pay for
Performance
Bundled Payments
Shared Savings
Shared Risk
Global Capitation
28

Full Range of Tools and Services to Support Differentiated Needs of Providers
4
Health Hospital
Differentiated Needs of Providers
CVS/minuteclinic Engagement Engine
Hospital Transitions
Complementary health Powerful analytics Assisting patients to
Epic EMR
Enhanced connectivityComplementary health care services
Wellness and chronic care support
Powerful analytics capabilities
Essential in helping manage population health
Assisting patients to avoid adherence lapses
Enhanced care coordination
Enhanced connectivity to the health care system
>60% of Americans have Epic recordp
Well-positioned to excel regardless of how market evolves
29

CVS Health Best-in-class Tools to Drive Adherence 4
Medication Possession RatioDi b t Ch l t l H t i
83 84
DiabetesTherapy
CholesterolTherapy
HypertensionTherapy
+580bps
+650bps
73
77 7880+700
bps
bps
73
Top 3 Retail
CVS/pharmacy
Top 3 Retail
Top 3 Retail
CVS/pharmacy
CVS/pharmacy
Adherence for these common conditions can drive Star ratings
30
Note:1. Adherence measured by Medication Possession Ratio, calculated as total days supply divided by total days in evaluation period.Source: CVS Health Internal Analysis, based on rolling 12 month period: November 2014 to October 2015.
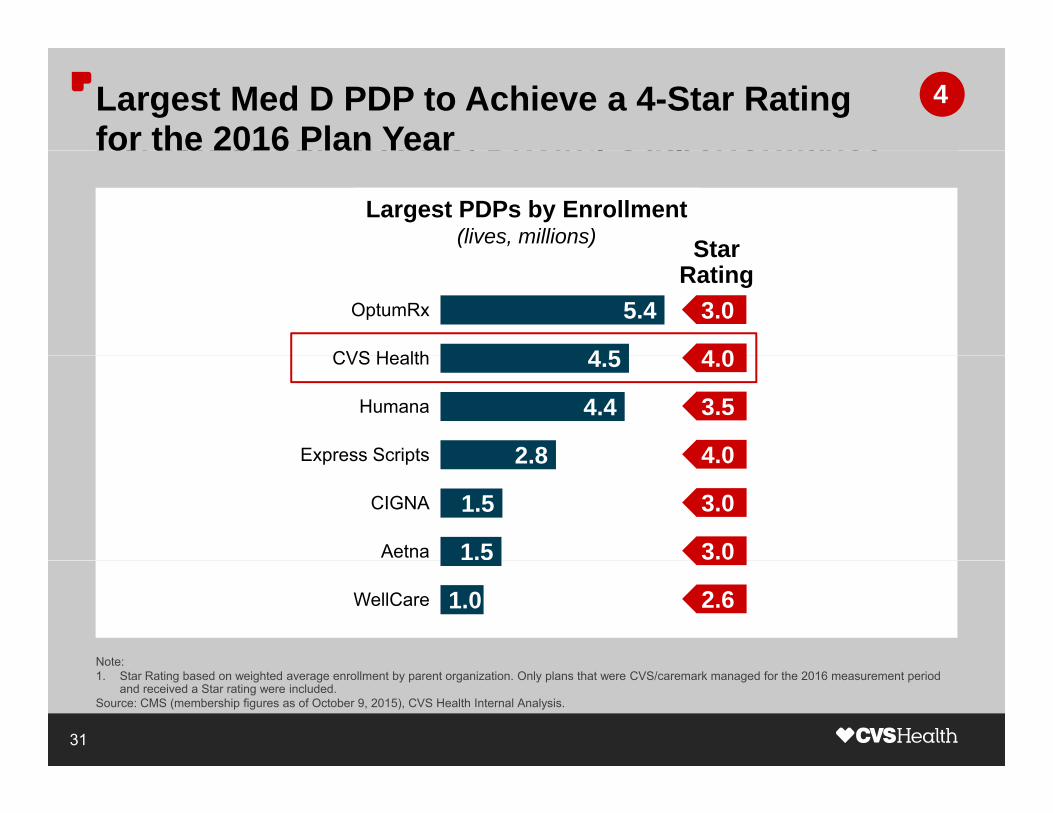
CVS Health Can Directly Impact a Significant Portion of Star Metrics, Driving Outperformance Largest Med D PDP to Achieve a 4-Star Rating for the 2016 Plan Year
4
Portion of Star Metrics, Driving Outperformance
Largest PDPs by Enrollment(lives, millions) Star
for the 2016 Plan Year
4 5
5.4
CVS Health
OptumRx 3.0
4 0
Star Rating
2 8
4.4
4.5
Express Scripts
Humana
CVS Health 4.0
3.5
4 0
1.5
1.5
2.8
Aetna
CIGNA
Express Scripts 4.0
3.0
3.0
1.0WellCare 2.6
Note:
31
Note:1. Star Rating based on weighted average enrollment by parent organization. Only plans that were CVS/caremark managed for the 2016 measurement period
and received a Star rating were included.Source: CMS (membership figures as of October 9, 2015), CVS Health Internal Analysis.

CVS Health Can Directly Impact a Significant Portion of Star Metrics, Driving Outperformance
4
Portion of Star Metrics, Driving Outperformance
Largest PDPs by Enrollment(lives, millions) Star
SilverScript is excelling…
O l PDP ith 50% l
4 5
5.4
CVS Health
OptumRx 3.0
4 0
Star Rating • Only PDP with >50% low-
income-subsidy lives to achieve 4 Star rating
2 8
4.4
4.5
Express Scripts
Humana
CVS Health 4.0
3.5
4 0
And we’re helping clients achieve their goals…
• Ability to directly impact more
1.5
1.5
2.8
Aetna
CIGNA
Express Scripts 4.0
3.0
3.0
y y pthan 80% of Med D and 55% of MAPD Star metrics
• Client lives in high performing
1.0WellCare 2.6
Note:
g p gplans: 73% vs. 49% for the overall market
32
Note:1. Star Rating based on weighted average enrollment by parent organization. Only plans that were CVS/caremark managed for the 2016 measurement period
and received a Star rating were included.Source: CMS (membership figures as of October 9, 2015), CVS Health Internal Analysis.

Evolving Health Care Market Creates Opportunities
Demographics and Health Reform Continue to Transform the Market1 to Transform the Market
Specialty Growth Will Be Primary Driver of Pharmacy Trend
1
2
Retailization of Health Care Is Accelerating3
Increasing Focus on Outcomes4
5 Consolidation in the Health Plan Market5
33

We Can Partner with Health Plans in a Multitudeof Ways to Drive Value
5
of Ways to Drive Value
Strong procurement Broad service Pharmacy is Unique ability procurement
capabilities and claims scale
makes
portfolio to support plan
needs whether or not we are
your focus and a
key lever for managing
overall health
q yto leverage consumer insights
to improveus a low-cost provider
or not we are the PBM
overall health costs
to improvecare
34

After Consolidation, Regional and Blues Plans Will Still Manage More Than Half of Total Lives
5
Will Still Manage More Than Half of Total Lives
AetnaAetnaHumana
Nationals Nationals Anthem 46%Cigna
Anthem
UnitedUnited
RegionalsRegionals
54%BluesBlues
35
Future MarketMarket Today

We Dispense 8X to 11X the Prescription Volume of the Proposed Combinations …
5
Volume of the Proposed Combinations …
2015 Estimated Rx Volume(Rx dispensed, millions) CVS Health Advantages
1,350• Generic purchasing scale makes
us a low-cost provider
Scale is further enhanced by Red• Scale is further enhanced by Red Oak sourcing
~8X ~11X
170 120
CVS Aetna AnthemCVS Health
Aetna Humana
Anthem Cigna
Notes:
36
Notes:1. Estimated dispensed Rx include prescriptions filled at CVS/pharmacy and mail order and specialty prescriptions filled at CVS/caremark.2. Estimated dispensed Rx also displayed on a pro forma basis to include full year 2015 Dispensed Rx volume from Omnicare and Target.Source: CVS Health Internal Analysis, Company disclosures. All prescriptions dispensed on a 30-day equivalent basis.

… and We Manage 2X to 3X the Claims Volume of the Proposed Combinations
5
Volume of the Proposed Combinations
CVS Health Advantages2015 Estimated Claims Volume
(Rx managed, millions)
1,165
2X
• Substantial managed claims volume supports negotiations for rebates / formulary placement
600480
~2X ~3X • Creates value as majority of rebates are passed to clients
CVS / Aetna AnthemCVS / caremark
Aetna Humana
Anthem Cigna
37
Note:1. Estimated managed claims include all CVS/caremark network claims plus specialty and adjusted mail claims.Source: CVS Health Internal Analysis, Company disclosures. CVS/caremark claims represent midpoint of guidance range.

We Dispense 8X to 11X and Manage 2X to 3X the Volumes of the Proposed Combinations
5
Volumes of the Proposed Combinations
2015 Estimated Rx Volume(Rx dispensed, millions)
2015 Estimated Claims Volume(Rx managed, millions)
1,350 1,165
2X
~8X ~11X 600480
~2X ~3X
170 120
CVS Aetna Anthem CVS / Aetna Anthem
Note: Estimated dispensed Rx include prescriptions filled at CVS/pharmacy and mail order and specialty prescriptions filled at CVS/caremark Dispensed Rx also
CVS Health
Aetna Humana
Anthem Cigna
CVS / caremark
Aetna Humana
Anthem Cigna
Scale is critical to being a low-cost provider
38
Note: Estimated dispensed Rx include prescriptions filled at CVS/pharmacy and mail order and specialty prescriptions filled at CVS/caremark. Dispensed Rx also displayed on a pro forma basis to include full year 2015 Dispensed Rx volume from Omnicare and Target. Estimated dispensed prescriptions on a 30-day equivalent basis. Estimated managed claims include all CVS/caremark network claims plus specialty and adjusted mail claims.Source: CVS Health Internal Analysis, Company disclosures. CVS claims represent midpoint of guidance range.

Agenda
Our Compelling Value Proposition
Evolving Health Care Market Creates Opportunities
Our Compelling Value Proposition
Strategic Framework for Long-term Enterprise GrowthStrategic Framework for Long-term Enterprise Growth
Evolving Health Care Market Creates Opportunities
Strategic Framework for Long-term Enterprise GrowthStrategic Framework for Long-term Enterprise Growth
39

Our Strategic Business Imperatives
AggregateLives
GrowShare
Execute with Excellence
DriveInnovation
Enterprise Focus
Grow the core, Broaden the base
40

Our Strategy for Long-term Enterprise Growth
5Opportunistic bolt-on acquisitions4
5
Continued innovation in drug procurement and supply chain efficiencies3
Enhance patient engagement
Deepen relationships with payors and providers
2Deepen relationships with payors and providers to help reduce cost and improve outcomes
Add capabilities to enhance core business
1
41
p

Today’s Key Takeaways
The Right Strategy for an Evolving Health Care MarketThe Right Strategy for an Evolving Health Care Market
Leadership in multiple competencies to drive superior l f h lth t
Demonstrating Valuevalue for health care partnersto People, Payors and Providers
Expanding core pharmacy business while broadening Growing the Core, p g p y greach into new health care channels
g ,Broadening the Base
I t d i i ti d t d ki l tAlways Looking Introducing innovative products and making long-term, value-enhancing investments
Always Looking Ahead
Driving shareholder value with strong earnings and cash flow as well as disciplined capital allocation
Driving Sustainable Enterprise Growth
Driving Enterprise Growth in an Evolving Health Care Market

Endnote
1. , Omnicare, CVS/caremark, CVS/pharmacy, CVS Health, CVS/specialty, CVS/minuteclinic, and Health Engagement Engine are trademarks or registered trademarks of CVS Pharmacy, Inc.
43

Delivering Value Today,Delivering Value Today, Ensuring Growth for Tomorrow
Jon RobertsExecutive Vice President & President CVS/caremarkPresident, CVS/caremark

Agenda
Demonstrating Value: PBM P f Hi hli htDemonstrating Value: PBM Performance HighlightsPBM Performance Highlights
Addressing Clients’ Top Concern: CostAddressing Clients Top Concern: Cost
Ensuring Growth: Our Integrated Model and the E l i H lth C M k tEvolving Health Care Market
2

Continued Strong PBM Performance
Net Revenue($, billions)
Operating Profit($, billions)
121.515.6%CAGR
3.5
4.415.0%CAGR
58.9
88.4
2.2
3.5
2011 2014 2016E 2011 2014 2016E
3
Note:1. 2016E based on midpoint of 2016 guidance.

Another Successful Selling Season: Gross New Business Wins of $13.5 Billion for 2016Gross New Business Wins of $13.5 Billion for 2016
13 5B13.5BIN NEW
$11.2B$1.8B
BUSINESS WINS
St t f
State of Oklahoma
Government & Union
Employer
State of Illinois Health Plan
4
EmployerNotes:1. As of 12/04/2015.2. Gross wins exclude Medicare Part D SilverScript individual products.

Net New Client Business of $11.5 Billion for 2016with 98% Retentionwith 98% Retention
Revenues($, billions) 60% of client
l13.5 0.8
0.4
non-renewals due to acquisition
and retirees
11.5
0.8
Business Not Renewed
Gross New B i
Acquired Moved to Exchange (P i il R ti )
Competitive / Oth
Net New Business
Expect another highly successful welcome season
Business (Primarily Retirees) / Other
5
Notes:1. As of 12/04/2015.2. Gross wins exclude Medicare Part D SilverScript individual products.

Gross New Business Creates Share Gain Opportunity
ENTERPRISE SHAREGROSS WINS BY CHANNEL
54%$0.6B Mail Choice
data28%
22%$1.8B SpecialtySpecialty
$11.1BExisting
Health PlanExisting
EmployerNew
Business
$RetailNetworks
6
Notes:1. Enterprise share represents the percent of Rx volume dispensed through a CVS Health enterprise channel (Mail, Specialty, Retail).2. All claims on a 30-day equivalent basis.

Client Priorities: Prescription Drug Cost Top Concern Across SegmentsTop Concern Across Segments
AVOIDINGDISRUPTION
MEDICARE EXPERTISE
MEMBERSERVICE
UTILIZATION& CLINICALPROGRAMS
CLIENT SERVICE
PRESCRIPTION DRUG COST
LEVEL OF IMPORTANCE
7

Our Model Provides Flexibility to Address Client Priorities dd ess C e t o t es
EmployersEmployers
AVOIDINGDISRUPTION
MEDICARE EXPERTISE
MEMBERSERVICE
UTILIZATION& CLINICALPROGRAMS
CLIENT SERVICE
PRESCRIPTION DRUG COST
LEVEL OF IMPORTANCE
8

Our Model Provides Flexibility to Address Client Priorities dd ess C e t o t es
Health PlansHealth Plans
AVOIDINGDISRUPTION
MEMBERSERVICE
CLIENT SERVICE
PRESCRIPTION DRUG COST
UTILIZATION& CLINICALPROGRAMS
MEDICARE EXPERTISE
LEVEL OF IMPORTANCE
9

Our Model Provides Flexibility to Address Client Priorities Address Client Priorities
MedicareMedicare
AVOIDINGDISRUPTION
MEMBERSERVICE
CLIENT SERVICE
PRESCRIPTION DRUG COST
MEDICARE EXPERTISE
UTILIZATION& CLINICALPROGRAMS
LEVEL OF IMPORTANCE
10

Multi-segment PBM Market Demands Flexibility
Employers Government Health p yand Unions Plans
Expertise, flexibility and proven performance support our continued growth
11

Delivering on Client Priorities: Clients and Members Highly Satisfied with ServiceClients and Members Highly Satisfied with Service
2015 Member Satisfaction2015 Client Satisfaction
96% 95%
CVS/caremark scored highest in overall customer satisfaction in 2015 PBMI Survey
12
in 2015 PBMI SurveySource: PBMI 2015 Pharmacy Benefit Management Customer Satisfaction Report; PBMs with >20M members.

Delivering on Client Priorities: Medicare
A t i l / bid f l
Consultative Services
Progressive and
Competitiveness
Actuarial / bid, formulary and plan
design support
Progressive and integrated strategies to
help manage trend
ComplianceStar Ratings
MEDICARE HEALTH
PLAN
p
Robust compliance support for complex
g
73% of client lives are 4 to 5 Star plans
regulatory environmentp
13
Note:1. Star ratings for 2016 based on internal analysis of CMS data released October 2015. Star rating based on weighted average enrollment by parent
organization. Only plans that were CVS/caremark managed for the 2016 measurement period and received a Star rating were included.

Delivering on Client Priorities: Clinical Programs
ROBUST UTILIZATION PROGRAMS
6% savings for medical
MEDICATION RECONCILIATION
48% reduction in hospital 6% savings for medical and pharmacy benefits from specialty utilization management
preadmissions; $3,300 savings per patient counseled
PHARMACY ADVISORSPECIALTY CARE
MANAGEMENT NURSE
Pharmacist counseling:4% increase in adherence; 7.5% reduction in gaps in care
Enhanced outreach: 60% engagement rate; reduce hospitalizationsby 23%in care by 23%
Note:1. Savings quoted may vary based on various factors including things such as plan design, programs adopted and demographics.Sources:Pharmacy Advisor : CVS/caremark internal data 2013 Medication Reconciliation: CVS/caremark sample study 2014 Robust UM (integrated PA)
14
Pharmacy Advisor : CVS/caremark internal data, 2013. Medication Reconciliation: CVS/caremark sample study, 2014. Robust UM (integrated PA) CVS/caremark Specialty Client Solutions and Trend Management, 2013, internal analyses for estimated program savings. Specialty engagement source: Accordant® - Comprehensive Data Warehouse; SQL Server 2008. Greensboro, NC: care management Health Services, a CVS/caremark Company; 2013www.hpminstitute.org/content/wellness-and-disease-management-podcast-industry-specialist-judy-mueller.

Agenda
Demonstrating Value: PBM P f Hi hli ht
Addressing Clients’ Top Concern: Cost
PBM Performance Highlights
Addressing Clients’ Top Concern: CostAddressing Clients Top Concern: CostAddressing Clients Top Concern: Cost
Ensuring Growth: Our Integrated Model and the E l i H lth C M k tEvolving Health Care Market
15

Size and Scale Ensures Competitive Cost
Generic Purchasing
• Sourced through Red Oak, the largest generic sourcing entity in the U.S.
Formulary Management
• $6.4B in incremental client savings ‘12-’16E from our leading formulary management strategy
Specialty Pharmacy
• Largest specialty pharmacy; able to manage cost across pharmacy and medical benefit
Competitive Networks
• 1.34B adjusted claims estimated in 2016 through our multiple networks
Cost of Service
• Streamlining continues to deliver value as volume grows• Technology investments enable regulatory compliance
16
Note:1. 2016E based on midpoint of 2016 guidance.

Comprehensive Program Addresses 3 Possible Areas of Fraud, Waste and AbuseAreas of Fraud, Waste and Abuse
• Medication abuse / misuse
MEMBER
CVS/caremark provides:• Doctor shopping• Pharmacy shopping • Active and retrospective
claims monitoring• Review of high-riskPRESCRIBER Review of high risk
prescribing patterns• Robust network pharmacy
credentialing programPh di
PRESCRIBER
• Illegal or irresponsible prescribing
• Pharmacy audits• High- and low-touch
interventions
PHARMACY • Fraudulent billing • Inaccurate dispensing
For 2015, CVS/caremark pharmacy audits will lead to more than $240M in savings and recovery of incorrect improper or fraudulently-billed claims
• Drug diversion
savings and recovery of incorrect, improper or fraudulently-billed claims
17
Source: CVS/caremark internal data.

2014 Double-digit Pharmacy Trend: A Call to Action
IMPACT TO TREND1 0%
3.4%2.0%
1.0%
(5.9)%
2.1%1.5%
7.7%
11.8%
7.7%
Specialty Brand
Inflation
Utilization Hep C Compounds Generic Inflation
Drug MixNon-specialty
Brand Inflation
2014 Bookof Business
Trend
Note:1. Trend is net of rebates.Source: CVS Health Enterprise Analytics, Book of Business Trend Cohort.
18

RxInsights: Client-Specific Reporting on Trend Performance and Key Metricsy
EXECUTIVE SUMMARY
Note:1. Sample data, actual results may vary.
19

CVS HEALTH - COMPREHENSIVE SOLUTIONS TO MANAGE TRENDIDENTIFY EXPLORE MANAGE OPTIMIZEIDENTIFYEMERGINGTREND
EXPLOREROOT CAUSES
MANAGETHROUGHFORMULARY
OPTIMIZECHANNEL
Interactive RxInsightsIndividual classes are plotted below. The graph is showing the relationship between Cost and Contribution to Trend. Size represents the Cost/Days Supply for a given class.
3%
4%5%
CLASS ANALYSIS BY CONTRIBUTION
p g p g p p y pp y g
11.2%
TREND
RxInsights
-1%
0%
1%
2%RxInsights
Demo
$0 $1 $2 $3 $4 $5 $6 $7 $8-3%-2%
$
GROSS COST PMPM TREND
J 2014 M 2014 S t b 2014 J 2015 M 2015 S t b 2015
$80
$100
$120
©2015 CVS Health and/or one of itsJanuary 2014 May 2014 September 2014 January 2015 May 2015 September 2015 affiliates: Confidential and Proprietary

Strong Adoption of Key Cost Management Solutions … Meaningful Opportunity Remains… Meaningful Opportunity Remains
Current Lives Total LivesOpportunity Savings
TOTAL NETWORK
23MMAINTENANCE CHOICE Up to 4%44M
37M
25M
TOTAL NETWORK STRATEGIES
FORMULARY STRATEGIES
Up to 4%
Up to 12%
75M
53M
35M EXCLUSIVE SPECIALTY
STRATEGIES
Up to 7%50M
10M SPECIALTY MEDICAL MANAGEMENT Up to 13% 41M
Notes:1 Current Lives includes 2016 known enrollments
21
1. Current Lives includes 2016 known enrollments.2. Exclusive Specialty savings apply to specialty spend under the pharmacy benefit. 3. Specialty Medical Management opportunity based on Health Plan lives in PBM book of business; savings apply to specialty spend under the medical benefit.4. Savings results will vary based on a variety of factors including demographics, plan design and other programs implemented by the client.

Adoption of Our Plan Designs Helps Reduce Plan Costs While Growing Enterprise ShareCosts While Growing Enterprise Share
Enterprise Share Growth in a Multi-state Health Plan
31.3%11.4 ppincrease
19.9%
26.7%
2010 2013 2016E
Plan has implemented programs that reduce plan and member cost and grow enterprise shareand grow enterprise share
22

2014 Double-digit Pharmacy Trend: A Call to Action2015 Year-to-date Trend Summary
JAN THROUGH SEP COMMERCIAL TREND
2.3%1.6% (0.3)% (1.9)% 0.8%
(2.8)%6 7%
11.8%
6.7%6.4%
2014 Bookof Business
Trend
Specialty Brand
Inflation
Utilization Hep C Compounds Generic Inflation
Drug MixNon-specialty
Brand Inflation
2015 YTD Book of Business
Trend
Note:1. Trend is net of rebates.Source: CVS Health Enterprise Analytics, Book of Business Trend Cohort.
23

Agenda
Demonstrating Value: PBM P f Hi hli htPBM Performance Highlights
Addressing Clients’ Top Concern: CostAddressing Clients Top Concern: Cost
Ensuring Growth: Our Integrated Model and the E l i H lth C M k tEnsuring Growth: Our Integrated Model and the E l i H lth C M k tEvolving Health Care MarketEvolving Health Care Market
24

Driving Market Evolution: Government Programs Linking Payments to Quality
1 in 3 50% of traditional Medicare spending
g ay e ts to Qua ty
1 in 3 Americans are currently covered by government-sponsored health
50%
Medicare spending will be linked to quality incentives by 2018
% OF MEDICARE SPENDING TIED TO
QUALITY INCENTIVESpinsurance programs
$1 f $2 20%
QUALITY INCENTIVES
$1of every $2spent on health care goes through Medicare and M di id 2014 2018Medicaid 2014 2018
To succeed, payors and providers must align with CMS focus on quality
25
Notes:1. Health Affairs – National Health Expenditure Projections 2014-2024, July 2015.2. Modern Healthcare, January 26, 2015.

Our Model Uniquely Meets Evolving Needs
Integrated Assetsand Ability to Improve Outcomesand Ability to Improve Outcomes
Position Us for Growth
Data and analytics to guide
interventions
Connectivity and coordination
with providers to
Capabilities to reduce risk of readmissions
Effective outreach to consumers
between visits tointerventionsand help optimize
outcomes
with providers to help them succeed in new risk models
readmissionsand support
transitions in care
between visits to the doctor
Supporting market initiatives linking payments to quality
1 2 3 4
26

We Make Data Actionable and Deliver It When and Where Interventions Can Do the Most GoodWhere Interventions Can Do the Most Good
HospitalsProvidersPatient Post-acute Care
Optimal Interventions P d b thPowered by the
Health Engagement Engine
Foundation of rich data and analytic expertise
1 Data/Analytics Guide Interventions27

CVS Health Uses Pharmacy Data to Help Providers Reduce Risk and Improve Quality
Risk Adjustment Targeting: Accurate assessment of population risk to help
Reduce Risk and Improve Quality
Which of my patients are high p p p
optimize reimbursement
Who will drop
p grisk?
Adherence Prediction: Assess a patient’s risk of non-adherence to more effectively target adherence interventions
Who will dropoff therapy and when?
Vulnerable Patient Index: Identify patients at high risk of steep increase in health care costs to enable interventions to improve adherence,
Who could incurhigh costs in the next 12 months? safety and outcomesnext 12 months?
Vulnerable patients have 3.5X higher cost of care
1 Data/Analytics Guide Interventions28
Note:1. CVS Health uses and shares data as allowed by applicable law, our agreements and our information firewall.Source: CVS/caremark internal analysis.

Connected Assets Support EffectiveConsumer Outreach
CVS/omnicare™
Consumer Outreach
Omnicare Support for
Medication reviews for high
risk patients
Adherence counseling
Wellness supportOmnicare support forSupport for
Transitions in Carerisk patients
Specialty conditionmanagement
Support forself-management
of chronic conditions
Wellness support support for transitions in care
29 2 Effective Consumer Outreach
Note:1. CVS Health uses and shares data as allowed by applicable law, our agreements and our information firewall.

Connecting with At-risk Providers and Extending the Care Team to Help Them Succeed
Adh t iti
the Care Team to Help Them Succeed
Adherence opportunities
Intervention results
M di ti dMedication and allergy info
MinuteClinic visit summaries
Provider
Affiliated with 60+ health systems to share data and support patient interventions and better outcomesinterventions and better outcomes
30 3 Provider Connectivity
Note:1. CVS Health uses and shares data as allowed by applicable law, our agreements and our information firewall.

Supporting Patients After Discharge from Hospital: Care Transitions Challenge the SystemCare Transitions Challenge the System
1/5 readmitted within 30 days1/5 readmitted within 30 days
3/4 of these readmissions3/4 of these readmissionsare preventable
2/3 readmissions related to medication issues
Costs: $12B per year
31 4 Transitions in Care
Sources:1. Health Affairs Health Policy Brief, November 12, 2013, Medicare Hospital Readmission Reduction Program.2. Annals of Internal Medicine; The Incidence and Severity of Adverse Events Affecting Patients after Discharge from the Hospital, 2003.

Supporting Patients After Discharge from Hospital: Reducing Risk, Improving OutcomesReducing Risk, Improving Outcomes
Medication Reconciliation by PharmacistMedication Reconciliation by Pharmacist Shown to reduce readmissions by 48%
Home Infusion Services
High-touch Specialty Services
Earlier discharge; alternative, lower-cost sites of care
Adherence support; rare disease management
Skilled Nursing or Long-term CareHelping patients through complex changes in
Only CVS Health can provide this end-to-end solution
Helping patients through complex changes in regimen as they transition
32 4 Transitions in Care
Note:1. CVS/caremark sample study, 2014.

One-of-a-kind: Assets and Capabilities to Connect and Coordinate with All Stakeholdersand Coordinate with All Stakeholders
LARGEST LARGEST SPECIALTY
Integrated
LARGEST RETAIL CLINIC
LARGEST SPECIALTY PHARMACY
Integrated Model Helps Lower Costs
and RETAIL PHARMACY
FOOTPRINT LARGEST HOME INFUSION
Improve Outcomes
INDUSTRY-LEADING PBM PROGRAMS
LEADING POST-ACUTE PHARMACY SERVICES
33

The Right Strategy for an Evolving Health Care Market
Industry-leading trend management tools / solutionsDemonstrating ValueProvider and patient support that improves outcomesto People, Payors and Providers
Flexibility to meet evolving market needsGrowing the Core, Adding value with new capabilities
g ,Broadening the Base
I ti l ti f t d d dAlways Looking Innovative solutions foster expanded payor and provider relationships
Always Looking Ahead
Integrated assets serve expanding market segments and evolving payment models
Driving Sustainable Enterprise Growth
Delivering Value Today, Ensuring Growth for Tomorrow

Endnote
1. , CVS/caremark, CVS Caremark, RxInsights, Maintenance Choice, Health Engagement Engine and CVS/omnicare are trademarks or registered trademarks of CVS Pharmacy, Inc.
35

Capitalizing on GrowthCapitalizing on Growth Opportunities in Specialty
Alan Lotvin, M.D.Executive Vice President, CVS/specialtyCVS/specialty

Agenda
Performance HighlightsPerformance HighlightsPerformance Highlights
CVS/specialty Differentiated Assets
Performance Highlights
CVS/specialty Differentiated Assets
Future Growth InitiativesFuture Growth Initiatives
2

CVS/specialty Has Grown Faster Than the Industry
CVS Health Specialty Revenue($, billions)
CVS/specialty Managed
40
49
30
222219
2012 2013 2014 2015E 2016E
3
.Source: CVS Health Internal Analysis, does not include specialty revenue from Target pharmacies.

CVS/specialty Has Grown Faster Than the Industry
CVS/specialty Dispensed Revenue($, billions)
3532.3%
CVS/specialtyCAGR27
35
19.3%Industry
2014
11
2012 2013 2014 2015E 2016E
CAGR
4
.Source: CVS Health Internal Analysis, does not include specialty revenue from Target pharmacies.

CVS/specialty Is Growing Faster Than Nearest Competitor to Become the Largest Specialty PharmacyCompetitor to Become the Largest Specialty Pharmacy
Specialty Pharmacy Share2013 20142013 2014
300 bps point lead for competitor
700 bps point lead for CVS/specialty
25%33%26%
35%
competitor p y
28%10%
2%2% 19%
11%6%
3%
Competitor A
11%
$63B Market $78B MarketCompetitor B Competitor C Competitor D All other
5
Source: 2013 Share: Pembroke Consulting estimates. This chart appears as Exhibit 14 in the 2013-14 Economic report on Retail, Mail, and Specialty Pharmacies, Drug Channels Institute, January 2014; Proforma for UHC and Catamaran Combination. 2014 Share: Drug Channels, The Top 10 Specialty Pharmacies of 2014.
Agenda
Performance HighlightsPerformance Highlights
CVS/specialty Differentiated AssetsCVS/specialty Differentiated AssetsCVS/specialty Differentiated Assets
Future Growth Initiatives
CVS/specialty Differentiated Assets
Future Growth Initiatives
6

The Traditional Specialty Pharmacy Model Now Represents ‘Table Stakes’ in the IndustryRepresents Table Stakes in the Industry
CLINICAL MANAGEMENT
CLINICAL MONITORING LOGISTICS
Side Effects
Injection Training
Risk Evaluation and Mitigation Strategies
(REMS)
Cold Chain Shipping
MANAGEMENT MONITORING
Injection Training
Adherence(REMS)
Adverse Event Reporting
Benefit and Financial Support
7
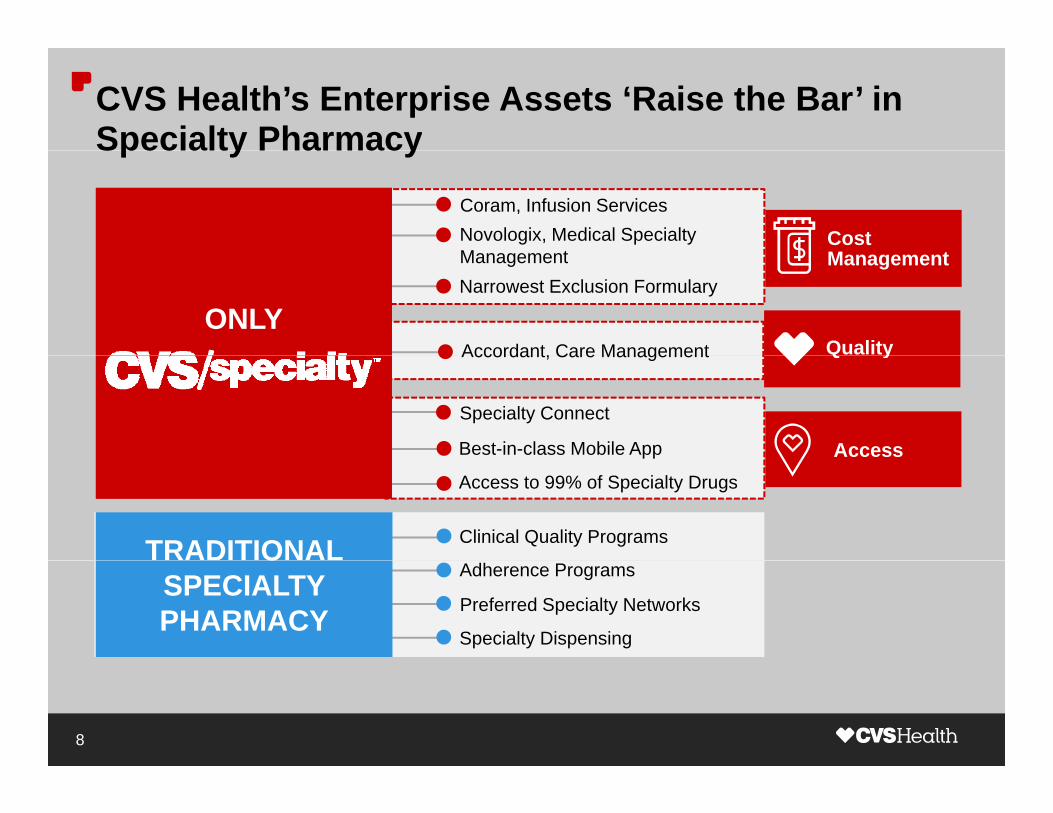
CVS Health’s Enterprise Assets ‘Raise the Bar’ in Specialty PharmacySpecialty Pharmacy
Novologix, Medical Specialty M t
Coram, Infusion Services
Cost M t
Accordant, Care Management
Narrowest Exclusion Formulary Management
ONLY
Management
Quality
Best-in-class Mobile App
Specialty Connect
Accordant, Care Management
Access
Q y
Clinical Quality Programs
Access to 99% of Specialty Drugs
pp
TRADITIONAL
Specialty Dispensing
Adherence Programs
Preferred Specialty Networks
OSPECIALTY PHARMACY
8

CVS/specialty Model Starts with National FootprintCVS/specialt 12T t l CVS/ h th 9 500T t th 1 660CVS/ h th 7 900CVS/specialty: 12Total CVS/pharmacy: more than 9,500Target: more than 1,660CVS/pharmacy: more than 7,900
Access9

CVS/specialty Model Starts with National FootprintCVS/specialt 12T t l CVS/ h th 9 500T t th 1 660CVS/specialty: 12Total CVS/pharmacy: more than 9,500Target: more than 1,660
Access10

CVS/specialty Model Starts with National FootprintCVS/specialt 12T t l CVS/ h th 9 500CVS/specialty: 12Total CVS/pharmacy: more than 9,500
Access11
76% of the U.S. population lives within 5 miles of a CVS/pharmacy

CVS/specialty Model Starts with National FootprintCVS/specialt 12CVS/specialty: 12
Footprint enables streamlined operations, reduced shipping costs and
Access12
Footprint enables streamlined operations, reduced shipping costs and improved efficiency

Our Specialty Connect Model Improves the Patient Experience with Convenience
CLINICAL SUPPORTCLINICAL SUPPORT
DELIVERY OF CHOICE
DELIVERY CHOICE
HIGHLY UTILIZED CHANNEL
HIGHLY-UTILIZED CHANNEL
Experience with Convenience
SUPPORTSUPPORTCHOICE CHOICECHANNELCHANNEL
~500specialty patients a day
100,000+ Total Patients
Note:1. In-store pick up currently is not available in Arkansas, Oklahoma and West Virginia. Some states require first fill prescriptions to be transmitted directly to the
di i i l h O h i i l P d il bl h h h S i l C di d b CVS/ i l i
13 Access
dispensing specialty pharmacy. Other restrictions may apply. Products available through the Specialty Connect program are dispensed by CVS/specialty in compliance with all applicable state laws.
Source: "The Adherence Impact of a Program Offering Specialty Pharmacy Services to Patients Using Retail Pharmacies.”, Journal of the American Pharmacists Association. In press.

Our Specialty Connect Model Improves Patient Experience with Flexibility
CLINICAL SUPPORTCLINICAL SUPPORT
DELIVERY OF CHOICE
DELIVERY CHOICE
HIGHLY UTILIZED CHANNEL
HIGHLY-UTILIZED CHANNEL
p y
SUPPORTSUPPORTCHOICE CHOICECHANNELCHANNEL
54%prefer to pick up at
CVS/pharmacy
Note:1. In-store pick up currently is not available in Arkansas, Oklahoma and West Virginia. Some states require first fill prescriptions to be transmitted directly to the
di i i l h O h i i l P d il bl h h h S i l C di d b CVS/ i l i
14 Access
dispensing specialty pharmacy. Other restrictions may apply. Products available through the Specialty Connect program are dispensed by CVS/specialty in compliance with all applicable state laws.
Source: "The Adherence Impact of a Program Offering Specialty Pharmacy Services to Patients Using Retail Pharmacies.”, Journal of the American Pharmacists Association. In press.

Our Specialty Connect Model Improves Patient Experience with Better Outcomes
CLINICAL SUPPORTCLINICAL S O
DELIVERY OF CHOICE
DELIVERY C O C
HIGHLY UTILIZED CHANNEL
HIGHLY-UTILIZED CHANNEL
Experience with Better Outcomes
SUPPORTSUPPORTCHOICE CHOICECHANNELCHANNEL
11.4%adherence
improvement
Note:1. In-store pick up currently is not available in Arkansas, Oklahoma and West Virginia. Some states require first fill prescriptions to be transmitted directly to the
di i i l h O h i i l P d il bl h h h S i l C di d b CVS/ i l i
15 Access
dispensing specialty pharmacy. Other restrictions may apply. Products available through the Specialty Connect program are dispensed by CVS/specialty in compliance with all applicable state laws.
Source: "The Adherence Impact of a Program Offering Specialty Pharmacy Services to Patients Using Retail Pharmacies.”, Journal of the American Pharmacists Association. In press.

Our Best-in-class Mobile App Further Improves Experience for Specialty PatientsExperience for Specialty Patients
SIMPLE COMMUNICATIONS
Choice of Delivery Text Messaging
EASY TO LOGIN
ONE-STEP REFILL
Access16

Our Best-in-class Mobile App Further Improves Experience for Specialty PatientsExperience for Specialty Patients
SIMPLE COMMUNICATIONS
Choice of Delivery Text Messaging
EASY TO LOGIN
ONE-STEP REFILL
Access17

Our Best-in-class Mobile App Further Improves Experience for Specialty PatientsExperience for Specialty Patients
SIMPLE COMMUNICATIONS
Choice of Delivery Text Messaging
Fingerprint Touch ID
EASY TO LOGIN
ONE-STEP REFILL
Facial Recognition
Access18
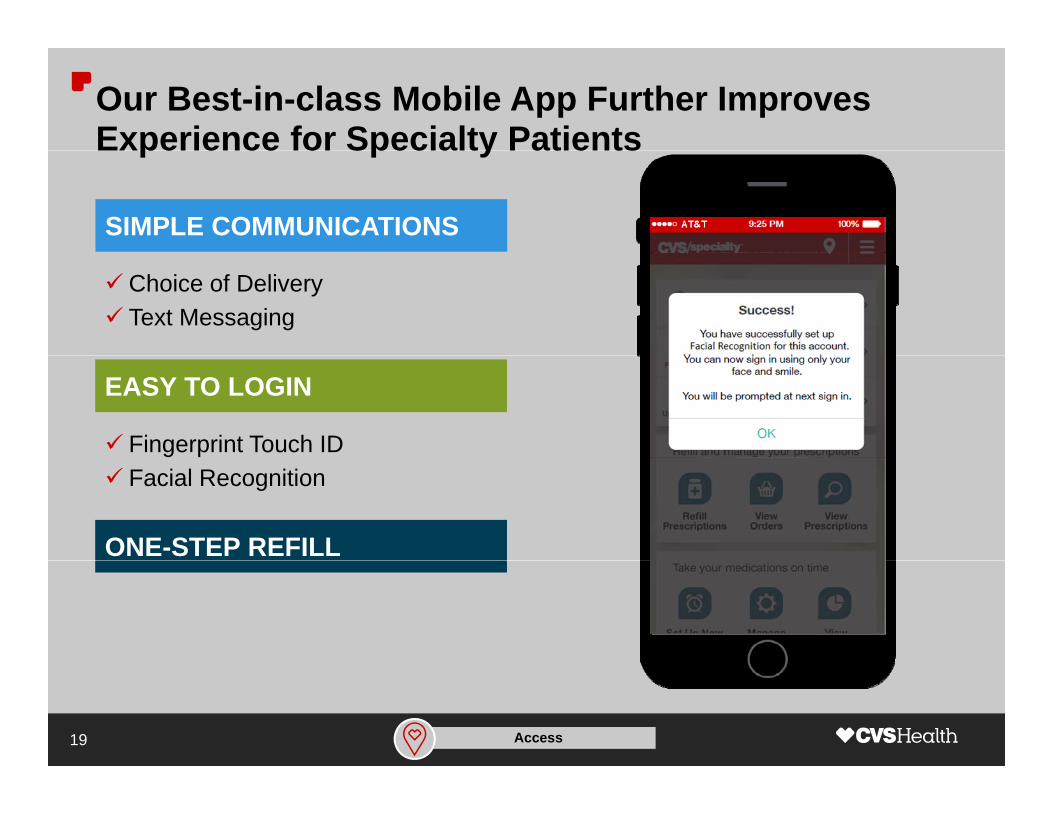
Our Best-in-class Mobile App Further Improves Experience for Specialty PatientsExperience for Specialty Patients
SIMPLE COMMUNICATIONS
Choice of Delivery Text Messaging
Fingerprint Touch ID
EASY TO LOGIN
ONE-STEP REFILL
Facial Recognition
Access19

Our Best-in-class Mobile App Further Improves Experience for Specialty PatientsExperience for Specialty Patients
SIMPLE COMMUNICATIONS
Choice of Delivery Text Messaging
Fingerprint Touch ID
EASY TO LOGIN
ONE-STEP REFILL
Facial Recognition
Scan to RefillRefill Reminder
Access20

Our Best-in-class Mobile App Further Improves Experience for Specialty PatientsExperience for Specialty Patients
SIMPLE COMMUNICATIONS
Choice of Delivery Text Messaging
Fingerprint Touch ID
EASY TO LOGIN
ONE-STEP REFILL
Facial Recognition
Scan to RefillRefill Reminder
Access21

Enterprise Assets Make CVS/specialty the Pharmacy of Choice When Patients Have OptionsPharmacy of Choice When Patients Have Options
SPECIALTY PHARMACY SHARE OF PATIENT-DIRECTED BUSINESS
HEPATITIS C
Indexed National Market Share
ORAL ONCOLOGY
CVS/specialty Nearest competitorOther specialty pharmacies(26 pharmacies in distribution network)
22 Access
Source: CVS/caremark Internal Analytics.

Our Assets Also Make CVS/specialty a Pharmacy of Choice in Limited Manufacturer NetworksChoice in Limited Manufacturer Networks
Uptravi Blincyto p
Oral pulmonary arterial hypertension (PAH) therapy
yInfused anti-cancer therapy
PBM Affiliated Ph
Distribution Network: 1 of 2National Infusion P id
Distribution Network: 1 of 2and and
Key to win: Cli i l ti i PAH E t i t
Pharmacy
Key to win: Coram CVS/specialty Infusion Services
Provider
Our unique model gives us access to 99% of specialty drugs
Clinical expertise in PAH, Enterprise assetsCoram CVS/specialty Infusion Services
Access23

Effective Quality and Cost Management Solutions Are Resonating with Payorse eso at g t ayo s
Nearly 1,000 clients in the past 2 years
have selected CVS/specialty
as their Exclusive Specialty P idProvider
Quality and cost management24
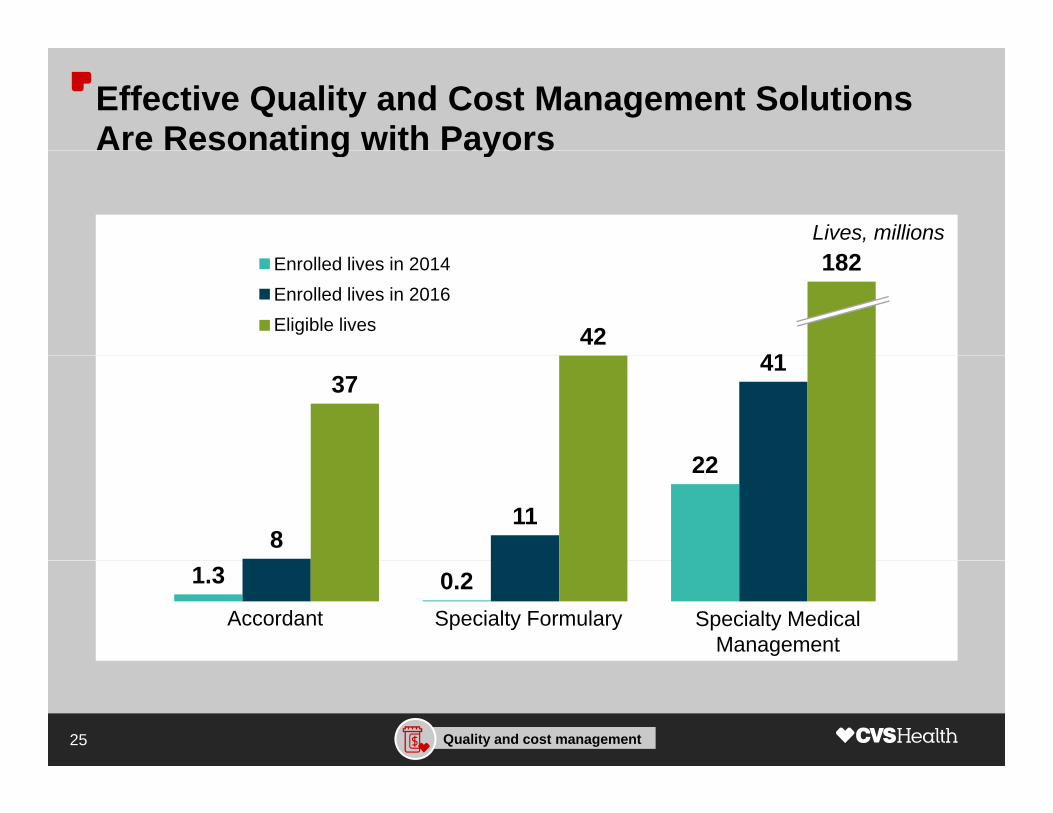
Effective Quality and Cost Management Solutions Are Resonating with Payorse eso at g t ayo s
Lives, millions
4142
182Enrolled lives in 2014Enrolled lives in 2016Eligible lives
22
4137
22
811
1.3 0.2Specialty Formulary Specialty Medical
ManagementAccordant
Quality and cost management25

Adoption of Our Cost Management Solutions Results in Significantly Lower TrendResults in Significantly Lower Trend
I t t dIll t ti
Site of
Care
IntegratedPA
6%
Illustrative Trend
20%Claims
Editing &
Remaining Exclusive Network
Pricing Models
Generic Programs
1%
Specialty Formulary
2%2%
3%Editing & Pricing
4%Trend
Network1%1%1%
Quality and cost management26
Source: CVS/caremark Specialty Client Solutions and Trend Management, 2014, internal analyses for estimated program savings.

Adoption of Our Cost Management Solutions Results in Significantly Lower TrendResults in Significantly Lower Trend
Employer Client ExamplePrior Authorization
14%
Illustrative Trend34%
Specialty
14%34%
Claims
Siteof
Care
RemainingExclusive N t k
Generic Programs
3%
Specialty Formulary
4%
Pricing Models
Editing & Pricing 12%
Remaining Trend
Network1%
3%
Comprehensive Trend Management Tools
Quality and cost management27
Source: CVS/caremark Specialty Client Solutions and Trend Management, 2014, internal analyses for estimated program savings.

Agenda
Performance HighlightsPerformance Highlights
CVS/specialty Differentiated AssetsCVS/specialty Differentiated Assets
Future Growth InitiativesFuture Growth InitiativesFuture Growth InitiativesFuture Growth Initiatives
28

Our Strategic Business Imperatives
EnterpriseDriveExecute withGrowAggregate Enterprise Focus
DriveInnovation
Execute with Excellence
Grow Share
AggregateLives
ONCOLOGY CAPABILITIESPIPELINEFORMULARY
Grow the core, Broaden the base
ONCOLOGY CAPABILITIESPIPELINEFORMULARY
29

Aggregating Lives Requires Innovative Cost Management Programs: Value-based ContractingManagement Programs: Value based Contracting
AUTOIMMUNE THERAPIES
INDICATION-SPECIFIC APPROACH
CONTRACTING STRATEGIES
Rheumatoid Arthritis:
9
S
SimpleNo complex
analyses needed
O CSTRATEGIES
Value Based
Crohn’s:
9analyses needed
EffectiveIncreases competitionPrice
P i i
4
A il bl 2016
Net price better aligned with clinical value
Protection
Psoriasis:
4Available 2016
for CVS/caremark clients
Exclusion Formulary
Aggregate Lives 30

Growing Share in Growing Segments: Outperform Upon Launch with Proactive Strategies
Indexed Growth:CVS/specialty Share
Outperform Upon Launch with Proactive Strategies
Key Tactics
1.7 1.7• Establish Centers of Excellence
• Incorporate into
1.5 1.5
Incorporate into Specialty Connect
• Engage physicians with differentiated service modeldifferentiated service model
• Pre-launch pharmacy training
Ali t i i
CVS/specialty Indexed Performance
Hepatitis CIdiopathic Pulmonary
Fibrosis
OncologyMultiple Sclerosis
• Align enterprise services
Grow Share31
Note:1. CVS/specialty share is based on internal analysis and IMS data.

Strong Pipeline Creates Growth Opportunity for CVS/specialty in Newly Launched ProductsCVS/specialty in Newly Launched Products
ROBUST PIPELINE: ANTICIPATED SPECIALTY AGENTS IN 2016-2018
New Drugs
238238ANTICIPATED BLOCKBUSTER DRUGS:
Liver Disease (NASH)obeticholic acid (2018)
NSC Lung Cancerrociletinib(2016)
Alzheimer’s Disease aducanumab(2018)
Breast Cancerribociclib(2017)
32 Grow Share
Note:1. NSC (Non-small Cell) NASH (Nonalcoholic Steatohepatitis)

Oncology Remains Key Pain Point for Payors: CVS/specialty Developing Innovative Approach
FIVE MODIFIABLE COST FACTORS
CVS/specialty Developing Innovative Approach
AVERAGE EPISODE SPEND BY PROVIDER: BREAST CANCER
Regimen SelectionOutliers 7-8X median
Use of Generics
Duration of Therapy
Use of Generics
Site of Care
75th percentile: $60K
Median: $42K$30K
Use of Supportive AgentsDrug Related Cost per Episode
25th percentile: $30K
33 Drive Innovation
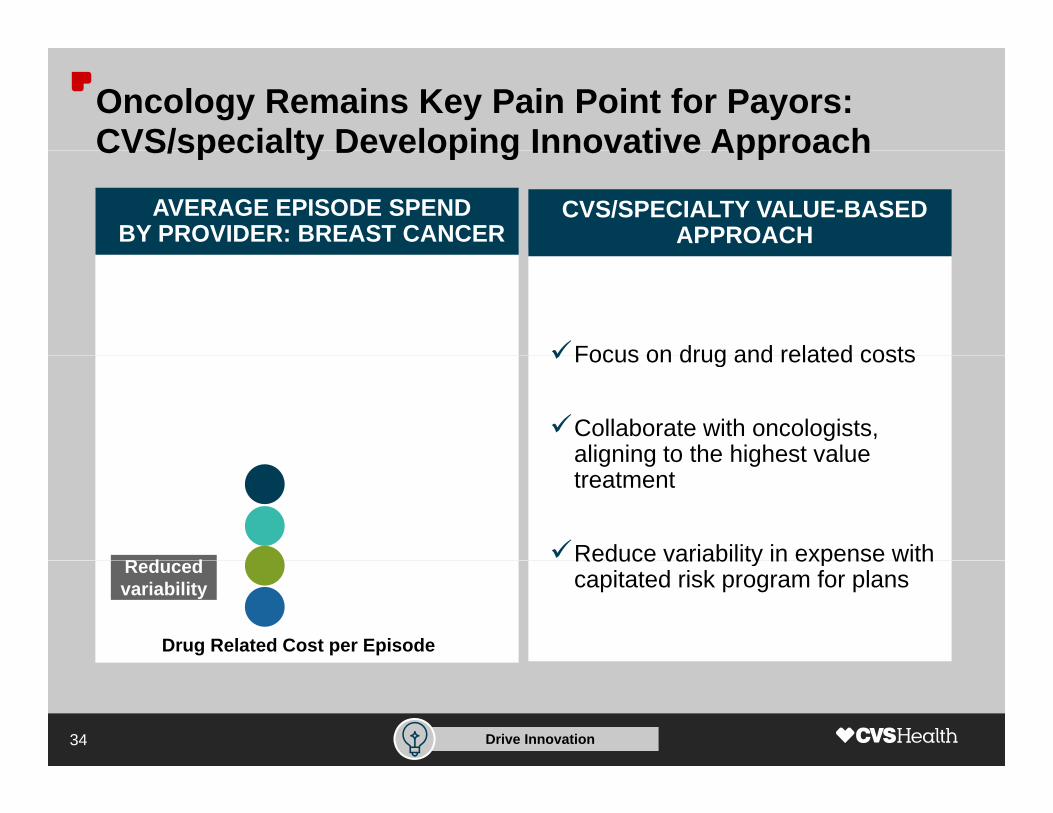
Oncology Remains Key Pain Point for Payors: CVS/specialty Developing Innovative Approach
CVS/SPECIALTY VALUE-BASED APPROACH
CVS/specialty Developing Innovative Approach
AVERAGE EPISODE SPEND BY PROVIDER: BREAST CANCER
Focus on drug and related costsFocus on drug and related costs
Collaborate with oncologists, aligning to the highest valuealigning to the highest value treatment
Reduce variability in expense withR d d Reduce variability in expense with capitated risk program for plans
Drug Related Cost per Episode
Reduced variability
34 Drive Innovation

Adding New Capabilities to the Enterprise Augments Organic Growth Strategies Augments Organic Growth Strategies
Industry DynamicsInfusion Share
• More people ‘aging in place’
• Home as lowest-cost site 6%5% 5%
of care
• Administrative burden for plans10%
• Enhanced quality standard, 503B, most stringent in the industry
74%
All others
Infusion A Infusion C
CVS/specialty Infusion Services
Infusion B
Enterprise Focus 35
Source: HarrisWilliams&Co – Home Infusion Industry Overview, June 2014.

New Relationship with Leading Social Network for Patients with Chronic DiseasePatients with Chronic Disease
MyHealthTeams
Enterprise Focus 36

New Relationship with Leading Social Network for Patients with Chronic DiseasePatients with Chronic Disease
300K 48%Registered Users Active Users
CreatingCreating Awareness
and EngagementIncreasing
Script Growth
Enterprise Focus 37

The Right Strategy for an Evolving Health Care Market
Improving specialty patient and provider experienceDemonstrating ValueAdvanced trend management solutions for clientsto People, Payors and Providers
Leading expertise and position in all specialtysegmentsGrowing the Core, segments
Strategic acquisitions to enhance product position
g ,Broadening the Base
Innovating to meet customer and patient needsAlways Looking Innovating to meet customer and patient needs
Expanding into social media; developing oncologyAlways Looking
Ahead
Balanced growth portfolio
Scalable operating modelDriving Sustainable Enterprise Growth
Capitalizing on Growth Opportunities in Specialty

Endnote
1. , CVS/specialty, Coram, Novologix, Accordant, CVS/pharmacy, and Specialty Connect are trademarks or registered trademarks of CVS Pharmacy, Inc.
39

Changing the Face ofChanging the Face of Retail Pharmacy Through Innovation
Helena FoulkesExecutive Vice President & President CVS/pharmacyPresident, CVS/pharmacy

Agenda
Strong Core PerformanceStrong Core Performance
Expanding Our Footprint
Reinventing Retail Pharmacy to Drive Outcomes
Evolution of CVS/minuteclinic
Driving Growth in Front Store
2

Retail Pharmacy at a Glance
2015E CVS/pharmacy Revenue
72% Pharmacyy
Pharmacy is a significant portion of retail revenue
3

Strong Record of Share Growth in BothPharmacy and Front StorePharmacy and Front Store
Health & Beauty ShareCVS/pharmacy Share of Total U.S. Retail Prescriptions
11.5% 12.0%+50bps
19.2%21.6%
+240bps
2010 2015E
Note:
2010 2015E
Note: Note:1. Market = remainder of Food/Drug/Mass;compares 2015 YTD through
August to 2010 Jan through AugustSource: IRI
Note:1. Compares 2015 90 day adjusted scripts from January through August to
2010 January through AugustSource: IMS
4

Continued Strength in Core RetailPharmacy BusinessPharmacy Business
Growth in Prescriptions(2010 – 2015)
38%
~2X19%
~2X Faster
Nearly 44% of our growth
through non-CVS/caremarkCVS/caremark
payors
All Other MarketCVS/pharmacy
Notes:1 Compares total CVS/pharmacy prescriptions for 90 day adjusted scripts January through August for 2010 compared with January through August for 20151. Compares total CVS/pharmacy prescriptions for 90 day adjusted scripts January through August for 2010 compared with January through August for 2015 2. Compares total market (excluding CVS/pharmacy) for 90 day adjusted scripts January through August for 2010 compared with January through August for 20153. Reduction in labor cost to fill excludes wage inflation.Source: IMS
5

Continued Strength in Core RetailPharmacy BusinessPharmacy Business
Growth in Prescriptions(2010 – 2015)
38%
~2X ~13%reduction in labor
19%
~2X Faster
cost to fill each Rx since 2010
All Other MarketCVS/pharmacy
Notes:1 Compares total CVS/pharmacy prescriptions for 90 day adjusted scripts January through August for 2010 compared with January through August for 20151. Compares total CVS/pharmacy prescriptions for 90 day adjusted scripts January through August for 2010 compared with January through August for 2015 2. Compares total market (excluding CVS/pharmacy) for 90 day adjusted scripts January through August for 2010 compared with January through August for 20153. Reduction in labor cost to fill excludes wage inflation.Source: IMS
6

We Are Continuing to Use Various Channels to Drive Growth in Pharmacy VolumeGrowth in Pharmacy Volume
Retail (CVS/pharmacy & CVS/minuteclinic)
CVS/caremark Target PartnershipCVS/caremark Target Partnership
Omnicare Acquisition
Leveraging our integrated model to drive pharmacy innovation
7
Leveraging our integrated model to drive pharmacy innovation

Success in High Margin Health & Beauty Businesses
Health & Beauty Sales($, billions)
Key Takeaways
Th i h
11.0
9 2
+3.7% CAGR
• These are categories where we have a right to win, most closely tied to pharmacy
P j t d t 2X f t9.2 • Projected to grow 2X faster than General Merchandise & Edibles over the next 3 years
M i i 1 7X hi h th th• Margin is 1.7X higher than other categories
2010 2015E
Note:1. 2015 YTD through August with estimate through end of year.Source: CVS Health Internal Analysis.
Sources: CVS Health Internal Analysis, IRI, Mintel market reports, Global-Markets reports, ITE Beauty, CVS Health Internal Analysis.
8

Continued Success in Store Brands
Store Brands Penetration Key Takeaways
~22%25%
• Penetration increased ~300 bps since 2014, with 150 bps attributable to tobacco exit
Store
~17% • CVS Store Brands growing more than 2X faster than industry
• Focus on Healthy Food exclusive• Focus on Healthy Food, exclusive Beauty brands and core OTC
2010 2015E Goal
Store Brands driving front store margins
9
Note:1. Based on SB Drug market.Sources: CVS Health Internal Analysis; IRI 2015 YTD through August.
Agenda
Strong Core Performance
Expanding Our FootprintExpanding Our Footprint
Reinventing Retail Pharmacy to Drive Outcomes
Evolution of CVS/minuteclinic
Driving Growth in Front Store
10

Growing Our Business Through Acquisition of Target Pharmacies and ClinicsTarget Pharmacies and Clinics
TARGET PHARMACIES TARGET CLINICS
• ~80 clinics
380 li i l
• More than 1,660 pharmacies
• ~4 000 pharmacists • ~380 clinical providers and staff members
• ~4,000 pharmacists
• ~10,000 technicians
80 fi ld l d• 430,000 annual
visits
• ~80 field leaders
• ~100 million prescriptions filled annuallyfilled annually
Expands footprint of pharmacies by ~20% and clinics by ~8%
11
Note:1. FY 2014 data, prescriptions on a 30-day equivalent basis.Source: Target.

Target Pharmacies Complement and Expand Our Existing Footprint, Increasing Patient AccessExisting Footprint, Increasing Patient Access
ORID SD
CO
New regions include …• Seattle
AK
• Denver• Portland• Salt Lake City
Current CVS/pharmacy states
12
New states

Transitioning New Assets to Our Brand and Network
• Rebrand as CVS/pharmacy and MinuteClinicy• Introduce unique CVS clinical programs and capabilities• Focus on driving script growth and profitability
13

Acquisition Will Benefit New and Existing Patients
Opportunity to Narrow the Prescription Volume Gap…
… and Help Patients on Their Path to Better Health
• Target guests gain access to best-in-class health care services
M i t Ch i
Average Prescriptions per Pharmacy
p p
– Maintenance Choice– Pharmacy Advisor– Specialty Connect
• Currently ~5% to 7% of Target
~2X
• Currently ~5% to 7% of Target guests use Target pharmacies; CVS Health can drive that percentage higher
Target CVS/pharmacy
14
Note:1. FY 2014 data, prescriptions on a 30-day equivalent basis.Source: Target.
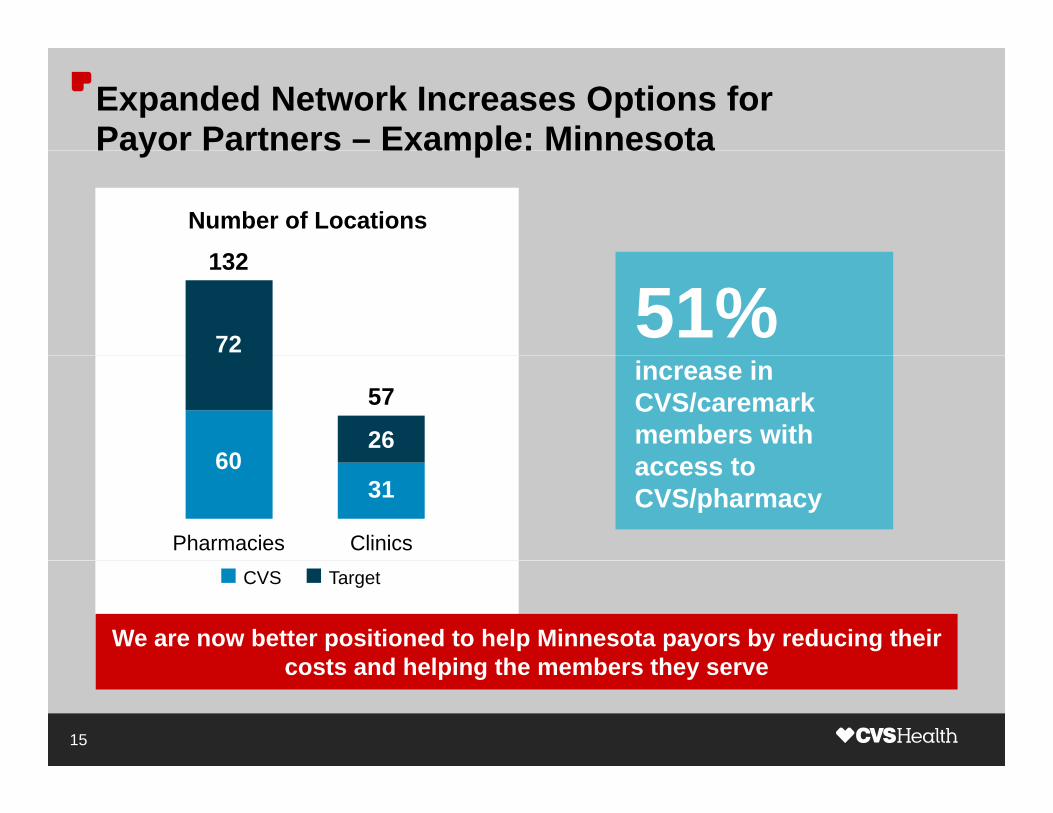
Expanded Network Increases Options for Payor Partners – Example: MinnesotaPayor Partners Example: Minnesota
132Number of Locations
51%132
72increase in CVS/caremarkmembers with
t60
57
26access to CVS/pharmacy
Pharmacies Clinics
6031
We are now better positioned to help Minnesota payors by reducing their costs and helping the members they serve
CVS Target
costs and helping the members they serve
15

Agenda
Strong Core Performance
Expanding Our Footprint
Reinventing Retail Pharmacy to Drive OutcomesReinventing Retail Pharmacy to Drive Outcomes
Evolution of CVS/minuteclinic
Driving Growth in Front Store
16

Unique Model Enables Deep Understanding of Both B2B and B2C Capabilities B2B and B2C Capabilities
I d B2B d B2C C bili iIntegrated B2B and B2C Capabilities
B2B
B2CUniquely positioned
for the retailization of health care with the
Focus onpayors and
providers to drive B2C health care with the power of our
face-to-face model
providers to driveoutcomes
17

Five Key Innovations Are Delivering Value to Customers and Strategic Partners Customers and Strategic Partners
Next Generation Patient Care
ScriptSync
1
2 ScriptSync
Specialty ConnectValue to
Customers and
2
3
Strategic Partnerships
andPartners
4
Digital Integration 5
18

Next Generation Patient Care: New Patient-centric Approach to Drive Retail Pharmacy Growth
1
centric Approach to Drive Retail Pharmacy Growth
Traditional Pharmacy Model Next Generation Patient Carey
Demographics
Customer insights enable patient-centric, targeted approach
Broad-basedservice
to all
Demographics
to allGeography Clinical inputs
Shift to a more personalized strategy to drive adherence and outcomes
Customerpreferences
19

Example: Proactive Weather Campaign – Partnering with the U.S. Department of Health & Human Services
1
with the U.S. Department of Health & Human Services
Mobilized and Launched in 36 Hours
Positive Responses Across Multiple Channels
~185k voice calls “ Thank you very much; you guys are awesome. I am so glad I have you for my drugstore.”
p
~400k automated
calls
“ I didn’t know CVS was doing this type of thing now. How nice!”
- CVS SMS patient response
- CVS live call patient
“ What a class company; just got a call ahead of severe weather stating to check if I had enough meds … If I wasn’t a fan b f thi ld h l d th d l!”
~220k voicemails
p~175k texts
sent
before, this would have sealed the deal!”
More sophisticated outreach helps our business and our customers
- CVS live call patient
20

ScriptSync: Making It Easier for Our Patients to Manage Multiple Medications
2
Pre-ScriptSync
Manage Multiple Medications
Post-ScriptSyncPost-ScriptSync
JANUARY FEBRUARY
Consolidates to one pick-up date each month
Solution benefits patients, payors and CVS
Provides improved patient adherence Creates efficiencies for pharmacy teams
21
~70% of patients accept the program when offered; >500k have enrolled

Specialty Connect: Seamless Customer Experience for All Specialty Care Needs at CVS/pharmacy
3
for All Specialty Care Needs at CVS/pharmacy
Patients Receive Support from Both Local Pharmacistsand Specialty CareTeam Experts
Local CVS pharmacistcan help onboard
Specialty CareTeamprovides ongoing counselingcan help onboard
specialty patients
93% patient satisfaction • 62% Net Promoter Score • Adherence up 11.4%
provides ongoing counselingto support adherence
22

Strategic Partnerships: We Partner with BCBSA Federal Employee Program to Provide Customer Care
4
Federal Employee Program to Provide Customer Care
Encouraging FEP Members with Diabetes to Complete an A1c Test
3. HealthTag message2. Face-to-face counseling from pharmacist about A1c tests at CVS/minuteclinic
1. Letter from plan
An important message about your healthcare
The American Diabetes Association (ADA) recommends you check your Hemoglobin A1C value, also known as A1C, at least every six (6) months to assess how controlled your diabetes is. It’s important to remember that your A1C level is different from the blood glucose (sugar) results that you may test on your own at home. Testing your blood glucose at home is a good way to see how your sugar levels are at the time you are testing. An A1C test is different and important because it will show you and your doctor how controlled your diabetes is over time. Your doctor may suggest things you can do to improve your diabetes depending on your A1C test results.
Our integrated model allows us to deliver targeted messages and drive better outcomes for clients and patientsbetter outcomes for clients and patients
23

Strategic Partnerships: A Resource for Health Plansas They Respond to the Retailization of Health Care
4
as They Respond to the Retailization of Health Care
Val e to Health PlansValue to Health PlansCost-effective way to drive member acquisition, engagement and retention
Value to ConsumersConvenient access to health insurance resourceshealth insurance resources for customers
Value to CVS HealthI d t i tIncreased trips to CVS/pharmacy
24

Digital Drives Adherence, Pharmacy Growth and Loyalty
5
Loyalty
Prescriptions Filled
1 in 3 patients enrolled in text messaging2.4X
More than 200 million text reminders sent to patients
Non-Digital Patients Digital
Added medication reminder and mobile Rx pick-up toolsg g
Patients
Digital integration creating a better experience for patients
25

Agenda
Strong Core Performance
Expanding Our Footprint
Reinventing Retail Pharmacy to Drive Outcomes
Evolution of CVS/minuteclinicEvolution of CVS/minuteclinic
Driving Growth in Front Store
26

2010: 454 MinuteClinic Locations
Full-time clinics
454
Full-time clinicsin 2010
27

2015: 1,055 MinuteClinic Locations in 32 States and Washington, D.C.Washington, D.C.
Full-time clinics
1,055+
Full-time clinicsin 2015
28

2016: 1,055 MinuteClinic Locations in 32 States (and D.C.) and Integrating ~80 Target ClinicsD.C.) and Integrating 80 Target Clinics
Full-time clinics
1,135
MinuteClinic Target ClinicClinic StateLegend:
Full-time clinicsin 2016
More than 50% of the U.S. population is within 10 miles of a MinuteClinic
29

CVS/minuteclinic Expanding Scope of Care on Epic Electronic Health Record PlatformElectronic Health Record Platform
Epic Implementation Primary Care Services:50 Most Common Diagnoses
• National MinuteClinicroll-out of Epic EHR completed in 2015
• Epic EHR has extended connectivity to about 250 provider organizations 11Expanded
~56%of most
• Enables accelerated roll-out of new services
17Historical C S/
11Diagnoses
(22%)
pCVS/minuteclinic
Scope common
diagnoses
Notes:
Diagnoses(34%)
CVS/minuteclinicScope
30
1 Diagnoses not weighted by individual volume.2 Examples of expanded scope include gastrointestinal illnesses, musculoskeletal pain.Source: Top 50 Codes: 2015 Family Practice. www.aapc.com/icd-10.

Looking Ahead: Expanding Digital Services and Partnering to Expand TeleHealthPartnering to Expand TeleHealth
Partnering for TeleHealthDigital Solutions
Online wait times
Remotequeuing
Futureschedulingscheduling
Innovations will continue to evolve our model of convenient and affordable health care
31
affordable health care

Agenda
Strong Core Performance
Expanding Our Footprint
Reinventing Retail Pharmacy to Drive Outcomes
Evolution of CVS/minuteclinic
Driving Growth in Front StoreDriving Growth in Front Store
32

Continue to Expand Our Basket Despite Industry HeadwindsIndustry Headwinds
Growth in Sales per CVS Basket(2015 over 2014)
U.S. Store Trips(trips per person per year)
4.0%150 148 143
-2%
2.0%
Overall Health & Beauty201520142013
Focus on driving profitable front store growth, attracting new pharmacy patients
Note:1. U.S. shopper for Food/Drug/Mass retail.Source: IRI.
Note: 1. All transactions are for TY vs. LY YTD August and adjusted to exclude tobacco.Source: CVS Health Internal Analysis.
33

We Launched Front Store Strategy in 2015 with Five Key Themes to Drive GrowthFive Key Themes to Drive Growth
B L di H lth dBe a Leading Health and Beauty Destination
1 2 3 54MyCVSStore
ElevateBeauty
Better Health Made Easy
Digital Innovation
Customer-Driven
Personalization
Investing for the Future
34

We Launched Front Store Strategy in 2015 with Five Key Themes to Drive GrowthFive Key Themes to Drive Growth
B L di H lth dBe a Leading Health and Beauty Destination
1 2 3 54MyCVSStore
ElevateBeauty
Better Health Made Easy
Digital Innovation
Customer-Driven
Personalization
In-store enhancements in the chain
35

We Executed Key Elements of Our Better Health Made Easy and Elevate Beauty Strategy in 3 Different Ways
In-store enhancements
Easy and Elevate Beauty Strategy in 3 Different Ways
21Store Remodel
2ElevateBeauty
Better Health Made Easy
Light Touch Store Enhancement
AssortmentExpansion
36

These Changes Have Enhanced Thousands of Stores and Improved Customer Experienceand Improved Customer Experience
In-store enhancements
1 2Store
Remodel
• Prioritized Health, Healthy Food and Beauty for ~450 stores
• +250 bps sales lift in overall front store performance
ElevateBeauty
Better Health Made Easy
store performance
Light Touch Store • Focus on elevating beauty
fi t t i i l tStore Enhancement
fixtures at a minimal cost
• Rolled out Better-for-You Healthy F d t t i h i
AssortmentExpansion
Foods assortment in chain• Continuing to expand key
segments & product lines (e.g., nutrition bars)
37
Note:1. Store reset doors (n=85) at steady state (24+ weeks post-construction, through 9/26).

Better Health Made Easy: Revolutionizing Healthy Food Industry
1
Food Industry
“• Edibles up +8.5% overall in remodel stores
I love the fact CVS added so much healthy food – CVS is really putting their money where
• 75% of shoppers indicate an intention of shopping more for on-the-go snacking at CVS ”
their money where their mouth is!
38
Note:1. Store reset doors (n=85) at steady state (24+ weeks post-construction, through 9/26).

Better Health Made Easy: Leading Change from Sick Care to Self Care
1
Sick Care to Self Care
Health Quadrant Hearing & Optical Center Pilots
• Health up +1.9% in remodeled stores
• Key categories such as Vitamin, Allergy, Cold have seen high growth due to space optimization
• 12 pilot stores launched in 2015
• Expanding on innovative health-oriented services in the store
39
Note:1. Store reset doors (n=85) at steady state (24+ weeks post-construction, through 9/26).

Elevate Beauty: Multi-step Process to Re-imagine Beauty Segment
2
Before
Beauty Segment
(2014)
40

Elevate Beauty: Multi-step Process to Re-imagine Beauty Segment
2
Beauty Segment
After1. Elevated Cosmetics WallAfter
4,500stores
41

Elevate Beauty: Multi-step Process to Re-imagine Beauty Segment
2
Beauty Segment
AfterAfter
2. Self Service Customer Units
1 6001,600stores
42

Elevate Beauty: Multi-step Process to Re-imagine Beauty Segment
2
Beauty Segment
After
3. Elevated Facial
After
2,000,stores
43

Elevate Beauty: Multi-step Process to Re-imagine Beauty Segment
2
Beauty Segment
AfterAfter
Remodel Store Results Beauty / Personal Care: +3.7%y
44
Note:1. Store reset doors (n=85) at steady state (24+ weeks post-construction, through 9/26).
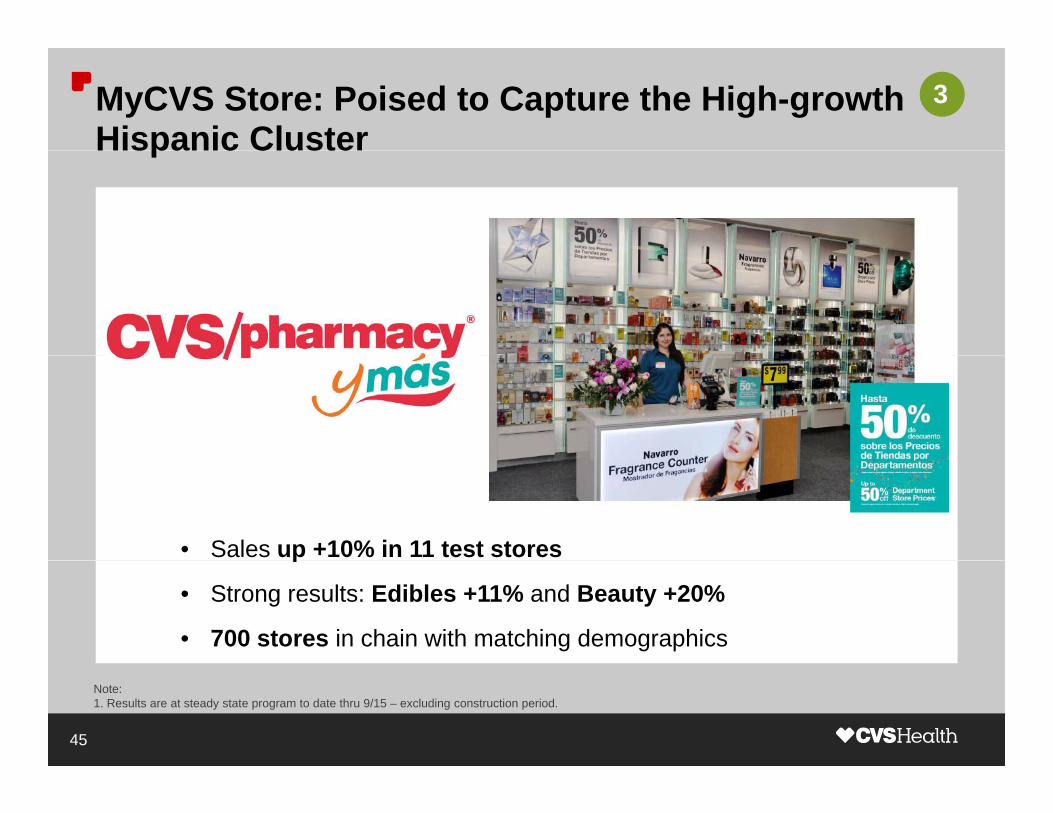
MyCVS Store: Poised to Capture the High-growth Hispanic Cluster
3
Hispanic Cluster
• Sales up +10% in 11 test storesp
• Strong results: Edibles +11% and Beauty +20%
• 700 stores in chain with matching demographics
45
Note:1. Results are at steady state program to date thru 9/15 – excluding construction period.

Customer-driven Personalization: The Future Is Personalization by Leveraging ExtraCare
4
Personalization by Leveraging ExtraCare
More Efficient Promo Spending Accretive to Margin
• De-emphasizing promotion that loses margin
Certain Circular Promotion (e.g. Soda) Drive Sales But Lose
Margin
Certain Circular Promotion (e.g. Soda) Drive Sales But Lose Margin
• Prioritizing promotion with lower sales but significantly positive Marging y pmargin
• Aspiring to deliver promotions that driveDivestment Investment Investment in promotions that drive higher sales and margin
Divestmentfrom negativemargin promo(e.g., soda)
Investmentin high margin
promo(e.g., vitamins)
Investment inPersonalization
46

Customer-driven Personalization: Using Shopping Behavior to Segment and Value Our Customers
4
Behavior to Segment and Value Our Customers
Lower FS Value CustomersLower Front Store Value Customers
20%
70%
Higher FS Value Higher Front Store
80%
CustomersValue Customers
FS Shoppers FS Revenue
30%
47
FS Shoppers FS Revenue

Customer-driven Personalization: Leverage Data to Produce Relevant and Personalized Communications
4
Produce Relevant and Personalized Communications
Customer Level Data Used to Model and Predict Behavior
CustomerBehavior
• Buys Hair Color• Increasing promo sensitivity
Our Strategy• Establish routine• Create a reason to visit weekly
1:1 C
• Personalized resupply reminder email monthly
Hi h l Communicationy
• Personalized sale items
Average weekly spend up 38% and average redemption rate up almost 2X
Higher value customer
g y p p g p p
48
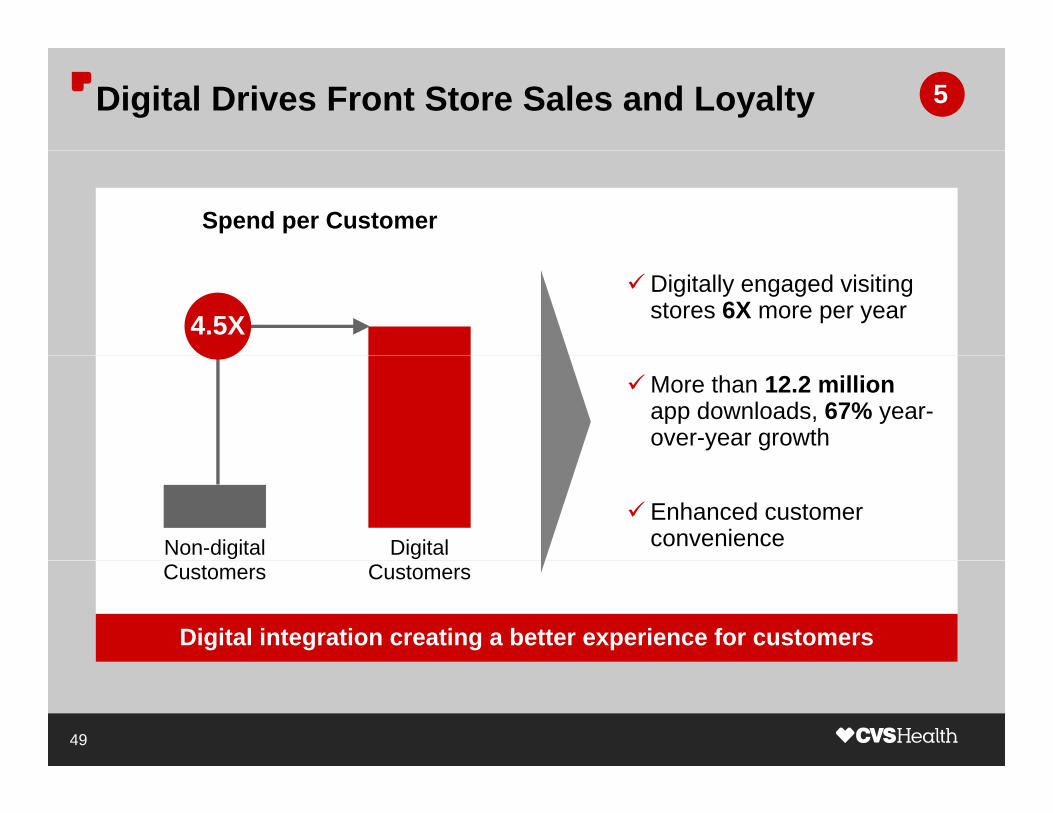
Digital Drives Front Store Sales and Loyalty 5
Spend per Customer
Digitally engaged visiting stores 6X more per year 4.5X
More than 12.2 million app downloads, 67% year-over-year growth
Enhanced customer convenienceNon-digital Digital
Digital integration creating a better experience for customers
Customers Customers
49

The Right Strategy for an Evolving Health Care Market
Delivering value through adherenceDemonstrating ValueReducing cost of care for all stakeholdersto People, Payors and Providers
Continuing Rx innovation to serve customer needsGrowing the Core, Strengthening leadership in overall health & beauty
g ,Broadening the Base
Driving digital innovation across the enterpriseAlways Looking Driving digital innovation across the enterprise
Anticipating evolving customer health needsAlways Looking
Ahead
Growing footprint to reach customers and patients
Expanding breadth of health services and productsDriving Sustainable Enterprise Growth
Changing the Face of Retail Pharmacy through Innovation

Endnote
1. , CVS/pharmacy, Omnicare, CVS/minuteclinic, CVS/caremark, Specialty Connect, ScriptSync, MinuteClinic, MyCVS are trademarks or registered trademarks of CVS Pharmacy, Inc.
51

Serving Patients AcrossServing Patients Across the Continuum of Care
Rocky KraftExecutive Vice President & President OmnicarePresident, Omnicare

Agenda
Senior Care Market OverviewSenior Care Market OverviewSenior Care Market OverviewSenior Care Market Overview
Omnicare: A Leader in Long-term Care Pharmacy
CVS/omnicare Positioned to Drive Value in an Evolving Health Care Market
2

Aging Population Shaping U.S. Health Care System
Under 65 Years(lives, millions)
Aged 65-84 Years(lives, millions)
Aged 85+ Years(lives, millions)
+4% +56% +45%
274 278 285
50
65
7
9
41 6 7
2015 2020 2030 2015 2020 2030 2015 2020 2030
10,000 baby boomers projected to turn 65 every day for next 15 years
3
Source: U.S. Census Bureau.

Increase in Older Population Driving the Need for Long-term Care Services and SupportLong term Care Services and Support
Population Requiring LTC Services
Trends in Need for LTC Services
27+80%
(lives, millions)• 70% of people over age 65 will
require some form of LTSS
15
27 • Number of frail adults rising rapidly with expanding older population
• Between 2000 and 2040, number of older adults with disabilities is expected to i f 10 t 21 illi
2000 2050increase from 10 to 21 million
By 2050, 27 million people will need long-term care services and supportNote:1. Long-Term Services & Support (LTSS) based on limitations regardless of age, cause, etc.Source: Long Term Care Services in the U.S.: 2013 Overview: U.S. Department of HHS.
4

Navigating Through the Senior Care Continuum
Assisted SkilledIndependentResidential/
High AcuityLow Acuity
Cooking cleaning Dining social and Social activities, 24 hour
Living(ALF)
Nursing(SNF)
pLiving
(IL)Home Aide
SERVICES Cooking, cleaning, transportation, etc.
Dining, social, and recreational services assistance with
ADLs
24-hournursing care
Retail, mail orderRetail, mail order,
institutional pharmacy
Institutional pharmacy, retail,
mail order
Institutionalpharmacy
SERVICES PROVIDED
PHARMACYCHOICE pharmacy mail order
Not Available $3 Billion $5 Billion $8 BillionANNUAL RXSPEND
TOTAL COST 1.0% Not Available 2.5% 3.7%TOTAL COST5-YR CAGR
Omnicare: Industry leader in ALF and SNF markets
5
Sources:1. IMS Health, Goldman Sachs Global Investment Research (September 2014).2. Genworth 2015 Cost of Care Survey.

Agenda
Senior Care Market OverviewSenior Care Market Overview
Omnicare: A Leader in Long-term Care PharmacyOmnicare: A Leader in Long-term Care Pharmacy
CVS/omnicare Positioned to Drive Value in an Evolving Health Care Market
6

An Industry Leader in Long-term Care Pharmacy
Institutional Post-acute Revenue($, billions) Omnicare Advantages
• Leading pharmacy provider to elderly in chronic care settings
4.8Omnicare
(1)
• $4.8 billion in revenue
• Approximately 100 million scripts dispensed annually
1.9Next largestscripts dispensed annually
• Approximately 2 million unique patients served annually9.4All others
Notes:
7
Notes:1. Publicly disclosed 2014 revenue.2. Revenue is estimated for Skilled Nursing, Assisted Living and Independent Living communities.3. For the year ended December 31, 2014. Long-Term Care Pharmacy Revenue only:; does not include manufacturing services.

Omnicare Value Proposition Gives Us a Competitive Advantage in the Long-term Care MarketAdvantage in the Long term Care Market
N ti id f t i tNationwide footprint
Efficient operations
Robust clinical infrastructure
Innovative technology
8

Omnicare’s Nationwide Footprint Makes Us an Ideal Partner for National Providers and Their Residents
A D V A N T A G E # 1
Partner for National Providers and Their Residents
80% within 50 miles
9

CVS/omnicare’s Expanded Retail Footprint Further Enhances Our Ability to Serve Our Customers
A D V A N T A G E # 1
Enhances Our Ability to Serve Our Customers
80% within 5 miles
10

Operating Efficiency Ensures Our Low-cost PositionA D V A N T A G E # 2
Infrastructure
• Hub and spoke network− Enabler for automation, efficiency and quality service
Automation
• Hub pharmacies utilize automation technologiesImproves dispensing accuracy while reducing operating costs
On-site Dispensing
− Improves dispensing accuracy while reducing operating costs
• On-site first fill / emergency dose− Key component to emergency dose strategy and delivery
cost management
11

Our Robust Clinical Services Drive Better Outcomes While Lowering Costs
A D V A N T A G E # 3
Outcomes While Lowering Costs
On-site Consultant Pharmacists
Clinical Intervention Centers
ClinicalDifferentiationPharmacists
• Patient-facing services within institution
Centers
• Formulary adherence
• Generic penetration
• Quality-based cost containment
Differentiation
• Driving adherence improvement
• Reducing avoidable
• Therapeutics interchange
• Non covered charges
• Standardized processes
• 2% to 5% savings readmissions • Non-covered charges for customers and
patients
12

Innovative Technology Solutions Resonate with Our Customers and Drive Higher Retention Rates
A D V A N T A G E # 4
Our Customers and Drive Higher Retention Rates
Omniview MyOmniview
Omnicare’s secure web-based worksite for customer facilities, prescribers and patients
13
prescribers and patients

Innovative Technology Solutions Resonate with Our Customers and Drive Higher Retention Rates
A D V A N T A G E # 4
Our Customers and Drive Higher Retention Rates
• Designed for residents gof communities and their caregivers
• Access financial• Access financial information and health records
T lk ith h i t• Talk with a pharmacist
MyOmniview
Omnicare’s secure web-based worksite for customer facilities, prescribers and patients
14
prescribers and patients

Innovative Technology Solutions Resonate with Our Customers and Drive Higher Retention Rates
A D V A N T A G E # 4
Our Customers and Drive Higher Retention Rates
• Secure customer ffacing technology
• Optimize cost effectiveness
• Enhance medication management
• Expedite patient care
Omniview
Omnicare’s secure web-based worksite for customer facilities, prescribers and patients
15
prescribers and patients

Agenda
Senior Care Market OverviewSenior Care Market Overview
Omnicare: A Leader in Long-term Care Pharmacy
CVS/Omnicare Positioned to Drive Value in an Evolving Health Care MarketCVS/omnicare Positioned to Drive Value in an Evolving Health Care Market
16

Multiple Opportunities for Driving Enterprise Value from CVS/omnicare Both Near- and Long-termfrom CVS/omnicare Both Near and Long term
Drive Deliver Future
Revenue
Integrating Phase-in Systems
Leverage Shared
Services
OperationalEfficiencies
• Combined operational
• Focused on transitions of care, market
Synergies
Procurement
• Significant purchasing
• Technology focused on high quality customer
• Leveraging best practices across the business
P d i t l
operational infrastructure
• Improved workflow
care, market adjacencies and differentiated offerings
synergies
• Integrated 1H 2016
customer service and visibility
• Predominately complete by
• Predominately complete by YE 2016
• More efficient delivery service
complete by YE 2016
17

CVS/omnicare Value Proposition Provides New Channels to More Effectively Serve Broader PopulationChannels to More Effectively Serve Broader Population
Skilled Nursing
Assisted Living Independent HomeNursing
Facilities
Transitions Segmented
Living Facilities
pLiving
Broader
Care
CareTransitionsof Care
Segmented Offering
Broader Services
Care Coordination
CVS/omnicare best positioned to serve senior care continuum
18

Enhanced Offering for Skilled Nursing Driven by Improved Coordination During Care Transitions
Skilled Assisted Independent Home
Improved Coordination During Care Transitions
Completenessof Service Offerings
Nursing Facilities
Living Facilities
Independent Living
HomeCare
Omnicare CVS/omnicare
ISSUE RESULTSSOLUTIONS
Omnicare CVS/omnicare
• Medication availability challenges due to lack of care coordination at admission and discharge
• CVS/pharmacy retail footprint extends reach for first fillsE i f di t d
• Better outcomes for the patient, provider and payor
admission and discharge• Hospital discharge re-
admissions costing $4.3B to Medicare
• Expansion of coordinated care services with integrateddischarge solution
19
solution
Source: Study by NIA (National Institute on Aging) and Robert Wood Johnson Foundation based on Medicare inpatient & SNF claims 2000 – 2006.

Segmented Assisted Living Offering in Development to Better Align with Varying Resident Needs
Skilled Assisted Independent Home
to Better Align with Varying Resident Needs
Completenessof Service Offerings
Nursing Facilities
Living Facilities
Independent Living
HomeCare
Omnicare CVS/omnicare
ISSUE RESULTSSOLUTIONS
Omnicare CVS/omnicare
• Acuity level differences in facilities due to state regulations and community type
• Segmented offering to align solutions to the residents’ specific needsG t CVS b d
• Increased resident choice• Improved community
satisfactioncommunity type
• 30% of beds but only 50% of those residents served
• Lack of brand
• Greater CVS brand awareness to improve patient conversion and retention
20
awareness
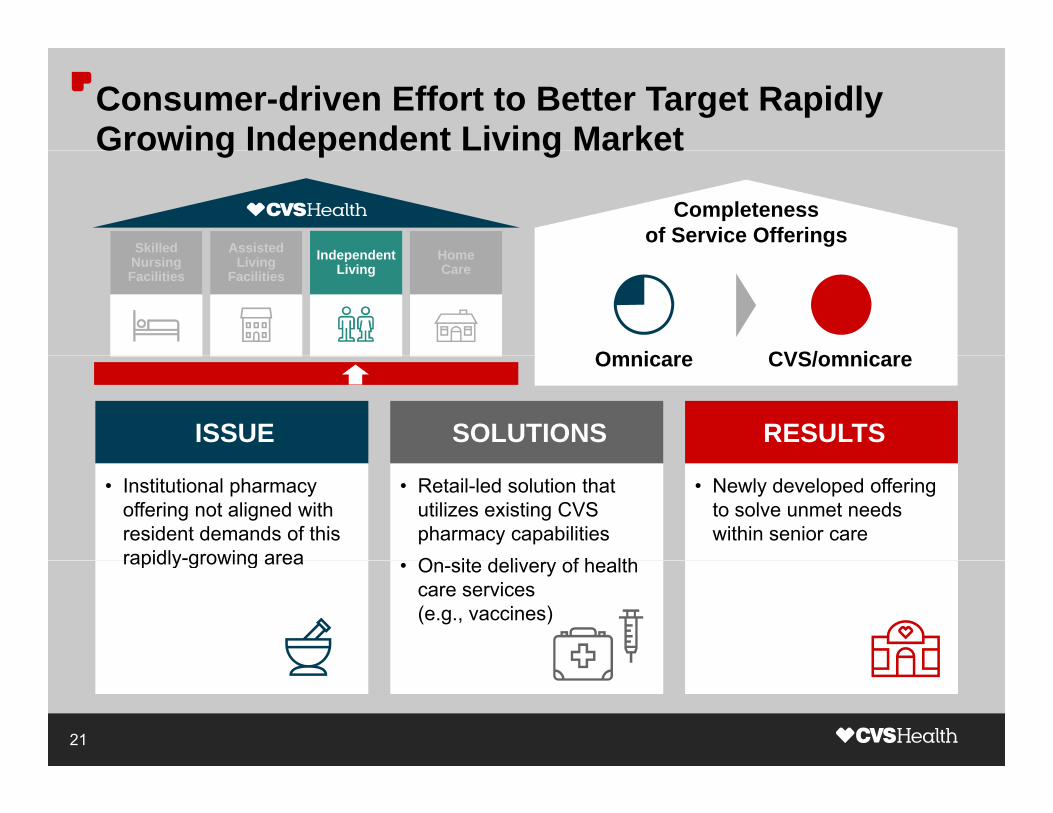
Consumer-driven Effort to Better Target Rapidly Growing Independent Living Market
Skilled Assisted Independent Home
Growing Independent Living Market
Completenessof Service Offerings
Nursing Facilities
Living Facilities
Independent Living
HomeCare
Omnicare CVS/omnicare
ISSUE RESULTSSOLUTIONS
Omnicare CVS/omnicare
• Institutional pharmacy offering not aligned with resident demands of this rapidly-growing area
• Retail-led solution that utilizes existing CVS pharmacy capabilitiesO it d li f h lth
• Newly developed offering to solve unmet needs within senior care
rapidly growing area • On-site delivery of health care services (e.g., vaccines)
21

Care Coordination Offering to Better Serve Seniors Requiring More Acute Services in Home Setting
Skilled Assisted Independent Home
Requiring More Acute Services in Home Setting
Completenessof Service Offerings
Nursing Facilities
Living Facilities
Independent Living
HomeCare
Omnicare CVS/omnicare
ISSUE RESULTSSOLUTIONS
Omnicare CVS/omnicare
• Home care represents the largest aspect of senior care marketO i i f ilit
• Replicate independent living to serve acute patients in home settingC t ti f 2M
• Better outcomes for high-risk patients requiring more acute services
• Omnicare is more facility-centric
• Capture portion of ~2M discharges from SNF setting through new offering
22

The Right Strategy for an Evolving Health Care Market
Omnicare has a differentiated service offering focused on quality, service and expertise to customers and Demonstrating Value q y, ptheir residentsto People, Payors and Providers
Omnicare, as a leader in senior pharmacy services, b d b idi h l d
Growing the Core, broadens our base, providing a new channel and expanding our reach to a broader population
g ,Broadening the Base
A i iti f O i bl t b ttAlways Looking Acquisition of Omnicare enables us to better serve patients across the continuum of care
Always Looking Ahead
Significant opportunities for driving long-term growth Driving Sustainable Enterprise Growth
Serving Patients Across the Continuum of Care

AppendixAppendix
, CVS/Omnicare, Omnicare, Omniview, and MyOmnivieware trademarks or registered trademarks of CVS Pharmacy, Inc.

How Institutional Pharmacy Services Differ
Retail Institutional
Access Open to the public Closed door pharmacies
Deli eries to facilit a erageDispensing Primarily at pharmacy counter Deliveries to facility average 3 times per day
Packaging Primarily bottles/vials Standard compliantspecialized unit dose
Adjudication Prior to dispensingFederally mandated quick
turnaround may require dispensing prior to adjudication
P i il f d Required consultant pharmacistsServices Primarily focused on
patient/caregiver
Required consultant pharmacists provide extensive patient facing
services within facility
Costs Generally lower cost to dispense Extensive regulation significantly increases cost to dispense
25
increases cost to dispense

The Right Strategy for anThe Right Strategy for an Evolving Health Care Marketg
Larry MerloyPresident & Chief Executive Officer
Analyst DayDecember 16, 2015

The Most Extensive Suite of Leading Assets…
Retail MailMailLong-term
CareRetailClinics
Specialty
Infusion
Clinics
Clinical Programs
Patients Medical Claims
Digital
g
Payors ProvidersClaims Editing
…providing the right strategy for an evolving health care market
2

Today’s Key Takeaways
The Right Strategy for an Evolving Health Care MarketThe Right Strategy for an Evolving Health Care Market
Leadership in multiple competencies to drive superior l f h lth t
Demonstrating Valuevalue for health care partnersto People, Payors and Providers
Expanding core pharmacy business while broadening Growing the Core, p g p y greach into new health care channels
g ,Broadening the Base
I t d i i ti d t d ki l tAlways Looking Introducing innovative products and making long-term, value enhancing investments
Always Looking Ahead
Driving shareholder value with strong earnings and cash flow as well as disciplined capital allocation
Driving Sustainable Enterprise Growth
3