Embed Size (px)
DESCRIPTION
CHAPTER # 22 (b). THE RESPIRATORY SYSTEM. Mechanics of Breathing. Pulmonary ventilation consists of two phases Inspiration: gases flow into the lungs Expiration: gases exit the lungs. Pressure Relationships in the Thoracic Cavity. Atmospheric pressure (P atm ) - PowerPoint PPT Presentation
Citation preview
Copyright © 2010 Pearson Education, Inc.
THE RESPIRATORY SYSTEM
CHAPTER # 22 (b)
Copyright © 2010 Pearson Education, Inc.
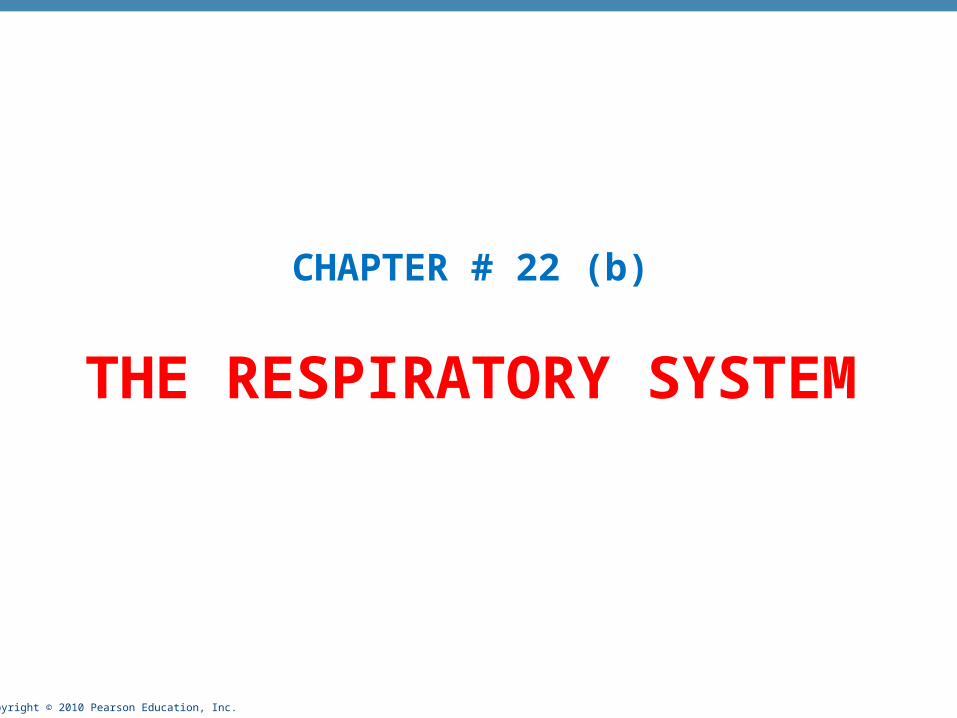
Mechanics of Breathing
• Pulmonary ventilation consists of two phases
1. Inspiration: gases flow into the lungs
2.Expiration: gases exit the lungs

Copyright © 2010 Pearson Education, Inc.
Pressure Relationships in the Thoracic Cavity
• Atmospheric pressure (Patm)
• Pressure exerted by the air surrounding the body
• 760 mm Hg at sea level
• Respiratory pressures are described relative to Patm
• Negative respiratory pressure is less than Patm
• Positive respiratory pressure is greater than Patm
• Zero respiratory pressure = Patm

Copyright © 2010 Pearson Education, Inc.
Intrapulmonary Pressure
• Intrapulmonary (intra-alveolar) pressure (Ppul)
• Pressure in the alveoli
• Fluctuates with breathing
• Always eventually equalizes with Patm
Copyright © 2010 Pearson Education, Inc.
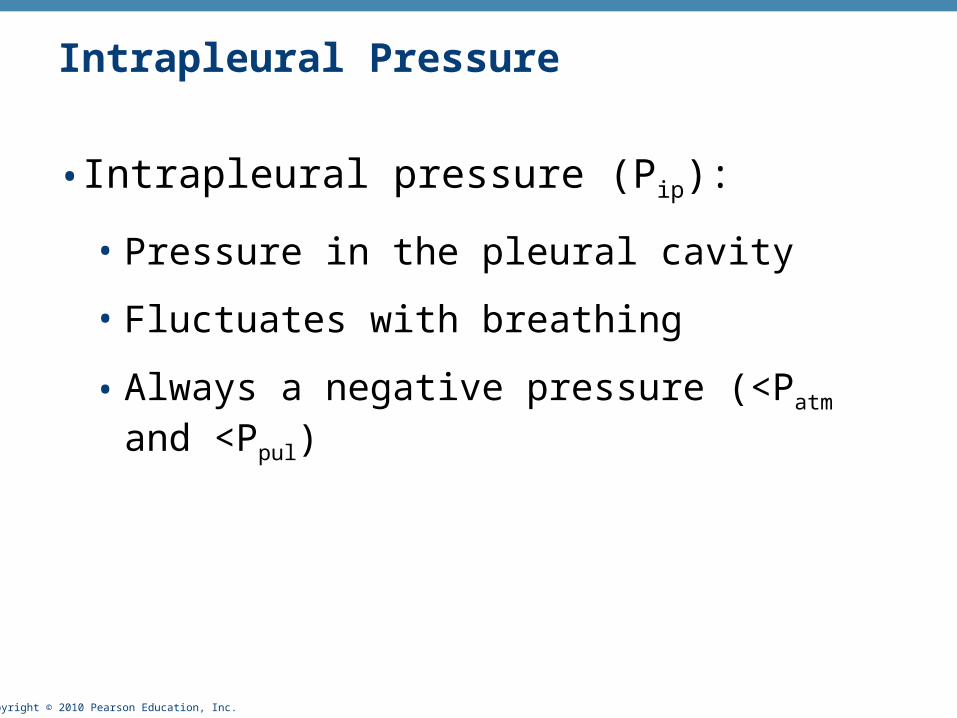
Intrapleural Pressure
• Intrapleural pressure (Pip):
• Pressure in the pleural cavity
• Fluctuates with breathing
• Always a negative pressure (<Patm and <Ppul)

Copyright © 2010 Pearson Education, Inc.
Intrapleural Pressure
• Negative Pip is caused by opposing forces
• Two inward forces promote lung collapse
• Elastic recoil of lungs decreases lung size
• Surface tension of alveolar fluid reduces alveolar size
• One outward force tends to enlarge the lungs
• Elasticity of the chest wall pulls the thorax outward
Copyright © 2010 Pearson Education, Inc.
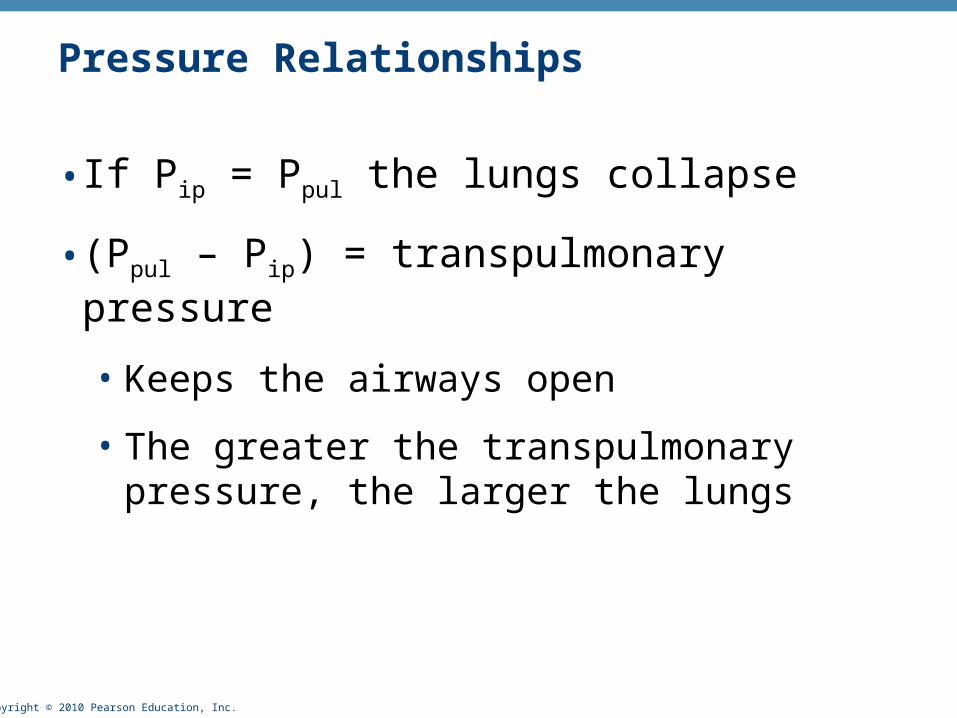
Pressure Relationships
• If Pip = Ppul the lungs collapse
• (Ppul – Pip) = transpulmonary pressure
• Keeps the airways open
• The greater the transpulmonary pressure, the larger the lungs

Copyright © 2010 Pearson Education, Inc. Figure 22.12
Atmospheric pressure
Intrapleuralpressure756 mm Hg(–4 mm Hg)
Transpulmonarypressure760 mm Hg –756 mm Hg= 4 mm Hg
Thoracic wall
DiaphragmLung Intrapulmonary
pressure 760 mm Hg(0 mm Hg)
Parietal pleura
Pleural cavityVisceral pleura
756
760

Copyright © 2010 Pearson Education, Inc.
Homeostatic Imbalance
• Atelectasis (lung collapse) is due to
• Plugged bronchioles collapse of alveoli
• Wound that admits air into pleural cavity (pneumothorax)

Copyright © 2010 Pearson Education, Inc.
Pulmonary Ventilation
• Inspiration and expiration
• Mechanical processes that depend on volume changes in the thoracic cavity
• Volume changes pressure changes
• Pressure changes gases flow to equalize pressure
Copyright © 2010 Pearson Education, Inc.
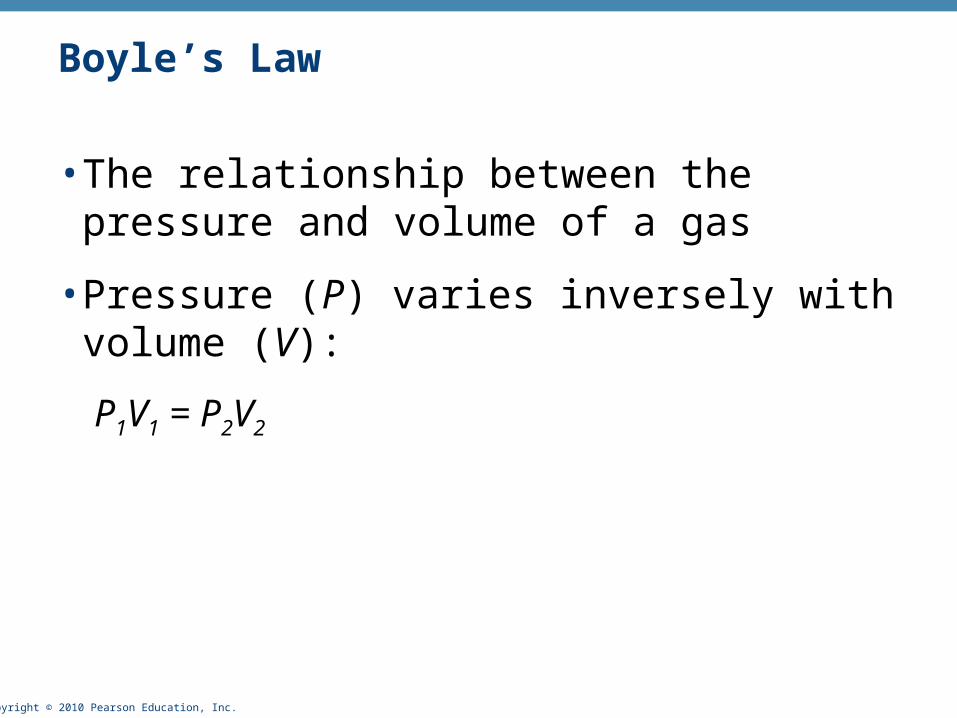
Boyle’s Law
• The relationship between the pressure and volume of a gas
• Pressure (P) varies inversely with volume (V):
P1V1 = P2V2

Copyright © 2010 Pearson Education, Inc.
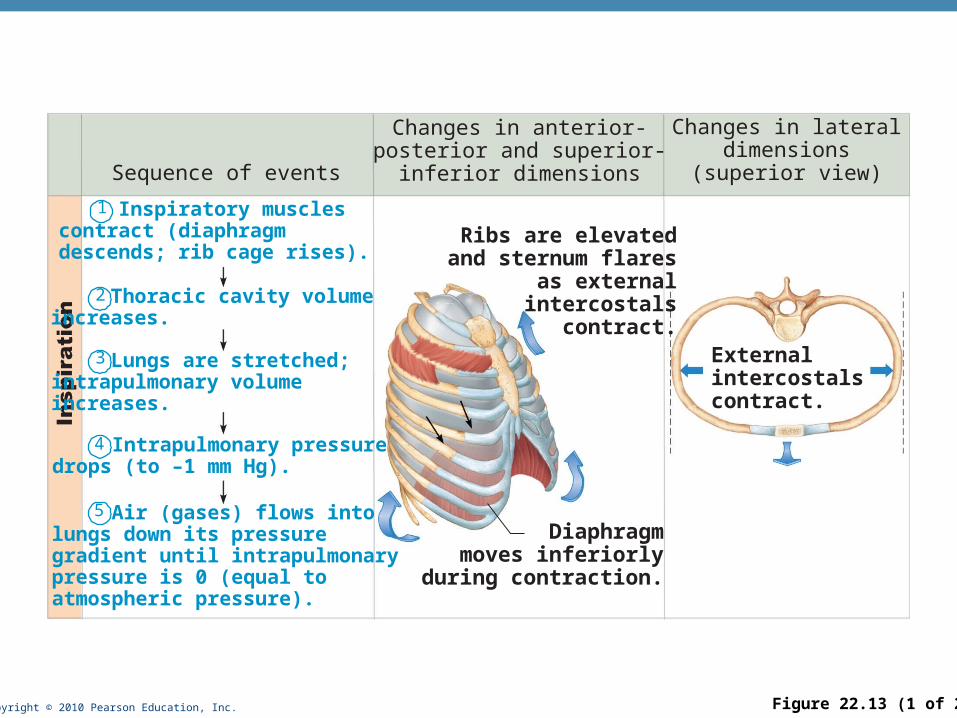
Inspiration
• An active process
• Inspiratory muscles contract
• Thoracic volume increases
• Lungs are stretched and intrapulmonary volume increases
• Intrapulmonary pressure drops (to 1 mm Hg)
• Air flows into the lungs, down its pressure gradient, until Ppul = Patm
Copyright © 2010 Pearson Education, Inc. Figure 22.13 (1 of 2)
Sequence of events
Changes in anterior-posterior and superior-
inferior dimensions
Changes in lateraldimensions
(superior view)
Ribs are elevatedand sternum flares
as externalintercostals
contract.
Diaphragmmoves inferiorly
during contraction.
Externalintercostalscontract.
Inspiratory muscles contract (diaphragm descends; rib cage rises).
2
1
Thoracic cavity volume increases.
3 Lungs are stretched; intrapulmonary volume increases.
4 Intrapulmonary pressure drops (to –1 mm Hg).
5 Air (gases) flows into lungs down its pressure gradient until intrapulmonary pressure is 0 (equal to atmospheric pressure).

Copyright © 2010 Pearson Education, Inc.
Expiration
• Quiet expiration is normally a passive process
• Inspiratory muscles relax
• Thoracic cavity volume decreases
• Elastic lungs recoil and intrapulmonary volume decreases
• Ppul rises (to +1 mm Hg)
• Air flows out of the lungs down its pressure gradient until Ppul = 0
• Note: forced expiration is an active process: it uses abdominal and internal intercostal muscles

Copyright © 2010 Pearson Education, Inc. Figure 22.13 (2 of 2)
Sequenceof events
Changes in anterior-posterior and superior-
inferior dimensions
Changes inlateral dimensions
(superior view)
Ribs and sternumare depressed
as externalintercostals
relax.
Externalintercostalsrelax.
Diaphragmmovessuperiorlyas it relaxes.
1 Inspiratory muscles relax (diaphragm rises; rib cage descends due to recoil of costal cartilages).
2 Thoracic cavity volume decreases.
3 Elastic lungs recoil passively; intrapulmonary volume decreases.
4 Intrapulmonary pres-sure rises (to +1 mm Hg).
5 Air (gases) flows out of lungs down its pressure gradient until intra-pulmonary pressure is 0.
Copyright © 2010 Pearson Education, Inc. Figure 22.14
5 seconds elapsed
Volume of breath
Intrapulmonarypressure
Expiration
Intrapleuralpressure
Trans-pulmonarypressure
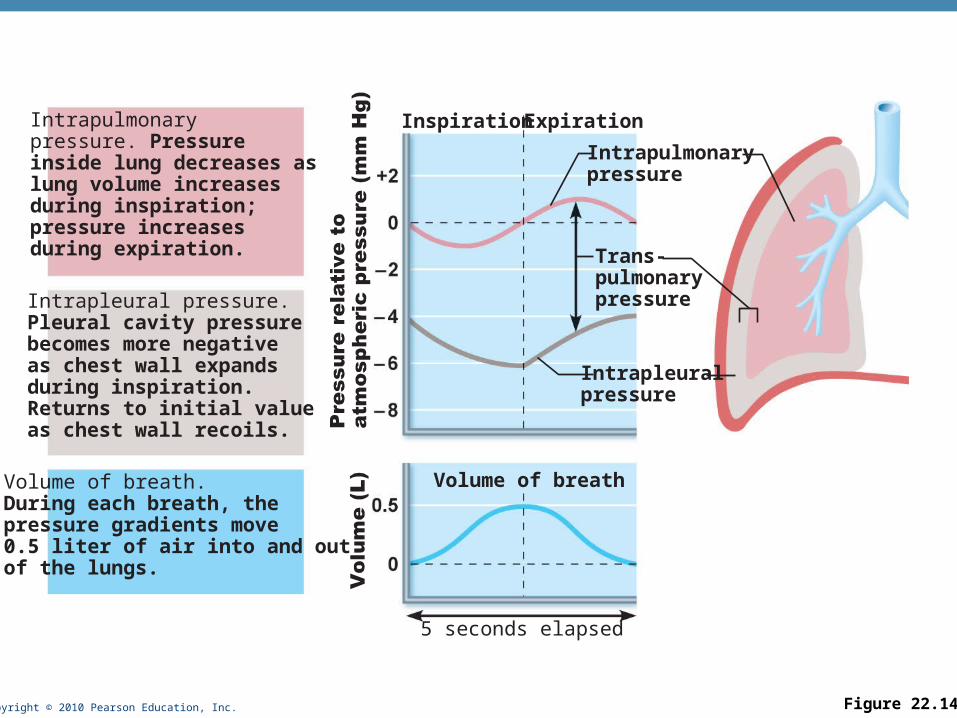
InspirationIntrapulmonary pressure. Pressure inside lung decreases as lung volume increases during inspiration; pressure increases during expiration.
Intrapleural pressure.Pleural cavity pressure becomes more negative as chest wall expands during inspiration. Returns to initial value as chest wall recoils.
Volume of breath.During each breath, the pressure gradients move 0.5 liter of air into and out of the lungs.
Copyright © 2010 Pearson Education, Inc.
Physical Factors Influencing Pulmonary Ventilation
• Inspiratory muscles consume energy to overcome three factors that hinder air passage and pulmonary ventilation
1. Airway resistance
2. Alveolar surface tension
3. Lung compliance

Copyright © 2010 Pearson Education, Inc.
Airway Resistance
• Friction is the major nonelastic source of resistance to gas flow
• The relationship between flow (F), pressure (P), and resistance (R) is:
F = P R
• P is the pressure gradient between the atmosphere and the alveoli (2 mm Hg or less during normal quiet breathing)
• Gas flow changes inversely with resistance
Copyright © 2010 Pearson Education, Inc.
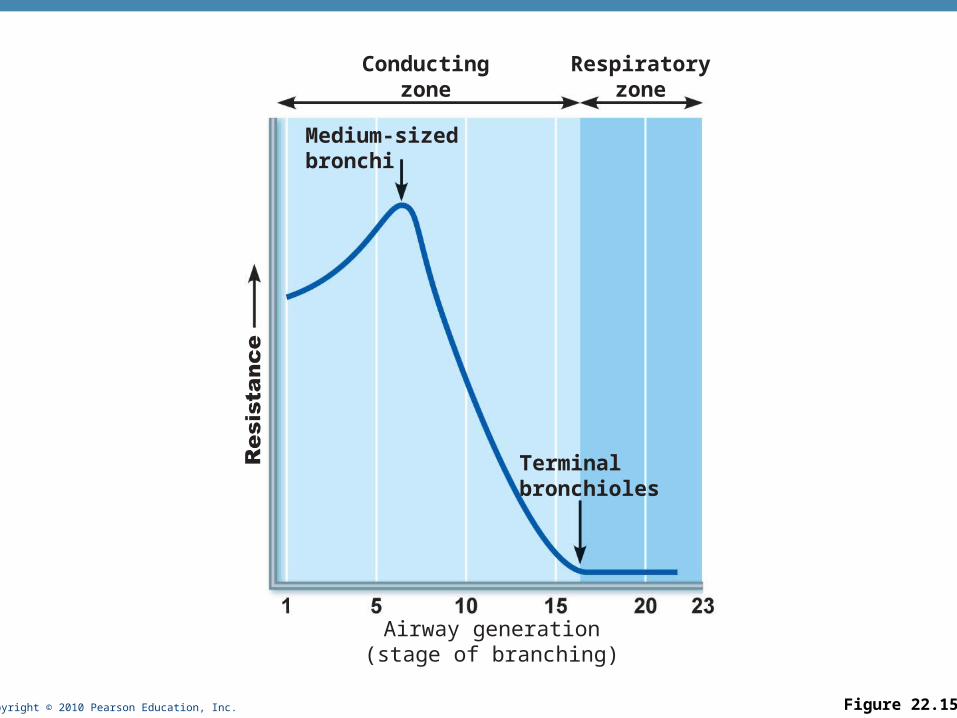
Airway Resistance
• Resistance is usually insignificant because of
• Large airway diameters in the first part of the conducting zone
• Progressive branching of airways as they get smaller, increasing the total cross-sectional area
• Resistance disappears at the terminal bronchioles where diffusion drives gas movement
Copyright © 2010 Pearson Education, Inc. Figure 22.15
Airway generation(stage of branching)
Medium-sizedbronchi
Terminalbronchioles
Conductingzone
Respiratoryzone
Copyright © 2010 Pearson Education, Inc.
Airway Resistance
• As airway resistance rises, breathing movements become more strenuous
• Severely constricting or obstruction of bronchioles
• Can prevent life-sustaining ventilation
• Can occur during acute asthma attacks and stop ventilation
• Epinephrine dilates bronchioles and reduces air resistance

Copyright © 2010 Pearson Education, Inc.
Alveolar Surface Tension
• Surface tension
• Attracts liquid molecules to one another at a gas-liquid interface
• Resists any force that tends to increase the surface area of the liquid
Copyright © 2010 Pearson Education, Inc.
Alveolar Surface Tension
• Surfactant
• Detergent-like lipid and protein complex produced by type II alveolar cells
• Reduces surface tension of alveolar fluid and discourages alveolar collapse
• Insufficient quantity in premature infants causes infant respiratory distress syndrome

Copyright © 2010 Pearson Education, Inc.
Lung Compliance
• A measure of the change in lung volume that occurs with a given change in transpulmonary pressure
• Normally high due to
• Distensibility of the lung tissue
• Alveolar surface tension

Copyright © 2010 Pearson Education, Inc.
Lung Compliance
• Diminished by
• Nonelastic scar tissue (fibrosis)
• Reduced production of surfactant
• Decreased flexibility of the thoracic cage

Copyright © 2010 Pearson Education, Inc.
Lung Compliance
• Homeostatic imbalances that reduce compliance
• Deformities of thorax
• Ossification of the costal cartilage
• Paralysis of intercostal muscles
Copyright © 2010 Pearson Education, Inc.
Respiratory Volumes
• Used to assess a person’s respiratory status
• Tidal volume (TV)
• Inspiratory reserve volume (IRV)
• Expiratory reserve volume (ERV)
• Residual volume (RV)

Copyright © 2010 Pearson Education, Inc. Figure 22.16b
Respiratoryvolumes
Tidal volume (TV) Amount of air inhaled or exhaled with each breath under resting conditions
3100 ml Inspiratory reservevolume (IRV)
Expiratory reservevolume (ERV)
Residual volume (RV) Amount of air remaining in the lungs after a forced exhalation
500 ml
Amount of air that can be forcefully inhaled after a nor-mal tidal volume inhalationAmount of air that can beforcefully exhaled after a nor-mal tidal volume exhalation
1200 ml
1200 ml
Measurement DescriptionAdult maleaverage value
1900 ml
500 ml
700 ml
1100 ml
Adult femaleaverage value

Copyright © 2010 Pearson Education, Inc.
Respiratory Capacities
• Inspiratory capacity (IC)
• Functional residual capacity (FRC)
• Vital capacity (VC)
• Total lung capacity (TLC)

Copyright © 2010 Pearson Education, Inc. Figure 22.16b
Respiratorycapacities
(b) Summary of respiratory volumes and capacities for males and females
Functional residualcapacity (FRC)
Volume of air remaining in the lungs after a normal tidal volume expiration: FRC = ERV + RV
Maximum amount of air contained in lungs after a maximum inspiratory effort: TLC = TV + IRV + ERV + RVMaximum amount of air that can be expired after a maxi-mum inspiratory effort: VC = TV + IRV + ERVMaximum amount of air that can be inspired after a normal expiration: IC = TV + IRV
Total lung capacity (TLC)
Vital capacity (VC)
Inspiratory capacity (IC)
6000 ml
4800 ml
3600 ml
2400 ml
4200 ml
3100 ml
2400 ml
1800 ml

Copyright © 2010 Pearson Education, Inc. Figure 22.16a
Inspiratoryreserve volume
3100 ml
Tidal volume 500 ml
(a) Spirographic record for a male
Expiratoryreserve volume
1200 ml
Residual volume1200 ml
Functionalresidualcapacity2400 ml
Inspiratorycapacity3600 ml Vital
capacity4800 ml
Total lungcapacity6000 ml

Copyright © 2010 Pearson Education, Inc.
Dead Space
• Some inspired air never contributes to gas exchange
• Anatomical dead space: volume of the conducting zone conduits (~150 ml)
• Alveolar dead space: alveoli that cease to act in gas exchange due to collapse or obstruction
• Total dead space: sum of above nonuseful volumes
Copyright © 2010 Pearson Education, Inc.
Pulmonary Function Tests
• Spirometer: instrument used to measure respiratory volumes and capacities
• Spirometry can distinguish between
• Obstructive pulmonary disease—increased airway resistance (e.g., bronchitis)
• Restrictive disorders—reduction in total lung capacity due to structural or functional lung changes (e.g., fibrosis or TB)
Copyright © 2010 Pearson Education, Inc.
Pulmonary Function Tests
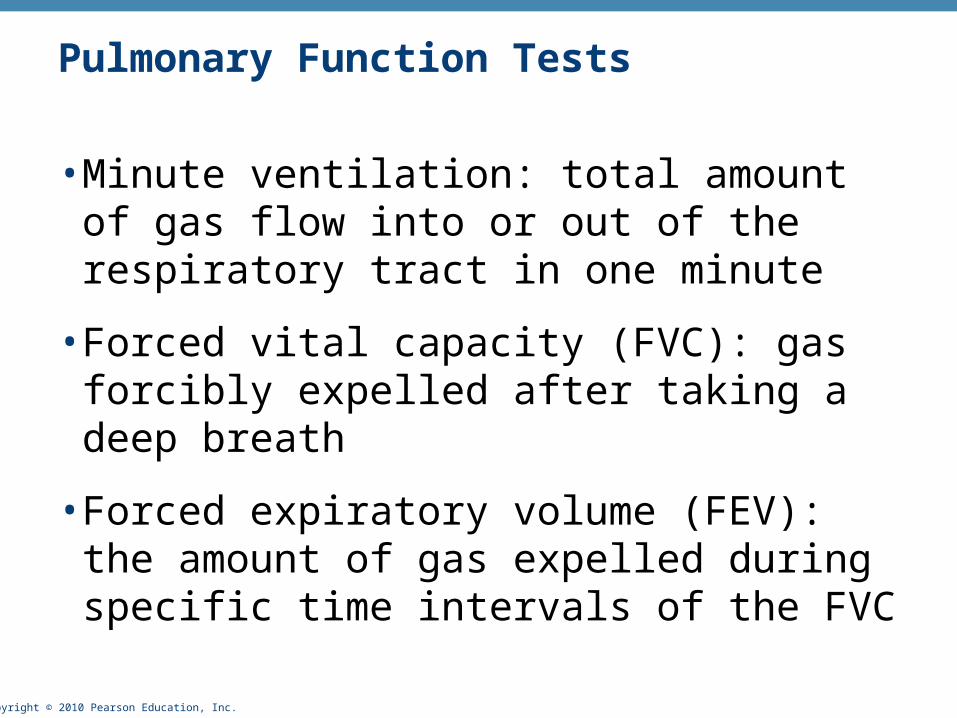
• Minute ventilation: total amount of gas flow into or out of the respiratory tract in one minute
• Forced vital capacity (FVC): gas forcibly expelled after taking a deep breath
• Forced expiratory volume (FEV): the amount of gas expelled during specific time intervals of the FVC

Copyright © 2010 Pearson Education, Inc.
Pulmonary Function Tests
• Increases in TLC, FRC, and RV may occur as a result of obstructive disease
• Reduction in VC, TLC, FRC, and RV result from restrictive disease
Copyright © 2010 Pearson Education, Inc.
Alveolar Ventilation
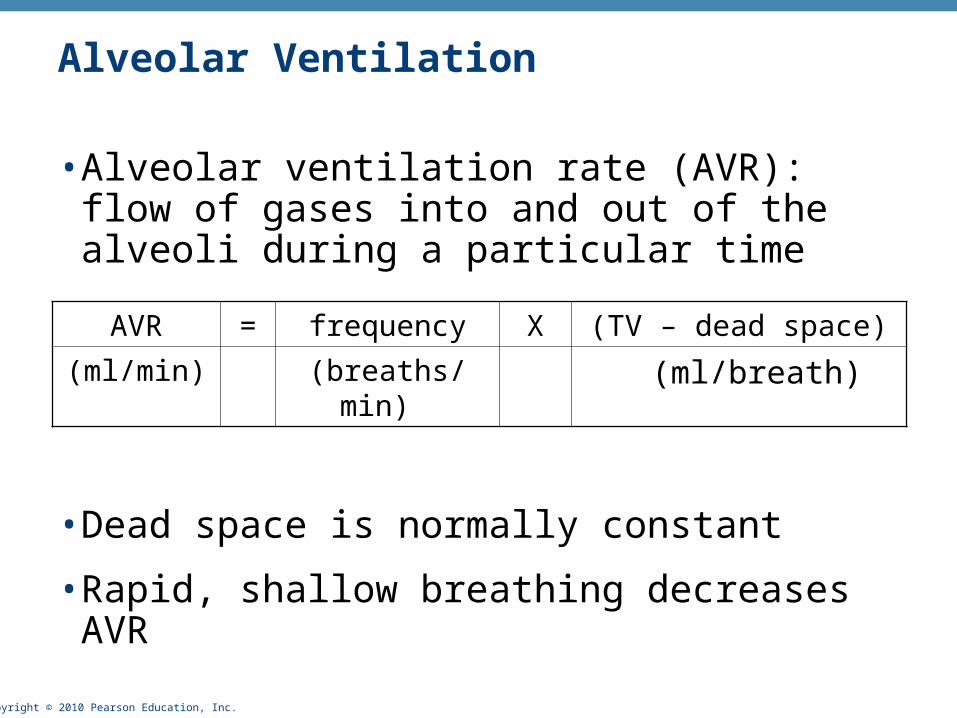
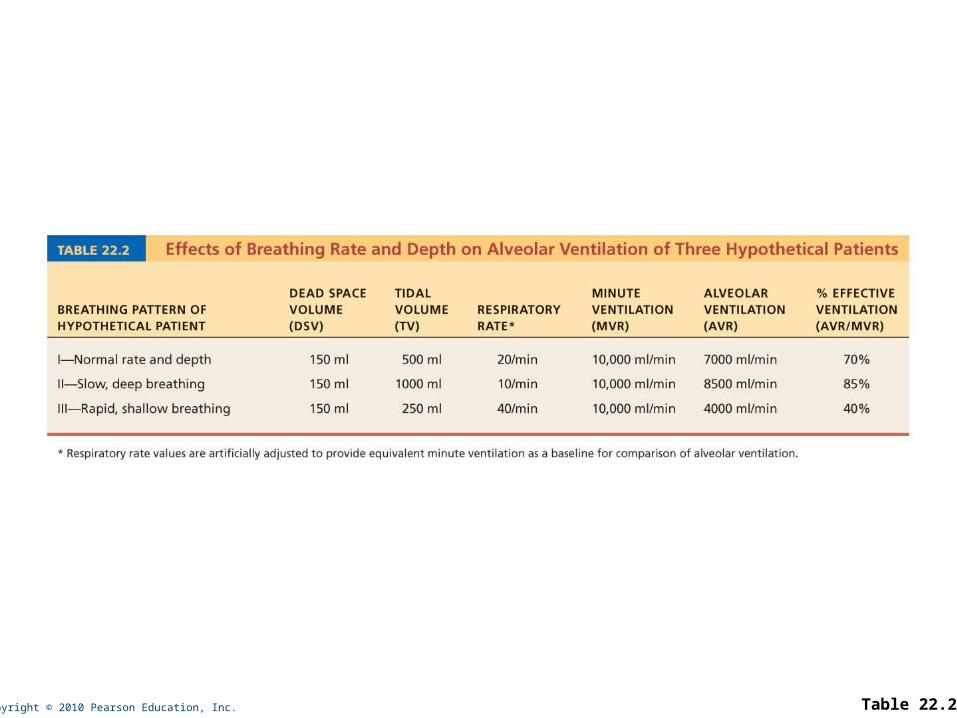
• Alveolar ventilation rate (AVR): flow of gases into and out of the alveoli during a particular time
• Dead space is normally constant
• Rapid, shallow breathing decreases AVR
AVR = frequency X (TV – dead space)
(ml/min) (breaths/min) (ml/breath)
Copyright © 2010 Pearson Education, Inc. Table 22.2

Copyright © 2010 Pearson Education, Inc.
Nonrespiratory Air Movements
• Most result from reflex action
• Examples include: cough, sneeze, crying, laughing, hiccups, and yawns
Copyright © 2010 Pearson Education, Inc.
Gas Exchanges Between Blood, Lungs, and Tissues
• External respiration
• Internal respiration
• To understand the above processes, first consider
• Physical properties of gases
• Composition of alveolar gas
Copyright © 2010 Pearson Education, Inc.
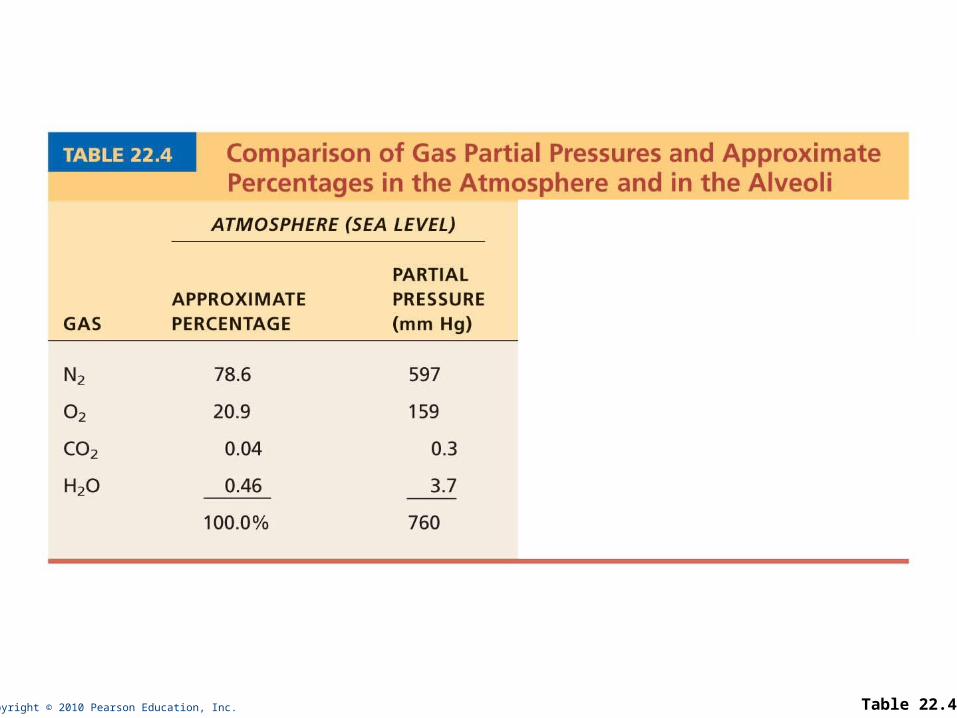
Basic Properties of Gases: Dalton’s Law of Partial Pressures
• Total pressure exerted by a mixture of gases is the sum of the pressures exerted by each gas
• The partial pressure of each gas is directly proportional to its percentage in the mixture
Copyright © 2010 Pearson Education, Inc. Table 22.4

Copyright © 2010 Pearson Education, Inc.
Basic Properties of Gases: Henry’s Law
•When a mixture of gases is in contact with a liquid, each gas will dissolve in the liquid in proportion to its partial pressure
• At equilibrium, the partial pressures in the two phases will be equal
• The amount of gas that will dissolve in a liquid also depends upon its solubility
• CO2 is 20 times more soluble in water than O2
• Very little N2 dissolves in water
Copyright © 2010 Pearson Education, Inc.
Composition of Alveolar Gas
• Alveoli contain more CO2 and water vapor than atmospheric air, due to
• Gas exchanges in the lungs
• Humidification of air
• Mixing of alveolar gas that occurs with each breath

Copyright © 2010 Pearson Education, Inc. Table 22.4
Copyright © 2010 Pearson Education, Inc.
External Respiration
• Exchange of O2 and CO2 across the respiratory membrane
• Influenced by
• Partial pressure gradients and gas solubilities
• Ventilation-perfusion coupling
• Structural characteristics of the respiratory membrane
Copyright © 2010 Pearson Education, Inc.
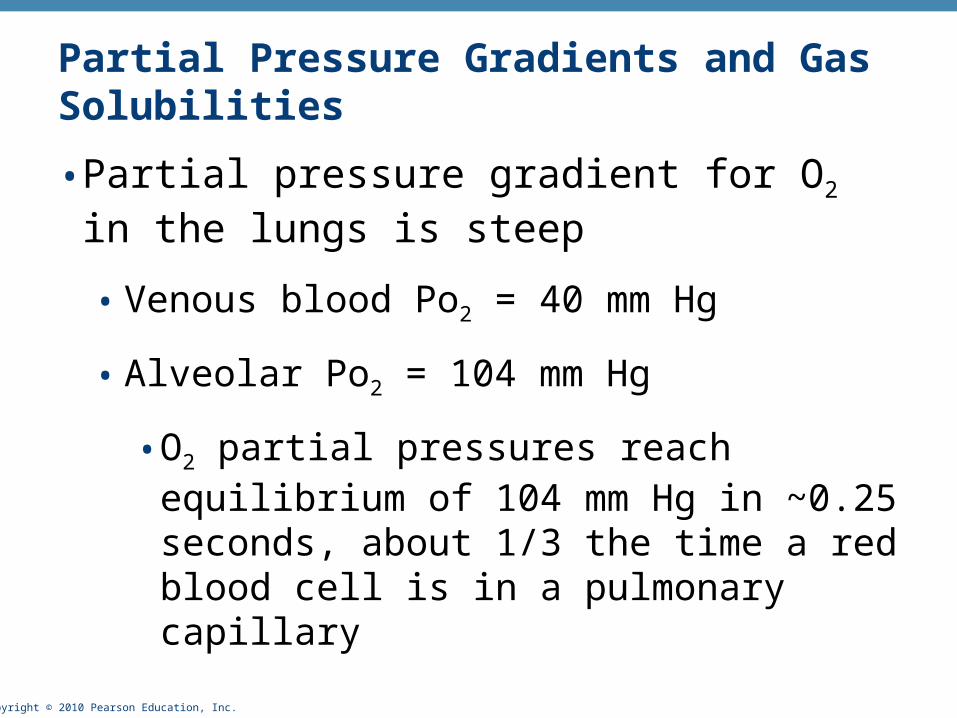
Partial Pressure Gradients and Gas Solubilities
• Partial pressure gradient for O2 in the lungs is steep
• Venous blood Po2 = 40 mm Hg
• Alveolar Po2 = 104 mm Hg
• O2 partial pressures reach equilibrium of 104 mm Hg in ~0.25 seconds, about 1/3 the time a red blood cell is in a pulmonary capillary

Copyright © 2010 Pearson Education, Inc. Figure 22.18
Time in thepulmonary capillary (s)
P 104 mm HgO2
End ofcapillary
Start ofcapillary
Copyright © 2010 Pearson Education, Inc.
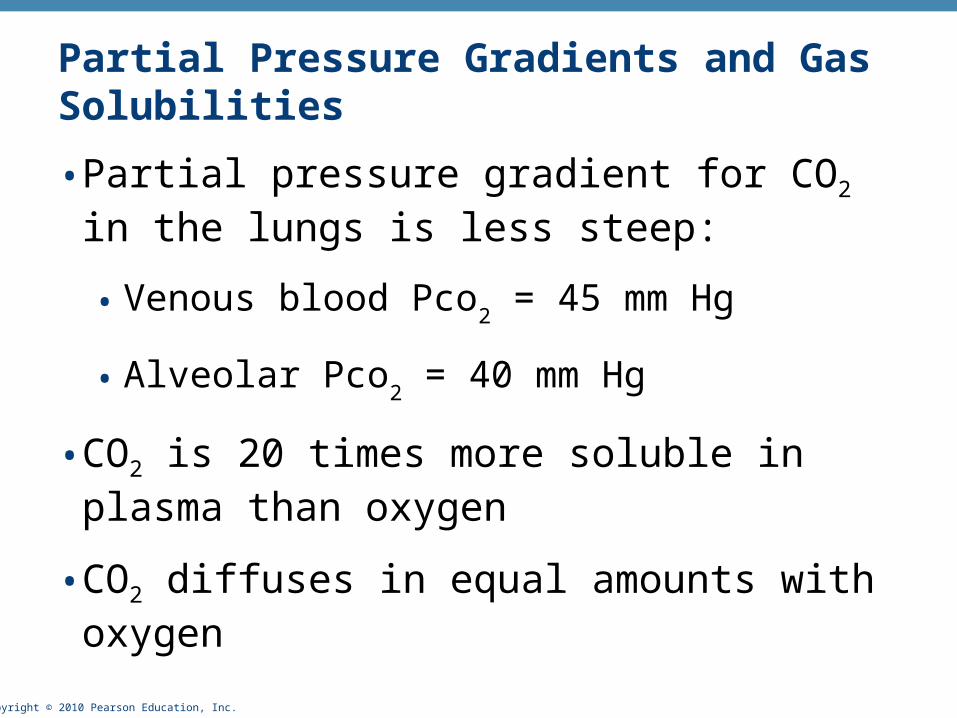
Partial Pressure Gradients and Gas Solubilities
• Partial pressure gradient for CO2 in the lungs is less steep:
• Venous blood Pco2 = 45 mm Hg
• Alveolar Pco2 = 40 mm Hg
• CO2 is 20 times more soluble in plasma than oxygen
• CO2 diffuses in equal amounts with oxygen
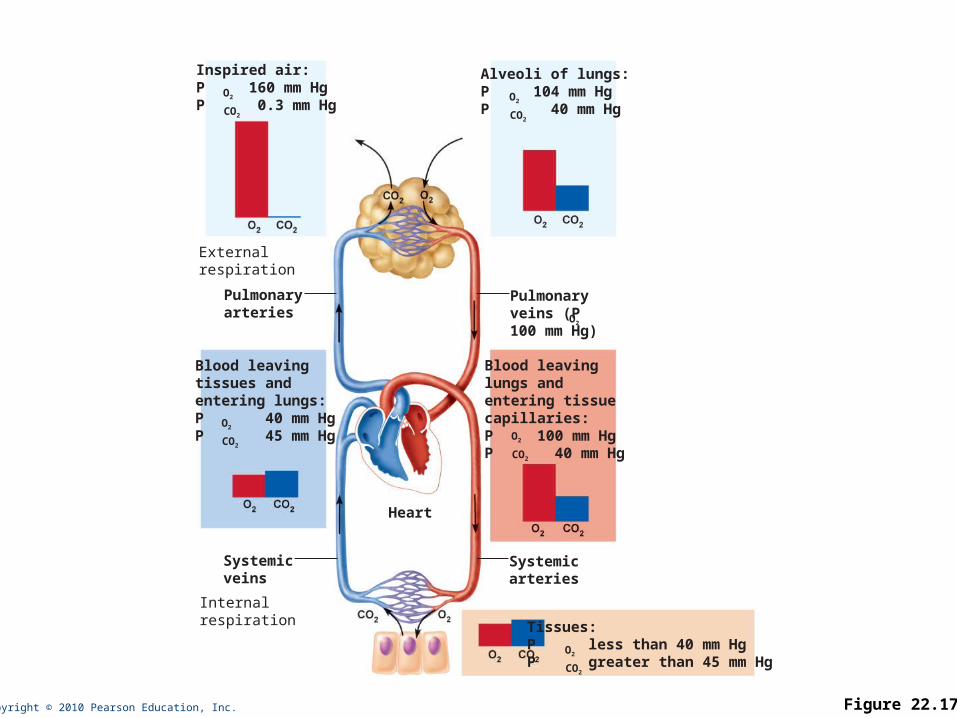
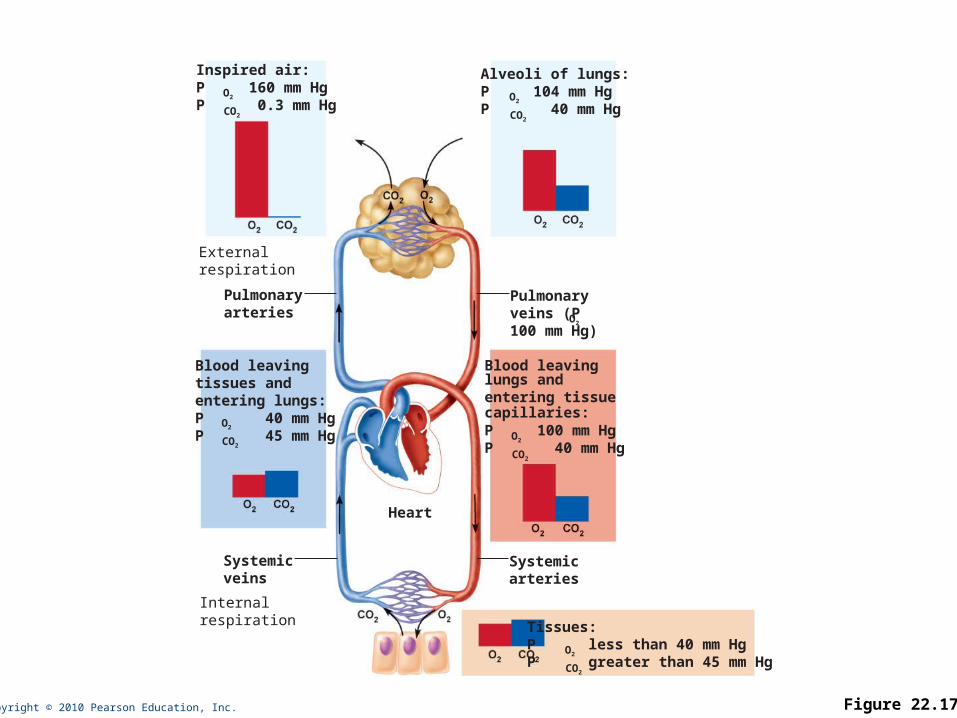
Copyright © 2010 Pearson Education, Inc. Figure 22.17
Inspired air:P 160 mm HgP 0.3 mm Hg
Blood leavinglungs andentering tissuecapillaries:P 100 mm HgP 40 mm Hg
Alveoli of lungs:P 104 mm HgP 40 mm Hg
O2
Heart
Blood leavingtissues andentering lungs:P 40 mm HgP 45 mm Hg
Systemicveins
Systemicarteries
Tissues:P less than 40 mm HgP greater than 45 mm Hg
Internalrespiration
Externalrespiration
Pulmonaryveins (P100 mm Hg)
Pulmonaryarteries
CO2
O2
CO2
O2
CO2O2
CO2
O2
CO2
O2

Copyright © 2010 Pearson Education, Inc.
Ventilation-Perfusion Coupling
• Ventilation: amount of gas reaching the alveoli
• Perfusion: blood flow reaching the alveoli
• Ventilation and perfusion must be matched (coupled) for efficient gas exchange
Copyright © 2010 Pearson Education, Inc.
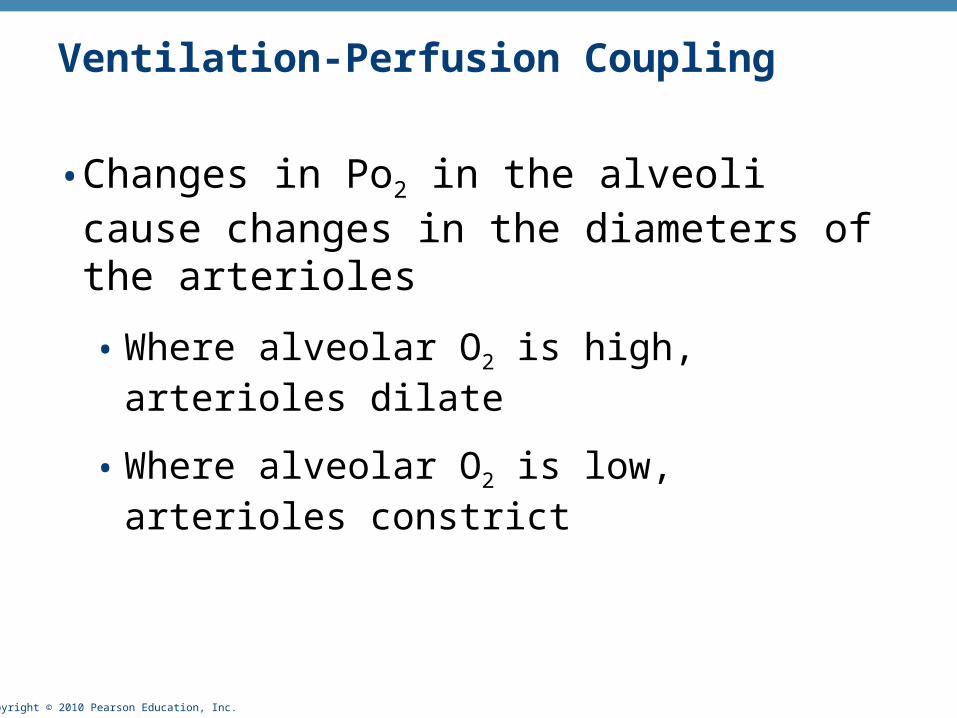
Ventilation-Perfusion Coupling
• Changes in Po2 in the alveoli cause changes in the diameters of the arterioles
• Where alveolar O2 is high, arterioles dilate
• Where alveolar O2 is low, arterioles constrict

Copyright © 2010 Pearson Education, Inc.
Ventilation-Perfusion Coupling
• Changes in Pco2 in the alveoli cause changes in the diameters of the bronchioles
• Where alveolar CO2 is high, bronchioles dilate
• Where alveolar CO2 is low, bronchioles constrict
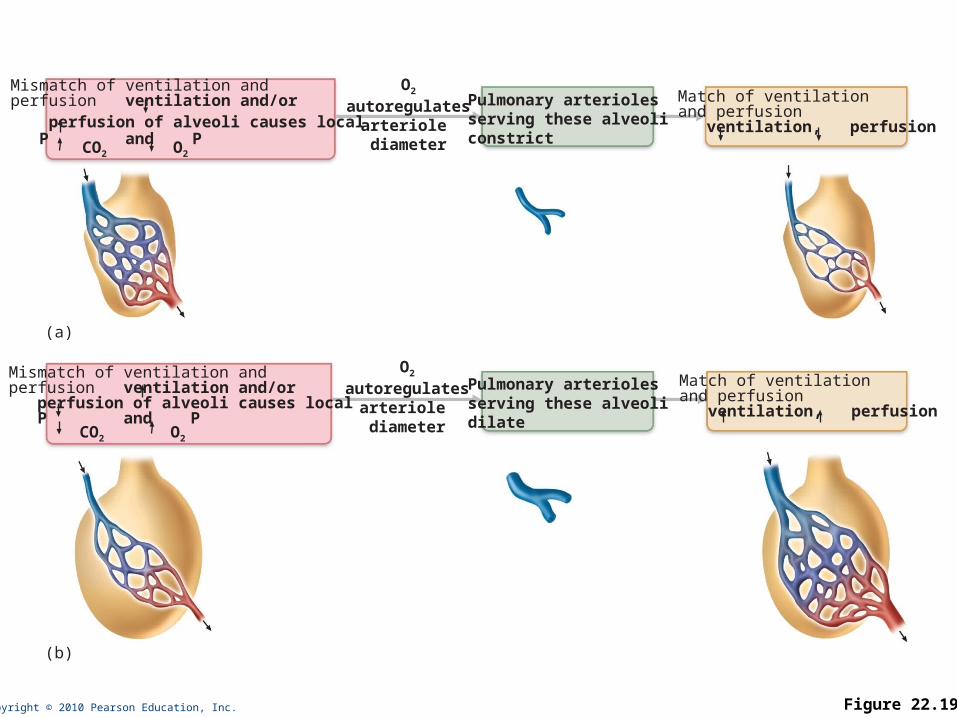
Copyright © 2010 Pearson Education, Inc. Figure 22.19
Mismatch of ventilation and perfusion ventilation and/or perfusion of alveoli causes local P and PCO2 O2
Pulmonary arteriolesserving these alveoliconstrict
O2
autoregulatesarteriole diameter
Match of ventilationand perfusion ventilation, perfusion
(a)
(b)
Mismatch of ventilation andperfusion ventilation and/or perfusion of alveoli causes local P and P
CO2 O2
Pulmonary arteriolesserving these alveolidilate
Match of ventilationand perfusion ventilation, perfusion
O2
autoregulatesarteriole diameter

Copyright © 2010 Pearson Education, Inc.
Thickness and Surface Area of the Respiratory Membrane
• Respiratory membranes
• 0.5 to 1 m thick
• Large total surface area (40 times that of one’s skin)
• Thicken if lungs become waterlogged and edematous, and gas exchange becomes inadequate
• Reduction in surface area with emphysema, when walls of adjacent alveoli break down
Copyright © 2010 Pearson Education, Inc.
Internal Respiration
• Capillary gas exchange in body tissues
• Partial pressures and diffusion gradients are reversed compared to external respiration
• Po2 in tissue is always lower than in systemic arterial blood
• Po2 of venous blood is 40 mm Hg and Pco2 is 45 mm Hg
Copyright © 2010 Pearson Education, Inc. Figure 22.17
Inspired air:P 160 mm HgP 0.3 mm Hg
Blood leavinglungs andentering tissuecapillaries:P 100 mm HgP 40 mm Hg
Alveoli of lungs:P 104 mm HgP 40 mm Hg
O2
Heart
Blood leavingtissues andentering lungs:P 40 mm HgP 45 mm Hg
Systemicveins
Systemicarteries
Tissues:P less than 40 mm HgP greater than 45 mm Hg
Internalrespiration
Externalrespiration
Pulmonaryveins (P100 mm Hg)
Pulmonaryarteries
CO2
O2
CO2
O2
CO2O2
CO2
O2
CO2
O2
Copyright © 2010 Pearson Education, Inc.
Transport of Respiratory Gases by Blood
• Oxygen (O2) transport
• Carbon dioxide (CO2) transport
Copyright © 2010 Pearson Education, Inc.
O2 Transport
• Molecular O2 is carried in the blood
• 1.5% dissolved in plasma
• 98.5% loosely bound to each Fe of hemoglobin (Hb) in RBCs
• 4 O2 per Hb
Copyright © 2010 Pearson Education, Inc.
O2 and Hemoglobin
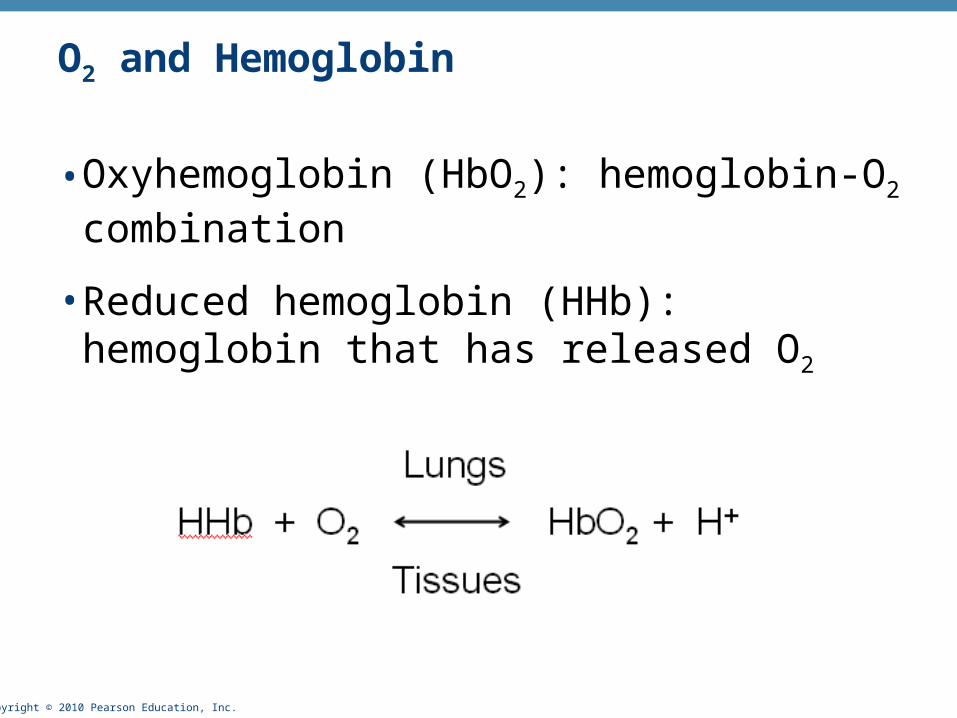
• Oxyhemoglobin (HbO2): hemoglobin-O2 combination
• Reduced hemoglobin (HHb): hemoglobin that has released O2

Copyright © 2010 Pearson Education, Inc.
O2 and Hemoglobin
• Loading and unloading of O2 is facilitated by change in shape of Hb
• As O2 binds, Hb affinity for O2 increases
• As O2 is released, Hb affinity for O2 decreases
• Fully (100%) saturated if all four heme groups carry O2
• Partially saturated when one to three hemes carry O2
Copyright © 2010 Pearson Education, Inc.
O2 and Hemoglobin
• Rate of loading and unloading of O2 is regulated by
• Po2
• Temperature
• Blood pH
• Pco2
• Concentration of BPG
Copyright © 2010 Pearson Education, Inc.
Influence of Po2 on Hemoglobin Saturation
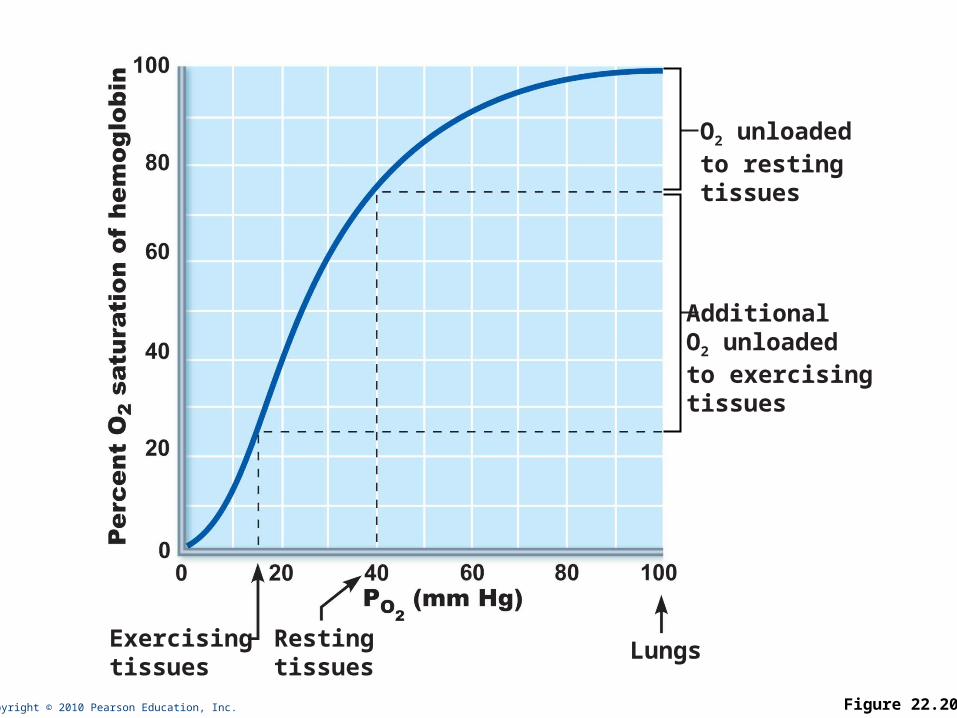
• Oxygen-hemoglobin dissociation curve
• Hemoglobin saturation plotted against Po2 is not linear
• S-shaped curve
• Shows how binding and release of O2 is influenced by the Po2

Copyright © 2010 Pearson Education, Inc. Figure 22.20
O2 unloadedto restingtissues
LungsExercisingtissues
Restingtissues
AdditionalO2 unloadedto exercisingtissues
Copyright © 2010 Pearson Education, Inc.
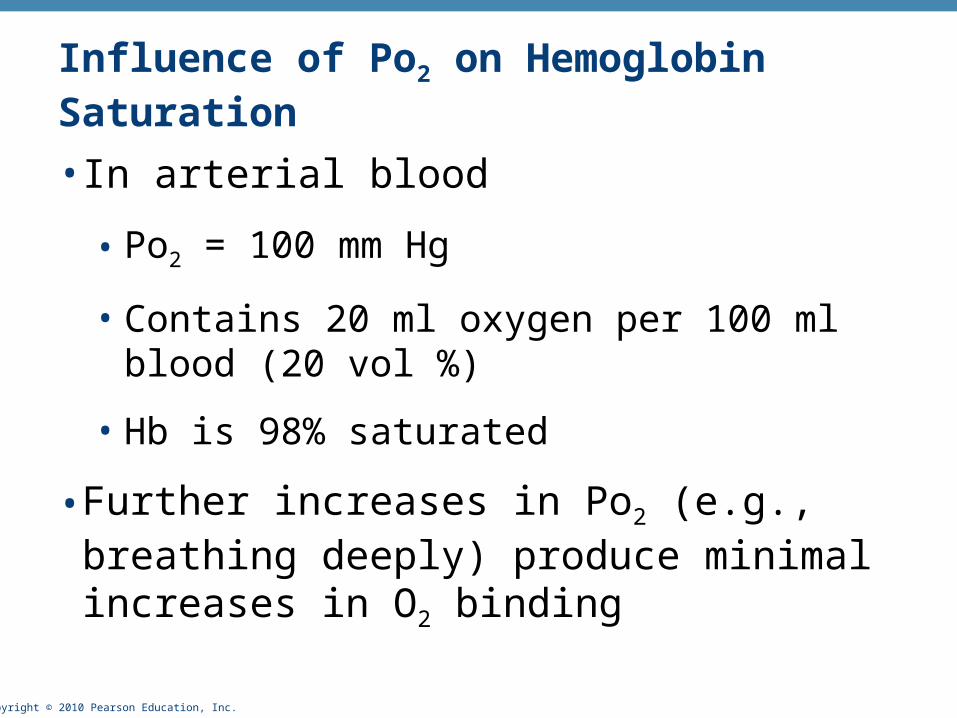
Influence of Po2 on Hemoglobin Saturation
• In arterial blood
• Po2 = 100 mm Hg
• Contains 20 ml oxygen per 100 ml blood (20 vol %)
• Hb is 98% saturated
• Further increases in Po2 (e.g., breathing deeply) produce minimal increases in O2 binding
Copyright © 2010 Pearson Education, Inc.
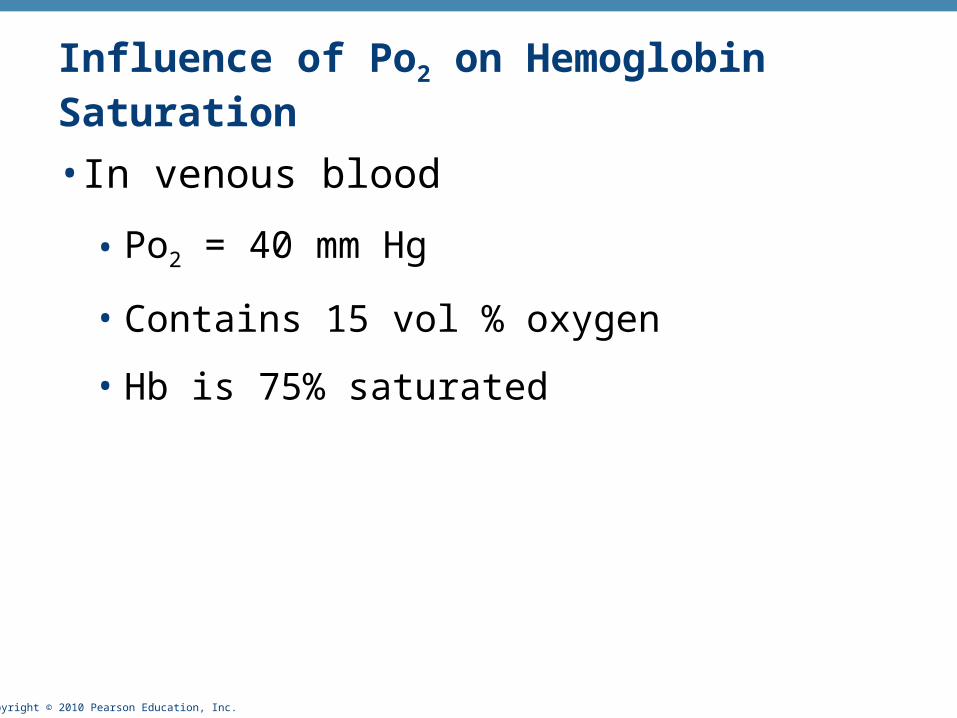
Influence of Po2 on Hemoglobin Saturation
• In venous blood
• Po2 = 40 mm Hg
• Contains 15 vol % oxygen
• Hb is 75% saturated
Copyright © 2010 Pearson Education, Inc.
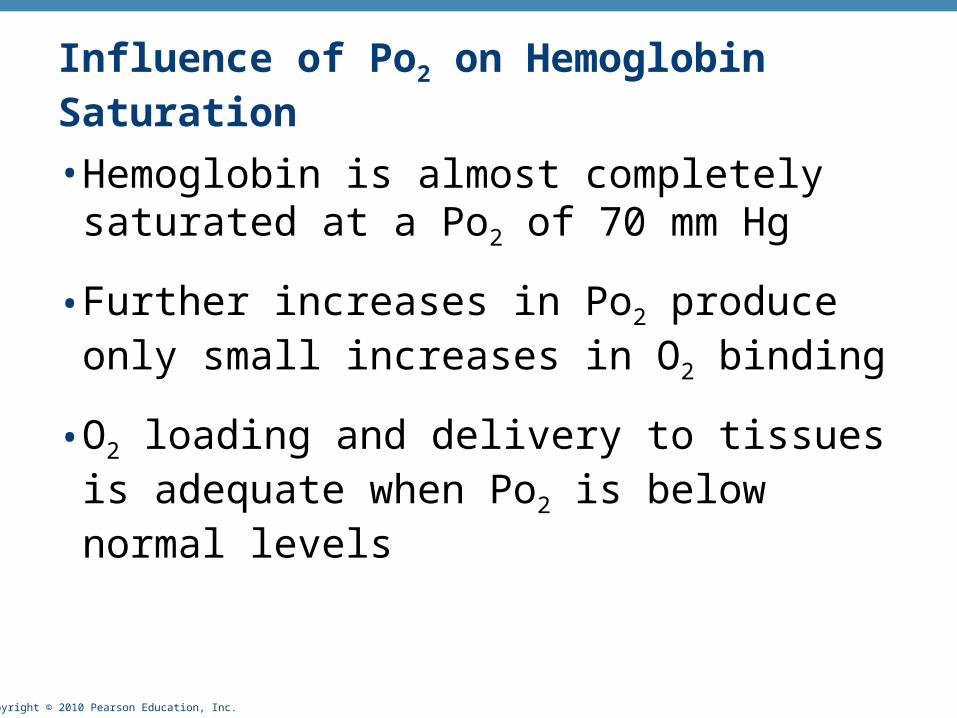
Influence of Po2 on Hemoglobin Saturation
• Hemoglobin is almost completely saturated at a Po2 of 70 mm Hg
• Further increases in Po2 produce only small increases in O2 binding
• O2 loading and delivery to tissues is adequate when Po2 is below normal levels
Copyright © 2010 Pearson Education, Inc.
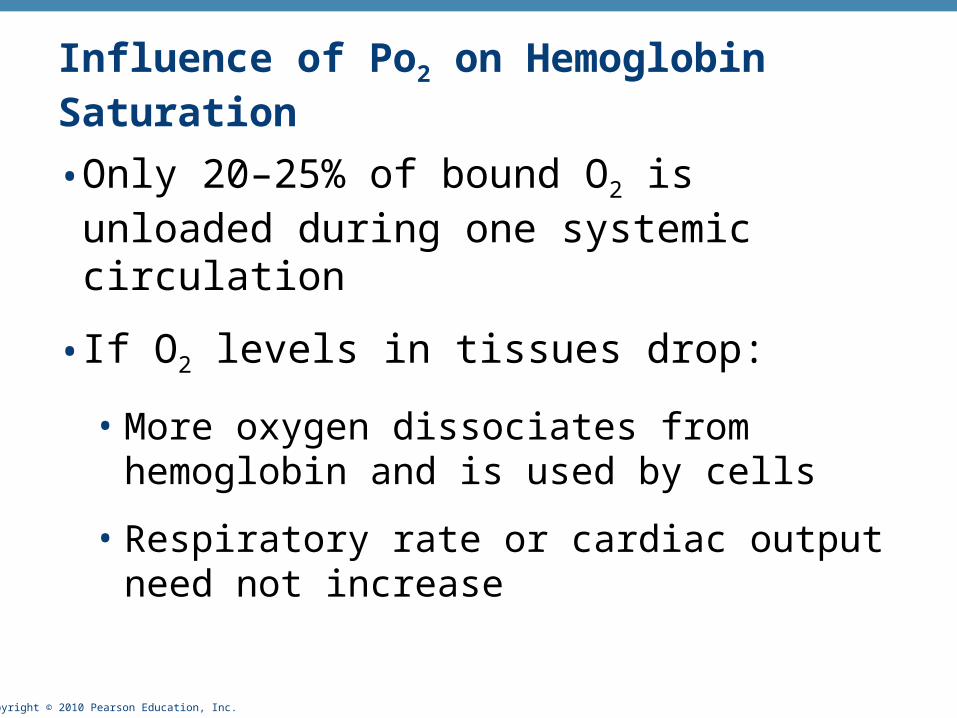
Influence of Po2 on Hemoglobin Saturation
• Only 20–25% of bound O2 is unloaded during one systemic circulation
• If O2 levels in tissues drop:
• More oxygen dissociates from hemoglobin and is used by cells
• Respiratory rate or cardiac output need not increase
Copyright © 2010 Pearson Education, Inc. Figure 22.20
O2 unloadedto restingtissues
LungsExercisingtissues
Restingtissues
AdditionalO2 unloadedto exercisingtissues

Copyright © 2010 Pearson Education, Inc.
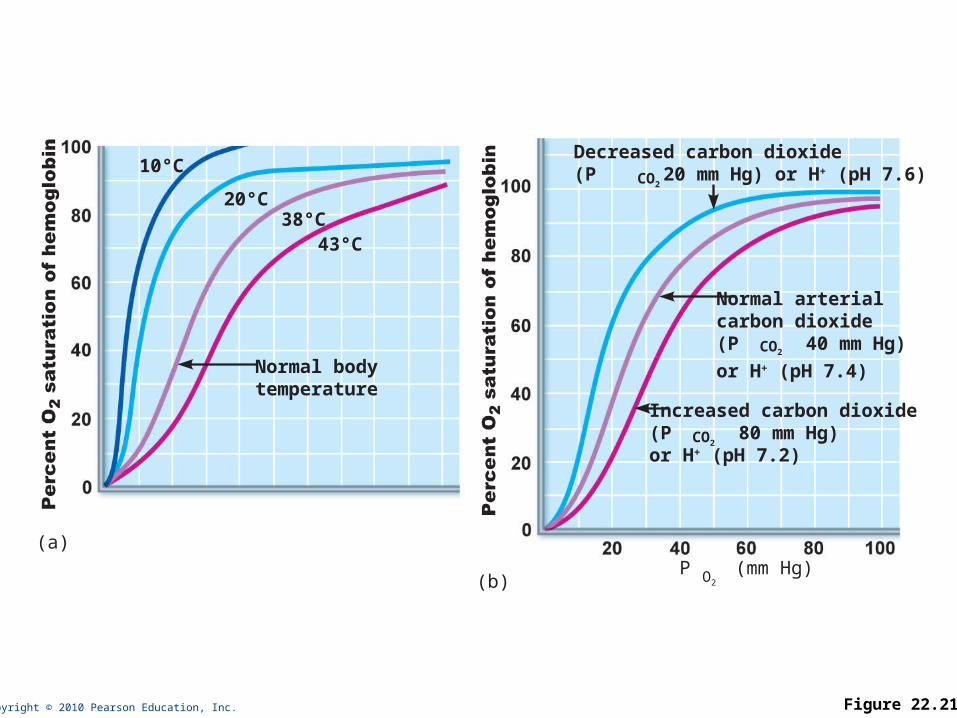
Other Factors Influencing Hemoglobin Saturation
• Increases in temperature, H+, Pco2, and BPG
• Modify the structure of hemoglobin and decrease its affinity for O2
• Occur in systemic capillaries
• Enhance O2 unloading
• Shift the O2-hemoglobin dissociation curve to the right
• Decreases in these factors shift the curve to the left
Copyright © 2010 Pearson Education, Inc. Figure 22.21
O2P (mm Hg)
Normal bodytemperature
10°C
20°C38°C
43°C
Normal arterialcarbon dioxide(P 40 mm Hg)
or H+ (pH 7.4) CO2
Increased carbon dioxide(P 80 mm Hg)or H+ (pH 7.2)
CO2
Decreased carbon dioxide(P 20 mm Hg) or H+ (pH 7.6)CO2
(a)
(b)
Copyright © 2010 Pearson Education, Inc.
Factors that Increase Release of O2 by Hemoglobin
• As cells metabolize glucose
• Pco2 and H+ increase in concentration in capillary blood
• Declining pH weakens the hemoglobin-O2 bond (Bohr effect)
• Heat production increases
• Increasing temperature directly and indirectly decreases Hb affinity for O2

Copyright © 2010 Pearson Education, Inc.
Homeostatic Imbalance
• Hypoxia
• Inadequate O2 delivery to tissues
• Due to a variety of causes
• Too few RBCs
• Abnormal or too little Hb
• Blocked circulation
• Metabolic poisons
• Pulmonary disease
• Carbon monoxide
Copyright © 2010 Pearson Education, Inc.
CO2 Transport
• CO2 is transported in the blood in three forms
• 7 to 10% dissolved in plasma
• 20% bound to globin of hemoglobin (carbaminohemoglobin)
• 70% transported as bicarbonate ions (HCO3–)
in plasma

Copyright © 2010 Pearson Education, Inc.
Transport and Exchange of CO2
• CO2 combines with water to form carbonic acid (H2CO3), which quickly dissociates:
• Most of the above occurs in RBCs, where carbonic anhydrase reversibly and rapidly catalyzes the reaction
CO2 + H2O H2CO3 H+ + HCO3–
Carbondioxide
Water Carbonic acid
Hydrogen ion
Bicarbonate ion

Copyright © 2010 Pearson Education, Inc.
Transport and Exchange of CO2
• In systemic capillaries
• HCO3– quickly diffuses from RBCs into the
plasma
• The chloride shift occurs: outrush of HCO3–
from the RBCs is balanced as Cl– moves in from the plasma
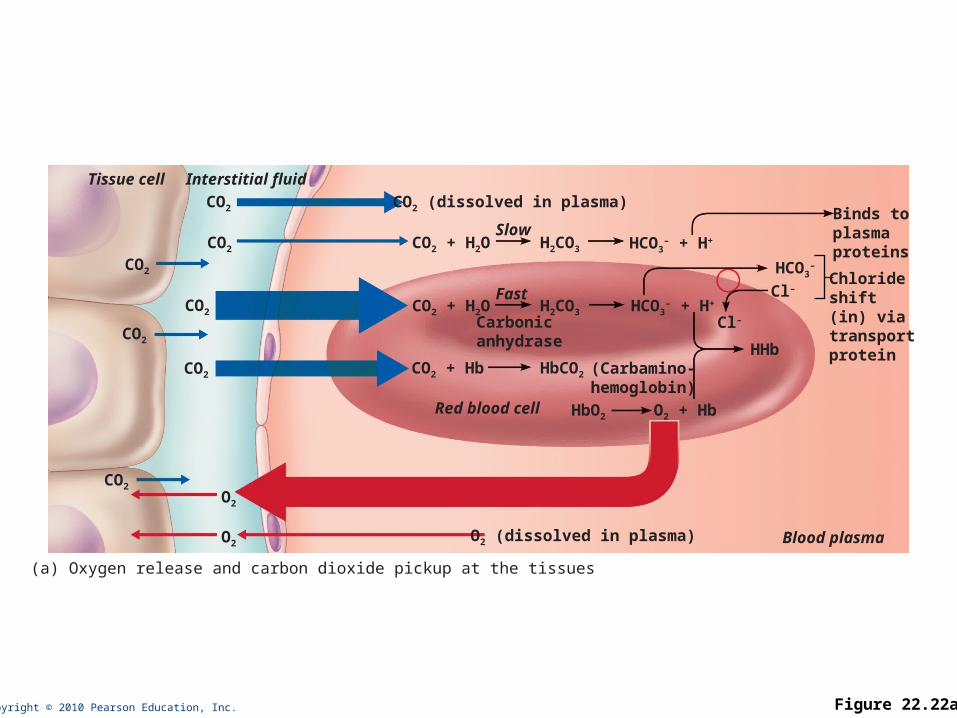
Copyright © 2010 Pearson Education, Inc. Figure 22.22a
Red blood cell
Blood plasma
Slow
Tissue cell Interstitial fluid
Carbonicanhydrase
CO2
CO2
(a) Oxygen release and carbon dioxide pickup at the tissues
CO2 (dissolved in plasma)
CO2 + H2O H2CO3 HCO3– + H+
FastCO2 + H2O H2CO3
O2 (dissolved in plasma)
CO2 + Hb HbCO2
HbO2 O2 + Hb
(Carbamino-hemoglobin)
HCO3– + H+
HCO3–
Cl–
Cl–
HHb
Binds toplasmaproteins
Chlorideshift(in) viatransportprotein
CO2
CO2
CO2
CO2
CO2
O2
O2

Copyright © 2010 Pearson Education, Inc.
Transport and Exchange of CO2
• In pulmonary capillaries
• HCO3– moves into the RBCs and binds with H+
to form H2CO3
• H2CO3 is split by carbonic anhydrase into CO2 and water
• CO2 diffuses into the alveoli

Copyright © 2010 Pearson Education, Inc. Figure 22.22b
Blood plasma
Alveolus Fused basement membranes
CO2
CO2
CO2
(b) Oxygen pickup and carbon dioxide release in the lungs
CO2
O2
O2 O2 (dissolved in plasma)
Cl–
Slow
CO2 (dissolved in plasma)
CO2 + H2O H2CO3 HCO3– + H+
Red blood cell
Carbonicanhydrase
FastCO2 + H2O H2CO3
CO2 + Hb HbCO2
O2 + HHb HbO2 + H+
(Carbamino-hemoglobin)
HCO3– + H+
HCO3–
Cl–
Chlorideshift(out) viatransportprotein

Copyright © 2010 Pearson Education, Inc.
Haldane Effect
• The amount of CO2 transported is affected by the Po2
• The lower the Po2 and hemoglobin saturation with O2, the more CO2 can be carried in the blood

Copyright © 2010 Pearson Education, Inc.
Haldane Effect
• At the tissues, as more carbon dioxide enters the blood
• More oxygen dissociates from hemoglobin (Bohr effect)
• As HbO2 releases O2, it more readily forms bonds with CO2 to form carbaminohemoglobin
Copyright © 2010 Pearson Education, Inc.
Influence of CO2 on Blood pH
• HCO3– in plasma is the alkaline reserve of the
carbonic acid–bicarbonate buffer system
• If H+ concentration in blood rises, excess H+ is removed by combining with HCO3
–
• If H+ concentration begins to drop, H2CO3 dissociates, releasing H+
Copyright © 2010 Pearson Education, Inc.
Influence of CO2 on Blood pH
• Changes in respiratory rate can also alter blood pH
• For example, slow shallow breathing allows CO2 to accumulate in the blood, causing pH to drop
• Changes in ventilation can be used to adjust pH when it is disturbed by metabolic factors
Copyright © 2010 Pearson Education, Inc.
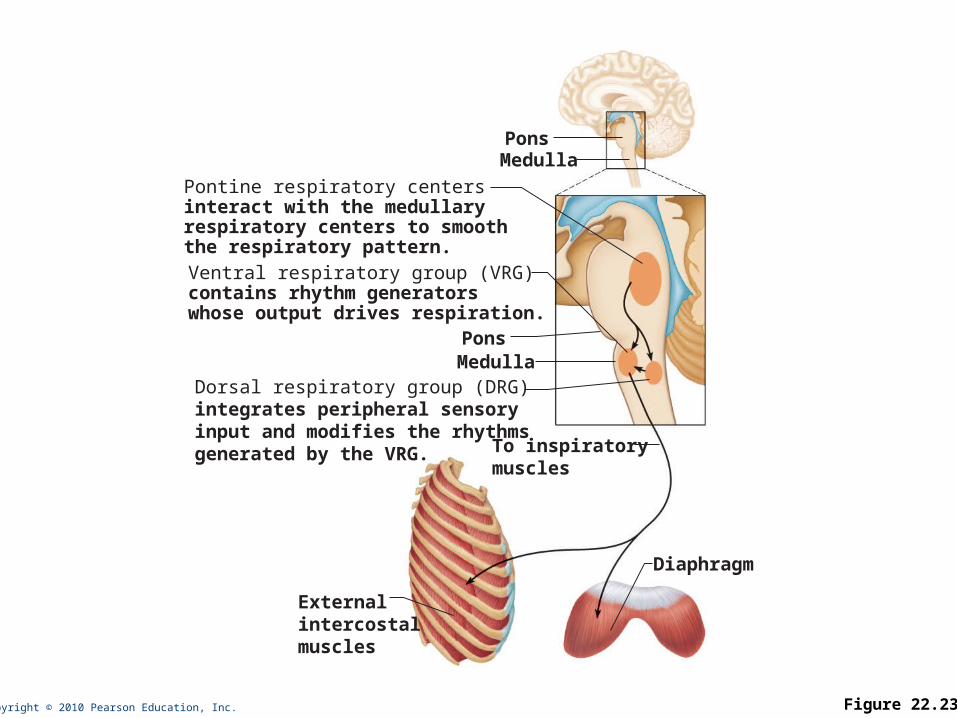
Control of Respiration
• Involves neurons in the reticular formation of the medulla and pons

Copyright © 2010 Pearson Education, Inc.
Medullary Respiratory Centers
1. Dorsal respiratory group (DRG)
• Near the root of cranial nerve IX
• Integrates input from peripheral stretch and chemoreceptors

Copyright © 2010 Pearson Education, Inc.
Medullary Respiratory Centers
2. Ventral respiratory group (VRG)
• Rhythm-generating and integrative center
• Sets eupnea (12–15 breaths/minute)
• Inspiratory neurons excite the inspiratory muscles via the phrenic and intercostal nerves
• Expiratory neurons inhibit the inspiratory neurons
Copyright © 2010 Pearson Education, Inc. Figure 22.23
Pons
Pons
Ventral respiratory group (VRG)contains rhythm generatorswhose output drives respiration.
Pontine respiratory centersinteract with the medullaryrespiratory centers to smooththe respiratory pattern.
Medulla
Medulla
To inspiratorymuscles
External intercostalmuscles
Diaphragm
Dorsal respiratory group (DRG)integrates peripheral sensoryinput and modifies the rhythmsgenerated by the VRG.

Copyright © 2010 Pearson Education, Inc.
Pontine Respiratory Centers
• Influence and modify activity of the VRG
• Smooth out transition between inspiration and expiration and vice versa
Copyright © 2010 Pearson Education, Inc.
Genesis of the Respiratory Rhythm
• Not well understood
• Most widely accepted hypothesis
• Reciprocal inhibition of two sets of interconnected neuronal networks in the medulla sets the rhythm

Copyright © 2010 Pearson Education, Inc.
Depth and Rate of Breathing
• Depth is determined by how actively the respiratory center stimulates the respiratory muscles
• Rate is determined by how long the inspiratory center is active
• Both are modified in response to changing body demands

Copyright © 2010 Pearson Education, Inc.
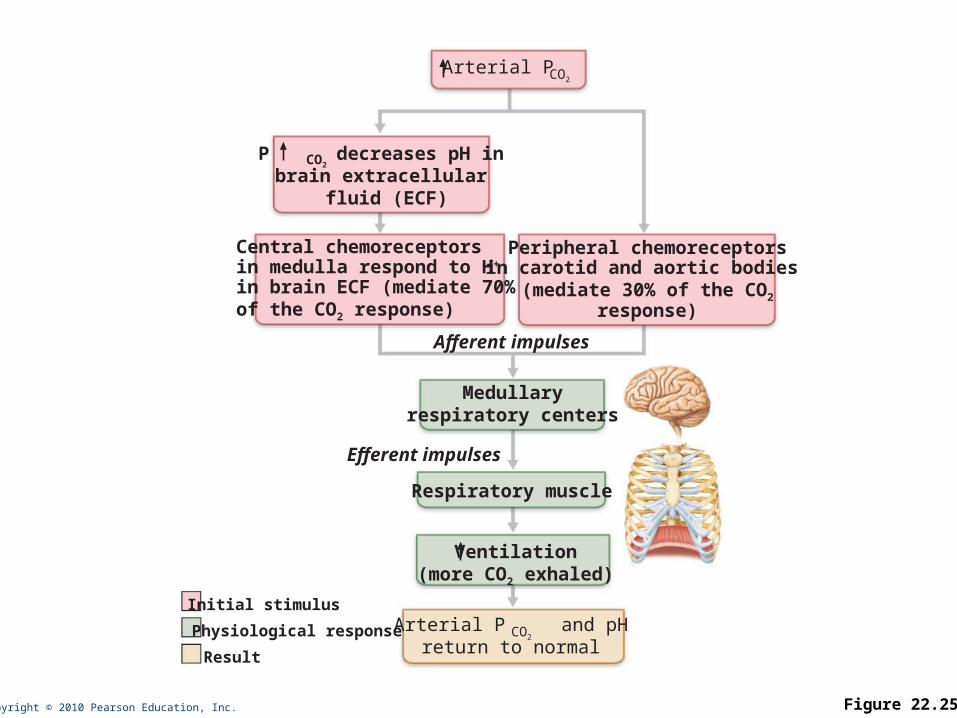
Chemical Factors
• Influence of Pco2:
• If Pco2 levels rise (hypercapnia), CO2 accumulates in the brain
• CO2 is hydrated; resulting carbonic acid dissociates, releasing H+
• H+ stimulates the central chemoreceptors of the brain stem
• Chemoreceptors synapse with the respiratory regulatory centers, increasing the depth and rate of breathing
Copyright © 2010 Pearson Education, Inc. Figure 22.25
Initial stimulus
Result
Physiological response
Ventilation(more CO2 exhaled)
Arterial P and pHreturn to normal
CO2
Medullaryrespiratory centers
Respiratory muscle
Afferent impulses
Efferent impulses
Arterial P CO2
Central chemoreceptorsin medulla respond to H+
in brain ECF (mediate 70% of the CO2 response)
Peripheral chemoreceptorsin carotid and aortic bodies
(mediate 30% of the CO2
response)
P decreases pH in brain extracellular
fluid (ECF)
CO2
Copyright © 2010 Pearson Education, Inc.
Depth and Rate of Breathing
• Hyperventilation: increased depth and rate of breathing that exceeds the body’s need to remove CO2
• Causes CO2 levels to decline (hypocapnia)
• May cause cerebral vasoconstriction and cerebral ischemia
• Apnea: period of breathing cessation that occurs when Pco2 is abnormally low

Copyright © 2010 Pearson Education, Inc.
Chemical Factors
• Influence of Po2
• Peripheral chemoreceptors in the aortic and carotid bodies are O2 sensors
• When excited, they cause the respiratory centers to increase ventilation
• Substantial drops in arterial Po2 (to 60 mm Hg) must occur in order to stimulate increased ventilation

Copyright © 2010 Pearson Education, Inc. Figure 22.26
Brain
Sensory nerve fiber in cranial nerve IX(pharyngeal branch of glossopharyngeal) External carotid arteryInternal carotid arteryCarotid bodyCommon carotid arteryCranial nerve X (vagus nerve)
Sensory nerve fiber incranial nerve X Aortic bodies in aortic arch
Aorta
Heart

Copyright © 2010 Pearson Education, Inc.
Chemical Factors
• Influence of arterial pH
• Can modify respiratory rate and rhythm even if CO2 and O2 levels are normal
• Decreased pH may reflect
• CO2 retention
• Accumulation of lactic acid
• Excess ketone bodies in patients with diabetes mellitus
• Respiratory system controls will attempt to raise the pH by increasing respiratory rate and depth
Copyright © 2010 Pearson Education, Inc.
Summary of Chemical Factors
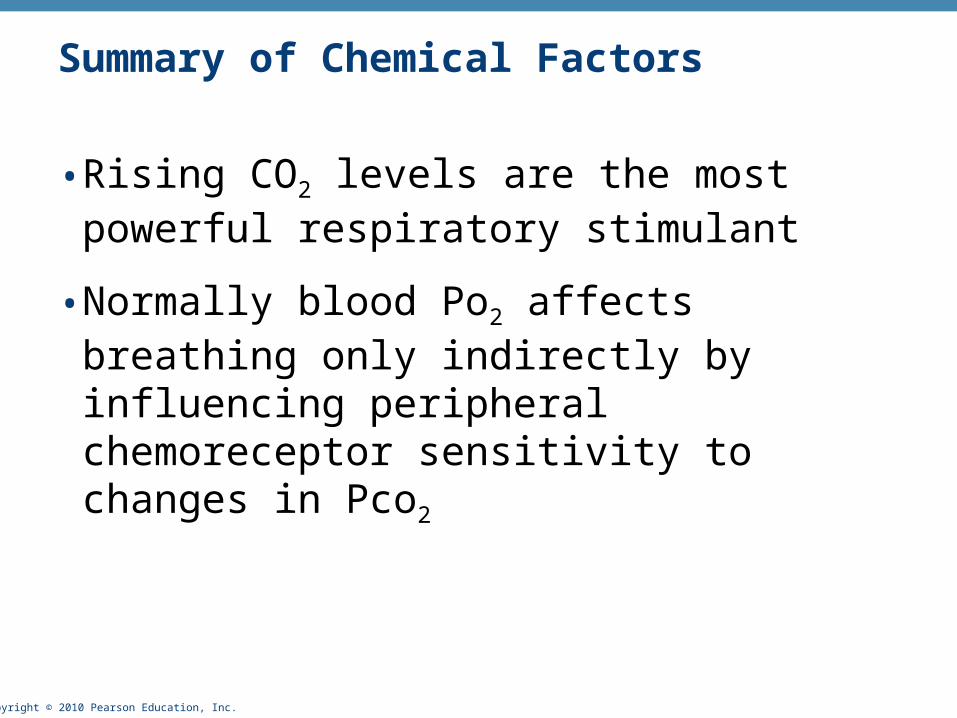
• Rising CO2 levels are the most powerful respiratory stimulant
• Normally blood Po2 affects breathing only indirectly by influencing peripheral chemoreceptor sensitivity to changes in Pco2
Copyright © 2010 Pearson Education, Inc.
Summary of Chemical Factors
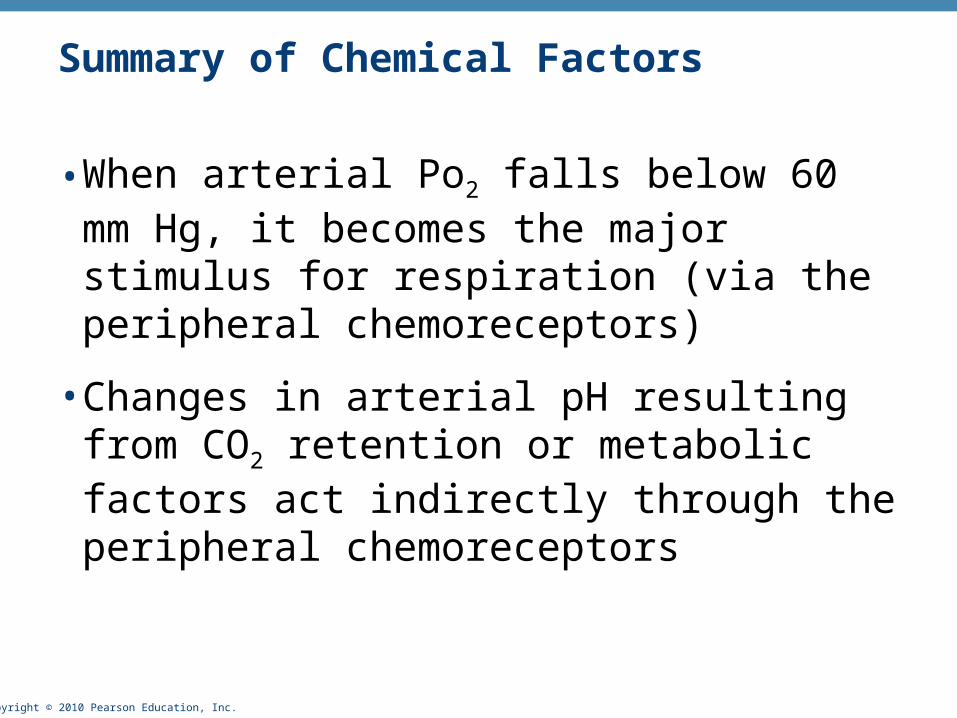
•When arterial Po2 falls below 60 mm Hg, it becomes the major stimulus for respiration (via the peripheral chemoreceptors)
• Changes in arterial pH resulting from CO2 retention or metabolic factors act indirectly through the peripheral chemoreceptors

Copyright © 2010 Pearson Education, Inc.
Influence of Higher Brain Centers
• Hypothalamic controls act through the limbic system to modify rate and depth of respiration
• Example: breath holding that occurs in anger or gasping with pain
• A rise in body temperature acts to increase respiratory rate
• Cortical controls are direct signals from the cerebral motor cortex that bypass medullary controls
• Example: voluntary breath holding

Copyright © 2010 Pearson Education, Inc.
Pulmonary Irritant Reflexes
• Receptors in the bronchioles respond to irritants
• Promote reflexive constriction of air passages
• Receptors in the larger airways mediate the cough and sneeze reflexes
Copyright © 2010 Pearson Education, Inc.
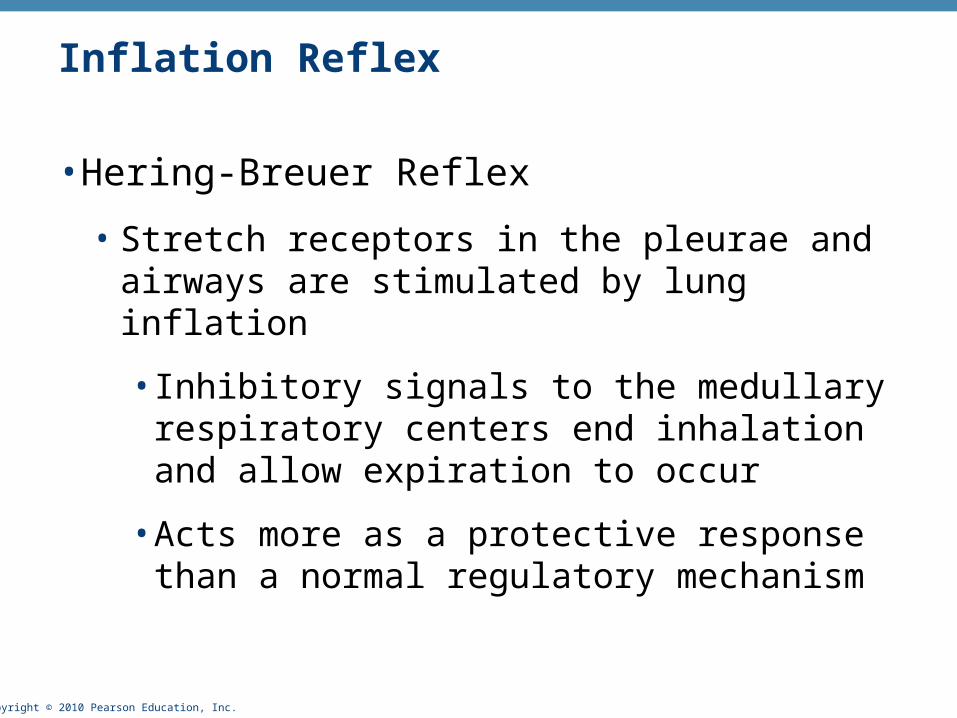
Inflation Reflex
• Hering-Breuer Reflex
• Stretch receptors in the pleurae and airways are stimulated by lung inflation
• Inhibitory signals to the medullary respiratory centers end inhalation and allow expiration to occur
• Acts more as a protective response than a normal regulatory mechanism
Copyright © 2010 Pearson Education, Inc. Figure 22.24
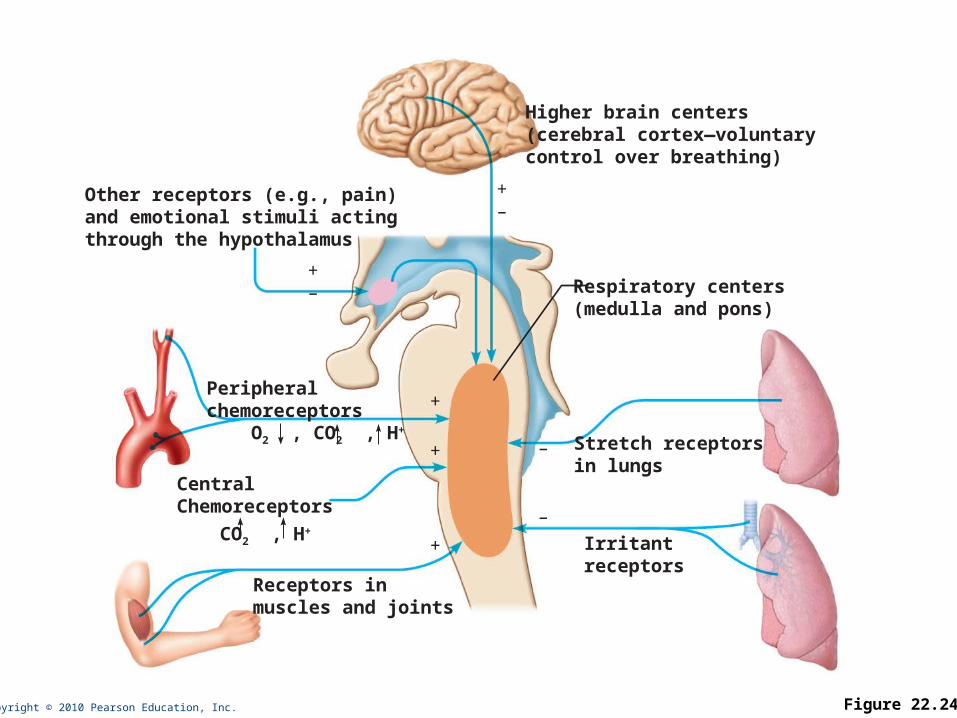
Higher brain centers(cerebral cortex—voluntarycontrol over breathing)
Other receptors (e.g., pain)and emotional stimuli actingthrough the hypothalamus
Peripheralchemoreceptors O2 , CO2 , H+
Receptors inmuscles and joints
Irritantreceptors
Stretch receptorsin lungs
Respiratory centers(medulla and pons)
–
–
+
+–
+–
+
+
CentralChemoreceptors
CO2 , H+

Copyright © 2010 Pearson Education, Inc.
Respiratory Adjustments: Exercise
• Adjustments are geared to both the intensity and duration of exercise
• Hyperpnea
• Increase in ventilation (10 to 20 fold) in response to metabolic needs
• Pco2, Po2, and pH remain surprisingly constant during exercise

Copyright © 2010 Pearson Education, Inc.
Respiratory Adjustments: Exercise
• Three neural factors cause increase in ventilation as exercise begins
• Psychological stimuli—anticipation of exercise
• Simultaneous cortical motor activation of skeletal muscles and respiratory centers
• Exictatory impulses reaching respiratory centers from

Copyright © 2010 Pearson Education, Inc.
Respiratory Adjustments: Exercise
• As exercise ends
• Ventilation declines suddenly as the three neural factors shut off
Copyright © 2010 Pearson Education, Inc.
Respiratory Adjustments: High Altitude
• Quick travel to altitudes above 8000 feet may produce symptoms of acute mountain sickness (AMS)
• Headaches, shortness of breath, nausea, and dizziness
• In severe cases, lethal cerebral and pulmonary edema

Copyright © 2010 Pearson Education, Inc.
Acclimatization to High Altitude
• Acclimatization: respiratory and hematopoietic adjustments to altitude
• Chemoreceptors become more responsive to Pco2 when Po2 declines
• Substantial decline in Po2 directly stimulates peripheral chemoreceptors
• Result: minute ventilation increases and stabilizes in a few days to 2–3 L/min higher than at sea level
Copyright © 2010 Pearson Education, Inc.
Acclimatization to High Altitude
• Decline in blood O2 stimulates the kidneys to accelerate production of EPO
• RBC numbers increase slowly to provide long-term compensation

Copyright © 2010 Pearson Education, Inc.
Homeostatic Imbalances
• Chronic obstructive pulmonary disease (COPD)
• Exemplified by chronic bronchitis and emphysema
• Irreversible decrease in the ability to force air out of the lungs
• Other common features
• History of smoking in 80% of patients
• Dyspnea: labored breathing (“air hunger”)
• Coughing and frequent pulmonary infections
• Most victims develop respiratory failure (hypoventilation) accompanied by respiratory acidosis

Copyright © 2010 Pearson Education, Inc. Figure 22.27
• Tobacco smoke• Air pollution
• Airway obstruction or air trapping• Dyspnea• Frequent infections
• Abnormal ventilation- perfusion ratio• Hypoxemia• Hypoventilation
-1 antitrypsindeficiency
Continual bronchialirritation and inflammation
Breakdown of elastin inconnective tissue of lungs
Chronic bronchitisBronchial edema,chronic productive cough,bronchospasm
EmphysemaDestruction of alveolarwalls, loss of lungelasticity, air trapping
Copyright © 2010 Pearson Education, Inc.
Homeostatic Imbalances
• Asthma
• Characterized by coughing, dyspnea, wheezing, and chest tightness
• Active inflammation of the airways precedes bronchospasms
• Airway inflammation is an immune response caused by release of interleukins, production of IgE, and recruitment of inflammatory cells
• Airways thickened with inflammatory exudate magnify the effect of bronchospasms
Copyright © 2010 Pearson Education, Inc.
Homeostatic Imbalances
• Tuberculosis
• Infectious disease caused by the bacterium Mycobacterium tuberculosis
• Symptoms include fever, night sweats, weight loss, a racking cough, and spitting up blood
• Treatment entails a 12-month course of antibiotics

Copyright © 2010 Pearson Education, Inc.
Homeostatic Imbalances
• Lung cancer
• Leading cause of cancer deaths in North America
• 90% of all cases are the result of smoking
• The three most common types
1. Squamous cell carcinoma (20–40% of cases) in bronchial epithelium
2. Adenocarcinoma (~40% of cases) originates in peripheral lung areas
3. Small cell carcinoma (~20% of cases) contains lymphocyte-like cells that originate in the primary bronchi and subsequently metastasize

![Respiratory system roadmap.pptx [Repaired] - Loginanatomical-sciences.health.wits.ac.za/roadmaps/Respiratory system... · DIVISION OF THE RESPIRATORY SYSTEM CONDUCTING PORTION Nasal](https://img.pdfslide.us/doc/110x75/5a78c3d87f8b9ae6228c9db0/respiratory-system-repaired-loginanatomical-scienceshealthwitsaczaroadmapsrespiratory.jpg)