Embed Size (px)
Citation preview
Lowland Technology International 2015; 17 (1): 27-38
International Association of Lowland Technology (IALT): ISSN 1344-9656
Research Paper The relationship between tourist’s path selection and space image: A case study of peripheral lines surrounding the West Lake
X.M. Zhao 1, J.R. SHI 2, Y.Y. Duan 3, Y.X. Lei 4 and K. Hokao 5
A R T I C L E I N F O R M A T I O N
A B S T R A C T
Article history: Received: 19 September, 2014 Received in revised form: 27 March, 2015 Accepted: 06 May, 2015 Published on: June, 2015
Relationship between space image and tourists’ path selection patterns plays a very important role in landscape planning and design in scenic areas. Based on research of West Lake scenic area in Hang Zhou, this article studies the small scale space scenic images and big scale spatial structure images through questionnaire surveys, image recognition, image sketch, factor analysis, dynamic observation and other methods. The results indicate that there are four main types of space activities among the West Lake tourists, namely (1) the general activity type in the Bai Causeway and Su Causeway, (2) the general activity type in the Sunset Glow at Leifeng Pagoda, (3) the surrounding activity type in the Evening Bell at Nanping Hill, and (4) the surrounding activity type in the Music Fountain Square; and the proportion score has it in order from high to low. The score results of tourists' identifying picture and frequency of the five elements of space image in image maps are consistent with four main types of space activities observed by dynamic lines. Therefore, tourists' perception results of space image can directly affect the route choice behavior. And the more image elements can be perceived, the more reasonable path choices can be made. Finally, the research puts forward some suggestions tentatively on the planning and design of the West Lake area.
Keywords: Tourist Path selection Space image Line observation Cognitive map
1 Associate Professor, Department of Environmental Design, Zhejiang Gongshang University, Hangzhou 310018, CHINA,
[email protected] 2 Associate Professor, Department of Urban Planning, Zhejiang Gongshang University, Hangzhou 310018, CHINA, [email protected] 3 Department of Urban Planning, Zhejiang Gongshang University, Hangzhou 310018, CHINA 4 Department of Urban Planning, Zhejiang Gongshang University, Hangzhou 310018, CHINA 5 Professor Emeritus & IALT member, Department of Civil Engineering, Saga University, Saga 840-8502, JAPAN,
[email protected] Note: Discussion on this paper is open until September 2015
1. Introduction 1.1 Research background
The rise of urban tourism and people’s attention to the scenic area planning promotes the increase of scenic area space perception research. Tourists of different
nationalities, different characteristics and personality traits gather in one place, constituting members of the scenic spots and forming a tourist flow of different paths. For example, tourists coming the first time may behave differently on the choice of travel route in the face of unfamiliar area space; tourists having no sense of direction may don't know what to do in a certain limit for
28 X.M. Zhao et al. / Lowland Technology International 2015; 17 (1): 27-38
fear of being lost; tourists having traveled for many times and abnormal familiar with the space layout of scenic spots could easily select a path of saving time and enjoying the most representative beauty, etc.. Perception study of scenic area space conforms to the development trend of "tourists-oriented" in the process of today's tourism planning. This article will focus on research of combining tourist route choice with space image study. 1.2 Research review In the rapid development of urbanization, unplanned, inefficient development projects both for the sustainable development of urban planning, urban environment and human activity will lead to a wide range of devastating consequences (Shummadtayar et al., 2013).With the infrastructure construction, tourism planning and development path chosen by the impact of tourists has become increasingly prominent, many researchers choose the path scholars and space research has gradually penetrated (Lew and McKercher, 2002). Wu focused on the distribution of inner-city visitors in 1994 (Wu, 1994). Fennell analyzed the movement of tourists and time allocation to show tourists spatiotemporal patterns (Fennell, 1994). Bao and Yang mainly researched urban destination for space tourism market rules and spatial structure (Bao et al., 2002; Yang and Ma, 2004). Shoval, etc analyzed the process flow of tourists within the city by modern tracking technology (Shoval and Michal, 2009).McKercher and Lau through our own internal space tourist traveler behavior patterns to detect spatial and temporal patterns of explanatory and predictive factors (McKercher and Lau, 2008). Lew and McKercher attempted to move the actual modeling modespace tourists to look for the impact of internal tourist destination spatial behavior patterns important factors (Lew and McKercher, 2002; Lew and McKercher, 2006). Yang and Gu studied the spatial distribution of tourists between cities (Yang and Gu, 2011).
With the rise of urban tourism and people's attention on the scenic space planning a lot of scholars were prompted to study the perception of the scenic space. Different types of tourists are more and more influenced by the subjective perception of the impact of space imagery, so the tourist path and spatial imagery binding studies conducted increasingly necessary. Theory research of space image: the putting forward of "learning theory" and clear concept of "space image". Psychologist Tolman put forward a "learning theory" in 1948 and opened the study precedent of space image theory (Tolman, 1948), then behavior geologist, Walmsley further defined the concept of space image (Walmsley, 1988). Empirical research of space image: the putting forward of "city image". Kevin Lynch (1960), the great
American architect, was the first to propose the concept of city image and he thought that everyone in their environment formed the local impression of their own city, and can divide the city image content into five types of elements referred to the physical form: roads, borders, areas, nodes and landmarks (Lynch, 1960). Domestic city image research started in the early 1970 s and then many scholars put forward relevant concepts. For example, Li and Sun proposed the concept of city tourism image (Li and Sun, 2009).
To sum up, with the development of urban tourism, the researchers began to develop an interest in quoting urban image map method (cognitive sketches) into the field of tourism research (Qian and Su, 2010), but the domestic study of a particular "scenic spot space image" is less extensive (34 articles). And the research literature based on travel behaviors combining tourists "path" with "space image" are much rarer (4 articles). According to the Walmsley the space image is that people understand certain objective by means of the spatial characteristics of the object, such as shape, proportion, spacing, orientation, etc. in the brain to produce the impression of the perceptions and schemata process. We can learn there are relationships between the space image and the route choice (Walmsley 1988). Therefore, this article attempts to take the peripheral lines surrounding the West Lake as an example to have a tentative analysis of the correlation between tourist’s path selection and space image.
1.3 Research significance
The significance of this study lies in the scenic tourist route and space imagery theory, combining tourism with induction geography, spatial planning tourist attractions proposed ideas. At the same time, based on a number of surveys and empirical data analysis, correlation study seeks to explore tourist path and space images, with a strong practical significance.
Firstly, to help visitors understand the psychological perception of the degree of influence for path selection. Through this study, visitors can learn the subjective feelings of the scenic space of preference, to guide the designer to build physical space, while focusing on the importance of creating a virtual space. Secondly, to help guide the planning of tourist attractions. In tourism planning, the key is to create a unique tourist attraction, and give full play to the important role of the five elements of the city image and rational planning application to the area, so that visitors can have a strong perception of the scenic area, create a good tourism image, so as to develop a kind of tourist attractions planning to explore new ideas and methods. Finally, help expand the tourism market. Through data analysis on the
29 X.M. Zhao et al. / Lowland Technology International 2015; 17 (1): 27-38
scenic space images, can be quantitatively evaluated for scenic images in order to take corresponding marketing channels, according to the index level scenic imagery, be targeted.
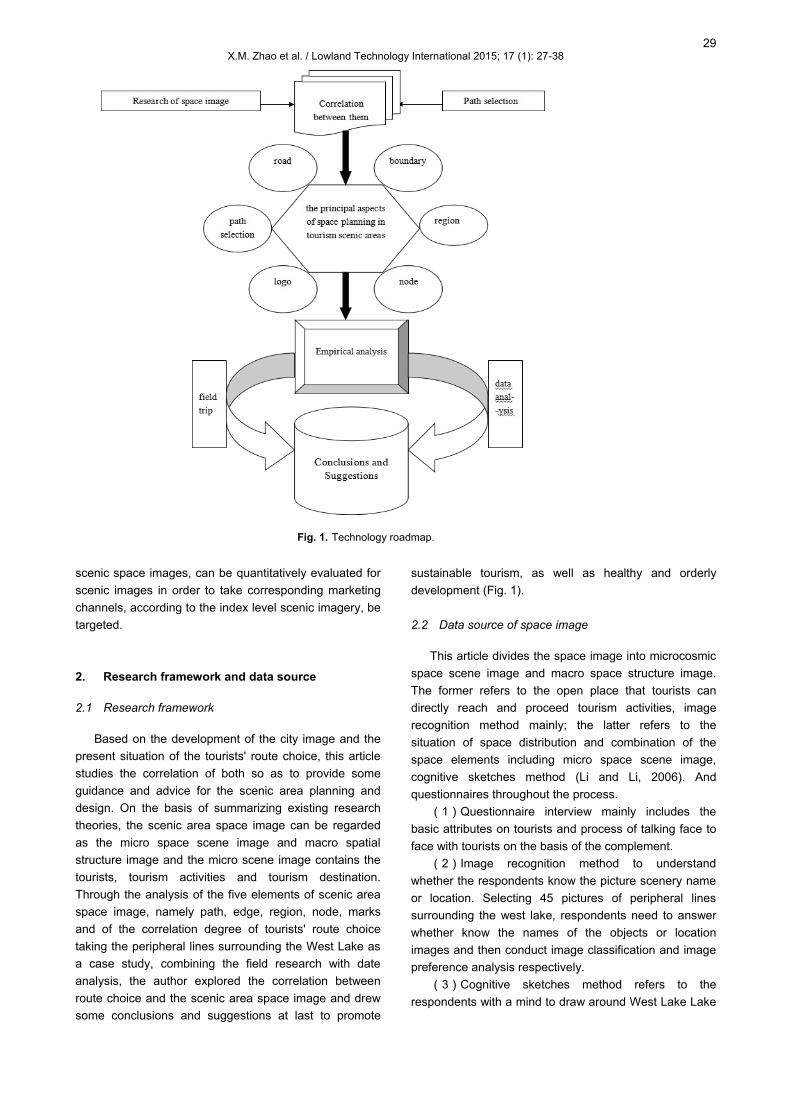
2. Research framework and data source 2.1 Research framework
Based on the development of the city image and the present situation of the tourists' route choice, this article studies the correlation of both so as to provide some guidance and advice for the scenic area planning and design. On the basis of summarizing existing research theories, the scenic area space image can be regarded as the micro space scene image and macro spatial structure image and the micro scene image contains the tourists, tourism activities and tourism destination. Through the analysis of the five elements of scenic area space image, namely path, edge, region, node, marks and of the correlation degree of tourists' route choice taking the peripheral lines surrounding the West Lake as a case study, combining the field research with date analysis, the author explored the correlation between route choice and the scenic area space image and drew some conclusions and suggestions at last to promote
sustainable tourism, as well as healthy and orderly development (Fig. 1). 2.2 Data source of space image
This article divides the space image into microcosmic
space scene image and macro space structure image. The former refers to the open place that tourists can directly reach and proceed tourism activities, image recognition method mainly; the latter refers to the situation of space distribution and combination of the space elements including micro space scene image, cognitive sketches method (Li and Li, 2006). And questionnaires throughout the process.
(1)Questionnaire interview mainly includes the basic attributes on tourists and process of talking face to face with tourists on the basis of the complement.
(2)Image recognition method to understand whether the respondents know the picture scenery name or location. Selecting 45 pictures of peripheral lines surrounding the west lake, respondents need to answer whether know the names of the objects or location images and then conduct image classification and image preference analysis respectively.
(3)Cognitive sketches method refers to the respondents with a mind to draw around West Lake Lake
Fig. 1. Technology roadmap.
30 X.M. Zhao et al. / Lowland Technology International 2015; 17 (1): 27-38
scenic spot or a sketch and appropriate annotation. The respondent needs to draw out a sketch of the peripheral lines surrounding the West Lake or within it and have marks if appropriate. Observe and record visitors the appearing sequence order of each factor in the drawing process and then provide statistics for the frequency number and rate of each factor in the sketch drawn by all respondents.
2.3 Data source of tourist’s path selection
This part of the research adopts the tracking survey method in the dynamic line tracing method, that is investigators track and record the respondents and investigation contents mainly include the mobile number, mobile time, route selection, track, etc.
The study gave out 220 questionnaires in all and recycled 200 effective questionnaires and the effective rate was 91%.The questionnaire is divided into three parts, the social background of tourists, western visitors to the lake’s impression sketch. The social background of tourists and the perception of the West Lake survey can help visitors understand the different social background images for the perception of the lake while Lynch’s impression sketch space images of the five elements; the analysis of the various elements appear frequency and frequency difference can be drawn on the West Lake scenic tourist space images of five elements of frequency and perception between the different elements.
3. Data analysis
The West Lake in Hangzhou is a cultural landscape reflected by a lake, mountain and city evolved from a nature's landscape entity. As a typical urban lake, the West Lake is located in the west of Hangzhou and has spatial characteristics of a Lake City consisting of "three sides surrounding mountains and one side of the city", which basically outlines the best natural landscape into the scene topography.
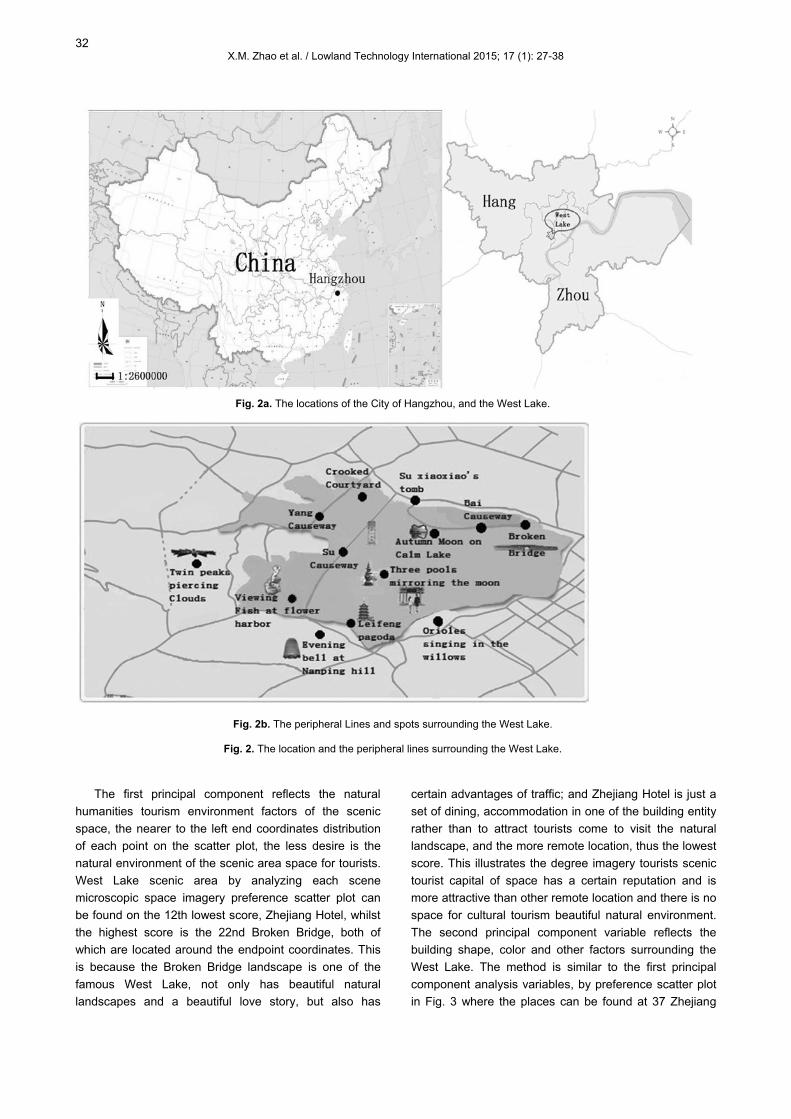
The West Lake successfully applied for the world cultural landscape heritage on June 25, 2011, and in the application papers, the West Lake cultural landscape in Hangzhou is defined as "the spiritual home of Chinese traditional cultural elites for more than ten centuries, a yearning paradise on earth for all levels of people, a cultural lake that has the oldest history and the strongest influence and once had an extensive influence on the culture in East Asia from the 9th to the 18th century". As one of nine scenic areas, peripheral lines scenic spots surrounding the West Lake are the core subject and representation and are also the assembling areas of Ten Views of the West Lake, attracting more and more people
from home and abroad (Fig. 2). But to some extent, the tourism development level of Hangzhou obviously lags behind the level of Beijing, Shanghai and other larger Chinese cities. In order to obtain more tourist markets and enhance the influence and popularity of the West Lake in Hangzhou around the world, peripheral lines scenic spots surrounding the West Lake still need to improve the layout of scenic spot so as to shape a better landscape image and city image, improve the core competitiveness, thus promote a fast and sustainable development in the tourism industry in Hangzhou. Therefore, it will be necessary to have a analysis and research on the space images surrounding the West Lake. 3.1 Data analysis of pace image 3.1.1 Microcosmic space scene image
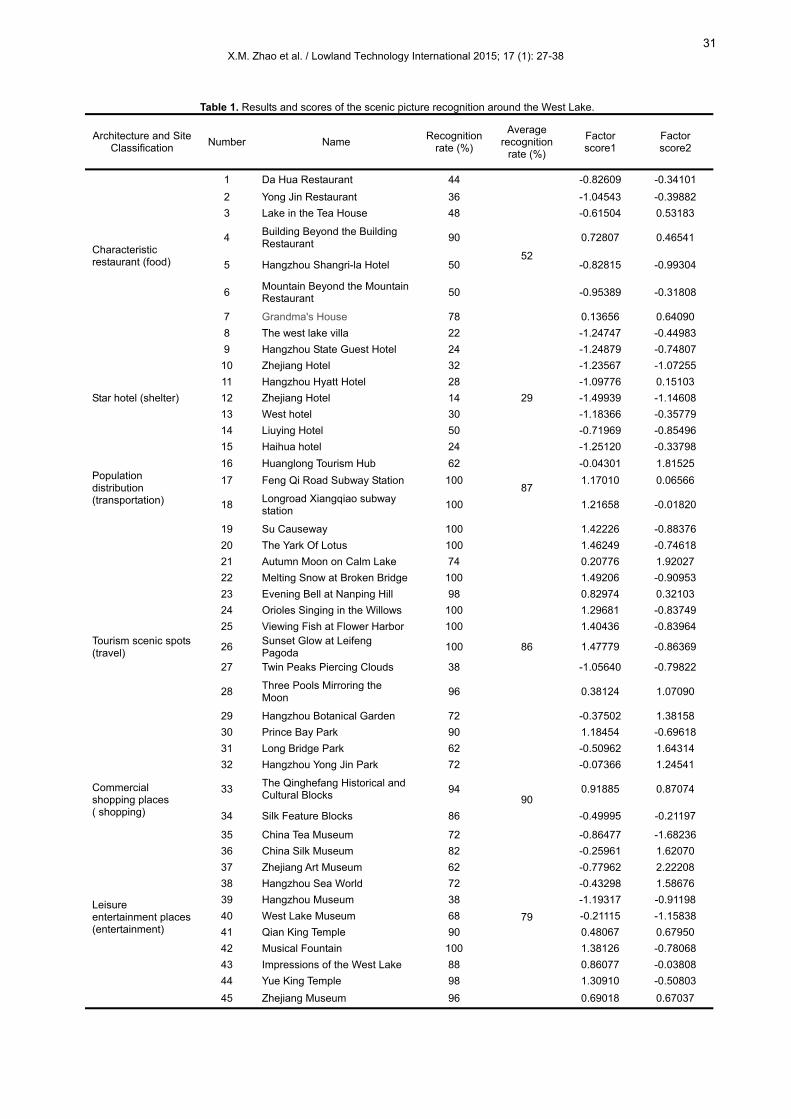
(1) Photo identification and results Photos that need to be identified are divided into six
categories according to the elements of tourist activities: characteristic restaurants (food) 8 pictures, star hotels (shelters) 7 pictures, population distributions (transportation) 3 pictures, tourism scenic spots (travel) 14 pictures, commercial shopping places (shopping) 2 pictures, leisure entertainment places (entertainment) 11 pictures (Table 1). And it indicates: 1) Most of the buildings are in place to identify the rate of more than 20 %, and more than 50% account for a large part of that whole picture identifiable LAKE high scenic space. 2) Identify the highest rate of commercial shopping, up to 90 %. 3) Identify the rate of specialty restaurants in each location there is a big difference. As Lou Wai Lou restaurant (90 %) and West Hills (22 %), which was mainly due to visibility, which affect the location and facilities. 4) Identification star hotel rates are generally low. 5) Tourist scenic spots in various scenic spots higher identification rate. 6) In identifying various locations leisure and entertainment, showing some differences, mainly affected by geographic location and facilities.
(2) Image preference analysis and results Giving results of picture identification image level
scores and having a principal component analysis for the score results of 45 microcosmic space situation images in the application of SPSS software, we can work out the regression factor score and corresponding preference scatter plot.
The author obtained nine principal component variables in the application of SPSS software for 45 microcosmic space situations of principal component analysis, and in this paper the author drew the tourists ' preference scatter plot according to the first two principal components scores, as shown in Fig. 3.
31 X.M. Zhao et al. / Lowland Technology International 2015; 17 (1): 27-38
Table 1. Results and scores of the scenic picture recognition around the West Lake.
Architecture and Site Classification Number Name Recognition
rate (%)
Average recognition
rate (%)
Factor score1
Factor score2
Characteristic restaurant (food)
1 Da Hua Restaurant 44
52
-0.82609 -0.34101 2 Yong Jin Restaurant 36 -1.04543 -0.39882 3 Lake in the Tea House 48 -0.61504 0.53183
4 Building Beyond the Building Restaurant 90 0.72807 0.46541
5 Hangzhou Shangri-la Hotel 50 -0.82815 -0.99304
6 Mountain Beyond the Mountain Restaurant 50 -0.95389 -0.31808
7 Grandma's House 78 0.13656 0.64090 8 The west lake villa 22 -1.24747 -0.44983
Star hotel (shelter)
9 Hangzhou State Guest Hotel 24
29
-1.24879 -0.74807 10 Zhejiang Hotel 32 -1.23567 -1.07255 11 Hangzhou Hyatt Hotel 28 -1.09776 0.15103 12 Zhejiang Hotel 14 -1.49939 -1.14608 13 West hotel 30 -1.18366 -0.35779 14 Liuying Hotel 50 -0.71969 -0.85496 15 Haihua hotel 24 -1.25120 -0.33798
Population distribution (transportation)
16 Huanglong Tourism Hub 62
87
-0.04301 1.81525 17 Feng Qi Road Subway Station 100 1.17010 0.06566
18 Longroad Xiangqiao subway station 100 1.21658 -0.01820
Tourism scenic spots (travel)
19 Su Causeway 100
86
1.42226 -0.88376 20 The Yark Of Lotus 100 1.46249 -0.74618 21 Autumn Moon on Calm Lake 74 0.20776 1.92027 22 Melting Snow at Broken Bridge 100 1.49206 -0.90953 23 Evening Bell at Nanping Hill 98 0.82974 0.32103 24 Orioles Singing in the Willows 100 1.29681 -0.83749 25 Viewing Fish at Flower Harbor 100 1.40436 -0.83964
26 Sunset Glow at Leifeng Pagoda 100 1.47779 -0.86369
27 Twin Peaks Piercing Clouds 38 -1.05640 -0.79822
28 Three Pools Mirroring the Moon 96 0.38124 1.07090
29 Hangzhou Botanical Garden 72 -0.37502 1.38158 30 Prince Bay Park 90 1.18454 -0.69618 31 Long Bridge Park 62 -0.50962 1.64314 32 Hangzhou Yong Jin Park 72 -0.07366 1.24541
Commercial shopping places ( shopping)
33 The Qinghefang Historical and Cultural Blocks 94
90 0.91885 0.87074
34 Silk Feature Blocks 86 -0.49995 -0.21197
Leisure entertainment places (entertainment)
35 China Tea Museum 72
79
-0.86477 -1.68236 36 China Silk Museum 82 -0.25961 1.62070 37 Zhejiang Art Museum 62 -0.77962 2.22208 38 Hangzhou Sea World 72 -0.43298 1.58676 39 Hangzhou Museum 38 -1.19317 -0.91198 40 West Lake Museum 68 -0.21115 -1.15838 41 Qian King Temple 90 0.48067 0.67950 42 Musical Fountain 100 1.38126 -0.78068 43 Impressions of the West Lake 88 0.86077 -0.03808 44 Yue King Temple 98 1.30910 -0.50803 45 Zhejiang Museum 96 0.69018 0.67037
32 X.M. Zhao et al. / Lowland Technology International 2015; 17 (1): 27-38
Fig. 2a. The locations of the City of Hangzhou, and the West Lake.
Fig. 2b. The peripheral Lines and spots surrounding the West Lake.
Fig. 2. The location and the peripheral lines surrounding the West Lake.
The first principal component reflects the natural humanities tourism environment factors of the scenic space, the nearer to the left end coordinates distribution of each point on the scatter plot, the less desire is the natural environment of the scenic area space for tourists. West Lake scenic area by analyzing each scene microscopic space imagery preference scatter plot can be found on the 12th lowest score, Zhejiang Hotel, whilst the highest score is the 22nd Broken Bridge, both of which are located around the endpoint coordinates. This is because the Broken Bridge landscape is one of the famous West Lake, not only has beautiful natural landscapes and a beautiful love story, but also has
certain advantages of traffic; and Zhejiang Hotel is just a set of dining, accommodation in one of the building entity rather than to attract tourists come to visit the natural landscape, and the more remote location, thus the lowest score. This illustrates the degree imagery tourists scenic tourist capital of space has a certain reputation and is more attractive than other remote location and there is no space for cultural tourism beautiful natural environment. The second principal component variable reflects the building shape, color and other factors surrounding the West Lake. The method is similar to the first principal component analysis variables, by preference scatter plot in Fig. 3 where the places can be found at 37 Zhejiang
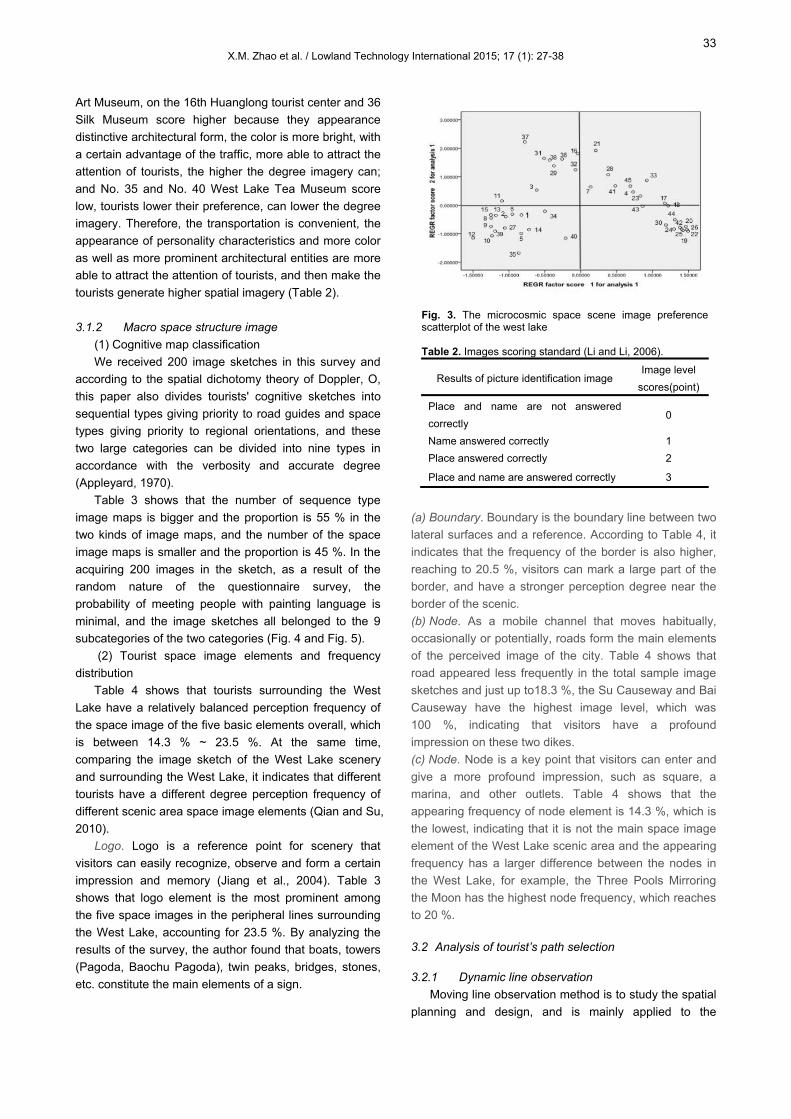
33 X.M. Zhao et al. / Lowland Technology International 2015; 17 (1): 27-38
Fig. 3. The microcosmic space scene image preference scatterplot of the west lake Table 2. Images scoring standard (Li and Li, 2006).
Results of picture identification image Image level
scores(point)
Place and name are not answered correctly
0
Name answered correctly 1 Place answered correctly 2
Place and name are answered correctly 3
Art Museum, on the 16th Huanglong tourist center and 36 Silk Museum score higher because they appearance distinctive architectural form, the color is more bright, with a certain advantage of the traffic, more able to attract the attention of tourists, the higher the degree imagery can; and No. 35 and No. 40 West Lake Tea Museum score low, tourists lower their preference, can lower the degree imagery. Therefore, the transportation is convenient, the appearance of personality characteristics and more color as well as more prominent architectural entities are more able to attract the attention of tourists, and then make the tourists generate higher spatial imagery (Table 2).
3.1.2 Macro space structure image
(1) Cognitive map classification We received 200 image sketches in this survey and
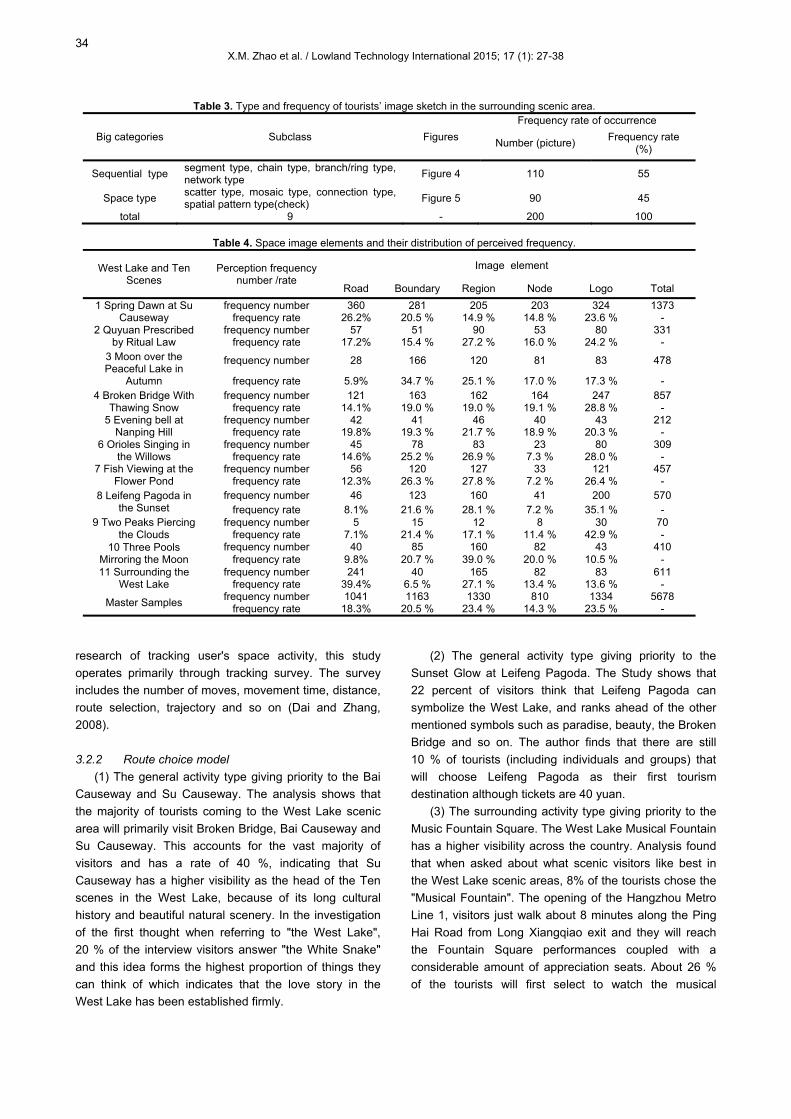
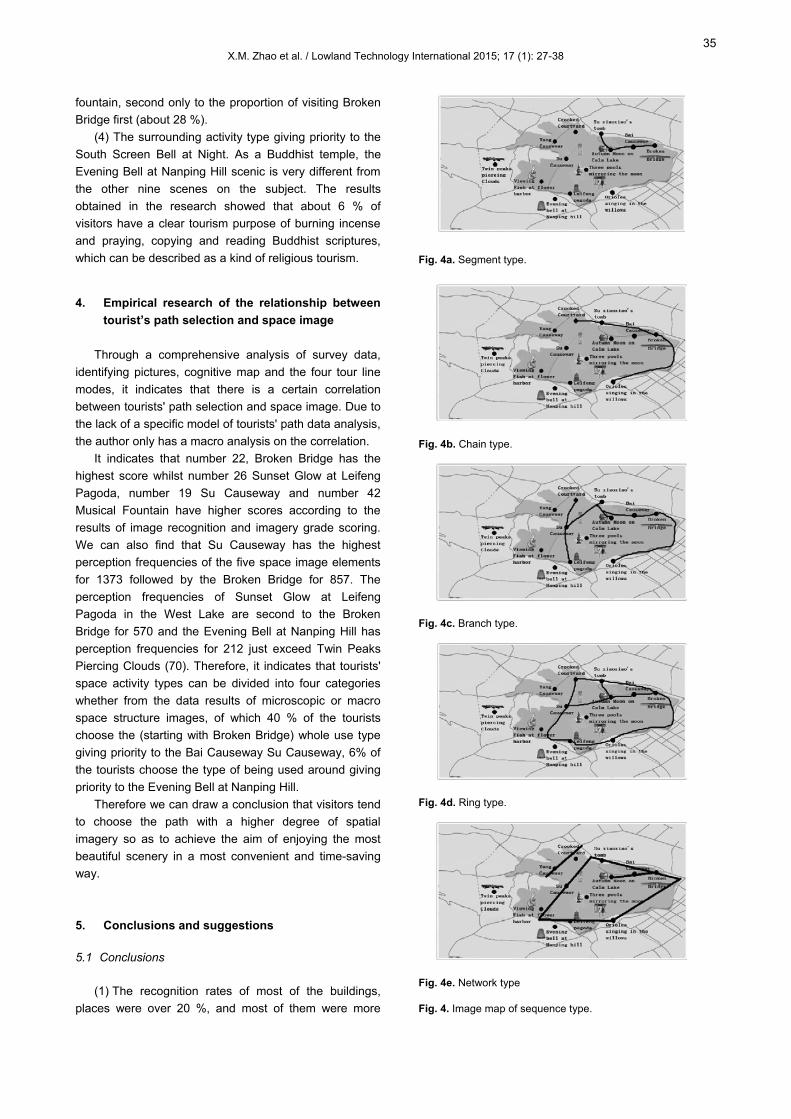
according to the spatial dichotomy theory of Doppler, O, this paper also divides tourists' cognitive sketches into sequential types giving priority to road guides and space types giving priority to regional orientations, and these two large categories can be divided into nine types in accordance with the verbosity and accurate degree (Appleyard, 1970).
Table 3 shows that the number of sequence type image maps is bigger and the proportion is 55 % in the two kinds of image maps, and the number of the space image maps is smaller and the proportion is 45 %. In the acquiring 200 images in the sketch, as a result of the random nature of the questionnaire survey, the probability of meeting people with painting language is minimal, and the image sketches all belonged to the 9 subcategories of the two categories (Fig. 4 and Fig. 5).
(2) Tourist space image elements and frequency distribution
Table 4 shows that tourists surrounding the West Lake have a relatively balanced perception frequency of the space image of the five basic elements overall, which is between 14.3 % ~ 23.5 %. At the same time, comparing the image sketch of the West Lake scenery and surrounding the West Lake, it indicates that different tourists have a different degree perception frequency of different scenic area space image elements (Qian and Su, 2010).
Logo. Logo is a reference point for scenery that visitors can easily recognize, observe and form a certain impression and memory (Jiang et al., 2004). Table 3 shows that logo element is the most prominent among the five space images in the peripheral lines surrounding the West Lake, accounting for 23.5 %. By analyzing the results of the survey, the author found that boats, towers (Pagoda, Baochu Pagoda), twin peaks, bridges, stones, etc. constitute the main elements of a sign.
(a) Boundary. Boundary is the boundary line between two lateral surfaces and a reference. According to Table 4, it indicates that the frequency of the border is also higher, reaching to 20.5 %, visitors can mark a large part of the border, and have a stronger perception degree near the border of the scenic. (b) Node. As a mobile channel that moves habitually, occasionally or potentially, roads form the main elements of the perceived image of the city. Table 4 shows that road appeared less frequently in the total sample image sketches and just up to18.3 %, the Su Causeway and Bai Causeway have the highest image level, which was 100 %, indicating that visitors have a profound impression on these two dikes. (c) Node. Node is a key point that visitors can enter and give a more profound impression, such as square, a marina, and other outlets. Table 4 shows that the appearing frequency of node element is 14.3 %, which is the lowest, indicating that it is not the main space image element of the West Lake scenic area and the appearing frequency has a larger difference between the nodes in the West Lake, for example, the Three Pools Mirroring the Moon has the highest node frequency, which reaches to 20 %. 3.2 Analysis of tourist’s path selection 3.2.1 Dynamic line observation
Moving line observation method is to study the spatial planning and design, and is mainly applied to the
34 X.M. Zhao et al. / Lowland Technology International 2015; 17 (1): 27-38
Table 3. Type and frequency of tourists’ image sketch in the surrounding scenic area.
Big categories Subclass Figures Frequency rate of occurrence
Number (picture) Frequency rate (%)
Sequential type segment type, chain type, branch/ring type, network type Figure 4 110 55
Space type scatter type, mosaic type, connection type, spatial pattern type(check) Figure 5 90 45
total 9 - 200 100
Table 4. Space image elements and their distribution of perceived frequency.
West Lake and Ten Scenes
Perception frequency number /rate
Image element
Road Boundary Region Node Logo Total 1 Spring Dawn at Su
Causeway frequency number 360 281 205 203 324 1373
frequency rate 26.2% 20.5 % 14.9 % 14.8 % 23.6 % - 2 Quyuan Prescribed
by Ritual Law frequency number 57 51 90 53 80 331
frequency rate 17.2% 15.4 % 27.2 % 16.0 % 24.2 % - 3 Moon over the Peaceful Lake in
Autumn
frequency number 28 166 120 81 83 478
frequency rate 5.9% 34.7 % 25.1 % 17.0 % 17.3 % - 4 Broken Bridge With
Thawing Snow frequency number 121 163 162 164 247 857
frequency rate 14.1% 19.0 % 19.0 % 19.1 % 28.8 % - 5 Evening bell at
Nanping Hill frequency number 42 41 46 40 43 212
frequency rate 19.8% 19.3 % 21.7 % 18.9 % 20.3 % - 6 Orioles Singing in
the Willows frequency number 45 78 83 23 80 309
frequency rate 14.6% 25.2 % 26.9 % 7.3 % 28.0 % - 7 Fish Viewing at the
Flower Pond frequency number 56 120 127 33 121 457
frequency rate 12.3% 26.3 % 27.8 % 7.2 % 26.4 % - 8 Leifeng Pagoda in
the Sunset frequency number 46 123 160 41 200 570
frequency rate 8.1% 21.6 % 28.1 % 7.2 % 35.1 % - 9 Two Peaks Piercing
the Clouds frequency number 5 15 12 8 30 70
frequency rate 7.1% 21.4 % 17.1 % 11.4 % 42.9 % - 10 Three Pools
Mirroring the Moon frequency number 40 85 160 82 43 410
frequency rate 9.8% 20.7 % 39.0 % 20.0 % 10.5 % - 11 Surrounding the
West Lake frequency number 241 40 165 82 83 611
frequency rate 39.4% 6.5 % 27.1 % 13.4 % 13.6 % -
Master Samples frequency number 1041 1163 1330 810 1334 5678 frequency rate 18.3% 20.5 % 23.4 % 14.3 % 23.5 % -
research of tracking user's space activity, this study operates primarily through tracking survey. The survey includes the number of moves, movement time, distance, route selection, trajectory and so on (Dai and Zhang, 2008). 3.2.2 Route choice model
(1) The general activity type giving priority to the Bai Causeway and Su Causeway. The analysis shows that the majority of tourists coming to the West Lake scenic area will primarily visit Broken Bridge, Bai Causeway and Su Causeway. This accounts for the vast majority of visitors and has a rate of 40 %, indicating that Su Causeway has a higher visibility as the head of the Ten scenes in the West Lake, because of its long cultural history and beautiful natural scenery. In the investigation of the first thought when referring to "the West Lake", 20 % of the interview visitors answer "the White Snake" and this idea forms the highest proportion of things they can think of which indicates that the love story in the West Lake has been established firmly.
(2) The general activity type giving priority to the Sunset Glow at Leifeng Pagoda. The Study shows that 22 percent of visitors think that Leifeng Pagoda can symbolize the West Lake, and ranks ahead of the other mentioned symbols such as paradise, beauty, the Broken Bridge and so on. The author finds that there are still 10 % of tourists (including individuals and groups) that will choose Leifeng Pagoda as their first tourism destination although tickets are 40 yuan.
(3) The surrounding activity type giving priority to the Music Fountain Square. The West Lake Musical Fountain has a higher visibility across the country. Analysis found that when asked about what scenic visitors like best in the West Lake scenic areas, 8% of the tourists chose the "Musical Fountain". The opening of the Hangzhou Metro Line 1, visitors just walk about 8 minutes along the Ping Hai Road from Long Xiangqiao exit and they will reach the Fountain Square performances coupled with a considerable amount of appreciation seats. About 26 % of the tourists will first select to watch the musical
35 X.M. Zhao et al. / Lowland Technology International 2015; 17 (1): 27-38
Fig. 4a. Segment type.
Fig. 4b. Chain type.
Fig. 4c. Branch type.
Fig. 4d. Ring type.
Fig. 4e. Network type Fig. 4. Image map of sequence type.
fountain, second only to the proportion of visiting Broken Bridge first (about 28 %).
(4) The surrounding activity type giving priority to the South Screen Bell at Night. As a Buddhist temple, the Evening Bell at Nanping Hill scenic is very different from the other nine scenes on the subject. The results obtained in the research showed that about 6 % of visitors have a clear tourism purpose of burning incense and praying, copying and reading Buddhist scriptures, which can be described as a kind of religious tourism.
4. Empirical research of the relationship between tourist’s path selection and space image
Through a comprehensive analysis of survey data,
identifying pictures, cognitive map and the four tour line modes, it indicates that there is a certain correlation between tourists' path selection and space image. Due to the lack of a specific model of tourists' path data analysis, the author only has a macro analysis on the correlation.
It indicates that number 22, Broken Bridge has the highest score whilst number 26 Sunset Glow at Leifeng Pagoda, number 19 Su Causeway and number 42 Musical Fountain have higher scores according to the results of image recognition and imagery grade scoring. We can also find that Su Causeway has the highest perception frequencies of the five space image elements for 1373 followed by the Broken Bridge for 857. The perception frequencies of Sunset Glow at Leifeng Pagoda in the West Lake are second to the Broken Bridge for 570 and the Evening Bell at Nanping Hill has perception frequencies for 212 just exceed Twin Peaks Piercing Clouds (70). Therefore, it indicates that tourists' space activity types can be divided into four categories whether from the data results of microscopic or macro space structure images, of which 40 % of the tourists choose the (starting with Broken Bridge) whole use type giving priority to the Bai Causeway Su Causeway, 6% of the tourists choose the type of being used around giving priority to the Evening Bell at Nanping Hill.
Therefore we can draw a conclusion that visitors tend to choose the path with a higher degree of spatial imagery so as to achieve the aim of enjoying the most beautiful scenery in a most convenient and time-saving way.
5. Conclusions and suggestions 5.1 Conclusions
(1) The recognition rates of most of the buildings, places were over 20 %, and most of them were more
36 X.M. Zhao et al. / Lowland Technology International 2015; 17 (1): 27-38
Fig. 5a. Scatter type. Fig. 5b. Mosaic type.
Fig. 5c. Connection type. Fig. 5d. Spatial pattern type.
Fig. 5. Image map of space type.
than 50 %, indicating that the whole space recognition in the West Lake scenic area is high. Meanwhile, the recognition results of the six categories feature pictures divided according to tourism activities elements showed some differences and the commercial shopping districts represented by Qinghefang Historical and Cultural Blocks and Silk Feature Blocks have the highest recognition rates.
(2) The type of image sketches of Peripheral Lines Surrounding the West Lake can be divided into two categories and nine sub-categories. Sequential image sketches have a higher rate for 55 % giving priority to segment, chain, branched/ring and network type, while image maps of space type have a lower rate giving priority to scatter, mosaic, connection and spatial pattern type (check).
(3) There are four main types of space activities among the West Lake tourists, namely the whole use type giving priority to the Bai Causeway Su Causeway and Sunset Glow at Leifeng Pagoda, type of being used around giving priority to the Evening Bell at Nanping Hill and Music Fountain Square.
To sum up, there is a certain correlation between tourists' path selection and space image. When tourists perceive different space images, they will draw out different sketchs of West Lake and choose different routes. The more image elements visitors can perceive, the more it can help tourists make the most reasonable path choices.
5.2 Suggestions
(1) Identifiability construction of road The frequency of road elements appeared lower in
the total sample imagery sketches, such as Autumn Moon on Calm Lake, only 5.9 %, thus consolidating West Lake Ring Road and image degree of Bai Causeway and Su Causeway, roads sensing function and identifiable building of Orioles Singing in the Willows and Viewing Fish at Flower Harbor should be strengthened, so that tourists can identify their orientations accurately anytime and anywhere.
(2) Hierarchical development of node In node cognition, it is not to say that every point must
have the same profound cognitive impression, but should show some hierarchical differences. As the survey data of this paper shows, the frequency between the nodes in the scenic lake appears larger difference, for example, the sample frequency of the highest node elements appearing in Three Pools Mirroring the Moon sketch was 20 %, while Sunset Glow at Leifeng Pagoda, Viewing Fish at Flower Harbor and Orioles Singing in the Willows were about 7.2 %, it may be that there are compelling boat dock and ticket office nearby the Three Pools Mirroring the Moon and they can give visitors a more profound impression. But for tourists of Sunset Glow at Leifeng Pagoda, they enter the area inside after buying tickets and would feel less node elements. However,
37 X.M. Zhao et al. / Lowland Technology International 2015; 17 (1): 27-38
cognitive nodes should be controlled within a certain reasonable range.
(3) Continuing strengthen of sign system of Three Pools Mirroring the Moon
In the research, the author found that as a sign of the West Lake, the Three Pools Mirroring the Moon has not been identified more easily their pictures and locations by tourists and has the lowest frequency in tourists' sketches, only 10.5 %, indicating that the West Lake scenic area, should be focused on the construction and promotion in the mark of Three Pools Mirroring the Moon while strengthening other scenic designation system constructions.
(4) Separate and successive boundaries Boundary is the boundary line of two faces and a
horizontal reference. According to Table 4, this can be found in West Lake that the boundary elements of various scenic sketches appear in the basic balance, the total sample sketch, frequency boundary elements appear higher, 20.5% of visitors surveyed a large part can be labeled the border and near the border on the scenic tourist has a strong degree of perception. Description West Lake scenic area, the West Lake border elements, is not integrated with the connection, it can be said is the scenic doing more successful examples, so the West Lake scenic area boundary elements planned for other national scenic tourism planning to play some reference.
(5) Thematic area of differentiation From the division of the West Lake and West Lake's
new look, the theme of each region are obvious, explained at the time of the West Lake tourism planning and design, special attention to the important role of regional factors, and the effect is significant. Thus, many scenic doing specific plans, should pay special attention to the subject area of differentiation clearly different scenic spots in different regions with different themes, multi-level perspective of the topic, not only to attract tourists with different needs, but also to create and therefore has its own featuring scenic or tourist cities, this is for specific tourism planning and design, will undoubtedly have some degree of guidance and reference.
Acknowledgements
This research is supported by National Natural Science Fund of China (51408545), the Natural Science Fund of Zhejiang Province (LQ12E08010), and the Humanities and Social Science Fund of the Education Ministry of China (13YJCZH150).
References Bao, J.G., Zheng, H.Y., Dai, G.Q., 2002. The evolvement
of spatial structure and the significance of Guilin’s Domestic Tourist Origins. Acta Geographica Sinica, 57 (1): 96-106 (in Chinese).
Dai, F. and Zhang, J.H., 2008. The survey methods in planning and design 2: Trace observation. Chinese Garden: 83-86 (in Chinese).
Fennell, D., 1996. A Tourist Space-time Budget in the Shetland Islands. Annals of Tourism Research, 23 (4): 811-829.
Gu, C.L. and Song, G.C., 2001. Urban Image Space and Main Factors in Beijing. Acta Geographica Sinica, 56 (1): 64-74 (in Chinese).
Jiang, Z.J., Wu, G.Q., and Bai, G.R., 2004. A spatial analysis of the image of tourist destinations-A case study on ancient water towns in southern Yangtze River. Tourism Tribune, 19 (2): 32-36 (in Chinese).
Lynch, K., 1960. The Image of the city. MIT Press, Cambridge MA, First Eds.: pp194.
Lew, A. and McKercher, B., 2002. Trip destinations, gateways and itineraries: The example of Hong Kong. Tourism Management, 23 (6): 609-621.
Lew, A. and McKercher, B., 2006. Modeling tourist movements a local destination analysis. Annals of Tourism Research, 33 (2): 403-423.
Li, X.M. and Li, J.H., 2006. Analysis of urban space in Dalian. Acta Geographica Sinica, 61 (8): 809-817 (in Chinese).
Li, H.X. and Sun, H.Q., 2009. Analysis of tourism city markers based on urban tourism image. Social Scientist, 4: 97-99 (in Chinese).
McKercher, B. and Lau, G., 2008. Movement patterns of tourists within a destination. Tourism Geographies, 10 (3): 355-374.
Qian, S.W. and Su, Q., 2010. Analysis of the features of tourists’ spatial perception of classical gardens in Suzhou. Tourism Science, 24 (5): 56-63 (in Chinese).
Shoval, N. and Michal, I., 2009. Tourism mobility and advanced tracking technologies. Routlege, New York and London, First Eds.: pp 228.
Shummadtayar, U., Hokao, K., Iamtrakul, P., 2013. Investigating the low-income settlement in an urbanization and urban form a consequences of Bangkok Growing City, Thailand. Lowland Technology International, 15 (1): 45-54.
Tolman, E. C., 1948. Cognitive Map in Rats Andmen. Psychological Review, 55 (4): 189-201.
Walmsley, D. J., 1988. The Introduction of behavioral geography. Wang, X.Z. (translated by), Shanxi People's Publishing House, Xi'an, China, First Eds.: pp11 (in Chinese).

38 X.M. Zhao et al. / Lowland Technology International 2015; 17 (1): 27-38
Wu, B.H., 1994. Research on urban recreationist’s traveling behaviour in Shanghai. Acta Geographica Sinica, 49 (2): 117-127 (in Chinese).
Yang, X.J. and Ma, X.L., 2004. A spatial analysis and construction of domestic tourism of big Xi An Tourism Circle. Geographical Research, 23 (5): 695-704 (in Chinese).
Yang, X.Z. and Gu, C.L., 2011. Spatial system of urban tourist flows: A Case study of Nanjing. Economic Geography, 31 (5): 868-873 (in Chinese).