Embed Size (px)
Citation preview

THE FACTOR INFLUENCE OF TOURIST’S LOYALTY ON THEIR REVISIT
INTENTION: IN CASE OF TRAVEL IN PATTAYA CITY
MUTITA TANSIRI
AN INDEPENDENT STUDY SUBMITTED IN PARTIAL FULFFILLMENT OF
THE REQUIREMENTS FOR THE MASTER DEGREE OF
BUSINESS ADMINISTERATION (INTERNATIONAL PROGRAM)
GRADUATE SCHOOL OF COMMERCE
BURAPA UNIVERSITY
JULY 2016
COPYRIGHT OF BURAPHA UNIVERSITY

An independent study of Mutita Tansiri has been approved by examining
committee to be partial fulfillment of the requirements for the Master Degree in
Business Administration (International Program) of Burapha University
Research Advisor
............................................................................................Principal advisor
(Dr. Nont Sahaya)
Examining Committee
............................................................................................Principal examiner
(Dr. Supasit Lertbuasin)
......................................................................Member
(Dr. Savitree Bintasan)
An independent study has been approved by the Graduate School of
Commerce to be partial fulfillment of the requirements for the Master Degree in
Business Administration (International Program) of Burapha University
................................................................Dean of Graduate School of Commerce
(Asst. Professor. Dr. Banphot Wilunrach)
July ......., 2016


ACKNOWLEDGEMENT
I would like to thank the many people who helped me accomplish this
research.Without any the encouragement and support from many people, this research
could not be completed. So, I would like to take this chance to express my gratitude to
all who contributed to this research.
I would like to give sincere thanks to Dr. Nont Sahaya who was my advisor
for his kindness, Invaluable guidance and time devoted throughout the period of
study. I could not have finished my research without his guidance and assistance.
I would like to give sincere thanks to Dr. Supasit Lertbuasin and
Dr. Savitree Bintasan who recommended the right direction and gave me very useful
information and helped me throughout the process of this research.
During the two years study programmed at Burapha University, I am
grateful to be a student MBA program here so I would like to say thank for Burapha
University staff who support my education for their kindness and helpfulness.
In additionally, I would also like to thank my classmate who has assisted and
encouraged me during the research writing period and A very special appreciation to
my parents, my sister who were always there to offer endless love, support, and
understanding.
Finally, I will take full responsibility and apologize for all mistakes and
some ambiguities which might remain in this research.
Mutita Tansiri

iv
57740002: MAJOR: BUSINESS ADMINISTRATION; M.B.A.
(INTERNATIONAL PROGRAM)
KEYWORDS: TOURIST LOYALTY/ REVISIT INTENTION
MUTITA TANSIRI: THE FACTOR INFLUENCE OF TOURIST’S
LOYALTY ON THEIR REVISIT INTENTION: IN CASE OF TRAVEL IN
PATTAYA CITY. ADVISOR: NONT SAHAYA, D.B.A 92 P. 2015.
Tourism has been becoming the major driving force for tourism industries
and brings a lot of income to the country. However, given the challenges of any
tourist destination to remain attractive to loyal tourist overtime and revisiting of
Tourists is measure as the key factors to the successful in Tourism Industry. Thus the
purpose of this study is to investigate the significant factor that influence tourist’s
loyalty on their revisit intention; in case of travel in Pattaya city. The main part is
focused on an analysis factors in term of Tourist loyalty which consist of destinations
image, service quality and perceive value that affect on tourist revisit intention in
cognitive (past experience ), tourist satisfaction, attitude and trust . The study selected
the simple random sampling method with 400 foreign tourists by questionnaires in 16
landmarks of Pattaya City which consist of Pattaya Hill, Mimosa Pattaya, Teddy Bear
Museum, Pattaya Dolphin World, Crocodile Farm, Tiffany Show, Ripley’s believe it
or not museum, Mini Siam, Elephant Village, Nongnooch tropical Garden, Art in
Paradise, Pattaya Water Park ,Under Water world Pattaya , WatYannasangwararam,
KhaoChiChan and Pattaya Floating Market to collect data . For data analysis process
was used statistical instrument for analyze the relationship between each factor via
used SPSS program. In term of hypothesis testing by using multiple linear regression
(MLR), found that in term of tourist loyalty (destination image, perceive value and
service quality) which is independent variable has significant influence to tourist
revisit intention in cognitive (Past experience) , tourist’s satisfaction, attitude and
trust. The study indicated that “service Quality” was the strongest factor influencing
on Tourists’ Visit Intention and service quality results were the significant factors
towards the marketing strategic plans for stimulating foreign tourists to revisit Pattaya
City and expand the numbers of tourist in the future.

CONTENTS
Page
ABSTRACT .......................................................................................................... iv
CONTENTS .......................................................................................................... v
LIST OF TABLES ................................................................................................ vii
LIST OF FIGURES ............................................................................................... ix
CHAPTER
1 INTRODUCTION ...................................................................................... 1
Background and significant of the study ................................................ 1
Research objectives ............................................................................... 5
Research hypotheses ............................................................................. 6
Scope of research .................................................................................. 6
Conceptual framework .......................................................................... 7
Excepted benefit.................................................................................... 7
Definition of terms ................................................................................ 8
2 LITERATURE REVIEWS........................................................................... 10
Determinants of tourist loyalty .............................................................. 10
Destination image ................................................................................. 11
Perceived values.................................................................................... 13
Service quality ...................................................................................... 14
Tourist's revisit intention ....................................................................... 16
Cognitive (Past experience) ................................................................... 16
Attitude ................................................................................................. 17
Tourist’s satisfaction ............................................................................. 17
Trust ..................................................................................................... 19
Related studies ...................................................................................... 19
3 RESEARCH METHODOLOGY ................................................................. 22
Research design .................................................................................... 22
Population and sampling ....................................................................... 22
Research instrument .............................................................................. 24

vi
CONTENTS (CONTINUED)
Chapter Page
Data gathering ....................................................................................... 27
Data analysis ......................................................................................... 27
4 DATA ANALYSIS AND RESULTS .......................................................... 29
Restatement of the purpose .................................................................... 29
Part 1: Statistical analysis of demographic of sample group ................... 30
Part 2: Statistical analysis of travel characteristic ................................... 31
Part 3: Statistical analysis of tourist loyalty toward Pattaya City ............ 34
Part 4: Statistical analysis of tourist revisits intention toward
Pattaya City ........................................................................................... 37
Hypothesis test ...................................................................................... 42
Data gathering and procedures .............................................................. 45
Data processing and analysis ................................................................. 45
Limitations of methodology .................................................................. 46
5 CONCLUSION, DISSCUSSION AND RECOMMENDATION.................. 54
Conclusion ............................................................................................ 54
Discussion in this study ......................................................................... 55
Recommendations in implication for business ....................................... 59
Recommendation for further research .................................................... 61
Limitations of the study ......................................................................... 62
BIBLIOGRAPHY ................................................................................................. 63
APPENDICES ....................................................................................................... 72
APPENDIX 1 ................................................................................................... 73
APPENDIX 2 ................................................................................................... 80
APPENDIX 3 ................................................................................................... 89
BIOGRAPHY ....................................................................................................... 92

LIST OF TABLES
Table Page
1-1 Number of foreign tourist in Pattaya City in year 2010-2015 ....................... 1
1-2 The best of Thailand Awards voted by Chinese Tourists .............................. 3
3-1 The landmarks of Pattaya City ranked ........................................................... 24
4-1 Respondents’ demographic characteristics .................................................... 30
4-2 Respondents’ of travel characteristic ............................................................. 32
4-3 Show number and percentage of 16 landmarks of Pattaya City where
foreign tourist have been visit ........................................................................ 33
4-4 Summary of descriptive statistics of factor influence tourist loyalty
(Destination image) ........................................................................................ 34
4-5 Summary of descriptive statistics of factor influence tourist loyalty
(Perceive value) ............................................................................................. 35
4-6 Summary of descriptive Statistics of factor influence tourist loyalty
(Service quality) ............................................................................................. 36
4-7 Mean ( ), Standard deviation (SD), and level of affecting of factor
influence tourist loyalty ................................................................................. 36
4-8 Summary of descriptive statistics of factor influence tourist revisit
intention (Cognitive (Past experience)) ......................................................... 38
4-9 Summary of descriptive statistics of factor influence tourist revisit
intention (Tourist’s satisfaction) .................................................................. 39
4-10 Summary of descriptive statistics of factor influence tourist revisit
intention (Attitude)......................................................................................... 39
4-11 Summary of descriptive statistics of factor influence tourist revisit
intention (Trust) ............................................................................................. 40
4-12 Mean ( ), Standard deviation (SD), and level of affecting toward
tourist revisit intention ................................................................................... 41
4-13 Model summaries, ANOVA and Coefficients of Multiple regression
analysis (MRA) (Hypothesis 1) ..................................................................... 44
4-14 Model summaries, ANOVA and Coefficients of Multiple regression
analysis (MRA) (Hypothesis 2) ..................................................................... 46

viii
LIST OF TABLES (CONTINUED)
Table Page
4-15 Model summary, ANOVA and Coefficients of Multiple regression
analysis (MRA) (Hypothesis 3) ..................................................................... 47
4-16 Model summary, ANOVA and Coefficients of Multiple regression
analysis (MRA) (Hypothesis 4) .................................................................... 49
4-17 Model summary, ANOVA and Coefficients of Multiple regression
analysis (MRA) (Hypothesis 5) ..................................................................... 51
4-18 Hypothesis testing by using Multiple regression analysis (MRA) ................. 53

LIST OF FIGURES
Figure Page
1-1 Conceptual framework ..................................................................................... 7
4-1 Hypothesis test diagram ................................................................................... 42

CHAPTER 1
INTRODUCTION
Background and significant of the study
According to fierce competition market, we know that the tourism industry
is one of the largest industries in the world which has taken the majority of GDP in
many countries. It can create the growing opportunities for domestic work, increase
revenues, and more importantly increase the number of tourists in the country.
This study will be conducted in Pattaya city, Thailand. It is because Pattaya
is the world famous destination, and has ranked as the top 3th most visit place in
Thailand in 2011-2015 (see Table 1-1). Pattaya has been generating large income to
Thailand since 2004, which is approximately 9-10% of the GDP in Thailand.
However, the tourism industry is more changeling to Thailand than ever
before due to advanced technology, cost competition, and other government
incentives that encourage the tourists to go to travel in other countries. It is very
significant to us to learn and develop our tourism strategy to maintain the quality and
to increase the quantity of tourists at the same time.
Therefore, the purpose of this research is to study what are the factors that
impact to tourist's loyalty. It will be focused on Destination image, perceive value,
and Service quality that can influence foreign tourist's revisit intention.
Table 1-1 Number of foreign tourist in Pattaya City in year 2010-2015
(TAT Intelligence Center, 2015)
Internal tourism in Chon Buri Pattaya
Year 2010-2015
Type of data 2010 2011 2012 2013 2014 2015
Visitor 8,313,528 8,993,572 9,409,497 10,020,628 9,896,011 9,849.940
Thai 2,953,859 2,817,952 2,726,368 2,904,280 2,884,528 2,998,479
Foreigners 5,359,669 6,175,620 6,683,129 7,116,348 7,011,483 6,851,461

2
Table 1-1 (continued)
Internal tourism in Chon Buri Pattaya
Year 2010-2015
Type of data 2010 2011 2012 2013 2014 2015
Tourist 7,377,162 8,135,924 8,876,924 9,440,676 9,281,860 9,223,060
Thai 2,143,566 2,083,113 2,312,666 2,454,439 2,407,025 2,506,545
Foreigners 5,233,596 6,052,811 6,564,258 6,986,237 6,874,835 6,716,515
Excursionist 936,366 857,648 532,573 579,952 614,151 626,880
Thai 810,293 734,839 413,702 449,841 477,503 491,934
Foreigners 126,073 122,809 118,871 130,111 136,648 134,946
Average length of
stay (Day) 3.17 3.29 3.19 3.23 3.24 3.28
Foreigners 3.50 3.37 3.35 3.40 3.42 3.67
From the above graph, it revealed that over the years number of foreign
tourists visiting Pattaya City have steadily increased between 2010-2013, which
implied that these tourists found that the province have become popular as foreign
tourist attraction and they have continued loyal toward Pattaya City as tourist
destination. But during year 2013 the number of tourist has declined with political
problems faced in Thailand. The number of visitors fell nearly 5% on-year between
January-April, according to data from Thailand’s Department of Tourism. But
however a few months after the military Coup, during the final quarter of the year,
tourism recovered, the number of tourist increase in year 2013 Revealing Pattaya City
still popular for most travelers and the increase showed the customer loyal to Pattaya
City even in unconventional situation.

3
Table 1-2 The best of Thailand Awards voted by Chinese Tourists (Tourism
Authority of Thailand, 2015)
Top 10 best destination
Project: The best of Thailand awards voted by Chinese Tourists
Number Topic Name of the place
1 Best Luxury Hotel W Bangkok
2 Best Boutique Hotel Koh Chang Kacha Resort and Spa
3 Best Resort Hotel Patong Resort Hotel Phuket
4 Best Value Hotel De Lanna Hotel Chiang Mai
5 Best Destination Chiang Mai
6 Best Attraction Floating Market in Pattaya
7 Best Restaurant Sirocco
8 Best Thai Dish Tom Yam Kung (spicy shrimp soup)
9 Best Thai Fruit Durian
10 Best Thai Spa Let’s Relax (Phuket)
11 Best Golf Course Gassan Khuntan Golf and Resort (Lamphun)
12 Best Shopping Mall Siam Centre
13 Best Shopping Area Siam Square
14 Best Airline Thai AirAsia
15 Best Thai Show Muay Thai Live: The Legend Lives
and four attraction place in Pattaya City consist of:
Alcazar Show, Tiffany Show, Nongnooch tropical
Garden and Tiger Zoo
16 Best Festival Songkran Festival
17 Best Medical Service Bangkok Hospital Phuket
Pattaya is ranked as the top ten for most searched city for holiday
destination, accommodation and popular restaurant from Chinese voters in program
“The best of Thailand Awards voted by Chinese tourist” by Thailand tourism
authority in hand with King Power International , private company SINA Corporation
one of the biggest online Chinese service provider with over 600 million peoples
around the world and Jiaranai Entertainment Company set up this program aiming for
service and product competition “The best of Thailand Awards “ they set up this

4
program for product and service provider of Chinese customer to complete among
themselves totaling of 17 categories by considering various tourist destination and
service provider such as accommodation shopping center and the top rating show , by
Chinese tourist putting in one vote per day for their top tourist attraction . After the
vote close it has been seen that there are 5.56 via www.weibo.com and other channel
100 millions times since 8-29 May 2015 which reveal that tourist attraction in Pattaya
City is popular destination for most Chinese traveler.
Thus, this study of tourist’s loyalty has been pointed out in tourism in
Pattaya City as one of the major driving forces to increase tourist’s loyalty to maintain
the number of tourist who come to visit Pattaya city and for increase the number of
tourist in the future.
A successful marketing strategy must be focused on winning new customers,
along with maintaining the existing customers is also important. Nowadays, many
firms has realized that a customer relationship is now significant as a marketing
strategic objective (Oliver, 1999). As a result, to have a strong relationship with
customers can create a competitive advantage to the company (Ganesan, 1994).
In the tourism industry, the destinations can be one of the main factors for
tourists to make a decision. Depend on tourists' experience, they can recommend
family and friends which will potentially increase the number of tourists in the future
(Yoon & Uysal, 2005). However, Chen, and Gursoy (2011) disagreed that the
destination loyalty is not related to the loyalty of tourist due to deficient study.
In marketing literature, one of the most important indicators of company
success is the concept of loyalty (La Barbara & Mazursky, 1983), which can be
deliberated by repeated sales or by recommendation to other consumers (Pine,
Peppers, & Rogers, 1995). A tourist loyal is the significant goal of every tourist
destination. This can be characterized by the amount of time that person revisits the
particular destination, it’s called “tourist loyalty” (Yoon & Uysal, 2005). To be
successful in the tourism industry, it is essential that the destination is fascinated by
tourists. As a result, tourist will recommend the destination to others to make a visit.
Recently, marketing research in the tourism industry is mainly focused on
attractiveness, competiveness of destination in order to meet the satisfaction of
5
customers that will increase the level of tourist loyalty and the perception towards the
Service quality and Destination image.
However, in order to focus on the tourist loyalty, the number of studies has
shown that to create dynamics tourism sector and to distinguish tourist experience is
al so important. In theory of contemporary marketing stated that repeat purchase is
one of the most significant strategies by its beneficial rewards such as creating
positive word-of-mouth, achieving better cost-effective by repeat visitors, and
increasing economic profits. In turn, repeat visitation in tourism is an important fact in
the economy as well as in the individual attraction.
Furthermore, important role of repeat visitation would be in international
tourism flows. There is a high correlation between the current visit towards an
individual and the future visit based on the previous experience. In addition, the
current visitors can give a great influence to other people when they expressed their
perception of the place and a possibility of making a second visit in the near future.
The number of researches has proved that the repeat visitors had a better experience
and higher level of satisfaction than the first time visitor. It can be explained that the
service providers such as restaurant and hotel is given more awareness and priority to
the repeat visitor more than the first time visitor (Gitelson & Crompton (1984).
As a result, this study will be examined the factors of tourist loyalty in terms
of revisit intention in Pattaya City with the main purpose of making the effective
strategic marketing planning to stabilize the number of tourists, and also to persuade
the tourist revisiting to Pattaya city. As a result, this research will be useful source of
information for marketers who want to have a successful business in Pattaya. Most
importantly, it will be valuable to the tourism industry in Pattaya City.
Research objectives
1. To study characteristic of foreign tourist who come to visit Pattaya City.
2. To study the situation of tourist’s loyalty that influences their revisit
intention toward Pattaya City

6
Research hypotheses
The tourist’s loyalty has influence on their tourist revisit intention.
Hypothesis 1: The tourist’s loyalty (Destination image, Perceived value,
Service quality) has influence on their revisit intention in Cognitive (Past experience).
Hypothesis 2: The tourist’s loyalty (Destination image, Perceived value,
Service quality) has influence on their revisit intention in Tourist satisfaction.
Hypothesis 3: The tourist’s loyalty (Destination image, Perceived value,
Service quality) has influence on their revisit intention in Attitude.
Hypothesis 4: The tourist’s loyalty (Destination image, Perceived value,
Service quality) has influence on their revisit intention in Trust.
Hypothesis 5: The tourist’s loyalty (Destination image, Perceived value,
Service quality) has influence on their revisit intention in Cognitive (Past
experience), Tourist satisfaction, Attitude and Trust.
Scope of research
Scope of content
Study in term of factor which is Destination image, Perceived value and
Service quality of tourist’s loyalty that influence to tourist revisit intention toward
Pattaya City.
Scope of population
The In term of population in this research are foreign tourists in Pattaya City
who visit 16 landmarks in Pattaya City.
Scope of area
The location to survey Pattaya City by collect data from Foreign tourist who
visit Pattaya City. Since Pattaya has various tourist attractions, the researcher has
chosen top 16 spots recommended by the Thaiway Magazine for their significance
and popularity. Thus I, as the researcher will choose these 16 top destinations of
Pattaya City as landmarks to collect data.
Scope of research period
Timeline for collect data is 1 April-May 2016.

7
Conceptual framework
Figure 1-1 Conceptual framework
For the conceptual framework of this study, The dependent Variables
(Tourist revisit intention) was developed through the integration and adaptation of
numerous analysis models which were implemented in the previous relevant studies
and literature reviews by many researchers in the past. Hence, the attributes and
factors in the Tourist revisit intention framework of this study were selected and
adapted from the previous studies to best suit with the environment in Pattaya City.
Simply, the model consists of dependent variable and independent variables. To meet
the objective of this study, the independent variable is denoted as the likelihood of
tourist to revisit Pattaya City in the future or destination loyalty. The independent
variables which determine the revisit intention comprise of (Cognitive (Past
experience), Attitude, Tourist’s satisfaction and trust) the conceptual model is
illustrated in Figure 3.

8
Expected benefit
1. The result from this study will be useful for policy makers to devise plans
to increase tourists' loyalty toward Pattaya City.
2. The result from this study can be adopted by private tourism business
operators to retain more number of loyal tourists, which is the most cost-effective
ways to promote destination tourism.
3. This study will be useful as research evidences for further study
concerning tourists' loyalty.
Definition of terms
Tourist loyalty means the tourist's loyalty can be describe as tourist's attitude
and beliefs regarding the value of perceived destination, which leads to repurchase or
revisit intention.
Destination image means the Destination image is an essential factor for
tourist places and better image of the destination bring more tourists towards
destination .If any tourism authority can create positive image of the destination on
tourist mind then it is easy to be successful in tourism business. Destination image or
image of the country has great influence on the decision making process of the tourist.
If the tourist perceive positive and favorable Destination image on their mind then
they like to often visit their desired tourist place.
Perceived value means the Perceived value is defines the comparison of the
benefits or output with the price of product or service. Perceived value is related with
customer satisfaction. If customers get positive value then they are satisfied and if
they do not get negative value then they are dissatisfied with product or service.
Service quality means the Service quality is customer’s judgment of
standard or quality of the service. Service quality is the core of business prosperity of
service industry. Better Service quality brings more customers and generates more
revenue. It is common psychology of tourist that if they are happy of Service quality
then they are going to be loyal
Revisit intention means the revisit intention means the individual’s
subjective probability that he or she will perform a specific behavior after he or she

9
did it. In this study, revisit intention is tourists’ willingness to visit creative tourism
destination again in the next 12 months. Revisit Intention Revisit intention from
repurchase intentions, a term usually used when discussing buying something.
Repurchase intentions are the customers’ intentions to purchase some goods or
services from the same organization again.
Cognitive (Past experience) means the past experience refers to mainland
traveler’s previous travel experience. While travel experience may include aspects
such as number of past visits, travel mode, transportation, length of stay, and overall
satisfaction.
Attitude means the attitude is an individual’s predisposition to evaluate some
symbol, object, or aspect of the world in a favorable or unfavorable manner. Attitude
serves as a reliable indicator of how people act under given set of circumstances in
many different walks of life. Tourist attitudes comprise cognitive, affective and
behavioral components. Tourist attitude describes the psychological tendencies
expressed by the positive or negative evaluations of tourists when engaged in certain
behaviors.
Tourist’s satisfaction means the tourists’ satisfaction with a trip or a
destination is a result of many aspects, such as their perception of product elements
experienced as well as their expectations before- and during the trip. People go on
holiday to satisfy one or several of their needs, whatever these needs are. To achieve
satisfaction people try to behave in a rational way. They choose, for instance,
activities that they expect will fulfill their needs satisfactorily.
Trust means the trust is regarded as an essential key to maintaining
continuity in the customer provider relationship. Trust is “expectations held by the
consumer that the service provider is dependable and can be relied on to deliver on its
promises”
Foreign tourist means the foreign tourists are foreign persons admitted under
tourist visas (if required) for purposes of leisure, recreation, holiday, visits to friends
or relatives, health or medical treatment, or religious pilgrimage. They must spend at
least a night in a collective or private accommodation in the receiving country and
their duration of stay must not surpass 12 months.

CHAPTER 2
LITERATURE REVIEWS
This chapter will explore various definitions of variables used in this study.
The main parts consisted of the following;
1. Concept and theory of tourist's loyalty
2. Concept and theory of destination image
3. Concept and theory of perceive value
4. Concept and theory of service quality
5. Concept and theory of revisit intention
6. Concept and theory of cognitive (past experience)
7. Concept and theory of tourist satisfaction
8. Concept and theory of attitude
9. Concept and theory of trust
Determinants of tourist loyalty
For tourist’s loyalty can be explained as cognitive and behavioral, or as a
compound between them (Pritchard & Howard, 1997; Bowen & Chen, 2001; Zins,
2001; Dimitriades, 2006), in one approach, tourist loyalty could be described as
tourist's attitude and beliefs regarding the value of perceived destination, which leads
to repurchase or revisit intention (Fournier, 1994; Hawkins, Best, & Coney, 1989);
while another approach states that loyalty is a construct that can be conceptualized by
several perspectives. Cronin and Tayler (1992), Homburg and Giering (2001) measure
loyalty as “future behavioral intention” when another research conceptualized tourist
loyalty as behaviors consisted of continued repurchase and act of recommendation to
friends or relatives (Oppermann, 2000; Chen & Gursoy, 2001; Petrick & Backman,
2002; Yoon & Uysal, 2005). Tourist loyalty is an important goal for every tourist
destination is to make tourist loyal. According to (Oppermann 2000, Yoon & Uysal,
2005), when tourists visit any particular tourist destination multiple times then it is
called tourist loyalty. According to Chen and Gursoy (2001), tourists revisit
perception of any particular tourist destination refers tourist loyalty. When any tourist

11
perceives positive experience about any destination then he or she thinks to revisit the
destination. When tourist is loyal towards any destination then he or she recommends
others to visit that destination (Oppermann, 2000, Chen & Gursoy, 2001). According
to Yoon and Uysal (2005), if tourist gets better service from any tourist destination
then tourist will be loyal towards the destinations. Besides that positive word of
mouth also influence tourist to visit any particular destination.
Factors that influence tourist loyalty
There are many factors leading to tourist loyalty, generally the commonly
agree factor leading to tourist loyalty must consist of satisfaction (Dick & Basu, 1994;
Oliver, 1999). However, literatures diverted when considering factors that lead to
satisfaction, hence tourist loyalty. For Dick and Basu (1994) and Oliver (1999), these
factors included demonstrated service quality, perceived price, customer value, and
perceptions of company performance as determinants of customer satisfaction.
Stepchenkova and Mills (2010) proposed that destination image had influence on
customer satisfaction and loyalty. The following part will explore various definitions
and concepts;
Destination image
According to the theoretical and research tradition in tourism literature,
destination image has been one of the key areas of tourism research for more than
four decades (Stepchenkova & Mills, 2010). The study about effect of destination
image and satisfaction on loyalty has been key research topics in tourism research for
quite some time. Since 1970’s destination image research was first proposed by
Edward Mayo, John Hunt, and Clare Gunn. Later in 1990s, Chon identified the
influence of destination image on traveller's behaviours and satisfaction. Similar study
be Baloglu and McCleary (1999) confirmed that destination image had influence in
tourist’s decision making and travel behavior, while Lee, Lee, and Lee (2005)
emphasized that destination image had a big influence in tourist behaviors and led to
tourist satisfaction, which were divided into two significant factors; first was the
influences of destination choices, and second, post-purchase influences. Lee et al.
(2005) concluded that a person with a more pleasurable destination image identified
more on site experiences led to increased satisfaction and resulted in positive

12
behavioral intentions. However, there were many studied that argued and pointed out
that there were a significant relationship between destination loyalty and destination
image (Rittchainuwat et al., 2001; Ross 1993; Tasci & Gartner, 2007; Wang, Lin,
Yeh, & Lui, 2011). Chen and Tsai (2007) had determined the relations between
destination image which consist of 4 factors, namely trip quality, perceived value,
satisfaction, and inclined behavior. They found that destination image and satisfied
individuals were two very significant variables that influenced tourist behavioral
willingness. These cases revealed that destination image had influences, both directly
and indirectly, on behavioral intentions/ willingness. Tasci, Gartner, and Cavusgil
(2007) determined destination image as “A dreaming and feelings are interactive way
of imaging a destination”. Destination image in the mind of the visitors plays an
important role in their travel purchase decisions and their visiting intentions
(Oppermann, 2000; Pike, 2004). Mostafavi Shirazi and Mat Som (2010) considered
that there was a significant effect of destination attributes on revisit intention in
Penang. They found out that repeated visit was an indicator of loyalty in tourist
destination that is strongly affected by destination attributes. In their study, the most
successful conditions for repeated visitor was diversity of attractions. Hwang, Lee,
and Chen (2006) later emphasized that there were a significant relationship between
tourist involvements, place attachment and satisfaction. The relationship among
destination image, service quality and perceived value impact on tourist satisfaction
and future behavioral intentions (Kim, Holland, & Han, 2012). Hence we can
conclude that Destination image has powerful affect to tourist’s loyalty because the
perception of foreign tourists has effect on tourists’ future behavioral intentions. This
result was further confirmed by Mohamad, Abdullah, and Mokhlis (2012), if tourists
were satisfied with any particular tourist destinations, then they would be interested to
visit that destination many times over and resulted in loyalty to the destinations.
Furthermore they would spread positive word of mouth to their family members,
relatives and friends. Thus, it was important for any tourism destinations to create
tourist loyalty, because once tourists became loyal to the destination, they would
generate continued revenues and recommended to others.

13
Perceived values
Perceived value refers to the value that customers receive or experience by
using a service (Bettman, Luce, John, & Payne, 1998). Perceived value is the best
predictor of behavioral intentions and perceive value is one of the most important
elements for gaining competitive and it is considered to be an important key predictor
for customer satisfaction and loyalty (McDougall & Levesque, 2000; Cronin et al.,
2000). Patterson and Spreng (1997) Cronin et al. ( 2000) conceptualize a model of
perceived value as the link among quality, satisfaction and sacrifices. Woodruff
(1997) indicated that the important mission for tourism managers is to understand
what do customers value and how their needs can be met. and there are several
researchers describe about perceive value in term of tourism (Schechter, 1984; Bolton
& Drew, 1991). Perceived value is defines the comparison of the benefits with the
price of product or service (Zeithaml, 1988; Bigne´ et al., 2000; Teas & Agarwal,
2000). Perceived value is an evaluation of consumers’ feeling (Zeithaml, 1988;
Monroe, 1990). As well as customer’s overall assessment of the utility of a product
based on perceptions of what is received and what is given” (Zeithaml, 1988, p. 14).
And according to utilitarian perspective perceive value is the function of acquisition
and transaction utility (Petrick & Backman, 2002). The perceived value is relationship
between perceived benefits on the one hand and monetary and non-monetary with
highly personalized involvement and abstract level activities. Perceived value is
important in marketing area and is an key element in relationship marketing
(Dumond, 2000; MSI, 2001; Oh, 2003). Because perceived value can relate with
customer satisfaction it can affects how much the customer willing to pay for product
or service. Lovelock (2000) defined perceived value as the compromise between
perceived benefits and perceived costs (Grewal et al., 1998; Bigne´ et al., 2000;
Cronin et al., 2000), there are two factors in perceived value; (1) benefits of the
customers, such as social benefit, economic benefit, relational benefit and (2)
expenses of the customers such as time spend perceived risk. ,price of product or
service. By Zeithaml (1998) give more information about Perceive value that different
customers perceive value in different ways and that the components of perceived
value might be weighted in differently. Thus although there are many studies have
been describe about measurement of perceived value in the tourism field and the

14
structure of perceived value was varies in the existing literature .by all of the studies
conducted in the hospitality and tourism industry the researchers have adopted a
multidimensional approach. Two underlying dimensions of perceived value, cognitive
(functional) and affective (emotional), have been identified (Eid & El-Gohary, 2014).
The cognitive dimension refers to the economic assessment of value made by tourists,
such as price value and quality value (Sweeney & Soutar, 2001). The affective
emotional dimension captures the emotions or feelings generated in travelers by
tourism, such as experiential value. Quality value, emotional value functional value,
price value, and emotional value have been incorporate as a dimensions of perceived
value for tourist in several studies (Lee, Yoon, & Lee, 2007; Yoon & Kim, 2012; Eid
& El-Gohary, 2014).
Service quality
Customer form service expectations from past experiences. The expected
service and the perceive service sometimes may not be equal, thus leading a service
quality gap. The service quality model or the “Gap model ” (Parasuraman et al.,
1985). Hilight the main requirement for delivering high service quality they are
reliability, reponsiveness,competence, access, courtesy, communication, credibility,
security, understanding the customer and tangible. Customers compare perceived
service with expected service. These are three basic outcomes may occur from
disparities in the perceived and expected service:
1. Perceived service exceeds expected service: Maximum positive effect
occurs: significantly affects customer loyalty, resulting in repeat and word of mouth
referral business. Maximum customer satisfaction occurs with a high assurance or
customer loyalty. Ideal scenario bringing in the most customers and customer loyalty.
Successful companies add benefits to their offering that not only satisfy the
customers, but also surprise and delight them. Delighting customers is a manner of
exceeding their expectations.
2. Perceived service equaling expected service: Pained service quality
achieved. This will positively affect customer loyalty, repeat business, and word of
mouth referrals, positive customer satisfaction and customer loyalty.

15
3. Perceived service is below expected service: This would be the worst
scenario. Once customer loyalty is lost, it is difficult, if not impossible to regain back
again. Repeat business is lost. And negative word of mouth comments/reviews may
well result in a loss of potential future customers. This would certainly be a failure
service quality scenario affecting a loss of customer satisfaction and thus, any
possibility of customer loyalty.
While Zeithaml and Bitner (2003), said that service quality is customer’s
judgment of standard or quality of the service by (Shahin & Dabestani, 2001) said that
better service quality brings more customers and generates more revenue because
Service quality is the core of business prosperity of service industry. In tourism
industry managers of every tourist destinations are very concern to improve the
quality of the service because improving in service quality or satisfied their tourist it
can make customer loyal towards the destinations (Tian-Cole & Cromption, 2003).
For Bloemer et al. (1998) and Ganesan (2007) he found out how service quality
influence tourist’s loyalty and he found that service quality can influence customer
loyalty positively and significantly (Akbar et al., 2010; Cronin et al., 2000).
According to Sparks and Westgate (2002) said poor service quality of any particular
service industry can influence customers to switch service providers. It is common
psychology of tourist that if they are happy of service quality then they are going to be
return and going to be loyal and it has been found that service quality positively
influences customer satisfaction and ultimately leads to customer loyalty in the
tourism industry (Kuo, Chang, Cheng, & Lai, 2013). In addition, quality value has a
major influence on tourist behavior (Polo Peña et al., 2013). Tourist service is very
sensitive, intangible, and imperishable. Today’s tourists are very conscious about the
service quality of the tourist destination. If the service quality of any tourist
destination meet the expectation of the tourist then it is easy to attract more tourists
towards that destination and moreover If any particular tourist destination fails to
provide better service then customers will switch to another destination but in
opposite side if they are happy of service quality then they are going to be loyal.

16
Tourist's revisit intention
Tourist's revisit intention was a result of tourist's satisfaction (Um, Chon, &
Ro, 2006). Repurchase intention could be defined as customer’s willingness to
purchase some goods or services from the same organization repeatedly (Hwang,
2008). Revisit intention was a powerful factor that could predict future revisit
behavior (Li et al., 2010). The tourist's revisit intention could be traced to theoretical
origin in the theory of planned behavior. This theory was one of the most popular
conceptual frameworks to study people’s intentions to do a specific behavior (Ajzen,
1991). From consumption process’s perspective, tourists’ behavior could be divided
into three stages, including pre-visitation, during visitation, and post visitation
(Rayan, 2002; William & Buswell, 2003). Future behavioral intentions refer to the
visitor’s judgment about the likeliness to revisit the same destination and willingness
to recommend it to others (Chen & Tsai, 2007). But Beigne et al. (2009) argued that
even customer satisfied of the product or service may switch to rivals because of the
opportunities to achieve better product or service. Other study also found out that
creating customer loyalty was a major determinant of tourist revisit intention (Lam &
Hsu, 2006).
Cognitive (Past experience)
A recalls of their past experience can establish a connection between their
sentiment and the target object because a consumer’s cognition lead to behavior
(Lindquist, 1974). The information on the consumer‘s cognition toward a certain
destination is highly valuable to the marketers. Despite the above factors, the survey
intended to measure tourist revisit intention developed by Dodds et al. (1991) and
Bigne et al. (2005) only include four question; (1) You are willing to visit this
destination again; (2) This destination will be your first choice when you plan for
another trip in the future; (3) You will recommend this destination to other and (4)
You will encourage your friend and family to visit this destination.

17
Attitude
Ragheb and Tate (1993) suggested that tourist attitude has a significant on
tourist satisfaction and can affect tourist loyalty. Because attitudes can lead or
predispose a person to perform in a certain manner (De Young, 1986; Vining &
Ebero, 1990), and Ajzen (1991) Eiser and Pligt (1988) Lee (2007) described that the
intention behind an attitude can affect external behaviors. While Unger and
Wandermman (1985) Vincent and Thompson (2002) said that tourist attitudes consist
of cognitive, affective and behavioral components and he describe about tourist's
attitude as psychological expressed by the positive or negative evaluations of tourists
when they engaged in certain behaviors (Ajzen, 1991; Schiffman & Kanuk, 1994).
Thus we can conclude that the cognitive response is the evaluation made in forming
an attitude, the affective response is a psychological response expressing the
preference of a tourist for an entity and the behavioral component is a verbal
indication of the intention of a tourist to visit or use that entity.
Tourist’s satisfaction
There are many studies about tourist’s satisfaction but It is important to
make it clear about the meaning of tourist satisfaction in this study. Weber (1996)
describe about consumer satisfaction as a key influence for repurchase intentions,
recommend to other and also including with market share. By Shoemaker and Lewis
(1999) have explained about satisfaction in the same way satisfied customers are more
likely to recommend friends, relatives or other potential customers to a product/
service by acting as free word of mouth advertising agents. Satisfaction is defined as
customers’ judgments or response of consumer when they expectation is fulfilled
when a features of the products or service give satisfaction to them Oliver (1999)
satisfaction of customer will be occurred when their perception is the same as they
expect or more than expected Kotler and Keller (2009) confirmed, “Satisfaction can
be reflect a person’s a comparative judgments resulting from a product’s perceived
performance in relation of customer expectation". Zeithaml and Berry (1994)
suggested that customer’s overall satisfaction may be related to their evaluation of not
only service quality (e.g. courtesy, responsiveness, etc.) but also product features (e.g.

18
size of hotel room, room decoration etc.) and price. Same as Kozak and Rimmington
(2000) defined that tourist satisfaction had directly influence to the choice of
destination as well as consumption of products and services. Satisfaction with travel
experience as the major antecedent of revisit intention (Oppermann, 2000; Baker &
Crompton, 2000; Petrik & Backman, 2002; Kozak, 2001; Jang & Feng, 2007;
Alexandris et al., 2006; Chi & Qu, 2008), According to Oliver (1999) described that
Tourist’s satisfaction is the customer’s fulfillment about natural, service , landscapes,
and recreational equipments were attribute which affects the tourist satisfaction. By
Prayag et al. (2011) Prayag (2012) emphasized that Destination image, personal
involvement, place attachment and overall satisfaction influence satisfaction of
tourists. Also (Coban, 2012) Tourist attractions, basic facilities, cultural attractions,
touristy substructures and access possibilities, natural environment, variety and
economical were influence tourist satisfaction. But in term of tourism, satisfaction
has been reveal as outcome of the comparison between expectations and experiences
(Truong & Foster, 2006). When experiences compared to expectations result in
feelings of emotional state, the tourist is satisfied (Reisinger & Turner, 2003) and
leave that destination with their good memory. Even, they agree to pay more for this
service. Later Chen and Tsai (2007) tested the relationship between destination image,
evaluative factors (e.g., trip quality, perceived value, satisfaction) and behavioral
intentions. They found that destination image and satisfaction were two important
variables that have powerful influenced on visitors’ behavioral intention. Their study
revealed that satisfaction influenced behavioral intentions directly and indirectly. In
consumer behavior theory, satisfaction was more defined as the aspect of consumers
experience after they use or consume the product or service. The researchers stated
that the attributes which influence the consumers’ satisfaction are suitable with the
products. But for intangible products, consumers used attributes / dimensions
(Parasuraman et.al., n.d. cited in Zeithaml & Bitner, 2008). Besides that, the tourist’s
psychology condition will also influence their satisfaction. The tourists, who are in
anger or have lots of thought, will not enjoy the tourism travelling, although the
tourism place are beautiful or service are very good.

19
Trust
Trust is defined as the willingness of consumers to ignore deep though when
making decision, (Morgan and Hunt, 1994). Ganesan (1994) stated that trust are
forms lessen the risk and the vulnerability felt in the relationship, so it leads to higher
commitment in relationship. According to Hsu and Chai (2009), brand trust is defined
by the willingness of the tourists to depend on the ability to feel the destination brand
to give and fulfill the promises or more that what the tourists hope for which are built
from the knowledge about the brand. This is suitable with Huang and Chiu (2006),
trust is defined as the willingness to depend on the tourism destination where people
have faith or trust that activities on the tourism destination can be relied on. Oh (1999)
argued on the contrary that tourism image and quality of the destination, instead,
influence satisfaction and tourist revisit intentions. Gwinner, Gremler, and Bitner
(1998) argued that trust played an important roles in the relationship between service
firms and customers. According to them, customer’s satisfaction was an end-result of
excellent product performances, which in turn lead to higher level of confidence in the
provider's reliability and integrity. This level of confidence was sometime coined as
"trust". This high-degree of satisfactory experiences acts as a significant determinant
of repeat-purchase intention (Lankton, Wilson, & Mao, 2010). Trust can affect in the
future purchase intentions of an exchange partner Garbarino and Johnson (1999).
Trust has a positive influence on motivation to improve a commonly beneficial buyer
and seller relationship (Selnes, 1998; Chiu et al., 2012). Thus, in this study the tourist'
revisit intention is defined as "positive tourist's attitudes toward a destination, which
was a result of past experience, that led to satisfaction and trust toward a destination
in the long term"
Related studies
1. This Quantitative research has been conducted by questionnaire to
understand key influencing factors for international tourists visiting Bangkok. Couple
of factors which are considered by international tourists while visiting Bangkok are
1.1 Value for money accommodation.
1.2 Shopping places like Weekends markets, street shopping & Malls.

20
1.3 Behavior of Thai people
1.4 Great restaurants & bars followed by Thai Street Food.
1.5 Relaxation and recreations like spa & massages etc.
The above factors are positively related to the loyalty of tourists towards
Bangkok city in terms of re-visiting or recommending to other travelers via social
media channels. The key to gain more tourists is to focus on enhancing the destination
perception considering key attributes shared above. (Thiumsak & Ruangkanjanases,
2016)
2. This study was identify key factors affecting tourists’ satisfaction as well
as their return intention towards Vung Tau tourist destination. In this case, beach city
of Vung Tau is the tourist destination where quantitative method has been applied via
which questionnaires were delivered to 301 leisure tourist. and the researcher found
that the key influencing factors for revisiting destination is destination image and
destination image are like the details below;
2.1 Natural and Cultural environment
2.2 Infrastructure
2.3 Accessibility
2.4 Local famous cuisine
2.5 Leisure entertainment options.
On contrary, safety and security provided significant negative effect on
revisiting of tourists’ intention.(Khuong & Nguyen, 2015)
3. The aim of this study is to identify key factors influencing the revisiting
visitors of Sabah, Malaysia. Destination Image, relaxation & recreating are the most
important factors for the tourist to revisit Sabah. Regarding the loyalty for destination,
the researcher found that respondents were loyal to Sabah, with positive intent to
revisit and recommended Sabah as a holiday destination (Mat Som, Marzuki, Yousef,
& AbuKhalifeh, 2012).
4. The revisiting of tourists is regarded as the key factors to the successful
Tourism Industry. This study was explore about the significant of the tourism research
in relation to marketing field is one of the strategies to enlarge the numbers of tourists
in Hua-Hin, Prachub khirikhan Province in Thailand where the natural tourist
destinations have been well-known for Thai and foreign tourists. The research aims to

21
study factors of the revisiting of Thai Tourists. The study selected the simple random
sampling method with 385 tourists by questionnaires. The analysis of the data used
logistic regression to identify the significant factors of the revisiting. The study
indicated that service quality results were the significant factors to lead their Trust
towards Thai Tourists to revisit Hua-Hin and expand the numbers of visitors.
(Wattanasaruch 2014)
5. The purpose of this study attempted to investigate the relationship
between the five dimensions of service quality on tourist satisfaction. Since, tourist
satisfaction is considered to be a great predictor for future behavioral intentions in
many nature of tourism destinations, the second purpose of this study was to
investigate the relationship between tourist satisfactions on future behavioral
intentions. This study was examined using SERVQUAL model and analyzed with
multiple regression analysis. This field research was conducted on 28–31 May 2012 at
the Borobudur temple, Magelang, Central Java Indonesia. The model was tested using
data collected from 200 domestic local tourists. The findings of this study showed that
service quality had significant positive relationship with tourist satisfaction and their
revisit Borobudur temple, Magelang, Central Java Indonesia in the future (Canny,
2013).

CHAPTER 3
RESEARCH METHODOLOGY
In this chapter, the research methodology of this study was clarified for the
method of data collection and data analysis by 5 stages as follows.
1. Research design
2. Population and samples
3. Research instruments
4. Data gathering
5. Data analysis
Research design
This research will study about factor that influence of tourist’s loyalty on
their revisit intention; in case of travel in Pattaya City. Researcher start the first
process of research which is the topic selection then starts the second step by design
and create hypothesis and objectives of research for focus on study point. Next,
researcher start literature review from various data resource which related to this
topic. Then, researcher designs conceptual framework of the study and methods for
gather data which these data will be used for data analysis. That researcher study
sample by survey and collect questionnaire totally 400 respondents from foreign
tourist who visit landmarks of Pattaya City (Defined from 16 landmarks of Pattaya
City ranked by Thaiway magazine in year 2016. Final processes are cushion and
recommendation in relation of variables factors which were explained by using
statistical analysis.
Population and sampling
Population
In term of population in this research are foreign tourists in Pattaya City.
Which are the large group information. In fact, it’s difficult to access all consumers.
In this research will use sampling method for representative all target groups which
researcher use random sampling for collect data by choose collect data from foreign

23
tourist who comes to visit landmarks of Pattaya City. By these location is the target
area which has the distribution of sample for comprehensive in term of data
collection.
Sample size
The sample size in this research will use sample size which calculate from infinite
population sample size formula.
When
n0 is the sample size without considering the finite population
correction (fpb) factor
N is population proportion
e is error margin or confident interval
When n0 is the member of tourist who visit Pattaya provinces on years 2014.
Then, from infinite population sample size formula;
Therefore, the sample size in this research is 400 samples.
Sampling method
In this study we using Probability Sampling and Quota Method by
researcher will collect data from foreign tourist who visit top rated attraction place in
Pattaya city ranked by Thaiways magazine by Proportionate and Systematic
Sampling.
K = (Total employee of each company X sample size)/ Total sampling

24
Table 3-1 The landmarks of Pattaya City ranked
Top rated attraction place in Pattaya City Number of Foreign Tourist/ (Person)
1. Pattaya Hill (Pratamnak Hill) 25
2. Mimosa Pattaya 25
3.Teddy Bear Museum Pattaya 25
4. Pattaya Dolphin World 25
5. Crocodile Farm 25
6. Tiffany Cabarets Show 25
7. Ripley's Believe It or Not! 25
8. Mini Siam 25
9.Pattaya Elephant Village 25
10. NongNooch Tropical Garden 25
11. Art in Paradise 25
12. Pattaya Water Park 25
13.Underwater World Pattaya 25
14. Wat Yannasangwararam 25
15.Khao Chichan 25
16. Pattaya Floating Market 25
Total 400
Research instrument
The research instrument use questionnaire for collect the data on factor
influence tourist loyalty on their revisit intention case study in Pattaya City.
Therefore, the questionnaire which will be distributed to respondents was separated
into 4 parts as follows.
Part 1: Questionnaire about demographic characteristics of foreign tourist
who visit the landmarks in Pattaya City by study gender, age, marital status, monthly
income, education level and Occupation.
Part 2: Questionnaire about travel Characteristic consists of number of visits
to Thailand, Length of stay in each times, Purpose of visit, travel companion , and the

25
attraction place in Pattaya City where the tourist have been visit. (Defined from 16
landmarks of Pattaya City)
Part 3: Questionnaire about factor influence tourist’s loyalty toward Pattaya
City.
Part 4: Questionnaire about tourist’s revisit intention toward Pattaya City.
In the 3rd and 4th parts of questionnaire concentrate to focus on level of
affecting on factor that influence tourist loyalty on their revisit intention toward
Pattaya City which were designed to be the Likert scale by rating scale into 5 levels
for respondents to indicate the level of affecting as follows rating.
The questionnaire has 5 levels:
Level Point
Strongly agree 5
Agree 4
Neutral 3
Disagree 2
Strongly disagree 1
Interpretation method for the results of questionnaire by using mean value
follows this formula,
= The highest point – The lowest point
5
= 5 – 1
5
= 0.8
Thus, meaning of the point for each factors are as follows.
Mean score The level of affecting of each factors
Level 5 Mean 4.21-5.00 Strongly agree
Level 4 Mean 3.41-4.20 Agree
Level 3 Mean 2.61-3.40 Neutral
Level 2 Mean 1.81-2.60 Disagree
Level 1 Mean 1.00-1.80 Strongly disagree

26
In term of methods to test the potential of the research instruments of this
research are Validity and Reliability test as followed methods.
Validity
Validity: researcher submitted the processed questionnaire through the
literature review to 3 experts in order to consider and reviewed the Content Validity
by using Index of Concordance: IOC method. Then, to inspect accuracy wording or
appropriateness of the language used to be amended for improvement before actual
investigate (Rovinelli & Hambleton, 1977).
Researcher will use convenience sampling method to select sample form
population. The descriptive statistics and inferential statistics with t-test significant
difference at 0.05 significant levels were used for this study.
Index of Concordance: IOC is the consistent of the question and objective
which value are between (1) to (-1). If questions were absolute with content, IOC
value would approach to 1.00. In contrast, if IOC value was 0.5, questionnaire should
be revised in accordance with the desired objective measurement which calculated by
the following formula.
IOC = ΣR
N
When
ΣR mean Sum score by all experts
N mean Number of experts
Rating score refers:
1 mean The question is consistent with the objectives.
0 mean The question is uncertain consistent with the objectives.
-1 mean The question is not consistent with the objectives.
Reliability
Reliability: researcher created the questionnaire then improved and tested
the Try-out for 30 sets of questionnaire with the population who approach similar to
the sample by using SPSS (Statistical Package for the Social Sciences) program to
determine confidence. The coefficients (Cronbach’s alpha) with Alpha coefficient
above 0.7 was common used for the internal consistency test (Pallant, 2010). The

27
result that researcher calculated for the Cronbach’s alpha determined a coefficient of
0.937 so the internal consistency of questionnaires was accepted
Table 3-2 Reliability statistics testing
Reliability statistics
Cronbach's alpha Cronbach's alpha based
on standardized items
N of items
.897 .898 30
Data gathering
This research is the quantitative research and concern about the factor that
influence tourist’s loyalty on their revisit intention in Pattaya City. The data collection
of this research came from 2 sources consist of secondary data such as text book,
journal, article, thesis, related studies and information from the internet and primary
data by survey questionnaire which directly distribute to respondents for 400 sets of
questionnaires. The survey was conducted at 16 landmarks of Pattaya City in the
period since May 1-31, 2016 as totally 1 month.
Data analysis
In this research, the researcher gather the data from questionnaire to design
the mean of data analysis and use SPSS program to process the data analysis and get
the result of statistical as follows method.
1. Review data and editing: researcher inspects only complete
questionnaires for evaluate and separate out the incomplete questionnaires.
2. Encode the data: raw data gotten by questionnaires then generate to
evaluate information through the SPSS program (Statistical Package for Social
Sciences). After that coded all questions and answer choices in different letter and
number in order to represent the meaning and coded the unanswered question or
missing data as a zero (0). These codes will be completed into the SPSS program
(Statistical Package for the Social Sciences) to analyze the data statistic.

28
Data analysis
Data analysis of collection information from questionnaires by using SPSS
program (Statistical Package for the Social Sciences) has sequence of analysis as
follows,
Descriptive Statistics consist of Frequency, Percentage, Mean and Standard
Deviation will be used in the 1st and 2nd part of questionnaire to explain about
demographic characteristic and travel characteristic of respondents consist of
frequency and percentage for data analysis and also used in the 3rd and 4th part of
questionnaire as factor that influence tourist loyalty on their revisit intention toward
Pattaya City which were used descriptive statistics consist of mean and standard
deviation for data analysis.
Inferential Statistics was used to exam the hypothesis and analyze the
relationships between factors by using MRA (Multiple Regression Analysis) for study
influence of independent variables on dependent variables.

CHAPTER 4
DATA ANALYSIS AND RESULTS
Restatement of the purpose
The result of this quantitative study will hereby be presented the factor
influence tourist loyalty on their revisit intention toward in Pattaya City. This research
has been divided in 4 parts as follows:
Part 1: Statistical analysis of demographic of sample group
Part 2: Statistical analysis of travel characteristic
Part 3: Statistical analysis of tourist loyalty toward Pattaya City
Part 4: Statistical analysis of tourist revisits intention toward Pattaya City
Regarding to data analysis, the descriptive of symbols were used for this
research are as follows;
mean Mean (Arithmetic average)
SD mean Standard deviation
n mean Sample size
t mean t (t-Distribution)
F mean F (F-distribution)
SE mean Standard error
P mean Probability
df mean Degree of freedom
N mean Population size
Part 1: Statistical analysis of demographic of sample group
This part defines the frequency and percentage of demographic data which
are gender, age, marital status, monthly income, education level and occupation.

30
Table 4-1 Respondents’ demographic characteristics (N = 400)
Personal factor Frequency (n) Percentage (%)
Gender
Male 194 48.5
Female 206 51.5
Total 400 100
Age
Less than 20 years old 75 18.8
20-39 years old 178 44.5
40-59 years old 125 31.3
60 years or more 22 5.5
Total 400 100
Marital status
Single 131 32.8
Married 192 47.8
Divorced 51 12.8
Widowed 26 6.5
Total 400 100
Monthly income
Less than $20,000 67 16.8
$20,001 - $40,000 93 23.3
$40,001 - $60,000 159 39.8
$60,001 - $80,000 69 17.3
More than $80,001 12 3
Total 400 100

31
Table 4-1 (continued)
Personal factor Frequency (n) Percentage (%)
Education level
High school or less 66 16.5
Diploma or Associate degree 97 24.3
Bachelor degree 173 43.3
Master degree or higher 64 16
Total 400 100
Occupations
Company Employee 112 28
Business owner or self
employed
118 29.5
Government officer 98 24.5
Student or other 72 18
Total 400 100
From Table 4-1, the results of travel characteristic revealed that majority of
respondents are female with the contribution of 51.5%. Between the ages of 20-39
years old is the majority which accounts for 44.5% of the total respondents. Most of
them are married 47.8% with average annual income 40,001-60,000 USD. Most
respondents have received good education mainly of their education level were
Bachelor degree 43.3%, followed by diploma or associate degree at 24.3%. Majority
of their occupation were business owner or self-employed 29.5% and followed by
28% were company employee.
Part 2: Statistical analysis of travel characteristic
This part defines the frequency and percentage of travel characteristic
consists of number of visits to Thailand, length of stay in each times, purpose of visit,
travel companion and the attraction place in Pattaya City where you have been visit.

32
(Defined from 16 landmarks of Pattaya City ranked by Thaiway Magazine (Year 2016)
Table 4-2 Respondents’ of travel characteristic (N = 400)
Personal factor Frequency (n) Percentage (%)
Number of visits to Pattaya
One time 68 17.0
Two times 159 39.8
Three times 141 35.3
More than three times 32 8
Total 400 100
Length of stay in each times
One night 20 5
Two nights 104 26
Three nights 166 41.5
More than three nights 110 27.5
Total 400 100
Purpose of visit
Leisure 130 32.5
Business 100 25
Visit friend or relatives 97 24.5
other 73 18
Total 400 100
Travel companion
Family or relative 67 16.8
Spouse 73 18.3
Friends 134 33.5
Colleagues 69 17.3
Classmates or teacher 14 3.5
One self 43 10.8
Total 400 100

33
From Table 4-2, the results of travel characteristic revealed that 39.8%
visited Pattaya City for two times, stayed in Pattaya about three night 41.5%, and the
main purpose of their visit was leisure (32.5%) and 27.5% of them stay more than
three nights in Pattaya. Nearly half of the respondents (33.5%) travel to Pattaya with
their friends while 18.3% travel with spouse.
Table 4-3 Show number and percentage of 16 landmarks of Pattaya City where
foreign tourist have been visit
Landmarks Frequency (n) Percentage (%)
Select Non selected Select Non selected
1. Pattaya Hill 149 251 37.3 62.8
2. Mimosa Pattaya 179 221 44.8 55.3
3. Teddy Bear Museum 164 236 41 59
4. Crocodile Farm 169 231 42.3 57.8
5. Tiffany Show 207 193 51.8 48.3
6. Ripley's Believe It or Not 153 247 38.3 61.8
7. Khao Chichan 152 248 38 62
8. Pattaya Dolphin World 142 258 35.5 64.5
9. Pattaya Elephant Village 204 196 51 49
10. Nongnooch Garden 223 177 55.8 44.3
11. Art in Paradise 185 215 46.3 53.8
12. Pattaya Water Park 155 245 38.8 61.3
13. Underwater World 167 233 41.8 58.3
14. Wat Yannasangwararam 152 248 38 62
15. Pattaya Floating Market 161 293 40.3 59.8
16. Mini Siam 145 255 36.3 63.8
From Table 4-3, the result among 16 landmarks of Pattaya City, majority of
the respondents 55.8% visited Nongnooch Tropical Garden. Second most visited
destination was Tiffany Show with 51.8% Then followed by Pattaya Elephant Village
with 51% respectively.

34
Part 3: Statistical analysis of tourist loyalty toward Pattaya City
This part is a Likert scale as an interval scale ranging from 1-5. It shows
overall component of factor that influence tourist loyalty that consist of destination
image, perceive value and service quality. The statistical analysis in this part was
analyzed and demonstrated by , Standard deviation (SD), and level of affecting in
each component of factor influence tourist loyalty.
Table 4-4 Summary of descriptive statistics of factor influence tourist loyalty
(Destination image) (N = 400)
Factor influence Tourist loyalty SD Level of affecting
1. Destination image
1.1 Abundance of natural attractions and scene
(beaches, sea, garden and etc.)
1.2 Friendly and helpful of local people toward visitors
safe and secure environment
4.04
3.94
2.31
.743
.715
.828
Strongly Agree
Agree
Agree
Total 3.39 .762 Agree
From Table 4-4, shown that in term of descriptive statistics of destination
image (factor influence Tourist loyalty) found that, Abundance of natural attractions
and beautiful scenery which earn the highest average score with = 4.04 and
SD = .743 following by Friendly and helpful of local people toward visitors
= 3.98) and SD = .715, and followed by safe and secure environment = 3.69) and
SD = .828. Therefore, average of overall factors were weighted at = 3.90) and
SD = 0.762.

35
Table 4-5 Summary of descriptive statistics of factor influence tourist loyalty
(Perceive value) (N = 400)
Factor influence Tourist loyalty SD Level of affecting
2. Perceive value
2.1 Travel in Pattaya City can brings me plenty of
pleasure and happiness
2.2 Travel in Pattaya City give me the chance to meet
loads of different interesting people
2.3 “Visiting the destination is valuable and worth it”
3.92
3.94
2.31
.682
.709
.993
Agree
Agree
Disagree
Total 3.39 .945 Agree
From Table 4-5, shown that in term of descriptive statistics of perceive value
(factor influence tourist loyalty) found that, Travel in Pattaya City give me the
chance to meet loads of different interesting people earn the highest average score
with = 3.94 and SD = .709 following by travel in Pattaya City can brings me plenty
of pleasure and happiness with = 3.92 and SD = 6.82 and followed by “Visiting the
destination is valuable and worth it” = 2.31 and SD = .993. Therefore, average of
overall factors were weighted at = 3.39 and SD = 0.945.

36
Table 4-6 Smmary of descriptive Statistics of factor influence tourist loyalty
(Service quality) (N = 400)
Factor influence tourist loyalty SD
Level of
affecting
3.1 General quality of service of this tourist destination
offer is valuable and worth it. The quality of activities/
services available (transport, restaurants, leisure activities,
etc.)
3.42 1.061 Agree
3.2 Service staff can pay active attention to your personal
special requirement
3.89
.747
Agree
3.3 “While visiting the place, I received good service” 3.89 .780 Agree
Total 3.39 .945 Agree
From Table 4-6, shown that in term of descriptive Statistics of service
quality (factor influence tourist loyalty ) found that, “While visiting the place, I
received good service” earn the highest mean = 3.89 and SD = .747 followed by
“While visiting the place, I received good service” = 3.89 and SD = .780 followed
by General quality of service of this tourist destination offer is valuable and worth it.
The quality of activities/ services available (transport, restaurants, leisure activities,
etc.) = 3.42 and SD = 1.061. Therefore, average of overall factors were weighted at
= 3.73 and SD = 0.863.
Table 4-7 Mean (), Standard deviation (SD), and level of affecting of factor
influence tourist loyalty
Tourist loyalty Level of affecting
SD Level Rank
1. Destination image 3.90 0.762 High 1
2. Perceive value 3.39 0.945 Medium 3
3. Service quality 3.73 0.863 Agree 2
Total 3.67 2.57 High

37
From Table 4-7, The statistical analysis of tourist loyalty result can be
demonstrated that the tourist were influenced by destination image is in high level ,
the tourist perceived towards the important of overall of destination image is in high
level = 3.90. For Perceived Value factors, the tourist perceived towards the
important of overall of Perceive value that could be summarized the level of affecting
in medium level = 3.39 and affecting level of Service quality is in high level
=3.73. In contrast, the result from table could be summarized that tourist perceive
towards the important from overall of factor influence tourist loyalty is in high level
= 3.67.
The summarize of factor influence tourist loyalty analysis could be
concluded that among all tourist loyalty factors, the tourist rank the affecting level
from Destination image as the highest degree comparing with others by mean value
= 3.90, the second is Service quality = 3.73 and the lastly Perceive value
= 3.39 which is only factor was weighted in medium level. Therefore, average of
overall factors were weighted at high level with = 3.67.
Part 4: Statistical analysis of tourist revisits intention toward
Pattaya City
This part is a Likert scale as an interval scale ranging from 1-5. It shows
overall component of tourist revisit intention that consist of Cognitive (Past
experience), Tourist’s satisfaction, Attitude and Trust. The statistical analysis in this
part was analyzed and demonstrated by and SD, and level of affecting in each
component of factor that influence tourist loyalty.

38
Table 4-8 Summary of descriptive statistics of factor influence tourist revisit
intention (Cognitive (Past experience)) (N = 400)
Tourist revisits intention SD
Level of
affecting
Cognitive (Past experience)
1.1 If I have a positive experience from a tourism
destination, there is high certainty that I would be
willing to revisit it again.
3.91
.778
Agree
1.2 Positive past experience of a tourism destination
make me want to tell more friends and families about
that destination.
3.81
.809
Agree
1.3 Positive past experience of the destination led to it
being on my top priority for future travel choices.
3.78 .776 Agree
Total 3.83 .788 Agree
From Table 4-8, shown that in term of descriptive statistics of tourist revisit
intention (Cognitive (Past experience)) found that, If I have a positive experience
from a tourism destination, there is high certainty that I would be willing to revisit it
again earn the highest average score with = 3.91 and SD = .778 following by
“Positive past experience of a tourism destination make me want to tell more friends
and families about that destination” with = 3.81 and SD = .809 and followed by
“Positive past experience of the destination led to it being on my top priority for
future travel choices” = 3.78 and SD = .776. Therefore, average of overall factors
were weighted at = 3.83 and SD = 0.788.

39
Table 4-9 Summary of descriptive statistics of factor influence tourist revisit
intention (Tourist’s satisfaction) (N = 400)
Tourist revisits intention SD Level of
affecting
Tourist satisfaction
2.1 I have positive feelings regarding Pattaya City
2.2 The visit to Pattaya City exceeded my expectation.
2.3 I am satisfied with my decision to visit Pattaya City
3.83
3.76
3.82
.823
.797
.810
Agree
Agree
Agree
Total 3.80 0.81 Agree
From Table 4-9, shown that in term of descriptive statistics of tourist revisit
intention (Tourist’s satisfaction) found that, I have positive feelings regarding Pattaya
City earn the highest average score with = 3.83 and SD = .823 following by “I am
satisfied with my decision to visit Pattaya City” with = 3.82 and SD = .810 and
followed by “The visit to Pattaya City exceeded my expectation” = 3.76 and
SD = .797. Therefore, average of overall factors were weighted at = 3.80 and
SD = 0.81.
Table 4-10 Summary of descriptive statistics of factor influence tourist revisit
intention (Attitude) (N = 400)
Tourist revisits intention SD Level of
affecting
Attitude
3.1 I am pleased that I decided to visit this tourist
destination
3.2 I have wonderful image of Pattaya City as a holiday
destination.
3.3 I feel at home in this tourist destination.
3.76
3.80
3.70
.750
.796
.875
Agree
Agree
Agree
Total 3.753 0.807 Agree

40
From Table 4-10, demonstrated that in term of descriptive Statistics of
tourist revisit intention (attitude) found that I have wonderful image of Pattaya City as
a holiday destination earn the highest average score with = 3.80 and SD = .796
following by “I am pleased that I decided to visit this tourist destination” with
= 3.76 and SD = .750 and followed by “I feel at home in this tourist destination”
= 3.70 and SD = .875. Therefore, average of overall factors were weighted at
= 3.753 and SD = 0.807.
Table 4-11 Summary of descriptive statistics of factor influence tourist revisit
intention (Trust) (N = 400)
Tourist revisits intention SD Level of
affecting
Trust
4.1 Pattaya City represents high level of expertise in
tourism services.
4.2 If I had to decide again I would choose this tourist
destination again.
4.3 I feel I am very loyal to Pattaya City as a destination
choice.
3.82
3.70
3.76
.864
.893
.864
Agree
Agree
Agree
Total 3.76 0.874 Agree
From Table 4-11, demonstrated that in term of descriptive Statistics of
tourist revisit intention (trust) found that “Pattaya City represents high level of
expertise in tourism services” earn the highest average score with = 3.82 and
SD = .864 following by “I feel I am very loyal to Pattaya City as a destination
choice.” with = 3.76 and SD = .864 and followed by “If I had to decide again I
would choose this tourist destination again.” = 3.70 and SD = .893). Therefore,
average of overall factors were weighted at = 3.76 and SD = 0.874.

41
Table 4-12 Mean (), Standard deviation (SD), and level of affecting toward tourist
revisit intention
Tourist Revisit Intention
Level of affecting
SD Level Rank
1. Cognitive (Past experience) 3.83 0.788 high 1
2. Tourist satisfaction 3.80 0.81 high 2
3. Attitude 3.753 0.807 high 4
3. Trust 3.76 0.874 high 3
Total 3.79 0.819 high
From Table 4-12, The statistical analysis of tourist loyalty result can be
demonstrated that the tourist were influenced by Cognitive (Past experience) is in
high level , the tourist perceived towards the important of overall of Cognitive (Past
experience) is in high level = 3.80. For Tourist satisfaction factors, the tourist
perceived towards the important of overall of Tourist satisfaction could be
summarized the level of affecting in Medium level = 3.80 and follow by affecting
level of Attitude is in high level = 3.753 and lastly affecting level of Trust is in high
level = 3.76. In contrast, the result from table could be summarized that tourist
perceive towards the important from overall of factor influence tourist loyalty is in
High level = 3.79.
The summarize of factor influence tourist loyalty analysis could be
concluded that among all tourist loyalty factors, the tourist rank the affecting level
from Cognitive (Past experience) as the highest degree comparing with others by
mean value = 3.83, the second is Tourist satisfaction = 3.80 , Follow by Trust
= 3.76 and the lastly is Attitude = 3.753 Therefore, average of overall factors
were weighted at high level with = 3.79
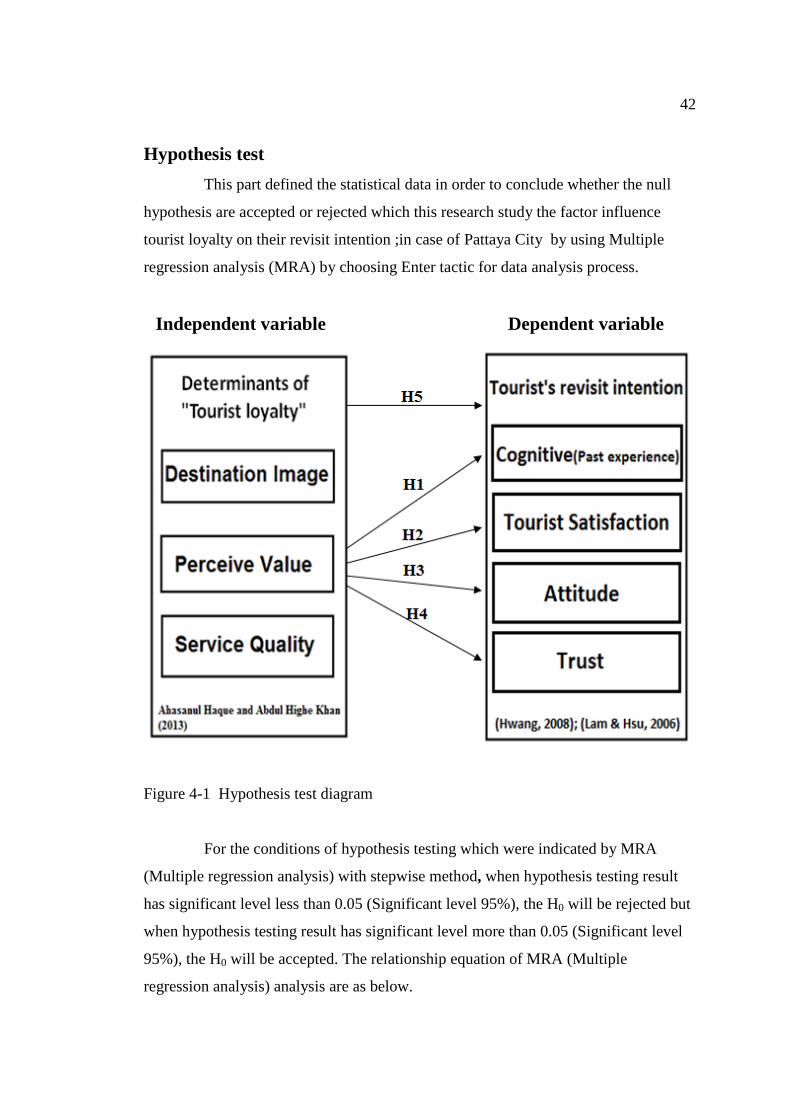
42
Hypothesis test
This part defined the statistical data in order to conclude whether the null
hypothesis are accepted or rejected which this research study the factor influence
tourist loyalty on their revisit intention ;in case of Pattaya City by using Multiple
regression analysis (MRA) by choosing Enter tactic for data analysis process.
Independent variable Dependent variable
Figure 4-1 Hypothesis test diagram
For the conditions of hypothesis testing which were indicated by MRA
(Multiple regression analysis) with stepwise method, when hypothesis testing result
has significant level less than 0.05 (Significant level 95%), the H0 will be rejected but
when hypothesis testing result has significant level more than 0.05 (Significant level
95%), the H0 will be accepted. The relationship equation of MRA (Multiple
regression analysis) analysis are as below.
43
Ŷ = a + b1X1 + b2X2 + b3X3…+ bkXk + e
When
Ŷ mean Customers’ purchase decision
a mean Constant
b (1-k) mean Coefficient
X1 mean Destination image
X2 mean Perceive value
X3 mean Service quality
Xk mean Independent variable
e mean Tolerances
The data analysis process by using SPSS program with the multiple linear
regression indicated in term of hypothesis testing, the result are as follows,
Results of hypothesis test
Hypothesis testing condition; by each hypothesis must have significant level
less than 0.05 (Significant level 95%) therefore refuse H0 but if hypothesis has
significant level more than 0.05 (Significant level 95%) it will accept H0 which the
result after MRA indicate to table 4-13, 4-14 , 4-15, 4-16 and 4-17 respectively.

44
Table 4-13 Model summaries, ANOVA and Coefficients of Multiple regression
analysis (MRA) (Hypothesis 1)
a. Dependent variable: Cognitive (Past experience)
Hypothesis 1 The tourist’s loyalty (Destination image, Perceived value,
Service quality) has influence on their revisit intention in Cognitive (Past experience).
H0: There is no significant influence between tourist’s loyalty (Destination
image, Perceived value, Service quality) has influence on their revisit intention
(Cognitive (Past experience)).
H1: There is a significant influence between tourist’s loyalty (Destination
image, Perceived value, Service quality) has influence on their revisit intention
(Cognitive (Past experience)).
In Table 4-13 indicate that the R value between independent variable which
is tourist loyalty including with destination image, perceive value and service quality
and dependent variable “Revisit intention” in Cognitive (Past experience) equal to
.509 and R Square equal to 0.259 which mean that the change of revisit intention
25.4% by in term of adjusted R Square equal to .254 and Durbin-Watson equal to
1.376
In additionally the analysis of variance (ANOVA) by the F-distribution
indicated value at 46.218. The coefficients of multiple regression analysis (MRA)
which indicate the analysis result of the independent variable to dependent variable
Model
Unstandardized
coefficients Standardized
coefficients t P-value Collinearity statistics
B SE Beta Tolerance VIF
(Constant) 1.538 .210 7.337 .000
Service .295 .051 .315 5.757 .000 .626 1.598
Destination .183 .055 .178 3.324 .001 .654 1.530
Perceive .143 .052 .131 2.755 .006 .833 1.200
R 0.509
R Square 0.259
Adjusted R square 0.254
F-ratio 46.218 (.0000*)
Durbin-Watson 1.376

45
didn’t have any problem in term of multicollinearity because the tolerance and VIF
value of this hypothesis was .833 and 1.200 respectively that tolerance value of this
factor more than 0.1 and VIF value of this factor were less than 10 which indicated to
independent variable is not have relationship. The lastly, significant level of this
factor equal to 0.000 and 0.015 which less than the significant level at 0.05 as follows
solution:
Unstandardized Ŷ = 1.538 + 0.295X3 *+ 0.183X1 *+0.143X2 + e
Standardized Ŷ = 0.315X3*+ 0.178X1 *+ 0.131X2e
When
Ŷ = Tourist revisit intention in Cognitive (Past experience)
X1 = Destination image
X2 = Perceive value
X3 = Service quality
So it indicated that tourist loyalty including destination image, perceive
value and service quality have significant influence on tourist revisit intention in
Cognitive (Past experience). Therefore, it could be summarized that reject H0 and
accept H1.
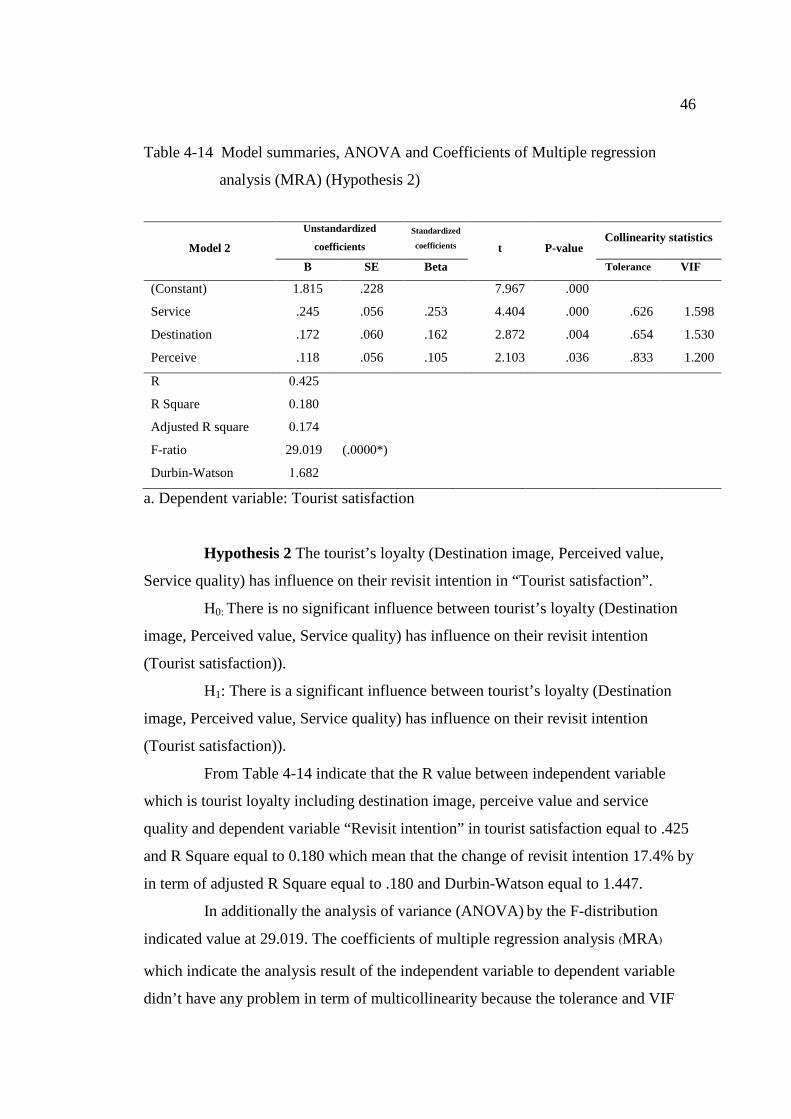
46
Table 4-14 Model summaries, ANOVA and Coefficients of Multiple regression
analysis (MRA) (Hypothesis 2)
a. Dependent variable: Tourist satisfaction
Hypothesis 2 The tourist’s loyalty (Destination image, Perceived value,
Service quality) has influence on their revisit intention in “Tourist satisfaction”.
H0: There is no significant influence between tourist’s loyalty (Destination
image, Perceived value, Service quality) has influence on their revisit intention
(Tourist satisfaction)).
H1: There is a significant influence between tourist’s loyalty (Destination
image, Perceived value, Service quality) has influence on their revisit intention
(Tourist satisfaction)).
From Table 4-14 indicate that the R value between independent variable
which is tourist loyalty including destination image, perceive value and service
quality and dependent variable “Revisit intention” in tourist satisfaction equal to .425
and R Square equal to 0.180 which mean that the change of revisit intention 17.4% by
in term of adjusted R Square equal to .180 and Durbin-Watson equal to 1.447.
In additionally the analysis of variance (ANOVA) by the F-distribution
indicated value at 29.019. The coefficients of multiple regression analysis (MRA)
which indicate the analysis result of the independent variable to dependent variable
didn’t have any problem in term of multicollinearity because the tolerance and VIF
Model 2
Unstandardized
coefficients Standardized
coefficients t P-value Collinearity statistics
B SE Beta Tolerance VIF
(Constant) 1.815 .228 7.967 .000
Service .245 .056 .253 4.404 .000 .626 1.598
Destination .172 .060 .162 2.872 .004 .654 1.530
Perceive .118 .056 .105 2.103 .036 .833 1.200
R 0.425
R Square 0.180
Adjusted R square 0.174
F-ratio 29.019 (.0000*)
Durbin-Watson 1.682

47
value of this hypothesis was .833 and 1.200 respectively that tolerance value of this
factor more than 0.1 and VIF value of this factor were less than 10 which indicated to
independent variable is not have relationship. The lastly, significant level of this
factor equal to 0.000 and 0.015 which less than the significant level at 0.05 as follows
solution:
Unstandardized Ŷ = 1.815 + 0.245X3 *+ 0.172X1 *+ 0.118X2 + e
Standardized Ŷ = 0.253X3*+ 0.162X1 *+ 0.105X2e
When
Ŷ = Tourist revisit intention in Cognitive (Past experience)
X1 = Destination image
X2 = Perceive value
X3 = Service quality
So it indicated that tourist loyalty including destination image, perceive
value and service quality have significant influence on tourist revisit intention in
tourist satisfaction. Therefore, it could be summarized that reject H0 and accept H1.
Table 4-15 Model summary, ANOVA and Coefficients of Multiple regression
analysis (MRA) (Hypothesis 3)
a. Department valiable: Attitude
Model 3
Unstandardized coefficients
Standardized coefficients
t P-value Collinearity statistics
B SE Beta Tolerance VIF
(Constant) 2.066 .209
9.903 .000
Service .274 .048 .283 5.648 .000 .851 1.175
Perceive .205 .057 .181 3.617 .000 .851 1.175
R 0.390
R Square 0.152
Adjusted R square 0.148
F-ratio 35.664 (.0000*)
Durbin-Watson 1.682

48
Hypothesis 3 The tourist’s loyalty (Destination image, Perceived value,
Service quality) has influence on their revisit intention in “Attitude”.
H0: There is no significant influence between tourist’s loyalty (Destination
image, Perceived value, Service quality) has influence on their revisit intention
(Attitude))
H1: There is a significant influence between tourist’s loyalty (Destination
image, Perceived value, Service quality) has influence on their revisit intention
(Attitude).
From table 4-15 indicate that the R value between independent variable
which is tourist loyalty including destination image, perceive value and service
quality and dependent variable “Revisit intention” in Attitude equal to 390 and
R Square equal to 0.152 which mean that the change of revisit intention 14.8% by
in term of adjusted R Square equal to .148 and Durbin-Watson equal to 1.682
In additionally the analysis of variance (ANOVA) by the F-distribution
indicated value at 35.664. The coefficients of multiple regression analysis (MRA)
which indicate the analysis result of the independent variable to dependent variable
didn’t have any problem in term of multicollinearity because the tolerance and VIF
value of this hypothesis was .851 and 1.175 respectively that tolerance value of this
factor more than 0.1 and VIF value of this factor were less than 10 which indicated to
independent variable is not have relationship. The lastly, significant level of this
factor equal to 0.000 and 0.015 which less than the significant level at 0.05 as follows
solution:
Unstandardized Ŷ = 2.066 + 0.274X3 *+ 0.205X2* + e
Standardized Ŷ = 0.283X3*+ 0.181X2e
When
Ŷ = Tourist revisit intention in attitude
X1 = Destination image
X2 = Perceive value
X3 = Service quality

49
So it indicated that tourist loyalty including perceive value and service
quality have significant influence on tourist revisit intention in tourist attitude.
Therefore, it could be summarized that reject H0 and accept H1.
Table 4-16 Model summary, ANOVA and Coefficients of Multiple regression
analysis (MRA) (Hypothesis 4)
a. Dependent valiable: Trust
Hypothesis Hypothesis 4 The tourist’s loyalty (Destination image,
Perceived value, Service quality) has influence on their revisit intention in Trust.
H0: There is no significant influence between tourist’s loyalty (Destination
image, Perceived value, Service quality) has influence on their revisit intention
(Trust)).
H1: There is a significant influence between tourist’s loyalty (Destination
image, Perceived value, Service quality) has influence on their revisit intention
(Trust).
From table 4-16 indicate that the in Table 4-14 indicate that the R value
between independent variable which is tourist loyalty including destination image,
perceive value and service quality and dependent variable “Revisit intention” in Trust
equal to .367 and R Square equal to 0.135 which mean that the change of revisit
intention 13% by in term of adjusted R Square equal to .130 and Durbin-Watson
equal to 1.641.
Model 4
Unstandardized
coefficients Standardized
coefficients t P-value Collinearity statistics
B SE Beta Tolerance VIF
(Constant) 2.086 .225 9.276 .000
Service .283 .060 .270 4.733 .000 .668 1.497
Destination .158 .066 .137 2.398 .017 .668 1.497
R 0.367
R Square 0.135
Adjusted R square 0.148
F-ratio 30.867 (.0000*)
Durbin-Watson 1.641

50
In additionally the analysis of variance (ANOVA) by the F-distribution
indicated value at 30.867. The coefficients of multiple regression analysis (MRA)
which indicate the analysis result of the independent variable to dependent variable
didn’t have any problem in term of multicollinearity because the tolerance and VIF
value of this hypothesis was .668 and 1.497 respectively that tolerance value of this
factor more than 0.1 and VIF value of this factor were less than 10 which indicated to
independent variable is not have relationship. The lastly, significant level of this
factor equal to 0.000 and 0.015 which less than the significant level at 0.05 as follows
solution:
Unstandardized Ŷ = 2.086 + 0.283X3 *+ 0.158X1* + e
Standardized Ŷ = 0.60X3*+ 0.66X1+e
When
Ŷ = Tourist revisit intention in trust
X1 = Destination image
X3 = Service quality
So it indicated that tourist loyalty including destination image and service
quality have significant influence on tourist revisit intention in trust. Therefore, it
could be summarized that reject H0 and accept H1.

51
Table 4-17 Model summary, ANOVA and Coefficients of Multiple regression
analysis (MRA) (Hypothesis 5)
Dependent variable: Tourist revisit intention
Hypothesis 5 The tourist’s loyalty (Destination image, Perceived value,
Service quality) has influence on their revisit intention in “Cognitive (Past
experience),” “Tourist satisfaction,” “Attitude” and “Trust”.
H0: There is no significant influence between tourist’s loyalty (Destination
image, Perceived value, Service quality) has influence on their revisit intention
(Cognitive (Past experience), (Tourist satisfaction), (Attitude) and (Trust)).
H1: There is a significant influence between tourist’s loyalty (Destination
image, Perceived value, Service quality) has influence on their revisit intention
(Cognitive (Past experience), (Tourist satisfaction), (Attitude) and (Trust))
From table 4-17 that the R value between independent variable which is
tourist loyalty including destination image, perceive value and service quality and
dependent variable “Revisit intention” in Cognitive (Past experience), tourist
satisfaction, attitude and trust equal to .547 and R Square equal to 0.299 which mean
that the change of revisit intention 29.4% by in term of adjusted R Square equal to
.294 and Durbin-Watson equal to 1.359
In additionally the analysis of variance (ANOVA) by the F-distribution
indicated value at 56.270. The coefficients of multiple regression analysis (MRA)
which indicate the analysis result of the independent variable to dependent variable
Model 4
Unstandardized
coefficients Standardized
coefficients t P-value Collinearity statistics
B SE Beta Tolerance VIF
(Constant) 1.783 .166 10.773 .000
Service .254 .040 .335 6.288 .000 .626 1.598
Destination .154 .043 .184 3.530 .000 .654 1.530
Perceive .137 .041 .154 3.346 .001 .833 1.200
R 0.547
R Square 0.299
Adjusted R square 0.294
F-ratio 56.270 (.0000*)
Durbin-Watson 1.359

52
didn’t have any problem in term of multicollinearity because the tolerance and VIF
value of this hypothesis was .833 and 1.200 respectively that tolerance value of this
factor more than 0.1 and VIF value of this factor were less than 10 which indicated to
independent variable is not have relationship. The lastly, significant level of this
factor equal to 0.000 and 0.015 which less than the significant level at 0.05 as follows
solution:
Unstandardized Ŷ = 1.783 + 0.254X3 *+ 0.154X1* ++ 0.137X2 * + e
Standardized Ŷ = 0335X3*+ 0.184X1+*+ 0.154X2+e
When
Ŷ = Tourist revisit intention in Cognitive (Past experience), Tourist
satisfaction, Attitude and Trust
X1 = Destination image
X3 = Service quality
So it indicated that tourist loyalty including destination image and service
quality have significant influence on tourist revisit intention in tourist revisit intention
in Cognitive (Past experience), Tourist satisfaction, Attitude and Trust. Therefore, it
could be summarized that reject H0 and accept H1.

53
Table 4-18 Hypothesis testing by using Multiple regression analysis (MRA)
Hypothesis statement Sig.
value R. value
Result of
hypothesis
H1.1 = The tourist’s loyalty (Destination
image, Perceived value, Service quality) has
influence on their revisit intention in Cognitive
(Past experience).
.000 .574 Accept
H1.2 = The tourist’s loyalty (Destination
image, Perceived value, Service quality) has
influence on their revisit intention in Tourist
satisfaction.
.000 .623 Accept
H1.3 = The tourist’s loyalty (Destination
image, Perceived value, Service quality) has
influence on their revisit intention in Attitude.
.000 .585 Accept
H1.4 = The tourist’s loyalty (Destination
image, Perceived value, Service quality) has
influence on their revisit intention in Trust.
.000 .499 Accept
H1.5 = The tourist’s loyalty (Destination
image, Perceived value, Service quality) has
influence on their revisit intention in Cognitive
(Past experience), Tourist satisfaction, Attitude
and Trust.
.000 .499 Accept
CHAPTER 5
CONCLUSIONS, DISCUSSION AND RECOMMENDATIONS
In this chapter will indicate to the conclusion of the study which is the final
process for this research by the topic of this chapter was listed below:
1. Conclusion
2. Discussion of the study
3. Recommendation in Implication for business
4. Recommendation of further research
5. Limitations of the study
Conclusions
The purpose of this research is study and explore to the influence of tourist
loyalty influence on their revisit intention toward in Pattaya City. Questionnaires were
used to collect data from a total 400 samples who visit landmarks of Pattaya City by
not limited about gender and have age between 18-60 years old. By in data analysis
process was used SPSS program for measured and analyzed the hypothesis which this
research was used multiple linear regression (MLR). Additionally, in term of
demographic factors were used statistic instrument consist of mean, standard
deviation and percentage.
In demographic factors of this research which used collect data consist of
gender, age, marital status , monthly income ,education levels and occupations. After
data collection process, the researcher found that
From the result found that the majority of foreign tourist who visited
Landmarks of Pattaya City are female which equal to 51.5% and male 48.5% in age
between 20-39 years olds 44.5%. Most of them were married 47.8%, have monthly
income $40,001-$60,000 39.8% and Bachelor’s degree level shown in highest
percentage equal to 43.3% and the lowest percentage in term of education level is
master degree or higher which is equal to 16% percentage of occupations: Business
owner or self employed has the highest percentage equal to 29.5% and the lowest
percentage and in term of occupations is student or other which is equal to 18%.

55
In term of travel characteristic factors of this research which used collect
data consist of number of visits to Thailand, length of stay in each times, purpose of
visit, travel companion and the attraction place in Pattaya City where tourist have
been visit. (Defined from 16 landmarks of Pattaya City ranked by Thaiway magazine)
From the result indicated that most of tourist visited Pattaya City for two
times, stayed in Pattaya about three night 41.5%, and the main purpose of their visit
was leisure (32.5%) and 27.5% of them stay more than three nights in Pattaya by
travel to Pattaya with their friends . Majority of the respondents 55.8 percent visited
Nongnooch Tropical Garden. Second most visited destination was Tiffany Show with
51.8 percent. Then Followed by Pattaya Elephant Village with 51 percent
respectively.
Discussion of this study
Pattaya City is a popular tourism destination for tourist from various part of
the world. Even though there are many or a lot of places around the world where
people can travel to, But for Thailand, Pattaya always be a destination that catches the
tourist's heart and soul. Pattyaya is tourist destination on both national levels .its is
filled with many natural tourist spots and man made entertainment venue to fulfill
tourist demand at all level. So no wonder why Pattaya ranked 3th position out of the
top 10 most visited tourist Place in Thailand in terms of international tourists in
Thailand in the year of 2011 and Soon Pattaya is ranked as the top ten for most
searched city for holiday destination, accommodation and popular restaurant from
Chinese voters in program “The best of Thailand Awards voted by Chinese tourist”
by Thailand tourism authority. Therefore, in this study the researcher uses the
relationship between tourist loyalty which consist of Destination image, Perceive
value and Service quality on their revisit intention towards Pattaya City offers to the
tour agency and the Thailand tourism organization to develop the tourism market in
the short and long-term and to segment the different market by the demographic. The
information from this research has clearly target sampling who come to visit Pattaya
City by using questionnaire in landmarks of Pattaya area which consist of 16
locations consist of Pattaya Hill, Mimosa Pattaya, Teddy Bear Museum Pattaya,
Pattaya Dolphin World, Crocodile Farm, Tiffany Cabarets Show, Ripley's Believe It

56
or Not!, Mini Siam, Pattaya Elephant Village, Nong Nooch Tropical Garden, Art in
Paradise, Pattaya Water Park, Underwater World Pattaya, Wat Yannasangwararam,
Khao Chichan and Pattaya Floating Market in Pattaya area by choosing target sample
for data collection as much as possible for benefit to study which in the end of data
collection process this research collected questionnaire equal to 400 samples for using
in data analysis process via Multiple regression analysis (MRA) for hypothesis test by
the result from hypothesis test will show by following below;
Hypothesis1: There is a significant influence between tourist’s loyalty
(Destination image, Perceived Value, Service quality) has influence on their revisit
intention in Cognitive (Past experience).
According to data analysis process, the Multiple regression analysis (MRA)
indicate to the significant level equal to 0.006 and R-value equal to 0.509 which mean
that the independent variable which consist of Destination image, Perceive value and
Service quality have significant influence to tourist revisit intention (Cognitive (past
experience)) by there is not the multicollinearity occur between each independent
variable. The significant value is less than alpha at 0.05 and hypothesis is accepted.
By Service quality greater than other dependent that mean that service is the most
valuable that affect to cognitive (In this case) moreover the result is not consistent
with (Thiumsak & Ruangkanjanases, 2016) His research was study about key
influencing factors for international tourists on their revisit intention in Bangkok city
and the result of his study found that “Destination image is a key factor” on tourist
revisit intention. For the result that not consistent is because of the different area to
collect data (In this case the related study collect data in Bangkok) and differ from
period of time to collect data (In this case the related collect data from Saturday and
Sunday during September – October 2013) and the total of sample size are different
(In this case the total number of questionnaire was 189).
Hypothesis 2: There is a significant influence between tourist’s loyalty
(Destination image, Perceived Value, Service quality) has influence on their revisit
intention (Tourist Satisfaction)).
According to data analysis process, the Multiple regression analysis (MRA)
indicate to the significant level equal to 0.036 and R-value equal to 0.425 which mean
that the independent variable which consist of Destination image, Perceive value and

57
Service quality have significant influence to tourist revisit intention (Satisfaction) by
there is not the multicollinearity occur between each independent variable. The
significant value is less than alpha at 0.05 and hypothesis is accepted. By Service
quality greater than other dependent that mean that service is the most valuable that
affect to tourist revisit intention (Satisfaction) (In this case) moreover the result is not
consistent with (Khuong & Nguyen, 2015). This study was study was identify key
factors affecting tourists’ satisfaction as well as their return intention towards Vung
Tau tourist destination and they found that key influencing factors for revisiting
destination is “Destination image” For the result that not consistent is because of the
different area to collect data (In this case the related study collect data in Vung Tau
City, Vietnam). Hence, because of different geographic and nationality may be affect
to tourist attitude and perceptions and Moreover these two study have different period
of time to collect data and including with the total of sample size are different. (In
this case the total number of questionnaire was 301).
Hypothesis 3: There is a significant influence between tourist’s loyalty
(Destination image, Perceived value, Service quality has influence on their revisit
intention (Attitude).
According to data analysis process, the Multiple regression analysis (MRA)
indicate to the significant level equal to 0.000 and R-value equal to 0.390 which mean
that the independent variable which consist of Destination image, Perceive value and
Service quality have significant influence to tourist revisit intention (Attitude) by
there is not the multicollinearity occur between each independent variable. The
significant value is less than alpha at 0.05 and hypothesis is accepted. By Service
quality greater than other dependent that mean that service is the most valuable that
affect to tourist revisit intention (Attitude) (In this case) moreover the result is not
consistent with (Mat Som et al., 2012). This study is exploring about factors
Influencing Visitors’ Revisit Behavioral Intentions: A case study of Sabah, Malaysia and
the researcher found that the key influencing factors for revisiting destination is
Destination image. For the result that not consistent is because different geographic
and nationality (In this case the related study was study at Kuala Sabah, Malaysia). So
its may be cause of different attitude and perception.

58
Hypothesis 4: There is a significant influence between tourist’s loyalty
(Destination image, Perceived value, Service quality) has influence on their revisit
intention (Trust)).
According to data analysis process, The Multiple regression analysis
(MRA ) indicate to the significant level equal to 0.017 and R-value equal to 0.367
which mean that the independent variable which consist of Destination image,
Perceive value and Service quality have significant influence to tourist revisit
intention (Trust) by there is not the multicollinearity occur between each independent
variable. The significant value is less than alpha at 0.05 and hypothesis is accepted.
By Service quality greater than other dependent that mean that service is the most
valuable that affect to tourist revisit intention (trust) (In this case) moreover the result
is consistent with (Wattanasaruch, 2014). The research aims to study factors of the
revisiting of Thai Tourists in Hua-Hin, Prachub khirikhan Province in Thailand where
the natural tourist destinations have been well-known for Thai and foreign tourists and
the result indicate that Service quality were the significant factors that influence their
trust and lead them loyal with destination and want to revisit Hua-Hin again in the
future.
Hypothesis 5: There is a significant influence between tourist’s loyalty
(Destination image, Perceived value, Service quality) has influence on their revisit
intention in Cognitive (Past experience), Tourist satisfaction, Attitude and Trust.
According to data analysis process, The Multiple regression analysis (MRA)
indicate to the significant level equal to 0.000 and R-value equal to 0.547 which mean
that the independent variable which consist of Destination image, Perceive value and
Service quality have significant influence to tourist revisit intention (Trust) by there is
not the multicollinearity occur between each independent variable. The significant
value is less than alpha at 0.05 and hypothesis is accepted. By Service quality greater
than other dependent that mean that service is the most valuable that affect to tourist
revisit intention in Cognitive (Past experience), Tourist satisfaction, Attitude and
Trust. (In this case) moreover the result is consistent with (Canny, 2013) By this study
attempted to investigate the relationship between the five dimensions of Service
quality on tourist satisfaction. Since, tourist satisfaction is considered to be a great
predictor for future behavioral intentions at the Borobudur temple, Magelang, Central

59
Java Indonesia. The model was tested using data collected from 200 domestic local
tourists. The findings of this study showed that Service quality had significant
positive relationship with tourist satisfaction and their revisit intention in Borobudur
Temple, Magelang,
Recommendation in implication for business
In the world of globalization, people have more chance to interconnect
between countries and regions without boundaries and according to Tourism is one of
the strongest drivers to generate revenue to every country and tourism always be the
trend for the people who love traveling. Tourist destinations have progressively over
the year and nowadays it’s become competitive. So for maintaining the
competitiveness and enhancing Pattaya attractiveness in order to be the top revisit
destination choice of tourists’ decision has become a strong challenge. In this section,
the recommendations will be proposed to the organizations in the tourism industry of
Pattaya in order to augment the competitiveness of Pattaya over other tourist
destination. The recommendations are segregated into three aspects;
1. From the result of hypothesis test indicate that service quality have the most
influence and valuable on tourist loyalty on their revisit intention towards in Pattaya
City which mean that for Pattaya city tourist have been received a good service
quality , and service quality in Pattaya City can bring a loyal tourist towards
destination by make a good relationship and value on them. So this study suggest that,
Pattaya Government and private tour operator should focus on maintain a good
service quality and the most important thing in delivering consistent customer service.
Hence in term of how to make tourist receive the same level of service every time the
Pattaya government and private tour operator should provide training programs for
the employees and tour guides. By the training programs intended to enhance service
quality towards in Pattaya city to preserve good service in tourist mind by the
program should focus on professional quality, professional skills training,
professional ethics training. The training can be provided by the various tourism
enterprises regularly held various training courses, relevant training activities, to form
a formal and long-term training plan , And according to subsequently of this study

60
shows that general quality of service of these tourist destination offer is valuable and
worth it. consist of activities/services available (transport, restaurants, leisure
activities, etc) was the important factor that make the tourists feel satisfied with the
quality of service , then, it is very recommended if the authority of Pattaya can work
together with the tourists attraction place cooperatively to maintain the service of
transport, restaurants, leisure activities and public facilities (i.e. rest room, parking lot
and rest area) to be more comfortable to the tourist for the present and in the future
and they should establish the leadership of tourism in environment protection; by
update existing tourism infrastructure and facilities; improve visitor facilities in tourist
attraction by ask for the corporation from every tourist attractions in Pattaya City for
development.
2. According to result of hypothesis test indicate that destination image has less
influence on tourist revisit intention; incase travel in Pattaya City. But however,
destination image had influence on tourist pre-visit and it plays an important role in
their travel purchase decisions and their visiting intentions (Oppermann, 2000; Pike,
2004). So it is very important to focus on it. Although Pattaya hold a huge tourism
potential, With full range of accommodation and varieties of attraction place but the
problem is the promoting campaigns never produced the desired effects and they
lacked coherence and continuity. So the Pattaya government and private tour operator
in Pattaya should proactively create the relationship and coordination with Tourism
Authority of Thailand in other countries to enhancing promotion and benefit in many
ways. For instance, the coordination could be practical by organizing a tourism fair or
even in major cities of Asia and Europe to promote tourism in Pattaya City. More
over due to subsequently of this study shows "Safe and secure environment" was the
important factor influence on destination image. So, building a positive destination
image is very important for tourism in Pattaya City , because a positive image of
destination will attract more and more visitor come to travel in that destination. The
destination image is very important whether in the long-term or short-term market
development. The researcher suggests the Thailand tourism organization create a city
image of the tourism destination. Thailand tourism organization and Pattaya
Government should strengthen the management of social security by improve the safe

61
image of the tourism destination because Safety in Pattaya is another problem that
effect the destination image of Pattaya City. Negative public security problems will
damage a good tourism image. Therefore Pattaya government should put in more
effort the solve the problems such as, putting in more police officers to take care of
civilians and tourist police at all important tourist destinations to oversee their safety.
to protect robberies and sexual harassment cases that can be seen all the time in
Pattaya City .
3. From the result of hypothesis test the result indicate that perceive have less
influence on tourist revisit intention in case travel in Pattaya City. Perceived value
refers to the value that customers receive or experience by using a service (Bettman,
Luce, John, & Payne, 1998). and according to subsequently of this study shows that "
Travel in Pattaya City can brings me plenty of pleasure and happiness" , " Travel in
Pattaya City give me the chance to meet loads of different interesting people" and
“Visiting the destination is valuable and worth it” was the important factor that make
the tourists feel satisfied when travel in Pattaya City So to satisfaction and
attractiveness and on the tourist destination So they are one of the key attractiveness
which draws foreigners to revisit Pattaya. Thus, the marketers in tourism industry
should substantially communicate the positive image of Pattaya to to create word of
mouth. Simultaneously, the government should create a campaign which educate the
local people about the significance of tourism industry and encourage them to be
friendly and helpful to international tourists.
4. For private tour operator who run the business in Pattaya City. To enhance the
competitiveness in this area. The private tour operator should proactively create the
relationship and coordination with tourism authorities of Thailand in terms of
enhancing promotion by the coordination could be practical by organizing a tourism
fair or even to tourism in Pattaya. In the event, the organizer should offer promotional
package to potential tourists. Moreover, price and quality of service are the key areas
in which tourists are looking for in evaluating the attractiveness and satisfaction on
the tourist destination. The businesses in tourism industry in Pattaya .So for compete
with those of other company and another destinations based on relatively low-price

62
strategy with differentiated and outstanding service quality to influence the tourists to
perceive that the price is value for money. Furthermore, as the tourists have heavily
relied on internet as the source of information in traveling to Pattaya, the businesses in
tourism industry should increasingly implement marketing and sales promotion via
online platform and add more distribution channel to contact with the customer such
as access to customer service by the phone 24 hours or website and E-mail.
Recommendations for further research
This research only focused on the influence of tourist loyalty on their revisit
intention; in case travel in Pattaya, The further research can be extended to study in
another province in Thailand. By further research may use another framework or
added other factors for extended the hypothesis. In addition, the further research can
add the data analysis instrument for develop in term of validity and reliability.
This study is only focus on interpreting the tourist loyalty on their revisit intention of
local Pattaya tourist through quantitative methods. Therefore, its very recommended if
the future studies can develop the similar research by combining quantitative and
qualitative methods, which then the results can be compared and benchmarked to
enrich the academic study of hospitality research in terms of service quality, brand
loyalty and revisit behavioral intentions at various tourist destinations. Nevertheless,
as a limitation of questionnaire survey, there must be a measurement against error in
assessing the respondent’s honesty.
Limitations of the study
From the study “the factors influence tourist loyalty on their revisit
intention; case study in Pattaya City” it appears that the limitations have been issued
as follows:
In this study, the researchers distributed the surveys by the researcher
personally to the respondents who visited Pattaya City. Some tourists travel to Pattaya
by themselves, some tourists was travel with the tour. They come from different
background. And this affected on the questionnaire. Some people can not clearly

63
understand the questionnaires which need more explanations. All these factors may
affect the accuracy of the answer.
The survey has been distributed by the researcher personally to the
respondents who have been traveling in Thailand. Since the data collection time
coincided with rest after visited at tourist attraction place. After visit and finish their
activities from the attraction place they were very tired, so, they may not have a good
mind to do the surveys.

BIBLIOGRAPHY
Ajzen, I. (1991). The theory of planned behavior. Organization Behavior and Human
Decision Processes, 50, 179-211.
Akbar, S. (2010). Revitalization of service quality to gain customer satisfaction and
loyalty. International Journal of Business and Management, 5(6), 113-122.
Badarneh, M. B., & Mat Som, P. A. (2011). Factors influencing tourists’ revisit
behavioral intentions and loyalty. Retrieved from
http://www.wbiconpro.com/426-Badarneh.pdf
Baker, D. A., & Crompton, J. L. (2000). Quality, satisfaction and behavioral
intentions. Annals of Tourism Research, 27(3), 785-804. Retrieved from
http://dx.doi.org/10.1016/S0160-7383(99)00108-5
Baloglu, S., & McCleary, K. W. (1999). A model of destination image formation.
Annuals of Tourism Research, 35, 868-897. Retrieved from
http://dx.doi.org/10.1016/S0160-7383(99)00030-4
Bigne´, J. E., Moliner, M. A., & Callarisa, L. L. J. (2000). El valor y la fidelizacio´n
de clientes: Una propuesta de modelo dina´mico de comportamiento. Revista
Europea de Direccio´n y Economı´a de la Empresa, 9(3), 65-78.
Bigne, J. E., Sanchez, M. I., & Sanchez, J. (2001). Tourism image, evaluation
variables and after purchase behaviour: Inter-relationship. Tourism
Management, 22(6), 607-616. Retrieved from
http://dx.doi.org/10.1016/S0261-5177(01)00035-8
Blackwell, R., Engel, J. F., & Miniard, P. W. (2006). Consumer behavior (10 th ed.).
Mason, OH: Thomson/South-Western.
Bloemer, J. (1998). Investigating derivers of bank loyalty: The complex relationship
between image, service quality and satisfaction. International Journal of
Bank Marketing, 16(7), 276-286.
Bolton, R. N., & Drew, J. H. (1991). A multistage model of customers’ assessments
of service quality and value. Journal of Consumer Research, 17, 375-384.

64
Bowen, J. T., & Chen, S. L. (2001). The relationhsip between customer loyalty and
customer satisfaction. International Journal of Contemporary Hospitality
Management, 13(5), 213-217.
Canny, I. U. (2013). An empirical investigation of service quality, tourist satisfaction
and future behavioral intentions among domestic local tourist at Borobudur
Temple. Retrieved from http://www.ijtef.org/papers/265-F603.pdf
Castro, C. B., Armario, E. M., & Ruiz, D. M. (2007). The influence of market
heterogeneity on the relationship between a destination’s image and
tourists’ future behavior. Tourism Management, 28, 175-187. Retrieved
from http://dx.doi.org/10.1016/j.tourman.2005.11.013
Chen, C. F., & Tsai, D. C. (2007). How destination image and evaluative factors
affect behavioral intentions?. Tourism Management, 28(4), 1115-1122.
Retrieved from http://dx.doi.org/10.1016/j.tourman.2006.07.007
Chen, J. S., & Gursoy, D. (2001). An investigation of tourists destination loyalty and
preferences. International Journal of Contemporary Hospitality
Management, 13(2), 79-85. Retrieved from
http://dx.doi.org/10.1108/09596110110381870
Chi, C., & Qu, H. (2008). Examining the structure relationships of destination image
and destination loyalty: An integrated approach. Tourism Management, 29,
624-636. Retrieved from http://dx.doi.org/10.1016/j.tourman.2007.06.007
Choi, S. H., Kim, J. N., & Cai, L. A. (2012). Tourism loyalty: An extended
communicative action model. Retrieved from
http://scholarworks.umass.edu/cgi/viewcontent.cgi?article=1194&context=g
radconf_hospitality
Christian, H., & Giering, A. (2001). Personal characteristics as moderators of the
relationship between customer satisfaction and loyalty: An empirical
analysis. Psychology & Marketing, 18(1), 43-66.
Cronin, J. J., Brady, M. K., & Hult, G. T. (2000). Assessing the effects of quality,
value, customer satisfaction on consumer behavioral intentions in service
environments. Journal of Retailing, 76(2), 193-218.
Cronin, J. J., & Taylor, S. A. (1992). Measuring service quality: A reexamination and
extension. Journal of Marketing, 56(3), 55-69.

65
Dodds, W. B., Monroe, K. B., & Grewal, D. (1991). Effect of price, brand and store
information on buyers’ product evaluations. Journal of Marketing Research,
28(3), 307-319.
Dumond, E. J. (2000). Value management and underlying framework. International
Journal of Operation & Production Management, 20(9), 1062-10177.
Dwyer, K. (2003). Destination competitiveness: Determinants and indicators. Current
Issues in Tourism, 6(5), 369-414. Retrieved from
http://dx.doi.org/10.1080/13683500308667962
Etchner, C., & Ritchie, B. (1991). The meaning and measurement of a destination
image. Journal of Tourism Studies, 2(2), 2-12.
Ganesan, S. (1994). Determinats of long-term orientation in buyer-seller relationship.
Journal of Marketing, 58(2), 1-19.
Grewal, D., Monroe, K. B., & Krishnan, R. (1998). The effect of price comparison
advertising on buyers‘ perception of acquisition value, transaction value, and
behavioral intention. Journal of Marketing, 62, 46-59.
Fournier, S. (1998). Consumers and their brands: Developing relationships theory in
consumer research. Journal of Consumer Research, 24, 343-373.
Gabarro, J. J. (1978). The development of trust, influence, and expectations. In A. G.
Athos, & J. J. Gabarro (Eds.), Interpersonal behavior, communications and
understanding in relationships. Englewood Cliffs, NJ: Prentice-Hall.
Gitelson, R. J., & Crompton, J. L. (1984). Insights into the repeat vacation
phenomenon. Annals of Tourism Research, 11(2), 199-217.
Gwinner, K. P., Gremler, D. D., & Bitner, M. J. (1998). Relational benefits in services
industries: The customer’s perspective. Journal of the Academy of
Marketing Science, 26(2), 101-114.
Ibrahim, E. E., & Gill, J. (2005). A positioning strategy for a tourist destination,
based on analysis of customers’ perceptions and satisfactions. Marketing
Intelligence & Planning, 23(2), 172-188.
Kim, S., Holland, S., & Han, H. (2012). A structural model for examining how
destination image, perceived value, and service quality affect destination
loyalty: A case study of Orlando. Retrieved from
http://dx.doi.org/10.1002/jtr.1877

66
Khuong, M. N., & Nguyen, T. T. (2015). Factors affecting tourists’ return intention
towards Vung Tau City, Vietnam: A mediation analysis of destination
satisfaction. Retrieved from http://www.joams.com/uploadfile/
2014/0825/20140825102137622pdf
Kozak, M. (2001). Repeaters’ behavior at two distinct destinations. Annals of
Tourism Research, 28(3), 784-807. Retrieved from
http://dx.doi.org/10.1016/S0160-7383(00)00078-5
Kosak, M., & Rimmington, M. (2000). Tourist satisfaction with Mollorca, Spain as
anoff-season holiday destination. Journal of Travel Research, 38, 260-269.
La Barbara, P. A., & Mazursky, D. (1983). A longitudinal assessment of consumer
satisfaction/ dissatisfaction: The dynamic aspect of the cognitive process.
Journal of Marketing Research, 20, 393-404.
Lam, T., & Hsu, C. H. C. (2006). Predicting behavioral intention of choosing a travel
destination. Tourism Management, 27(4), 589-599.
Lee, C., Lee, Y., & Lee, B. (2005). Korea’s destination image formed by the 2002
World Cup. Annals of Tourism Research, 32(4), 839-58.
Lindquist, J. D. (1975). Meaning of image. Journal of Retailing, 50(4), 29-38.
Mat Som, A. P., Marzuki, A., Yousef, M., & AbuKhalifeh, A. N. (2012).
Factors influencing visitors’ revisit behavioral intentions: A case study of
Sabah, Malaysia. International Journal of Marketing Studies, 4(4), 41-50.
McDougall, G. H. G., & Levesque, T. (2000). Customer satisfaction with services:
Putting perceived value to equation. Journal of Services Marketing, 14,
392-410.
Mechinda, P., Serirat, S., Anuwichanont, J., & Gulid, N. (2010). An examination of
tourists loyalty towards medical tourism in Pattaya, Thailand. International
Business & Economics Research Journal, 9(1), 56-70. Retrieved from
http://www.cluteinstitute.com/ojs/index.php/IBER/article/view/508
Meng, S. M., Liang, G. S., & Yang, S. H. (2010). The relationships of cruise image,
perceived value, satisfaction, and post-purchase behavioral intention on
Taiwanese tourists. American Journal of Business Management, 5(1), 19-29.
392-410.

67
Mohamad, M., Abdullah, A. R., & Mokhlis, S. (2012). Tourists’ evaluations of
destination image and future behavioural intention: The case of Malaysia.
Journal of Management and Sustainability, 2(1), 181-189.
Monetary Authority of Singapore. (2014). Annual Statistics 2014. Retrieved from
http://www.mas.gov.sg/Statistics/Insurance-Statistics/Annual
Statistics/Insurance-Statistics-2014.aspx
Morgan, R. M., & Hunt, S. D. (1994). The commitment-trust theory of relationship
marketing. Journal of Marketing, 58, 20-38.
Mostafavi Shirazi, S. F., & Mat Som, A. P. (2010). Relationship marketing and
community involvement: Two significant factors for tourism strategies. In
C. A. Brebbia, & F. D. Pineda (Eds.), Sustainable Tourism IV (pp. 47-53).
Southampton, UK: WIT Press.
Oh, H. (2003). Price fairness and its asymmetric effects on overall price, quality and
value judements: The case of upscale hotel .Tourism Management, 24,
241-249.
Oliver, R. L. (1999). Whence consumer loyalty?. Journal of Marketing, 63, 33-44.
Oom do Valle, P., Silva, J. A., Mendes, J., & Guerreiro, M. (2006). Tourist
satisfaction and destination loyalty intention: A structural and categorical
analysis. Journal of Business Science and Applied Management, 1(1),
25-44. Retrieved from http://www.business-and-
management.org/paper.php?id=3
Oppermann, M. (2000). Tourism destination loyalty. Journal of Travel Research,
39(1), 78-84.
Pallant, J. F. (2010). SPSS survival manual: A step by step guide to data analysis
using SPSS (4th ed.). Maidenhead: Open University Press/McGraw-Hill.
Parasuraman, A., Zeithaml, V. A., & Berry, L. L. (1985). A conceptual model of
service quality and its implications for future research. Journal of
Marketing, 49, 41-50.
Parasuraman, A., Zeithaml, V. A., & Berry, L. L. (1994, Fall). Alternative scales for
measuring service quality: A comparative assessment based on psychometric
and diagnostic criteria. Journal of Retailing, 201-230.

68
Patterson, P., & Spreng, G. (1997). Modelling the relationship between perceived
value, satisfaction and repurchase intentions in a business-to-business,
services context: An empirical examination. International Journal of Service
Industry Management, 8, 414-434.
Petrick, J. F., & Backman, S. J. (2002). An examination of the construct of perceived
value for the prediction of golf travelers: Intentions to revisit. Journal of
Travel Research, 41, 38-45.
Pike, S. (2004). Destination marketing organizations. Oxford, UK: Elsevier.
Pine, B. J., Peppers, D., & Rogers, M. (1995, March-April). Do you want to keep your
customers forever? Harvard Business Review, 103-114.
Prayag, G., & Ryan, C. (2011). Antecedents of tourists’ loyalty to mauritius: The role
and influence of destination image, place attachment, personal involvement,
and satisfaction. Journal of Travel Research, 51(3), 342-356.
Pritchard, M. P., & Howard, D. R. (1997). The loyal traveler: Examining a typology
of service patronage. Journal of Travel Research, 35(2), 1-10.
Ragheb, M. G., & Tate, R. L. (1993). A behavioral model of leisure participation,
based on leisure attitude, motivation and satisfaction. Leisure Studies, 12,
61-70.
Rayan, C. (2002). From motivation to assessment. In C. Rayan (Ed.), The tourist
experience (pp. 58-77). London: Continuum.
Rittichainuwat, B. N., Qu, H., & Brown, T. J. (2001). Thailand's international travel
image: Mostly favorable. The Cornell Hotel and Restaurant Administration
Quarterly, 42(2), 82-95.
Ross, G. F. (1993). Ideal and actual images of backpacker visitors to Northern
Australia. Journal of Travel Research, 32(2), 54-57. Retrieved from
http://dx.doi.org/10.1177/004728759303200208
Rovinelli, R. J., & Hambleton, R. K. (1977). On the use of content specialists in the
assessment of criterion-referenced test item validity. Dutch Journal of
Educational Research, 2, 49-60.
Schechter, L. (1984). A normative conception of value. Progressive Grocer,
Executive Report, 12-14.
69
Schiffman, L. G., & Kanuk, L. L. (1994). Consumer behavior (10th ed.). Boston:
Pearson.
Seba, J. A. (Ed.). (2012). Tourism and hospitality: Issues and developments. Oakville:
Apple Academic Press.
Shahin, A., & Dabestani, R. (2001). Coloration analysis of service quality gap in four-
star hotel in Iran. International Business Research, 3(3), 40-46.
Stepchenkova, S., & Mills, J. E. (2010). Destination image: A meta-analysis of 2000-
2007 research. Journal of Hospitality Marketing & Management, 19(6),
575-609.
Sweeney, J. C., & Soutar, G. N. (2001). Consumer perceived value: The development
of a multiple item scale. Journal of Retailing, 77(2), 203-220.
Tasci, A. D. A., & Gartner, W. C. (2007). Destination image and its functional
relationships. Journal of Travel Research, 45(4), 413-425. Retrieved from
http://dx.doi.org/10.1177/0047287507299569
TAT Intelligence Center. (2013). Statistics of domestic tourist (Pattaya City) year
2010-2013. Retrieved from http://tatic.tourismthailand.org/
TAT Intelligence Center. (2015). Statistics of internal tourism in Pattaya Chonburi
year 2014-2015. Retrieved from http://www.tourism.go.th
Teas, K., & Agarwal, S. (2000). The effects of extrinsic product cues on consumers’
percepcions of quality, sacrifice and value. Journal of the Academy of
Marketing Science, 28(2), 102-117.
Thiumsak, T., & Ruangkanjanases, A. (2016). Factor influence international visitors
to revisit Bangkok, Thailand. Retrieved from
http://www.joebm.com/vol4/394-E00008.pdf
Tian-Cole, S., & Crompton, J. (2003). A conceptualization of the relationships
between service quality and visitor satisfaction, and their links to destination
selection. Leisure Studies, 22, 65-80.
Tideswell, C. (2012). Loyalty behaviors and relationship commitment towards
hotel services. Retrieved from http://www.anzmac.org/conference_archive/
...Relationship.../6-Tideswell.pdf

70
Tourism Authority of Thailand. (2015). The best of Thailand Awards voted by
Chinese Tourists year 2015. Retrieved from
http://www.tatnews.org/chinese-tourists-vote-for-their-top-thai-tourism-
products-and-services/
Truong ,T. H., & Foster, D. (2006). Using holsat to evaluate tourist satisfaction at
destinations: The case of Australian Holidaymakers in Vietnam. Tourism
Management, 27, 842-855.
Um, S., Chon, K., & Ro, Y. H. (2006). Antecedents of revisit intention. Annals of
Tourism Research, 33(4), 1141-1158. Retrieved from
http://dx.doi.org/10.1016/j.annals.2006.06.003
Unger, D. C., & Wandersman, A. (1985). The importance of neighbors: The social,
cognitive and affective components of neighboring. American Journal of
Community Psychology, 13, 139-169.
Uysal, M., Chen, J., & Williams, D. (2000). Increasing state market share through a
regional positioning. Tourism Management, 21(1), 89-96. Retrieved from
http://dx.doi.org/10.1016/S0261-5177(99)00082-5
Vincent, V. C., & Thompson, W. T. (2002). Assessing community support and
sustainability for ecotourism development. Journal of Travel Research, 41,
153-160.
Wang, Y. C., Lin, W. R., Yeh, P. H., & Lui, C. R. (2011). The role of destination
image in formation of destination loyalty at leisure farm: Difference between
first-time and repeat visitors. In Paper presented at the 7th CPTHL
Symposium Chiang Mai, Thailand. n.p.
Wattanasaruch, P. (2014). Factors affecting to revisit of Thais’ tourists with logistic
regression: A case study of Hua-Hin in Prachuap Khirikhan province,
Thailand. Retrieved from http://jotr.eu/index.php/tourism-management/103-
parnchit
Williams, C., & Buswell, J. (2003). Service quality in leisure and tourism. Retrieved
from http://dx.doi.org/10.1079/9780851995410.0000

71
Yoon, Y., & Uysal, M. (2005). An examination of the effects of motivation and
satisfaction on destination loyalty: A structural model. Tourism
Management, 26(1), 45-56. Retrieved from
http://dx.doi.org/10.1016/j.tourman.2003.08.016
Zeithaml, V., & Bitner, M. (2003). Service marketing: Integrating customer focus
across the firm. New York: McGraw-Hill.
Zeithaml, V.A. (1988). Consumer perceptions of price, quality and value: a means-
end model and synthesis of evidence. Journal of Marketing, 52, 2-22.

APPENDICES

APPENDIX 1
Questionnaire

Questionnaire
The factor influence tourist’s loyalty on their revisit intention: Incase of travel in
Pattaya City
Objective:
This questionnaire was designed to collect data which will be used to test
hypotheses include in the independent study of student in Master Degree in Business
Administration (International Program) of Burapha University. Researcher would like
to ask your co-operation in doing questionnaire.
The questionnaire is divided into 3 parts:
Part 1: Questionnaire about demographic of foreign tourist who visit 16
attractions place in Pattaya city. (Determined from 16 landmarks of Pattaya City)
Part 2: Questionnaire about travel Characteristic consists of number of visits
to Thailand, length of stay in each times, purpose of visit, travel companion and the
attraction place in Pattaya City where you have been visit.
Part 3: Question about tourist loyalty toward Pattaya City consists of
destination image, perceive value and service quality.
Part 4: Questionnaire about question about tourist revisit intention toward in
Pattaya City consists of Cognitive (Past Experience), Tourist’s Satisfaction, Attitude
and Trust

75
Instruction: Please mark (/) in the blank that represent that fact.
Part 1: Information about demographic of foreign tourist.
1. Gender:
□ Male
□ Female
2. Age:
□ Less than 20 years old
□ 20-39 years old
□ 40-59 years old
□ 60 years or more
3. Married status:
□ Single
□ Married
□ Divorced
□ Widowed
4. Monthly income:
□ Less than 20,000$
□ $20,001-$40,000
□ More than $80,001
5. Education level:
□ High School or less
□ Diploma or Associate degree
□ Bachelor degree
□ Master degree or higher
5. Occupation:
□ Company employee
□ Business owner or self employed
□ Government officer
□ Student or others
76
Part 2: Travel Characteristic
I would like to ask some questions about your travel characteristic. Please
mark the correct sign () in the box which best describes your travel behavior for
each question.
1. Number of visits to Pattaya
□ One time
□ Two times
□ Three times
□ More than three times
2. Length of stay in each times
□ One night
□ Two nights
□ Three nights
□ More than three nights
3. Purpose of visit
□ Leisure
□ Business
□ Visit friend or relatives
□ Other
4. Travel companion
□ Family or relative
□ Spouse
□ Friends
□ Colleagues
□ Classmates or teacher
□ One self
5. The attraction place in Pattaya City where you have been visit. You can choose
more than one items.
□ Pattaya Hill (Pratamnak Hill)
□ Pattaya Elephant Village
□ Mimosa Pattaya
□ Nongnooch Tropical Garden

77
□ Teddy Bear Museum Pattaya
□ Art in Paradise
□ Crocodile Farm
□ Pattaya Water Park
□ Tiffany Show
□ Underwater World Pattaya
□ Ripley's Believe It or Not
□ Wat Yannasangwararam
□ Khao Chichan
□ Pattaya Floating Market
□ Pattaya Dolphin World
□ Mini Siam
Part 3: Question about tourist loyalty toward Pattaya City
I would like to ask about your loyalty toward in Pattaya City (Destination
image, perceive value and service quality). Please indicate how much you agree or
disagree for each statement on the following scale:
No. Statement
Level of Affecting
5 4 3 2 1
Strongly
agree Agree Neutral Disagree
Strongly
disagree
1 Destination Image
1.1 Abundance of natural attractions and
beautiful scenery (beaches, sea, garden
and etc.)
1.2 Friendly and helpful of local people
toward visitors
1.3 Safe and secure environment
2 Perceive Value
2.1 Travel in Pattaya City can brings me
plenty of pleasure and happiness

78
No. Statement
Level of Affecting
5 4 3 2 1
Strongly
agree Agree Neutral Disagree
Strongly
disagree
2.2 Travel in Pattaya City give me the
chance to meet loads of different
interesting people
2.3 “Visiting the destination is valuable and
worth it”
3 Service Quality
3.1 General quality of service of this tourist
destination offer is valuable and worth it.
The quality of activities/services available
(transport, restaurants, leisure activities,
etc.)
3.2 Service staff can pay active attention to
your personal special requirement
3.3 “While visiting the place, I received good
service
Part 4: Question about tourist revisit intention toward in Pattaya City.
I would like to ask about your intention to revisit Pattaya City. (Cognitive
(Past Experience), Tourist’s Satisfaction, Attitude and trust). Please indicates how
much you agree or disagree for each statement on the following scale:
No. Statement
Level of Affecting
5 4 3 2 1
Strongly
agree Agree Neutral Disagree
Strongly
disagree
1 Cognitive (Past Experience)
1.1 If I have a positive experience from a
tourism destination, there is high certainty
that I would be willing to revisit it again.

79
No. Statement
Level of Affecting
5 4 3 2 1
Strongly
agree Agree Neutral Disagree
Strongly
disagree
1.2 Positive past experience of a tourism
destination make me want to tell more
friends and families about that
destination.
1.3 Positive past experience of the destination
led to it being on my top priority for
future travel choices.
2 Tourist’s Satisfaction
2.1 I have positive feelings regarding Pattaya
City
2.2 The visit to Pattaya City exceeded my
expectation.
2.3 I am satisfied with my decision to visit
Pattaya City
3 Attitude
3.1 I am pleased that I decided to visit this
tourist destination
3.2 I have wonderful image of Pattaya City as
a holiday destination.
3.3 I feel at home in this tourist destination.
4 Trust
4.1 Pattaya City represents high level of
expertise in tourism services.
4.2 If I had to decide again I would choose
this tourist destination again.
4.3 I feel I am very loyal to Pattaya City as a
destination choice

The result of data analysis process by using SPSS program
Hypothesis 1: Model summary, ANOVA and Coefficients of multiple
regression analysis (MRA)
ANOVAa
Model Sum of Squares df Mean Square F Sig.
1
Regression 30.119 1 30.119 111.346 .000b
Residual 107.659 398 .270
Total 137.778 399
2
Regression 33.775 2 16.887 64.463 .000c
Residual 104.003 397 .262
Total 137.778 399
3
Regression 35.730 3 11.910 46.218 .000d
Residual 102.047 396 .258
Total 137.778 399
a. Dependent Variable: Cognitive
b. Predictors: (Constant), Service
c. Predictors: (Constant), Service, Destination
d. Predictors: (Constant), Service, Destination, Perceive
Model R R
Square
Adjusted
R Square
Std.
Error of
the
Estimate
Change Statistics Durbin-
Watson R Square
Change
F
Change
df1 df2 Sig. F
Change
1 .468a .219 .217 .52010 .219 111.346 1 398 .000
2 .495b .245 .241 .51183 .027 13.956 1 397 .000
3 .509c .259 .254 .50764 .014 7.588 1 396 .006 1.376
a. Predictors: (Constant), Service
b. Predictors: (Constant), Service, Destination
c. Predictors: (Constant), Service, Destination, Perceive
d. Dependent Variable: Cognitive

82
Coefficients
Model Unstandardized Coefficients Standardized
Coefficients
t Sig. Collinearity
statistics
B Std. Error Beta Tolerance VIF
1 (Constant) 2.202 .157 14.038 .000
Service .438 .041 .468 10.552 .000 1.000 1.000
2
(Constant) 1.802 .188 9.597 .000
Service .330 .050 .353 6.610 .000 .668 1.497
Destination .205 .055 .199 3.736 .000 .668 1.497
3
(Constant) 1.538 .210 7.337 .000
Service .295 .051 .315 5.757 .000 .626 1.598
Destination .183 .055 .178 3.324 .001 .654 1.530
Perceive .143 .052 .131 2.755 .006 .833 1.200
a. Dependent Variable: Cognitive
Hypothesis 2: Model summary, Anova and Coefficients of multiple
regression analysis (MRA)
Model Summaryd
Model R R
Square
Adjusted
R Square
Std.
Error of
the
Estimate
Change Statistics Durbin-
Watson R Square
Change
F
Change
df1 df2 Sig. F
Change
1 .387a .150 .148 .56071 .150 70.063 1 398 .000
2 .414b .171 .167 .55431 .021 10.237 1 397 .001
3 .425c .180 .174 .55193 .009 4.424 1 396 .036 1.447
a. Predictors: (Constant), Service
b. Predictors: (Constant), Service, Destination
c. Predictors: (Constant), Service, Destination, Perceive

83
Coefficientsa
Model Unstandardized Coefficients Standardized
Coefficients
t Sig. Collinearity
statistics
B Std. Error Beta Tolerance VIF
1 (Constant) 2.406 .169 14.227 .000
Service .374 .045 .387 8.370 .000 1.000 1.000
2
(Constant) 2.035 .203 10.006 .000
Service .275 .054 .284 5.076 .000 .668 1.497
Destination .190 .059 .179 3.200 .001 .668 1.497
3
(Constant) 1.815 .228 7.967 .000
Service .245 .056 .253 4.404 .000 .626 1.598
Destination .172 .060 .162 2.872 .004 .654 1.530
Perceive .118 .056 .105 2.103 .036 .833 1.200
a. Dependent Variable: Satisfaction
ANOVAa
Model Sum of Squares df Mean Square F Sig.
1
Regression 22.027 1 22.027 70.063 .000b
Residual 125.127 398 .314
Total 147.154 399
2
Regression 25.173 2 12.586 40.963 .000c
Residual 121.982 397 .307
Total 147.154 399
3
Regression 26.520 3 8.840 29.019 .000d
Residual 120.634 396 .305
Total 147.154 399
a. Dependent Variable: Satisfaction
b. Predictors: (Constant), Service
c. Predictors: (Constant), Service, Destination
d. Predictors: (Constant), Service, Destination, Perceive

84
Hypothesis 3: Model summary, Anova and Coefficients of multiple
regression analysis (MRA)
Model Summaryc
Model R R
Square
Adjusted
R Square
Std.
Error of
the
Estimate
Change Statistics Durbin-
Watson R Square
Change
F
Change
df1 df2 Sig. F
Change
1 .353a .124 .122 .56942 .124 56.529 1 398 .000
2 .390b .152 .148 .56097 .028 13.083 1 397 .000 1.682
a. Predictors: (Constant), Service
b. Predictors: (Constant), Service, Perceive
c. Dependent Variable: Attitude
ANOVAa
Model Sum of Squares df Mean Square F Sig.
1
Regression 18.329 1 18.329 56.529 .000b
Residual 129.048 398 .324
Total 147.377 399
2
Regression 22.446 2 11.223 35.664 .000c
Residual 124.931 397 .315
Total 147.377 399
a. Dependent Variable: Attitude
b. Predictors: (Constant), Service
c. Predictors: (Constant), Service, Perceive

85
Coefficientsa
Model Unstandardized
Coefficients
Standardized
Coefficients
t Sig. Collinearity
statistics
B Std. Error Beta Tolerance VIF
1 (Constant)
2.508 .172 14.606 .000
Service .341 .045 .353 7.519 .000 1.000 1.000
2
(Constant) 2.066 .209 9.903 .000
Service .274 .048 .283 5.648 .000 .851 1.175
Perceive .205 .057 .181 3.617 .000 .851 1.175
a. Dependent Variable: Attitude
Hypothesis 4: Model summary, Anova and Coefficients of multiple
regression analysis (MRA)
Model Summaryc
Model R R
Square
Adjusted
R Square
Std.
Error of
the
Estimate
Change Statistics Durbin-
Watson R Square
Change
F
Change
df1 df2 Sig. F
Change
1 .349a .122 .120 .61663 .122 55.322 1 398 .000
2 .367b .135 .130 .61298 .013 5.752 1 397 .017 1.641
a. Predictors: (Constant), Service
b. Predictors: (Constant), Service, Destination
c. Dependent Variable: Trust

86
ANOVAa
Model Sum of Squares df Mean Square F Sig.
1
Regression 21.035 1 21.035 55.322 .000b
Residual 151.331 398 .380
Total 172.366 399
2
Regression 23.196 2 11.598 30.867 .000c
Residual 149.170 397 .376
Total 172.366 399
a. Dependent Variable: Trust
b. Predictors: (Constant), Service
c. Predictors: (Constant), Service, Destination
Coefficientsa
Model Unstandardized
Coefficients
Standardized
Coefficients
t Sig. Collinearity
statistics
B Std. Error Beta Tolerance VIF
1 (Constant) 2.393 .186 12.870 .000
Service .366 .049 .349 7.438 .000 1.000 1.000
2
(Constant) 2.086 .225 9.276 .000
Service .283 .060 .270 4.733 .000 .668 1.497
Destination .158 .066 .137 2.398 .017 .668 1.497
a. Dependent Variable: Trust

87
Hypothesis 5: Model summary, Anova and Coefficients of multiple
regression analysis (MRA)
Model Summaryd
Model R R
Square
Adjusted
R Square
Std. Error
of the
Estimate
Change Statistics Durbin-
Watson R Square
Change
F Change df1 df2 Sig. F
Change
1 .500a .250 .248 .41364 .250 132.550 1 398 .000
2 .528b .279 .275 .40601 .029 16.090 1 397 .000
3 .547c .299 .294 .40090 .020 11.197 1 396 .001 1.389
a. Predictors: (Constant), Service
b. Predictors: (Constant), Service, Destination
c. Predictors: (Constant), Service, Destination, Perceive
d. Dependent Variable: Revisit
ANOVAa
Model Sum of Squares df Mean Square F Sig.
1
Regression 22.679 1 22.679 132.550 .000b
Residual 68.097 398 .171
Total 90.776 399
2
Regression 25.332 2 12.666 76.833 .000c
Residual 65.445 397 .165
Total 90.776 399
3
Regression 27.131 3 9.044 56.270 .000d
Residual 63.645 396 .161
Total 90.776 399
a. Dependent Variable: Revisit
b. Predictors: (Constant), Service
c. Predictors: (Constant), Service, Destination
d. Predictors: (Constant), Service, Destination, Perceive

88
Coefficientsa
Model Unstandardized
Coefficients
Standardized
Coefficients
t Sig. Collinearity
statistics
B Std. Error Beta Tolerance VIF
1 (Constant) 2.377 .125 19.057 .000
Service .380 .033 .500 11.513 .000 1.000 1.000
2
(Constant) 2.037 .149 13.674 .000
Service .288 .040 .379 7.274 .000 .668 1.497
Destination .175 .044 .209 4.011 .000 .668 1.497
3
(Constant) 1.783 .166 10.773 .000
Service .254 .040 .335 6.288 .000 .626 1.598
Destination .154 .043 .184 3.530 .000 .654 1.530
Perceive .137 .041 .154 3.346 .001 .833 1.200
a. Dependent Variable: Revisit

APPENDIX 3
Plagiarism checking report

91