Embed Size (px)
Citation preview

The Real Summer Getaway:Escaping With Premium Video Content

2
Summer Reading List
Summer-y 3-4
Summer Activities: 5-12Understanding Seasonal Behaviors
Summertime TV Programming: 13-16Highlighting The Scope of Content
Summer TV Trends: 17-27Showcasing Season-long Stability
The Summer Solstice For TV Brands: 28-34Achieving A High Point Through Multi-screen TV
The Summer Social Scene: 35-41Examining TV’s Popularity In Online Conversations
Summer In The Cinema: 42-48Delivering Scale Among Younger Audiences
Contact Information 49
VAB: THE REAL SUMMER GETAWAY

3
Premium Video Content Provides The Habitual Escape And Relaxation That People Are Looking For During The Summer
Whether people are on vacation or at home this summer, one thing remains constant – people will actively seek out
premium video content, in the form of both multi-screen TV brands and theatrical movie releases, to escape and relax
from their daily lives.
Watching ad-supported TV and going to the local cineplex are the two most popular summer activities; they’re more
popular than going to the beach, barbecuing, taking a vacation or even dining out. Additionally, the evolution of near-
ubiquitous broadband connectivity has turned summer “reading lists” into summer “streaming lists” and have opened
up more video viewing occasions for people to watch their favorite TV shows when away from their living rooms.
But make no mistake, even in the summer, Television continues to represent the large majority of overall video
consumption. Between original programming, specials and sports, there is a wide breadth of summertime ad-supported
TV content available. Because of this, tune-in and reach of ad-supported TV shows a steadiness and stability in
relation to other time periods throughout the year, with only a minimal drop-off from a time spent perspective.
Also, due to the abundance of “live” TV content and near-weekly blockbuster theatrical releases, nothing gets people
talking online during the summer like ad-supported TV and cinema as both are some of the most popular topics that
trend on Twitter.
For those looking for millennials this summer, cinema delivers both a high reach and high concentration of those
looking to escape and relax with friends. In fact, the millennial audience composition of cinema is higher than
popular, targeted digital platforms like Snapchat, Instagram and YouTube.
With all the great original content available during the summer, it’s no surprise that people consider their time spent
with premium, multi-screen video to be their real summer getaway.
VAB: THE REAL SUMMER GETAWAY
4
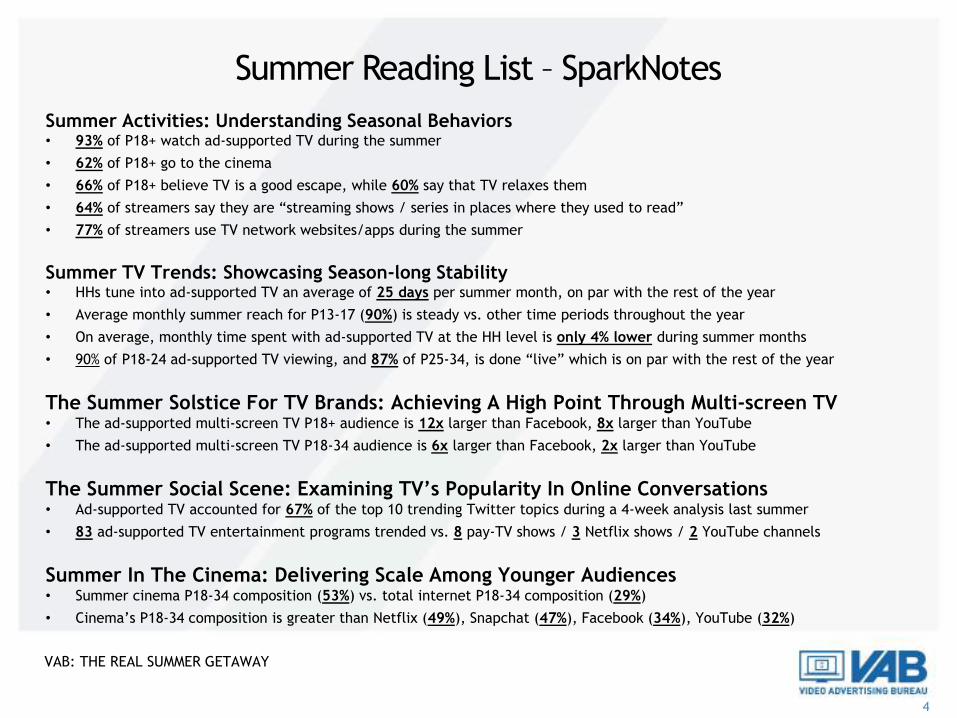
Summer Reading List – SparkNotes
Summer Activities: Understanding Seasonal Behaviors• 93% of P18+ watch ad-supported TV during the summer
• 62% of P18+ go to the cinema
• 66% of P18+ believe TV is a good escape, while 60% say that TV relaxes them
• 64% of streamers say they are “streaming shows / series in places where they used to read”
• 77% of streamers use TV network websites/apps during the summer
Summer TV Trends: Showcasing Season-long Stability• HHs tune into ad-supported TV an average of 25 days per summer month, on par with the rest of the year
• Average monthly summer reach for P13-17 (90%) is steady vs. other time periods throughout the year
• On average, monthly time spent with ad-supported TV at the HH level is only 4% lower during summer months
• 90% of P18-24 ad-supported TV viewing, and 87% of P25-34, is done “live” which is on par with the rest of the year
The Summer Solstice For TV Brands: Achieving A High Point Through Multi-screen TV• The ad-supported multi-screen TV P18+ audience is 12x larger than Facebook, 8x larger than YouTube
• The ad-supported multi-screen TV P18-34 audience is 6x larger than Facebook, 2x larger than YouTube
The Summer Social Scene: Examining TV’s Popularity In Online Conversations• Ad-supported TV accounted for 67% of the top 10 trending Twitter topics during a 4-week analysis last summer
• 83 ad-supported TV entertainment programs trended vs. 8 pay-TV shows / 3 Netflix shows / 2 YouTube channels
Summer In The Cinema: Delivering Scale Among Younger Audiences• Summer cinema P18-34 composition (53%) vs. total internet P18-34 composition (29%)
• Cinema’s P18-34 composition is greater than Netflix (49%), Snapchat (47%), Facebook (34%), YouTube (32%)
VAB: THE REAL SUMMER GETAWAY

5
Summer Activities: Understanding Seasonal Behaviors

6
Watching Ad-Supported TV & Going To The Local Cineplex Are The Two Most Popular Leisure Time Activities
Source: TV data based on VAB Analysis of Nielsen Npower R+F Time Period Report, P18+, 5/28/17-9/10/17, Live+7; Leisure Activities based on GFK MRI
2017 Doublebase, P18+
93%
62%
51%
29% 28%
13% 12% 11% 9%5% 5% 4%
Watched Ad-Supported TV
Went toCinema
Dining Out Barbecuing Went to theBeach
Visited Zoo Went to LiveTheater
Went to MusicPerformance
Picnic VisitedAquarium
Tailgating Went to Circus
Leisure Activities Participated In Last 12 Months*P18+
*except for “watched ad-supported TV” which only reflects viewership during summer months
VAB: THE REAL SUMMER GETAWAY

7
Only About Half Of All Americans Plan To Go Away OnA Summer Vacation
Source: Associated Press National Opinion Research Center Poll, 2017. Numbers may not equal 100% due to rounding. ; GfK MRI Doublebase 2017, P18+
Many people look to TV content as a much more affordable way to escape and relax• 66% of A18+ believe television is a good escape, while 60% say that TV relaxes them
Yes, 56% No, 43%
Are You Planning To Take A Summer Vacation?
23%
3%
11%
12%
49%
Other
Don't Like to Be Off Work
Can't Take Time Off Work
Intend to Vacation Another Time ofYear
Can't Afford the Cost
Why Not?
Go Away, 92%
Stay At Home, 8%
Destination
VAB: THE REAL SUMMER GETAWAY

8
Whether On Vacation Or At Home, Summer “Reading” Lists Have Evolved Into Summer “Streaming” Lists
Source: Miner & Co. Studio “Summer Streaming” 2016, Base: TV Viewers P18-59
• Thanks to streaming, more video viewing occasions – through both time and locations - have opened
up to the consumer and many are streaming more frequently and in spots where they used to read a
book during the summer
62% say they are “streaming shows / series during times they used to be reading”
64% say they are “streaming shows / series in places they used to read”
• From a platform perspective, 77% of streamers use TV network websites / apps over the summer
• When on vacation, people find streaming an integral part of their time away• 90% say that streaming shows gives them a sense of “me-time” where they can relax and decompress from other
pressures
• 75% say they talk more with their family and friends about the shows/series they’re streaming than the books
they’re reading
• 65% say they’re spending more quality time with family/friends because they’re streaming shows together
Inside the home Relaxing on the porch Lounging in the yard On the beach At a lake
VAB: THE REAL SUMMER GETAWAY

9
Network Shows Are The Most Popular TV Content Streamed On All The Major SVOD Services
74% 73%
57%
49%
74%
40%
74%
54%52%
Netflix Hulu Amazon Prime Video
TV Content Types Viewed on Netflix, Hulu & Amazon Prime Video
Network TV Series: Prior Seasons Network TV Series: Current Season Original TV Programs
Source: Kagan, a media research group within the TMT offering of 2018 S&P Global Market Intelligence. Results from an online consumer survey conducted in
September 2017, base: Netflix users – 1,480; Hulu users – 549; Amazon Prime Video users – 938. Question: You indicated that you currently have a
subscription to (online video service). Which of the following types of video content do you view from the service?
VAB: THE REAL SUMMER GETAWAY

10
Movies(29%)
Acquired Network TV
Series(35%)
Original TV Programs
(35%)
Other(1%)
Source: Kagan, a media research group within the TMT offering of 2018 S&P Global Market Intelligence. Results from an online consumer survey conducted in
September 2017, base: Netflix users – 1,480; Hulu users – 549; Amazon Prime Video users – 938. Question: Of the content you view on (online video service)
which would you say is the content you most enjoy viewing? “Movies” include recent movies (released within past 2 years) and older movies (released over 2
years ago). “Acquired Network TV Series” includes prior seasons of network TV series and current season of network TV episodes.
Movies(17%)
Acquired Network TV
Series(64%)
Original TV Programs
(17%)
Other(1%)
Movies(44%)
Acquired Network TV
Series(29%)
Original TV Programs
(25%)
Other(2%)
Content Most Enjoyed on Netflix, Hulu and Amazon Prime Video
Collectively, Subscribers Also Find Acquired Network TV Series To Be More Enjoyable Than Original Content On These Services
11
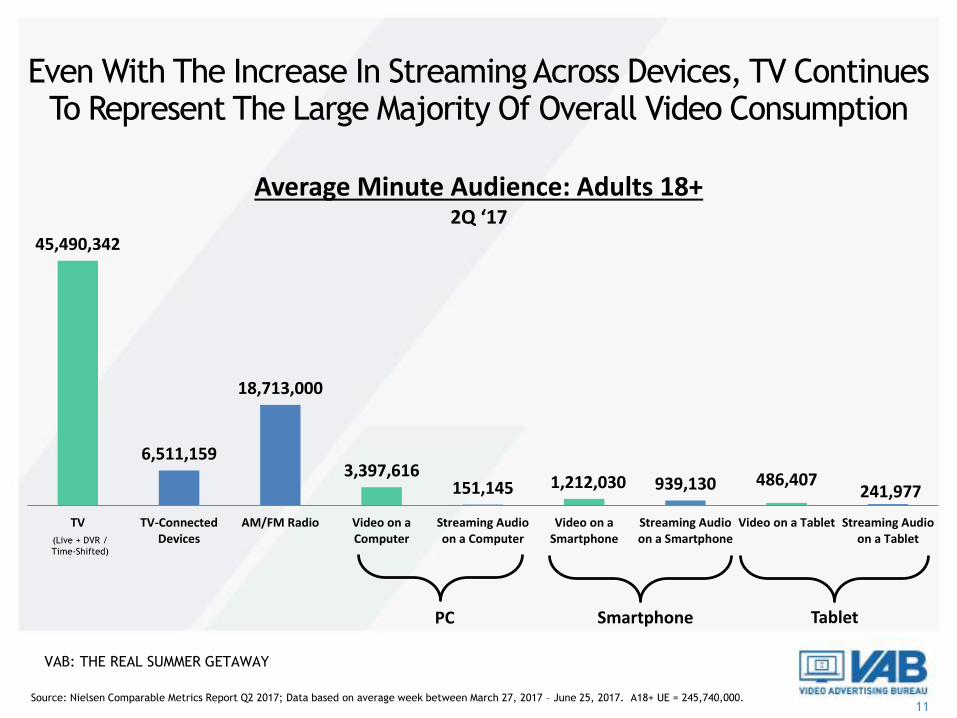
Even With The Increase In Streaming Across Devices, TV Continues To Represent The Large Majority Of Overall Video Consumption
Source: Nielsen Comparable Metrics Report Q2 2017; Data based on average week between March 27, 2017 – June 25, 2017. A18+ UE = 245,740,000.
45,490,342
6,511,159
18,713,000
3,397,616151,145 1,212,030 939,130 486,407
241,977
TV TV-ConnectedDevices
AM/FM Radio Video on aComputer
Streaming Audioon a Computer
Video on aSmartphone
Streaming Audioon a Smartphone
Video on a Tablet Streaming Audioon a Tablet
Average Minute Audience: Adults 18+2Q ‘17
PC Smartphone Tablet
(Live + DVR /
Time-Shifted)
VAB: THE REAL SUMMER GETAWAY

12Source: Nielsen Comparable Metrics Report Q2 2017; Data based on average week between March 27, 2017 – June 25, 2017. A18+ UE = 245,740,000.
6,994,535
3,203,017
4,577,000
1,316,261
53,857582,741 422,687 205,880
86,853
TV TV-ConnectedDevices
AM/FM Radio Video on aComputer
Streaming Audioon a Computer
Video on aSmartphone
Streaming Audioon a Smartphone
Video on a Tablet Streaming Audioon a Tablet
Average Minute Audience: Adults 18-342Q ‘17
PC Smartphone Tablet
(Live + DVR /
Time-Shifted)
TV Also Represents The Majority Of Overall Video Consumption Against Millennials As Well
VAB: THE REAL SUMMER GETAWAY

13
Summertime TV Programming: Highlighting The Scope Of Content
14
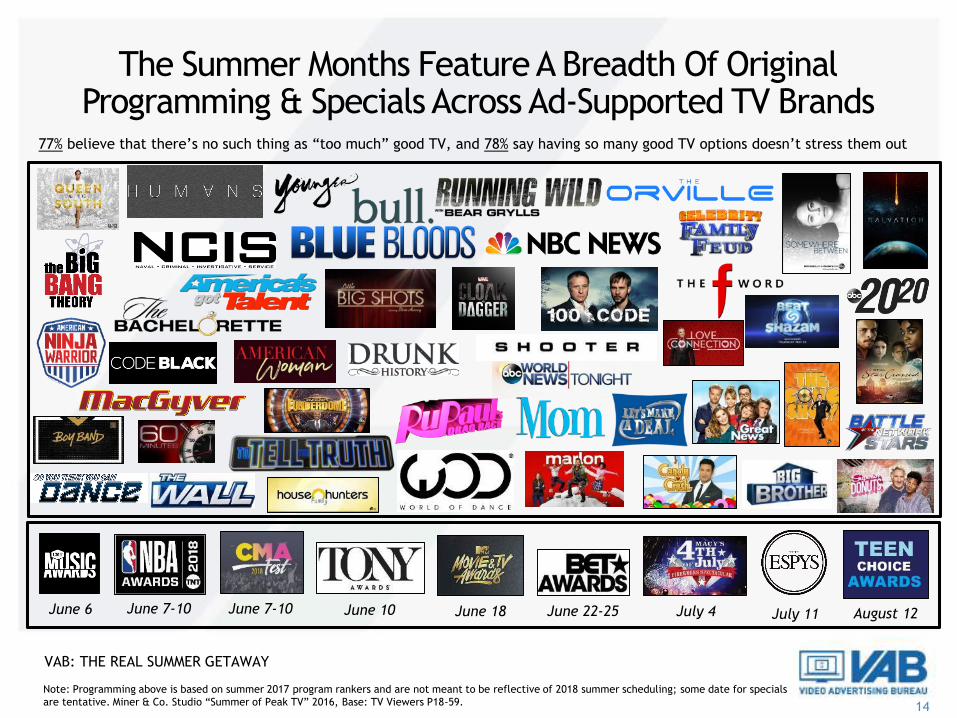
The Summer Months Feature A Breadth Of Original Programming & Specials Across Ad-Supported TV Brands
June 6 June 7-10 June 7-10 June 10 June 18 June 22-25 July 4 July 11 August 12
Note: Programming above is based on summer 2017 program rankers and are not meant to be reflective of 2018 summer scheduling; some date for specials
are tentative. Miner & Co. Studio “Summer of Peak TV” 2016, Base: TV Viewers P18-59.
77% believe that there’s no such thing as “too much” good TV, and 78% say having so many good TV options doesn’t stress them out
VAB: THE REAL SUMMER GETAWAY

15
Original Scripted & Reality Programming Is Complemented By Signature Sports Events Throughout The Summer
NFL Preseason (August)
NFL Season Kick-Off (9/6)
NBA Finals (5/31-7/17)
NBA Draft (6/21)
NCAA Football Kick-Off (8/25)
US Women’s Open (5/31-6/3)
US Open (6/11-17)
British Open (7/15-22)
PGA Championships (8/9-12)
Fedex Cup Playoffs (8/23-9/23)
World Cup (6/14-7/15)
Champions League Final (6/26)
MLS All-Star Game (8/1)
Summer X-Games (7/19-22)
French Open (5/27-6/10)
Wimbledon (7/2-15)
US Open (8/27-9/9)
Tour De France (7/7-7/29)
Belmont Stakes (6/9)
Stanley Cup Finals (June)
NBA Soccer Horse RacingGolf
NFLNHL
Tennis
CyclingExtreme Sports
NCAA Football
VAB: THE REAL SUMMER GETAWAY

16
In Addition To Signature Events, Several Sports Offer Continuity Across The Summer Months
Note: Some 2018 dates are tentative
Sport W1 W2 W3 W4 W1 W2 W3 W4 W5 W1 W2 W3 W4 W1 W2 W3 W4 W5
(9/6) NFL Season Kickoff
(7/16-17) Home Run Derby &All Star Game
(6/21) NBA Draft
(8/25) NCAA Season Kickoff
(5/31-6/3) US Womens Open (6/11-17) US Open (7/15-22) British Open (8/9-12) PGA Championship
(6/26) UEFA Champions League Final (7/15) World Cup Final (8/1) MLS All Star Game
(5/27-6/10) French Open (7/2-15) Wimbeldon (8/27-9/9) US Open
NFL
NASCARRegular Season Chase For The Cup
TennisATP Tour
NCAA FootballRegular Season
GolfRegular Tour Cup Playoffs
SoccerMLS Season World Cup MLS Season MLS & Premier League Season
MLBRegular Season
NBAFinals
NHLStanley Cup
June July August September
Pre-season Regular Season
VAB: THE REAL SUMMER GETAWAY

17
Summer TV Trends: Showcasing Season-long Stability

18
The Number Of Days That The Average Household Is Tuned Into TV Is Similar For Both Summer & Non-Summer Months
Source: VAB Analysis of Nielsen Npower Segmentation Report, Household, broadcast + cable TV, based on standard calendar months in 2017, Live+7
27
2426
25 2625 24
26 2526
25 26
Jan '17 Feb '17 Mar '17 Apr '17 May '17 Jun '17 Jul '17 Aug '17 Sep '17 Oct '17 Nov '17 Dec '17
Average # of Days Tuned Into Ad-Supported TVHouseholds
Annual Monthly Average
25
VAB: THE REAL SUMMER GETAWAY

19
The Close Similarity In The Number Of Tune-In Days During Summer & Non-Summer Months Holds True Across Demos
Source: VAB Analysis of Nielsen Npower Segmentation Report, broadcast + cable TV, based on standard calendar months in 2017, Live+7
14 13
18
22
13 13
17
21
13 13
18
22
P13-17 P18-24 P25-34 P35-49
Average # of Days Tuned Into Ad-Supported TVBased on Monthly Average
Jan '17 - May '17 Jun '17 - Sep '17 Oct '17 - Dec '17
Monthly average Monthly average Monthly average
VAB: THE REAL SUMMER GETAWAY

20
Source: VAB analysis of Nielsen NPower R+F Time Period Report, Household, Total Day, broadcast + cable TV, based on standard calendar months in 2017,
Live+7
Monthly Household Reach Remains Steady During Summer Months Compared To Non-Summer Months
97% 96% 96% 96% 96% 96% 95% 96% 96% 96% 96% 96%
Jan '17 Feb '17 Mar '17 Apr '17 May '17 Jun '17 Jul '17 Aug '17 Sep '17 Oct '17 Nov '17 Dec '17
Ad-Supported TV Monthly Reach (Total Day)Households
Annual Monthly Average
96%
VAB: THE REAL SUMMER GETAWAY

21Source: VAB analysis of Nielsen Npower R+F Time Period Report, Total Day, broadcast + cable TV, based on standard calendar months in 2017, Live+7
Monthly Reach Also Holds Relatively Steady Across Demos During Summer & Non-Summer Months
91%
85%
89%
95%
90%
83%
86%
94%
91%
84%
88%
94%
P13-17
P18-24
P25-34
P35-49
Ad-Supported TV Monthly Reach (Total Day)Based on Monthly Average
Jan '17 - May '17 Jun '17 - Sep '17 Oct '17 - Dec '17Monthly average Monthly average Monthly average
VAB: THE REAL SUMMER GETAWAY
22Source: VAB analysis of Nielsen Npower R+F Time Period Report, Live+SD, Total Day, broadcast + cable TV, based on 2017 dates, Live+SD.
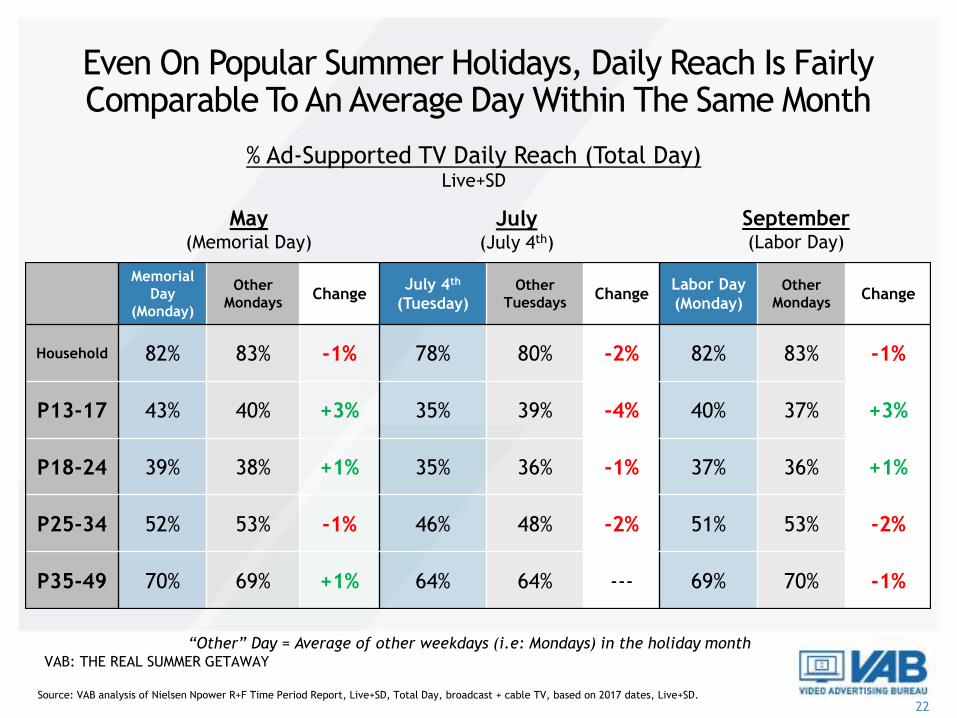
Even On Popular Summer Holidays, Daily Reach Is Fairly Comparable To An Average Day Within The Same Month
Memorial
Day
(Monday)
Other
MondaysChange
July 4th
(Tuesday)
Other
TuesdaysChange
Labor Day
(Monday)
Other
MondaysChange
Household 82% 83% -1% 78% 80% -2% 82% 83% -1%
P13-17 43% 40% +3% 35% 39% -4% 40% 37% +3%
P18-24 39% 38% +1% 35% 36% -1% 37% 36% +1%
P25-34 52% 53% -1% 46% 48% -2% 51% 53% -2%
P35-49 70% 69% +1% 64% 64% --- 69% 70% -1%
“Other” Day = Average of other weekdays (i.e: Mondays) in the holiday month
% Ad-Supported TV Daily Reach (Total Day)Live+SD
May(Memorial Day)
July(July 4th)
September(Labor Day)
VAB: THE REAL SUMMER GETAWAY
23
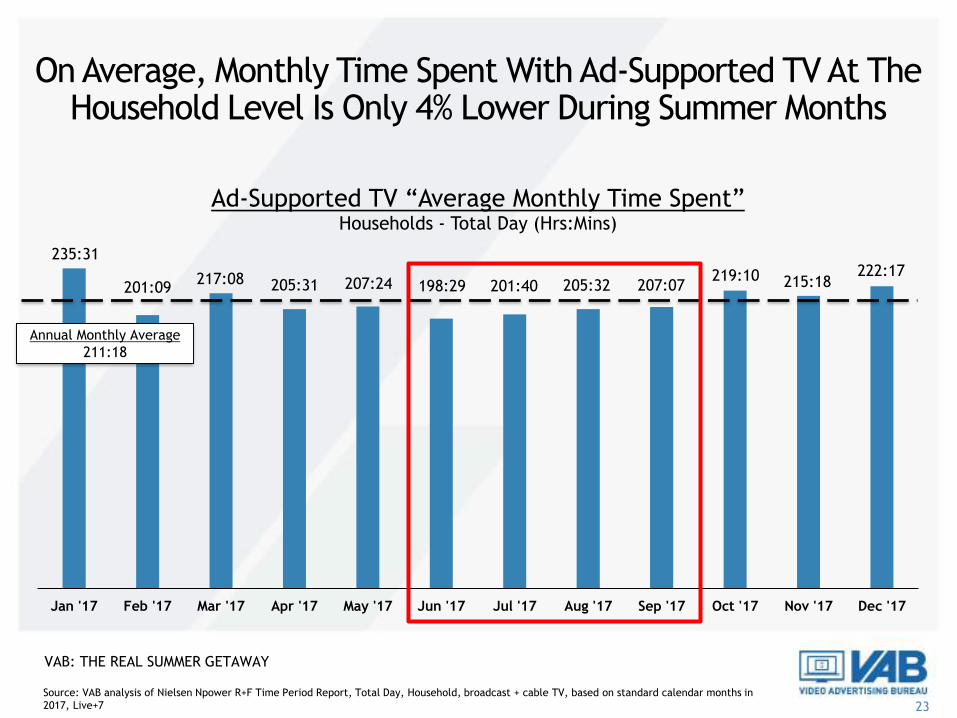
On Average, Monthly Time Spent With Ad-Supported TV At The Household Level Is Only 4% Lower During Summer Months
Source: VAB analysis of Nielsen Npower R+F Time Period Report, Total Day, Household, broadcast + cable TV, based on standard calendar months in
2017, Live+7
Jan '17 Feb '17 Mar '17 Apr '17 May '17 Jun '17 Jul '17 Aug '17 Sep '17 Oct '17 Nov '17 Dec '17
Ad-Supported TV “Average Monthly Time Spent”Households - Total Day (Hrs:Mins)
Annual Monthly Average
211:18
235:31
201:09217:08 205:31 207:24 198:29 201:40 205:32 207:07
219:10 215:18222:17
VAB: THE REAL SUMMER GETAWAY

24Source: VAB analysis of Nielsen Npower R+F Time Period Report, Total Day, broadcast + cable TV, based on standard calendar months in 2017, Live+7
On A Demo Basis, Monthly Time Spent Is Only 6% Lower On Average During The Summer Vs. Winter Months
P13-17
P18-24
P25-34
P35-49
Ad-Supported TV “Average Monthly Time Spent”Based on Monthly “Total Day” Average (Hrs:Mins)
Jan '17 - May '17 Jun '17 - Sep '17 Oct '17 - Dec '17
Monthly average Monthly average Monthly average
34:4733:5933:24
43:31
41:4042:56
67:57
61:5566:24
99:3491:23
101:00
VAB: THE REAL SUMMER GETAWAY
25
Source: VAB analysis of Nielsen Npower R+F Time Period Report, Live+SD, Total Day, broadcast + cable TV, based on standard calendar months in 2017,
Live+SD.
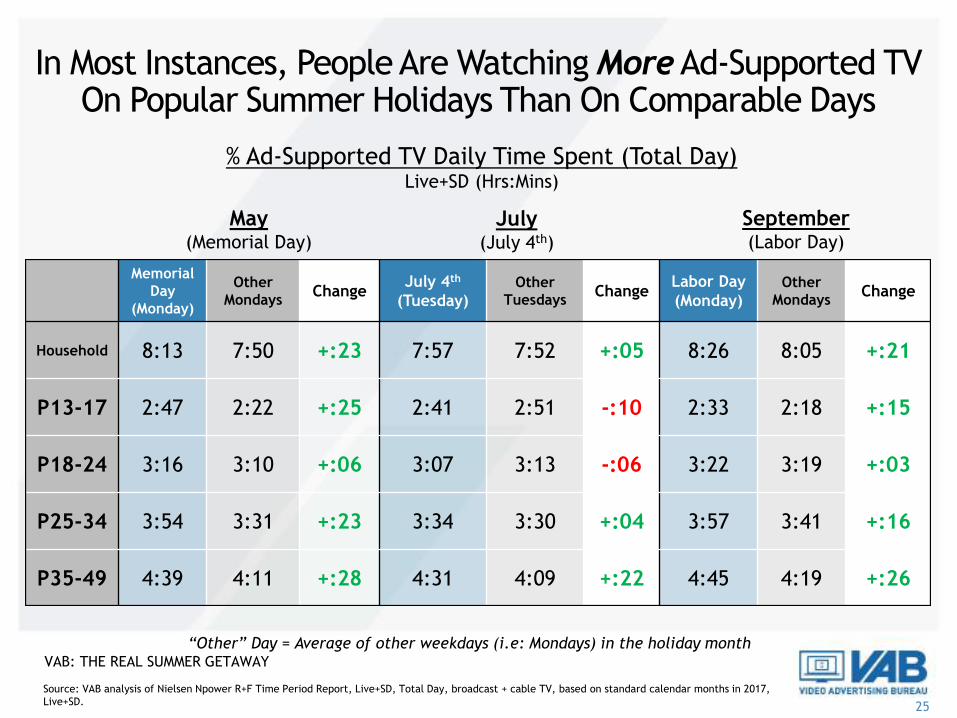
In Most Instances, People Are Watching More Ad-Supported TV On Popular Summer Holidays Than On Comparable Days
Memorial
Day
(Monday)
Other
MondaysChange
July 4th
(Tuesday)
Other
TuesdaysChange
Labor Day
(Monday)
Other
MondaysChange
Household 8:13 7:50 +:23 7:57 7:52 +:05 8:26 8:05 +:21
P13-17 2:47 2:22 +:25 2:41 2:51 -:10 2:33 2:18 +:15
P18-24 3:16 3:10 +:06 3:07 3:13 -:06 3:22 3:19 +:03
P25-34 3:54 3:31 +:23 3:34 3:30 +:04 3:57 3:41 +:16
P35-49 4:39 4:11 +:28 4:31 4:09 +:22 4:45 4:19 +:26
% Ad-Supported TV Daily Time Spent (Total Day)Live+SD (Hrs:Mins)
May(Memorial Day)
July(July 4th)
September(Labor Day)
“Other” Day = Average of other weekdays (i.e: Mondays) in the holiday month VAB: THE REAL SUMMER GETAWAY
26Source: VAB analysis of Nielsen NPower R+F Time Period Report, all TV Households, Total Day, broadcast + cable TV, based on standard calendar months in
2017, Live & Live+7
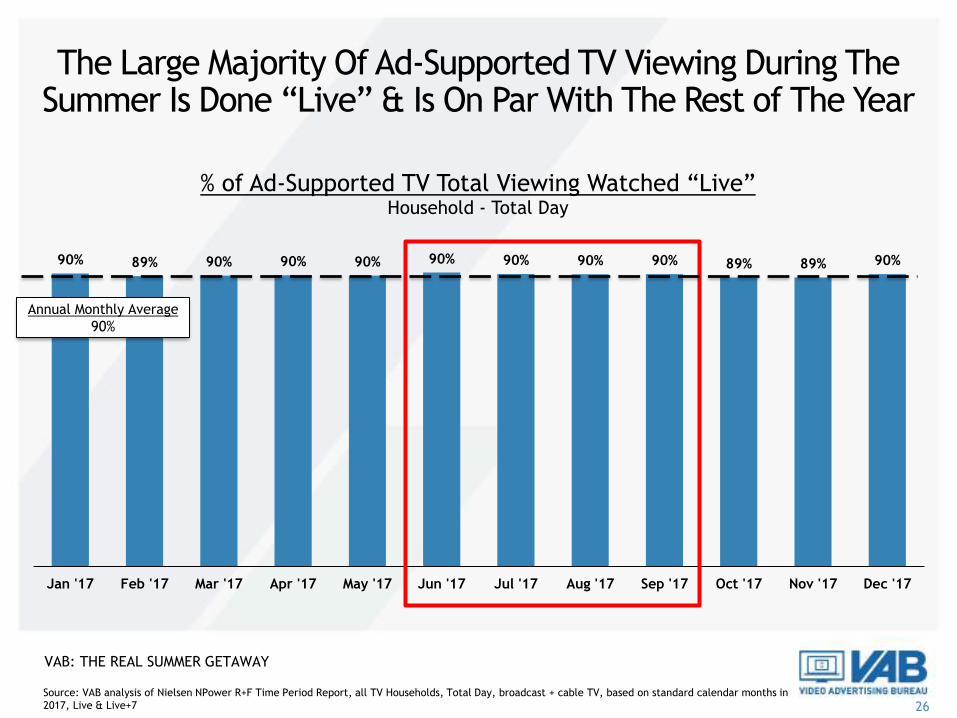
The Large Majority Of Ad-Supported TV Viewing During The Summer Is Done “Live” & Is On Par With The Rest of The Year
90% 89% 90% 90% 90% 90% 90% 90% 90% 89% 89% 90%
Jan '17 Feb '17 Mar '17 Apr '17 May '17 Jun '17 Jul '17 Aug '17 Sep '17 Oct '17 Nov '17 Dec '17
% of Ad-Supported TV Total Viewing Watched “Live”Household - Total Day
Annual Monthly Average
90%
VAB: THE REAL SUMMER GETAWAY
27
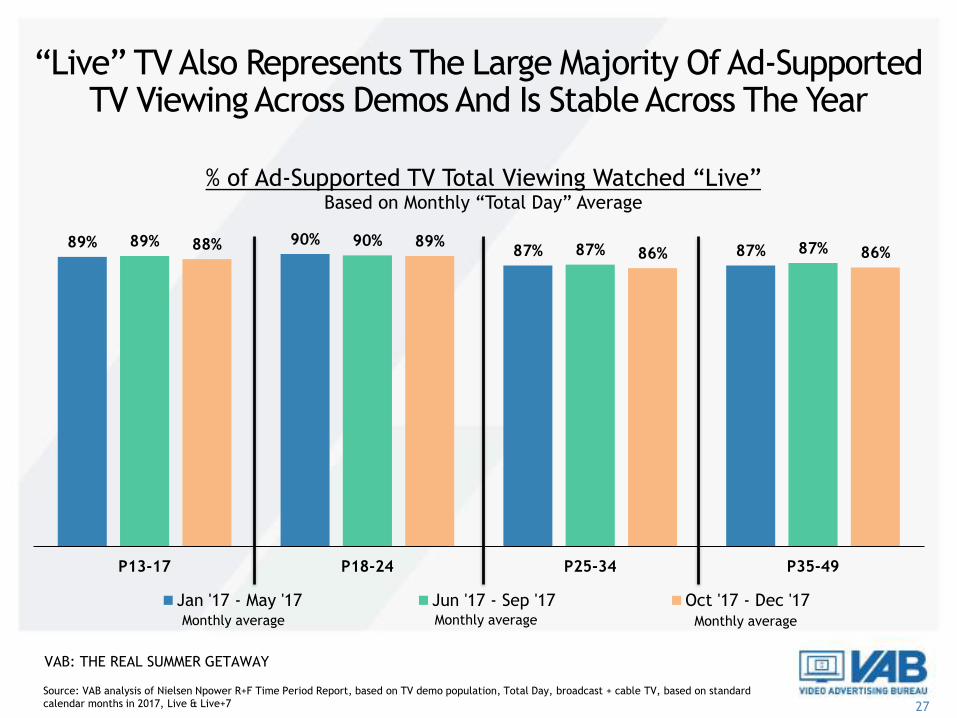
Source: VAB analysis of Nielsen Npower R+F Time Period Report, based on TV demo population, Total Day, broadcast + cable TV, based on standard
calendar months in 2017, Live & Live+7
89% 90%87% 87%
89% 90%87% 87%88% 89%
86% 86%
P13-17 P18-24 P25-34 P35-49
% of Ad-Supported TV Total Viewing Watched “Live” Based on Monthly “Total Day” Average
Jan '17 - May '17 Jun '17 - Sep '17 Oct '17 - Dec '17Monthly average Monthly average Monthly average
“Live” TV Also Represents The Large Majority Of Ad-Supported TV Viewing Across Demos And Is Stable Across The Year
VAB: THE REAL SUMMER GETAWAY

28
The Summer Solstice For TV Brands:
Achieving A High Point Through
Multi-screen TV
29
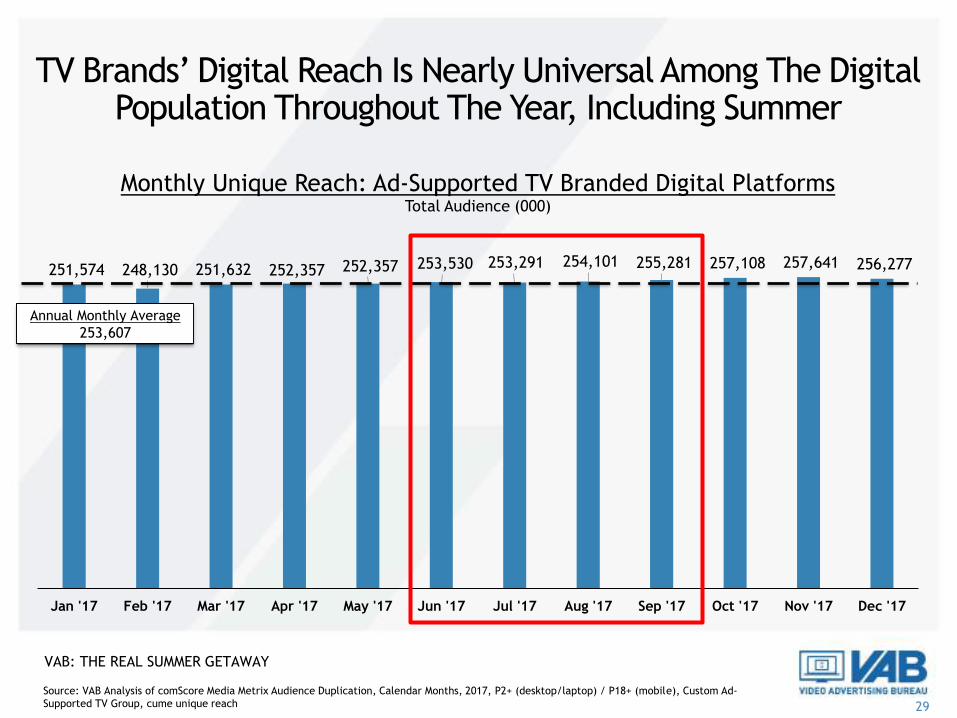
TV Brands’ Digital Reach Is Nearly Universal Among The Digital Population Throughout The Year, Including Summer
Source: VAB Analysis of comScore Media Metrix Audience Duplication, Calendar Months, 2017, P2+ (desktop/laptop) / P18+ (mobile), Custom Ad-
Supported TV Group, cume unique reach
251,574 248,130 251,632 252,357 252,357 253,530 253,291 254,101 255,281 257,108 257,641 256,277
Jan '17 Feb '17 Mar '17 Apr '17 May '17 Jun '17 Jul '17 Aug '17 Sep '17 Oct '17 Nov '17 Dec '17
Monthly Unique Reach: Ad-Supported TV Branded Digital PlatformsTotal Audience (000)
Annual Monthly Average
253,607
VAB: THE REAL SUMMER GETAWAY
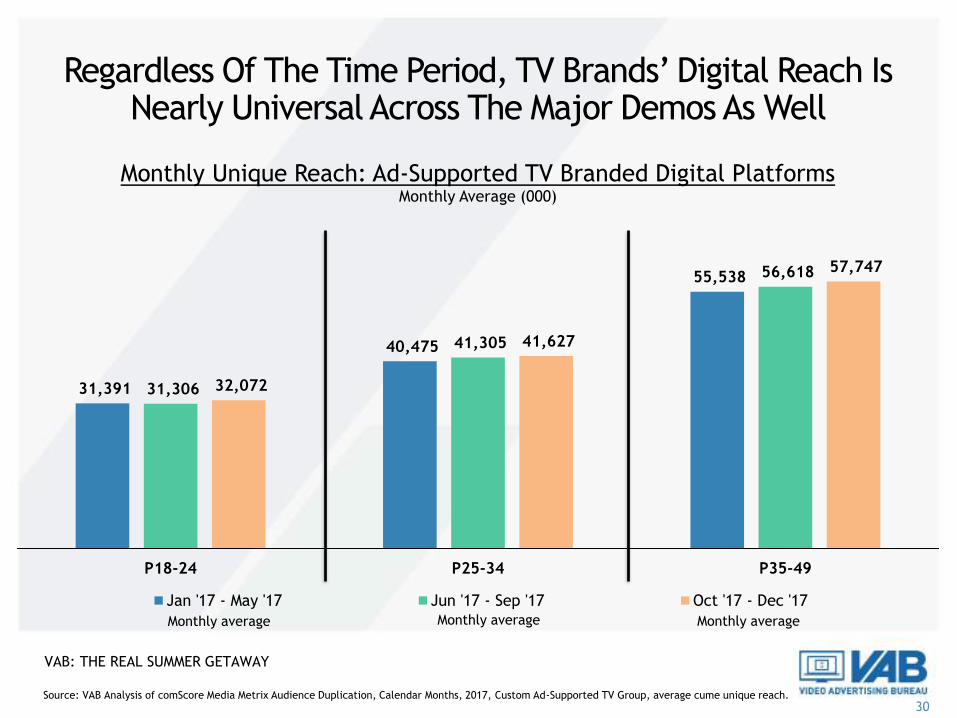
30Source: VAB Analysis of comScore Media Metrix Audience Duplication, Calendar Months, 2017, Custom Ad-Supported TV Group, average cume unique reach.
31,391
40,475
55,538
31,306
41,305
56,618
32,072
41,627
57,747
P18-24 P25-34 P35-49
Monthly Unique Reach: Ad-Supported TV Branded Digital PlatformsMonthly Average (000)
Jan '17 - May '17 Jun '17 - Sep '17 Oct '17 - Dec '17
Monthly average Monthly average Monthly average
Regardless Of The Time Period, TV Brands’ Digital Reach Is Nearly Universal Across The Major Demos As Well
VAB: THE REAL SUMMER GETAWAY

31
There Is A Thirst For Online TV Content During The Summer As Many Supported TV Brands Rank In The Top 5 Across Most Major Genres
Sports
Adam4Adam
Queerty
Here Media
Hearst Lifestyle
Houzz
CafeMedia Home
Hometalk
AccuWeather
WeatherBug
Yahoo Weather
MSN Weather
HBONow
Allrecipes
MSN Food & Drink
TotallyKidz
PBS Kids
Sports LGBTQ TV Entertainment - Black General News
Home Weather TV Entertainment KidsFood
Finance News
MSN Money
Dow Jones
Yahoo Finance
Top 5 Rank by Internet Genre: August 2017
Total Audience
Online Buddies
Bon Appetit
CafeMedia Food
Source: VAB analysis of Media Metrix multi-platform comScore data, August 2017 (Ranking based on “Total Minutes Viewed”), P2+ (desktop/laptop) /
P18+ (mobile)
Roblox
VAB: THE REAL SUMMER GETAWAY

32
Sports
Resignation Media
9GAG
HBO Now
Buzzfeed
Talemetry
CafeMedia Home
WeatherBug
MSN Weather
Yahoo Weather HBO Now
Allrecipes
Bon Appetit
CafeMedia Food
Time Inc Food
Roblox
Totally Kidz
PBS Kids
Sports Comedy TV Entertainment - Black General News
Home Weather TV Entertainment KidsFood
LGBTQ
Queerty
Here Media
Top 5 Rank by Internet Genre: August 2017
A18-34
EBaumsworld
Adam4Adam
Totally LGBT
Source: VAB analysis of Media Metrix multi-platform comScore data, August 2017 (Ranking based on “Total Minutes Viewed”)
Houzz
AccuWeather
Electus
Hearst
This Thirst For Online TV Content During The Summer Holds True For Millennials As Well
VAB: THE REAL SUMMER GETAWAY
33
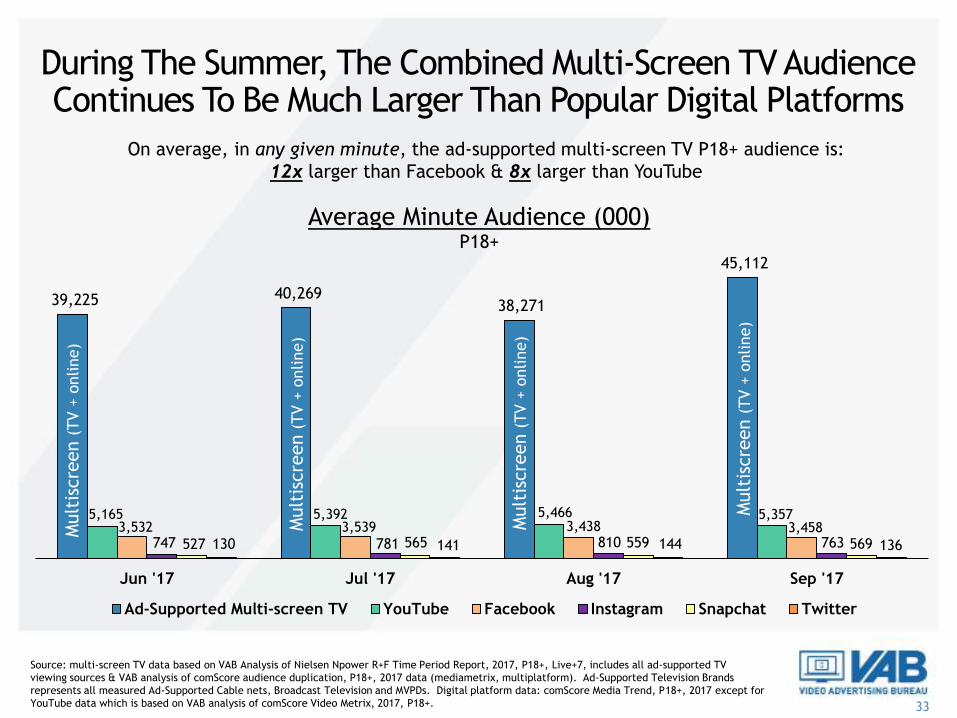
During The Summer, The Combined Multi-Screen TV Audience Continues To Be Much Larger Than Popular Digital Platforms
Source: multi-screen TV data based on VAB Analysis of Nielsen Npower R+F Time Period Report, 2017, P18+, Live+7, includes all ad-supported TV
viewing sources & VAB analysis of comScore audience duplication, P18+, 2017 data (mediametrix, multiplatform). Ad-Supported Television Brands
represents all measured Ad-Supported Cable nets, Broadcast Television and MVPDs. Digital platform data: comScore Media Trend, P18+, 2017 except for
YouTube data which is based on VAB analysis of comScore Video Metrix, 2017, P18+.
39,225 40,26938,271
45,112
5,165 5,392 5,466 5,357 3,532 3,539 3,438 3,458
747 781 810 763 527 565 559 569 130 141 144 136
Jun '17 Jul '17 Aug '17 Sep '17
Average Minute Audience (000)P18+
Ad-Supported Multi-screen TV YouTube Facebook Instagram Snapchat Twitter
Mult
iscre
en (
TV +
online)
Mult
iscre
en (
TV +
online)
Mult
iscre
en (
TV +
online)
Mult
iscre
en (
TV +
online)
On average, in any given minute, the ad-supported multi-screen TV P18+ audience is:
12x larger than Facebook & 8x larger than YouTube

34
Source: multi-screen TV data based on VAB Analysis of Nielsen Npower R+F Time Period Report, 2017, P18-34, Live+7, includes all ad-supported TV viewing
sources & VAB analysis of comScore audience duplication, P18-34, 2017 data (mediametrix, multiplatform). Ad-Supported Television Brands represents all
measured Ad-Supported Cable nets, Broadcast Television and MVPDs. Digital platform data: comScore Media Trend, P18-34, 2017 except for YouTube data
which is based on VAB analysis of comScore Video Metrix, 2017, P18-34.
5,711 5,8765,684
6,596
2,580 2,687 2,735 2,672
1,132 1,114 1,045 1,034
557 598 641 595 469 503 506 513
72 80 79 75
Jun '17 Jul '17 Aug '17 Sep '17
Average Audience (000)P18-34
Ad-Supported Multi-screen TV YouTube Facebook Instagram Snapchat Twitter
Mult
iscre
en (
TV +
online)
Mult
iscre
en (
TV +
online)
Mult
iscre
en (
TV +
online)
Mult
iscre
en (
TV +
online)
Against Millennials, The Multi-Screen TV Audience Is Also Much Larger Than Popular Digital Platforms During The Summer
On average, in any given minute, the ad-supported multi-screen TV P18-34 audience is:
6x larger than Facebook & over 2x larger than YouTube

35
The Summer Social Scene:Examining TV’s Popularity In Online
Conversations

36
8:30p
Total % of
TV-topics In
Top 10: 50%
9:30p
Total % of
TV-topics In
Top 10: 70%
10:30p
Total % of
TV-topics In
Top 10: 76%
11:30p
Total % of
TV-topics In
Top 10: 72%
Nothing Gets People Talking Online Like Ad-Supported TV;It’s The Most Popular Type Of Trending Topic During The Summer
Source: VAB custom analysis of Top 10 trending Twitter Topics each night (8:30p, 9:30p, 10:30p, 11:30p) aggregated during 4-week time period
(5/15/2017 – 6/11/2017). Results include both “direct” and “related” TV topics.
Although this analysis was conducted as the summer season was getting underway between May-June,
ad-supported TV continued to dominate the top social conversations on Twitter
Ad-Supported TV accounted for Nearly 7 Of The Top 10 trending Twitter topics through a
four-week primetime period in early summer last year (May ’17 / June ‘17)
67%Overall Total % of TV-topics
in Top 10 During Primetime
VAB: THE REAL SUMMER GETAWAY

37
There Was Virtually No Difference In TV’s Social Popularity Between May And The Post Memorial Day Time Period
Source: VAB custom analysis of Top 10 trending Twitter Topics each night (8:30p, 9:30p, 10:30p, 11:30p) during 4-week time period
(5/15/2017 – 6/11/2017). Pre-Memorial Day Weekend = 5/15 – 5/25; Memorial Day Weekend & Beyond = 5/26 – 6/11; Memorial Day
Weekend = Friday, 5/26 – Monday, 5/29. Results include both “direct” and “related” TV topics.
Ad-Supported TV Topic
68%
Other
32%
Ad-Supported TV Topic
66%
Other
34%
May - Pre-Memorial Day Weekend(May 15th – May 25th)
Memorial Day Weekend - June(May 26th – June 11th)
TV-related topics dominated social conversations both before and after the first summer holiday;
Television even held a majority of the top trending topics during Memorial Day Weekend itself
Topic Breakout: Overall Total % of Top 10 Trending Twitter Topics
Memorial Day
Weekend:
58%
VAB: THE REAL SUMMER GETAWAY
38
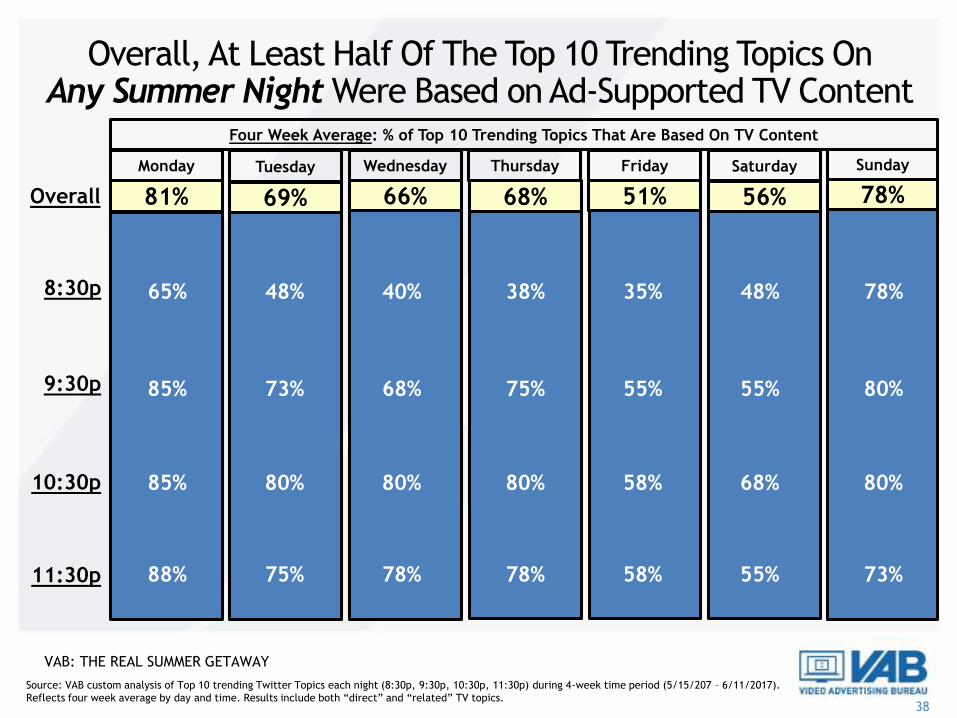
81% 69% 66% 68% 51% 56% 78%
Monday Tuesday Wednesday Thursday Friday Saturday Sunday
Overall
8:30p
9:30p
10:30p
11:30p
Overall, At Least Half Of The Top 10 Trending Topics OnAny Summer Night Were Based on Ad-Supported TV Content
65% 48% 40% 38% 35% 48% 78%
Four Week Average: % of Top 10 Trending Topics That Are Based On TV Content
85% 73% 68% 75% 55% 55% 80%
85% 80% 80% 80% 58% 68% 80%
88% 75% 78% 78% 58% 55% 73%
Source: VAB custom analysis of Top 10 trending Twitter Topics each night (8:30p, 9:30p, 10:30p, 11:30p) during 4-week time period (5/15/207 – 6/11/2017).
Reflects four week average by day and time. Results include both “direct” and “related” TV topics.
VAB: THE REAL SUMMER GETAWAY

39
Sports & Entertainment Both Account For A Large Portion Of The Total Ad-Supported TV Topics That Trended In The Top 10
Four-Week Time PeriodGenre % Breakout of Top 10 Ad-Supported TV Trending Topics
Entertainment40%
News4%
Sports56%
Source: VAB custom analysis of Top 10 trending Twitter Topics each night (8:30p, 9:30p, 10:30p, 11:30p) aggregated during 4-week time period
(5/15/2017 – 6/11/2017). Results include both “direct” and “related” TV topics.
VAB: THE REAL SUMMER GETAWAY

40
Over 126 TV Programs Trended During The Four Week Analysis Which Speaks To The Breadth Of Summer Programming
Source: VAB custom analysis of Top 10 trending Twitter Topics each night (8:30p, 9:30p, 10:30p, 11:30p) during 4-week time period (5/15/2017 –
6/11/2017). Results include both “direct” and “related” TV topics.
VAB: THE REAL SUMMER GETAWAY

41
11112222345588
83
RadioFacebookLive
TwitchSnapchatOtherStreaming
Online RadioPPVYouTubeNetflixOther SVODVideo GamesMoviesMusicPay-TVAd-SupportedTV
(UFC Fight Pass, WWE Network)
Ad-Supported TV Owns The Summer Social Space When It Comes To Conversations Around Entertainment Content
Four-Week Time Period# of Top 10 Trending Entertainment Programs / Content By Platform
Interestingly, two of the three Netflix shows that trended in the Top 10 on Twitter did so because the
streaming service announced their cancellation (The Get Down & Sense8)
Source: VAB custom analysis of Top 10 trending Twitter Topics each night (8:30p, 9:30p, 10:30p, 11:30p) during 4-week time period (5/15/2017 – 6/11/2017).
Based on unique program counts. For the purposes of this chart, “program / content” is an all-encompassing definition for individual pieces of content on each
platform (albums & singles for music, video games, channel on YouTube, live streaming and/or personality on a social media platform, etc).
(HBO, Showtime,
Starz)
Other platform “program” highlights: Netflix – House of Cards, Sense8, The Get Down; Music – T-Wayne, Rake It Up; Online Radio – Most Requested Live (iHeart Radio);
YouTube – Car Boys; HBO – HBO Boxing, Mommy Dead & Dearest, Real Time with Bill Maher, The Leftovers; Showtime – Twin Peaks; Starz – American Gods; PPV – UFC 212;
Facebook Live – CFDAAwards; Snapchat – Ask Ethan & Grayson; WWE Network – WWE Backlash; Video Games – Injustice 2, Life Is Strange 2; Other streaming – E3

42
Summer In The Cinema:Delivering Scale Among Younger
Audiences

43
People Can’t Wait To Share Their Excitement Online When They Hear About Movie-Related Content & Subjects
Source: VAB custom analysis of Top 10 trending Twitter Topics each night (8:30p, 9:30p, 10:30p, 11:30p) during 4-week time period (5/15/2017 – 6/11/2017).
New Trailer
Released
Cast & Crew
Announcements
Production
Announcements
Fri, June 9th –
Marvel
releases the
new trailer for
Black Panther_____________
Black Panther
is #1 trending
topic at Twitter
during the
10:30p period
Special Premieres
Thurs, June 8th –
Chris Brown:
Welcome To My
Life is shown in
theatres for one
night only_____________
#WelcomeToMyLife
trends in the top
10 that night
(reaches #6)
Tues, May 23rd – Tom Cruise
tells an Australian talk show
that Top Gun 2 will be filming
in the next year._____________
Top Gun 2 trends in the top 10
throughout the night (reaches #4)
Fri, May 19th –
Tom Hardy
announced as
Venom in a
new Spiderman
spinoff movie_____________
Tom Hardy
trends in the top
10 that night
(reaches #6)
Examples of movie topics that trended in the top 10 on Twitter during early summer 2017
VAB: THE REAL SUMMER GETAWAY

44
58%62% 60%
54%
P18-24 P25-34 P18-34 P18-49
Cinema Reach During Summer Months (2017)(000)
Cinema Delivers High Reach In Key Demographics During The Summer
Source: VAB Analysis of Nielsen Media Impact, Cinema = NCM & Screenvision, 5/28/17-9/10/17. Reach vs. demo population.
VAB: THE REAL SUMMER GETAWAY
45
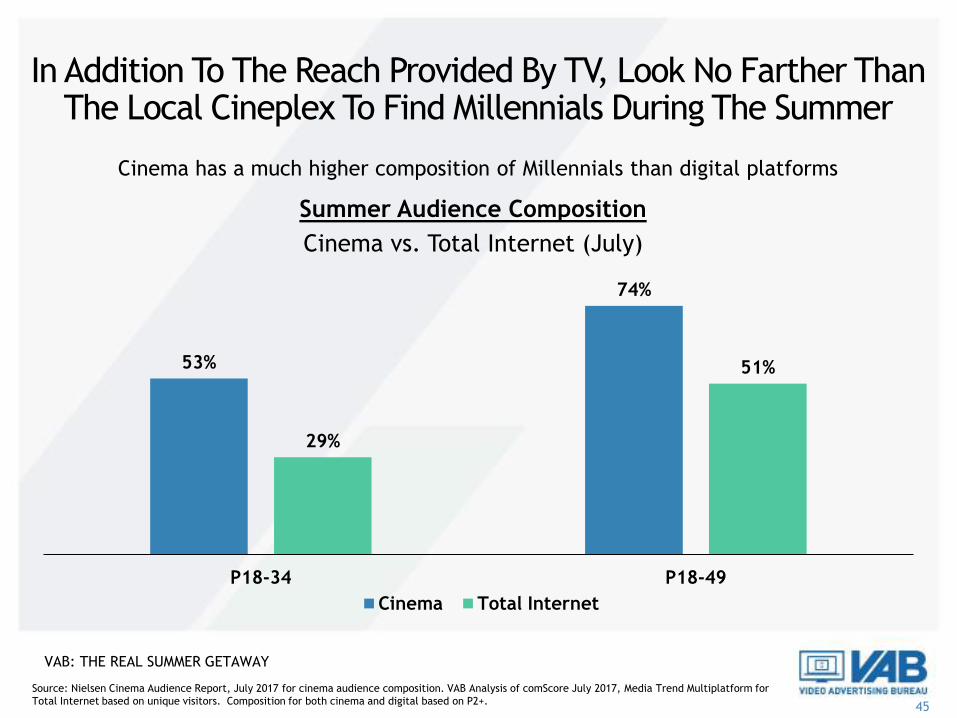
Summer Audience Composition
Cinema vs. Total Internet (July)
In Addition To The Reach Provided By TV, Look No Farther Than The Local Cineplex To Find Millennials During The Summer
Source: Nielsen Cinema Audience Report, July 2017 for cinema audience composition. VAB Analysis of comScore July 2017, Media Trend Multiplatform for
Total Internet based on unique visitors. Composition for both cinema and digital based on P2+.
Cinema has a much higher composition of Millennials than digital platforms
53%
74%
29%
51%
P18-34 P18-49
Cinema Total Internet
VAB: THE REAL SUMMER GETAWAY

46
54.5% 53.4% 52.5%
49.0%47.1%
43.7%42.0%
40.0% 39.7% 39.3% 38.2% 38.2%36.7%
33.9% 33.9%32.4%
Buzzfeed Reddit Cinema Netflix Snapchat Instagram Pandora Wikipedia TMZ Craigslist Twitter Yelp Pinterest Amazon Facebook YouTube
Cinema Provides Both Scale & High Concentration Of Millennials In Comparison To The Most Popular & Targeted Digital Platforms
P18-34 Audience Composition
Cinema vs. Select Digital Platforms (25MM+ P18-34 UVs)
Source: Nielsen Media Impact, July 2017 for unique cinema reach P18-34 (25MM+); Nielsen Cinema Audience Report, July 2017 for cinema audience composition.
comScore July 2017, mediametrix multiplatform for we domains (excluding Snapchat which was pulled at the property level). P18-34 composition for both cinema
and digital based on total measured audience of each platform.
VAB: THE REAL SUMMER GETAWAY
47
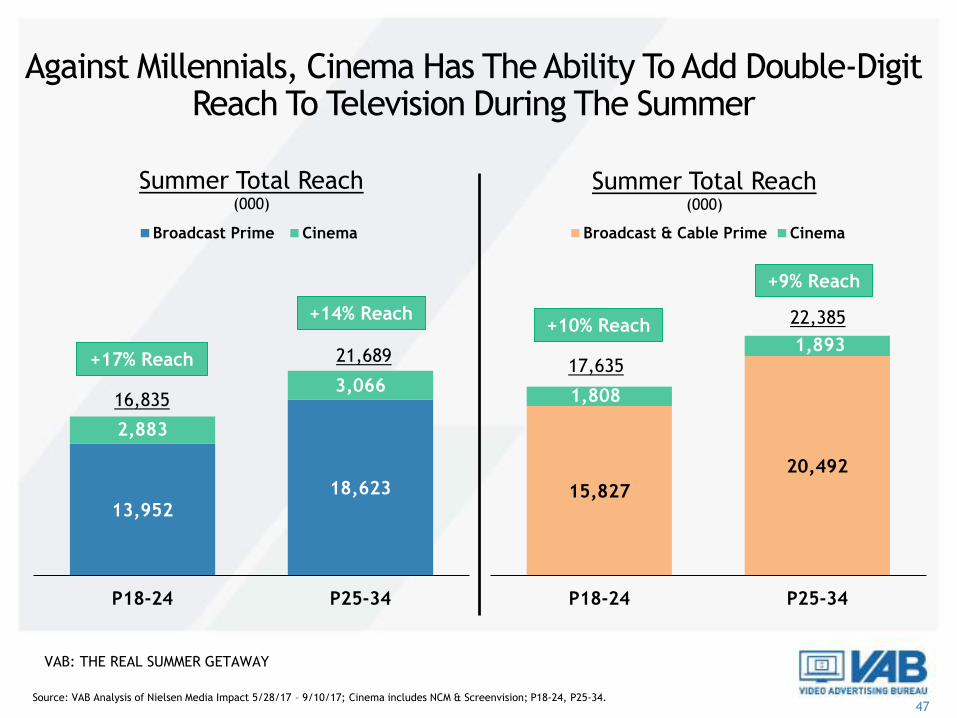
Against Millennials, Cinema Has The Ability To Add Double-Digit Reach To Television During The Summer
Source: VAB Analysis of Nielsen Media Impact 5/28/17 – 9/10/17; Cinema includes NCM & Screenvision; P18-24, P25-34.
13,952
18,623
2,883
3,066
P18-24 P25-34
Summer Total Reach(000)
Broadcast Prime Cinema
15,827
20,492
1,808
1,893
P18-24 P25-34
Summer Total Reach(000)
Broadcast & Cable Prime Cinema
16,835
21,689+17% Reach
+14% Reach
17,635
22,385+10% Reach
+9% Reach
VAB: THE REAL SUMMER GETAWAY

48
Big Theatrical Releases Are Slated Throughout Summer 2018 Featuring Top Stars & Popular Franchises
Note: Some release dates are tentative
May 25 June 8 June 15 June 22
June 29 June 29 July 4 July 6
July 13 July 27 August 3July 20
VAB: THE REAL SUMMER GETAWAY

49


![[Globant Summer Take Over] Apple Tv Development](https://img.pdfslide.us/doc/110x75/58aa4a631a28ab4c348b6c05/globant-summer-take-over-apple-tv-development.jpg)