Embed Size (px)
Citation preview
VAB REPORT: FEEL THE BURN: HOT SUMMER TV VIEWING
TV’S REACH YEARLY TRENDS BY DAY LIVE V. TIMESHIFTED PLAYBACK BY AGE OTHER DAYPARTS PROGRAMMING 2016 PROGRAMS AD IMPRESSIONS MOBILE VIEWING BY PLATFORM

Television’s Powerful Reach Extends Into the Summer Months
97% 97% 96% 96% 97% 97%
93% 94% 94% 94%95% 96% 96% 97%
2015 TV Reach Levels: Winter v. SummerWinter ‘15 Summer ‘15
Source: Nielsen R&F report 5/25/15-9/6/15 v. 1/1-3/31/15; ad-supported TV= bdcst+cable
P2+ CH2-11 T13-17 A18-24 A18-34 A18-49 A25-54
TV’S REACH
TV’S REACH YEARLY TRENDS BY DAY LIVE V. TIMESHIFTED PLAYBACK BY AGE OTHER DAYPARTS PROGRAMMING 2016 PROGRAMS AD IMPRESSIONS MOBILE VIEWING BY PLATFORM

Summer TV Viewing Has Remained Relatively Constant
Total Use Of Television Ratings
Source: Nielsen Npower TUTs; Live+timeshifted+DVD playback+Video game console+VCR+Internet Connected Devices+Audio/video viewing; 5/25-9/6/15 v. year ago; Live+7
Summer’14 Summer’15 % Change
A18-49 19.7 19.4 -2%
A25-54 21.7 21.5 -1%
Summer’14 Summer’15 % Change
A18-49 36.9 36.1 -2%
A25-54 41.4 40.9 -1%
Primetime
Total Day
YEARLY TRENDS
TV’S REACH YEARLY TRENDS BY DAY LIVE V. TIMESHIFTED PLAYBACK BY AGE OTHER DAYPARTS PROGRAMMING 2016 PROGRAMS AD IMPRESSIONS MOBILE VIEWING BY PLATFORM
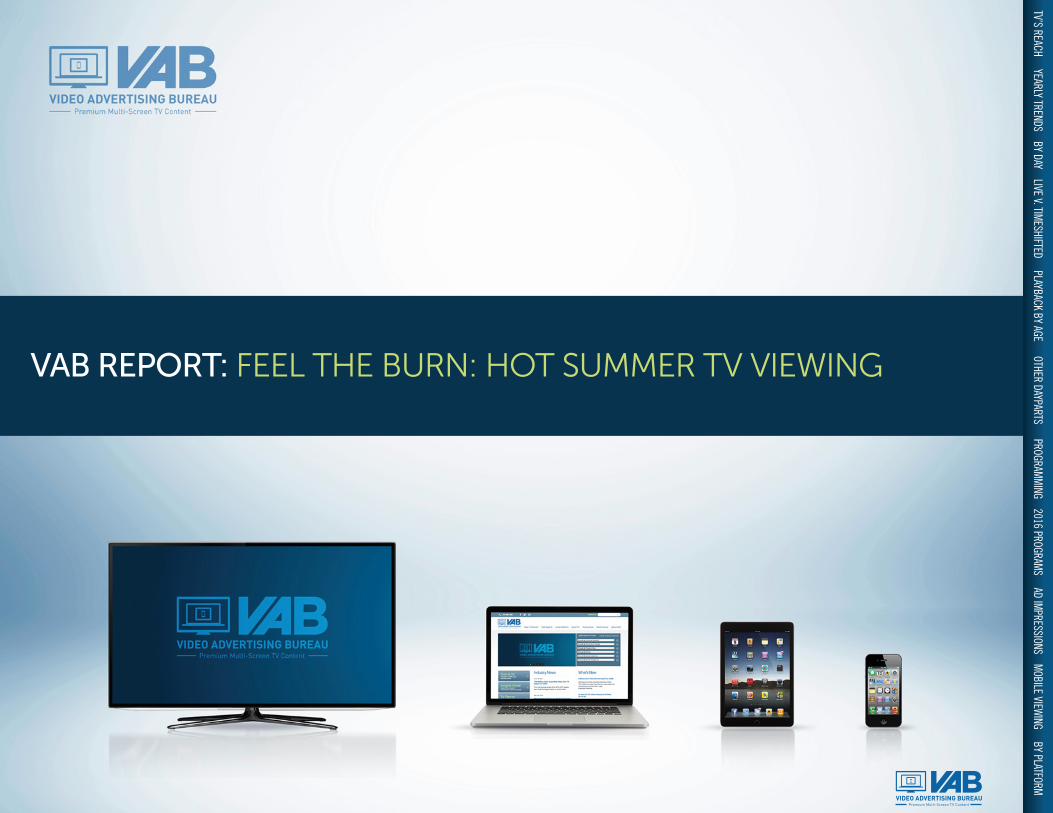
Sunday Monday Tuesday Wednesday Thursday Friday Saturday
Primetime 31,565 34,485 33,493 30,781 30,440 24,670 23,262
Key Window For Retailers, Movie Studios, etc…
Ad-Supported TV Delivers Over 30 Million Viewers In Primetime, In 5 Out Of 7 Days Of The Week
Ad-Supported TV Primetime Viewership (OOO) By Day: P18-49(Summer 2015)
Source: Nielsen Npower Ad-Supported TV viewing=English+Spanish bdcst and cable; 5/25-9/6/15; Live+7
BY DAY
TV’S REACH YEARLY TRENDS BY DAY LIVE V. TIMESHIFTED PLAYBACK BY AGE OTHER DAYPARTS PROGRAMMING 2016 PROGRAMS AD IMPRESSIONS MOBILE VIEWING BY PLATFORM

…and More Than Three-Quarters Of Consumer’s Viewing Is With Live TV – Ideal For Time Sensitive Marketing Campaigns
A18-49 % Live v. DVR Minutes In Primetime
Live TV viewing is More Common In the Summer Months Than In The Winter
3:24
Summer ‘15 Winter‘15
75%
25%
78%
22%
Source line: Nielsen, Base=DVR HHs; Live; Summer ’15 (5/25-9/16/15) v. Jan-March 2015
Live %
Playback %
LIVE V. TIMESHIFTED
TV’S REACH YEARLY TRENDS BY DAY LIVE V. TIMESHIFTED PLAYBACK BY AGE OTHER DAYPARTS PROGRAMMING 2016 PROGRAMS AD IMPRESSIONS MOBILE VIEWING BY PLATFORM
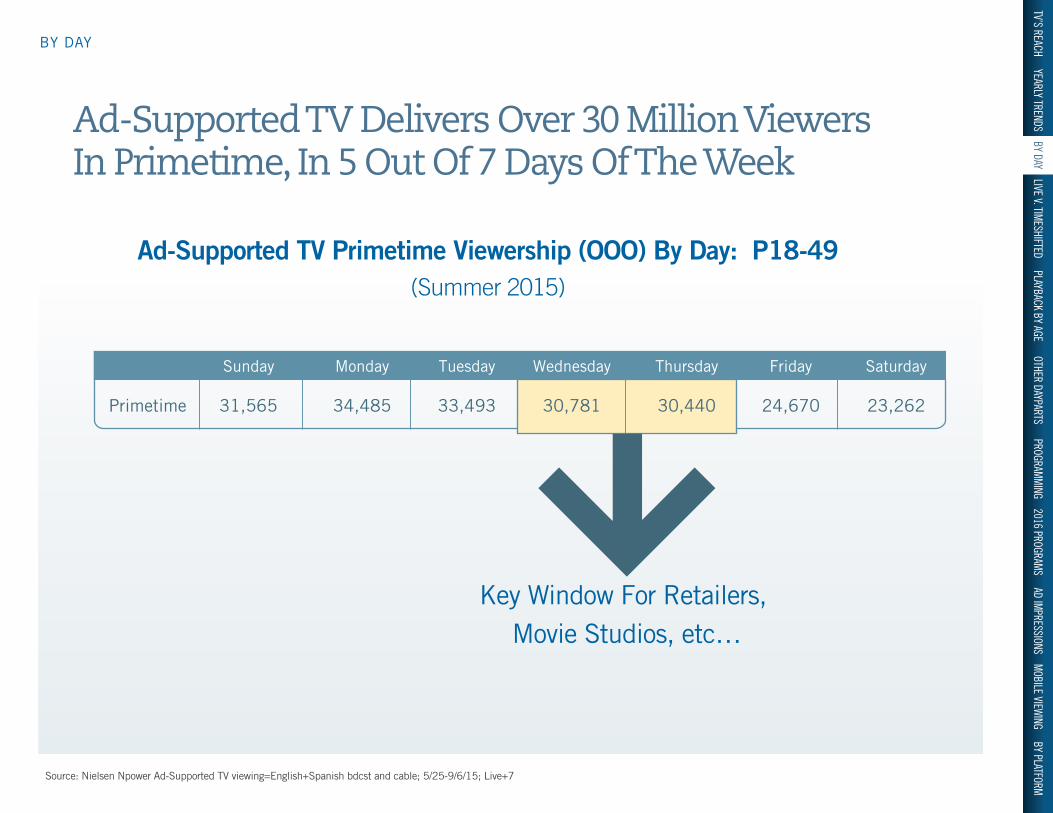
In Fact, Across The Age Spectrum, Majority Of Content Is Viewed ‘Live’ and Not in Delayed Mode
% Live Minutes With The TV By Demo: Prime
Source line: Nielsen, Base=DVR HHs; Live; Summer ’15 (5/25-9/16/15)
Live % Playback %
P2-11 79% 21%
P12-17 80% 20%
P18-24 82% 18%
P25-34 77% 23%
P35-49 77% 23%
P50+ 80% 20%
PLAYBACK BY AGE
Live Viewing isDominant Among
Young Adults
TV’S REACH YEARLY TRENDS BY DAY LIVE V. TIMESHIFTED PLAYBACK BY AGE OTHER DAYPARTS PROGRAMMING 2016 PROGRAMS AD IMPRESSIONS MOBILE VIEWING BY PLATFORM
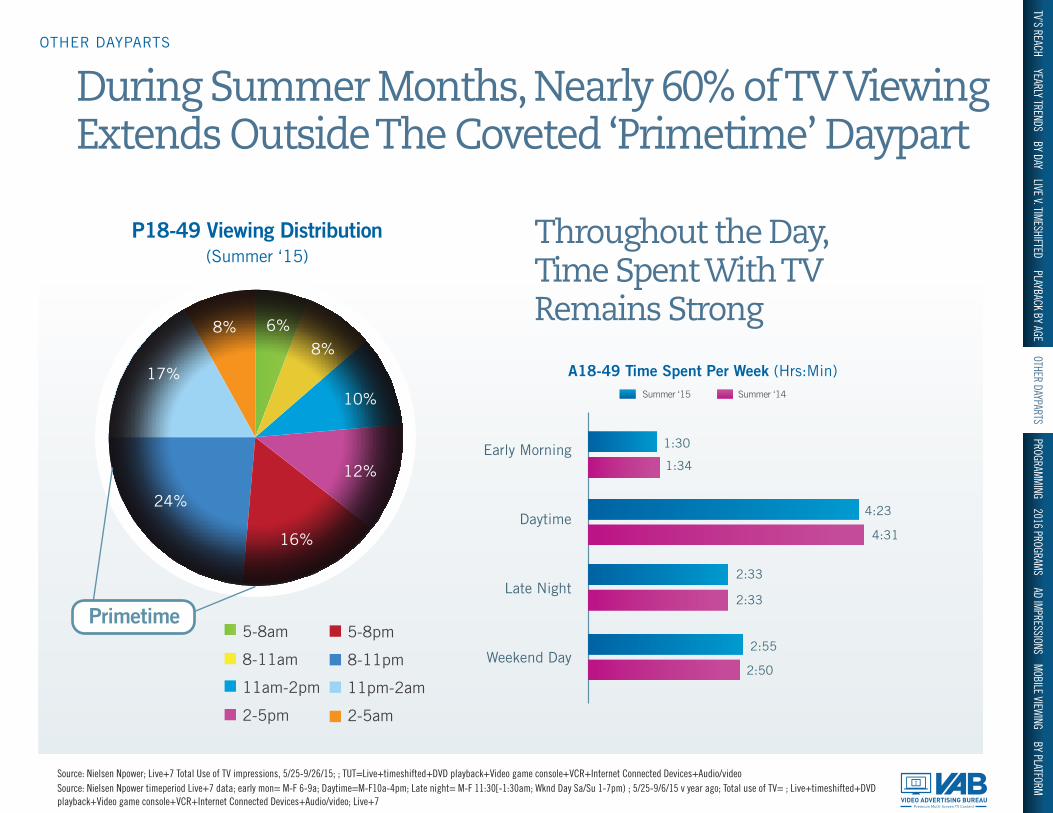
P18-49 Viewing Distribution(Summer ‘15)
5-8am
8-11am
11am-2pm
2-5pm
8%
17%
6%8%
10%
12%
16%
24%
5-8pm
8-11pm
11pm-2am
2-5am
Primetime
A18-49 Time Spent Per Week (Hrs:Min)
Early Morning
Daytime
Late Night
Weekend Day
1:30
1:34
4:23
2:33
2:33
2:55
2:50
4:31
Summer ‘15 Summer ‘14
During Summer Months, Nearly 60% of TV Viewing Extends Outside The Coveted ‘Primetime’ Daypart
Throughout the Day, Time Spent With TV Remains Strong
Source: Nielsen Npower; Live+7 Total Use of TV impressions, 5/25-9/26/15; ; TUT=Live+timeshifted+DVD playback+Video game console+VCR+Internet Connected Devices+Audio/video Source: Nielsen Npower timeperiod Live+7 data; early mon= M-F 6-9a; Daytime=M-F10a-4pm; Late night= M-F 11:30[-1:30am; Wknd Day Sa/Su 1-7pm) ; 5/25-9/6/15 v year ago; Total use of TV= ; Live+timeshifted+DVD playback+Video game console+VCR+Internet Connected Devices+Audio/video; Live+7
OTHER DAYPARTS
TV’S REACH YEARLY TRENDS BY DAY LIVE V. TIMESHIFTED PLAYBACK BY AGE OTHER DAYPARTS PROGRAMMING 2016 PROGRAMS AD IMPRESSIONS MOBILE VIEWING BY PLATFORM
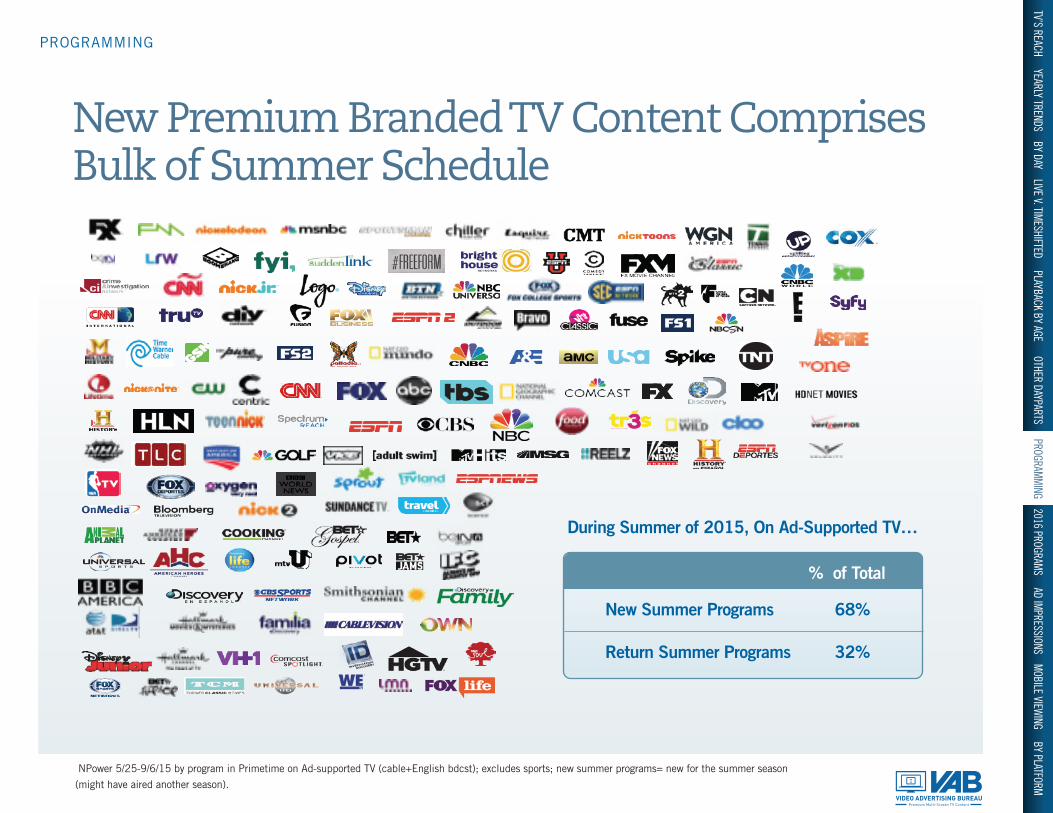
New Premium Branded TV Content Comprises Bulk of Summer Schedule
NPower 5/25-9/6/15 by program in Primetime on Ad-supported TV (cable+English bdcst); excludes sports; new summer programs= new for the summer season
(might have aired another season).
During Summer of 2015, On Ad-Supported TV…
New Summer Programs 68%
Return Summer Programs 32%
% of Total
PROGRAMMING
TV’S REACH YEARLY TRENDS BY DAY LIVE V. TIMESHIFTED PLAYBACK BY AGE OTHER DAYPARTS PROGRAMMING 2016 PROGRAMS AD IMPRESSIONS MOBILE VIEWING BY PLATFORM
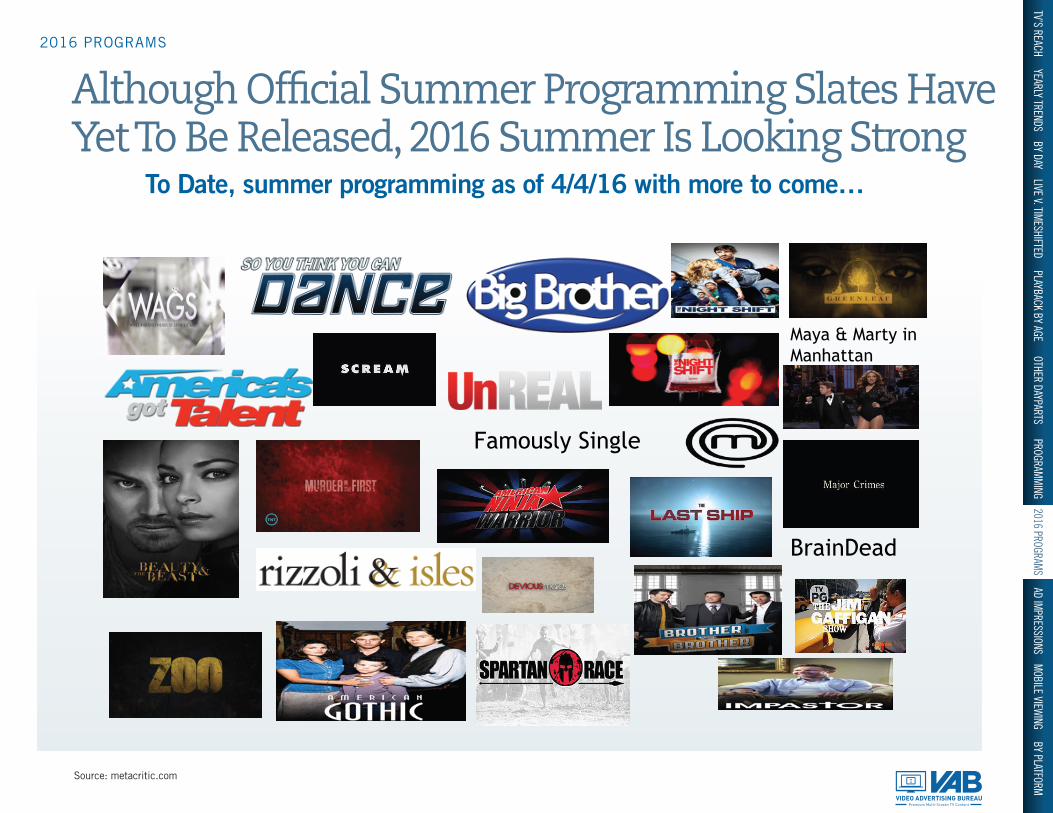
Although Of�cial Summer Programming Slates Have Yet To Be Released, 2016 Summer Is Looking Strong
To Date, summer programming as of 4/4/16 with more to come…
Source: metacritic.com
Maya & Marty in Manhattan
BrainDead
Famously Single
2016 PROGRAMS
TV’S REACH YEARLY TRENDS BY DAY LIVE V. TIMESHIFTED PLAYBACK BY AGE OTHER DAYPARTS PROGRAMMING 2016 PROGRAMS AD IMPRESSIONS MOBILE VIEWING BY PLATFORM
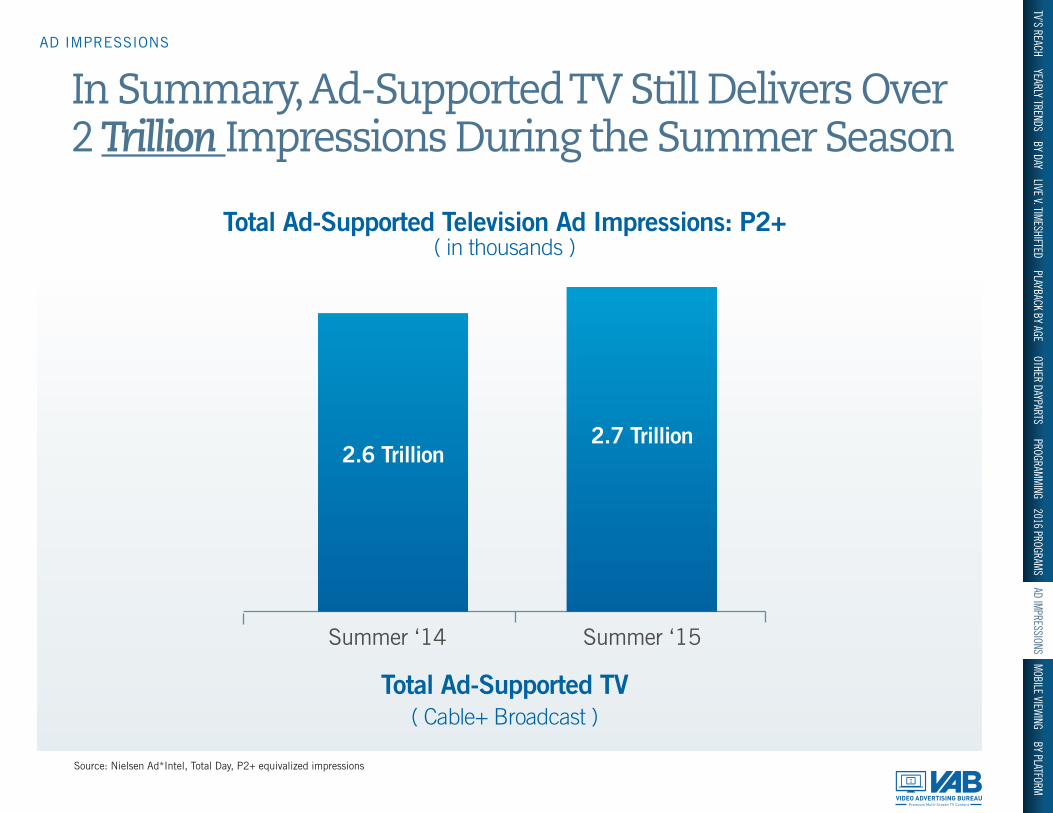
In Summary, Ad-Supported TV Still Delivers Over 2 Trillion Impressions During the Summer Season
Total Ad-Supported Television Ad Impressions: P2+( in thousands )
Total Ad-Supported TV( Cable+ Broadcast )
3:24
Summer ‘14 Summer ‘15
2.7 Trillion2.6 Trillion
Source: Nielsen Ad*Intel, Total Day, P2+ equivalized impressions
AD IMPRESSIONS
TV’S REACH YEARLY TRENDS BY DAY LIVE V. TIMESHIFTED PLAYBACK BY AGE OTHER DAYPARTS PROGRAMMING 2016 PROGRAMS AD IMPRESSIONS MOBILE VIEWING BY PLATFORM
TV’S REACH YEARLY TRENDS BY DAY LIVE V. TIMESHIFTED PLAYBACK BY AGE OTHER DAYPARTS PROGRAMMING 2016 PROGRAMS AD IMPRESSIONS MOBILE VIEWING BY PLATFORM

Time Spent With Ad-Supported TV Content Extends Beyond The TV Set – Rising During Summer Months
Source: VAB analysis of comScore total unduplicated data ( multiplatform includes mobile). Ad-Supported Television Brands represents all measured Ad-Supported
Cable nets, MVPDs and Broadcast Television FOX, CBS, NBC, ABC, iON and CW. All internet on computer, tablet, smartphone.
Feb’15
69,500 min
P2+
P18-34 24,992 min
July ’15
72,748 min
29,894 min
Absolute Diff
+3,248min
+4,902min
Time Spent with Ad-Supported TV on Computer & Mobile (Total Minutes)( July ’15 v. Feb’ 15)
MOBILE VIEWING
TV’S REACH YEARLY TRENDS BY DAY LIVE V. TIMESHIFTED PLAYBACK BY AGE OTHER DAYPARTS PROGRAMMING 2016 PROGRAMS AD IMPRESSIONS MOBILE VIEWING BY PLATFORM
P2+
P18-34
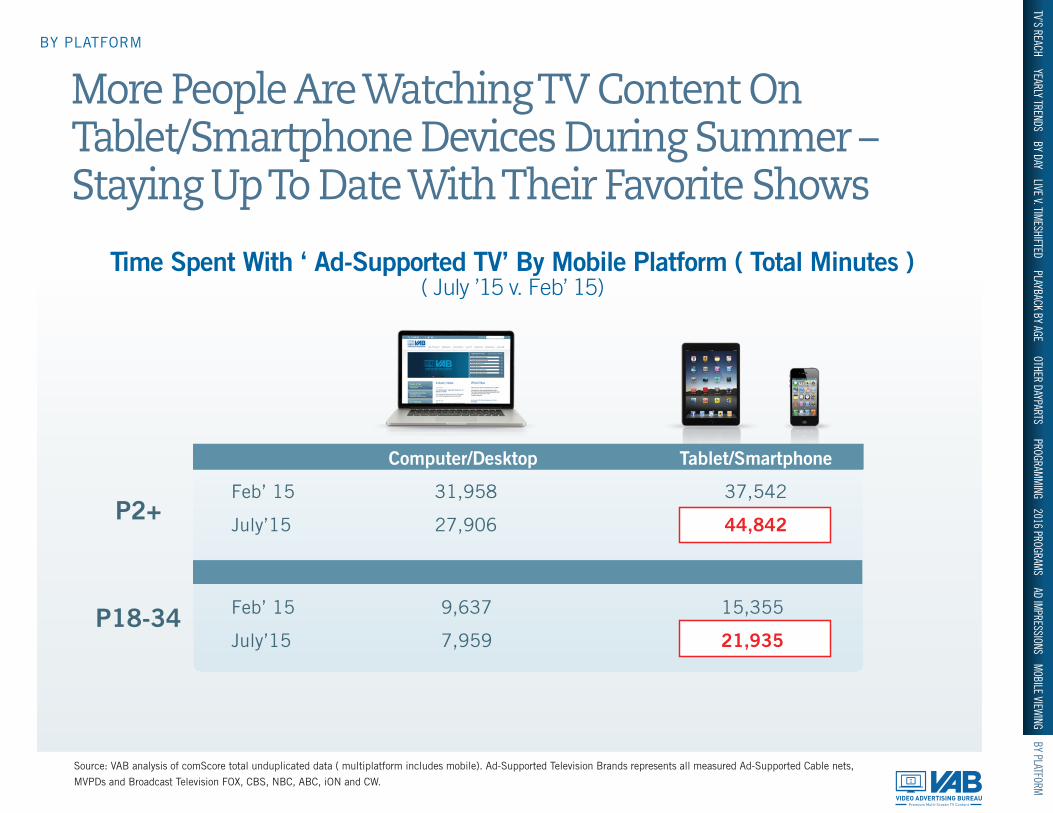
More People Are Watching TV Content On Tablet/Smartphone Devices During Summer – Staying Up To Date With Their Favorite Shows
Time Spent With ‘ Ad-Supported TV’ By Mobile Platform ( Total Minutes )( July ’15 v. Feb’ 15)
Source: VAB analysis of comScore total unduplicated data ( multiplatform includes mobile). Ad-Supported Television Brands represents all measured Ad-Supported Cable nets,
MVPDs and Broadcast Television FOX, CBS, NBC, ABC, iON and CW.
Computer/Desktop Tablet/Smartphone
Feb’ 15 31,958 37,542
July’15 27,906 44,842
Feb’ 15 9,637 15,355
July’15 7,959 21,935
BY PLATFORM
TV’S REACH YEARLY TRENDS BY DAY LIVE V. TIMESHIFTED PLAYBACK BY AGE OTHER DAYPARTS PROGRAMMING 2016 PROGRAMS AD IMPRESSIONS MOBILE VIEWING BY PLATFORM
If you would like additional video advertising information, insights or analysis please visit our website at www.TheVAB.com or feel free to contact us directly:
Sean Cunningham President & CEO212-508-1223
Danielle DeLauroSVP Strategic Sales Insights
Jason Wiese VP Strategic Insights
212-508-1219 [email protected]
Evelyn SkurkovichSr. Director, Strategic Insights
CONTACT US
Follow us on and like us on
TV’S REACH YEARLY TRENDS BY DAY LIVE V. TIMESHIFTED PLAYBACK BY AGE OTHER DAYPARTS PROGRAMMING 2016 PROGRAMS AD IMPRESSIONS MOBILE VIEWING BY PLATFORM