Embed Size (px)
Citation preview

Centre for Research and Analysis of MigrationDepartment of Economics, University College LondonDrayton House, 30 Gordon Street, London WC1H 0AX
Discussion Paper Series
CDP No 32/13
The Quality of Immigrant SourceCountry Educational Outcomes: Dothey Matter in the ReceivingCountry?
Qing Li and Arthur Sweetman
The Quality of Immigrant
Source Country Educational Outcomes: Do they Matter in the Receiving Country?
Qing Lia and Arthur Sweetmanb
Department of Economics
McMaster University Hamilton, Ontario, Canada
L8S 4M4 [email protected] a
905-525-9140 x23218
September 18, 2013 International test scores are used to proxy the quality of source country educational outcomes and explain differences in the rate of return to schooling among immigrants in Canada. The average quality of educational outcomes in an immigrant’s source country and the rate of return to schooling in the host country labour market are found to have a strong and positive association. However, in contrast to those who completed their education pre-immigration, immigrants who arrived at a young age are not influenced by this educational quality measure. Also, the results are not much affected when the source country’s GDP per capita and other nation-level characteristics are used as control variables. Together, these observations reinforce the argument that the quality of educational outcomes has explanatory power for labour market outcomes. The effects are strongest for males and for females without children. Research funding from SSHRC through EPRI is gratefully acknowledged. Statistics Canada provided access to the census data through the Research Data Center at McMaster University. Thanks to the editor and referees, as well as Julian Betts, David Card, Barry Chiswick, Tom Crossley, Louis Grignon, Lonnie Magee, Garnett Picot, Eden Thompson and Wei Yang for comments. This research builds on Statistics Canada Analytical Studies Branch Research Paper Series No. 234, which was funded by HRSDC and for which excellent research assistance was provided by Stephan McBride. This paper represents the views of the authors, and not necessarily those of Statistics Canada or the funders. Keywords: Immigration, Quality of Education, Earnings JEL codes: I21, J31, J61
1
1. Introduction
It is increasingly recognized that it is beneficial for economic analyses to differentiate
between the quantity of education attained (e.g., years of school or highest degree) and the quality
of educational achievement (e.g., test score derived measures of cognitive ability).1 Understanding
the relationships between immigrants’ formal schooling and source country-level average cognitive
skills, as proxied by an index derived from multiple sets of international standardized tests, on the
one hand, and labour market outcomes in the receiving country on the other, is relevant to a variety
of topics. One issue involves the labour market integration of immigrants in destination country
labour markets (Borjas and Friedberg, 2009; Borjas, 1995; Aydemir and Skuterud, 2005; Dustmann,
Fabbri and Preston, 2005; Ferrer and Riddell, 2008). Inasmuch as the quality, or relative quality, of
pre-immigration educational outcomes varies across source countries this may affect the labour
market integration of immigrants and have implications for receiving countries’ immigrant selection
and settlement policies. This is a long-standing issue; Chiswick (1978) observed a gap in rates of
return to education and hypothesized that educational quality might be at issue. More recently
Chiswick and Miller (2010) explore source country school quality using American data.
Immigration points systems such as those in Canada and Australia, and those being considered in
other countries including the US, assume (either implicitly or explicitly) that a year of education is
of the same “quality” regardless of where it is obtained. However, in complementary work to that
here, Ferrer, Green and Riddell (2006) use individual-level test scores to explore immigrant labour
market outcomes and find that these scores explain the entire immigrant-domestic born gap in the
rate of return to education.
1 Although we view test scores as reflecting the quality of general cognitive educational outcomes, it is important to note that such outcomes derive from a variety of inputs including the formal education system, but also including, for example, family inputs, nutrition, and cultural norms affecting student learning effort. That is, there are many inputs to the education production function.
2
Second, research on endogenous growth by, for example, Hanushek and Kimko (2000),
Barro (2001), Erosa et al. (2010), and Barro and Lee (2012) suggest that the quality of educational
outcomes as proxied by, for example, national-level average test scores, has very substantial
impacts on national productivity and economic growth in contrast to measures of educational
attainment or inputs – see Hanushek and Woessmann (2008) for a review. In a sub-section of their
work exploring causality, using US data Hanushek and Kimko undertake an exercise similar in
some aspects to that conducted here and they have broadly similar findings. Manuelli and Seshadri
(2010) suggest the quality of human capital varies systematically with the level of development and
find that effective human capital per worker varies substantially across countries. In accounting for
differences in output per worker across countries, Schoellman (2012) demonstrates that “education
quality” is roughly as important as quantity. Hanushek and Woessmann (2012) further explore this
association by tracking the cognitive skill distribution within countries and over time. This paper
builds on Hanushek and Kimko’s index of the quality of national-level educational outcomes. Since
their index is found to have predictive power in a context other than that for which it was produced,
this increases the credibility of the index and their approach.
A third related area of research focuses on the importance of educational outcomes, in
contrast to school system resource inputs, for labour market productivity. One reading of the
literature suggests that increased inputs are sometimes associated with improved labour market
outcomes, especially when the initial level of inputs is low and/or the variation in inputs is large, but
that in many situations the link between resource inputs and both cognitive outcomes (i.e., test
scores) and labour market outcomes is tenuous (Hanushek, 1996; Betts, 1996). Card and Krueger
(1992), and Heckman, Layne-Ferrar and Todd (1996a, 1996b), use data from the US for the
American born to look at the impact of educational inputs on labour market outcomes where
3
identification comes from individuals who migrate across states. They find some evidence that
inputs matter, but observe that the connection is weak. In a related vein, Bratsberg and Terrell
(2002) find that source country educational inputs impact the return to education observed for
immigrants to the US.
It is clear that individual-level measures of educational achievement (i.e., test scores) have
very substantial (conditional) correlations with labour market success. For example, Green and
Riddell (2003) study individual-level IALS scores in relation to earnings and find a sizeable effect
with these simple test scores accounting for a substantial fraction of the return to education.
However, the origin of the correlation is less than clear. Plausibly, individual unobserved ability
contaminates both measures’ relationship with labour market success. In this paper, by using
immigrants’ source country average levels of educational outcomes we avoid individual-level
cognitive ability capturing the effects of unobserved individual-specific variables with which they
may be correlated. This is also closer to the policy question that may be posed by a government
considering investing in improved educational quality. That is, is there a relationship between the
nations’ average level of test scores (i.e., cognitive skills), and labour market outcomes?
Exploring differences in the return to education of immigrants to Canada as a function of the
average quality of educational outcomes in each immigrant’s source country is the objective of the
present study. Overall, we find that differences in the source country average quality of pre-
immigration educational outcomes have substantial impacts on the Canadian labour market earnings
of immigrants. The observed impact flows through the return to education, with those from source
countries with higher test scores having much higher returns to education, so that the gap widens as
years of schooling increases. Adding country-level controls, especially source country GDP per
capita, does not appreciably alter the relationship so it is not a wealthy-country effect. Further, the
4
return to education observed for those immigrants who arrive before age 10 is not a function of their
source country quality of educational outcome. This reinforces the idea that it is the quality of
educational outcomes, and not source country effects per se, that is correlated with the return to
education. Notably, the findings for the sample of all women differs somewhat from that for men,
especially conditional on source country characteristics. However, in line with the literature on
immigrant gender roles, when the sample is restricted to women who are unmarried or without
children living in the household, the results are quite similar to those for men.
The remainder of this paper is structured as follows. Section II discusses the data and
provides an initial descriptive analysis. Section III presents a random coefficient approach,
including a test for the form of heteroscedasticity in the second stage and a feasible Generalized
Least Squares strategy. Estimates from the core regression analysis are discussed in Section IV, as
are those from sub-group analysis that helps in confirming and describing the phenomenon under
study. Section V discusses the findings, draws conclusions and suggests options for future work.
2. Data and Descriptive Statistics
To undertake this analysis Canadian census data are combined with an index of the quality
of source country educational outcomes derived from country-level scores from international
standardized tests and related information. Hanushek and Kimko (2000) derived the index to allow
international comparisons of economic growth. Their measure of the quality of educational
outcomes is for 87 countries, but there are only sufficient numbers of immigrants in the Canadian
census data to look at 81 of these for males, and 79 for females, with further reductions in some
analyses using subsets of the sample. Further, since GDP per capita is not available for three of the
countries the number in the regression analysis is reduced to 78 for males and 76 for females.
5
A merged sample of immigrants from the 1986, 1991, 1996 and 2001 Canadian census 20%
files is employed. Combining the four increases the sample size sufficiently to allow more countries
to be included in the analysis than would otherwise be possible. (A sensitivity test is conducted to
see how robust the results are to the aggregation.) Census 2006 is excluded because the questions
pertaining to education changed so substantially that the measurement of schooling is not
comparable to that in previous censuses. The selection rules employed for the sample for analysis
are that the immigrants must have been born since 1945, be at least 25 years old, and not currently
attending school. Those living in the Territories are omitted, as are those with missing relevant
variables. Further, immigrants from source countries with fewer than 60 observations are excluded,
as are the domestic born. However, in the subgroup analysis we retain all countries with more than
10 observations, which balances several criteria including the desire to retain as large a set of
countries as possible. The sample, however, contains the broadest possible set of people in the
labour market; thus anyone with positive weeks of work and earnings in the year is included.2
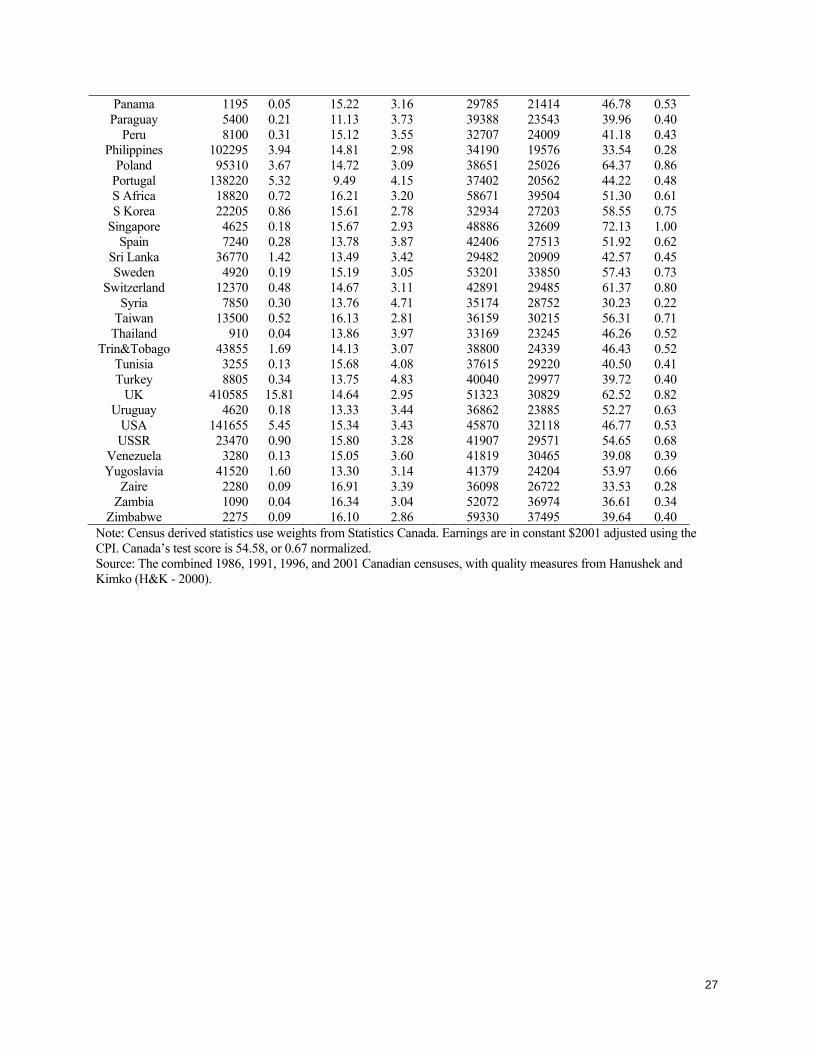
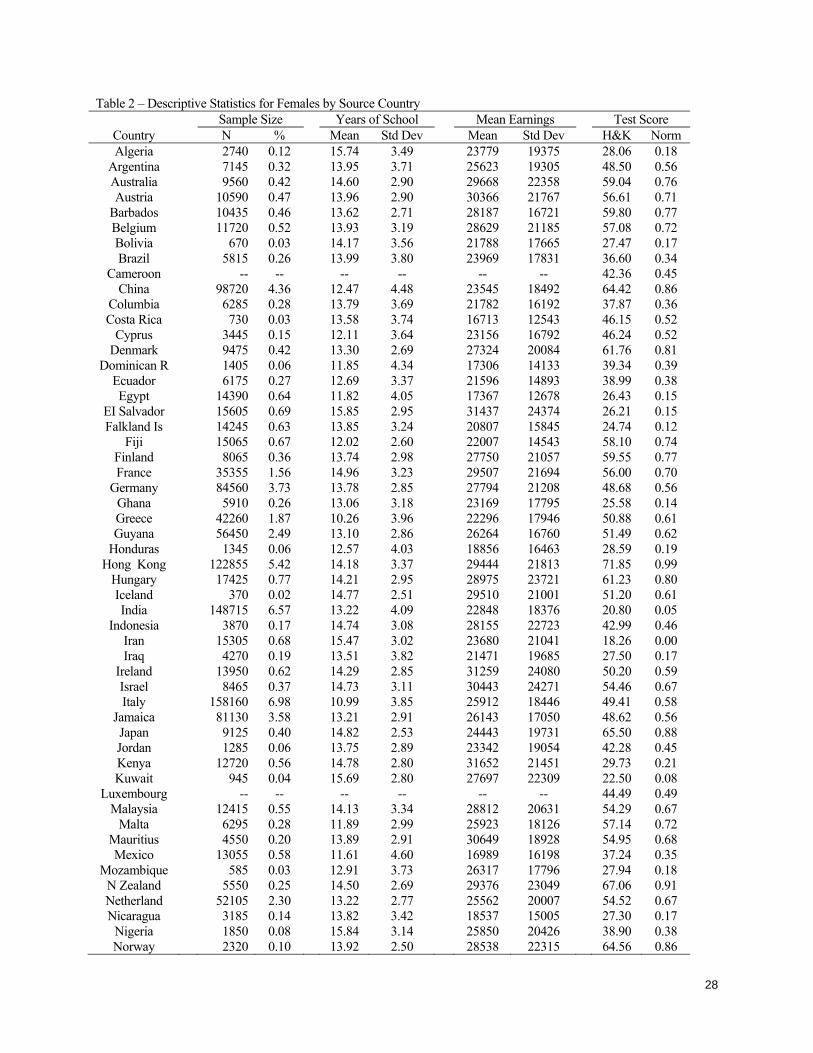
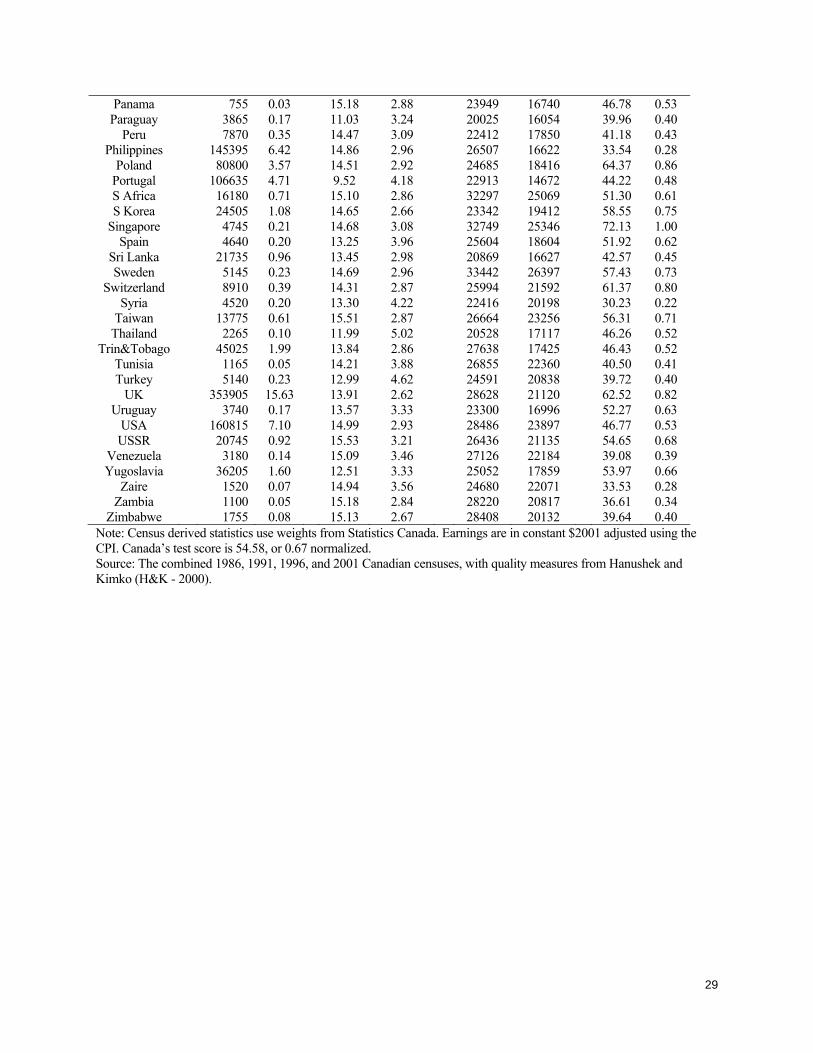
Table 1, for males, and Table 2, for females, present descriptive statistics by source country.
Years of school is measured as the sum of years of elementary and high school, university, and post-
secondary non-university, and includes years from incomplete and/or multiple certifications; it is
top coded at 24. Average years of schooling varies by over five years across countries, which is very
substantial – equivalent to the difference between an undergraduate degree and senior high school.
Annual earnings, converted to 2001 dollars using the all goods CPI, are the sum of
employment and positive self-employment earnings and are top coded at $150,000. They are
presented in the subsequent columns with the averages varying markedly across source countries
with the top few being about two and a half times the bottom ones for males, and two times for
2 The findings appear to be quite robust across alternative approaches to selecting the sample for analysis. Limited experiments suggest that changing or removing the “born in since 1945” restriction makes little difference. Also, sensitivity tests limiting the sample to those with strong labour force attachment produced remarkably similar results.
6
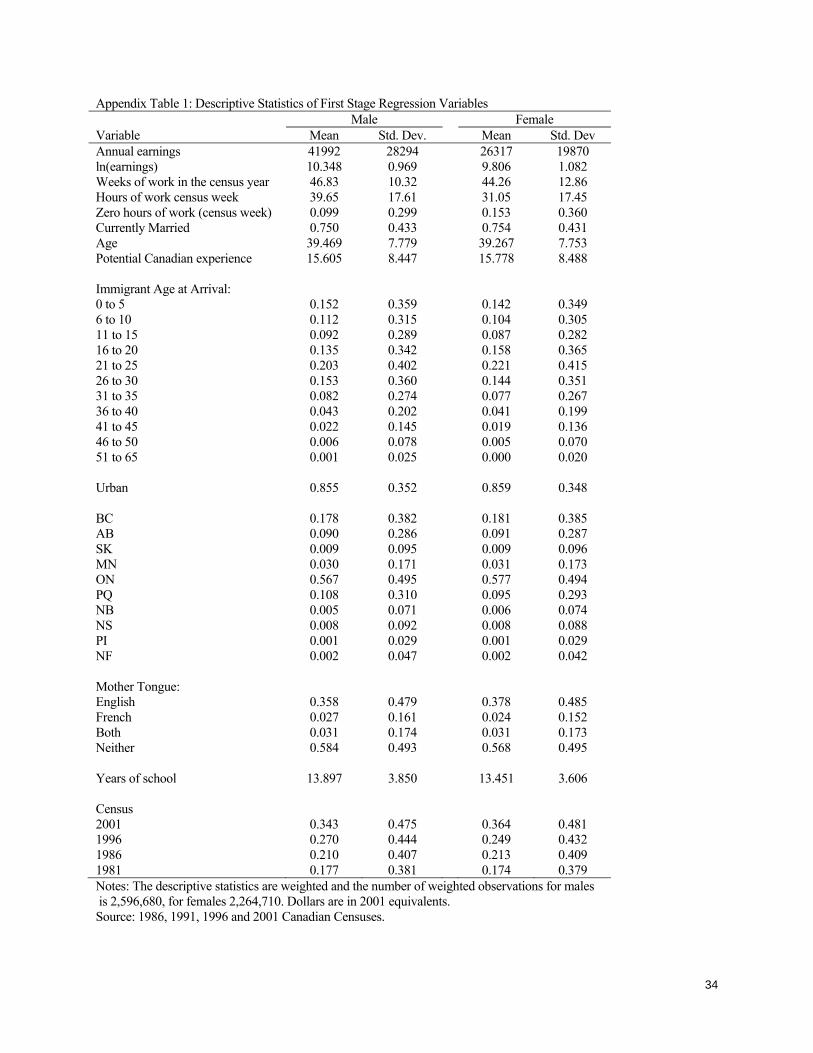
females. Appendix table 1 presents descriptive statistics for the census data and provides a listing of
the background variables employed in the regressions. One note is that mother tongue, not current
language spoken, is employed as a control variable since this is exogenous and is not influenced by
the ability to learn new languages, which may be correlated with the quality of educational outcome
variable that is the focus of the research. Also, note that the variables “age at immigration” and
“domestic potential labour market experience” are used in the regressions rather than “years since
migration” and “total potential labour market experience”. The former have more natural
interpretations given the context and also fit the data slightly better. However, sensitivity tests were
conducted using years since migration instead of age at immigration to ensure robustness and there
were no substantive changes in the results.
Turning next to the test score data, the “H&K” column presents Hanushek and Kimko’s
(2000 - Appendix table C1) preferred QL2 measure. The underlying observed test scores from
which this measure is derived are all in math and science and are only available for 37 countries.
The tests were administered in the local language, which reduces concerns that QL2 is influenced
by English proficiency across different countries. Further, those countries had different participation
frequencies in the underlying six rounds of international testing conducted between 1965 and 1991.
In particular, there are fewer observations from countries with very low scores, and wealthier
countries tend to participate more often. Using these test scores as a base, Hanushek and Kimko use
information regarding each country’s education system (e.g., the primary school enrollment rate and
teacher-pupil ratios) and demographics (e.g., population growth rates) to generate their QL2
measure. For this analysis QL2 is normalized to range from zero to one to facilitate interpretation.3
For this paper an attempt was made to go beyond an index by mapping the score from each test to
those age-specific set of individuals for whom the particular test was likely relevant (by using 3 Normalizing implies rescaling the data by subtracting the lowest value from each, and then dividing by the highest.
7
source country and a several year window around each test). This, however, was not fruitful since
the sample sizes were too small. Also, no substantive changes to the results in this paper occurred in
several experiments with Hanushek and Kimko’s alternative measure, QL1.
Since it is derived from six sets of tests by two different organizations, QL2 provides a
better proxy than any individual test. It also has the advantage of having been produced for previous
work in the US, so it is independent of the current research and the Canadian labour market data
employed. (In fact, significant results here add credibility to the index.) However, it cannot be said
to be perfect for the purpose at hand. These scores are for students in grade school (up to the end of
high school or its equivalent), and postsecondary educational quality may vary differentially across
countries although the averages at these two levels are likely correlated. Also, the scores are a
weighted average of those for males and females, and there may be appreciable gender gaps in some
countries. Finally, there are issues regarding how well the source country average test scores
represent the scores of those who immigrate. If immigrants are heavily selected based on
unobservables, then they may be from particular parts of each source country’s distribution. Of
course, if selection is similar across countries the relative scores may still be appropriate measures.
In short, although this measure is the best available, it is only a proxy for a broad concept. All of
these issues can be thought of as sources of measurement error. Thus, if the quality index contains
mostly noise and little signal, it will likely not be correlated with the variables of interest in the
Canadian census data, and the coefficients estimated in this study will probably be biased towards
zero. Note, however, that the endogenous growth literature discussed above finds that national
average test scores have substantial information content and are predictors of a nation’s economic
and productivity growth. Moreover, Schoellman (2012) argues that differences in immigrants’
return to schooling in the US derive from source country education quality, and not selection in
8
immigration or a lack of skill transferability.
One check on the QL2 measure is to compare it to subsequent international tests. In
particular, QL2 is not based on the TIMSS (Third International Math and Science Survey). This is
relevant since the TIMSS contains data on eight countries for which QL2 uses predictions.
Hanushek and Kimko conduct a verification test and find that the measure in Tables 1 and 2 are
highly correlated with the TIMSS country averages, even out of sample. This has two important
implications: first, the QL2 estimates are reasonable, and second, the test score rankings are
relatively stable over time. Substantial stability in rankings across the test years is also observed in
the earlier data. Overall, while QL2 measures the underlying concept with error, it appears to be the
best available measure of the quality of cognitive aspects of international relative educational
outcomes and to contain an appreciable amount of information.
Interestingly, rank order correlations (using Kendall’s tau statistic) between the test score
and average years of schooling measures show no relationship for either sex (the associated p-
values for males, and females, are 0.83 and 0.88, respectively). Therefore, among immigrants this
piece of evidence does not suggest that countries with higher average years of completed schooling
also have higher average quality as measured by these test scores. In interpreting this correlation,
however, keep in mind that the standardized tests are taken in school and not at completion. In
contrast, average schooling and the quality of educational outcomes are each positively correlated
with average earnings by source country (as measured by Kendall-tau statistics with p-values of less
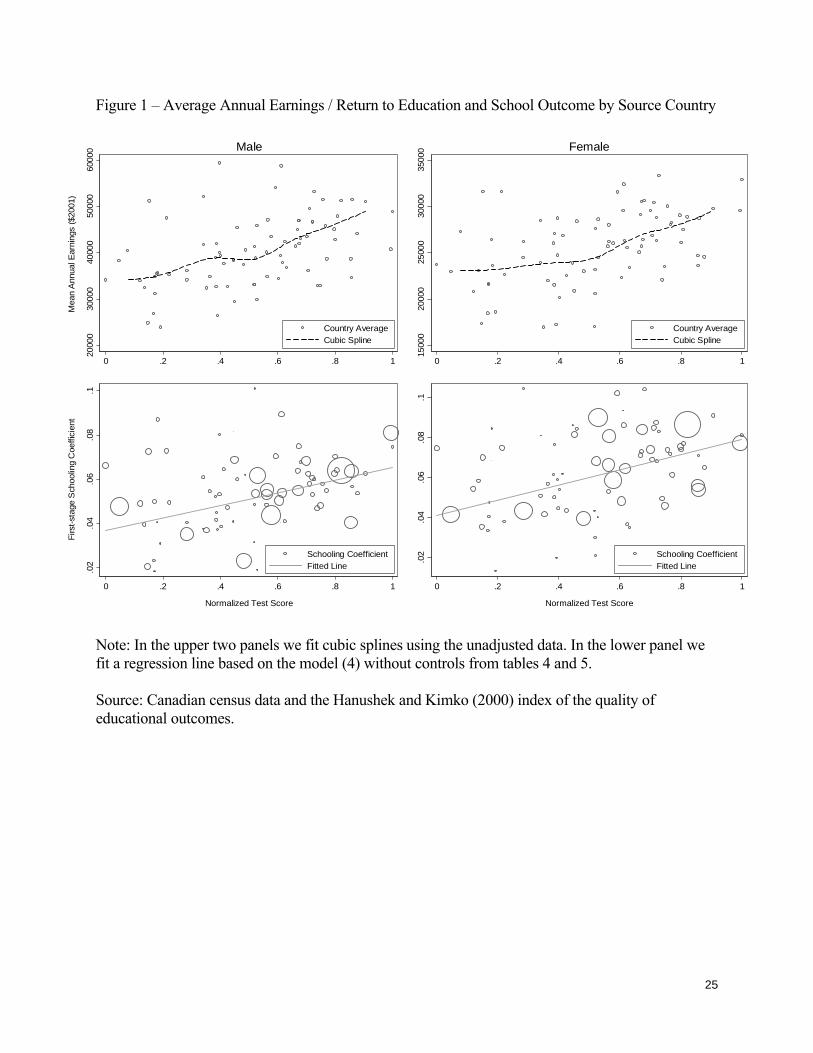
than 1% in all cases). The upper plots of Figure 1 illustrate the relationship between QL2 and source
country average earnings, demonstrating a substantial economic relationship. A shift from the 25th
to the 75th percentile of the normalized QL2 distribution is associated with an approximately $7,000
increase in unadjusted average annual earnings for the males, and about $3,500 for the females.
9
3. Empirical Strategy
An approach similar to that in Card and Krueger (1992) – sometimes referred to as a random
coefficient, or hierarchical linear, model – is pursued to explore differences in rates of return to
education in Canadian labour markets as a function of our proxy for the quality of educational
outcomes. It is less restrictive than the Mincer-type earnings equation approach on some dimensions
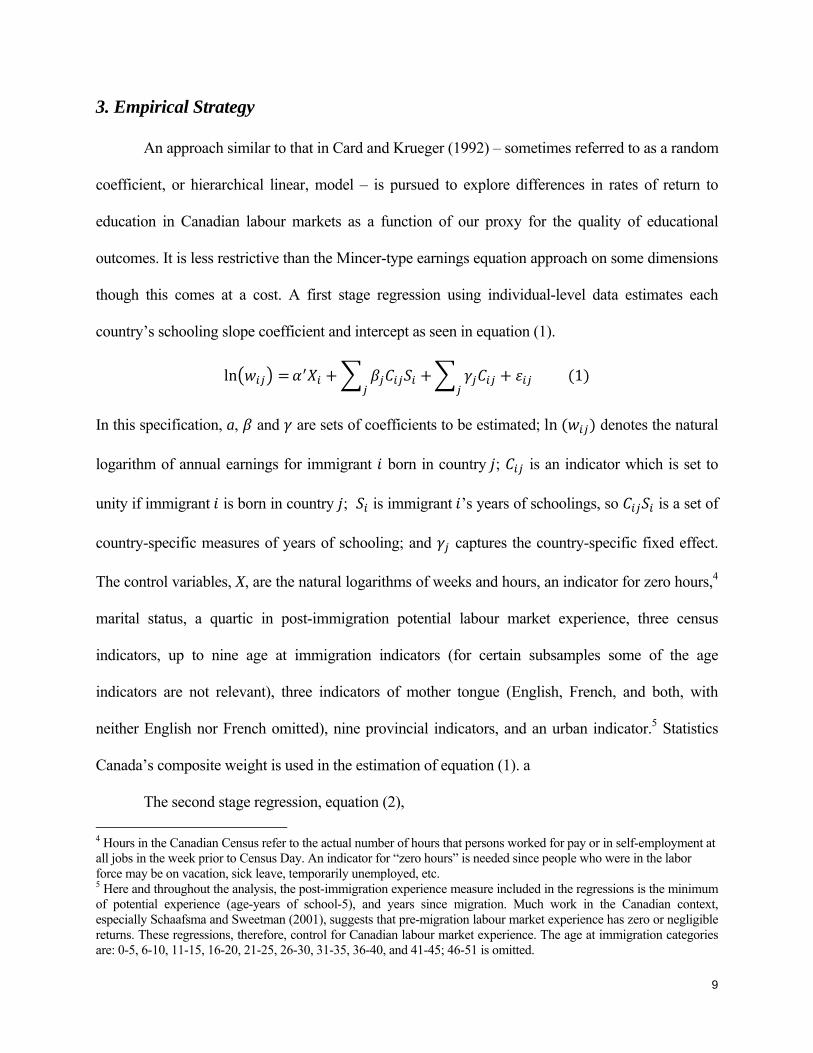
though this comes at a cost. A first stage regression using individual-level data estimates each
country’s schooling slope coefficient and intercept as seen in equation (1).
ln 1
In this specification, a, and are sets of coefficients to be estimated; ln denotes the natural
logarithm of annual earnings for immigrant born in country ; is an indicator which is set to
unity if immigrant is born in country ; is immigrant ’s years of schoolings, so is a set of
country-specific measures of years of schooling; and captures the country-specific fixed effect.
The control variables, X, are the natural logarithms of weeks and hours, an indicator for zero hours,4
marital status, a quartic in post-immigration potential labour market experience, three census
indicators, up to nine age at immigration indicators (for certain subsamples some of the age
indicators are not relevant), three indicators of mother tongue (English, French, and both, with
neither English nor French omitted), nine provincial indicators, and an urban indicator.5 Statistics
Canada’s composite weight is used in the estimation of equation (1). a
The second stage regression, equation (2),
4 Hours in the Canadian Census refer to the actual number of hours that persons worked for pay or in self-employment at all jobs in the week prior to Census Day. An indicator for “zero hours” is needed since people who were in the labor force may be on vacation, sick leave, temporarily unemployed, etc. 5 Here and throughout the analysis, the post-immigration experience measure included in the regressions is the minimum of potential experience (age-years of school-5), and years since migration. Much work in the Canadian context, especially Schaafsma and Sweetman (2001), suggests that pre-migration labour market experience has zero or negligible returns. These regressions, therefore, control for Canadian labour market experience. The age at immigration categories are: 0-5, 6-10, 11-15, 16-20, 21-25, 26-30, 31-35, 36-40, and 41-45; 46-51 is omitted.
10
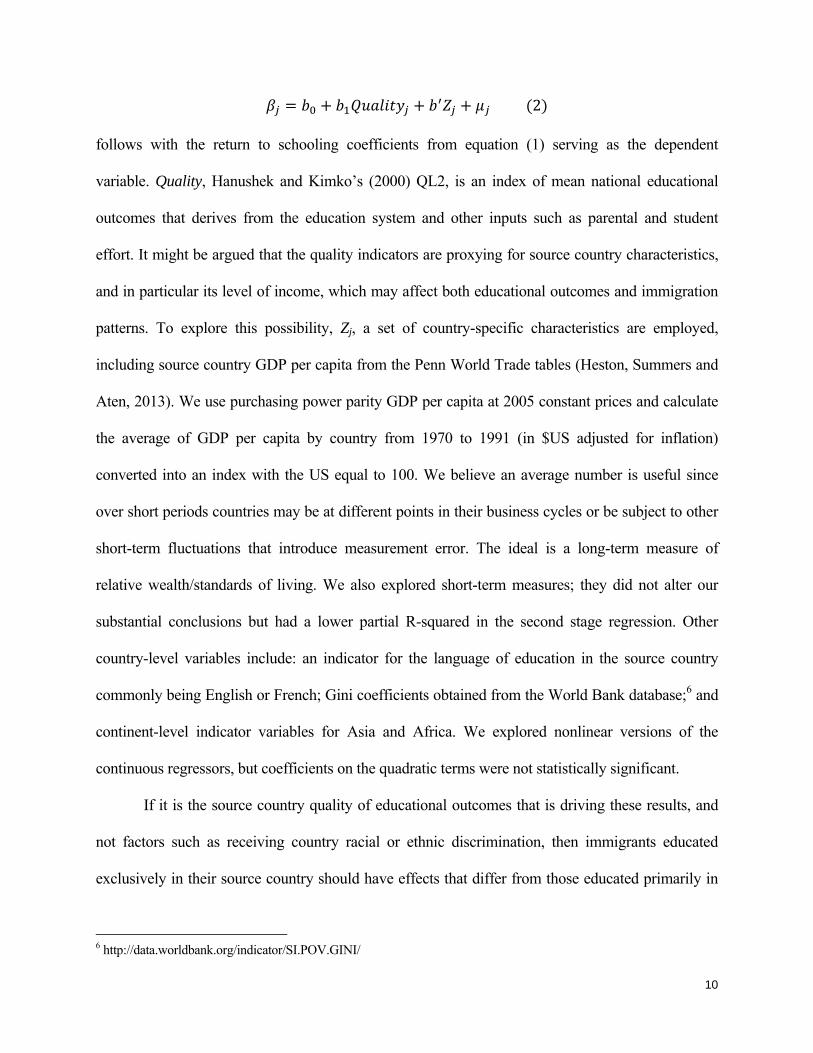
2
follows with the return to schooling coefficients from equation (1) serving as the dependent
variable. Quality, Hanushek and Kimko’s (2000) QL2, is an index of mean national educational
outcomes that derives from the education system and other inputs such as parental and student
effort. It might be argued that the quality indicators are proxying for source country characteristics,
and in particular its level of income, which may affect both educational outcomes and immigration
patterns. To explore this possibility, Zj, a set of country-specific characteristics are employed,
including source country GDP per capita from the Penn World Trade tables (Heston, Summers and
Aten, 2013). We use purchasing power parity GDP per capita at 2005 constant prices and calculate
the average of GDP per capita by country from 1970 to 1991 (in $US adjusted for inflation)
converted into an index with the US equal to 100. We believe an average number is useful since
over short periods countries may be at different points in their business cycles or be subject to other
short-term fluctuations that introduce measurement error. The ideal is a long-term measure of
relative wealth/standards of living. We also explored short-term measures; they did not alter our
substantial conclusions but had a lower partial R-squared in the second stage regression. Other
country-level variables include: an indicator for the language of education in the source country
commonly being English or French; Gini coefficients obtained from the World Bank database;6 and
continent-level indicator variables for Asia and Africa. We explored nonlinear versions of the
continuous regressors, but coefficients on the quadratic terms were not statistically significant.
If it is the source country quality of educational outcomes that is driving these results, and
not factors such as receiving country racial or ethnic discrimination, then immigrants educated
exclusively in their source country should have effects that differ from those educated primarily in
6 http://data.worldbank.org/indicator/SI.POV.GINI/
11
the Canadian system. The latter should not be directly affected by the source country quality index.
Extensions looking at where each person’s education was obtained are, therefore, presented for each
sex to increase our confidence in the interpretation of the findings.7
Although we focus on the impact of source country test scores on the return to schooling,
they could also have a direct effect on earnings as pointed out by, for example, Heckman, Layne-
Farrar and Todd (1996a, b), building on work by Behrman and Birdsall (1983). Thus, in principle, it
is possible for the effect of our quality measure to enter through variation in the intercept if its
variation is (or a component of it is) relevant for earnings but independent of the amount of
schooling obtained. We explore this possibility using a regression similar to equation (2) but with γj
from equation (1) as the dependent variable. Such a relationship might, for example, reflect a
selection effect in immigration, or systematic differences in selection within the education systems
of source countries with different measured test scores. It could also reflect the differential
attainment of basic skills across countries that are not highly correlated with years of schooling.
3.1 Heteroscedasticity and feasible Generalized Least Squares
Heteroscedasticity is a concern in the second stage regression since the countries have
different sample sizes and perhaps other unobserved common characteristics. For grouped data
regression models, if each error term in the individual-level data in equation (1), regardless of which
group it belongs to, is independently and identically distributed (i.i.d.) with mean zero and variance
(that is, if there is no clustering as in the census), then the errors in the group level regression
7 Place of birth, which is reported in the census, is assumed to be the country in which education is received if the years of schooling (plus 5) are less than the age at immigration. If the years of schooling plus 5 are greater than the age at immigration, then some schooling is inferred to have been received post-immigration. Since gaps in educational attendance exist, but are not observed, some of those who are classified as receiving only source country schooling will have obtained some education post-immigration. This will serve to attenuate the coefficient. Errors in the other direction are probably much less common, though some immigrants who arrive in Canada at a young age undoubtedly go out of the country to receive some of their education.
12
will have mean zero and variance / . Using this logic, a traditional way to deal with the
heteroscedasticity in the second stage (equation 2) is to use cell counts N as weights to generate
efficient and unbiased estimates. In contrast, in the presence of country-level clustering this
approach need not be appropriate as pointed out by Dickens (1990). If people within a group share
unobserved common characteristics then the error term in equation (1) should have two components
as in equation (3),
3
where and are group and individual error components respectively. If they are both i.i.d. (as
well as independent of each other) with mean zero and variance and respectively, then the
variance of the aggregate level error term follows as:
4 .
Dickens argues that if exists and is sufficiently large, or if group sizes are large enough,
then constructing weights exclusively based on cell counts (Nj) may increase heteroscedasticity
rather than adjust for it, which generates biased estimates of standard errors. Hence, it may be not
worth weighting. Solon et al. (2013) re-emphasize this issue and suggest that the practitioner
perform a heteroscedasticity test, in particular, a simple regression of squared OLS residuals on a
constant and the inverse group size (i.e., . If the coefficient on is statistically significant, then
this is evidence of heteroscedasticity from the grouped data structure and they suggest a feasible
Generalize Least Squares (GLS) specification. An estimate of the source-country specific variance
can be constructed based on equation (4) since the estimated intercept from the regression testing
for heteroscedasticity consistently estimates while the coefficient on consistently
estimates . In a related context Brewer et al. (2013) emphasize the importance of the increased
13
statistical power from feasible GLS.
For completeness, we employ four weighting strategies. The first is simply OLS, which
gives equal weight to all countries implying that the second term on the right hand side of equation
(4) is set to zero, which is the preferred specification if the coefficient on 1 is not statistically
different from zero. Second, as is common in the literature we use source country sample sizes as
weights, which emphasizes the second right hand side term in equation (4) and is appropriate if
there is no clustering. Third, and in a similar vein to the second, we use as weights the inverse of the
sampling variances of the estimated returns to schooling from the first stage, which is sometimes
discussed in the literature. Finally, we use Dickens style weights based on the estimated two
components in the variance of error terms, which is the preferred approach if the heteroscedasticity
tests suggest that both components of equation (4) are different from zero. Also, in accord with
Solon et al.’s (2013) recommendations, heteroscedasticity-robust standard error estimates are
reported in all cases to account for any remaining heteroscedasticity.
4. Regression Estimates
4.1 First stage regression results
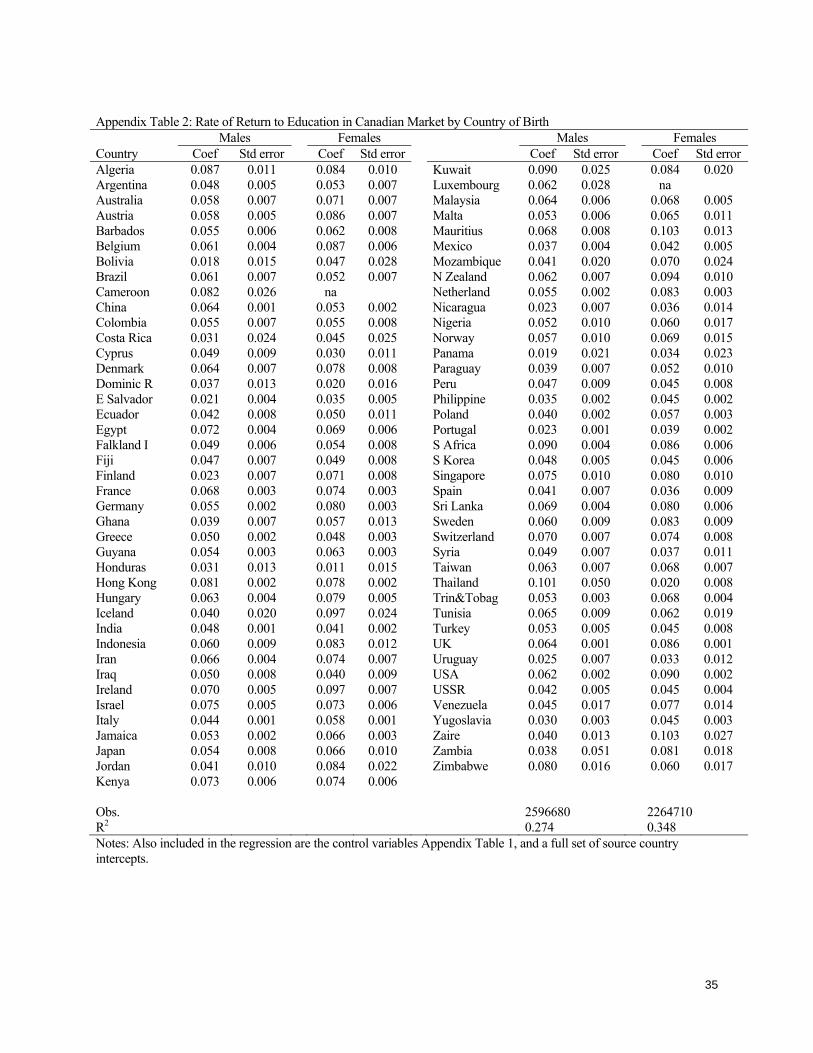
Country specific returns to education from the first stage are reported in Appendix table 2.
Models are also estimated for selected subsamples of the data, as discussed below, but only the
second stage results are presented for the latter. The range of estimates is clearly quite wide, and
there are substantial differences across the sexes with females having larger coefficients 72.5% of
the time. The correlation between the male and female coefficients is 0.476, which is statistically
different from zero with a p-value of 0.0000, however, there are some source countries, such as
Thailand, for which the estimated return to education for males is quite high (0.101), while that for
14
females is quite low (0.020). This may be related to the phenomena observed by Antecol (2000)
who found a strong positive correlation between source country male-female wage gaps and those
observed in the US for first generation immigrants. Also, in Canada the average return to education
for females is larger than that for males.
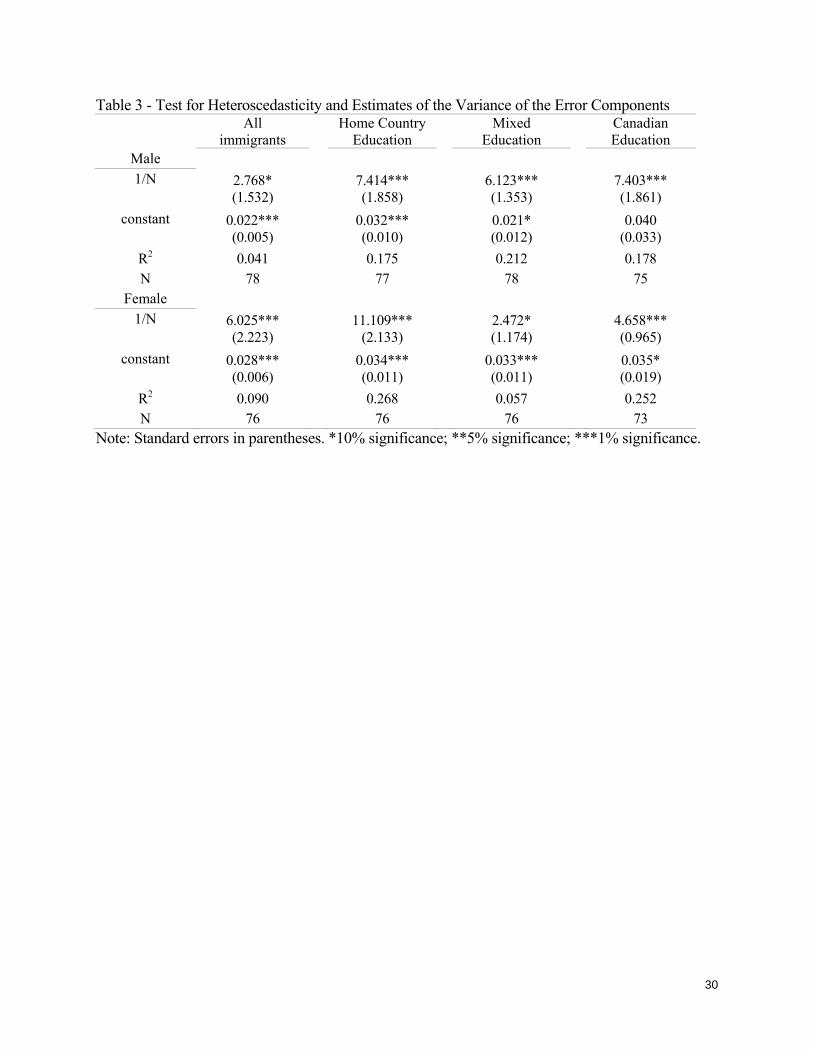
Table 3 presents results from heteroscedasticity tests for the entire sample and various
subsets of it. In all cases the evidence is in favor of an error component model with positive weight
on both components. Clearly, the modest minimum country-level samples together with the
substantial differences in cell sizes as seen in tables 1 and 2 generate appreciable heteroscedasticity,
but there is also a group-specific (cluster) component. Compared to that for the entire sample, the
coefficient on the term grows in magnitude for the subsamples, apparently because the smallest
country samples are reduced, making the heteroscedasticity more serious. In the extreme, some
countries are even lost when the number of individuals per country falls below our threshold for
inclusion in the regressions.
4.2 Second stage regression results
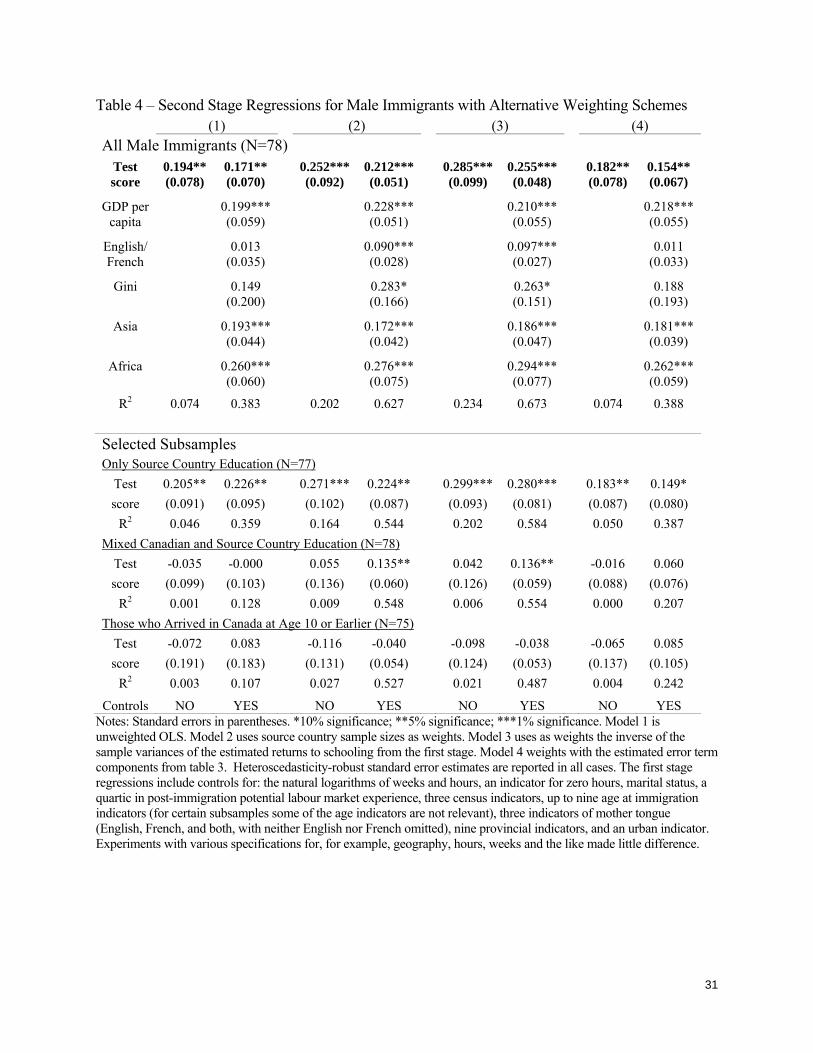
Quality’s coefficient is positive and highly statistically significant, empirically important in
magnitude, and although our preferred specification is (4) using GLS it is robust across
specifications in the male sample as shown in Table 4. Increasing the quality of source country
educational outcomes, via the education system or by other determinants of such outcomes, appears
to substantially augment the accumulation of skills that are relevant for earnings across years of
schooling. After controlling for the full set of country level variables, many of which are
individually statistically significant, the magnitude of the quality of educational outcomes is only
slightly reduced, which implies substantial independent variation between earnings in Canada and
15
source country test scores. The fact that the quality relationship does not appear to be diminished by
including GDP and other variables strengthens the central finding of this paper. Interestingly, the
coefficient on the GDP per capita index is statistically significant, suggesting that, conditional on
quality, immigrants from “high income” countries have higher returns to education, which is
relevant to Manuelli and Seshadri’s (2010) interest in productivity and educational quality across
nations. The same is true for immigrants from Asian and African countries, although the results for
English and French being used in the home country school system and income inequality in the
home country have coefficients that are statistically significant in some specifications, but not in the
preferred model (4).8
Subgroup analyses of the lower panel of table 4 tell an interesting story. These results are
from regressions identical to those in the upper panel, except that they are for various subsets of the
sample.9 First, we select those immigrants who completed their education before immigrating. Next
are those with mixed Canadian and source country education; this sample is the complement to the
first. It explores a result observed by Friedberg (2000), which shows that obtaining domestic
education increases wages and “undoes” some of the low return to foreign education in the Israeli
context. Finally, those who arrive at a very young age – a subset of the second group – are examined
in isolation since they have obtained almost all of their schooling in Canada and should not be
directly affected by the source country test scores.
Looking at the results in the bottom half of table 4, those immigrants who arrive at an older
age (for whom all their education is typically obtained in the source country) have a similar
8 It is worth noting that weighting by 1/N or Var(β) generate smaller standard errors than the preferred specification; plausibly they over-reject by virtue of putting insufficient emphasis on the term "clustering" error component. See the discussion in Dickens (1990) and Solon et al. (2013). 9 One small difference from the earlier regressions is that some of the age at immigration indicators (which are not presented) are not relevant for some of the subgroups.
16
relationship between the quality of source country educational outcomes and Canadian labour
market earnings as observed in the upper panel for all immigrants. In contrast, those who have
Canadian and/or mixed source education are unaffected by the source country index. Apparently, in
accord with Friedberg (2000), obtaining receiving country education seems to reduce or sever the
relationship with home country test scores. Of course, there is endogenous selection into post-
migration Canadian education. Finally, the earnings of those who arrive in Canada at a very young
age are not statistically significantly affected by the index – in fact, the point estimates are
frequently negative; source country educational outcome quality does not matter for those not
educated in the source country. Also, although not displayed, for these groups the returns to years of
schooling are quite large compared to those estimated in earlier regressions. This accords with
Schaafsma and Sweetman (2001) who find that immigrants who arrive prior to age 10 have equal or
greater returns to schooling than the Canadian born and immigrants who arrive later in life.
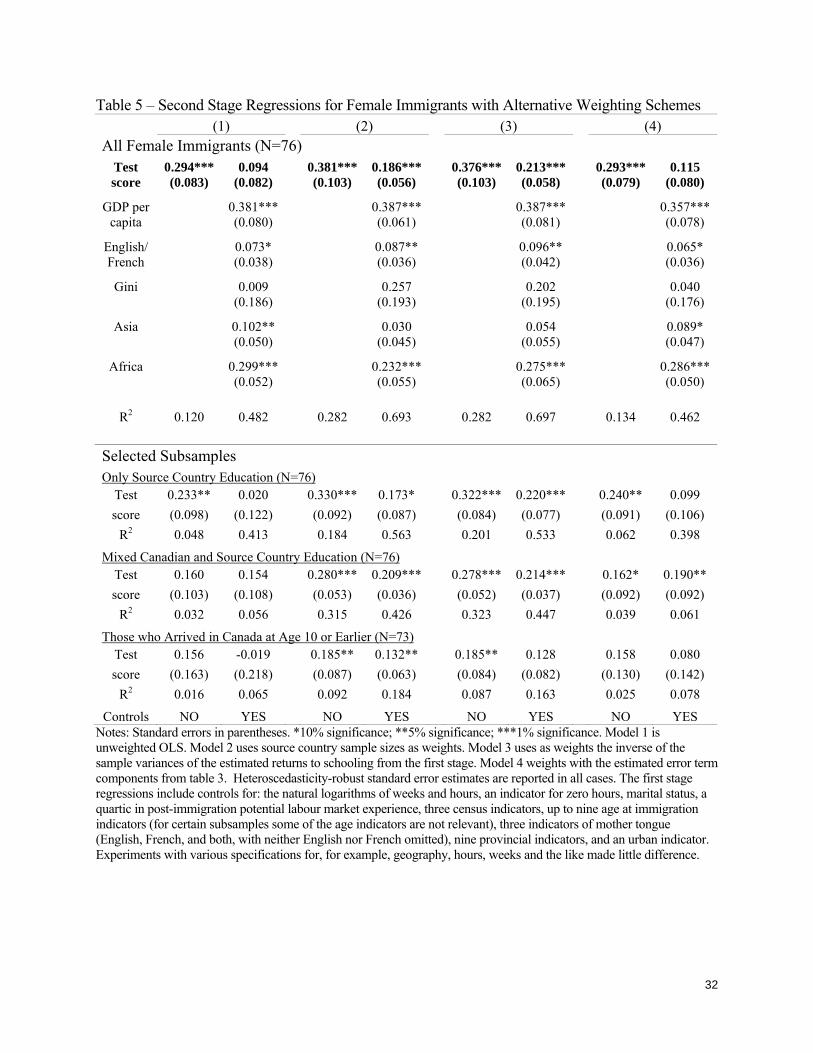
For the female sample, the coefficients on the quality measure are markedly larger than
those for males unconditionally in all four specifications in table 5. However, unlike the males, the
introduction of control variables substantially reduces the females’ coefficient estimates making
them slightly smaller than those for the males but with larger standard errors so that in the preferred
specification they are statistically insignificant. It is not certain why there is such an appreciable
difference between the conditional and unconditional coefficients across the genders, although it is
quite normal for the standard errors in annual earnings regressions for females to be larger than
those for males given the differences in their labour supply patterns; for example, many more
females work part time. Beyond differences in female labour force attachment, one possibility,
commonly discussed in the research and popular literature (e.g., Klasen, 2002; Behrman and Grant,
2010) has to do with quite different approaches to education for women compared to men in certain
17
nations, whereby historically females received less and/or lower quality education than males.
Additionally, Blau, Kahn, and Papps (2011) focus on married women’s labour supply assimilation
profiles and find that they are a function of source country gender roles for an extended period post-
migration. These gender differences may also have something to do with joint mobility decisions as
discussed by Loprest (1992).
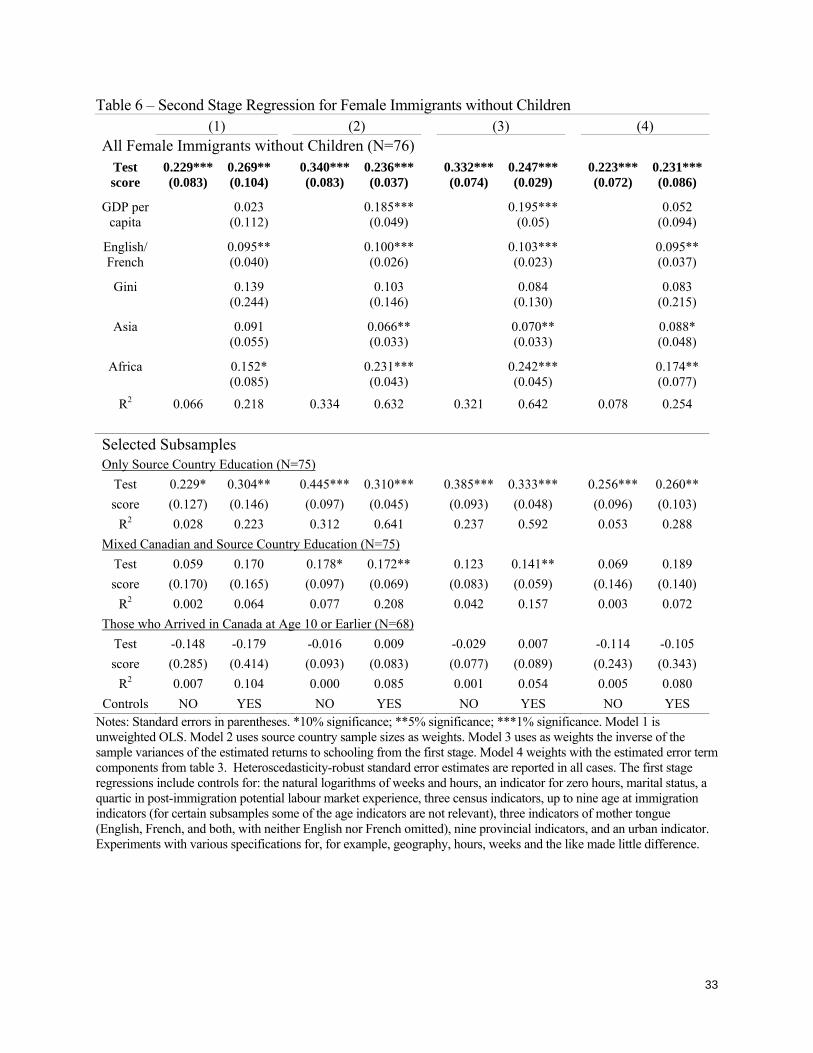
To explore the female coefficient gap further, we focus on females less affected by gender
roles, Table 6 shows results for the subset of females with no unmarried children residing in their
household. The unconditional estimates are very much like those for the males, although larger.
More interestingly, the conditional coefficient estimates are remarkably similar to the unconditional
ones. The patterns across the various subsamples in the lower half of the table are also similar to
those for males. Although not shown, the results for females who are not married are broadly
similar. Overall, it appears that the sub-samples of females who are either without children or not
married yield results very similar to those for males, but once those who are married/with children
are included in the sample, the patterns change appreciably, especially the gaps between the
conditional and unconditional estimates. For female immigrants with limited marital/childcare
responsibilities, the rate of return to education is clearly a function of source country test scores.
Understanding more about the source of these findings, which adds an education quality dimension
to the gender roles phenomena observed by Antecol (2000), and Blau, Kahn, and Papps (2011), is
an interesting area for future research.
Although not shown to save space, we explore correlations between the quality index and
the country-specific intercepts from equation (1). That is, we estimate equation (2) using γi as the
dependent variable. For males the point estimates are small, negative, and not statistically
significant in the preferred specification. For females the coefficient in the unconditional regression
18
from the preferred model is negative and statistically significant, whereas conditional on the Zi
variables it is effectively zero and not statistically significant. It is feasible that the best way to
interpret these results is to suggest that there is no relationship between the country-specific
intercepts and the quality measure. However, since one of the four coefficients is statistically
significant, and all the point estimates are negative, an alternative interpretation is to recognize that,
combined with the findings in tables 4 through 6, individuals with very low years of schooling from
source countries with very high test scores do poorly in terms of earnings. Potentially, the selection
into higher years of schooling in high test score countries is such that those with very low years of
schooling have low productivity for unobserved reasons.
While they are again not shown to save space, we performed a variety of sensitivity tests.
We split the sample according to census year, and into those residing in one of three major cities,
and found that the quality of source country educational outcomes has a similar effect on earnings
across locations and time periods. Of course, some of these estimates are not very precise. The
effects are still present when countries with a large number of observations such as the UK, the
USA, or India are excluded. When weekly earnings were used as the dependent variable the
statistical significance of the coefficients does not change appreciably, but the magnitude of
coefficients increases. Also, restricting the sample to “full-year” workers did not alter the results
substantially. Overall, the results with respect to earnings appear to be quite robust. Interestingly, we
did not find any relationship between the quality measure and various measures of labour supply
such as full-year status or labour force participation.
5. Discussion and Conclusion
Immigrants’ source country educational quality—measured by Hanushek and Kimko’s
19
(2000) index based on six sets of source country test scores in math and science—is seen to be
strongly positively correlated with the rate of return to education in the Canadian labour market. The
index does not measure the test score, or related ability, of any individual, but reflects the quality of
national-level educational outcomes, although those outcomes may have sources beyond the
education system. Simple correlations and graphical analyses by source country show a substantial
positive relationship between the quality of educational outcomes and average Canadian labour
market earnings among immigrants. Regression analysis finds that this measure of quality seems to
operate primarily through the return to education (as opposed to having a direct association with
earnings). For males, adding a range of country-specific controls, and especially source country
GDP per capita, does not attenuate the coefficient on quality very much. In contrast, for females the
gap between the conditional and unconditional coefficient estimates is greater, and the conditional
estimate is not statistically significant for the entire population. However, when the female sample is
restricted to those who are without children residing in their household or who are not married, then
the labour market relationship between annual earnings and the quality measure looks very much
like that for males. Sensitivity tests find that quality of educational outcomes matters for those
educated pre-immigration, but not for those who immigrate at a young age and obtain their
education in Canada. Taken together, these extensions reinforce the idea that it is the source country
quality of educational outcome that is at issue and not some other source country factors such as the
average level of source-country wealth or racial/ethnic discrimination. These findings provide
plausible evidence that the quality of education, as measured by test scores, has a causal impact on
the rate of return to education and through it earnings. However, it remains possible that some
omitted country-level characteristic is correlated with both the country-specific rates of return to
education our test score index.

20
These findings suggest that immigrant economic integration and credential recognition are
more complex than is allowed for by many analyses, which impose a common rate of return on
years of schooling or some similar measure of educational attainment. In terms of credential
recognition, the results in the lower half of tables 4 and 6 paint a picture of a labour market that
values not only “years of school” and/or credentials, but the cognitive content of that education as
measured by this index of test scores. Moreover, these results add support to Hanushek and
Kimko’s (2000), and Hanushek and Woessmann’s (2008), claims that they have captured aspects of
educational outcomes in their index that have substantial impacts in the labour market. In terms of
both the endogenous growth and the educational outcomes literatures, this is consistent with the
notion that the quality of national educational outcomes is associated with labour productivity.
In the future, expanding the information available on educational outcome quality would be
valuable. This might include more refined indexes, for example one for sex-specific school quality,
and expanding the countries for which the quality measure is available. It would also be useful to
consider other aspects of quality that might affect immigrant labour market earnings. For example,
advanced technologies, especially computers, are becoming increasingly important in the labour
market. Undoubtedly the degree to which the most current technologies are employed varies across
national education systems, even at the post-secondary level, and this may matter for labour market
outcomes.
21
References
Antecol, H., 2000. An examination of cross-country differences in the gender gap in labor force
participation rates Labour Economics 7, 409-426.
Aydemir, A., Skuterud, M., 2005. Explaining the Deteriorating Entry Earnings of Canada’s
Immigrant Cohorts: 1966-2000. Canadian Journal of Economics 38 (2), 641-71.
Barro, R.J., 2001. Human Capital and Growth. American Economic Review 91(2),12–17.
Barro, R.J., Lee, J.W., 2012. A New Data Set of Educational Attainment in the World, 1950-2010.
Journal of Development Economics DEVEC-01721, 1-15.
Behrman, J.R., Birdsall, N., 1983. The Quality of Schooling: Quantity alone is misleading.
American Economic Review 73(4),928-946.
Behrman, J.R.. Grant, M.J., 2010. Gender Gaps in Educational Attainment in Less Developed
Countries. Population and Development Review 36 (1), 71-89.
Betts, J. R., 1996. Is There a Link between School Inputs and Earnings? Fresh Scrutiny of an Old
Literature. In Does Money Matter? The Effect of School Resources on Student
Achievement and Adult Success, eds. G. Burtless. Washington, DC: Brookings.
Blau, F.D., Kahn, L.M., Papps, K.L., 2011. Gender, Source Country Characteristics, and Labor
Market Assimilation among Immigrants. Review of Economics and Statistics 93(1), 43–58.
Borjas, G.J., 1995. Assimilation and Changes in Cohort Quality Revisited: What Happened to
Immigrant Earnings in the 1980s? Journal of Labor Economics 13 (2), 201-245.
Borjas, G.J., Friedberg, R.M., 2009. Recent Trends in the Earnings of New Immigrants to the
United States NBER Working Paper No. 15406.
Bratsberg, B., Terrell, D., 2002. School Quality and Returns to Education of U.S. Immigrants.
Economic Inquiry 40 (2), 177-198.
22
Brewer, M., Crossley, T.F., Joyce, R., 2013. Inference with Difference-in-Differences Revisited
Institute for Fiscal Studies, mimeo.
Card, D., Krueger, A.B., 1992. Does School Quality Matter? Returns to Education and the
Characteristics of Public Schools in the United States. Journal of Political Economy 100 (1),
1-40.
Chiswick, B.R., 1978. The Effect of Americanization on the Earnings of Foreign-born Men. Journal
of Political Economy 86 (6), 897-921.
Chiswick, B.R., Miller, P.W., 2010. The Effects of School Quality in the Origin on the Payoff to
Schooling for Immigrants, in G. Epstein and I. Gang, eds., Migration and Culture, (Frontiers
of Economics and Globalization 8), Emerald Group Publishing, 67-103.
Dickens, W. T., 1990. Error Components in Grouped Data: Is It Ever Worth Weighting? The
Review of Economics and Statistics 72 (2), 328-333.
Dustmann, C., Fabbri, F., Preston, I., 2005. The Impact of Immigration on the British Labour
Market. The Economic Journal 115 (November), 324–341.
Ferrer, A., Green, D.A., Riddell, W.C., 2006. The Effect of Literacy on Immigrant Earnings.
Journal of Human Resources 41 (2), 380-410.
Ferrer, A., Riddell, W.C., 2008. Education, Credentials and Immigrant Earnings Canadian Journal
of Economics 41(1),186-216.
Erosa, A., Koreshkova, T., Restuccia, D., 2010. How Important Is Human Capital? A Quantitative
Theory Assessment of World Income Inequality. Review of Economic Studies 77, 1421-
1449.
Friedberg, R., 2000. You Can’t Take It with You? Immigrant Assimilation and the Portability of
Human Capital. Journal of Labor Economics 18, 221-251.
23
Green, D., Riddell, W.C., 2003. Literacy and Earnings: An Investigation of the Interaction of
Cognitive and Unobserved Skills in Earnings Generation Labour Economics 10 (2), 165-84.
Hanushek, E.A., 1996. The Economics of Schooling: Production and Efficiency in Public Schools.
Journal of Economic Literature 24 (3),1141-77.
Hanushek, E.A., Kimko, D.D., 2000. Schooling, Labor-Force Quality, and the Growth of Nations.
American Economic Review 90 (5), 1185-1208.
Hanushek, E.A., Woessmann, L., 2008. The role of cognitive skills in economic development.
Journal of Economic Literature 46 (3), 607-68.
Hanushek, E.A., Woessmann, L., 2012. Do Better Schools Lead to More Growth? Cognitive Skills,
Economic Outcomes, and Causation. Journal of Economic Growth 17 (4), 267-321.
Heckman, J., Layne-Ferrar, A., Todd, P., 1996a. Human Capital Pricing Equations with an
Application to Estimating the Effect of School Quality on Earnings. The Review of
Economics and Statistics 78 (4), 562-610.
Heckman, J., Layne-Ferrar, A., Todd, P., 1996b. Does Measured School Quality Really Matter? An
Examination of the Earnings-Quality Relationship. in G. Burtless ed., Does Money Matter?
The Effect of School Resources on Student Achievement and Adult Success (Washington,
D.C.; Brookings Institution), 192-289.
Heston, A., Summers, R., Aten, B., 2013. Penn World Table Version 7.1, Center for International
Comparisons of Production, Income and Prices at the University of Pennsylvania, October.
Klasen, S., 2002. Low Schooling for Girls, Slower Growth for All? Cross-Country Evidence on the
Effect of Gender Inequality in Education on Economic Development. World Bank
Economic Review 16 (3), 345-373.
Loprest, P.J. 1992. Gender Differences in Wage Growth and Job Mobility. American Economic
24
Review 82 (2), 526-32.
Manuelli, R. E. Seshadri, A., 2010. Human Capital and the Wealth of Nations, Mimeo, University
of Wisconsin Working Paper.
Schaafsma, J., Sweetman, A., 2001. Immigrant Earnings: Age at Immigration Matters. Canadian
Journal of Economics 34 (4), 1066-1099.
Schoellman, T., 2012. Education Quality and Development Accounting Review of Economic
Studies 79 (1), 388-417.
Solon, G., Haider, S.J., Wooldridge, J., 2013. What Are We Weighting For? NBER working paper
18859.
25
Figure 1 – Average Annual Earnings / Return to Education and School Outcome by Source Country
Note: In the upper two panels we fit cubic splines using the unadjusted data. In the lower panel we fit a regression line based on the model (4) without controls from tables 4 and 5. Source: Canadian census data and the Hanushek and Kimko (2000) index of the quality of educational outcomes.
2000
030
000
4000
050
000
6000
0
Mea
n A
nnua
l Ear
ning
s ($
2001
)
0 .2 .4 .6 .8 1
Country Average
Cubic Spline
Male
1500
020
000
2500
030
000
3500
0
0 .2 .4 .6 .8 1
Country Average
Cubic Spline
Female
.02
.04
.06
.08
.1
Firs
t-st
age
Sch
oolin
g C
oeffi
cien
t
0 .2 .4 .6 .8 1
Normalized Test Score
Schooling Coefficient
Fitted Line
.02
.04
.06
.08
.1
0 .2 .4 .6 .8 1
Normalized Test Score
Schooling Coefficient
Fitted Line

26
Table 1 – Descriptive Statistics for Males by Source Country Sample Size Years of School Mean Earnings Test Score
Country N % Mean Std Dev Mean Std Dev H&K Norm Algeria 6355 0.24 16.40 4.06 35608 26440 28.06 0.18
Argentina 9435 0.36 14.07 3.75 40130 26427 48.50 0.56 Australia 13475 0.52 14.57 3.14 49533 31399 59.04 0.76 Austria 9525 0.37 15.34 3.24 51420 33226 56.61 0.71
Barbados 9825 0.38 13.72 3.05 38649 24352 59.80 0.77 Belgium 13880 0.53 14.38 3.41 46717 29095 57.08 0.72 Bolivia 910 0.04 15.07 3.77 34698 23672 27.47 0.17 Brazil 6555 0.25 14.24 3.93 41690 28448 36.60 0.34
Cameroon 500 0.02 18.74 3.20 38610 25098 42.36 0.45 China 110130 4.24 13.64 4.72 34614 26907 64.42 0.86
Columbia 5710 0.22 14.15 3.68 34829 25002 37.87 0.36 Costa Rica 490 0.02 14.12 3.89 33169 24716 46.15 0.52
Cyprus 4370 0.17 13.48 3.87 41301 28808 46.24 0.52 Denmark 12035 0.46 13.69 3.10 47901 29712 61.76 0.81
Dominican R 1710 0.07 12.41 4.13 26526 22019 39.34 0.39 Ecuador 7095 0.27 12.76 3.36 32683 19790 38.99 0.38 Egypt 23210 0.89 16.90 3.16 51060 35374 26.43 0.15
EI Salvador 21050 0.81 12.17 4.05 24832 16490 26.21 0.15 Falkland Is 18835 0.73 14.26 3.29 33980 22838 24.74 0.12
Fiji 16315 0.63 12.63 2.95 32878 20200 58.10 0.74 Finland 8625 0.33 13.54 3.12 45784 26909 59.55 0.77 France 45510 1.75 14.97 3.51 43383 29267 56.00 0.70
Germany 99150 3.82 14.26 3.10 47111 29991 48.68 0.56 Ghana 8670 0.33 14.59 3.66 32551 21747 25.58 0.14 Greece 53950 2.08 11.43 4.22 34481 24578 50.88 0.61 Guyana 58660 2.26 13.67 3.21 37893 23509 51.49 0.62
Honduras 1450 0.06 12.46 4.19 23915 17243 28.59 0.19 Hong Kong 134005 5.16 15.23 3.48 40764 29296 71.85 0.99
Hungary 20425 0.79 14.58 3.18 45040 31315 61.23 0.80 Iceland 315 0.01 13.81 3.27 39396 22677 51.20 0.61 India 182715 7.04 13.91 4.16 38292 26806 20.80 0.05
Indonesia 4410 0.17 15.63 3.01 45444 30303 42.99 0.46 Iran 29325 1.13 15.88 3.30 34199 28632 18.26 0.00 Iraq 9730 0.37 14.07 4.04 31061 26911 27.50 0.17
Ireland 16630 0.64 14.68 3.22 54031 33188 50.20 0.59 Israel 12085 0.47 14.87 3.34 46982 35624 54.46 0.67 Italy 221500 8.53 11.92 3.92 43534 25881 49.41 0.58
Jamaica 70970 2.73 13.08 3.13 34868 22629 48.62 0.56 Japan 8565 0.33 15.11 2.86 44185 28346 65.50 0.88 Jordan 2335 0.09 14.58 3.51 38395 28236 42.28 0.45 Kenya 13280 0.51 15.77 2.95 47500 32203 29.73 0.21 Kuwait 1435 0.06 15.64 2.76 40455 30686 22.50 0.08
Luxembourg 290 0.01 13.42 2.53 40568 23591 44.49 0.49 Malaysia 12070 0.46 15.46 3.32 44890 29294 54.29 0.67
Malta 8485 0.33 12.41 3.29 46589 25018 57.14 0.72 Mauritius 5405 0.21 15.18 3.55 43040 28934 54.95 0.68 Mexico 16440 0.63 10.66 4.79 32420 25182 37.24 0.35
Mozambique 775 0.03 13.85 3.37 35514 23556 27.94 0.18 N Zealand 6795 0.26 14.94 3.16 51027 33228 67.06 0.91 Netherland 73525 2.83 13.71 3.21 46893 27886 54.52 0.67 Nicaragua 4005 0.15 14.29 3.66 26813 18018 27.30 0.17
Nigeria 4095 0.16 17.11 3.26 38913 28793 38.90 0.38 Norway 3220 0.12 14.27 3.14 51375 33002 64.56 0.86
27
Panama 1195 0.05 15.22 3.16 29785 21414 46.78 0.53 Paraguay 5400 0.21 11.13 3.73 39388 23543 39.96 0.40
Peru 8100 0.31 15.12 3.55 32707 24009 41.18 0.43 Philippines 102295 3.94 14.81 2.98 34190 19576 33.54 0.28
Poland 95310 3.67 14.72 3.09 38651 25026 64.37 0.86 Portugal 138220 5.32 9.49 4.15 37402 20562 44.22 0.48 S Africa 18820 0.72 16.21 3.20 58671 39504 51.30 0.61 S Korea 22205 0.86 15.61 2.78 32934 27203 58.55 0.75
Singapore 4625 0.18 15.67 2.93 48886 32609 72.13 1.00 Spain 7240 0.28 13.78 3.87 42406 27513 51.92 0.62
Sri Lanka 36770 1.42 13.49 3.42 29482 20909 42.57 0.45 Sweden 4920 0.19 15.19 3.05 53201 33850 57.43 0.73
Switzerland 12370 0.48 14.67 3.11 42891 29485 61.37 0.80 Syria 7850 0.30 13.76 4.71 35174 28752 30.23 0.22
Taiwan 13500 0.52 16.13 2.81 36159 30215 56.31 0.71 Thailand 910 0.04 13.86 3.97 33169 23245 46.26 0.52
Trin&Tobago 43855 1.69 14.13 3.07 38800 24339 46.43 0.52 Tunisia 3255 0.13 15.68 4.08 37615 29220 40.50 0.41 Turkey 8805 0.34 13.75 4.83 40040 29977 39.72 0.40
UK 410585 15.81 14.64 2.95 51323 30829 62.52 0.82 Uruguay 4620 0.18 13.33 3.44 36862 23885 52.27 0.63
USA 141655 5.45 15.34 3.43 45870 32118 46.77 0.53 USSR 23470 0.90 15.80 3.28 41907 29571 54.65 0.68
Venezuela 3280 0.13 15.05 3.60 41819 30465 39.08 0.39 Yugoslavia 41520 1.60 13.30 3.14 41379 24204 53.97 0.66
Zaire 2280 0.09 16.91 3.39 36098 26722 33.53 0.28 Zambia 1090 0.04 16.34 3.04 52072 36974 36.61 0.34
Zimbabwe 2275 0.09 16.10 2.86 59330 37495 39.64 0.40 Note: Census derived statistics use weights from Statistics Canada. Earnings are in constant $2001 adjusted using the CPI. Canada’s test score is 54.58, or 0.67 normalized. Source: The combined 1986, 1991, 1996, and 2001 Canadian censuses, with quality measures from Hanushek and Kimko (H&K - 2000).
28
Table 2 – Descriptive Statistics for Females by Source Country Sample Size Years of School Mean Earnings Test Score
Country N % Mean Std Dev Mean Std Dev H&K Norm Algeria 2740 0.12 15.74 3.49 23779 19375 28.06 0.18
Argentina 7145 0.32 13.95 3.71 25623 19305 48.50 0.56 Australia 9560 0.42 14.60 2.90 29668 22358 59.04 0.76 Austria 10590 0.47 13.96 2.90 30366 21767 56.61 0.71
Barbados 10435 0.46 13.62 2.71 28187 16721 59.80 0.77 Belgium 11720 0.52 13.93 3.19 28629 21185 57.08 0.72 Bolivia 670 0.03 14.17 3.56 21788 17665 27.47 0.17 Brazil 5815 0.26 13.99 3.80 23969 17831 36.60 0.34
Cameroon -- -- -- -- -- -- 42.36 0.45 China 98720 4.36 12.47 4.48 23545 18492 64.42 0.86
Columbia 6285 0.28 13.79 3.69 21782 16192 37.87 0.36 Costa Rica 730 0.03 13.58 3.74 16713 12543 46.15 0.52
Cyprus 3445 0.15 12.11 3.64 23156 16792 46.24 0.52 Denmark 9475 0.42 13.30 2.69 27324 20084 61.76 0.81
Dominican R 1405 0.06 11.85 4.34 17306 14133 39.34 0.39 Ecuador 6175 0.27 12.69 3.37 21596 14893 38.99 0.38 Egypt 14390 0.64 11.82 4.05 17367 12678 26.43 0.15
EI Salvador 15605 0.69 15.85 2.95 31437 24374 26.21 0.15 Falkland Is 14245 0.63 13.85 3.24 20807 15845 24.74 0.12
Fiji 15065 0.67 12.02 2.60 22007 14543 58.10 0.74 Finland 8065 0.36 13.74 2.98 27750 21057 59.55 0.77 France 35355 1.56 14.96 3.23 29507 21694 56.00 0.70
Germany 84560 3.73 13.78 2.85 27794 21208 48.68 0.56 Ghana 5910 0.26 13.06 3.18 23169 17795 25.58 0.14 Greece 42260 1.87 10.26 3.96 22296 17946 50.88 0.61 Guyana 56450 2.49 13.10 2.86 26264 16760 51.49 0.62
Honduras 1345 0.06 12.57 4.03 18856 16463 28.59 0.19 Hong Kong 122855 5.42 14.18 3.37 29444 21813 71.85 0.99
Hungary 17425 0.77 14.21 2.95 28975 23721 61.23 0.80 Iceland 370 0.02 14.77 2.51 29510 21001 51.20 0.61 India 148715 6.57 13.22 4.09 22848 18376 20.80 0.05
Indonesia 3870 0.17 14.74 3.08 28155 22723 42.99 0.46 Iran 15305 0.68 15.47 3.02 23680 21041 18.26 0.00 Iraq 4270 0.19 13.51 3.82 21471 19685 27.50 0.17
Ireland 13950 0.62 14.29 2.85 31259 24080 50.20 0.59 Israel 8465 0.37 14.73 3.11 30443 24271 54.46 0.67 Italy 158160 6.98 10.99 3.85 25912 18446 49.41 0.58
Jamaica 81130 3.58 13.21 2.91 26143 17050 48.62 0.56 Japan 9125 0.40 14.82 2.53 24443 19731 65.50 0.88 Jordan 1285 0.06 13.75 2.89 23342 19054 42.28 0.45 Kenya 12720 0.56 14.78 2.80 31652 21451 29.73 0.21 Kuwait 945 0.04 15.69 2.80 27697 22309 22.50 0.08
Luxembourg -- -- -- -- -- -- 44.49 0.49 Malaysia 12415 0.55 14.13 3.34 28812 20631 54.29 0.67
Malta 6295 0.28 11.89 2.99 25923 18126 57.14 0.72 Mauritius 4550 0.20 13.89 2.91 30649 18928 54.95 0.68 Mexico 13055 0.58 11.61 4.60 16989 16198 37.24 0.35
Mozambique 585 0.03 12.91 3.73 26317 17796 27.94 0.18 N Zealand 5550 0.25 14.50 2.69 29376 23049 67.06 0.91 Netherland 52105 2.30 13.22 2.77 25562 20007 54.52 0.67 Nicaragua 3185 0.14 13.82 3.42 18537 15005 27.30 0.17
Nigeria 1850 0.08 15.84 3.14 25850 20426 38.90 0.38 Norway 2320 0.10 13.92 2.50 28538 22315 64.56 0.86
29
Panama 755 0.03 15.18 2.88 23949 16740 46.78 0.53 Paraguay 3865 0.17 11.03 3.24 20025 16054 39.96 0.40
Peru 7870 0.35 14.47 3.09 22412 17850 41.18 0.43 Philippines 145395 6.42 14.86 2.96 26507 16622 33.54 0.28
Poland 80800 3.57 14.51 2.92 24685 18416 64.37 0.86 Portugal 106635 4.71 9.52 4.18 22913 14672 44.22 0.48 S Africa 16180 0.71 15.10 2.86 32297 25069 51.30 0.61 S Korea 24505 1.08 14.65 2.66 23342 19412 58.55 0.75
Singapore 4745 0.21 14.68 3.08 32749 25346 72.13 1.00 Spain 4640 0.20 13.25 3.96 25604 18604 51.92 0.62
Sri Lanka 21735 0.96 13.45 2.98 20869 16627 42.57 0.45 Sweden 5145 0.23 14.69 2.96 33442 26397 57.43 0.73
Switzerland 8910 0.39 14.31 2.87 25994 21592 61.37 0.80 Syria 4520 0.20 13.30 4.22 22416 20198 30.23 0.22
Taiwan 13775 0.61 15.51 2.87 26664 23256 56.31 0.71 Thailand 2265 0.10 11.99 5.02 20528 17117 46.26 0.52
Trin&Tobago 45025 1.99 13.84 2.86 27638 17425 46.43 0.52 Tunisia 1165 0.05 14.21 3.88 26855 22360 40.50 0.41 Turkey 5140 0.23 12.99 4.62 24591 20838 39.72 0.40
UK 353905 15.63 13.91 2.62 28628 21120 62.52 0.82 Uruguay 3740 0.17 13.57 3.33 23300 16996 52.27 0.63
USA 160815 7.10 14.99 2.93 28486 23897 46.77 0.53 USSR 20745 0.92 15.53 3.21 26436 21135 54.65 0.68
Venezuela 3180 0.14 15.09 3.46 27126 22184 39.08 0.39 Yugoslavia 36205 1.60 12.51 3.33 25052 17859 53.97 0.66
Zaire 1520 0.07 14.94 3.56 24680 22071 33.53 0.28 Zambia 1100 0.05 15.18 2.84 28220 20817 36.61 0.34
Zimbabwe 1755 0.08 15.13 2.67 28408 20132 39.64 0.40 Note: Census derived statistics use weights from Statistics Canada. Earnings are in constant $2001 adjusted using the CPI. Canada’s test score is 54.58, or 0.67 normalized. Source: The combined 1986, 1991, 1996, and 2001 Canadian censuses, with quality measures from Hanushek and Kimko (H&K - 2000).
30
Table 3 - Test for Heteroscedasticity and Estimates of the Variance of the Error Components
Note: Standard errors in parentheses. *10% significance; **5% significance; ***1% significance.
All
immigrants Home Country
Education Mixed
Education Canadian
Education Male
1/N 2.768* 7.414*** 6.123*** 7.403*** (1.532) (1.858) (1.353) (1.861)
constant 0.022*** 0.032*** 0.021* 0.040 (0.005) (0.010) (0.012) (0.033)
R2 0.041 0.175 0.212 0.178 N 78 77 78 75
Female
1/N 6.025*** 11.109*** 2.472* 4.658*** (2.223) (2.133) (1.174) (0.965)
constant 0.028*** 0.034*** 0.033*** 0.035* (0.006) (0.011) (0.011) (0.019)
R2 0.090 0.268 0.057 0.252 N 76 76 76 73
31
Table 4 – Second Stage Regressions for Male Immigrants with Alternative Weighting Schemes
Notes: Standard errors in parentheses. *10% significance; **5% significance; ***1% significance. Model 1 is unweighted OLS. Model 2 uses source country sample sizes as weights. Model 3 uses as weights the inverse of the sample variances of the estimated returns to schooling from the first stage. Model 4 weights with the estimated error term components from table 3. Heteroscedasticity-robust standard error estimates are reported in all cases. The first stage regressions include controls for: the natural logarithms of weeks and hours, an indicator for zero hours, marital status, a quartic in post-immigration potential labour market experience, three census indicators, up to nine age at immigration indicators (for certain subsamples some of the age indicators are not relevant), three indicators of mother tongue (English, French, and both, with neither English nor French omitted), nine provincial indicators, and an urban indicator. Experiments with various specifications for, for example, geography, hours, weeks and the like made little difference.
(1) (2) (3) (4) All Male Immigrants (N=78)
Test 0.194** 0.171** 0.252*** 0.212*** 0.285*** 0.255*** 0.182** 0.154** score (0.078) (0.070) (0.092) (0.051) (0.099) (0.048) (0.078) (0.067)
GDP per 0.199*** 0.228*** 0.210*** 0.218*** capita (0.059) (0.051) (0.055) (0.055)
English/ 0.013 0.090*** 0.097*** 0.011 French (0.035) (0.028) (0.027) (0.033)
Gini 0.149 0.283* 0.263* 0.188 (0.200) (0.166) (0.151) (0.193)
Asia 0.193*** 0.172*** 0.186*** 0.181*** (0.044) (0.042) (0.047) (0.039)
Africa 0.260*** 0.276*** 0.294*** 0.262*** (0.060) (0.075) (0.077) (0.059)
R2 0.074 0.383 0.202 0.627 0.234 0.673 0.074 0.388
Selected Subsamples Only Source Country Education (N=77)
Test 0.205** 0.226** 0.271*** 0.224** 0.299*** 0.280*** 0.183** 0.149*
score (0.091) (0.095) (0.102) (0.087) (0.093) (0.081) (0.087) (0.080)
R2 0.046 0.359 0.164 0.544 0.202 0.584 0.050 0.387
Mixed Canadian and Source Country Education (N=78)
Test -0.035 -0.000 0.055 0.135** 0.042 0.136** -0.016 0.060
score (0.099) (0.103) (0.136) (0.060) (0.126) (0.059) (0.088) (0.076)
R2 0.001 0.128 0.009 0.548 0.006 0.554 0.000 0.207
Those who Arrived in Canada at Age 10 or Earlier (N=75)
Test -0.072 0.083 -0.116 -0.040 -0.098 -0.038 -0.065 0.085
score (0.191) (0.183) (0.131) (0.054) (0.124) (0.053) (0.137) (0.105)
R2 0.003 0.107 0.027 0.527 0.021 0.487 0.004 0.242
Controls NO YES NO YES NO YES NO YES
32
Table 5 – Second Stage Regressions for Female Immigrants with Alternative Weighting Schemes
Notes: Standard errors in parentheses. *10% significance; **5% significance; ***1% significance. Model 1 is unweighted OLS. Model 2 uses source country sample sizes as weights. Model 3 uses as weights the inverse of the sample variances of the estimated returns to schooling from the first stage. Model 4 weights with the estimated error term components from table 3. Heteroscedasticity-robust standard error estimates are reported in all cases. The first stage regressions include controls for: the natural logarithms of weeks and hours, an indicator for zero hours, marital status, a quartic in post-immigration potential labour market experience, three census indicators, up to nine age at immigration indicators (for certain subsamples some of the age indicators are not relevant), three indicators of mother tongue (English, French, and both, with neither English nor French omitted), nine provincial indicators, and an urban indicator. Experiments with various specifications for, for example, geography, hours, weeks and the like made little difference.
(1) (2) (3) (4) All Female Immigrants (N=76)
Test 0.294*** 0.094 0.381*** 0.186*** 0.376*** 0.213*** 0.293*** 0.115score (0.083) (0.082) (0.103) (0.056) (0.103) (0.058) (0.079) (0.080)
GDP per 0.381*** 0.387*** 0.387*** 0.357*** capita (0.080) (0.061) (0.081) (0.078)
English/ 0.073* 0.087** 0.096** 0.065* French (0.038) (0.036) (0.042) (0.036)
Gini 0.009 0.257 0.202 0.040 (0.186) (0.193) (0.195) (0.176)
Asia 0.102** 0.030 0.054 0.089* (0.050) (0.045) (0.055) (0.047)
Africa 0.299*** 0.232*** 0.275*** 0.286*** (0.052) (0.055) (0.065) (0.050)
R2 0.120 0.482 0.282 0.693 0.282 0.697 0.134 0.462
Selected Subsamples Only Source Country Education (N=76)
Test 0.233** 0.020 0.330*** 0.173* 0.322*** 0.220*** 0.240** 0.099
score (0.098) (0.122) (0.092) (0.087) (0.084) (0.077) (0.091) (0.106)
R2 0.048 0.413 0.184 0.563 0.201 0.533 0.062 0.398
Mixed Canadian and Source Country Education (N=76) Test 0.160 0.154 0.280*** 0.209*** 0.278*** 0.214*** 0.162* 0.190**
score (0.103) (0.108) (0.053) (0.036) (0.052) (0.037) (0.092) (0.092)
R2 0.032 0.056 0.315 0.426 0.323 0.447 0.039 0.061
Those who Arrived in Canada at Age 10 or Earlier (N=73) Test 0.156 -0.019 0.185** 0.132** 0.185** 0.128 0.158 0.080
score (0.163) (0.218) (0.087) (0.063) (0.084) (0.082) (0.130) (0.142)
R2 0.016 0.065 0.092 0.184 0.087 0.163 0.025 0.078
Controls NO YES NO YES NO YES NO YES
33
Table 6 – Second Stage Regression for Female Immigrants without Children
Notes: Standard errors in parentheses. *10% significance; **5% significance; ***1% significance. Model 1 is unweighted OLS. Model 2 uses source country sample sizes as weights. Model 3 uses as weights the inverse of the sample variances of the estimated returns to schooling from the first stage. Model 4 weights with the estimated error term components from table 3. Heteroscedasticity-robust standard error estimates are reported in all cases. The first stage regressions include controls for: the natural logarithms of weeks and hours, an indicator for zero hours, marital status, a quartic in post-immigration potential labour market experience, three census indicators, up to nine age at immigration indicators (for certain subsamples some of the age indicators are not relevant), three indicators of mother tongue (English, French, and both, with neither English nor French omitted), nine provincial indicators, and an urban indicator. Experiments with various specifications for, for example, geography, hours, weeks and the like made little difference.
(1) (2) (3) (4) All Female Immigrants without Children (N=76)
Test 0.229*** 0.269** 0.340*** 0.236*** 0.332*** 0.247*** 0.223*** 0.231***score (0.083) (0.104) (0.083) (0.037) (0.074) (0.029) (0.072) (0.086)
GDP per 0.023 0.185*** 0.195*** 0.052 capita (0.112) (0.049) (0.05) (0.094)
English/ 0.095** 0.100*** 0.103*** 0.095** French (0.040) (0.026) (0.023) (0.037)
Gini 0.139 0.103 0.084 0.083 (0.244) (0.146) (0.130) (0.215)
Asia 0.091 0.066** 0.070** 0.088* (0.055) (0.033) (0.033) (0.048)
Africa 0.152* 0.231*** 0.242*** 0.174** (0.085) (0.043) (0.045) (0.077)
R2 0.066 0.218 0.334 0.632 0.321 0.642 0.078 0.254
Selected Subsamples Only Source Country Education (N=75)
Test 0.229* 0.304** 0.445*** 0.310*** 0.385*** 0.333*** 0.256*** 0.260**
score (0.127) (0.146) (0.097) (0.045) (0.093) (0.048) (0.096) (0.103)
R2 0.028 0.223 0.312 0.641 0.237 0.592 0.053 0.288
Mixed Canadian and Source Country Education (N=75)
Test 0.059 0.170 0.178* 0.172** 0.123 0.141** 0.069 0.189
score (0.170) (0.165) (0.097) (0.069) (0.083) (0.059) (0.146) (0.140)
R2 0.002 0.064 0.077 0.208 0.042 0.157 0.003 0.072
Those who Arrived in Canada at Age 10 or Earlier (N=68)
Test -0.148 -0.179 -0.016 0.009 -0.029 0.007 -0.114 -0.105
score (0.285) (0.414) (0.093) (0.083) (0.077) (0.089) (0.243) (0.343)
R2 0.007 0.104 0.000 0.085 0.001 0.054 0.005 0.080
Controls NO YES NO YES NO YES NO YES
34
Appendix Table 1: Descriptive Statistics of First Stage Regression Variables Male Female Variable Mean Std. Dev. Mean Std. Dev Annual earnings 41992 28294 26317 19870 ln(earnings) 10.348 0.969 9.806 1.082 Weeks of work in the census year 46.83 10.32 44.26 12.86 Hours of work census week 39.65 17.61 31.05 17.45 Zero hours of work (census week) 0.099 0.299 0.153 0.360 Currently Married 0.750 0.433 0.754 0.431 Age 39.469 7.779 39.267 7.753 Potential Canadian experience 15.605 8.447 15.778 8.488 Immigrant Age at Arrival: 0 to 5 0.152 0.359 0.142 0.349 6 to 10 0.112 0.315 0.104 0.305 11 to 15 0.092 0.289 0.087 0.282 16 to 20 0.135 0.342 0.158 0.365 21 to 25 0.203 0.402 0.221 0.415 26 to 30 0.153 0.360 0.144 0.351 31 to 35 0.082 0.274 0.077 0.267 36 to 40 0.043 0.202 0.041 0.199 41 to 45 0.022 0.145 0.019 0.136 46 to 50 0.006 0.078 0.005 0.070 51 to 65 0.001 0.025 0.000 0.020 Urban 0.855 0.352 0.859 0.348
BC 0.178 0.382 0.181 0.385 AB 0.090 0.286 0.091 0.287 SK 0.009 0.095 0.009 0.096 MN 0.030 0.171 0.031 0.173 ON 0.567 0.495 0.577 0.494 PQ 0.108 0.310 0.095 0.293 NB 0.005 0.071 0.006 0.074 NS 0.008 0.092 0.008 0.088 PI 0.001 0.029 0.001 0.029 NF 0.002 0.047 0.002 0.042 Mother Tongue: English 0.358 0.479 0.378 0.485 French 0.027 0.161 0.024 0.152 Both 0.031 0.174 0.031 0.173 Neither 0.584 0.493 0.568 0.495 Years of school 13.897 3.850 13.451 3.606 Census 2001 0.343 0.475 0.364 0.481 1996 0.270 0.444 0.249 0.432 1986 0.210 0.407 0.213 0.409 1981 0.177 0.381 0.174 0.379 Notes: The descriptive statistics are weighted and the number of weighted observations for males is 2,596,680, for females 2,264,710. Dollars are in 2001 equivalents. Source: 1986, 1991, 1996 and 2001 Canadian Censuses.
35
Appendix Table 2: Rate of Return to Education in Canadian Market by Country of Birth Males Females Males Females Country Coef Std error Coef Std error Coef Std error Coef Std error Algeria 0.087 0.011 0.084 0.010 Kuwait 0.090 0.025 0.084 0.020 Argentina 0.048 0.005 0.053 0.007 Luxembourg 0.062 0.028 na Australia 0.058 0.007 0.071 0.007 Malaysia 0.064 0.006 0.068 0.005 Austria 0.058 0.005 0.086 0.007 Malta 0.053 0.006 0.065 0.011 Barbados 0.055 0.006 0.062 0.008 Mauritius 0.068 0.008 0.103 0.013 Belgium 0.061 0.004 0.087 0.006 Mexico 0.037 0.004 0.042 0.005 Bolivia 0.018 0.015 0.047 0.028 Mozambique 0.041 0.020 0.070 0.024 Brazil 0.061 0.007 0.052 0.007 N Zealand 0.062 0.007 0.094 0.010 Cameroon 0.082 0.026 na Netherland 0.055 0.002 0.083 0.003 China 0.064 0.001 0.053 0.002 Nicaragua 0.023 0.007 0.036 0.014 Colombia 0.055 0.007 0.055 0.008 Nigeria 0.052 0.010 0.060 0.017 Costa Rica 0.031 0.024 0.045 0.025 Norway 0.057 0.010 0.069 0.015 Cyprus 0.049 0.009 0.030 0.011 Panama 0.019 0.021 0.034 0.023 Denmark 0.064 0.007 0.078 0.008 Paraguay 0.039 0.007 0.052 0.010 Dominic R 0.037 0.013 0.020 0.016 Peru 0.047 0.009 0.045 0.008 E Salvador 0.021 0.004 0.035 0.005 Philippine 0.035 0.002 0.045 0.002 Ecuador 0.042 0.008 0.050 0.011 Poland 0.040 0.002 0.057 0.003 Egypt 0.072 0.004 0.069 0.006 Portugal 0.023 0.001 0.039 0.002 Falkland I 0.049 0.006 0.054 0.008 S Africa 0.090 0.004 0.086 0.006 Fiji 0.047 0.007 0.049 0.008 S Korea 0.048 0.005 0.045 0.006 Finland 0.023 0.007 0.071 0.008 Singapore 0.075 0.010 0.080 0.010 France 0.068 0.003 0.074 0.003 Spain 0.041 0.007 0.036 0.009 Germany 0.055 0.002 0.080 0.003 Sri Lanka 0.069 0.004 0.080 0.006 Ghana 0.039 0.007 0.057 0.013 Sweden 0.060 0.009 0.083 0.009 Greece 0.050 0.002 0.048 0.003 Switzerland 0.070 0.007 0.074 0.008 Guyana 0.054 0.003 0.063 0.003 Syria 0.049 0.007 0.037 0.011 Honduras 0.031 0.013 0.011 0.015 Taiwan 0.063 0.007 0.068 0.007 Hong Kong 0.081 0.002 0.078 0.002 Thailand 0.101 0.050 0.020 0.008 Hungary 0.063 0.004 0.079 0.005 Trin&Tobag 0.053 0.003 0.068 0.004 Iceland 0.040 0.020 0.097 0.024 Tunisia 0.065 0.009 0.062 0.019 India 0.048 0.001 0.041 0.002 Turkey 0.053 0.005 0.045 0.008 Indonesia 0.060 0.009 0.083 0.012 UK 0.064 0.001 0.086 0.001 Iran 0.066 0.004 0.074 0.007 Uruguay 0.025 0.007 0.033 0.012 Iraq 0.050 0.008 0.040 0.009 USA 0.062 0.002 0.090 0.002 Ireland 0.070 0.005 0.097 0.007 USSR 0.042 0.005 0.045 0.004 Israel 0.075 0.005 0.073 0.006 Venezuela 0.045 0.017 0.077 0.014 Italy 0.044 0.001 0.058 0.001 Yugoslavia 0.030 0.003 0.045 0.003 Jamaica 0.053 0.002 0.066 0.003 Zaire 0.040 0.013 0.103 0.027 Japan 0.054 0.008 0.066 0.010 Zambia 0.038 0.051 0.081 0.018 Jordan 0.041 0.010 0.084 0.022 Zimbabwe 0.080 0.016 0.060 0.017 Kenya 0.073 0.006 0.074 0.006 Obs. 2596680 2264710 R2 0.274 0.348 Notes: Also included in the regression are the control variables Appendix Table 1, and a full set of source country intercepts.