Embed Size (px)
Citation preview

Ph.D thesis
IN SCIENCE OF CROP PRODUCTION
XXIV Cycle (2009-2011)
AGR/03
The qualitative characterization of
‘Sangiovese’ grapevine according to
the area and cultivation conditions
CANDIDATE Eleonora Ducci
TUTORS COORDINATOR Prof. Giancarlo Scalabrelli Prof. Alberto Pardossi
Dr. Claudio D‟Onofrio
November 2013
Department of Agriculture,
Food and Environment
(DAFE)
University of Pisa, Italy


Life is wonderful all you need is to look at it with the
‘right eyes’


TABLE OF CONTENTS
1. INTRODUCTION .................................................................................................... 1
1.1 Sangiovese cultivar ................................................................................................. 1
1.1.1 Adaptability of the soil ................................................................................. 5
1.1.2 Adaptability to temperatures ......................................................................... 6
1.1.3 Adaptability to rootstock .............................................................................. 7
1.1.4 Adaptation to the training system and density of plantation ........................ 8
1.1.5 Adaptability to summer pruning ................................................................... 9
1.2 The terroir ............................................................................................................. 12
1.2.1 The terroir and its evolution ....................................................................... 12
1.2.2 The vineyard factors ................................................................................... 16
1.2.3 Terroir of Tuscany ...................................................................................... 19
1.3 Aim of the thesis ................................................................................................... 22
2. MATERIALS AND METHODS ........................................................................... 23
2.1 Plant material ........................................................................................................ 23
2.2 Technological maturity ......................................................................................... 25
2.3 Sensory analysis on grapes ................................................................................... 25
2.4 Phenolic compounds analysis ............................................................................... 27
2.5 Aroma compounds analysis .................................................................................. 27
2.5.1 Preparation of grape sample ....................................................................... 28
2.5.2 Enzymatic hydrolysis of glycosides ........................................................... 28
2.5.3 Acid hydrolysis of glycosides ..................................................................... 29
2.5.4 Gas chromatography – mass spectrometry ................................................. 29
2.6 Statistical analysis ................................................................................................. 30
3. RESULTS ................................................................................................................ 31
3.1 Weather station location and study of the historical sequences ............................ 31
3.2 Climatic characteristics ......................................................................................... 35
3.3 Vineyards‟s characteristics ................................................................................... 43
3.3.1 Chianti Colline Pisane ................................................................................ 43
3.3.1.1 Beconcini estate ................................................................................ 43
3.3.2 Montecucco ................................................................................................. 44
3.3.2.1 ColleMassari estate ........................................................................... 44
3.3.2.2 Salustri estate ................................................................................... 47
3.3.3 Morellino di Scansano ................................................................................ 48
3.3.3.1 Fattoria di Magliano estate ............................................................... 48
3.3.4 Brunello di Montalcino ............................................................................... 49
3.3.4.1 Col d‟Orcia estate ............................................................................. 49
3.3.4.2 La Mannella estate ............................................................................ 49
3.3.4.3 Casanova di Neri estate .................................................................... 50
3.3.5 Chianti Classico .......................................................................................... 51
3.3.5.1 Castello di Albola estate ................................................................... 51
3.3.5.2 Capannelle estate .............................................................................. 51
3.4. Soil‟s characteristics ............................................................................................ 52
3.5 The study of geopedologic, orographic and viticultural aspects: the ColleMassari
estate .................................................................................................................... 56

3.5.1 Campo La Mora ......................................................................................... 58
3.5.2 Cerrete ........................................................................................................ 60
3.5.3 Orto del Prete ............................................................................................. 63
3.5.4 Vigna Vecchia ............................................................................................ 65
3.6 Harvest date .......................................................................................................... 69
3.7 Sensorial characteristics of the grapes at harvest‟s time ...................................... 70
3.7.1 Montecucco area ........................................................................................ 86
3.7.2 Col d‟Orcia estate ..................................................................................... 103
3.8. Technological and phenolic characteristics of the grapes at harvest‟s time ..... 119
3.8.1 Montecucco area ...................................................................................... 131 3.8.2 Col d‟Orcia estate ..................................................................................... 143
3.9 Aroma characteristics of the grapes at harvest‟s time ....................................... 156
3.9.1 Montecucco area ...................................................................................... 173
3.9.2 Col d‟Orcia estate ..................................................................................... 184
4. DISCUSSION AND CONCLUSIONS ............................................................... 195
5. REFERENCES ..................................................................................................... 202

1
1. INTRODUCTION
1.1 Sangiovese cultivar
Sangiovese is the base vine variety of Tuscan enology as it is the main component of the 7
Tuscan DOCG, since its presence varies from a minimum of 50% to a maximum of 100%:
„Brunello di Montalcino‟ (100%), „Carmignano‟ (50%), „Chianti‟ (70-100%), „Chianti
Classico‟ (80-100%), „Morellino di Scansano‟ (85%), „Montecucco‟ (90%) and „Nobile di
Montepulciano‟ (70%). It has many synonyms, the official one reported in National Register
of the Varieties of Vines, „Sangioveto‟, and others certified as „Brunello‟ (Tuscany),
„Morellino‟ (Scansano-Grosseto), „Nielluccio‟ (Corse, FR), „Prugnolo‟ (Tuscany), „Prugnole
gentile‟, „Sangiogheto‟, „Sangiovese grosso‟, „Sangiovese piccolo‟, „Sangioveto montanino‟,
„San Zoveto‟, „Uvetta‟ (www.vitisdb.it). Reconstructing the origin of this vine is not easy
since there is a lack of historical reference antecedent the XVI century. The importance of this
variety in wine production in central Italy and its leading role today in Italian enology justifies
the interest in searching the origin of its name. Due to lack of accurate references it was first
thought that it recalled the idea of blood, one of the symbols linked to wine and to offering
sacrifices to the gods, the blood of Jove (sanguis Jovis). The semantics of the word recalls a
game (jugum), and sustains the hypothesis of sangue-gio-vese, hill games; another hypothesis
is that of wine „giovevole al sangue‟ (Mainardi 2001). Other connections have been
hypothesized with language and popular customs, between the Etruscan language, religious
aspects and the meaning of the term „Sangiovese‟. An Etruscan phrase was found on a
bandage used to wrap an Egyptian mummy of the first century AD, it read „s‟antist‟celi‟ with
the word „vinum‟ and it is thought that it referred to a type of wine as it is very close in
assonance to terms that describe „Sangiovese‟. Other assonances linked to rituals and
„Sangiovese‟, as in thana-chvil (votive offering), tbcms.zusleva (ritual offering), thezin-eis
(offering to the god), which is very close to the Romagnolo term sanzve used for
„Sangiovese‟, this term means father or ancestor to mean the wine of my father‟s or an
offering to the fathers (Mainardi, 2001).
Linking the origin of the Sangiovese vine variety to the Etruscan culture is fascinating, recent
discoveries, the close relationship between „Ciliegiolo‟ e „Calabrese di
Montenuovo‟(Vouillamoz et al., 2007) and (Bergamini et al., 2012), do not concord with
these hypothesis even if they do not totally negate them as shown in other research (Di Vecchi
et. al, 2007). A current hypothesis associates the name of the vine to „sangiovannese‟ as in

2
originating in „San Giovanni Valdarno‟, others believe the origin of the name to come from
dialect „sangiovannina‟ early grapes. The first reference to the existence of this vine variety in
Tuscany dates back to Soderini (1590) who calls it „Sangiogheto‟. At the end of the sixteenth
century it appears in a painting by Bartolomeo del Bimbo known as „il Bimbi‟ by the name
„Sangioeto‟ (Basso, 1982), while Trinci (1738) describes the „SanZoveto‟ as „a fine quality
grape and bountiful in production‟. Moreover the reliable productivity characteristics of the
„San Gioveto‟ are praised by the Villifranchi in his „Oenologia Toscana‟ (1773) defining it
„the protagonist of Tuscan wine superb in taste and generous‟. Villifranchi (1773) also refers
to „San Gioveto‟ strong (synonymous of dog deceiver) and „San Gioveto romano‟ that is
cultivated in Marca and in particular in the Faentino area where the wine produced is
generous „call it San Gioveto‟. The existence of the „Sangovese‟ wine and the description of
its qualities are found in convivial texts and in the dithyramb of 1818 „Il Bacco in Romagna‟
by the abbot Piolanti (Mainardi, l.c.).
From Tuscany and „Romagna‟ the elected areas the cultivation on „Sangiovese‟ spread
progressively to other Italian regions, „Marche‟, „Umbria‟, „Abruzzo‟, „Lazio‟ and „Puglia‟
(Mainardi l.c.) and „Corsica‟. Most of this growth occurred at the end of the nineteenth
century and the beginning of the twentieth century with the reconstruction post phylloxeras.
A large scale renovation of the plants took place in the 60s and 70s thanks to the „Piano
Verde‟, that gave incentives to expand vineyards. The setting for quantity and choice of plant
sites which were not always the best did not help the development of this vine variety, but
have indeed limited it. The obsolescence of these vineyards has requested renovation, paying
particular attention to choice of soil, cloning material and plant design. The latter has been
orientated towards an increase in plant density and the accomplishment of management
techniques to obtain high quality grapes, able to produce important red wines. (Loreti and
Scalabrelli, 2007). At present the „Sangiovese‟ vine is the most diffused in Italy, and
according to the ISTAT (General Census Survey), in the year 2000 about 70.000 hectares
were cultivated covering over 10% of the total surface in vineyards; this data is also
confirmed in the 2010 statistics. In Tuscany it is the most diffused vine variety, covering
37.170 ha 67,4% of the regional viticulture surface. As for the agronomic properties, the
„Sangiovese‟ variety is characterized by a rather early bud burst, found along the Tuscan
coastal areas in the last 10 days of March and about a week later in the inner areas. This vine
needs high temperatures for ripening (Turri and Intrieri, 1988), reaching its peak around the
last 10 days of September in the coastal areas while inland and hilly areas early to mid
October. Adaptation to colder climes is linked to rainfall in the month preceding harvest. The

3
high fertility of the base gems accounts for the spur pruning which can be very short in the
hottest areas („Montalcino‟, „Maremma‟). Many types of training system can be practiced,
short pruning (tree-like, spur pruned cordon, GDC), mixed (Guyot, „capovolto‟), long
(„tendone‟): these are chosen on the basis of climatic conditions and soil fertility. Rootstocks
are now more used than in the past in areas where there are no risks of prolonged drought,
high density plantations are employed choosing less vigorous subjects (161/49,101,14), to
110R where there is a need for more drought tolerance, while in the most difficult conditions
1103P is used.
Figure 1. Sangiovese‟s bunch.
It is greatly adaptable to diverse environments, even if in coastal areas it can suffer from late
frosts. High quality grapes are produced in low fertility soils, well drained and dry climes,
with moderate lack of water from veraison to ripening. For a better aroma complexity it is
also important to have good temperature range. The terroir effect is well shown by the
particular characteristics of wines from different areas. As already stated the „Sangiovese‟ is
the base vine variety in Tuscan oenology besides being the king of wines like „Chianti‟,
„Brunello di Montalcino‟, „Nobile di Montepulciano‟ and „Morellino di Scansano‟ (fig. 2), it
is the main vine variety in the production of almost all red DOC and IGT wines in Tuscany.
The bunch (fig. 1) is average size, conic in
shape and average compactness.
The sugar levels reached in the right
conditions is high, while the anthocyanins
content of the skins is greatly influenced
by the site, the cultivation technique and
in particular by the vigour.
The different clones offer a variety of
choice according to the morphology and
the qualitative characteristics of the bunch
(Moretti et al., 2007; Tamai, 2009), so as
to allow the realization of polyclonal
vineyards.

4
Figure 2. Consortium Logos of some DOCG produced with Sangiovese.
Among the DOC there are „Barco Reale di Carmignano‟, „Bolgheri rosso‟, „Candia dei Colli
Apuani‟, „Capalbio‟, „Colli dell'Etruria Centrale‟, „Colli di Luni‟, „Colline Lucchesi‟,
„Cortona‟, „Elba‟, „Montecarlo‟, „Montecucco‟, „Monteregio di Massa Marittima‟,
„Montescudaio‟, „Orcia‟, „Parrina‟, „Pietraviva‟, „Pomino‟, „Rosso di Montalcino‟, „Rosso di
Montepulciano‟, „San Gimignano rosso‟, „Sant'Antimo‟, „Sovana‟, „Terratico di Bibbona‟,
„Val di Cornia‟, „Valdichiana‟, „Vin Santo Occhio di Pernice‟. Among the IGT „Sangiovese‟
is among the components of: „Alta Valle del Greve‟, „Colli della Toscana centrale‟,
„Maremma Toscana‟, „Montecastelli‟, „Toscana‟, „Val di Magra‟.
„Sangiovese‟ is also used in the production of DOP and IGP wines in other regions too;
„Bardolino‟, „Garda Est,‟ „Valdadige,‟ „Valpolicella‟, „Sangiovese di Romagna‟,
„Montefalco‟, „Rosso piceno‟, „Rosso Conero‟, „Velletri‟ and „Gioia del Colle‟.
Depending on the area, grape characteristics and level of phenol ripening, it is possible to
obtain rosé wines, young red wines ready to be drunk and wines suited to short, mid or long
maturation. One of the problems with „Sangiovese‟ is linked to the quality of the grapes
which are heavily dependent on the climatic course of the year. The grapes can be turned into
wine in blend with other vine varieties according to the objectives desired. Grapes that are in a

5
good healthy state give a tannic product needing refinement before it can be consumed. The
colour stability greatly depends on the anthocyanic composition, that in the „Sangiovese‟ is
not optimal for lack of malvidin; however this problem has been mitigated improving the
production techniques (minor yield per plant) and by using qualitative clones. „Sangiovese‟ is
also a blend vine, as shown by the formula in „Chianti‟ del „Barone Bettino Ricasoli‟ (7/10 of
„Sangiovese‟, 2/10 od „Canaiolo nero‟ and 1/10 of „Malvasia bianca lunga‟), and it has
evolved from being a year wine to refined wine with the progressive reduction of white berry
vines. The red berry vines used in the blend are there to integrate the characteristics of the
„Sangiovese‟ wines in particular years or in less favourable conditions to give greater colour
stability, greater sense of smell and mellowness. The young wine is an intense rich red colour,
red fruit scented and at times floral and or vegetable, dry tasting, correctly tannic. Wines that
are to be refined are more structured and have a higher acidity level. With ageing the colour
tends to garnet and with the fruity note there are the evolved scents of tobacco, balsamic and
liquorices.
1.1.1 Adaptability of the soil
Tests conducted on the influence of the soil on the quality of „Sangiovese‟ grapes in the
„Chianti Classico‟ area, have shown a link between the sugar content of the grapes and nature
and soil composition and in particular the organic and clay content. The best soils are those
with average fertility, clayey-chalky and well framed, that dry quickly during ripening and as
such in these soils the vegetative development of the plants is more balanced. According to
Bertuccioli (2000) the most interesting values of the chemical parameters linked to quality,
were found in areas with a higher percentage of sand and with a lower rate of phosphorous
and potassium that can be assimilated. Tomasi and others (2006), have pointed out that in
cases of grapes from non chalky soils, in the corresponding wines there was a strong spicy
scent, cinnamon and cherry, but above all they presented a fullness of taste that was not
present in chalky soils. In these soils however, the aromatic fineness and persistence
triumphed, and the scent of violets and white flowers. At high temperatures the monoterpenic
substances are lower. The reduction of aromatic content of the grapes, due to high
temperatures, is so strong so as to also cancel the positive action linked to water content of the
soil. It was also possible to note the norisoprenoids components present in the grapes grown
in quite damp soils. The high temperatures therefore compromised the aromatic quality,
independently from the water content in the soils.

6
From a survey carried out by the CRA-VIT (Sebastiani and Storchi, 2004) on a number of
vineyards in the „Arezzo‟ province, the influence of soil management relative to a number of
vegetal-productive plant response emerged. Therefore, the positive response of „Sangiovese‟
to grass cover became obvious, even if limited to alternate rows. In particular, with this
technique the result was a lower average weight of the bunch and of the berries, but with
positive effects on sugar content and colouring substances and on the state of health of the
grapes at harvest. All this had already been noted by Egger et al., (1996). These results have
also been confirmed in other research by Bertuccioli et al., (2000) carried out on the grass
cover in two areas of the „Chianti Classico‟. The wines from grass covered vineyards have
clearly shown the positive influence of this technique on the quality of the product having
higher alcohol content and greater net extract, total polyphenols and anthocyanins compared
to vineyards situated on land worked so as to support the vigour of the vine (Pisani et al.,
2000). Triolo and Materazzi (Triolo et al., 2000) too have noted how grass cover favours
significant reduction in Botrytis, particularly in years of low rainfall.
1.1.2 Adaptability to temperatures
Intrieri, already in the 1980s, underlined the resistance to the cold of the main buds of the
„Sangiovese‟. After the bad frost in January 1985 at -18°C, the bud mortality was just over
20%,but with the further fall of 1°C the mortality rose to 90% thus setting the critical
threshold to the winter cold at an interesting -18°, -19°C. In tests in the 1970s the
environmental stability in the phonological phase was evaluated and variable behaviour per
bud, flower and veraison was observed in that the vine often suffers environment conditions
but not always in an univocal way (Calò et al., 1977). Test Results carried out in 2004 have
underlined the importance of high thermal summing for the perfect completion of the
vegetative cycle and that the best quality is determined by temperature along with water
availability in the fruit set- veraison period, so much so that the best years are correlated to
higher average temperatures summing and lower rainfall values in the vegetative period. In
the „Montepulciano‟ area there was a positive correlation between the altitude of the
vineyards and malic acid content in the must, as late harvesting occurs in altitude and this
confirms the temperature needs of this vine variety during ripening (Egger et al., 1986).
Systematic research conducted since 1987 on the relationship between variety and
environment, has shown that the „Sangiovese‟ is more reactive to pedoclimatic and cultivation
solicitations. Results from four different years (1987-1990) from the main vine growing areas

7
of Tuscany („Chianti Classico‟, „Montalcino‟ and „Montepulciano‟), show higher sugar levels
in areas where the mean temperatures are higher and rainfall levels are lower during the
vegetative period. The values obtained from the Huglin index, on the other hand, appeared
less correlated to the sugar content at harvest. In the „Montepulciano‟ area there was a
positive close correlation between the altitude of the vineyards and the malic acid content and
the titratable acid of the must. In relation to altitude the ripening period too is later due to the
lower temperature levels in the period preceding harvest. Research in the „Chianti Classico‟
area clearly show the vine sensitivity to rising temperatures. In particular, comparing the two
maturation curves obtained from vines with the same productive weight but in different
altitude environments (600 and 350 m. above sea level) showed for the latter a constant higher
sugar level (Scalabrelli et al.,1996). This difference is to be attributed presumably to the
beneficial effects that rising temperatures together with periods of sun exposition, can have on
the total photosynthetic yield of the foliage as a consequence and the ability to accumulate dry
substance in the bunches.
Bunch size is determined by climate and temperature and is one of the determining factors in
the synthesis processes, accumulation and conservation inside the berry of the aromatic
mixtures. Another important positive link is between climatic parameters and aromatic
substances between the norisoprenoids content and potential value of photo- synthetically
active radiation. It is necessary to add the effect of the active limestone content in the soils, in
fact in equal active photo synthetic radiation the norisoprenoids content is distinctly higher in
vineyards with greater limestone content (Failla, 2006).
1.1.3 Adaptability to rootstock
The adoption of rootstock suitable in different ecopedologic and cultural conditions and
productive typologies is of crucial importance in order to obtain the qual-quantitative results
desired. Even in this sector there is much reliable data from research carried out on the
„Sangiovese‟. In the area of the „Morellino di Scansano‟, Di Collato et al., (2000) noted the
tendency of higher sugar concentration levels in grapes in vines grafted on 110R followed by
SO4 and 41B. A good hold on acidity levels was observed in combinations with rootstock 140
Ru, 3309C and 41B, while in most of the other thesis the values registered were much lower.
Taking into account the generalized tendency to the decreasing productive yields in the areas
of Denomination of Origin, where red wines are produced, it is worthwhile noting that lower
productivity induced by 41B, differently from other rootstocks, determined some of the
8
highest sugar gradation, while keeping a good hold on acidity levels. In the „Chianti Classico‟
the experimental trials carried out on rootstocks by Scalabrelli and Loreti (Scalabrelli et al.,
2000) evidenced the different influence on „Sangiovese‟ both in the vegetative-productive
performances and in qualitative aspect. On the basis of the results the SO4 is not the ideal
rootstock for the pedoclimatic characteristics of this area. With this rootstock, the vines often
produce an excessive quantity of grapes with a mediocre sugar level.
The rootstocks by V. Berlandieri x V. Rupestris (775P, 779P, 1103P), even if producing a
certain vigour and productivity, have also determined a reasonable sugar gradation of the
grapes. However, some years it has been necessary to reduce the quantities produced. The
140Ru, 110R, 225Ru, 420A, 34EM, rootstocks have induced average to low vigour and quite
good sugar gradation and production. Rootstocks 101.14 and 3309C have induced lower
vigour, higher sugar gradation and relatively low productivity even lower than the regulatory
foreseen for the „Chianti Classico‟ DOCG. From this we can ascertain that the 110R is the
best rootstock for the global performance of the „Sangiovese‟ in the „Chianti Classico‟ soil
conditions Scalabrelli et al., l.c.).
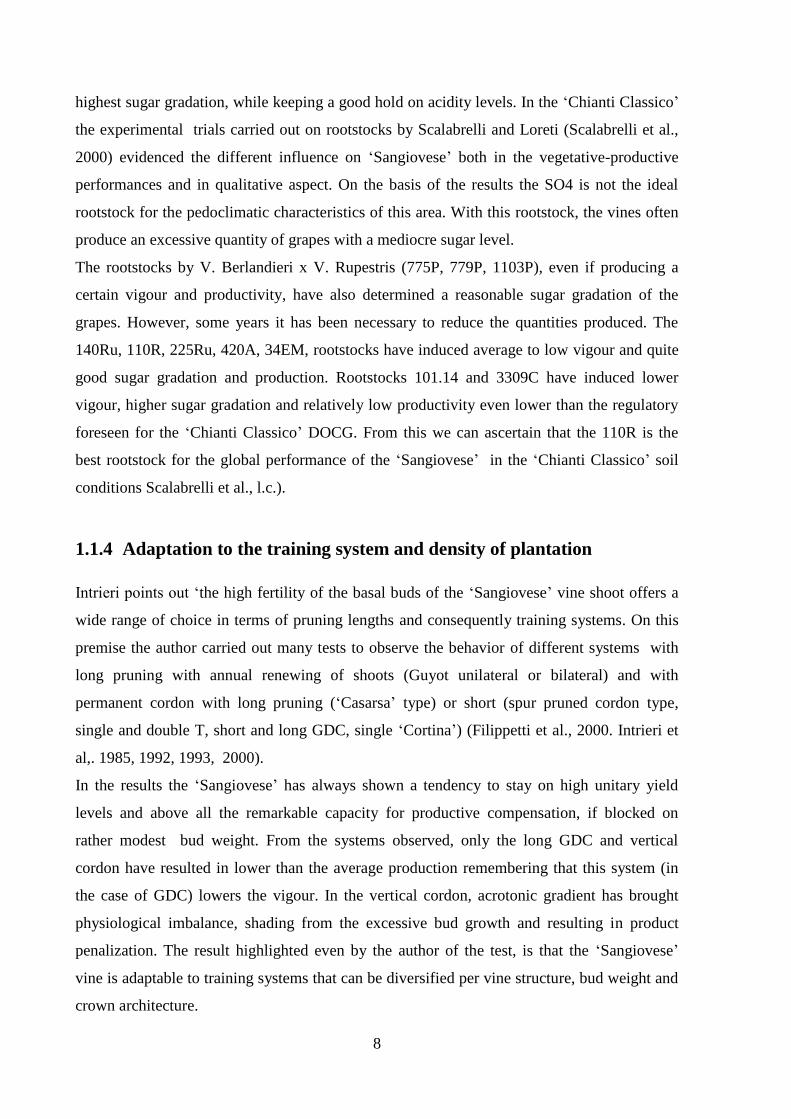
1.1.4 Adaptation to the training system and density of plantation
Intrieri points out „the high fertility of the basal buds of the „Sangiovese‟ vine shoot offers a
wide range of choice in terms of pruning lengths and consequently training systems. On this
premise the author carried out many tests to observe the behavior of different systems with
long pruning with annual renewing of shoots (Guyot unilateral or bilateral) and with
permanent cordon with long pruning („Casarsa‟ type) or short (spur pruned cordon type,
single and double T, short and long GDC, single „Cortina‟) (Filippetti et al., 2000. Intrieri et
al,. 1985, 1992, 1993, 2000).
In the results the „Sangiovese‟ has always shown a tendency to stay on high unitary yield
levels and above all the remarkable capacity for productive compensation, if blocked on
rather modest bud weight. From the systems observed, only the long GDC and vertical
cordon have resulted in lower than the average production remembering that this system (in
the case of GDC) lowers the vigour. In the vertical cordon, acrotonic gradient has brought
physiological imbalance, shading from the excessive bud growth and resulting in product
penalization. The result highlighted even by the author of the test, is that the „Sangiovese‟
vine is adaptable to training systems that can be diversified per vine structure, bud weight and
crown architecture.

9
Varying these conditions, the vine maintains a strong productive capacity with appreciable
qualitative levels. However there is also the need to find systems that can contain the natural
tendency of the vine to let the vegetative phase prevail; this phenomenon has also been found
in other tests by Intrieri et al., 2000.
Bertuccioli et al., (2000), in a study, noted that average-low density plantation determined a
likely physiological imbalance of the vines in favour of vegetative growth, penalizing the
quality of the production.
Moreover, according to Bertuccioli (2000), plantation density, showed significant effects on
the quality of the „Sangiovese‟ grapes. In particular, the most interesting values of the
chemical parameters linked to quality have been observed, in the area characterized by a
higher percentage of sand and lower values of phosphorous and potassium that can be
assimilated and by the catatonic exchange in the higher densities, while on the richer soil they
coincide with the average-low densities, which as a result of the excessive soil exploitation
determines a physiological imbalance of the vines in favour of vegetative growth.
Scalabrelli, et al., (2000) have noted that even in diverse environments and wine typology,
density of around 5.000 stumps per hectare in general determines a better balanced plant
growth. Higher density do not offer advantages, that can be generalized, on the vegetal-
productive behavior and on the quality of the grapes. Indeed, depending on the ecopedologic
conditions problems can arise due to the alteration of the vegetative balance if a low number
of buds per plant is chosen, or production increase if buds with a greater weight are chosen.
1.1.5 Adaptability to summer pruning
Shoot thinning the vine during the vegetative cycle, is quite diffused and this has posed and
poses many physiology problems, particularly concerning the flow of the elaborates at the
time of intervention.
Several works conducted by Calò (1975-1976) clarified the balance in the vegetative and
accumulation phase, and how it can be compromised in relation to trimming, which cannot be
considered as the operation that reduces the surface foliage of the plant.
In some studies by Intrieri and collaborators (Intrieri et al., 1983, 1985) confirmed that good
results were obtained by trimming 12 days after flowering. By stimulating the development of
the laterals shoots able to reach physiologic ripening at veraison and thus in time to contribute
to nourishing the bunch, has given rise to a good level of ripeness. On the other hand, a late
10
trimming, that is at the time when the push in the development of the shoots is inferior, has
brought about a slowing down in the growth of the berries and their ripening.
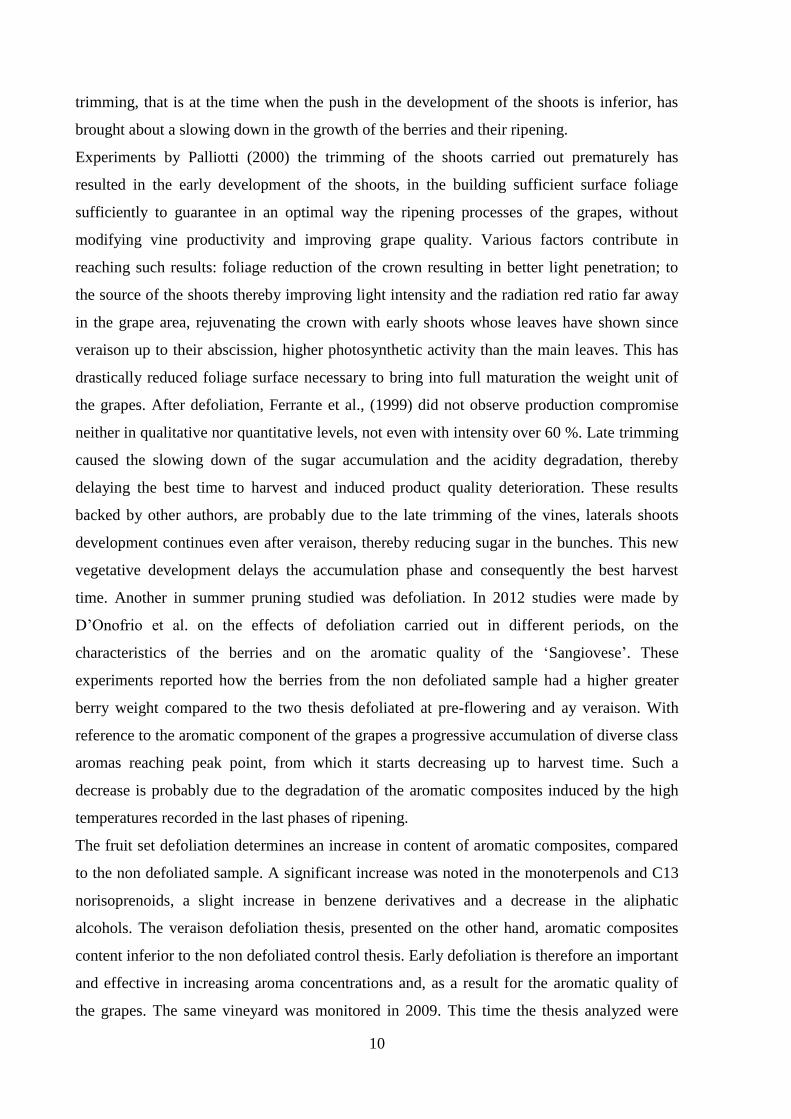
Experiments by Palliotti (2000) the trimming of the shoots carried out prematurely has
resulted in the early development of the shoots, in the building sufficient surface foliage
sufficiently to guarantee in an optimal way the ripening processes of the grapes, without
modifying vine productivity and improving grape quality. Various factors contribute in
reaching such results: foliage reduction of the crown resulting in better light penetration; to
the source of the shoots thereby improving light intensity and the radiation red ratio far away
in the grape area, rejuvenating the crown with early shoots whose leaves have shown since
veraison up to their abscission, higher photosynthetic activity than the main leaves. This has
drastically reduced foliage surface necessary to bring into full maturation the weight unit of
the grapes. After defoliation, Ferrante et al., (1999) did not observe production compromise
neither in qualitative nor quantitative levels, not even with intensity over 60 %. Late trimming
caused the slowing down of the sugar accumulation and the acidity degradation, thereby
delaying the best time to harvest and induced product quality deterioration. These results
backed by other authors, are probably due to the late trimming of the vines, laterals shoots
development continues even after veraison, thereby reducing sugar in the bunches. This new
vegetative development delays the accumulation phase and consequently the best harvest
time. Another in summer pruning studied was defoliation. In 2012 studies were made by
D‟Onofrio et al. on the effects of defoliation carried out in different periods, on the
characteristics of the berries and on the aromatic quality of the „Sangiovese‟. These
experiments reported how the berries from the non defoliated sample had a higher greater
berry weight compared to the two thesis defoliated at pre-flowering and ay veraison. With
reference to the aromatic component of the grapes a progressive accumulation of diverse class
aromas reaching peak point, from which it starts decreasing up to harvest time. Such a
decrease is probably due to the degradation of the aromatic composites induced by the high
temperatures recorded in the last phases of ripening.
The fruit set defoliation determines an increase in content of aromatic composites, compared
to the non defoliated sample. A significant increase was noted in the monoterpenols and C13
norisoprenoids, a slight increase in benzene derivatives and a decrease in the aliphatic
alcohols. The veraison defoliation thesis, presented on the other hand, aromatic composites
content inferior to the non defoliated control thesis. Early defoliation is therefore an important
and effective in increasing aroma concentrations and, as a result for the aromatic quality of
the grapes. The same vineyard was monitored in 2009. This time the thesis analyzed were

11
two: non defoliated control and fruit set defoliation. In the defoliated sample an increase was
noted in all the composite classes, above all at the expense of the C13-norisoprenoidi,
exception made for aliphatic alcohol class. The experiment was also carried out the following
year with the addition of a thesis created by covering some bunches. It was highlighted how
the defoliated thesis at flowering and the fruit set defoliated thesis, had at harvest a higher
concentration of all the aromatic composite classes studied. Among these the greatest increase
was reached in the fruit set thesis where there was a significant increase in the concentration
of all the composite classes. In the defoliated at flowering thesis and later covered it was
noted that the bunch temperature was about the same as the temperature of the defoliated at
flowering thesis and therefore the only variable, at the base of the significant reduction of
monoterpenols and C13-norisoprenoids concentrations, can be attributed to the absence of
light.
Reduced leaf layer numbers in a vine may have many beneficial impacts greater anthocyanins
and phenolics in Sangiovese harvested after leaf removal (Poni et al., 2006).
In 2008 Intrieri and Filippetti, compared manual and mechanical defoliation on a
„Sangiovese‟ cultivar: the first six basal leaves and any laterals were removed by hand, and
the same area was subjected to mechanical defoliation, the latter removing 48.3% of the leaf
area removed manually. Both treatments significantly reduced fruit-set, yield per shoot, bunch
weight, berries per bunch and bunch compactness. Yield/ha declined from 32.8 tons in control
vines to 24.4 and 19.0 tons for mechanical defoliation and hand defoliation (pre and post
bloom treatment means), respectively. Leaf to fruit ratios were unaffected by defoliation as
source loss was fully offset by yield decline. Soluble solid concentration and total
anthocyanins on a fresh-weight basis increased by 2.4°Brix and 0.2 mg/g in hand defoliation
and by 2.2°Brix and 0.08 mg/g in mechanical defoliation as compared with that in non-
defoliated control. Although results from hand defoliation reinforce the physiological basis of
the technique‟s effectiveness, mechanical defoliation proved likewise effective in reducing
yield and improving grape quality.

12
1.2 The terroir
Even in well known and prestigious „denomination of origin‟ vine growing areas there are
different vine behavior patterns and therefore the grape and wine characteristics in time and
area. It is a well known fact that soil, climate, vine variety and cultivation technique are the
main factors in influencing the productive and qualitative result of the vines.
Appraising the cultivation vocation of the territory is one of the best instruments in
safeguarding the typicality of the products and the risks involved in soil degradation. In
particular, studies on the correlation between the quality of the environment and the quality of
the product show the good use of local resources which is strictly connected the specificity of
the environment of origin and that must be safeguarded. Such specificity is usually known by
the term „cultivation vocation‟ and this is regarded as one of the most important success
factors in national agriculture in the global market because very often quality cultivation
becomes a reference point and a leading image of the territory. Indeed, the term „total quality
of the territory‟ refers to territory managed in function of product quality, soil and ecosystem
conservation, healthy environment and landscape beauty. The acknowledgement of the
„vocation‟ of a territory is needy of research into its peculiarities which exalt its
„exclusiveness‟. In other words, it is the peculiarities of a territory and its functionality, the
influence that determines the variability of response, the quality of a wine or of an olive oil
for example, that determines the uniqueness of that particular production area. The uniqueness
of a production area is thus and added value to the quality that can be crucial for the success
of a cultivation. The distinguishing characteristics that determine a production area suited to
quality food producing are better explained and detailed in the single functional components
of the territory, the „terroir‟.
1.2.1 The terroir and its evolution
The French term terroir which is difficult be to translated in other languages it nowadays
utilized in the wine world communication, its meaning can be described as a complex
combination of factors that determine a specific wine characteristics not repeatable elsewhere.
Regarding the roots of this term it is useful to remember that over a century ago its meaning
was very different, as revealed by Lawely (1870): „it is to be remembered that our hills
created by terrestrial clay-limestone white grapevine varieties perform very well because

13
they can acquire a perfect maturity, that elsewhere it is not possible: cultivated black grapes
in that soil could equally produce good wines , if these didn't receive from the soil a
particular taste of terrain, that French call terroir‟.
The term terroir has since been modified and enriched with other meanings, especially in
consequence of the intensification of viticulture and wine research and for the its wide use
by producers, researchers, journalists, wine critics and wine consumers. Today this word
contains at least the following four specifications Origin, Specificity, Perennial and Typical
(fig. 3).
Terroir:Origin,
Specificity, Perennial and
Typical
AGRICULTURAL: Terroir-subject
TERRITORIAL:Terroir-space
IDENTITY:
Terroir-conscience
ADVERTISING: Terroir-slogan
Figure 3. The multiple meaning of Terroir (Scalabrelli, 2013).
The AGRICULTURAL or Terroir-subject is identified by the Taste (sensory characteristic)
and from the consequent Instrumental Quality, the complex features due to relationships
between plant and environment. The TERRITORIAL concept or Terroir-space, concerns the
delimitation of a territory, with the relative Denominations and their specificities recognised
by the Unity of landscape that are also referred to as historical Geography of the territory.
The terroir IDENTITY or Terroir-conscience, constitute the immaterial part that is present in
a determined country, represented by identity and by the sense of affiliation of the inhabitants,
in relationship to their genealogical origin and their traditions.
The ADVERTISING terroir or Terroir-slogan constitutes the communicative part of the rural
world which needs to express certain values and to transmit one specific image. This means
searching meanings that are patrimony of the producers and that must be rendered explicitly
well through communication in order to offer a better understanding of the essence and the
specificity of the viticulturists job.

14
The terroir can be considered a complex system where the genotypes (rootstock, variety and
clone) interact with the soil, the macro-meso-climate (Carbonneau, 2000) and the viticulture
model (planting design and density, training system, geometry and canopy extension)
determining a functioning ecosystem, modulated by techniques of management (fig. 4).
Terroir:Wine composition
and qualityattributes obtained
by FactorsInteraction
driven by the man
Genotype: Rootstock,
Variety and Clone
Macro-meso-climate
and TerritoryEcosystem
Wine Technology:
Valorization ofgrapes features,
and wine process
Soil: Origin, Structure,
Fertility, Depth, Physical,
Chemical and Microbiological Characteristics
Viticulture model: Planting Design, Training System, Canopy
Geometry
Figure 4. Factors involved into the Terroir effect (Scalabrelli, 2013).
The interaction genotype environment, influences the vine sink/source relationships and, in
general, the production efficiency of the canopy. Therefore the quality and the composition of
grapes depend on vine equilibrium, or rather from the correct relationship between the leaf
functioning area and the amount of yield (Casternan, 1971; Scalabrelli et al., 2001; 2003;
Fregoni, 2005).
The knowledge of the vocation of the territory is acquired through interdisciplinary studies of
zoning, that through an integrated approach (Morlat et al., 1989) they aim to understand the
mechanisms of interaction environment x macro-meso-climate that affect the grapevine
physiology (Asselin 2001, Asselin et al., 2003). The system terroir/vine/wine can be
represented by a pyramid constituted by variables of simple and composite state, parameters
of functioning, and variables of operation, vintage and wine. All these aspects, in relationship,
define the system terroir/vine/wine (fig. 5).

15
Wine
Harvest
Variabiles of Functioning
(earliness, water nutrition..)
State Composed Variables
( permeability, porosity)
State Simple variables
(altitude, mineralology, granulometry,
chemical composition..)
Characteristics
of
the
production
Plants Characteristics
Environmental
features
Parameter of functiong
( pedoclimate, mesoclimate)
Figure 5. Chain of influences involved in the Terroir effect. Redrawn from Asselin (2001)
and Scalabrelli, (2013).
Hence this system implicates the impossibility to expound the elaboration of the wine quality
and the operation of the terroir through the simple measurement of the influence of a single
factor (Morlat, 2001).
Through an integrated approach it was initially defined the scientific concept of terroir
(Asselin, l.c.) as the basic unit terroir (UTB), which can be defined as „the smallest vineyard
area used by the grower in which the response of the vine is reproducible through the wine‟,
or „the smallest physical unit homogeneous that we can usefully differentiate, for practical or
for scientific purposes’, which is a separate operating unit agro-ecosystem „physical site x
vine’ (Riou et al., 1995). The unit of viticulture terroir (UTV) is the smallest unit that can be
formed by UTB, locally defined (Carbonneau, 1993) with the variety, cultivation techniques
and wine (Deloire et al., 2002). Moreover when the base of the UTV group are identical or
similar and associated with a strong personality of the wines (sometimes without complexity),
they give rise to a homogeneous viticulture terroir. If several UTV are different, they form a
„composite terroir’. In this case the personality of the wines is based on the diversity, the
assemblage and regularity according to the vintage year.
In recent years the eco physiological approach of vine-environment interaction, as assessed by
the phenotypic expression of the production and quality, has led to a better assessment of the

16
factors that contribute to the wine terroirs. Many of the investigations conducted under
conditions comparable of vineyard model and management system were aimed at the
identification of vocational units (UV) characterized by vegetative performance, production
and quality consistently homogeneous.
The variety „Sangiovese‟ is a genotype characterized by a wide variation of expression due to
its high responsiveness to the environment (Egger et al., 1999; Bandinelli et al., 2001;
Bertuccioli et al., 2001; Giannetti et al., 2001; Scalabrelli et al., 2006), so it would be possible
to obtain in different areas wines with very similar quality levels , though differentiated , thus
expressing the varietal potential in response to a specific terroir (Brancadoro et al., 2006).
1.2.2 The vineyard factors
The „Sangiovese‟ with over 67.4% of the vineyard surface cultivated represents the main
variety for wine production in Tuscany (ARTEA, 2008).
Without a doubt the wines produced with this variety (pure or base for blend) are famous
above all for their geographic origin, thanks to the influence of the environment that
modulates their characteristics (Brancadoro et al., 2006; Storchi et al., 2006). Several Tuscan
Denominations of Origin (DOCG) thanks to their peculiar aspects are distinguished and have
acquired reputation and notoriety abroad (tab. 1), according to several strategies of wine
valorisation (Cotarella, 2001; Gallenti and Cosmina, 2001). Only „Brunello di Montalcino‟
and few other famous red wines are produced with 100% of „Sangiovese‟ while many other
red wines, including those reporting the indication „Sangiovese‟, are produced mainly by this
grape which is integrated with other local or international varieties (Boselli, 2006; Fregoni,
2006; Zampi, 2006). This choice depends on several reasons, to note, problems of inconstant
quality levels to produce aging wines due to insufficient content of anthocyanins and
polyphenols or aromatic pattern, which could occur in some vintage years or in territory with
fair vocation.

17
Denomination Main variety
Number
of
Inscription
Vineyard
area
(hectare)
Maximum
yield of grape
(Ton/hectare)
BOLGHERI
Cabernet
Sauvignon,
Cabernet franc,
Merlot, Sangiovese,
Sirah 263 1.927,18 10
BRUNELLO DI
MONTALCINO Sangiovese 311 2.020,11 8
CARMIGNANO Sangiovese + other
varieties 34 215,72 10
CHIANTI Sangiovese 6160 23.585,45 9
CHIANTI CLASSICO Sangiovese 1178 7.559,14 7,5
MONTECUCCO
SANGIOVESE Sangiovese 317 687,14 9
MORELLINO DI
SCANSANO Sangiovese 412 1.543,54 9
SUVERETO
Sangiovese,
Cabernet
Sauvignon, Merlot, 100 239,03 9
VERNACCIA DI SAN
GIMIGNANO
Vernaccia di San
Gimignano 180 777,88 9
VINO NOBILE DI
MONTEPULCIANO Sangiovese 318 1.286,18 8
Table 1. Wines of excellence produced in Tuscany (DOCG in 2011).
The vineyard model (rootstock, density of plantation, training and pruning system, and type of
management) is of great importance on vine production equilibrium and therefore on the
vineyard ecosystem functioning. Although the „Sangiovese‟ grapevine was well studied, it is
not possible to indicate a generalized vineyard model suited to all situations (Intrieri, 1995;
Loreti and Scalabrelli, 2007). Holding into account the vineyards renewal initiated from 1990'
with the objective to avoid vine vigour excesses, in the new vineyards established in Tuscany
less vigorous rootstocks and close distances of plantation were used to achieve root
competition and decrease vine vigour, which unfortunately not always reached the desired
goal. The rootstocks can offer interesting opportunities for modulating vegetative, yield and
quality performances of vines, especially in difficult situations. In presence of not limiting
conditions less vigorous rootstocks like 3309C and 101-14 can be used, while it would be
more appropriate to use 110R when there is the risk of summer water deficit (Di Collalto et
al., 2001; Scalabrelli et al., 2001; 2003; Palliotti et al., 2006).
During the last phase of vineyards renewal in Tuscany the dominant tendency has been to
adopt planting models with middle or high density planting to achieve better light interception
18
and improve the vine efficiency. This choice is nearly always a result of a compromise
between the best solution from the physiological point of view and the management costs,
which can vary according to the conditions of the territory, the size of the farm and the type of
enterprise. In this region the tendency to adopt a vertical canopy with horizontal cordon spur
pruning or Guyot (less used) is quite generalized, while other innovative systems are
introduced only on a small scale (Intrieri and Poni, 2000; Loreti and Scalabrelli). The optimal
plantation density from the physiological and qualitative point of view for the most part are
intermediate (5000 - 6000 vines/ha), while only in poor soil, is it possible to plant vines at
closer spacing (Scalabrelli et al., 2001; Bertuccioli et al., 2001; Bagnoli et al., 2001; Loreti at.
al., Mattii et al., 2005). Narrow spacing between lines often induces canopy height to decrease
too much with negative effects on grape quality (Scalabrelli et al., 2006). Moreover the model
of vineyard must always be adequate to the environment and technical conditions so as to
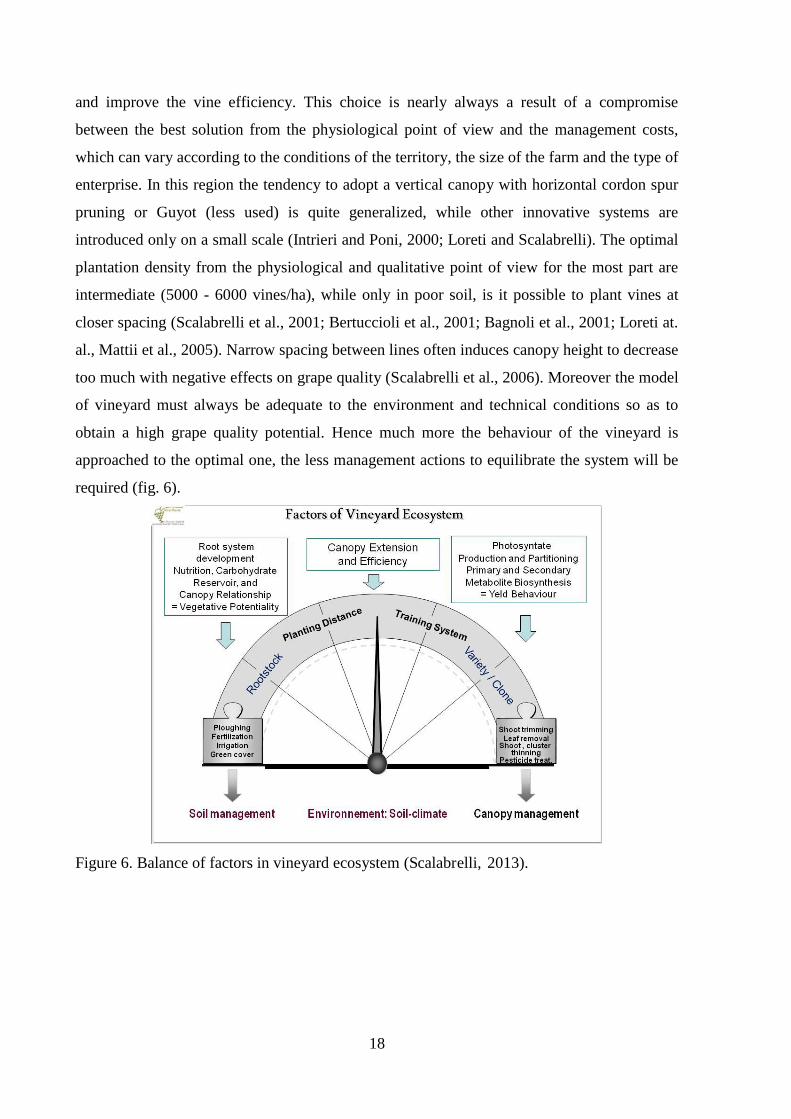
obtain a high grape quality potential. Hence much more the behaviour of the vineyard is
approached to the optimal one, the less management actions to equilibrate the system will be
required (fig. 6).
Figure 6. Balance of factors in vineyard ecosystem (Scalabrelli, 2013).

19
1.2.3 Terroir of Tuscany
The spatial soil and climate variability of the different appellation of origin contributes to the
different expression of „Sangiovese‟ has been highlighted by a series of works of
characterization and zoning .This has led to the definition of specific territorial units (UT) and
the drafting of maps of soil landscape to different scales within which a large number of
vineyards were researched in detail (Brancadoro et al., 2006). The climatic survey,
fundamental for the knowledge of terroir, proposes to draw up a climatic map organised into
levels of the territory space, in order to find microclimates of the vineyard, the local climate
and the regional climate (Zamboni, 2003; Carbonneau, 2003; Orlandini et al., 2003). The use
of simple and complex variables or climatic indices, useful for identifying homogeneous areas
requires well distributed information systems and weather stations on the territory and the
adoption of a different scale of reference (Vaudour, 2005; Costantini et al., 2006). The work
conducted in Tuscany by ARSIA meteorological service does not highlight uniform
conditions between the various areas with the possibility of a strong influence of the variable
climate the behaviour of „Sangiovese‟ performances (Scalabrelli, 2008).
The geologic and climatic survey has proved crucial in zoning studies to identify the UTB and
the soil map. In these studies the selected data for physical and chemical analysis of the soil,
the morphological interpretation of horizons, the roots profiles, the micro morphological
analysis and the study of the water functioning or heat of the soil (soil maps with their
properties) were separated from the spatial data (Costantini et al., 2006).
The experiences carried out on various scales in the territory of the provinces of Florence and
Siena showed great differences in the territory regarding to the climate and soil type profiles
and in the behaviour of the productive performance of „Sangiovese‟ variety in several
vineyards included in the main zones of Denomination of Origin: „Chianti‟, „Chianti
Classico‟, „Chianti Colli Senesi‟, „Chianti Colli Fiorentini‟, „Orcia‟, „Nobile di
Montepulciano‟ and „Brunello di Montalcino‟ (Campostrini e Costantini, 1996; Costantini et
al., 1996; Bogoni, 1998; Cricco e Toninato, 2004; Storchi et al., 2005). Climatic variables and
altitude were useful in characterizing only partially the zones having viticulture vocation,
while the mean soil temperature well characterized soils of the „Montalcino‟ vineyards. From
the geologic point of view the viticulture areas of „Montepulciano‟ and „Colli senesi‟ (Siena
hills) proved to be more homogenous, followed by those of Montalcino, while the „Chianti
Classico‟ and the „Orcia‟ resulted much more variable (Costantini et al., 2008). The soils of
„Montalcino‟ and in the „Chianti Classico‟ area were found stoniest and less deep, the latter

20
were also sandiest and could lesser withhold water although exhibiting the best inner water-
drainage, which is considered a key soil factor for the health of the vine root system
(Costantini et al., 2006; Costantini e Bucelli, 2008).
Other soil features like the cationic exchange capacity, the apparent density and the stability
of structure, were found to be quite different in the examined zones. The best vine responses
were observed in selected sites of „Montalcino‟, compared to „Chianti Classico‟. In several
viticulture zones in Tuscany, having the same meteorological conditions, we can find soils
with different physical and chemical characteristics (texture, water-drainage, water content)
that can characterize various units of soil landscape (USL). Examples are furnished by
„Cerreto Guidi‟ (Cricco and Toninato, 2000), and „Bolgheri‟ (Bogoni, 1999) where the
expression of „Sangiovese‟ is identified by different wine sensory profiles.
In a study carried out in the „Arezzo‟ province, 33 vineyards of `Sangiovese' were subdivided
into groups of premature sugar accumulation underlining the greater importance of the inner
soil water-drainage (26%), followed by altitude (16%) and water availability (11%) (AWC =
Available Water Content). The factors water-drainage, AWC and altitude well discriminate
the performances of the vineyards, important too are the depth of soil and the texture (Fig.
11). In particular the water-drainage and the AWC influenced significantly the kinetic of
sugar accumulation and the main qualitative grape parameters at harvest. The early ripening
vineyards achieved the best grape quality (higher anthocyanins and polyphenols content) and
also gave wines more interesting sensory profiles and of greater amplitude. Surveying has
permitted a subdivision of the territory into territorial units (UT) having similar characteristics
of soil, landscape and climatic conditions, and productive and qualitative expressions
(Toninato et al. 2005).
Several soils identified in „Montalcino‟ area having different water available in the ground
during ripening proved to significantly influence most characteristics (sugars, pH and acidity)
according to the year, while the extractable anthocyanins and polyphenols content were
influenced only by vintage year. It appeared obvious that in order to obtain the best
characteristics from `Sangiovese, soil water content is crucial during the period between
veraison to ripening, during which a moderated water deficiency is positive, while excesses or
drastic reductions of water available are both negative (Storchi et al., 2000).
Work conducted on small scale zoning in „Montalcino‟ area allowed to identify territorial
units (UT) characterized by soil chemical and physical parameters (table 3) eg. texture and
electrical conductivity, an indirect evaluation of AWC. In this case the UT richer in clay was
able to assure the greater AWC in the ground during maturation, while the other UT induced

21
in `Sangiovese' conditions of water stress from severe to light. Such conditions have
influenced meaningfully the kinetic of ripening and particularly increasing the sugar
accumulation and the content of extractable anthocyanins (Brancadoro et al., 2006). These
results are in agreement with several papers which have underlined that a moderated water
stress occurring in the period between veraison and ripening, induces favourable
characteristics of the grapes and the wine (Scalabrelli, 2006; Remorini et al., 2007).
Extensive research activities performed in the province of Siena have confirmed that the vine
root depth and AWC are significantly correlated with viticulture parameters while the vine
performances were mainly influenced by the annual variables like the temperatures of the
ground and the air, the rainfall and the number of days without rain (Costantini et al., l.c.). At
the end of a series of surveys led in this province an innovative methodology for the terroir
definition was proposed which previewed the construction of a soil information GIS which
collected data in geographic form (scale 1:100.000) and alphanumeric (DB) data. Moreover a
DB of viticulture and oenological data, monitored in 70 vineyards for several years, was
created. On the basis of these results in this province 363 terroir were thus characterized that
have an average extension of 46 hectares, varying from a minimum of 2 to a maximum of 474
hectares (Costantini et al., l.c.). Therefore, it can be noted how in Tuscany there are many
viticulture terroir although very few are really homogenous. The majority of the terroir can
be considered multiple sites, in which the meaningful effect of the soil and climatic factors,
utilized to characterize the UV, on the qualitative characteristics of the grapes and wines, can
determine a compensatory effect in areas of non homogenous production supplying however
wines having similar characteristics (Brancadoro et al. l.c.).
Recent studies on grapes were able to predict wine characteristics (Bucelli et al., 2010), while
berry sensorial analysis was used as a complementary method to determine berry quality
(Ducci et al., 2012) and the study of the aromatic profile as well (D‟Onofrio et al., 2012).

22
1.3 Aim of the thesis
The variety „Sangiovese‟ is a genotype characterized by a wide variation of expression due to
its high responsiveness to the environment so it is possible to obtain in different areas wines
with quality standards very similar, though differentiated between them, thus expressing the
varietal potential in response to a specific terroir. Although the „Sangiovese‟ grapevine was
well studied, it is not possible to indicate a generalized vineyard model adapt to all situations.
The project, through a structured study wants to proceed first to the chemical-physical and
sensory characterization of „Sangiovese‟ grapes produced in some representative production‟s
areas of Tuscany. Through a detailed study on the main components responsible for the quality
of grapes, especially aroma compounds, based on eco- pedological factors, it will deepen the
knowledge of the factors that in the vineyard are the source of differentiation in order to
provide the necessary tools to operate more efficiently technical choices that can make a
valuable contribution to the diversification and the identification of the wines produced. These
investigations, does not aim to make a hierarchical scale of oenological products of a specific
territory, but to provide a way to understand the potential of a territory. In this work a particular
attention was dedicated to the areas of „Montecucco‟ and „Brunello di Montalcino‟ making a
focus on vineyard effect („ColleMassari‟ estate) and on clone effect („Col d'Orcia‟ estate).

23
2. MATERIALS AND METHODS
2.1 Plant material
The research was conducted in three consecutive years (2009, 2010 and 2011), on
„Sangiovese‟ vineyards in five areas of production located in „Grosseto‟, „Pisa‟, and „Siena‟
provinces, involving a total of 17 theses (fig. 7 and tab. 2).
The corresponding Denomination areas of wine production were: „Brunello di Montalcino‟,
„Chianti Classico‟, „Chianti Colline Pisane‟, „Montecucco‟ and „Morellino di Scansano‟. On
„Montecucco‟ and „Brunello di Montalcino‟ the study were focused on several vineyards and
the clonal effect was also studied. The vineyards in our study were planted in 2000-2001, at a
density of 4000-5000 plants per hectare, trained to horizontal spur pruned cordon. The use of
cloned material has almost always been identified, most of these clones are „R24‟ and „SS-F9-
A548‟ grafted on 420A or 1103P rootstock depending on the cultivation area (tab. 3).
Figure 7. Main D.O. and D.O.C.G. areas in Tuscany on Sangiovese vines.
Carmignano
Chianti e Chianti Classico
Brunello di Montalcino
Sovana
Nobile di Montepulciano
Carmignano
Chianti e Chianti Classico
Brunello di Montalcino
Sovana
Nobile di Montepulciano
Capalbio
Morellino di Scansano
Monteregio di Massa Marittima
Val di Cornia
Colline Lucchesi
Montescudaio
Capalbio
Morellino di Scansano
Monteregio di Massa Marittima
Val di Cornia
Colline Lucchesi
Montescudaio
Montecucco
Chianti Colline Pisane

24
Table 2. Prospect of vineyards chosen for the study.
Table 3. Main characteristics of the vineyards (SPC = Spur pruned cordon; C= Current; B=Biologic;
BD= Biodinamic.).
Thesis Code Company - Vineyards Denomination Area Town Prov. Site
1 CCP 1 Beconcini Chianti Colline Pisane S. Miniato Pi 1
2 MC 1
ColleMassari
Campo La Mora F9 Montecucco Cinigiano Gr 2
3 MC 2
ColleMassari
Campo La Mora Sal “ Cinigiano Gr 2
4 MC 3 ColleMassari Cerrete “ Cinigiano Gr 2
5 MC 4 ColleMassari Orto del Prete “ Cinigiano Gr 2
6 MC 5 ColleMassari Vigna Vecchia “ Cinigiano Gr 2
7 MC 6 Salustri “ Cinigiano Gr 3
8 MS 1 Fattoria di Magliano Morellino Scansano Magliano Gr 4
9 BM 1 Col D'Orcia
Brunello di
Montalcino Montalcino Si 5
10 BM 2 Col D'Orcia “ Montalcino Si 5
11 BM 3 Col D'Orcia “ Montalcino Si 5
12 BM 4 Col D'Orcia “ Montalcino Si 5
13 BM 5 Col D'Orcia “ Montalcino Si 5
14 BM 6 Casanova Di Neri “ Montalcino Si 5
15 BM 7 La Mannella Terra Bianca “ Montalcino Si 6
16 CC 1 Capannelle Chianti Classico Gaiole Si 7
17 CC 2 Castello di Albola Chianti Classico Radda Si 8
Thesis Code Clone
Rootstock
Training
system Age Conduct
1 CCP 1 F9 1103P SPC 10 C
2 MC 1 F9 161-49 C Guyot 9 B
3 MC 2 Sel. Salustri 161-49 C Guyot 9 B
4 MC 3 Sel. Salustri 110 R Guyot 8 B
5 MC 4 Sel. Talenti 157-11 SPC 9 B
6 MC 5 Sel Col D‟Orcia 775 P SPC 10 B
7 MC 6 Sel. Salustri 110 R Guyot 10 B
8 MS 1 R 24 110 R SPC 10 C
9 BM 1 Clone 1 420A SPC 10 C
10 BM 2 Clone 2 420A SPC 10 C
11 BM 3 Clone 3 420A SPC 10 C
12 BM 4 Clone 4 420A SPC 10 C
13 BM 5 Clone 5 420A SPC 10 C
14 BM 6 VCR 5 110 R SPC 9 C
15 BM 7 R 24 1103P SPC 10 C
16 CC 1 R 24 420A SPC 10 C
17 CC 2 R 24 420A SPC 9 C

25
2.2 Technological maturity
At harvest time, sets of 10-12 bunches for thesis were sampled and subjected to sensorial,
physical-chemical, and aromatic analyses. Crashed bunches were used to determine the
concentration of total soluble solids (°Brix) by a digital refractometer (Model 53011, TR,
Forlì, Italy), the pH by a bench pH-meter (Hanna Instruments, Milano, Italy) and total acidity
by a digital burette (Brand, Wertheim ,Germany) by titration with NaOH 0.1 N.
2.3 Sensory analysis on grapes
Evaluating the quality of the grapes before harvest is very important for the decision making
of the vine technician and the enologist, as they can better direct the growing techniques in
vineyard and better select the grapes for the wine making based on quality and suitability in
the production of specific wines. Moreover it is possible to adjust the winemaking technology
on the basis of the characteristics of the raw material. The ICV has in the last ten years
developed a sensorial method of analysis in order to satisfy the above needs (www.icv.fr).
This method, slightly modified (Scalabrelli et al., 2010) can be used with good results at
contained costs, above all because it represents a complementary technique to the chemical-
physical analysis of the grapes (sugar, acidity, phenolic ripeness).
Sensorial analysis of the grapes consists in the evaluation of the visual and tactile
characteristics of the berry by the sequential tasting of the skin, the pulp and seeds.
The method used obtains the evaluation by one test: a) the mechanical characteristics of the
single berry, acid balance, aromatic strength, quantity and quality of polyphenol and the
respective localization; possible imbalance in ripeness levels of the different parts of the
berry; c) the variation of the technological ripeness in different periods and years. The
procedure expects that every wine taster on the panel assigns for every single descriptor a
mark from 1 to 4 corresponding to a level of increasing ripeness (tab. 4-5).
However it must be noted that for some parameters higher values correspond to an advanced
level of berry ripeness. This is the reason for the astringency of the tannin and the sensation of
bitterness.
Such requirements from a technical point of view are very important in the life of the vine and
in the conditions in which ripening occurs, as out of phase ripening can be important from a
technological point. Therefore from a sensorial analysis by a trained panel of tasters, it is
possible to understand the differences in the stage of ripeness of the different parts of the
berry, that can be difficult to determine analytically. For example the sensation of astringency

26
bitterness and aroma can be quantified immediately without turning to laboratory analysis, but
for sweetness and acidity of the must laboratory analysis is needed.
The panel of tasters were five and they were specifically trained in the tasting procedure.
Part/Score Sensorial descriptors
Berry Skin color Plasticity Pedicel
detachment
1 Pink Hard Very difficult
2 Red Elastic Difficult
3 Red dark Plastic Easy
4 Blue - black Easy to break Very easy
Skin Aptitude to the
Skin grinding
Tannins
astringency
Aromatic
dominant notes
Bitter
sensation
1 Very difficult Strong Herbaceous Strong
2 Difficult Medium Neutral Medium
3 Little hard Light Fruity Light
4 Tender Nothing Marmalade Little
Pulp Flesh - Skin
separation
Sweet
sensation Acid sensation
Aromatic
dominant notes
1 Very tight Little High Herbaceous
2 Middle tight Medium Medium Neutral
3 Tight Sweet Little Fruity
4 Not tight Very sweet Nothing Marmalade
Seed Colour Hardness Tannins
astringency
Aromatic
dominant notes
Bitter
sensation
1 Green Soft High Herbaceous Strong
2 Green -brown Little soft Medium Neutral Medium
3 Brown Hard Little Little roasted Light
4 Brown dark Lignified Nothing Roasted Little
Table 4. Synthetic sheet of sensorial descriptors and relative score attributed to each level perceived
during tasting of the berry parts. (Method proposed by Department of Fruit Science and Plant
Protection of Woody Species: Scalabrelli, 2008).
Score Skin color Skin Flesh Grape-seed Technological
evaluation
1 Little colored
Tight to pulp,
herbaceous taste,
astringent
Hard, acid, and
herbaceous
taste
Green, gummy,
astringent and
bitter
Unripe
2
Incomplete
coloration with
green veins
Tight to pulp,
lightly
herbaceous, thick,
astringent
Thick, acid,
herbaceous
taste
Brown with green
veins partially
lignified astringent
and bitter
In progress of
ripening: not to
harvest
3 Red, enough
uniform
Thick, a little bit
fragile, lightly
fruity with final
herbaceous taste
Little thick,
lightly acid
Brown, lignified
and little
astringent
Almost ripe, to
vinification
with particular
attention
4 Bleu - Black Easy to remove,
fragile, strong
Sweet juicy
flesh, fruity
Lignified, spiced
or lightly hot,
Ripe: suitable
to make wine

27
fruity notes
without final
herbaceous taste
and/or
marmalade
taste
almond taste, not
bitter and not
astringent.
Table 5. Sensorial analysis of berry parts (with black skin) during ripening: score and synthetic
description of perceived sensations.
2.4 Phenolic compounds analysis
For each sampling, 60 berries were randomly chosen, divided into three groups of 20 berries,
which were used as triplicates, and processed according to the method of Di Stefano et al.
(2008) slightly modified as follows. Berry skins of each replicate were manually separated
from pulp and seeds, and skins and seed were separately weighed and extracted for 4 h at
25°C in 25 mL of a pH 3.2 tartaric buffer solution. This solution contained 12% (v/v) ethanol,
2 g/L sodium metabisulphite, 5 g/L tartaric acid and 22 mL/L NaOH 1 N. After grounding in
a mortar and pestle, the extract was separated by centrifugation (R-9M: Remi Motors TD,
Vasai India) for 10 min at 3000 rpm. The pellet was re-suspended in 20 mL of buffer and
centrifuged for 5 min. The final two pooled supernatants were adjusted to 50 mL with the
buffer solution. The skins extract was measured by UV-Vis absorption (Spectrophotometer
HITACHI U-2000) at 540 nm after dilution (1:20) with ethanol: water : HCl (70:30:1) and at
750 nm as the seeds extract in the following solution: 0.1 mL of the extract, 6 mL H2O, 1 mL
Folin-Ciocalteu reactive, 4 mL 10% Sodium Carbonate (after 5 min) and H2O up to 20 mL.
Anthocyanins were expressed as mg of equivalents of malvidin 3-O-glucoside and phenolic
compounds as mg of equivalents of (+)-catechin.
2.5 Aroma compounds analysis
Aroma compounds originating from the enzymatic hydrolysis of glycosidic precursors
(aldehydes, benzene derivates, monoterpenes, norisoprenoids) were extracted from fresh
berries by Solid Phase Extraction (SPE) according to the protocol described by Di Stefano et
al. (1998).
Moreover to reproduce changes in compounds occurring during ageing, hydrolysis of the
extract was performed under similar acidic conditions of wines. In order to have a total
overview and concentration of aroma compounds, we decided to carry out hydrolysis reaction
on the methanolic extract obtained after enzymatic hydrolysis.

28
Preliminary investigations, considering the use of SPE or SPME procedure for the separation
and analysis of the formed compounds, showed SPME technique more suitable because of its
efficiency in the extraction, taking into account also the very low concentration of the
revealed compounds.
Free compounds were not considered in this work because usually their contribution in
neutral grapes, as „Sangiovese‟, is very limited.
2.5.1 Preparation of grape sample
Skins of 100 berries were separated from the pulp and extracted with 20 mL of methanol for 1
hour while the pulps were put in a glass containing 100 mg of sodium metabisulfite. After 1
hour pulp and juice were reunited with 150 mL of a pH 3.2 tartaric buffer solution (2 g/L
sodium metabisulphite, 5 g/L tartaric acid and 22 mL/L NaOH 1 N). After homogenization by
Ultra - Turrax and centrifugation at 7000 g for 5 minutes, solid parts were washed with 100
mL of pH 3.2 tartaric buffer solution and again centrifuged, and the clear liquid was reunited
to the first one. The obtained extract was treated with pectolytic enzyme (Vinozym FCEG) for
1 night at room temperature and finally filtered (Whatman 42).
2.5.2 Enzymatic hydrolysis of glycosides
The extract was added to 200 μL of 1-heptanol (40 mg/L in ethanol) as internal standard, and
the solution was passed through a cartridge 5 g C18 Sep Pak (WAT 036795) previously
activated by 20 mL methanol, and 50 mL water. After the sample loading, salts, sugars, and
more polar compounds were removed by washing the cartridge with 100 mL of water, and the
fraction containing free compounds was recovered by elution with 30 mL of dichloromethane.
A second fraction containing glycoside compounds was recovered with 30 mL of methanol.
The methanolic solution was evaporated to dryness under vacuum at 40 ° C, the residue was
dissolved in 5 mL of a citrate – phosphate buffer pH 5 (2.04 g of citric acid, 2.92 g of
hydrogen phosphate monoacid ), then it was added to 200 μL of a glycosidic enzyme with
strong glycosidase activity and kept at 40 °C overnight. Then, the solution was centrifuged,
added to 200 μL of a 1-heptanol (40 mg/L), and the resulting solution was passed through a 1
g cartridge C18 Sep Pak (WAT 036795) cartridge previously activated by 5 mL methanol and
10 mL water. After cartridge washing with 10 mL of water, the fraction containing the
aglycones was eluted with 6 mL of dichloromethane, dehydrated with sodium sulfate
anhydrous, and concentrated to 200 μL before analysis. A last fraction, containing the

29
potentially aromatic precursor compounds, was recovered from the cartridge by elution with 5
mL methanol.
2.5.3. Acid hydrolysis of glycosides
The methanolic solution, was evaporated to dryness under vacuum at 40 ° C and the residue
was dissolved in 10 mL of tartrate buffer at pH 3.
1g of sodium chloride and 8μL of a 40 mg/L solution of 1-heptanol were added to this
solution and the mixture was heated in a water bath to 100°C for 1 h, in an encapsulated vial
under a nitrogen atmosphere. After cooling, 2.5 mL of the resulting reaction mixture was
transferred in a 20 ml headspace vial and extracted with a SPME fiber (DVB/CAR/PDMS)
using an automatic CombiPal system (CTC analytics) under the following conditions:
incubation at 60°C for 20 min.; extraction for 35 min.; desorption in the GC injector at 240°C
for 6 min in pulsed splitless mode (25 psi for 5 min).
2.5.4. Gas chromatography – mass spectrometry
Chromatographic analysis were carried out using a Agilent 7890A gas-chromatograph
coupled with a Agilent 5975C quadrupole mass spectrometer. The carrier gas was helium at a
constant flow rate of 1 mL/min. The capillary column was a HP-Innowax (30 m length, 0.25
mm i.d., 0.25 mm film thickness) from Agilent. The temperature programme of the column
oven started at 30 °C, then increased at 30 °C/min to 60 °C for 2 min, at 2 °C/min to 190 °C,
and at 5 °C/min to 230 °C for 10 min. The MS detector scanned within a mass range of m/z
30-450.
Compounds were identified by a combination of matching retention indices with library
matches (Nist 08) and authentic standards, which were available for the compounds of
interest. The quantification was carried out comparing the peak area of each compound with
that of the internal standard.

30
2.6 Statistical analysis
The resulting data was then analyzed statistically using SPSS130 software. In detail, the
climatic data underwent cluster analysis and discriminating analysis and the visual results by
centroids which report the first two canonical functions. The macro and microstructural
characteristics data of the grapes at harvest were analyzed using the MANOVA test and the
differences highlighted two by two by the Tukey test.
With the statistical analysis by placing the three factors thesis, year, and the interaction thesis
by year, it was calculated the percentage of variance due to each factor relative to the total
variance, obviously including the error.
A factorial statistic analysis was also carried out to reduce the wide variability range of
descriptors and constitute complex variables that could well represent the theories examined
and to highlight the substantial differences that exist among them. Subsequently the results
underwent multiple linear regression to show the possible correlation between the parameters
examined.
The evaluation given in the berry sensorial analysis were transformed in percentages before
statistical analysis.
Statistical significance was accepted at P <0,05.

31
3. RESULTS
3.1 Weather station location and study of the historical sequences
The ARSIA archive provided the data relative to the areas under study by selecting six
weather huts that were close to each other and that were representative of the production area.
The climatic characteristics of the areas were analyzed by studying the following parameters:
min-max temperatures, temperature range and rainfall. Average values were calculated for the
period April–October and the bioclimatic index Growing Degree Days using the total daily
temperatures >10°C. As regards the station chosen on a specific site corresponding to n°2
(„ColleMassari‟, „Montecucco‟), the climatic findings were collected from weather huts
installed on the company.
The localization of the weather huts (fig. 8) and the climatic characteristics of the different
areas of Tuscany can be seen in fig. 9-11 relative to average annual temperatures, annual
rainfall (mm) and to the hydroclimatic balance (mm) up to the year 2007 (the difference
between the total rainfall and the total ETP).
Figure 8. Weather stations used (initials corresponding to table 6).
3
2
1
4
5
6

32
The data collected is in tabulate and graphic format so as to compare the different areas (tab. 6
a,b,c,d).
n Station
Temp
max
(°C)
Temp
min
(°C)
Temp
media
(°C)
Daily excursion
(°C)
Rainfall
(mm)
Growing
Degree
Days (°C)
Huglin
Index
1 San Miniato 26,2 14,7 21,5 11,5 234 2.043 2915,4 2 Cinigiano* 25,6 14,6 20,6 11 254 1.943 2548,8 3 Magliano 26,8 16,3 21,8 10,5 275 2.159 3206,8 4 Montalcino 23,8 14,3 19,5 9,5 331 1.750 2315,8 5 Montalcino** 25,6 13,7 20,3 11,9 254 1.895 2776,9
6 Gaiole 26,0 9,5 18,7 16,5 292 1.608 2449,8 * Poggi del Sasso
** Argiano
Table 6 (a). Average data about weather trends in the year 2009 in the period April-October.
n Station
Temp
max
(°C)
Temp
min
(°C)
Temp
media
(°C)
Daily excursion
(°C)
Rainfall
(mm)
Growing
Degree
Days (°C)
Huglin
Index
1 San Miniato 24,1 13,0 19,2 11,1 450 1.688 2470,3 2 Cinigiano* 24,2 13,7 19,3 10,5 379 1.715 2243,8 3 Magliano 23,1 14,2 19,4 8,9 355 1.739 2991,8 4 Montalcino 22,4 13,2 18,2 9,2 449 1.509 1981,8 5 Montalcino** 23,7 12,7 19,0 11 442 1.732 2374,6 6 Gaiole 24,2 9,0 17,4 15,2 465 1.368 2081,9
* Poggi del Sasso
** Argiano Table 6 (b). Average data about weather trends in the year 2010 in the period April-October.
n Station
Temp
max
(°C)
Temp
min
(°C)
Temp
media
(°C)
Daily excursion
(°C)
Rainfall
(mm)
Growing
Degree
Days (°C)
Huglin
Index
1 San Miniato 26,5 14,2 20,9 12,3 185 2.181 2902,2 2 Cinigiano* 25,6 14,3 19,5 11,3 344 2.051 2623,1 3 Magliano 27,1 15,1 21,8 12 227 2.791 3389,6 4 Montalcino 24,1 14,2 19,3 9,9 349 1.847 2389,6 5 Montalcino** 25,6 13,2 20,6 12,4 352 2.138 2753,3 6 Gaiole 26,4 9,3 18,7 17,1 249 1.662 2599,6
* Poggi del Sasso
** Argiano Table 6 (c). Average data about weather trends in the year 2011 in the period April-October.

33
n Stazione
Temp
max
(°C)
Temp
min
(°C)
Temp
media
(°C)
Daily excursion
(°C)
Rainfall
(mm)
Growing
Degree
Days (°C)
Huglin
Index
1 San Miniato 25,6 14,0 20,5 11,6 290 1.971 2762,6
2 Cinigiano* 25,1 14,2 19,8 10,9 326 1.903 2471,9
3 Magliano 25,7 15,2 21,0 10,5 286 2.230 3196,1
4 Montalcino 23,4 13,9 19,0 9,5 376 1.702 2229,1
5 Montalcino** 25,0 13,2 20,0 11,8 349 1.922 2634,9
6 Gaiole 25,5 9,3 18,3 16,2 335 1.546 2377,1 * Poggi del Sasso
** Argiano Table 6 (d). Average data relating to meteorological trends of 2009-2011 three-year period during
the reference period April-October.
Figure 9. Territorial distribution of the average annual temperature (period 1998-2007).
ARSIA source.
3
2
1
4
5
6

34
Figure 10. Territorial distribution of annual rainfall (mm/per year) (period 1998-2007).
ARSIA source.
Figure 11. Regional distribution of the hydroclimatic balance (mm) for the year 2007 (the difference
between the total rainfall and the total ETP). ARSIA source.
3
2
1
4
5
6
3
2
1
4
5
6

35
3.2 Climatic characteristics
The graphic representation of some averages highlight the differences between areas relative
to average temperatures, temperature range, rainfall and total of Growing Degree Days. (figures
12-23).
The „Gaiole‟ station shows in all the three years the lowest average temperature rates, while
the province of „Grosseto‟, with „Magliano‟ in 2009 and 2011 and with „Cinigiano‟ in 2010
reached the highest average temperatures in the period April-October. In addition „Gaiole‟
differs greatly from the other stations for reaching the highest temperature range in the three
year period, with temperatures close to 20°C in the main summer months. Growing Degree
Days have shown different trends for the years 2009-2010 where there was an accumulation
up to the month of August followed by a sharp fall; instead in 2011, the GDD do not all
follow the same trend moving away from the values of the previous years. To note that 2010
represents the year with the highest rainfall in mm, with the exception of „Argiano‟, where the
mm rainfall is lower compared to the other two years studied.
Figure 12. Average temperature trend in 2009 during the reference period April-October.
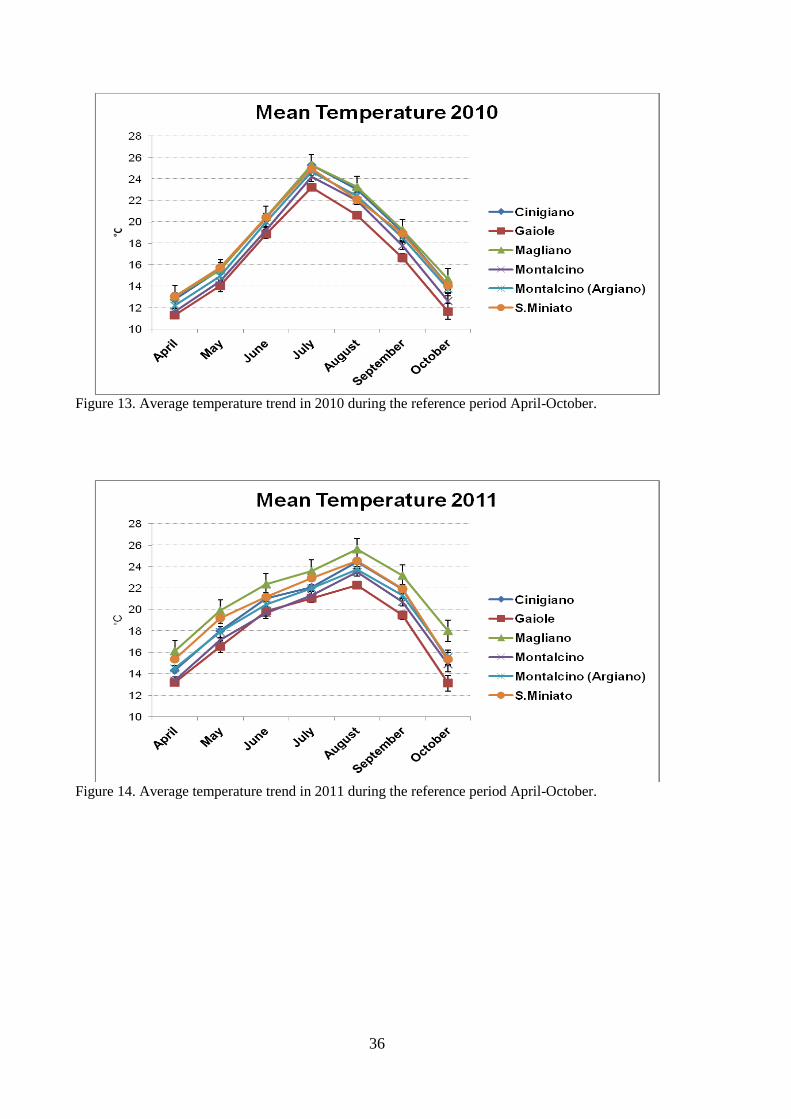
36
Figure 13. Average temperature trend in 2010 during the reference period April-October.
Figure 14. Average temperature trend in 2011 during the reference period April-October.

37
Figure 15. Daily excursion trend in 2009 during the reference period April-October.
Figure 16. Daily excursion trend in 2010 during the reference period April-October.
Figure 17. Daily excursion trend in 2011 during the reference period April-October.

38
Figure 18. GDD trend in 2009 during the reference period April-October.
Figure 19. GDD trend in 2010 during the reference period April-October.
Figure 20. GDD trend in 2011 during the reference period April-October.

39
Figure 21. Rainfall trend in 2009 during the reference period April–October.
Figure 22. Rainfall trend in 2010 during the reference period April–October.
Figure 23. Rainfall trend in 2011 during the reference period April–October.

40
By cluster analysis of the variables noted it was possible to obtain a dendrogram where it was
possible to see areas with similar climatic conditions on the basis of the mean climatic data
observed in each year of the three years studied from the six stations (fig. 24). The sites in the
study are grouped in cluster, the first being „Col D‟Orcia‟ 2010 („Argiano‟) and the second all
the other weather stations. In the second group only the „Magliano‟ 2011 station is
distinguishable from the others. The „Gaiole‟ and „Montalcino‟ stations, unlike the others, fall
in the same group for all three years.
From the centroids graph obtained from the cluster analysis (fig. 25), which highlighted a
significant result since the first two accepted functions represent 93,1% of the total variability,
it is noted that the points relative to the groups show a limited dispersion with the exception
of the „Cinigiano‟ station. Three distinct groups appear in the centroid, the first the stations of
„San Miniato‟ and „Magliano‟ that appear less distinct and the two belonging to the
„Montalcino‟ area; the second the station of „Gaiole‟ very close to that of „San Miniato‟ and
the third „Cinigiano‟ which is the most distinguishable.
The 91,3% of the original grouping are classified correctly, while 87,3% of the cases grouped
cross-validated are reclassified correctly (tab. 8). From the test table of the effects among
subjects, obtained from the multifactor analysis of the variables examined, differences
between weather stations emerge (tab. 7). Analysing the station as a source, the dependent
variables statistically different are maximum/minimum temperature and temperature range. If
on the other hand it is the year as the source the temperature range remains statistically
different together with the rainfall. From the interaction year by station however, the statistics
on the parameters examined resulted negative, that is to say, there are no statistically
significant differences between the stations studied.

41
Figure 24. Dendrogram obtained from the hierarchical cluster analysis of the mean data of the six
stations. Stations grouped on the basis of the average link between groups.
.
Rescaled Distance Cluster Combine
Figure 25. Centroids obtained from the cluster analysis of the climatic parameters.

42
Factor
Dependent
Variable F Sig.
Station T Max 5,717 ,000
T Min 9,235 ,000
T Med 1,615 ,162
Rainfall ,631 ,677
Excursion 58,455 ,000
GDD 1,783 ,122
Year T Max 2,759 ,068
T Min 1,384 ,255
T Med 2,135 ,123
Rainfall 6,359 ,002
Excursion 9,577 ,000
GDD 2,501 ,087
Station
* Year
T Max ,048 1,000
T Min ,058 1,000
T Med ,048 1,000
Rainfall ,262 ,988
Excursion ,260 ,988
GDD ,174 ,998
Table 7. Test of the effects between subjects (p=<0,05).
Station
Number
Group expected
Totals 1 2 3 4 5 6
Cross-
validation
% 1 66,7 ,0 33,3 ,0 ,0 ,0 100,0
2 ,0 95,2 ,0 ,0 4,8 ,0 100,0
3 23,8 ,0 76,2 ,0 ,0 ,0 100,0
4 ,0 ,0 4,8 95,2 ,0 ,0 100,0
5 ,0 ,0 9,5 ,0 90,5 ,0 100,0
6 ,0 ,0 ,0 ,0 ,0 100,0 100,0
Table 8. Classification results.
a. Cross validation is done only for those cases in the analysis in cross validation, each case is
classified by the functions derived from all cases other than that case. b. 93,7% of original grouped cases correctly classified.
c. 87,3% of cross-validated grouped cases correctly classified.

43
3.3 Vineyards’s characteristics
The main characteristics of the vineyards are reported as followed according to the denomination.
3.3.1 ‘Chianti Colline Pisane’
3.3.1.1 ‘Beconcini’ estate
The main component of the soil where the vineyard is situated is the white sand. The other
layers that make up these soils are varied, very thin and mostly consist of a series of marine
fossils from the Pliocene age and of sandstone. So we can see shells of every size and in
quantities such as to constitute, in some cases, the real skeleton of soils and also sands from
the finest to the heaviest, arranged in thin layers and very unlike for salinity and fertility as the
soil goes downwards. The soils are alkaline.
The vineyards are trained to spur pruned cordon with planting design of 1 meter on the row
and 3 meters between rows. With this pruning, every plant presents four spurs with two buds
and so, bud load of eight buds.
Figure 26. „Sangiovese‟s vineyard in „Beconcini‟ estate.

44
3.3.2.‘Montecucco’
3.3.2.1 ‘ColleMassari’ estate
The vineyards of our study are quite homogeneous in terms of conduct, training system,
rootstock and age. Only in the case of „Orto del Prete‟ vineyard, training system is spur
pruned cordon unlike the system used mainly that is the Guyot. All the vineyards have a bud
load of 10 buds per plant.
The main crop operations are performed in the same way in all the vineyards and the
spontaneous grass cover among rows is used.
„ColleMassari‟ is conducted according to the organic protocol and then the pest protection is
carried out exclusively by the use of copper-based and sulphur-based products according to
the limits imposed by law. Shoot thinning is carried out only one time.
The widespread use of summer pruning and mechanic thinning restrict vegetation, which in
itself would be very vigorous. Usually the cluster thinning takes place during the first week of
September.
‘Campo la Mora F9’: sloping vineyard of around 15%, with „rittochino‟ layout in north-east
south-west row orientation and then east- west in the end. The plantation dates from 2003.
Training system: simple Guyot
Clone: clone F9
Rootstock: 161-49 Couderc
Planting design: 2.30 x 0.80 m
Vine density: 5435 vines/ha
Figure 27. „Campo la Mora F9‟ vineyard in „ColleMassari‟ estate.

45
‘Campo la Mora Sal.’: sloping vineyard of around 15%, with „rittochino‟ layout in a north-
east south-west row orientation. The plantation dates from 2003.
Training system: simple Guyot
Clone: Salustri selection
Rootstock: 161 - 49 Couderc
Planting design: 2.30 x 0.80 m
Vine density: 5435 vines/ha
Figure 28. „Campo la Mora Sal.‟ vineyard in „ColleMassari‟ estate.
‘Cerrete’: sloping vineyard greater than 15%, with „rittochino‟ layout and in north-east
south-west row orientation. The plantation is the youngest among the six examined vineyards:
it planted in 2005
Training system: simple Guyot
Clone: Salustri selection
Rootstock: 110 R.
Planting design: 2.30 x 0.80 m
Vine density: 5435 vines/ha

46
Figure 29. „Cerrete‟ vineyard in „ColleMassari‟ estate.
‘Orto del Prete’: sloping vineyard greater than 15%, with „rittochino‟ layout and in east- west
row orientation. The plantation dates from 2001.
Training system: spur pruned cordon
Clone: Talenti‟s selection
Rootstock: 157-11 Couderc
Planting design: 2.30 x 0.80 m
Vine density: 5435 vines/ha
Figure 30. „Orto del Prete‟ vineyard in „ColleMassari‟ estate.

47
‘Vigna Vecchia’: sloping vineyard with „rittochino‟ layout and in north - south row
orientation. The plantation dates from 2001 planting out five Sangiovese‟s selections.
Training system: simple Guyot
Clone: Col D‟Orcia n°5 selectioned clones
Rootstock: 775 P
Planting design: 2.30 x 0.80 m
Vine density: 5435 vines/ha
Figure 31. Vigna Vecchia vineyard in ColleMassari estate.
3.3.2.2 ‘Salustri’ estate
The farm is conducted according to the organic protocol. The ground belongs to those who
present the surface layer from 0 to 30/40 cm, yellowish brown, dry, without any mottling,
with small, common, scarce and medium pores. Besides it is neither very adhesive nor plastic,
with sandy texture, frequent skeleton, devoid of concretions, non-calcareous with pH of 6,8.
The organic fraction of the soil is very low; thus microbial activity, physical structural
characteristics and chemical fertility are adversely affected. The contribution of organic
substance is therefore necessary. The cationic exchange capacity (C.E.C.) is average; the
amount of nutrients kept in cationic form is good. Total nitrogen appears to be low; his
contribution to nitrogenous nutrition of crop is modest. The phosphorus level is medium while
the calcium level is low, as well compared with C.E.C.
The vineyard was established with a „Sangiovese Salustri‟ selection at 0,8 meter on the row
and 2,3 meters between rows (5700 vines/ha), trained to Guyot with 8 buds per plant.

48
Figure 32. Sangiovese‟s vineyard in „Salustri‟ estate.
3.3.3 ‘Morellino di Scansano’
3.3.3.1 ‘Fattoria di Magliano estate’
The soil where the vineyard is situated has a moderately rich texture of skeleton and it is
calcareous. Is situated at 150 m above sea level, in a south-west row orientation.
The pH of the soil is alkaline.
The vineyards in our study are trained to unilateral spur pruned cordon with planting design
of 0,8 meter on the row and 2,2 meters between rows vines are hedged at 0,8 m in height. The
average yield is 1 kg/vine.
Figure 33. Sangiovese‟s vineyard in „Fattoria di Magliano‟ estate.

49
3.3.4 ‘Brunello di Montalcino’
3.3.4.1 ‘Col d’Orcia’ estate
The vineyard is placed on a slight slope with „rittochino‟ layout and in north - south row
orientation. The soil is silty, sandy, alkaline, calcareous reaction with active medium lime,
with a low content of organic substance and of potassium but is characterized by high strength
of magnesium, and of calcium and medium C.E.C. The vineyard was planted in 2000 with
planting design of 0,8 meter on the row and 2,35 meters between rows and 5319 vines/ha is
the planting density.
In this vineyard there are five Sangiovese‟s clones in selection (virus-free) on 420A rootstock,
this ensures a limited vigour, even considering the low amount of organic substance and total
nitrogen.
The vineyard is trained to spur pruned cordon with four spurs per plant; cluster thinning is
used to maintain production within disciplinary levels DOCG „Brunello di Montalcino‟
cluster thinning is used.
Figure 34. Sangiovese‟s vineyard in „Col D‟Orcia‟ estate.
3.3.4.2 ‘La Mannella’ estate
The vineyards is to the north-east of „Montalcino‟, is trained to spur pruned cordon placed at
at 0,8 m from the soil with rows in south east row orientation. The planting design is of 0,8
meter along the row and 3 meters between the rows. The „Sangiovese‟ clone is R24 grafted on
1103P. The soil is stony and alkaline.

50
Figure 35. Sangiovese‟s vineyard in „La Mannella‟ estate.
3.3.4.3 ‘Casanova di Neri’ estate
The vineyard is trained to spur pruned cordon and vines are hedged at 0,55 m in height in
south east row orientation. The planting design is of 0,8 meter on the row and 2,2 meters
between rows. „Sangiovese‟ is a mass selection grafted on 110R. The soil has a medium
consistence and it is rich in stones.
Figure 36. Sangiovese‟s vineyard in „Casanova di Neri‟ estate.

51
3.3.5 ‘Chianti Classico’
3.3.5.1 ‘Castello di Albola’ estate
The vineyard with an east exposure, located in the hills, is placed at an altitude of 550 meters.
The planting design is of 0,80 meter on the row and 2,50 meters between rows and 5000
vines/ha is the planting density.
„Albola‟s soils are characterized by the presence of pedological formations of limestone-
marly nature and partly calcareous-clayey. Morphologically the rock comes from austro-
alpine domain, with a place in the „series of marly limestone‟.
Figure 37. Sangiovese‟s vineyard in „Castello di Albola‟ estate.
3.3.5.2 ‘Capannelle’ estate
The vineyard is collocated on calcareous rocks and it is characterized by rich stones, of
similar origin to the soil of „Albola‟ estate, rows wirh east-west orientation. Vines are trained
to horizontal spur cordon placed at 0,6 m from the ground. At distance of 0,8 x 2,5 m (5000
vine/ha).
Figure 38. Sangiovese‟s vineyard in „Capannelle‟ estate.

52
3.4 Soil’s characteristics
By cluster analysis of the chemical and physical characteristics of the experimental soils (tab.
10) it was possible to obtain dendrograms where it was possible to see theses (tab. 9) with
similar pedologic conditions.
Thesis Code Vineyard Estate
N°
denomination Denomination
1 CCP 1 Beconcini Beconcini 1 Chianti Colline Pisane
2 MC 1 CM F9 ColleMassari 2 Montecucco
3 MC 2 CM Sal ColleMassari 2 Montecucco
4 MC 3 Cer ColleMassari 2 Montecucco
5 MC 4 O_P ColleMassari 2 Montecucco
6 MC 5 V_Vec ColleMassari 2 Montecucco
7 MC 6 S_Marta Salustri 2 Montecucco
8 SC 1 Magliano Magliano 3 Morellino Scansano
9 BM 1_5 CL 1 Col D'Orcia 4 Brunello di Montalcino
14 BM 6 Casanova Casanova di Neri 4 Brunello di Montalcino
15 BM 7 La Mannella La Mannella 4 Brunello di Montalcino
16 CC 1 Capannelle Capannelle 5 Chianti Classico
17 CC 2 Albola Albola 5 Chianti Classico
Table 9. Prospect of vineyards chosen for the statistical analysis of the soil.
Parameter M.U.
pH
Sand %
Silt %
Clay %
Total limestone %
Active limestone %
Cation exange capacity meq/100g
Electrical conducity dS/m
Total nitrogen g/Kg
Organic substance %
P205 ppm
CaO ppm
Mg0 ppm
K20 ppm
Table 10. Prospect of parameters chosen for the statistical analysis of the soil.

53
Code Sand Silt Clay pH
Electrical
conductivity
Cationic
exange
capacity
Organic
matter
CCP 1 28,0 44,0 28,0
8,50 0,11 14,50 0,97
MC 1 49,0 26,0 25,0 7,90 0,16 17,40 1,46
MC 2 49,0 26,0 25,0 7,90 0,16 17,40 1,46
MC 3 37,0 36,0 27,0 7,80 0,45 14,60 1,12
MC 4 58,0 22,5 19,5 7,90 0,15 13,40 1,17
MC 6 67,0 19,0 14,0 7,90 0,13 9,47 0,88
MC 7 70,0 20,0 10,0 6,80 0,07 15,40 1,20
SC 1 29,0 39,0 32,0 8,30 0,14 14,60 2,30
BM 1_5 14,0 60,0 26,0 8,30 0,13 15,66 0,27
BM 6 42,4 21,6 36,0 8,15 0,44 18,80 0,53
BM 7 57,0 20,0 23,0 8,41 0,30 18,40 1,29
CC 1 61,7 21,3 17,0 8,40 0,13 16,20 1,22
CC 2 49,6 23,0 27,4 8,40 0,13 25,30 1,36
Table 11. Physical characteristics of the experimental soils.
Code
Total
limestone
Active
limestone
Tot.
nitrogen P205 CaO Mg0 K20
CCP 1 21,00 14,50 0,06 10,80 3150 132 70
MC 1 5,90 1,90 0,09 4,00 3050 130 125
MC 2 5,90 1,90 0,09 4,00 3050 130 125
MC 3 39,70 8,00 0,07 5,00 2600 130 100
MC 4 0,22 2,85 0,05 4,50 2350 110 108
MC 6 23,50 3,80 0,06 5,00 1650 90 91
MC 7 0,70 0,10 0,10 21,50 1.684 490 181
SC 1 31,00 14,60 0,20 18,00 3650 320 141
BM 1_5 34,80 0,14 0,03 4,00 3400 185 90
BM 6 0,50 0,10 0,07 5,00 3212 1.135 324
BM 7 19,50 3,80 0,09 9,00 4796 181 98
CC 1 9,24 2,39 0,02 5,00 2760 161 410
CC 2 8,30 4,75 0,09 5,50 2930 154 322
Table 12. Chemical characteristics of the experimental soils.

54
Figure 39. Dendrogram obtained from the texture analysis of the soils.
The dendrogram obtained from the texture analysis (fig. 39) showed that the soils were
included into two large groups, in which we find in the first nine soils with a prevailing sandy
composition, while in the second one mostly silty soils (4 vineyards).
Figure 40. Dendrogram obtained from the physical and chemical analysis of the soils.

55
Examining chemical and physical characteristics of the soils was obtained the second
dendrogram (fig. 40).
The soil of the vineyard located in the „Chianti Colline Pisane‟ is a sandy, alkaline,
calcareous soil, poor in organic matter and potassium, with a mean amount of magnesium and
phosphorus (tab. 11-12).
The soils of the vineyards of „Montecucco‟ area have several differences between them, so as
they can be grouped into three clusters (tab. 11-12).
In the first one MC1 and MC 2, almost identical, are characterized by prevalence of sand,
sub-acid pH, moderate presence of limestone, low organic substance, and average potassium,
magnesium and exchange cation capacity. The MC3 and MC 4 even though appear in the
same cluster have some differences, for example the MC4 has greater content of sand while
the MC3 has equal proportions of sand, silt and clay. Different is the amount of total
limestone but not the active limestone which is low, in addition pH, organic matter and the
macro elements are at low or medium similar levels in both vineyards.
The third cluster is composed by MC5 and MC6 which have in common the high percentage
of sand and the low amount of clay. The MC5 soil has a slight range of active lime and a low
content of all the other elements. Soil of the vineyard MC6 has a lower pH, almost no
limestone, low organic substance and available nitrogen, meanwhile it has a good amount in
phosphorus, magnesium and potassium content.
The two vineyards located in the „Chianti Classico‟ belong to the same cluster although are
characterized by medium to high content of sand, medium silt and variable amount of clay.
Both soils are alkaline, moderately rich in active limestone, organic substance and mineral
elements (tab. 11-12).
The soil of the vineyard of „Magliano‟ has some similarities to one of the „Brunello di
Montalcino‟ (BM1_5) vineyard („Col D'Orcia‟ estate), for the prevalence of silty particles, the
same alkaline pH and quantity of active limestone, while the soil of „Magliano‟ estate is rich
in organic matter and well provided by all the other elements, while the BM1_5, is poor of
organic matter and by the other macro elements (tab. 11-12).
The soil of the other two vineyards of the „Montalcino‟ area are very different, in particular
BM6 („Casanova di Neri‟) is clay-sandy, poor in organic matter and phosphorus, while is rich
in potassium and showed an excess of magnesium. The soil of BM7 wich has a prevalence of
sand, is calcareous and rich in magnesium and poor in potassium.

56
3.5 The study of geopedologic, orographic and viticultural aspects:
the ColleMassari estate
As for data on soils (www.soilmaps.it) bibliographic data (Costantini et al.; 2006) and current
database was used as well as specific analyses conducted on the soils of the specific territory.
In depth study was carried out in the DOC „Montecucco‟ area where six vineyards from the
same wine farm were chosen, from which data on the geopedologic characteristics of the soils
were obtained from a previous study (Lizio 1999).
In this case the chemical-physical characteristics of the soil, were obtained from soil samples
analyzed in a special laboratory using methods approved by the „Società Italiana di Scienza
del Suolo‟. The geopedologic study refers to the land in the „ColleMassari‟ area, in the town
of „Cinigiano‟ (Gr) on a surface area of around 200 ha, where the six vineyards in question
are located. A general geological and geopedologic survey was carried out first. A study on
the soil type was carried out following the geological study of the area, using where possible a
manual drill to the depth of 80-100 cm, as often there were strata of compact pebbles and
clays. The limits between different soils are never clearly defined but the passage always
occurs through transition forms. The open profiles have been marked on the topographic map
to the scale of 1:5000, by enlarging the topographic base to the scale of 1:25.000 of the IGM.
During this geopedologic survey the World Reference Base for Soil Resources (WRB) was
used, which has led to the adoption of an innovative soil classification, already codified and
used internationally for geopedologic surveys. This type of classification regards the
functional characteristics of the soil as important without systematically subordinating it to
climatic data which obviously must be part of the interpretative aims of a project of zoning
but not necessarily be part of the geopedological definition of the interpretative model of the
soil examined and least of all subordinating it (Costantini and Lizio, 1996 ). The observations
transcriptions in the world soil classification (WRB) of the Fao, the last version of which was
published in 2001, conforms to the geoviticulture (Vaudour E., 2005) prospective. The
analysed data is always reinterpreted in the light of those modifying processes that occur on
the soil, therefore, it would be good practice to inspect the soils in different periods of the
year, as was done in this study. Studying the soil also means placing it in relation with the
landscape in which it is found so as to understand how the pedogenesis factors act, ie. the
climatic, biological, anthropical and geomorphologic processes occur on the territory
(Costantini and Lizio, 1996).

57
For a better understanding of the pedologic data there is a list of suffixes used to describe the
soil strata that for the most part traces the indications given by the „Chiavi della Soil
Taxonomy ed.1992‟.
STRATA Ap: mineral strata that form on the surfaces interested by agricultural work
(trenching – ploughing).
STRATA B: strata that form below strata Ap and that are well structured .
HORIZON or STRATA C: strata that are not so influenced by pedogenetic processes and lack
the characteristics of strata Ap and B, but are made of hard rock.
HORIZON or STRATI R: presence of hard rock and impenetrable from the plant roots, the
rock is not possible to dig out with a spade.
Suffix of the horizons:
g (gley) hydromorphia linked to the drainage limitations in the soils, or to a saturation of the
horizons with stagnating water;
w (weathering) used to draw an alteration horizon B in which materials of soil origin are
differentiated by colour, structure or both;
t horizon of alluvial clay cumulus;
k horizon of calcium carbonate cumulus;
r (rock) symbol used to characterize the horizons C, made of soft rock, partially cemented; in
any case materials that can be dug up with a spade, but cannot be penetrated from the plant
roots save through their fractures;
n exchangeable sodium cumulus.;
AWC (usable water): differences between field capacity and withering point.
Water reserve classes ( A, W, C in mm):
Very high> 200 mm;
High 150-200 mm;
Moderate 100-150 mm;
Low 50-100 mm;
Very low < 50mm
In particular for this wine farm the study was carried out on soils from 4 specific vineyards
that are identified and described in the units they belong to. Their physical characteristics
have been determined by studying soil conduits, both by manual drill and by opening
pedologic profile, with samples per soil strata (Lizio, 1999).

58
3.5.1 ‘Campo La Mora’
The soil where the vineyard is located falls within the cartographic unit called „Unità Bocca
Nera‟ which occupies the moderate convex slopes , with excessive internal drainage.
Lithology: Polygenic conglomerates of the Messinian sup.. The substrata is made up of
pebbles and sand with areas where the pebble concentration prevails on the sandy part. The
soils present a sequence Ap/C, are moderately deep with a skeleton of 35% to 40%.
The horizon from 0 to 40 cm light yellowy brown in colour has a structure that tends to be
loose; an open sandy clayey texture, abundant skeleton, limestone, pH 7,9 ,a horizon from 40
to 110 cm pale brown in colour, bulky, open texture abundant skeleton; high in limestone and
pH 8,1. The organic substance is low and the C.E.C. average on all the pedologic profile (tab.
13).
The apparent density is 1,4 gr/cmc, useful water calculated AWC is 95mm, belonging to the
low water reserve (50-100mm). As for taxonomy the soils belong to the Xerorthents typical
open skeleton .
Figure 41. Ground‟s surface of „Campo la Mora’.
Figure 42. Soil‟s profile of „Campo la Mora’.
.

59
PHYSICAL AND
CHEMICAL
ANALYSIS VALUE JUDGMENT
Skeletron Ab. abundant
Sand 50%
Silt 32%
Clay 18%
pH 8,1 medium alkaline
Electrical conducity 0,118 mS normal
Total limestone 59,00% calcareous
Active limestone 7,4 medium
Organic matter 0,14 medium-low
NUTRIENTS
ANALYSIS VALUE JUDGMENT
Total N 0,02% medium-low
Assimilable P 4 ppm medium-low
Assimilable Fe 3 ppm low
Assimilable Mn 8,2 ppm medium
Assimilable Cu 0,2 ppm medium-low
Assimilable Zn 0,3 ppm medium-low
Soluble Bo 0,26 ppm medium-low
Exchangeable Ca 1800 ppm high
Exchangeable Mg 140 ppm medium
Exchangeable K 80 ppm low
Exchangeable Na 100 ppm normal
C.E.C. ANALYSIS VALUE (meq/100 g) JUDGMENT
C.E.C. 10,80 meq medium
Ca 9 meq 83,3% high
Mg 1,17 meq 10,8% high
K 0,20 meq 1,9% low
Na 0,43 meq 4,0% normal
Basic saturation 100% high
mg/K ratio (meq/meq) 5,9 high
Table 13. Physical and chemical analysis of the soil of „Campo la Mora‟(profile 40-110 cm).
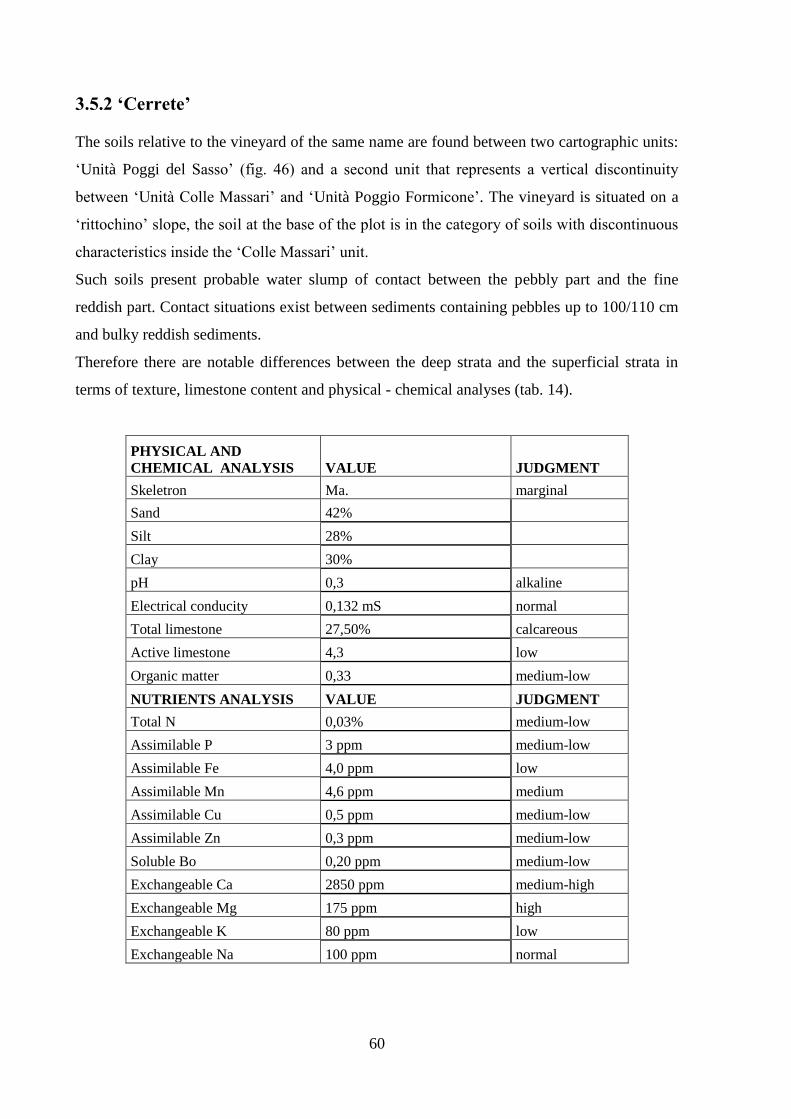
60
3.5.2 ‘Cerrete’
The soils relative to the vineyard of the same name are found between two cartographic units:
„Unità Poggi del Sasso‟ (fig. 46) and a second unit that represents a vertical discontinuity
between „Unità Colle Massari‟ and „Unità Poggio Formicone‟. The vineyard is situated on a
„rittochino‟ slope, the soil at the base of the plot is in the category of soils with discontinuous
characteristics inside the „Colle Massari‟ unit.
Such soils present probable water slump of contact between the pebbly part and the fine
reddish part. Contact situations exist between sediments containing pebbles up to 100/110 cm
and bulky reddish sediments.
Therefore there are notable differences between the deep strata and the superficial strata in
terms of texture, limestone content and physical - chemical analyses (tab. 14).
PHYSICAL AND
CHEMICAL ANALYSIS VALUE JUDGMENT
Skeletron Ma. marginal
Sand 42%
Silt 28%
Clay 30%
pH 0,3 alkaline
Electrical conducity 0,132 mS normal
Total limestone 27,50% calcareous
Active limestone 4,3 low
Organic matter 0,33 medium-low
NUTRIENTS ANALYSIS VALUE JUDGMENT
Total N 0,03% medium-low
Assimilable P 3 ppm medium-low
Assimilable Fe 4,0 ppm low
Assimilable Mn 4,6 ppm medium
Assimilable Cu 0,5 ppm medium-low
Assimilable Zn 0,3 ppm medium-low
Soluble Bo 0,20 ppm medium-low
Exchangeable Ca 2850 ppm medium-high
Exchangeable Mg 175 ppm high
Exchangeable K 80 ppm low
Exchangeable Na 100 ppm normal

61
C.E.C. ANALYSIS VALUE (meq/100 g) JUDGMENT
C.E.C. 16,34 meq medium
Ca 14,25meq 87,30% high
Mg 1,46 meq 8,9% medium
K 0,20 meq 1,20% low
Na 0,43meq 2,60% normal
Basic saturation 100% high
Table 14. Physical and chemical analysis of the soil of „Cerrete‟(profile 110-170 cm).
The soil upstream the plot falls within the „Poggi del Sasso‟ unit (fig. 45) and occupies the
sides with the low to moderate slopes badly drained. The substrata is made up of fine sandy
silts sediment with calcium carbonate concentrations right up to the surface.
Figure 43. Ground‟s surface of „Cerrete’.

62
Figure 44.Vertical discontinuity between
„Unità ColleMassari‟ and „Unità Poggio
Formicone‟.
The soils that fall in this category present a sequence Ap/CBgl/Cg2, are deep soils with a poor
skeleton and with obvious signs of hydromorphia. The horizon from 0 to 20/30 cm light olive
brown in colour, has an angular structure, moderately developed average, open texture,
ordinary skeleton, very chalky, pH 8, modest ordinary small red and grey mottles and small
ordinary limestone carbonate concretions. The horizon from 20/30 cm to 70 cm light olive
brown in colour, with average angular multifaceted structure, moderately developed, poor
skeleton, very calcareous, with pH 8,5, clear ordinary small red and grey mottles and small
ordinary limestone carbonate concretions. The horizon from 70 to 120 cm grey brown in
colour, lacking in structure and massive, open clayey texture, no skeleton, very calcareous,
with pH8, clear, ordinary small red and grey mottles, sodium content slightly high. The
organic matter is generally very low, average C.E.C., on all the pedologic profile. The
apparent density is 1,35 g/cmc for the superficial horizon, 1,3 g/cmc for the horizon below,
1,4 g/cmc for the third horizon; useful water calculated AWC is 168 mm, belonging to the
high water reserve class (150-200 mm).
Figure 45. „Poggi del Sasso‟ unit..

63
The taxonomy of the soils belong to the Aquic Xerorthens, open fine on fine clay with soda
clay.
Observations: as can be seen from the analysis the texture goes from sandy for the top soil to
clay silt for the sub soil, here too the depth increases electric conductibility associated to high
sodium content both in absolute value and in relation to C.E.C. .This is a soil characteristic of
the „Poggi del Sasso‟ that presents a finer texture than the other soils in the wine farm with a
presence of sodium in the sub soil associated to a higher clay content and to clear
hydromorphy, sign of imperfect drainage .
3.5.3 ‘Orto del prete’
The vineyard is located in a transition area between two cartographic units: „Unità Colle
Massari‟ and slight variation from the‟ Colle Massari‟ and „Bocca Nera‟ units.
„Colle Massari‟ occupies the steep slopes, with excessive internal drainage .
Lithology: Polygenic Messinian sup. conglomerates.
The substrata is made up of pebbles in sandy soil with areas in which the pebbly part prevails
on the fine sand, abundant presence of pebbles right from the surface. Such soils belong to the
category of soils that have a sequence Ac/C/Cr, moderately deep with a rich skeleton from
35% to 40%.
The horizon from 0 to 30/40 cm yellowy brown in colour , presents a structure that tends to
be loose, sandy texture, rich skeleton, very chalky with pH 7,9, the horizon 30/40 cm to 70/80
cm pale brown in colour, bulky, sandy franco texture, rich skeleton, with a pH 8,1; the strata
from 70/80 cm to 110 cm is very pebbly with thin layers of chalky sand.
The organic substance is very low and low C.E.C., on all the pedologic profile.
The nutrients analyses show a low quota of macro elements nitrogen, phosphorous and
potassium as well as inadequate secondary macro elements and microelements.
The apparent density is 1,4 gr/cmc, useful water calculated AWC is 72 mm, belonging to low
water reserve class (50-100 mm).
Regarding taxonomy the soils belong to Xerorthents typical sandy skeleton.
The „Bocca Nera‟ unit occupies the convex moderately steep slopes, with excessive internal
drainage.
Lithology: Messiniano sup. Polygenic conglomerates.

64
The substrata is made up of pebbles in sandy soils with areas in which the pebbly part prevails
on the fine sand. The soils have a sequence Ap/C are moderately deep soils with rich skeleton
from 35% to 40%.
The horizon from 0 to 40 cm light yellowy brown in colour has a structure that tends to be
loose, a clayey sandy texture, rich skeleton, chalky at pH 7,9, the horizon from 40cm to 110
cm pale brown in colour, bulky, with texture, rich skeleton, very chalky with pH 8,1 (tab. 15).
low organic matter and average C.E.C., on all the pedologic profile.
The apparent density is 1,4 gr/cmc, useful water calculated AWC is 95 mm, belonging to the
low water reserve class (50-100 mm).
As for taxonomy the soils belong to the Xerorthents typical skeleton.
Observation: for the soil that hosts the vineyard „Orto del Prete‟ the same is valid as for
„Campo la Mora‟ and for „Vigna Vecchia‟ in as much as the two cartographic units intersect
to which the soils of these two theses belong.
PHYSICAL AND
CHEMICAL
ANALYSIS VALUE JUDGMENT
Skeletron Ab. abundant
Sand 50%
Silt 32%
Clay 18%
pH 8,1 medium alkaline
Electrical conducity 0,118 mS normal
Total limestone 59,00% calcareous
Active limestone 7,4 medium
Organic matter 0,14 medium-low
NUTRIENTS
ANALYSIS VALUE JUDGMENT
Total N 0,02% medium-low
Assimilable P 4 ppm medium-low
Assimilable Fe 3 ppm low
Assimilable Mn 8,2 ppm medium
Assimilable Cu 0,2 ppm medium-low
Assimilable Zn 0,3 ppm medium-low
Soluble Bo 0,26 ppm medium-low
Exchangeable Ca 1800 ppm high
Exchangeable Mg 140 ppm medium
Exchangeable K 80 ppm low
Exchangeable Na 100 ppm normal

65
C.E.C. ANALYSIS VALUE (meq/100 g) JUDGMENT
C.E.C. 10,80 meq medium
Ca 9 meq 83,3% high
Mg 1,17 meq 10,8% high
K 0,20 meq 1,9% low
Na 0,43 meq 4,0% normal
Basic saturation 100% high
Table 15. Physical and chemical analysis of the soil of „Orto del Prete‟(profile 0-120 cm).
Figures 46-47. Ground‟s surface and soil‟s profile of „Orto del Prete’.
3.5.4 ‘Vigna Vecchia’
The land on which the vineyard is located falls within the cartographic unit called „Unità
Colle Massari‟ which occupies the very steep slopes, with excessive internal drainage.
Lithology: Messinian sup. Polygenic conglomerates. The substrata is made up of pebbles in
sandy soils with areas in which the pebbly part prevails on the fine sand, abundant presence of
pebbles right from the surface. Such soils belong to the category that have a sequence
Ac/C/Cr, moderately deep with rich skeleton from 35% to 40%.

66
The horizon from 0 to30/40 cm yellowy brown in color , has a structure that tends to be loose,
a sandy texture, rich skeleton, very chalky at pH 7,9, the horizon from 30/40 cm to 70/80 cm
pale brown in colour, bulky, with sandy texture, rich skeleton, very chalky with pH 8,1, the
strata from 70/80 cm to 110 cm is characterized abundant pebbles with thin layers of chalky
sand.
The organic matter and C.E.C. are low, on all the pedologic profile.
The nutrients analyses moreover show a deficit in macro elements, nitrogen, phosphorous and
potassium as well as inadequate secondary macro elements and microelements (tab. 16).
The apparent density is 1,4 gr/cmc, useful water calculated AWC is 72 mm, belonging to the
low water reserve class (50-100 mm).
As for taxonomy the soils belong to the Xerorthents skeleton.
Figure 48. Ground‟s surface of „Vigna Vecchia‟.
Figure 49. Soil‟s profile of „Vigna Vecchia’.

67
PHYSICAL AND
CHEMICAL
ANALYSIS VALUE JUDGMENT
Skeletron Ab. abundant
Sand 67%
Silt 19%
Clay 14%
pH 7,9 sub alkaline
Electrical conducity 0,133 mS normal
Total limestone 23,50% calcareous
Active limestone 3,8 medium
Organic matter 0,88 medium-low
NUTRIENTS
ANALYSIS VALUE JUDGMENT
Total N 0,06% low
Assimilable P 5 ppm medium-low
Assimilable Fe 3,2 ppm low
Assimilable Mn 15,6 ppm medium
Assimilable Cu 3,6 ppm medium
Assimilable Zn 0,4 ppm medium-low
Soluble Bo 0,42 ppm low
Exchangeable Ca 1650 ppm high
Exchangeable Mg 90 ppm low
Exchangeable K 91 ppm low
Exchangeable Na 55 ppm normal
C.E.C. ANALYSIS VALUE (meq/100 g) JUDGMENT
C.E.C. 9,47 meq low
Ca 5,25 meq 87,2% high
Mg 0,75 meq 7,9% medium
K 0,23 meq 2,4% medium
Na 0,24 meq 2,5% normal
Basic saturation 100% high
mg/K ratio (meq/meq) 3,3 medium
Table 16. Physical and chemical analysis of the soil of „Vigna Vecchia‟(profile 0-30/40cm).

68
Figure 50. Geopedologic card scale 1:5000; vineyard Campo la mora ( ), Vigna Vecchia ( ), Orto del Prete ( ), Cerrete (
Orto del
Prete
Vigna
Vecchia
Cerrete
Campo la Mora

69
3.6 Harvest date
Figure 51. Harvest date: comparison among 2009, 2010 and 2011 seasons.
Harvest time is set between the second half of September and the second half of October. For
the year 2009, the first area harvested was the „Chianti‟ from the „Colline Pisane‟, while the
last was the „Chianti Classico‟. Among the theses within the same production areas harvesting
time differs only a few days. The year 2010 recorded lower average temperatures compared
to the year before and this justifies the delay in harvesting in most of the thesis analysed,
exception made for the „Morellino di Scansano‟ Denomination and for the two belonging to
the „Chianti Classico‟, where it was necessary to delay the harvesting even more. Only the
bunches from the producer „Fattoria di Magliano‟ were picked in September and not in
October as in the case of the others. Early harvesting on the other hand, in all the farms in the
year 2011 was completed by the 20th
September. Such a result was no surprise because the
year 2011 was hotter in the period from April to end of October and therefore with a greater
cumulus of Growing Degree Days in all the areas. The bunches belonging to the „Chianti
Colline Pisane‟ denomination were harvested last while two years before they had been the
first to be harvested (fig. 51).

70
3.7 Sensorial characteristics of the grapes at harvest’s time
The MANOVA was conducted by examining the parameters linked to the sensorial analysis
of the grapes (tab. 17) at harvest‟s time harvested (using the values of three repeated analysis
of 17 theses each year for three years), studying the importance of the variables in function of
the chosen factor (tab. 18).
The real numeric values expressed by the panel were convert into percentages values relative
to the maximum value of 4.
Variable Abbreviation Units
Berry colour Ber. Col. s
Skin texture Skin text. s
Skin astringency Skin astr. s
Skin bitterness Skin bit. s
Skin aroma Skin aro. s
Skin maturity Skin mat. s
Pulp separation Pulp sep. s
Pulp acidity Pulp acid. s
Pulp swetness Pulp swe. s
Pulp aroma Pulp aro. s
Pulp maturity Pulp mat. s
Seed colour Seed col. s
Seed hardness Seed har. s
Seed bitterness Seed bit. s
Seed astringency Seed astr. s
Seed aroma Seed aro. s
Seed maturity Seed mat. s
Berry aroma Berry aro. s
Berry sensorial maturity* B.S.M. s
* Berry sensorial maturity was calculated by summing skin‟s, pulp‟s and seed‟s maturity
Table 17. List of abbreviations.

71
Factor Dependent
variable F Sig. Thesis Berry colour 25,727 ,000
Pulp separation 16,794 ,000
Pulp sweetness 8,436 ,000
Pulp acidity 4,875 ,000
Pulp aroma 7,100 ,000
Skin texture 11,149 ,000
Skin astringency 17,699 ,000
Skin aroma 7,943 ,000
Skin bitterness 10,120 ,000
Seed colour 9,094 ,000
Seed hardness 3,769 ,000
Seed bitterness 13,893 ,000
Seed astringency 6,431 ,000
Seed aroma 7,427 ,000
Pulp maturity 4,068 ,000
Skin maturity 9,189 ,000
Seed maturity 3,116 ,000
Berry aroma 2,277 ,007
Berry sensorial
maturity 1,554 ,096
Factor Dependent
variable F Sig. Year Berry colour 1,577 ,212
Pulp separation 93,822 ,000
Pulp sweetness 10,396 ,000
Pulp acidity 18,280 ,000
Pulp aroma 8,826 ,000
Skin texture 17,695 ,000
Skin astringency 8,107 ,001
Skin aroma 16,785 ,000
Skin bitterness 16,453 ,000
Seed colour 11,740 ,000
Seed hardness 58,463 ,000
Seed bitterness 94,802 ,000
Seed astringency 103,532 ,000
Seed aroma 126,072 ,000
Pulp maturity 14,343 ,000
Skin maturity 13,660 ,000
Seed maturity 62,480 ,000
Berry aroma 26,456 ,000
Berry sensorial
maturity 12,986 ,000
Factor Dependent
variable F Sig. Thesis
* Year Berry colour 16,377 ,000
Pulp separation 16,247 ,000
Pulp sweetness 3,226 ,000
Pulp acidity 3,333 ,000
Pulp aroma 2,558 ,000
Skin texture 8,494 ,000
Skin astringency 12,496 ,000
Skin aroma 8,793 ,000
Skin bitterness 17,168 ,000
Seed colour 6,305 ,000
Seed hardness 10,468 ,000
Seed bitterness 11,994 ,000
Seed astringency 10,992 ,000
Seed aroma 9,597 ,000
Pulp maturity 2,194 ,002
Skin maturity 9,045 ,000
Seed maturity 6,042 ,000
Berry aroma 3,431 ,000
Berry sensorial
maturity 2,315 ,001
Table 18 a, b, c. Test of the effects between subjects. (p=<0,05).

72
All the dependant variables proved to be statistically significant, bar the parameter indicated
with berry sensorial maturity linked to the sum of skin‟s, pulp‟s and seed‟s maturity. Such
variables do not change their level of significance if, the factor chosen during the statistical
analysis, is that of the thesis or the year or interaction between the two. However choosing the
year, a non significant statistical variable, the colour of the berry is added (tab. 18).
By using the data previously obtained the level of variability attributable to the different
factor was calculated (tab. 19). For most of the parameters the variability is attributable to the
year; the thesis, however, shows more variability as concerns berry colour and skin
astringency. Skin bitterness shows comparable levels of variability attributable to the different
source; most likely this is due to the difficulty in judging the sensation of bitterness.
Variable
%
variability
due to the
thesis
%
variability
due to the
year
%
variability
due to
interaction
thesis/year
%
variability
due to
error Berry colour 57,58 3,53 36,65 2,24 Pulp separation 13,13 73,38 12,71 0,78 Pulp sweetness 36,59 45,09 13,99 4,34 Pulp acidity 17,74 66,50 12,13 3,64 Pulp aroma 36,44 45,30 13,13 5,13 Skin texture 29,08 46,15 22,16 2,61 Skin astringency 45,03 20,63 31,79 2,54 Skin aroma 23,01 48,62 25,47 2,90 Skin bitterness 22,62 36,77 38,37 2,24 Seed colour 32,32 41,72 22,41 3,55 Seed hardness 5,11 79,33 14,20 1,36 Seed bitterness 11,42 77,91 9,86 0,82 Seed astringency 5,27 84,89 9,01 0,82 Seed aroma 5,15 87,49 6,66 0,69 Pulp maturity 18,83 66,39 10,15 4,63 Skin maturity 27,94 41,53 27,50 3,04 Seed maturity 4,29 86,02 8,32 1,38 Berry aroma 6,87 79,77 10,35 3,02 Berry sensorial maturity 8,70 72,73 12,97 5,60
Table 19. Level of variability attributable to the different factor.

73
From Tukey‟s statistic test it is possible to note the table with the different subsets and those
non differentiated; the most of significant variables creates differentiated homogenous
subsets, except for berry‟s aroma and sensorial maturity (tab. 20-22).
Regarding the sensorial maturity the values shown are the highest in one thesis of the „Chianti
Classico‟ area and the lowest in the one of „Morellino di Scansano‟ that is the thesis with less
difference as maturity level among the different parts of the berry (tab. 20). In general,
optimal value of sensory maturity are present in Siena‟s province; this area shows greater
variability in its theses if compared to Grosseto (tab. 20).
Grapes coming from „Chianti Colline Pisane‟ are characterized by differences among
maturation‟s level of the three parts of the berry; the skin appears more mature than seeds on
the contrary, seeds appear more mature than skin in one thesis belongs to the „Brunello di
Montalcino‟.
Analysing pulp‟s maturity, the lowest value belongs to the „Morellino di Scansano‟ thesis
while the highest to a „Brunello di Montalcino‟ thesis (tab. 20).
Regarding skin‟s maturity the highest value is found in one thesis of the „Brunello di
Montalcino‟ while the lowest value in „Morellino di Scansano‟ thesis already noted (tab. 21).
The values obtained from the analysis of seed‟s maturity indicate the lowest value in one
thesis of the „Chianti Colline Pisane‟ and the highest in one thesis of the „Chianti Classico‟
(tab. 22).
Code
Berry
colour Berry
aroma Berry
sensorial
maturity
Pulp
separation Pulp
sweetness Pulp
acidity Pulp aroma
Pulp maturity
CCP 1 93,06 bc 81,93 a 81,41 a 83,60 ab 88,9 b-e 84,73 a-d 83,89 a-e 85,15 ab
MC 1 98,61 ef 86,12 a 83,56 a 92,89 ef 93,12 de 84,73 a-d 92,28 ef 90,60 b
MC 2 99,33 f 81,93 a 83,62 a 90,35 c-f 94,79 e 86,40 cde 93,96 f 91,23 b
MC 3 99,33 f 79,13 a 83,28 a 92,04 def 91,4cde 87,24 cde 90,60 b-f 90,18ab
MC 4 96,23 c-f 79,41 a 84,24 a 86,98 a-d 92,2cde 83,89 a-d 88,08 b-f 87,66 ab
MC 5 98,75 ef 84,73 a 83,03 a 93,07 f 93,95 e 88,92 de 92,28 ef 92,07 b
MC 6 99,33 f 84,45 a 85,27 a 93,73 f 89,7cde 86,40 cde 87,24 b-f 89,13 ab
MS 1 86,05 a 78,57 a 85,47 a 90,35 c-f 78,02 a 78,85 ab 77,18 a 80,95 a
BM 1 90,16 b 83,89 a 86,25 a 81,91 a 89,76cde 83,89 a-d 87,24 b-f 85,57 ab
BM 2 96,34 c-f 85,01 a 86,34 a 87,82b-e 93,95 e 91,44 e 90,60 b-f 90,81b
BM 3 96,34 c-f 83,61 a 86,92 a 92,78ef 91,44cde 84,73 a-d 91,44 def 89,97ab
BM 4 95,60 cde 81,37a 87,25 a 86,13 abc 83,05abc 90,60 de 85,57 a-f 86,19 ab
BM 5 99,33 f 81,09 a 87,58 a 93,07 f 83,89 a-d 77,18 a 79,69 ab 83,47 ab
BM 6 98,31 def 85,29 a 88,32 a 93,73 f 93,12 de 88,08 de 93,12 ef 91,86b
BM 7 99,33 f 78,85 a 88,38 a 82,75 ab 88,08 b-e 82,21abc 87,24 b-f 84,93ab
CC 1 95,60 cde 78,29 a 88,81 a 87,82 b-e 79,69 ab 82,21abc 81,37 abc 82,63ab
CC 2 94,75 cd 84,91 a 89,01 a 84,44 ab 79,59 ab 78,76 ab 82,12 a-d 81,06 a
Table 20. Significant parameters with different and non differentiated subsets. Tukey (p=0,05).

74
Code Skin
texture Skin
astringency Skin
aroma Skin
bitterness Skin
maturity
CCP 1 91,44 g 91,44 g 72,14 a 88,92 fg 90,18 f
MC 1 88,08efg 83,89 c-g 76,34 ad 87,24 d-g 85,78 def
MC 2 81,37 a-e 75,50 bc 77,18 a-e 79,69 a-e 78,85 a-e
MC 3 72,98 a 65,43 a 73,82abc 72,98 a 71,09 a
MC 4 80,53 a-e 72,14 ab 77,18 a-e 76,34 abc 76,55abc
MC 5 90,60 fg 79,65 b-f 72,98 ab 78,85 a-d 83,05c-f
MC 6 87,24 dg 87,24 fg 77,18 a-e 88,92 fg 87,24 ef
MS 1 84,73 cg 77,18 bcd 78,85 a-e 83,89 c-f 80,74 b-e
BM 1 72,98 a 83,89 c-g 81,37 b-f 84,73 c-g 80,95 b-e
BM 2 78,85 ad 73,82 ab 81,37 b-f 83,05 b-f 78,23 a-d
BM 3 82,21 b-f 78,02 b-e 82,21 c-f 81,37 a-f 79,48 a-e
BM 4 77,18abc 86,40 efg 83,05def 88,08 efg 83,26 c-f
BM 5 90,60 fg 91,44 g 83,89def 93,12 g 90,18f
BM 6 84,73 cg 79,69 b-f 84,63def 83,89 c-f 82,42 b-f
BM 7 74,66 ab 71,30 ab 85,57 ef 74,66 ab 73,61 ab
CC 1 85,57 cg 75,50 bc 85,57 ef 76,34 abc 77,39 a-d
CC 2 84,62 cg 85,46 d-g 88,92 f 87,14 d-g 85,46 def
Table 21. Significant parameters with different and non differentiated subsets. Tukey (p=0,05).
Code
Seed
colour Seed
hardness Seed
bitterness Seed
astringency Seed
aroma Seed
maturity
CCP 1 78,85abc 86,40 ab 67,11 a 74,66 ab 72,98 a 76,00 a
MC 1 79,69abc 88,08 ab 80,53 bcd 83,05 bc 82,21 be 82,71abc
MC 2 83,05bcd 84,73 ab 73,82abc 80,53 abc 72,98 a 79,02abc
MC 3 80,53abc 79,69 a 78,02 bcd 72,94 a 73,82ab 77,01ab
MC 4 85,57 be 79,69 a 72,98 abc 72,94 a 72,98 a 76,84 ab
MC 5 83,89bcd 89,76 b 78,86 bcd 79,69 abc 78,85 ad 82,21abc
MC 6 93,12 e 84,73 ab 77,18 bcd 77,18 ab 80,53 a-e 82,55abc
MS 1 85,57 be 86,40 ab 77,18 bcd 75,50 ab 81,37 a-e 81,20abc
BM 1 78,85abc 85,57 ab 80,53 bcd 78,02 ab 82,21 be 81,04abc
BM 2 85,57 be 86,40 ab 90,60 ef 87,24 c 87,24 de 87,41 c
BM 3 93,12 e 86,40 ab 81,37 cd 81,37 abc 83,0cde 85,06 bc
BM 4 89,76 de 88,92 ab 72,98 abc 75,50 ab 77,18abc 80,87abc
BM 5 87,24cde 87,24 ab 72,14 ab 79,69 abc 78,02abc 80,87abc
BM 6 84,73 be 90,60 b 80,53 bcd 78,02 ab 81,37 a-e 83,05abc
BM 7 78,02 ab 79,69 a 78,86 bcd 79,69 abc 75,50abc 78,35 ab
CC 1 79,69abc 79,69 a 83,05 de 82,21 bc 81,37 a-e 81,20abc
CC 2 72,90 a 83,79 ab 93,014 f 87,98 c 87,98 e 85,13 bc
Table 22. Significant parameters with different and non differentiated subsets. Tukey (p=0,05).

75
From the multivariate analysis factor choice, the year and the statistic test it appears that most
of the parameters tested originate differentiated subsets, exception made for the variable
berry‟s colour. The variables linked to seeds are the variables that create well differentiated
subsets that indicate a great variability of data in the three years studied.
The year 2011 shows the highest parameters that influence the sensorial maturity of the
grapes at harvest‟s time especially for the variables correlated to the pulp, while the 2010
presents the lowest values that influence seed‟s level of maturity (tab. 23).
Variable 2009 2010 2011 Berry colour 95,98 a 96,70 a 96,11 a
Pulp separation 86,58 a 86,73 a 93,78 b
Pulp sweetness 86,60 a 87,49 a 91,47 b
Pulp acidity 82,60 a 83,05 a 88,51 b
Pulp aroma 84,68 a 87,93 b 89,25 b
Skin texture 79,35a 83,64 b 85,55 b
Skin astringency 77,72 a 80,07 ab 77,72 b
Skin aroma 76,68 a 81,72 b 81,99 b
Skin bitterness 79,35 a 84,53 b 84,81 b
Seed colour 80,53 a 84,96 b 85,12 b
Seed hardness 78,31 a 88,53 b 88,66 b
Seed bitterness 72,69 a 77,13 b 86,44 c
Seed astringency 74,02 a 75,94 a 87,62 b
Seed aroma 71,50 a 78,90 b 87,77 c
Pulp maturity 84,97 a 86,16 a 90,66 b
Skin maturity 78,27 a 78,27 b 78,27 b
Seed maturity 75,41 a 81,12 b 87,09 c
Berry aroma 78,71 a 81,77 b 86,34 c
Berry sensorial maturity 83,19 a 85,46 a 88,77 b
Table 23. Mean separation by multiple range test (Tukey); the comparison is among data shown in
horizontal.
In using the factorial statistic analysis – principal components method - it was possible to put
together all the variables noted and calculated in two new complex variables (components) so
as to represent 95,38% of the total variability of the sensorial characteristics of the berries at
harvest (tab. 24). The descriptors that represent the highest coefficients (tab. 25) operate in a
more reliable way in determining the characteristics of sensorial maturity of the berries at
harvest.
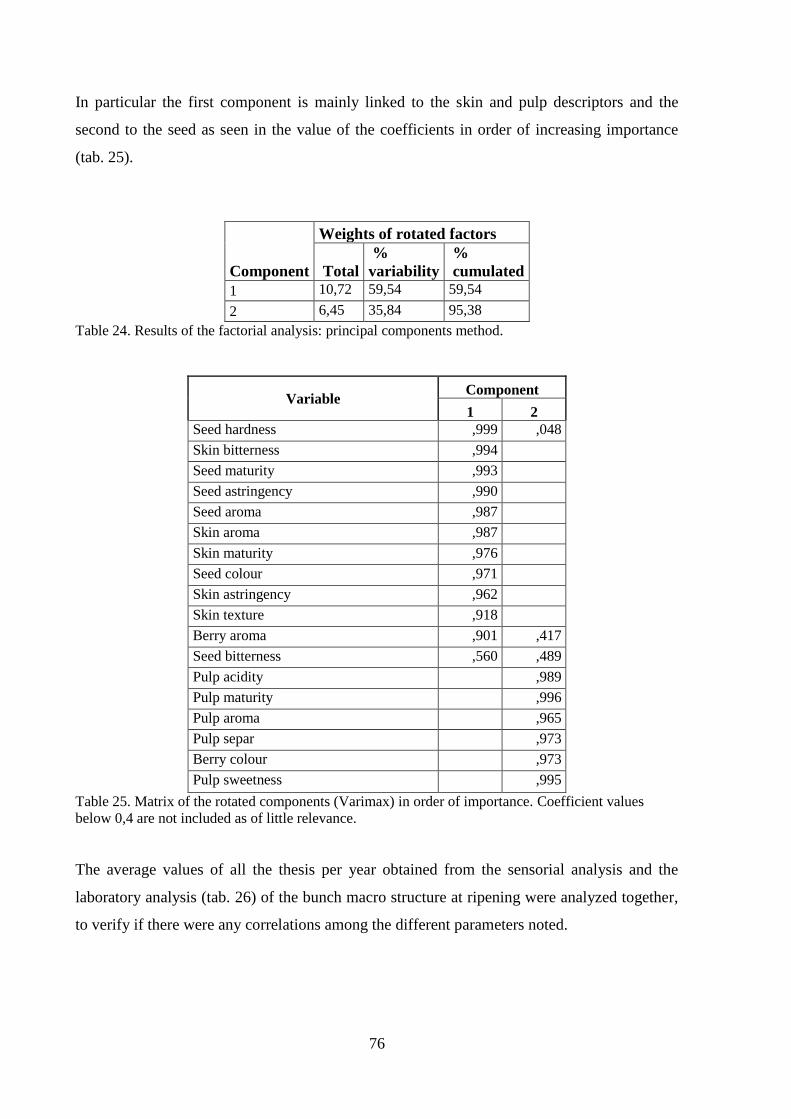
76
In particular the first component is mainly linked to the skin and pulp descriptors and the
second to the seed as seen in the value of the coefficients in order of increasing importance
(tab. 25).
Component
Weights of rotated factors
Total
%
variability
%
cumulated
1 10,72 59,54 59,54
2 6,45 35,84 95,38
Table 24. Results of the factorial analysis: principal components method.
Variable Component
1 2 Seed hardness ,999 ,048
Skin bitterness ,994
Seed maturity ,993
Seed astringency ,990
Seed aroma ,987
Skin aroma ,987
Skin maturity ,976
Seed colour ,971
Skin astringency ,962
Skin texture ,918
Berry aroma ,901 ,417
Seed bitterness ,560 ,489
Pulp acidity ,989
Pulp maturity ,996
Pulp aroma ,965
Pulp separ ,973
Berry colour ,973
Pulp sweetness ,995
Table 25. Matrix of the rotated components (Varimax) in order of importance. Coefficient values
below 0,4 are not included as of little relevance.
The average values of all the thesis per year obtained from the sensorial analysis and the
laboratory analysis (tab. 26) of the bunch macro structure at ripening were analyzed together,
to verify if there were any correlations among the different parameters noted.

77
Variable Abbreviation Units
pH pH n
Sugary content °Brix °Brix
Titratable acidity Titr. Ac. g/L
Ripening tecnological Index* Rip. T Index n
Bunch weight Bunch wgt g
Berry weight Berry wgt g
Berry seed number Berry seed num. n
Berry skin weight Skin wgt/berry g/berry
Berry seed weight Seed wgt/berry g/berry
Anthocyanins/berry Anth/berry mg/berry
Skins percentage % skin %
Skin anthocyanins Anth. skin mg/Kg
Skin polyphenols Polyph. skin mg/Kg
Skin polyphenols percentage % Skin polyph %
Seed polyphenols Polyph seed mg/Kg
Seeds percentage Seeds % %
Polyphenols/berry Polyph/berry mg/berry
Total Polyphenols Tot Polyph mg/Kg *Ripening Tecnological Index was so calculated °Brix/Titratable acidity
Table 26. List of abbreviations.
In using the factorial statistic analysis it was possible to put together all the variables noted
and calculated in three new complex variables so as to represent 99,84 % of the total
variability (tab. 27).
The first component is tied to the variables linked to skin‟s and seed‟s description; the third,
instead, to pulp‟s one.
The parameters that influence the technological ripeness and the phenolic richness the grapes
characterize the second component, one except for skin‟s anthocyanins, berry skin weight and
seed polyphenols tied to the third component (tab. 28).
The graph (fig. 52) shows how the descriptors that are in the same quadrant are directly
correlated while those further away are correlated negatively. The Ripening Index is indeed
positively correlated with berry‟s and skin‟s aroma, with seed bitterness and skin texture.
The first component is positively correlated with most of the variables examined, while the
second is correlated only in part.
The first and the second component are negatively correlated with the titratable acidity, the
skin‟s antochyanins, the mean number of seeds of the berry and the mean weight of the berry.

78
Component
Weights of rotated factors
Total
%
variability
%
cumulated
1 12,38 39,95 39,95
2 9,45 30,48 70,43
3 9,12 29,41 99,84
Table 27. Results of the factorial analysis: principal components method.
Component
1 2 3
Seed aroma ,977
Seed maturity ,969
Seed hardness ,940
Seed colour ,911
Berry aroma ,903
Seed astringency ,898
Skin aroma ,893 ,444
Skin bitterness ,893 ,441
Skin maturity ,863 ,497
Skin astringency ,840 ,525
Skin texture ,789 ,559
Seed bitterness ,781 -,402 ,477
Bunch weight ,619 ,500 -,605
Skin polyphenols ,577 -,800
pH ,411 ,911 ,042
Berry skin weight -,853
Ripening Index* ,923
Pulp aroma ,969
Pulp acidity ,977
Pulp maturity ,989
Pulp sweetness ,990
Berry colour ,963
Pulp separation ,963
Skin anthocyanins -,914
Berry weight -,918
Berry seed num -,925
Titratable acidity -,433 -,902
Total polyphenols -,517 -,835
°Brix -,580 -,726
Berry seed weight -,591 -,691 ,416
Seed polyphenols -,619 -,468 ,630
Table 28. Matrix of the rotated components (Varimax) in order of importance. Coefficient values
below 0,4 are not included as of little relevance.

79
Figure 52. Rotated graph of the first two components obtained from the factorial analysis.
Analysing the multiple linear regression in the three new components and the sensorial
maturity of the berry, it is possible to note that there is a significant correlation and that the
total ripeness of the berry obtained experimentally is linearly correlated in a significant way
(r2 = 0,980) to that estimated in (tab. 29). Therefore, the berry sensorial maturity can be
expressed in the following way (tab. 30).
Berry sensorial maturity =86,337+F1*4,432+F2*3,923-F3*0,078
From the table of coefficient values for the estimation of the sensorial maturity of the berry, it
can be concluded that the model used is of significant importance and that the Berry sensorial
maturity variable, is more relevant with the first two constants rather than with the third one
(tab. 30).

80
Model R R-square R-square correct
Standard deviation Estimate’s error
1 ,990 ,980 ,980 ,970
Table 29. Statistic model of relation between the dependant variable of sensorial maturity of the berry
and the three new components obtained from factorial analysis.
Coefficients B
Standard
deviation
Error Sig. (Costant) 86,337 ,131 ,000
F 1 4,432 ,117 ,000
F 2 3,923 ,114 ,000
F 3 -0,078 ,074 ,295
Table 30. Coefficient values for the estimation of the sensorial maturity estimated of the berry,
standard error and their significance.
Calculating the relation between the berry sensorial maturity expressed and that estimated
statistically it can be seen graphically how the ripeness expressed by the panel and that
determined statistically are overlapping (fig. 53).
Figure 53. The relation between the ripeness index expressed and that statistically estimated.

81
In the table of correlations in the parameters examined in the course of our study, only the
variables characterized by a probability < 0,00001. Most of the variables show a positive
Pearson correlation value. The variable represented by the harvest date is linked negatively to
the most parameters analyzed except for titratable acidity.
As foreseen, the variables concerning the ripening of the single berry constituents, global and
sensorial ripening are strictly and positively linked to the single parameters that constitute
them. There aren‟t many significant correlation among parameters that influence the
technological ripeness and the phenolic richness and sensorial maturity (tab. 31).
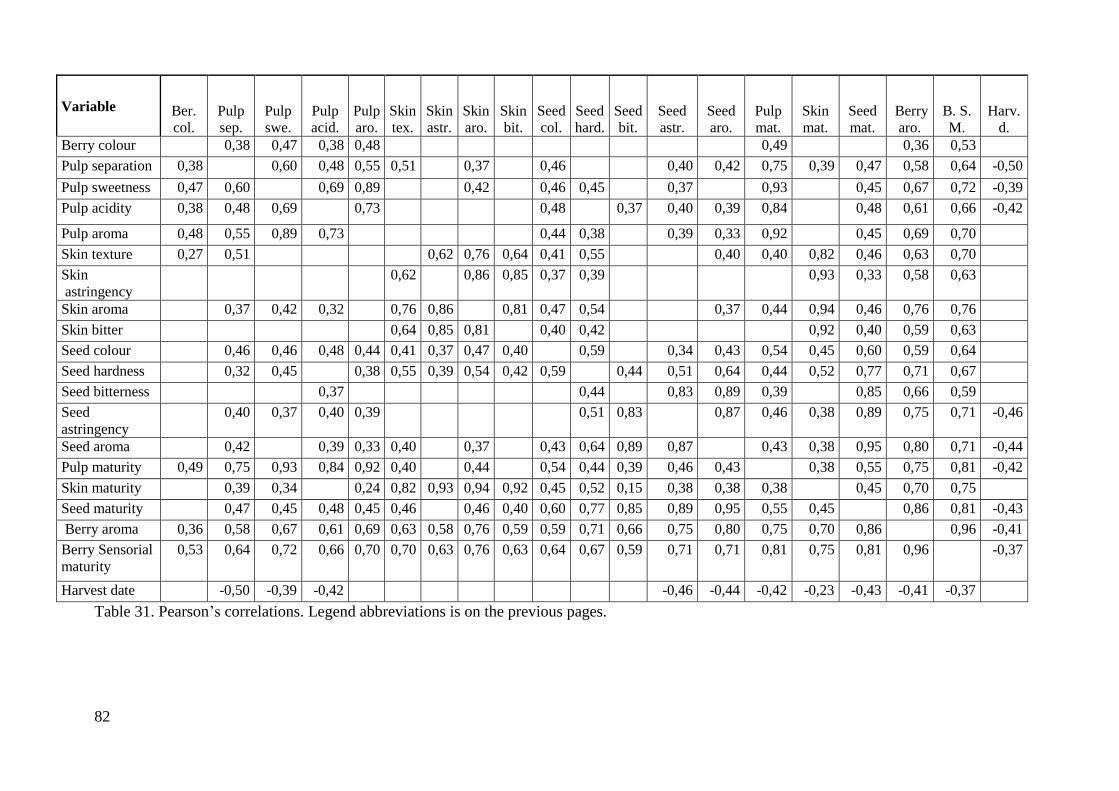
82
Variable Ber.
col. Pulp
sep. Pulp
swe. Pulp
acid. Pulp
aro. Skin
tex. Skin
astr. Skin
aro. Skin
bit. Seed
col. Seed
hard. Seed
bit. Seed
astr. Seed
aro. Pulp
mat. Skin
mat. Seed
mat. Berry
aro. B. S.
M. Harv.
d. Berry colour 0,38 0,47 0,38 0,48 0,49 0,36 0,53
Pulp separation 0,38 0,60 0,48 0,55 0,51 0,37 0,46 0,40 0,42 0,75 0,39 0,47 0,58 0,64 -0,50
Pulp sweetness 0,47 0,60 0,69 0,89 0,42 0,46 0,45 0,37 0,93 0,45 0,67 0,72 -0,39
Pulp acidity 0,38 0,48 0,69 0,73 0,48 0,37 0,40 0,39 0,84 0,48 0,61 0,66 -0,42
Pulp aroma 0,48 0,55 0,89 0,73 0,44 0,38 0,39 0,33 0,92 0,45 0,69 0,70
Skin texture 0,27 0,51 0,62 0,76 0,64 0,41 0,55 0,40 0,40 0,82 0,46 0,63 0,70
Skin astringency
0,62 0,86 0,85 0,37 0,39 0,93 0,33 0,58 0,63
Skin aroma 0,37 0,42 0,32 0,76 0,86 0,81 0,47 0,54 0,37 0,44 0,94 0,46 0,76 0,76
Skin bitter 0,64 0,85 0,81 0,40 0,42 0,92 0,40 0,59 0,63
Seed colour 0,46 0,46 0,48 0,44 0,41 0,37 0,47 0,40 0,59 0,34 0,43 0,54 0,45 0,60 0,59 0,64
Seed hardness 0,32 0,45 0,38 0,55 0,39 0,54 0,42 0,59 0,44 0,51 0,64 0,44 0,52 0,77 0,71 0,67
Seed bitterness 0,37 0,44 0,83 0,89 0,39 0,85 0,66 0,59
Seed astringency
0,40 0,37 0,40 0,39 0,51 0,83 0,87 0,46 0,38 0,89 0,75 0,71 -0,46
Seed aroma 0,42 0,39 0,33 0,40 0,37 0,43 0,64 0,89 0,87 0,43 0,38 0,95 0,80 0,71 -0,44
Pulp maturity 0,49 0,75 0,93 0,84 0,92 0,40 0,44 0,54 0,44 0,39 0,46 0,43 0,38 0,55 0,75 0,81 -0,42
Skin maturity 0,39 0,34 0,24 0,82 0,93 0,94 0,92 0,45 0,52 0,15 0,38 0,38 0,38 0,45 0,70 0,75
Seed maturity 0,47 0,45 0,48 0,45 0,46 0,46 0,40 0,60 0,77 0,85 0,89 0,95 0,55 0,45 0,86 0,81 -0,43
Berry aroma 0,36 0,58 0,67 0,61 0,69 0,63 0,58 0,76 0,59 0,59 0,71 0,66 0,75 0,80 0,75 0,70 0,86 0,96 -0,41
Berry Sensorial
maturity 0,53 0,64 0,72 0,66 0,70 0,70 0,63 0,76 0,63 0,64 0,67 0,59 0,71 0,71 0,81 0,75 0,81 0,96 -0,37
Harvest date -0,50 -0,39 -0,42 -0,46 -0,44 -0,42 -0,23 -0,43 -0,41 -0,37
Table 31. Pearson‟s correlations. Legend abbreviations is on the previous pages.

83
The Stepwise discriminant analysis gave the best results compared to the traditional method;
analysis of the most relevant variables for statistics purposes were inserted in stepwise.
The 17 theses of our study, before being subjected to discriminant analysis were subdivided
by denomination area and company, thus creating a renumbering of the theses analyzed that
result be nine regarding this analysis (tab. 32).
Area Denomination area Company
1 Chianti Colline Pisane Beconcini
2 Montecucco Collemassari
3 Montecucco Salustri
4 Scansano Fattoria di Magliano
5 Montalcino Col D'Orcia
6 Montalcino Casanova di Neri
7 Montalcino La Mannella
8 Chianti Classico Capannelle
9 Chianti Classico Castello di Albola
Table 32. Area subdivision.
The discriminant analysis highlighted differences between areas examined and some of which may be
distinct (fig. 54). The first two canonical functions represent more than 76,0 % of the total
variability (tab. 33).
From the centroids graph obtained from the discriminant analysis (fig. 54), it is noted that the
points relative to the groups show a enough limited dispersion. Four distinct groups appear in
the centroid: the first and the second comprise theses coming from „Chianti Classico‟ area that
is well detached and the third, „Chianti Colline Pisane‟s grapes.
The fourth includes the residual theses: the numbers four and five are the more
distinguishable while many points linked to numbers two and seven are superimposed.
The two Montecucco theses do not appear very close differently from those of the „Brunello
and Montalcino‟. In the „Chianti Classico‟ the two theses are very different.
The 95,1% of the original grouping data were classified correctly, while 85,2% of the cases
grouped cross-validated are reclassified correctly (tab. 34).

84
Function Eingenvalue % of
variance %
cumulated Canonical
correlation 1 41,626 73,8 73,8 ,988
2 7,396 13,1 86,9 ,939
3 4,006 7,1 94,0 ,895
4 1,923 3,4 97,4 ,811
5 ,603 1,1 98,5 ,613
6 ,440 ,8 99,3 ,553
7 ,360 ,6 99,9 ,515
8 ,043 ,1 100,0 ,203
Table 33. Eigenvalues of discriminant analysis.
Figure 54. Centroids obtained from the cluster analysis of the sensorial characteristics of the grapes at
harvest‟s time.
Area

85
Area Group expected
Totals 1 2 3 4 5 6 7 8 9 C
ross
- V
alid
atio
n a
% 1 100,0 ,0 ,0 ,0 ,0 ,0 ,0 ,0 ,0 100,0
2 ,0 100,0 ,0 ,0 ,0 ,0 ,0 ,0 ,0 100,0
3 ,0 ,0 66,7 11,1 ,0 22,2 ,0 ,0 ,0 100,0
4 ,0 ,0 ,0 100,0 ,0 ,0 ,0 ,0 ,0 100,0
5 ,0 ,0 ,0 ,0 100,0 ,0 ,0 ,0 ,0 100,0
6 ,0 ,0 33,3 ,0 ,0 66,7 ,0 ,0 ,0 100,0
7 ,0 33,3 ,0 ,0 ,0 33,3 33,3 ,0 ,0 100,0
8 ,0 ,0 ,0 ,0 ,0 ,0 ,0 100,0 ,0 100,0
9 ,0 ,0 ,0 ,0 ,0 ,0 ,0 ,0 100,0 100,0
Table 34. Classification results.
a. Cross validation is done only for those cases in the analysis in cross validation, each case is
classified by the functions derived from all cases other than that case.
b.95,1% of original grouped cases correctly classified.
c.85,2% of cross-validated grouped cases correctly classified.
Statistical analysis was also used to investigate the features and possible statistically
significant differences of the grapes coming from the theses as part of the same Denomination
of Origin. The theses belonging to „Montecucco‟ area, were then subjected to multivariate
analysis, factorial, discriminating, linear regression and correlation. Among the theses coming
from the area of „Montalcino‟ was also studied the case of „Col D'Orcia‟ estate in order to
study in detail the clone effect grown in the same site of cultivation.

86
3.7.1 ‘Montecucco’ area
As results from the multivariate analysis of variance, statistically significant parameters do
not remain the same if the factor chosen during the statistical analysis is changed. The
parameters related to pulp, except for acidity and separation, remain no significant when the
source is represented by year or year interaction for thesis. If the year is chosen as the factor,
all the variables become significant (tab. 35).
Factor Dependent
variable F Sig. Thesis Berry colour 8,304 ,000
Pulp separation 5,941 ,000
Pulp sweetness ,824 ,541
Pulp acidity ,927 ,475
Pulp aroma 1,794 ,139
Skin texture 12,788 ,000
Skin astringency 22,447 ,000
Skin aroma 7,510 ,000
Skin bitterness 12,439 ,000
Seed colour 6,988 ,000
Seed hardness 5,164 ,001
Seed bitterness 3,103 ,020
Seed astringency 5,958 ,000
Seed aroma 6,086 ,000
Pulp maturity ,649 ,664
Skin maturity 12,232 ,000
Seed maturity 2,565 ,044
Berry aroma 2,694 ,036
Berry sensorial
maturity 1,834 ,131
Factor Dependent
variable F Sig. Year Berry colour 5,839 ,006
Pulp separation 89,148 ,000
Pulp sweetness 7,533 ,002
Pulp acidity 5,918 ,006
Pulp aroma 4,072 ,025
Skin texture 18,160 ,000
Skin astringency 27,924 ,000
Skin aroma 18,660 ,000
Skin bitterness 25,609 ,000
Seed colour 9,816 ,000
Seed hardness 39,187 ,000
Seed bitterness 41,147 ,000
Seed astringency 90,515 ,000
Seed aroma 92,088 ,000
Pulp maturity 8,056 ,001
Skin maturity 21,507 ,000
Seed maturity 44,420 ,000
Berry aroma 22,884 ,000
Berry sensorial
maturity 12,991 ,000

87
Table 35 a, b, c. Test of the effects between subjects (p=<0,05).
By using the data previously obtained, the level of variability attributable to the different
factor was calculated (tab. 36). For most of the parameters the variability is attributable to the
year; the thesis, however, shows more variability as concerns berry colour. Skin bitterness
shows comparable levels of variability attributable to the different factor.
It is noted a high percentage value of error in pulp aroma variable.
Factor Dependent
variable F Sig. Thesis
* Year Berry colour 2,569 ,019
Pulp separation 1,652 ,131
Pulp sweetness 1,212 ,316
Pulp acidity 3,686 ,002
Pulp aroma 1,427 ,208
Skin texture 5,996 ,000
Skin astringency 12,607 ,000
Skin aroma 7,022 ,000
Skin bitterness 25,654 ,000
Seed colour 7,874 ,000
Seed hardness 9,205 ,000
Seed bitterness 7,555 ,000
Seed astringency 6,596 ,000
Seed aroma 6,713 ,000
Pulp maturity ,563 ,833
Skin maturity 9,770 ,000
Seed maturity 4,447 ,000
Berry aroma 2,390 ,027
Berry sensorial
maturity 1,396 ,222

88
Variable
%
variability
due to the
thesis
%
variability
due to the
year
%
variability
due to
interaction
thesis/year
%
variability
due to
error Berry colour 46,88 32,97 14,50 5,65 Pulp separation 6,08 91,21 1,69 1,02 Pulp sweetness 7,80 71,27 11,47 9,46 Pulp acidity 8,04 51,32 31,97 8,67 Pulp aroma 21,63 49,10 17,20 12,06 Skin texture 33,70 47,86 15,80 2,64 Skin astringency 35,09 43,65 19,71 1,56 Skin aroma 21,97 54,57 20,54 2,92 Skin bitterness 19,22 39,58 39,65 1,55 Seed colour 27,21 38,23 30,67 3,89 Seed hardness 9,47 71,83 16,87 1,83 Seed bitterness 5,88 77,92 14,31 1,89 Seed astringency 5,72 86,98 6,34 ,96 Seed aroma 5,75 86,97 6,34 ,94 Pulp maturity 6,32 78,46 5,48 9,74 Skin maturity 27,48 48,32 21,95 2,25 Seed maturity 4,89 84,72 8,48 1,91 Berry aroma 9,30 79,00 8,25 3,45 Berry sensorial maturity 10,65 75,44 8,11 5,81
Table 36. Level of variability attributable to the different factor.
From Tukey test it is possible to note the table with the different subsets and those non
differentiated (tab 37-39). The significant variable that creates the most differentiated
homogenous subsets is skin astringency. The values obtained from the analysis of the pulp,
instead, create no differentiated homogenous subsets.
„Montecucco‟ area shows optimal value of sensory maturity and small variability in its theses
(tab. 37-38). Regarding the sensorial maturity the values shown are higher in one thesis of
„ColleMassari‟ estate and in the thesis of „Salustri‟ estate (tab. 37).
The MC3 thesis is characterized by differences among maturation‟s level of the three berry
parts; the skin appears less matured than seeds and pulp; on the contrary, MC6 is
characterized by similar maturation‟s level of the berry at harvest‟s time (tab. 37-39).
Analysing pulp‟s maturity, the lowest value belongs to MC4 thesis while the highest to MC5
thesis (tab. 37).
Regarding skin‟s maturity the highest values are found in the grapes belonging to MC6, thesis
already highlighted as having similar maturation‟s level of the berry (tab. 38).
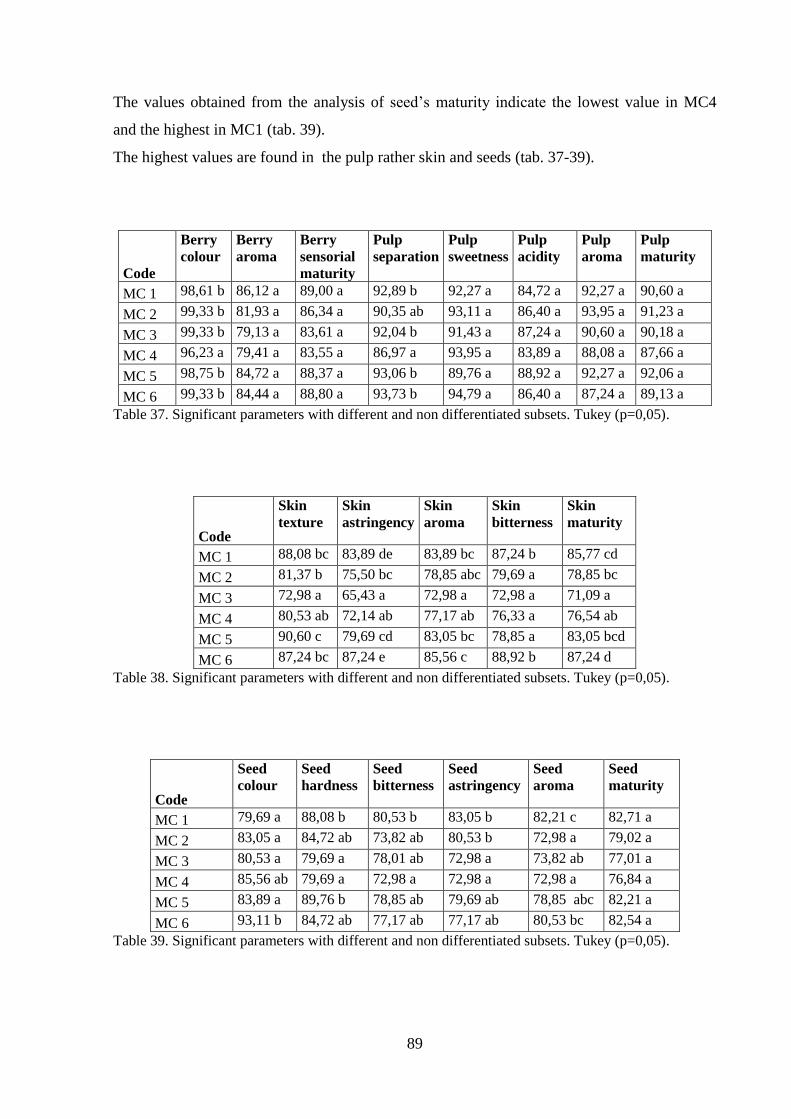
89
The values obtained from the analysis of seed‟s maturity indicate the lowest value in MC4
and the highest in MC1 (tab. 39).
The highest values are found in the pulp rather skin and seeds (tab. 37-39).
Code
Berry
colour Berry
aroma Berry
sensorial
maturity
Pulp
separation Pulp
sweetness Pulp
acidity Pulp aroma
Pulp maturity
MC 1 98,61 b 86,12 a 89,00 a 92,89 b 92,27 a 84,72 a 92,27 a 90,60 a
MC 2 99,33 b 81,93 a 86,34 a 90,35 ab 93,11 a 86,40 a 93,95 a 91,23 a
MC 3 99,33 b 79,13 a 83,61 a 92,04 b 91,43 a 87,24 a 90,60 a 90,18 a
MC 4 96,23 a 79,41 a 83,55 a 86,97 a 93,95 a 83,89 a 88,08 a 87,66 a
MC 5 98,75 b 84,72 a 88,37 a 93,06 b 89,76 a 88,92 a 92,27 a 92,06 a
MC 6 99,33 b 84,44 a 88,80 a 93,73 b 94,79 a 86,40 a 87,24 a 89,13 a
Table 37. Significant parameters with different and non differentiated subsets. Tukey (p=0,05).
Code
Skin
texture Skin
astringency Skin
aroma Skin
bitterness Skin
maturity
MC 1 88,08 bc 83,89 de 83,89 bc 87,24 b 85,77 cd
MC 2 81,37 b 75,50 bc 78,85 abc 79,69 a 78,85 bc
MC 3 72,98 a 65,43 a 72,98 a 72,98 a 71,09 a
MC 4 80,53 ab 72,14 ab 77,17 ab 76,33 a 76,54 ab
MC 5 90,60 c 79,69 cd 83,05 bc 78,85 a 83,05 bcd
MC 6 87,24 bc 87,24 e 85,56 c 88,92 b 87,24 d
Table 38. Significant parameters with different and non differentiated subsets. Tukey (p=0,05).
Code
Seed
colour Seed
hardness Seed
bitterness Seed
astringency Seed
aroma Seed
maturity
MC 1 79,69 a 88,08 b 80,53 b 83,05 b 82,21 c 82,71 a
MC 2 83,05 a 84,72 ab 73,82 ab 80,53 b 72,98 a 79,02 a
MC 3 80,53 a 79,69 a 78,01 ab 72,98 a 73,82 ab 77,01 a
MC 4 85,56 ab 79,69 a 72,98 a 72,98 a 72,98 a 76,84 a
MC 5 83,89 a 89,76 b 78,85 ab 79,69 ab 78,85 abc 82,21 a
MC 6 93,11 b 84,72 ab 77,17 ab 77,17 ab 80,53 bc 82,54 a
Table 39. Significant parameters with different and non differentiated subsets. Tukey (p=0,05).

90
From the multivariance analysis it appears that all of the parameters tested originate
differentiated homogenous subsets. The variables linked to skin and seeds are the variables
that create well differentiated subsets that indicate a great variability of data in the three years
studied.
The year 2011 shows the highest parameters that influence the sensorial maturity of the
grapes at harvest‟s time especially for the variables correlated to the pulp; the 2009, instead,
presents the highest values that influence skin‟s level of maturity.
In all three years variables related to seed‟s maturity were those with the lowest values (tab.
40).
Variable 2009 2010 2011 Berry colour 99,33 b 97,90 a 98,55 ab
Pulp separation 95,00 b 83,60 a 95,93 b
Pulp sweetness 94,79 b 88,08 a 94,79 b
Pulp acidity 85,56 ab 83,46 a 89,76 b
Pulp aroma 89,34 ab 88,92 a 93,95 b
Skin texture 86,40 b 77,17 a 86,82 b
Skin astringency 83,47 c 70,88 a 77,59 b
Skin aroma 84,30 b 74,24 a 82,21 b
Skin bitterness 84,72 b 73,40 a 83,89 b
Seed colour 87,24 b 79,69 a 85,98 b
Seed hardness 88,92 b 75,08 a 89,34 b
Seed bitterness 76,33 b 69,62 a 84,72 c
Seed astringency 76,33 b 67,11 a 89,76 c
Seed aroma 78,01 b 65,01 a 87,66 c
Pulp maturity 91,01 b 85,88 a 93,53 b
Skin maturity 84,72 b 73,92 a 82,63 b
Seed maturity 81,37 b 71,30 a 87,49 c
Berry aroma 83,88 b 76,06 a 87,94 b
Berry sensorial maturity 88,33 b 81,23 a 90,28 b
Table 40. Mean separation by multiple range test (Tukey); the comparison is among data shown in
horizontal.
In using the factorial statistic analysis it was possible to put together all the variables noted
and calculated in three new complex variables (components) so as to represent 98,95 % of the
total variability of the sensorial characteristics of the berries at harvest (tab. 41). The
descriptors that represent the highest coefficients (tab. 42) operate in a more reliable way in
determining the characteristics of sensorial maturity of the berries at harvest.
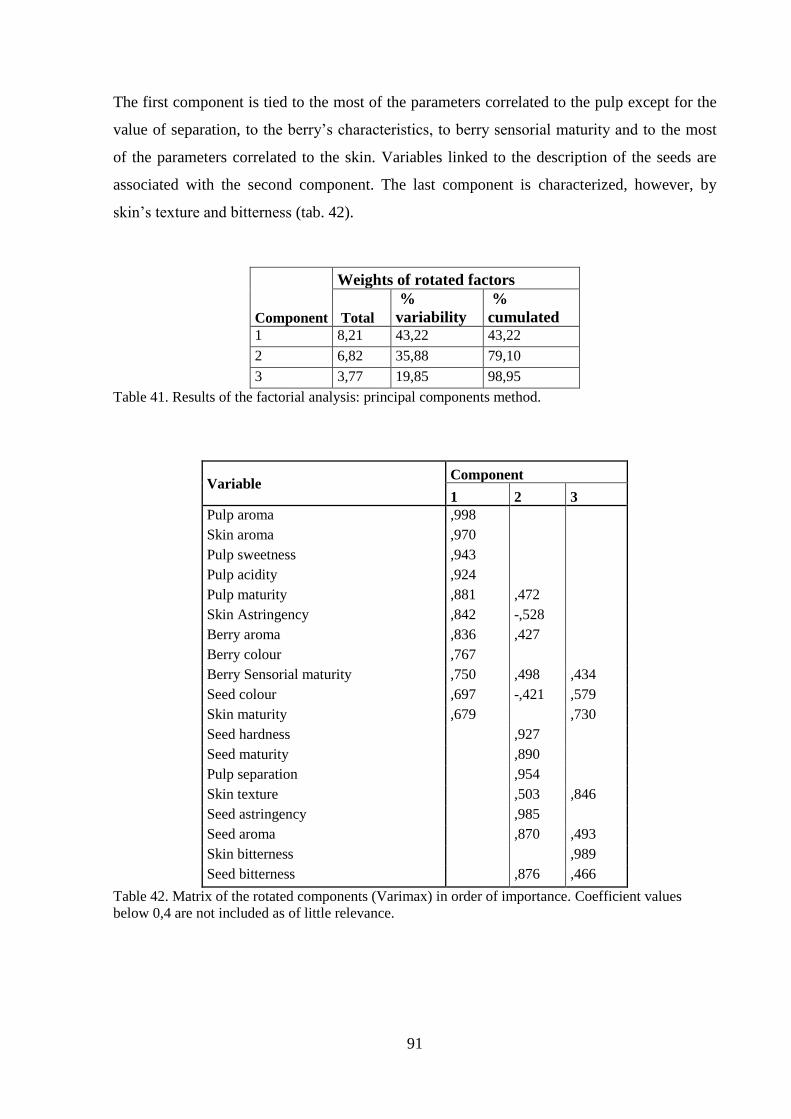
91
The first component is tied to the most of the parameters correlated to the pulp except for the
value of separation, to the berry‟s characteristics, to berry sensorial maturity and to the most
of the parameters correlated to the skin. Variables linked to the description of the seeds are
associated with the second component. The last component is characterized, however, by
skin‟s texture and bitterness (tab. 42).
Component
Weights of rotated factors
Total
%
variability
%
cumulated 1 8,21 43,22 43,22
2 6,82 35,88 79,10
3 3,77 19,85 98,95
Table 41. Results of the factorial analysis: principal components method.
Variable Component
1 2 3 Pulp aroma ,998
Skin aroma ,970
Pulp sweetness ,943
Pulp acidity ,924
Pulp maturity ,881 ,472
Skin Astringency ,842 -,528
Berry aroma ,836 ,427
Berry colour ,767
Berry Sensorial maturity ,750 ,498 ,434
Seed colour ,697 -,421 ,579
Skin maturity ,679 ,730
Seed hardness ,927
Seed maturity ,890
Pulp separation ,954
Skin texture ,503 ,846
Seed astringency ,985
Seed aroma ,870 ,493
Skin bitterness ,989
Seed bitterness ,876 ,466
Table 42. Matrix of the rotated components (Varimax) in order of importance. Coefficient values
below 0,4 are not included as of little relevance.

92
Extracting only two components from all the data collected it is possible to explain 85,02% of
the total variability (tab. 43). In particular the first component is greatly linked to the variables
already mentioned for the description of the first component; the second is composed of the
sum of the second and the third component of the previous analysis (tab. 44).
Component
Weights of rotated factors
Total
%
variance
%
cumulated 1 8,41 44,26 44,26
2 7,74 40,76 85,02
Table 43. Results of the factorial analysis extracting only the first 2 components: method of the
principal components.
Variable Component
1 2
Skin aroma ,986
Pulp aroma ,973
Pulp acidity ,897
Pulp sweetness ,875
Skin astringency ,849 -,513
Berry aroma ,843 ,536
Seed colour ,840
Skin maturity ,819
Pulp maturity ,811 ,467
Berry colour ,792 ,435
Berry Sesorial maturity ,772 ,631
Skin texture ,757
Seed hardness ,833
Seed maturity ,979
Skin bitterness ,460
Pulp separation ,835
Seed aroma ,984
Seed astringency ,987
Seed bitterness ,978
Table 44. Matrix rotated (Varimax) of the first two components extracted. Descriptors ordered in
order of importance excluding the <0,4 coefficients as of little relevance.

93
The average values of all the thesis per year obtained from the sensorial analysis and the
laboratory analysis of the bunch macro structure at ripening were analyzed together, to verify
if there were any correlations among the different parameters noted.
In using the factorial statistic analysis it was possible to put together all the variables noted
and calculated in three new complex variables so as to represent 99,34 % of the total
variability (tab. 45).
The first component is tied to some sensorial variables related to seeds and skin and some
technological and phenolic richness like sugary and anthocyanins content, the pH and the
mean weight of the berry. Variables linked to berry sensorial maturity, to skin astringency and
to the description of the pulp are associated with the second component.
The parameters that influence the seeds and titratable acidity characterize the third component
(tab. 46).
Component
Weights of rotated factors
Total
%
variability
%
cumulated
1 12,07 37,73 37,73
2 10,01 31,29 69,02
3 9,70 30,32 99,34
Table 45. Results of the factorial analysis: principal components method.
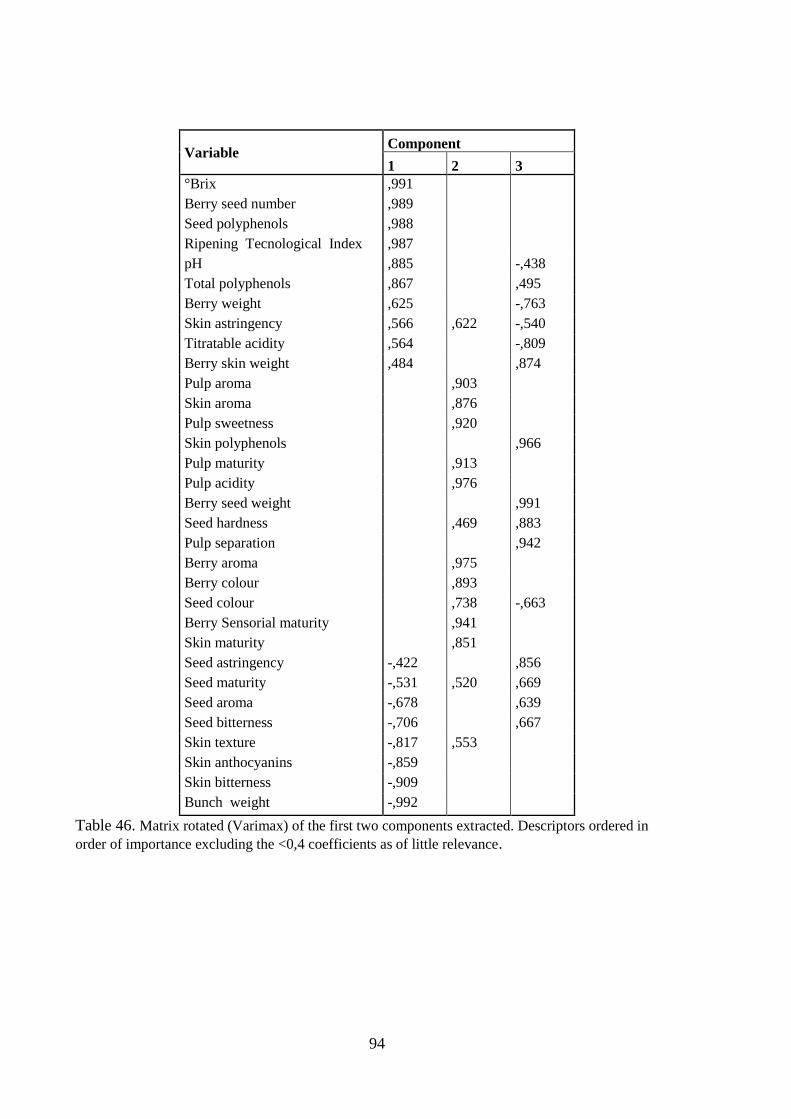
94
Variable Component
1 2 3 °Brix ,991
Berry seed number ,989
Seed polyphenols ,988
Ripening Tecnological Index ,987
pH ,885 -,438
Total polyphenols ,867 ,495
Berry weight ,625 -,763
Skin astringency ,566 ,622 -,540
Titratable acidity ,564 -,809
Berry skin weight ,484 ,874
Pulp aroma ,903
Skin aroma ,876
Pulp sweetness ,920
Skin polyphenols ,966
Pulp maturity ,913
Pulp acidity ,976
Berry seed weight ,991
Seed hardness ,469 ,883
Pulp separation ,942
Berry aroma ,975
Berry colour ,893
Seed colour ,738 -,663
Berry Sensorial maturity ,941
Skin maturity ,851
Seed astringency -,422 ,856
Seed maturity -,531 ,520 ,669
Seed aroma -,678 ,639
Seed bitterness -,706 ,667
Skin texture -,817 ,553
Skin anthocyanins -,859
Skin bitterness -,909
Bunch weight -,992
Table 46. Matrix rotated (Varimax) of the first two components extracted. Descriptors ordered in
order of importance excluding the <0,4 coefficients as of little relevance.

95
Extracting only two components from all the data collected it is possible to explain 74,26% of
the total variability (tab 47).
In particular the first component is greatly linked to the variables already mentioned for the
description of the first component; the second is composed of the sum of the second and the
third component of the previous analysis (tab. 48).
The graph (fig. 55) shows how the descriptors that are in the same quadrant and that are close
to the ripening of the berry are directly correlated to it while those further away are correlated
negatively. The Ripening Technological Index is indeed positively correlated with the sugary
content, the pH, the seed‟s and skin‟s weight, with the grade of polyphenols in the berry and
in the skins and, regarding sensorial parameters, with some characteristics of the pulp.
Berry sensorial maturity, on the contrary, is positively correlated, obviously with the level of
maturity of the three different part of the berry, berry‟s aroma and colour. It is negatively
correlated with the variables linked to technological and phenolic richness of the grapes at
harvest‟s time.
The first and the second component are negatively correlated with the mean weight of the
bunch.
Component
Weights of rotated factors
Total
%
variance
%
cumulated 1 13,25 41,39 41,39
2 10,52 32,87 74,26
Table 47. Results of the factorial analysis extracting only the first 2 components: method of the
principal components.

96
Variable Component
1 2 pH 1,000
Seed polyphenols ,930
Berry weight ,912
°Brix ,912
Titratable acidity ,878
Berry seed number ,852
Ripening Tecnological
Index ,842
Skin astringency ,838
Skin aroma ,596 ,668
Pulp aroma ,567 ,777
Total Polyphenols ,561
Pulp sweetness ,942
Seed colour
Pulp acidity ,965
Pulp maturity ,983
Berry skin weight ,350
Berry colour ,846
Berry aroma ,963
Skin maturity ,602
Berry Sensorial maturity ,946
Skin polyphenols ,344
Seed hardness ,795
Pulp separation ,693
Berry seed weight
Skin bitter -,654
Seed maturity -,675 ,732
Seed astringency -,697 ,613
Skin texture -,701 ,538
Seed aroma -,818 ,572
Seed bitterness -,876 ,468
Bunch weight -,903
Skin anthocyans -,998
Table 48. Matrix rotated (Varimax) of the first two components extracted. Descriptors ordered in
order of importance excluding the <0,4 coefficients as of little relevance.
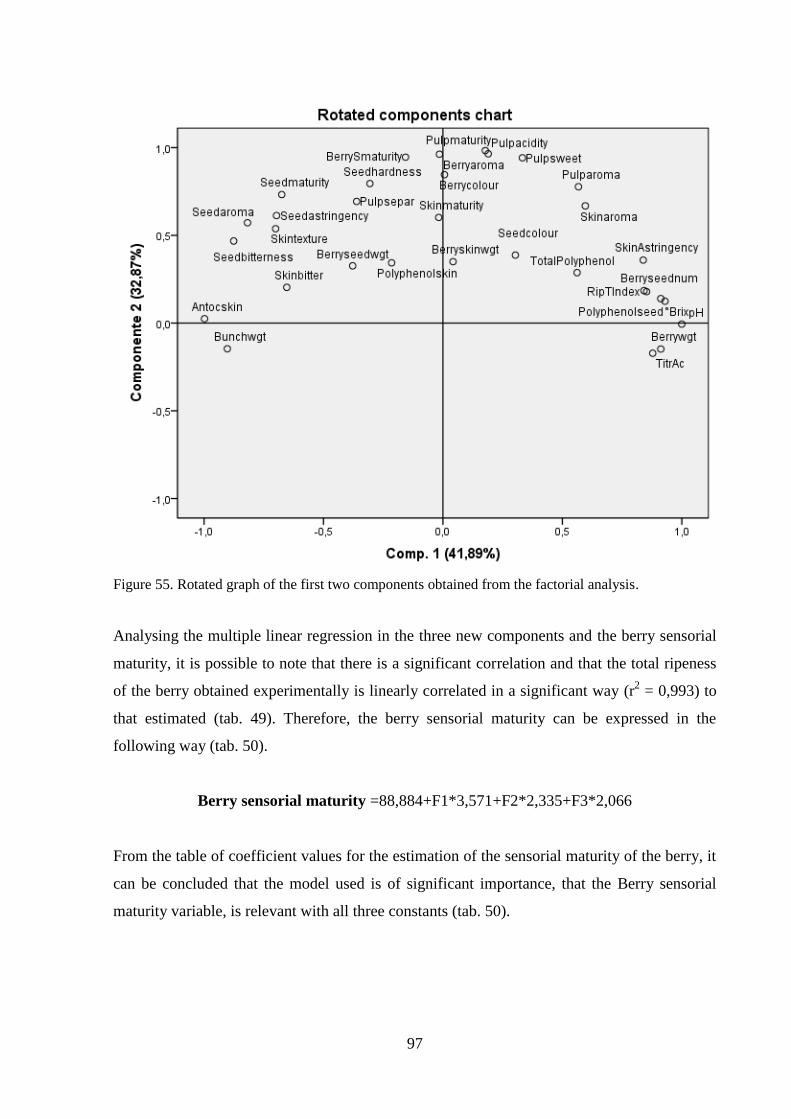
97
Figure 55. Rotated graph of the first two components obtained from the factorial analysis.
Analysing the multiple linear regression in the three new components and the berry sensorial
maturity, it is possible to note that there is a significant correlation and that the total ripeness
of the berry obtained experimentally is linearly correlated in a significant way (r2 = 0,993) to
that estimated (tab. 49). Therefore, the berry sensorial maturity can be expressed in the
following way (tab. 50).
Berry sensorial maturity =88,884+F1*3,571+F2*2,335+F3*2,066
From the table of coefficient values for the estimation of the sensorial maturity of the berry, it
can be concluded that the model used is of significant importance, that the Berry sensorial
maturity variable, is relevant with all three constants (tab. 50).

98
Model R R-square R-square correct
Standard deviation Estimate’s error
1 ,996 ,993 ,993 ,614
Table 49. Statistic model of relation between the dependant variable of sensorial maturity of the berry
and the three new components obtained from factorial analysis.
Coefficients B
Standard
deviation
Error Sig. (Costant) 88,884 ,114 ,000
F 1 3,571 ,115 ,000
F 2 2,335 ,122 ,000
F 3 2,066 ,086 ,000
Table 50. Coefficient values for the estimation of the sensorial maturity estimated of the berry,
standard error and their significance.
Calculating the relation between berry sensorial maturity expressed and that estimated
statistically it can be seen graphically how the ripeness expressed by the panel and that
determined statistically are overlapping (fig. 56).
Figure 56. The relation between the ripeness index expressed and that statistically estimated.

99
Examining the correlation between the parameters analyzed, in the table only the variables
with a probability <0,00001 are reported. The mean weight of the bunch and the skin‟s
anthocyanins, are the parameters that don‟t present significant Pearson‟s correlations (tab. 51).
In most cases there are values of Pearson's correlation positive, however the parameters
connected with the technological maturity of the grapes are negatively correlated. The
variable represented by the harvest date is linked negatively to the most parameters analyzed.
As foreseen, the variables concerning the ripening of the single berry constituents, global and
sensorial ripening are strictly and positively linked to the single parameters that constitute
them. Positive Pearson correlation values were found in mean weight of the skins and
separation of the pulp. There aren‟t many significant correlation among parameters that
influence the technological ripeness and the phenolic richness and sensorial maturity.
Nevertheless positive Pearson correlation values were found in mean weight of the skins and
separation of the pulp and in skin‟s polyphenols and seed‟s astringency (tab. 51).

100
Ber.
col.
Pulp
sep.
Pulp
swe.
Pulp
acid.
Pulp
aro.
Skin
tex.
Skin
astr.
Skin
aro.
Skin
bit.
Seed
col.
Seed
hard.
Seed
bit.
Seed
astr.
Seed
aro.
Pulp
mat.
Skin
mat.
Seed
mat.
Berry
aro.
B. S.
M. Harv.d
Berry colour 0,60
Pulp
separation
0,65 0,51 0,58 0,65 0,69 0,68 0,78 0,75 0,76 0,75 0,75 -0,66
Pulp
sweetness
0,65 0,79 0,73 0,64 0,63 0,89 0,70 0,75 0,78
Pulp acidity 0,71 0,83 0,58
Pulp aroma 0,79 0,71 0,89 0,67 0,64
Skin texture 0,58 0,83 0,86 0,81 0,66 0,64 0,66 0,76 0,92 0,74 0,84 0,85
Skin
Astringency
0,83 0,91 0,80 0,61 0,67 0,44 0,94 0,67 0,79 0,80
Skin aroma 0,86 0,91 0,84 0,60 0,70 0,58 0,96 0,69 0,88 0,87
Skin
bitterness
0,81 0,80 0,84 0,59 0,62 0,59 0,72 0,93 0,71 0,74 0,77
Seed colour 0,60 0,58 0,62
Seed hardness 0,65 0,73 0,66 0,61 0,59 0,72 0,82 0,83 0,58 0,65 0,90 0,76 0,79
Seed
bitterness
0,69 0,64 0,62 0,72 0,87 0,88 0,63 0,61 0,88 0,77 0,79 -0,65
Seed
astringency
0,68 0,64 0,66 0,59 0,82 0,87 0,92 0,66 0,63 0,94 0,84 0,82 -0,79
Seed aroma 0,78 0,63 0,76 0,67 0,70 0,72 0,83 0,88 0,92 0,64 0,76 0,97 0,91 0,88 -0,76
Pulp maturity 0,75 0,89 0,83 0,89 0,58 0,58 0,63 0,66 0,64 0,69 0,80 0,82
Skin maturity 0,92 0,94 0,96 0,93 0,65 0,61 0,63 0,76 0,48 0,75 0,86 0,87
Seed maturity 0,76 0,74 0,67 0,69 0,71 0,58 0,90 0,88 0,94 0,97 0,69 0,75 0,90 0,91 -0,69
Berry aroma 0,75 0,75 0,67 0,84 0,79 0,88 0,74 0,76 0,77 0,84 0,91 0,80 0,86 0,90 0,98 -0,61
Berry
S.maturity
0,60 0,75 0,78 0,58 0,64 0,85 0,80 0,87 0,77 0,62 0,79 0,79 0,82 0,88 0,82 0,87 0,91 0,98
Harvest date -0,66 -0,65 -0,79 -0,76 -0,69 -0,61
Table 51. Pearson‟s correlations. Legend abbreviations is on the previous pages.

101
The Stepwise discriminant analysis gave the best results compared to the traditional method;
analysis of the most relevant variables for statistics purposes were inserted in stepwise.
The discriminant analysis highlighted differences between areas examined and some of which may be
distinct (fig. 57). The first two canonical functions represent more than 91,6 % of the total
variability (tab. 52).
Function Eingenvalue % of
variance %
cumulated Canonical
correlation 1 42,273 82,6 82,6 ,988
2 4,788 9,4 91,9 ,910
3 2,602 5,1 97,0 ,850
4 1,103 2,2 99,2 ,724
5 ,430 ,8 100,0 ,549
Table 52. Eigenvalues of discriminant analysis.
From the centroids graph obtained from the discriminant analysis (fig. 57), it is noted that the
points relative to the groups show a enough limited dispersion. Four distinct groups appear in
the centroid: the fifth includes the thesis coming from a different estate and one of „ColleMassari‟
winery indeed some points are superimposed.
The 95,1% of the original data grouping were classified correctly, while 92,6% of the cases
grouped cross-validated are reclassified correctly (tab. 53).

102
Figure 57. Centroids obtained from the cluster analysis of the sensorial characteristics of the grapes at
harvest‟s time.
Thesis
Group expected
Totals 1 2 3 4 5 6
Cro
ss-v
alid
atio
n a
% 1 88,9 ,0 ,0 ,0 ,0 11,1 100,0
2 ,0 100,0 ,0 ,0 ,0 ,0 100,0
3 ,0 ,0 100,0 ,0 ,0 ,0 100,0
4 ,0 ,0 ,0 100,0 ,0 ,0 100,0
5 ,0 ,0 ,0 ,0 66,7 33,3 100,0
6 ,0 ,0 ,0 ,0 ,0 100,0 100,0
Table 53. Classification results.
a. Cross validation is done only for those cases in the analysis in cross validation, each case is
classified by the functions derived from all cases other than that case.
b.95,1% of original grouped cases correctly classified.
c.92,6% of cross-validated grouped cases correctly classified.

103
3.7.2 ‘Col d’Orcia’ estate
From the multivariate analysis, with the thesis as factor, what emerges is that among the
dependent variables the no significant ones for the sensorial variables are seed‟s hardness,
berry‟s aroma and berry‟s sensorial aroma.
The variables analyzed change their level of significance if, the factor chosen during the
statistical analysis changes; indeed choosing the year, many non significant statistical variable
are added. In this case, separation, sweetness, aroma and maturity of the pulp and skin texture
become the only significant variables.
Pulp maturity and berry sensorial aroma are the two parameters that become non significant
when the factor is represented by year interaction by thesis (tab. 54).
Factor Dependent
variable F Sig. Year Berry colour 41,532 ,000
Pulp separation 122,865 ,000
Pulp sweetness 8,134 ,002
Pulp acidity 2,343 ,113
Pulp aroma 12,004 ,000
Skin texture 5,056 ,013
Skin astringency 1,226 ,308
Skin aroma 2,651 ,087
Skin bitterness 1,946 ,160
Seed colour 2,553 ,095
Seed hardness 2,913 ,070
Seed bitterness ,423 ,659
Seed astringency 2,408 ,107
Seed aroma 1,218 ,310
Pulp maturity 9,404 ,001
Skin maturity ,699 ,505
Seed maturity ,257 ,775
Berry aroma 2,288 ,119
Berry sensorial
maturity 1,478 ,244
Factor Dependent
variable F Sig. Thesis Berry colour 14,408 ,000
Pulp separation 22,603 ,000
Pulp sweetness 6,226 ,001
Pulp acidity 9,764 ,000
Pulp aroma 6,241 ,001
Skin texture 14,425 ,000
Skin astringency 14,951 ,000
Skin aroma 4,767 ,004
Skin bitterness 6,244 ,001
Seed colour 8,037 ,000
Seed hardness ,459 ,765
Seed bitterness 18,729 ,000
Seed astringency 6,413 ,001
Seed aroma 5,344 ,002
Pulp maturity 2,702 ,049
Skin maturity 7,034 ,000
Seed maturity 2,842 ,041
Berry aroma ,895 ,479
Berry sensorial
maturity ,569 ,687

104
Table 54 a, b, c. Test of the effects between subjects (p=<0,05).
The variability quota attributed to the different factor was calculated using the data previously
obtained (tab. 55).
For most of the parameters the variability is attributable to the year; nevertheless most
variables show comparable levels of variability attributable to the different factor.
It is noted a high percentage value of error in berry sensorial aroma variable.
Factor Dependent
variable F Sig. Thesis
* Year Berry colour 11,504 ,000
Pulp separation 4,473 ,001
Pulp sweetness 3,074 ,012
Pulp acidity 4,399 ,001
Pulp aroma 2,831 ,018
Skin texture 7,781 ,000
Skin astringency 8,614 ,000
Skin aroma 3,930 ,003
Skin bitterness 9,193 ,000
Seed colour 3,999 ,003
Seed hardness 7,103 ,000
Seed bitterness 17,108 ,000
Seed astringency 14,679 ,000
Seed aroma 12,041 ,000
Pulp maturity 1,825 ,111
Skin maturity 4,926 ,001
Seed maturity 8,146 ,000
Berry aroma 2,538 ,031
Berry sensorial
maturity 1,946 ,089

105
Variable
%
variability
due to the
thesis
%
variability
due to the
year
%
variability
due to
interaction
thesis/year
%
variability
due to
error Berry colour 21,05 60,68 16,81 1,46 Pulp separation 14,98 81,40 2,96 ,66 Pulp sweetness 33,77 44,12 16,68 5,42 Pulp acidity 55,77 13,39 25,13 5,71 Pulp aroma 28,27 54,37 12,83 4,53 Skin texture 51,04 17,89 27,53 3,54 Skin astringency 57,97 4,75 33,40 3,88 Skin aroma 38,61 21,47 31,83 8,10 Skin bitterness 33,96 10,59 50,01 5,44 Seed colour 51,56 16,38 25,65 6,41 Seed hardness 4,00 25,39 61,90 8,71 Seed bitterness 50,27 1,14 45,91 2,68 Seed astringency 26,18 9,83 59,91 4,08 Seed aroma 27,26 6,21 61,43 5,10 Pulp maturity 18,09 62,99 12,22 6,70 Skin maturity 51,50 5,11 36,06 7,32 Seed maturity 23,21 2,10 66,53 8,17 Berry aroma 13,32 34,04 37,76 14,88 Berry sensorial maturity 11,40 29,60 38,97 20,03
Table 55. Level of variability attributable to the different factor.
From Tukey‟s test it is possible to note the table with the different subsets and those non
differentiated (tab. 56-58).
The significant variables create differentiated homogenous subsets except for seed‟s hardness
and its maturity, pulp‟s maturity, berry aroma and berry sensorial maturity.
Skin astringency is the variable that creates well differentiated subsets that give rise to a wide
range of data variability (tab. 56).
„Col d‟Orcia‟ grapes in general shows optimal values of sensory maturity; the highest values
are found in the pulp rather than in seeds and in skin; the latter is characterized by greater
variability (tab. 56-58).
BM2 thesis is characterized by the highest maturity of the pulp and seeds, on the contrary in
BM5 is skin to be more mature than the other two parts of the berry and it shows the lowest
values of pulp‟s and seed‟s maturity.

106
Code
Berry
colour Berry
aroma Berry
sensorial
maturity
Pulp
separation Pulp
sweetness Pulp
acidity Pulp aroma
Pulp maturity
BM 1 90,16 a 83,89 a 84,24 a 81,91 a 89,76 abc 83,89 ab 87,24 ab 85,56 a
BM 2 96,34 bc 85,00 a 87,58 a 87,82 b 93,95 c 91,43 b 90,60 b 90,81 a
BM 3 96,34 bc 83,61 a 86,92 a 92,77 c 91,43 bc 84,72 ab 91,43 b 89,97 a
BM 4 95,60 b 81,37 a 85,46 a 86,13 b 83,05 a 90,60 b 85,56 ab 86,19 a
BM 5 99,33 c 81,09 a 87,25 a 93,06 c 83,89 ab 77,17 a 79,69 a 83,47 a
Table 56. Significant parameters with different and non differentiated subsets. Tukey (p=0,05).
Code
Skin
texture Skin
astringency Skin
aroma Skin
bitterness Skin
maturity
BM 1 72,98 a 83,89 bc 82,21 ab 84,72 a 80,95 a
BM 2 78,85 ab 73,82 a 77,17 a 83,05 a 78,22 a
BM 3 82,21 b 78,01 ab 76,33 a 81,37 a 79,48 a
BM 4 77,17 ab 86,40 cd 81,37 ab 88,08 ab 83,26 ab
BM 5 90,60 c 91,43 d 85,56 b 93,11 b 90,18 b
Table 57. Significant parameters with different subsets. Tukey (p=0,05).
Code
Seed
colour Seed
hardness Seed
bitterness Seed
astringency Seed
aroma Seed
maturity
BM 1 78,85 a 85,56 a 80,53 b 78,01 a 82,21 ab 81,03 a
BM 2 85,56 ab 86,40 a 90,60 c 87,24 b 87,24 b 87,41 a
BM 3 93,11 b 86,40 a 81,37 b 81,37 ab 83,05 ab 85,06 a
BM 4 89,76 b 88,92 a 72,98 a 75,50 a 77,17 a 80,86 a
BM 5 87,24 b 87,24 a 72,14 a 79,69 a 78,01 a 80,86 a
Table 58. Significant parameters with different and non differentiated subsets. Tukey (p=0,05).
From the MANOVA analysis, it appears that most of the parameters examined originate non
differentiated subsets.
The variables linked to pulp are the variables that create well differentiated subsets that
indicate a great variability of data in the three years studied (tab. 59).
In 2010 the highest values were recorded concerning sensorial analysis, that show, at harvest,
a high maturity level of the berry in most of its components, compared to the other years
except for seed‟s variables and separation and acidity of the pulp (tab. 59).

107
The year 2011 stands out for the highest parameters that influence the description of seeds and
the 2009 just for seed hardness (tab. 59).
Variable 2009 2010 2011 Berry colour 96,98 b 99,05 b 90,62 a
Pulp separation 78,53 a 93,22 b 93,26 b
Pulp sweetness 83,55 a 91,10 b 90,60 b
Pulp acidity 84,56 a 84,05 a 88,08 a
Pulp aroma 82,04 a 92,11 b 86,57 a
Skin texture 77,51 a 83,55 b 80,03 ab
Skin astringency 83,05 a 84,05 a 81,03 a
Skin aroma 79,02 a 83,05 a 79,52 a
Skin bitterness 86,07 a 84,05 a 88,08 a
Seed colour 85,56 a 89,59 a 85,56 a
Seed hardness 88,58 a 84,05 a 88,08 a
Seed bitterness 79,02 a 79,02 a 80,53 a
Seed astringency 78,01 a 81,03 a 82,04 a
Seed aroma 81,54 a 80,03 a 83,05 a
Pulp maturity 82,04 a 89,97 b 89,59 b
Skin maturity 81,41 a 83,67 a 82,16 a
Seed maturity 82,54 a 82,74 a 83,85 a
Berry aroma 80,86 a 85,06 a 83,05 a
Berry sensorial maturity 84,80 a 88,22 a 85,85 a
Table 59. Mean separation by multiple range test (Tukey); the comparison is among data shown in
horizontal.
By factorial analysis it was possible to reduce the number of variables to three main
components able to represent 98,88% of the total variability of the sensorial characteristics of
the berries at harvest (tab. 60).
In particular the first component is mainly linked to the skin and pulp descriptors and the
second to the seeds. Pulp acidity and seed astringency are associated with the third component
(tab. 61).

108
Component
Weights of rotated factors
Total
%
variability
%
cumulated 1 9,79 51,51 51,51
2 6,42 33,77 85,28
3 2,58 13,60 98,88
Table 60. Results of the factorial analysis: principal components method.
Variable
Component
1 2 3
Seed hardness ,989
Seed colour ,989
Seed maturity ,949
Seed aroma ,887 ,430
Seed bitterness ,853
Pulp acidity ,480 ,874
Seed astringency ,675 ,701
Skin aroma ,997
Skin maturity ,986
Pulp maturity ,970
Skin texture ,961
Pulp sweetness ,948
Skin bitterness ,928
Pulp aroma ,919
Skin astringency ,918
Berry aroma ,822 ,565
Berry Sensorial maturity ,821 ,494
Berry colour ,687 ,427 ,410
Pulp separation ,643 -,704
Table 61. Matrix of the rotated components (Varimax) in order of importance. Coefficient values
below 0,4 are not included as of little relevance.
Extracting only two components from all the data collected it is possible to explain 89,84% of
the total variability (tab. 62). In particular the first component is greatly linked to the variables
that describe pulp‟s and skin‟s level of maturation; the second is connected to the seed‟s
characteristics and to the pulp acidity (tab. 63).
Component
Weights of rotated factors
Total
%
variance
%
cumulated 1 9,72 51,18 51,18
2 7,35 38,66 89,84
Table 62. Results of the factorial analysis extracting only the first 2 components: method of the
principal components.

109
Variable Component
1 2 Seed maturity ,993
Seed aroma ,978
Seed bitterness ,938
Seed hardness ,934
Seed colour ,934
Seed astringency ,886
Pulp acidity ,762
Skin aroma ,998
Skin maturity ,992
Pulp maturity ,981
Skin bitterness ,955
Skin astringency ,938
Skin texture ,937
Pulp sweetness ,918
Pulp aroma ,884
Berry Sensorial maturity ,811 ,583
Berry aroma ,794 ,573
Pulp separation ,697 -,543
Berry colour ,689 ,563
Table 63. Matrix rotated (Varimax) of the first two components extracted. Descriptors ordered in
order of importance excluding the <0,4 coefficients as of little relevance.
The average values of all the thesis per year obtained from the sensorial analysis and the
laboratory analysis of the bunch (macro structure) at ripening were analyzed together, to
verify if there were any correlations among the different parameters noted.
In using the factorial statistic analysis it was possible to put together all the variables noted
and calculated in three new complex variables so as to represent 99,32 % of the total
variability (tab. 64).
The first component is tied to some sensorial variables related to seeds and pulp and to some
technological and phenolic richness like polyphenols total content, mean weight and mean
number of seeds. Variables linked to only sensorial variables are associated with the second
component.
The parameters that influence technological and phenolic characteristics, pulp acidity, seed‟s
aroma and astringency characterize the third component (tab. 65).

110
Component
Weights of rotated factors
Total
%
variability
%
cumulated
1 11,60 35,15 35,15
2 11,51 34,88 70,03
3 9,67 29,29 99,32
Table 64. Results of the factorial analysis: principal components method.
Variable Component
1 2 3
Skin polyphenols -,988
Berry seed number ,979
Berry seed weight ,974
°Brix -,970
Berry weight ,912
Pulp separation -,887
Total polyphenols -,848 -,502
Seed hardness ,836 ,494
Seed colour ,836 ,494
Berry skin weight ,785 ,592
Seed maturity ,702 ,532 ,472
Berry sensorial maturity ,989
Berry aroma ,953
Skin astringency ,945
Pulp maturity ,938
Skin maturity ,931
Skin texture ,908 -,416
Skin bitter -,458 ,883
Berry colour ,882
Skin aroma ,865
Pulp sweetness ,820 -,572
Seed bitterness ,526 ,742 ,414
Pulp aroma ,736 -,676
pH ,936
Bunch weight ,923
Ripening tecnological Index -,903
Skin anthocyanins -,405 -,887
Pulp acidity ,473 ,877
Titratable acidity ,482 ,848
Seed polyphenols -,529 -,821
Harvest date ,695 -,712
Seed astringency ,648 ,710
Seed aroma ,660 ,687
Table 65. Matrix rotated (Varimax) of the first two components extracted. Descriptors ordered in
order of importance excluding the <0,4 coefficients as of little relevance.

111
Extracting only two components from all the data collected it is possible to explain 84,70% of
the total variability (tab. 66).
In particular the first component is greatly linked to the variables that describe technological,
phenolic, sensorial characteristics especially regarding seeds except the sensation of
bitterness. The second is composed of only sensorial variables (tab. 67).
The graph (fig. 58) shows how the descriptors that are in the same quadrant and that are close
to the ripening of the berry are directly correlated to it while those further away are correlated
negatively. Berry sensorial maturity is positively correlated with aroma and colour of the
berry, maturity and sweetness of the pulp and with texture of the skin. It is negatively
correlated, on the contrary, with the variables linked to technological and phenolic richness of
the grapes at harvest‟s time especially regarding pH and mean weight of the berry and of the
bunch.
Ripening Technological Index is positively correlated with variables linked to technological
and phenolic characteristics and to separation of the pulp.
The first and the second component aren‟t negatively correlated with any variables.
Component
Weights of rotated factors
Total
%
variance
%
cumulated 1 16,19 49,06 49,06
2 11,76 35,65 84,70
Table 66. Results of the factorial analysis extracting only the first 2 components: method of the
principal components.
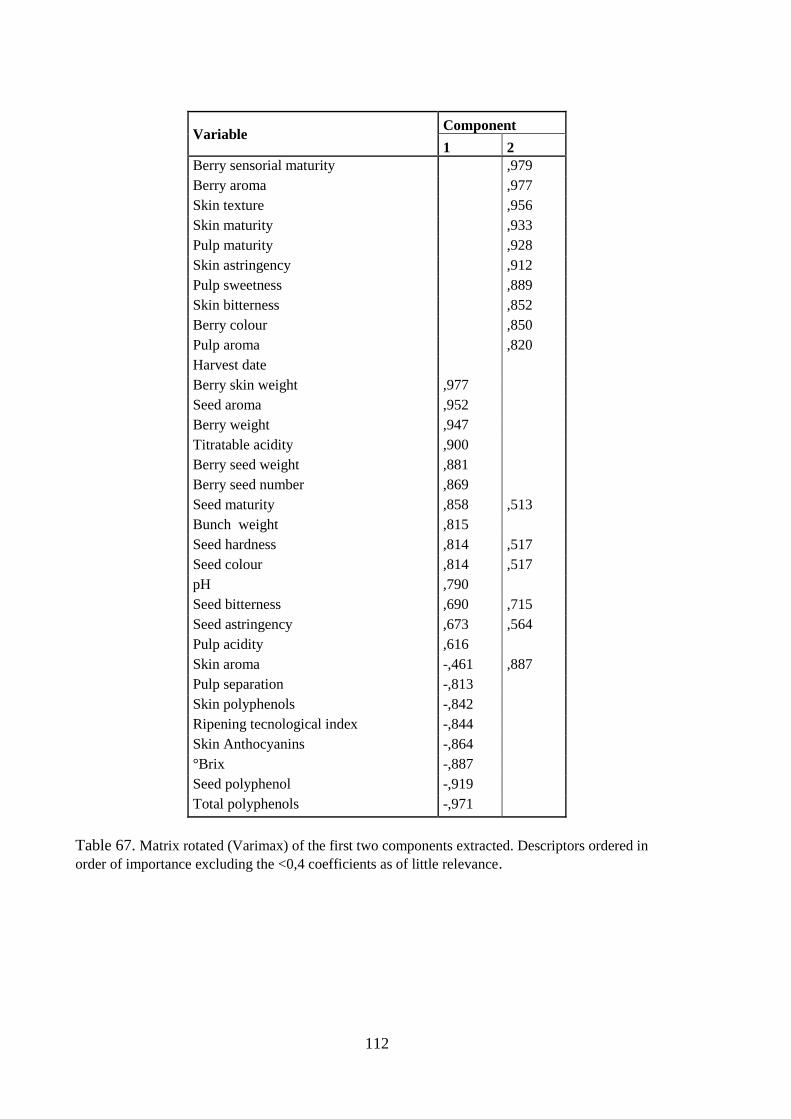
112
Variable Component
1 2 Berry sensorial maturity ,979
Berry aroma ,977
Skin texture ,956
Skin maturity ,933
Pulp maturity ,928
Skin astringency ,912
Pulp sweetness ,889
Skin bitterness ,852
Berry colour ,850
Pulp aroma ,820
Harvest date
Berry skin weight ,977
Seed aroma ,952
Berry weight ,947
Titratable acidity ,900
Berry seed weight ,881
Berry seed number ,869
Seed maturity ,858 ,513
Bunch weight ,815
Seed hardness ,814 ,517
Seed colour ,814 ,517
pH ,790
Seed bitterness ,690 ,715
Seed astringency ,673 ,564
Pulp acidity ,616
Skin aroma -,461 ,887
Pulp separation -,813
Skin polyphenols -,842
Ripening tecnological index -,844
Skin Anthocyanins -,864
°Brix -,887
Seed polyphenol -,919
Total polyphenols -,971
Table 67. Matrix rotated (Varimax) of the first two components extracted. Descriptors ordered in
order of importance excluding the <0,4 coefficients as of little relevance.

113
Figure 58. Rotated graph of the first two components obtained from the factorial analysis.
Analyzing the multiple linear regression between the three new components and the berry
sensorial maturity it was clear that an important correlation existed and that the berry
sensorial maturity experimentally determined is linearly correlated in an important way (r2 =
0,967) to that estimated (tab. 68). Thus the total ripening index of the berry can be expressed
as follows (tab. 69).
Berry sensorial maturity = 87,575+F1*1,182+F2*3,910-F3*0,012
From the table of coefficient values for the estimation of the sensorial maturity of the berry, it
can be concluded that the model used is of significant importance, however it is more
relevant with the component 1 and 2 rather than with 3 one (tab. 69).

114
Model R R-square R-square correct
Standard deviation Estimate’s error
1 ,984 ,969 ,967 1,092
Table 68. Statistic model of relation between the dependant variable of sensorial maturity of the berry
and the three new components obtained from factorial analysis.
Coefficients B
Standard
deviation
Error Sig. (Costant) 87,575 ,278 ,000
F 1 1,182 ,257 ,000
F 2 3,910 ,116 ,000
F 3 -,012 ,223 ,956
Table 69. Coefficient values for the estimation of the sensorial maturity estimated of the berry,
standard error and their significance.
Calculating the relation between berry sensorial maturity expressed and that estimated
statistically it can be noted graphically how the ripeness expressed by the panel and that
determined statistically are overlapping (fig. 59).
Figure 59. The relation between the ripeness index expressed and that statistically estimated.

115
In the table of correlations in the parameters examined in the course of our study, only the
variables characterized by a probability < 0,00001 are found on the table (tab. 70). The pH
and harvest date are the parameters that don‟t present significant Pearson‟s correlations .Most
of the variables show a positive Pearson‟s correlation value. Negative Pearson‟s correlation
values were found in many parameters linked to the weight and among technological and
phenolic characteristics.
As foreseen, the variables concerning the ripening of the single berry constituents, global and
sensorial ripening are strictly and positively linked to the single parameters that constitute
them. There aren‟t many significant correlation among parameters that influence the
technological ripeness, and the phenolic richness and sensorial maturity. Nevertheless,
positive Pearson‟s correlation values were found between °Brix and skin‟s texture and its
maturity and negative between berry colour and berry seeds weight and pulp separation.

116
Variable Ber.
col.
Pulp
sep.
Pulp
swe.
Pulp
acid.
Pulp
aro.
Skin
tex.
Skin
astr.
Skin
aro.
Skin
bit.
Seed
col.
Seed
hard.
Seed
bit.
Seed
astr.
Seed
aro.
Pulp
mat.
Skin
mat.
Seed
mat.
Berry
aro.
B. S.
M.
Berry colour 0,65
Pulp
separation
0,67
Pulp
sweetness
0,88 0,69 0,64 0,66 0,91 0,69 0,85 0,72
Pulp acidity 0,66 0,72 0,66
Pulp aroma 0,88 0,68 0,64 0,92 0,68 0,83 0,70
Skin texture 0,71
Skin
astringency
0,89 0,84 0,89
Skin aroma 0,89 0,84 0,95
Skin
bitterness
0,84 0,84 0,92
Seed colour 0,65 0,69 0,70
Seed hardness 0,72 0,65
Seed
bitterness
0,69 0,68 0,92 0,89 0,67 0,90 0,77 0,66
Seed
astringency
0,64 0,64 0,92 0,91 0,71 0,94 0,80 0,78
Seed aroma 0,66 0,66 0,89 0,91 0,67 0,95 0,81 0,73
Pulp maturity 0,67 0,91 0,72 0,92 0,65 0,67 0,71 0,67 0,75 0,86 0,79
Skin maturity 0,71 0,89 0,95 0,92
Seed maturity 0,69 0,66 0,68 0,69 0,72 0,90 0,94 0,95 0,75 0,85 0,82
Berry aroma 0,85 0,83 0,77 0,80 0,81 0,86 0,85 0,93
Berry S
maturity
0,65 0,72 0,70 0,70 0,65 0,66 0,78 0,73 0,79 0,58 0,82 0,93
Table 70. Pearson‟s correlations. Legend abbreviations is on the previous pages.

117
Discriminant analysis on the sensorial characteristics of the grapes at harvest‟s time
highlighted differences between clones examined and all may be well distinct (fig. 60).
The first two canonical functions represent more than 98,9 % of the total variability (tab. 71).
Function Eingenvalue % of
variance %
cumulated Canonical
correlation
1 388,562 80,8 80,8 ,999
2 87,138 18,1 98,9 ,994
3 3,686 ,8 99,7 ,887
4 1,596 ,3 100,0 ,784
Table 71. Eigenvalues of discriminant analysis.
From the centroids graph obtained from the discriminant analysis (fig. 55), it is noted that the
points relative to the groups show a very limited dispersion. Five distinct groups appear in the
centroid; above all, the number one, is well detached from the other four.
100,0% of the original grouping are classified correctly, and 100,0% of the cases grouped
cross-validated are reclassified correctly (tab. 72).
Figure 60. Centroids obtained from the cluster analysis of the sensorial characteristics of the grapes at
harvest‟s time.

118
Thesis
Group expected
Totals 1 2 3 4 5
Crt
oss
- val
idat
ion
a
% 1 100,0 ,0 ,0 ,0 ,0 100,0
2 ,0 100,0 ,0 ,0 ,0 100,0
3 ,0 ,0 100,0 ,0 ,0 100,0
4 ,0 ,0 ,0 100,0 ,0 100,0
5 ,0 ,0 ,0 ,0 100,0 100,0
Table 72. Classification results.
a.Cross validation is done only for those cases in the analysis in cross validation, each case is
classified by the functions derived from all cases other than that case.
b.100,0% of original grouped cases correctly classified.
c.100,0% of cross-validated grouped cases correctly classified.

119
3.8 Tecnological and phenolic characteristics of the grapes at
harvest’s time
Variable Abbreviation Units
pH pH n
Sugary content °Brix °Brix
Titratable acidity Titr Ac g/L
Ripening Index* Rip Index n
Bunch weight Bunch wgt g
Berry weight Berry wgt g
Berry seed number Berry seed num n
Berry skin weight Skin wgt/berry g/berry
Berry seed weight Seed wgt/berry g/berry
Anthocyanins/berry Anth/berry mg/berry
Skins % skin %
Skin Anthocyanins Anth skin mg/Kg
Skin Polyphenols Polyph skin mg/Kg
Skin polyphenols percentage % Skin polyph %
Seed polyphenols percentage Polyph seed mg/Kg
Seed percentage Seeds % %
Polyphenols/berry (mg/Kg) Polyph/berry mg/berry
Total Polyphenols Tot Polyph mg/Kg *Ripening Tecnological Index was so calculated °Brix/Titratable acidity
Table 73. List of abbreviations.
MANOVA was also conducted by examining the parameters (tab. 73) linked to the laboratory
analysis of the grapes (tab. 73) (using the values of three repeated analysis of 17 theses each
year for three years), studying the importance of the variables in function of the chosen source
(tab. 74).

120
Table 74 a, b, c. Test of the effects between subjects (p=<0,05).
Factor Dependent
variable F Sig. Thesis Bunch weight 28579,211 ,000
Berry weight 14,811 ,000
pH 70,538 ,000
°Brix 68,658 ,000
Titratable acidity 28,239 ,000
Ripening index* 30,587 ,000
Berry skin weight 14,126 ,000
Skins % 9,625 ,000
Berry seed number 9,422 ,000
Seed weight/berry 1,302 ,211
Seeds % 1,246 ,247
Anthocyanins skin 5,571 ,000
Polyphenols skin 4,916 ,000
Polyphenols seed 5,540 ,000
Total polyphenols 6,253 ,000
% Skinpolyphenols 3,611 ,000
Anthocyanins/berry 4,118 ,000
Polyphenols/berry 4,635 ,000
Factor Dependent
variable F Sig. Year Bunch weight 7483,430 ,000
Berry weight 87,936 ,000
pH 407,945 ,000
°Brix 5,791 ,004
Titratable Acidity 80,129 ,000
Ripening Index* 21,621 ,000
Berry skin weight 145,787 ,000
Skins % 33,965 ,000
Berry seed number 10,181 ,000
Seed weight/berry ,213 ,808
Seeds % 1,499 ,228
Anthocyanins skin 9,777 ,000
Polyphenols skin 31,049 ,000
Polyphenols seed 39,459 ,000
Total polyphenols 21,332 ,000
% Skinpolyphenols 46,425 ,000
Anthocyanins/berry 1,365 ,260
Polyphenols/berry 12,226 ,000
Factor Dependent
variable F Sig. Thesis
* Year Bunch weight 8920,264 ,000
Berry weight 11,484 ,000
pH 26,873 ,000
°Brix 17,680 ,000
Titratable acidity 10,196 ,000
Ripening Index* 12,356 ,000
Berry skin weight 6,359 ,000
Skins % 3,276 ,000
Berry seed number 4,643 ,000
Seed weight/berry 1,141 ,304
Seeds % ,948 ,554
Anthocyanins skin 3,878 ,000
Polyphenols skin 3,226 ,000
Polyphenols seed 3,868 ,000
Total polyphenols 4,511 ,000
% Skinpolyphenols 2,451 ,000
Anthocyanins/berry 3,962 ,000
Polyphenols/berry 5,211 ,000

121
All the dependant variables proved to be statistically significant, except two parameters linked
to seeds mean weight/berry and the seed weight percentage compared to the other components
of the berry. Such variables do not change their level of significance if, the factor chosen
during the statistical analysis, is that of the thesis or the year or interaction between the two.
However choosing the year, a non significant statistical variable, anthocyanins /berry is
added.
By using the data previously obtained the level of variability attributable to the different
factor was calculated (tab. 75).
For most of the parameters the greater variability is attributable to the year as shown in the
values for the berry weight, pH, titratable acidity, berry skin weight, skins %, skin
polyphenols, seed polyphenols, total polyphenols and % skin polyphenols. The thesis,
however, shows more variability as concerns bunch weight and °Brix, while the other
parameters show comparable levels of variability attributable to the different source.
High percentage value of error in the two variables linked to the seeds was found.
Variable
%
variability
due to the
thesis
%
variability
due to the
year
%
variability
due to
interaction
thesis/year
%
variability
due to
error Bunch weight 63,53 16,64 19,83 0,00 Berry weight 12,85 76,31 9,97 0,87 pH 13,93 80,56 5,31 0,20 °Brix 73,72 6,22 18,98 1,07 Titratable acidity 23,62 67,02 8,53 0,84 Ripening Index 46,65 32,98 18,85 1,53 Berry skin weight 8,45 87,16 3,80 0,60 Skins % 20,11 70,96 6,84 2,09 Berry seed number 37,32 40,33 18,39 3,96 Seed weight/berry 35,61 5,83 31,20 27,35 Seeds % 26,56 31,94 20,20 21,31 Skin anthocyanins 27,55 48,34 19,17 4,94 Skin polyphenols 12,23 77,25 8,03 2,49 Seed polyphenols 11,11 79,13 7,76 2,01 Total polyphenols 18,89 64,45 13,63 3,02 % Skin polyphenols 6,75 86,80 4,58 1,87 Anthocyanins/berry 39,42 13,07 37,94 9,57
Table 75. Level of variability attributable to the different factor.

122
From Tukey‟s statistic test it is possible to note the table with the different subsets and those
non differentiated (tab. 76-78). The significant variables that create the most differentiated
homogenous subsets are those linked to the weight of the berry and the weight of the bunch.
The values obtained from the analysis of the latter form a number of subsets equal to the
number of theses that indicate great variability in the samples tested, the mean weight of the
bunch lies between the minimum value of 167 grams and a maximum of 356 grams, both
belonging to the two thesis of the „Brunello di Montalcino‟ denomination. Moreover the two
thesis mentioned above also differ in the mean weight of the berry, but a lower number of
varied homogenous subsets are formed.
Regarding the pH the values shown are lower in one thesis of the „Chianti Classico‟ and
higher in one of „Montecucco‟, the °Brix grade showing the highest value from one thesis
from the „Brunello di Montalcino‟ production area, and the lowest from the „Chianti Classico‟
area (tab. 76).
The other grapes from the three remaining theses, exception made for those from the
„Morellino di Scansano‟, show medium to high sugar levels, reaching over 28 °Brix.
Moreover the „Brunello di Montalcino‟ denomination shows greater variability in their theses
if compared to „Montecucco‟ (tab. 76).
Regarding titratable acidity, the highest values are found in one thesis in the grapes of the
„Chianti Classico‟ and in one of „Montecucco‟, while the lowest value in the vineyard of the
„Chianti Classico‟ in the „Chianti Colline Pisane‟ (tab. 76), with average values in the
remaining vineyards. Excluding extreme values, within the denominations there is no notable
variability of data.
As for the standard of polyphenols, the mean value is average to low, the overall total is less
present in the „Chianti Classico‟ thesis already highlighted as having the lowest pH values
and sugar levels. The „Brunello di Montalcino‟ thesis, that stands out for its mean value of
3700 mg/Kg of polyphenols expressed as catechin, is that already noted for the highest °Brix
value and for having the lightest berry and bunch (tab. 76). Analysing the total anthocyanins
content two theses emerged as not being notable for the other variables. The lowest value
belongs to a „Brunello di Montalcino‟ thesis while the highest to that of the „Montecucco‟
thesis. Among the variables that are not statistically different seed, weight/berry and
anthocyanins /berry gave to different subsets unlike seeds % (tab. 78).

123
Thesis
Bunch
weight (g)
Berry
weight (g) pH °Brix
Titratable
Acidity (g/L)
Ripen.
Index
Berry
skin
weight (g) Skins %
CCP 1 191,85 b 1,99 bcd 3,60 l 24,61 c 5,01 a 5,04 g 0,39 abc 0,19 ab
MC 1 257,04 i 1,81 b 3,43 gh 25,07 cd 6,96 f 3,66 cd 0,38 ab 0,20 ab
MC 2 239,37 f 2,07cde 3,44 gh 24,82 cd 8,07 h 3,12 bc 0,39 abc 0,19 a
MC 3 335,51 r 2,24 de 3,50 i 23,27 b 6,45 c-f 3,64 cd 0,42 a-d 0,18 a
MC 4 200,37 d 2,00 bcd 3,51 i 25,60 cd 6,33b-f 4,078 def 0,37 a 0,18 a
MC 5 249,52 h 1,87bc 3,67 l 25,05 cd 6,09 b-e 4,11 def 0,37 a 0,19 ab
MC 6 328,79 q 1,97 bcd 3,47 hi 25,89 d 6,40 b-f 4,04 def 0,40 a-d 0,20 ab
MS 1 318,47o 2,09 de 3,30 cd 20,75 a 5,86 bc 3,71 cd 0,39 abc 0,18 a
BM 1 267,11 l 2,33 fg 3,29 cd 25,46 cd 5,82 bc 4,43 ef 0,61 g 0,26 cd
BM 2 242,82 g 1,95bcd 3,34 def 25,31 cd 5,74 abc 4,58 fg 0,46 c-f 0,24 bc
BM 3 195,162 c 1,99 bcd 3,37 ef 25,62 cd 5,88 bc 4,48 ef 0,47 c-f 0,23 bc
BM 4 274,47 n 2,25 efg 3,31 cde 24,97 cd 6,04 bcd 4,16 def 0,48 def 0,21 ab
BM 5 166,08 a 1,607 a 3,38 fg 28,62 e 5,55 ab 5,75 h 0,40 a-d 0,26 cd
BM 6 270,36 m 2,43 g 3,26 bc 23,57 b 6,73 def 3,59 cd 0,52 ef 0,23 abc
BM 7 355,55 s 1,97bcd 3,23 b 25,53 cd 6,78 def 3,89 de 0,55 fg 0,283 d
CC 1 230,09 e 2,09 de 3,28 bcd 20,37 a 6,92 ef 2,97 ab 0,43 a-d 0,20 ab
CC 2 327,45 p 2,14de 3,2 0 a 20,98 a 9,04 i 2,44 a 0,45 a-d 0,21 ab
Table 76. Significant parameters with different and non differentiated subsets. Tukey Test (p=0,05).
Thesis Berry
seed
number
Anthocya-
nins Skin
(mg/Kg)
Polyphe- nols Skin (mg/kg)
Polyphe- nols Seed (mg/kg)
Total
Polyphe- nols (mg/kg)
% Skin
Polyphe- nols
Polyphe- nols /berry
(mg/berry)
CCP 1 2,01 b-e 522abc 1587 a-d 1607 cde 3195 b-e 50 b 6 abcd
MC 1 2,38 def 728d 1703 bcd 1740 e 3443 de 50 b 6 abcd
MC 2 2,48 f 630 bcd 1786 cd 1373 a-e 3160 b-e 43 ab 6 bcd
MC 3 2,56 f 661bcd 1292 a 1351 a-e 2644 ab 49 b 5 abc
MC 4 2,31 b-f 615 bcd 1547 abc 1465 b-e 3013 a-d 48 b 6 abc
MC 5 2,42 ef 594 bcd 1734 bcd 1440 a-e 3174 b-e 44 ab 5 abc
MC 6 2,20 b-f 580 bcd 1596 a-d 168 de 3282 cde 51 b 6 bcd
MS 1 2,32 def 513 abc 1493 abc 1360 a-e 2853 a-d 47 b 6 abc
BM 1 2,60 f 359 a 1432 abc 1408 a-e 2841 a-d 49 b 6 bcd
BM 2 2,16 b-f 569 bcd 1581 a-d 1260 a-d 2842 a-d 44 ab 5 ab
BM 3 1,56 a 473 ab 1518 abc 1289 a-d 2807 abc 45 b 6 abc
BM 4 1,87 abc 521 abc 1382 ab 1193 abc 2575 ab 46 b 5 abc
BM 5 1,93 a-d 671 cd 1949 d 1780 e 3729 e 47 b 5 abc
BM 6 2,19 b-f 487 abc 1504 abc 1482 -e 2987 a-d 47 b 7 d
BM 7 1,78 ab 653 bcd 1781 cd 1028 a 2810 abc 35 a 5 a
CC 1 2,15 bcdef 624 bcd 1753 bcd 1440 a-e 3194 b-e 45 b 6 bcd
CC 2 2,37 def 508 bc 1430 abc 1092 ab 2522 a 42 ab 5 ab
Table 77. Significant parameters with non differentiated subsets. Tukey Test (p=0,05).

124
Thesis
Seed
weight/berry
(g/berry)
Seeds %
Anthocyanins
/berry
(mg/berry)
CCP 1 0,09 ab 0,05 a 1,01 a-d
MC 1 0,10 ab 0,05 a 1,31 cd
MC 2 0,10 ab 0,05 a 1,36 d
MC 3 0,10 ab 0,04 a 1,33 d
MC 4 0,12 ab 0,06 a 1,23 bcd
MC 5 0,08 ab 0,04 a 1,10 a-d
MC 6 0,11 ab 0,06 a 1,13 a-d
MS 1 0,09 ab 0,04 a 1,06 a-d
BM 1 0,11 ab 0,05 a 0,87 a
BM 2 0,09 ab 0,04 a 1,09 a-d
BM 3 0,06 a 0,03 a 0,93 ab
BM 4 0,08 ab 0,03 a 1,15 a-d
BM 5 0,07 ab 0,05 a 0,97 abc
BM 6 0,10 ab 0,04 a 1,20 a-d
BM 7 0,07 ab 0,03 a 1,26 bcd
CC 1 0,08 ab 0,04 a 1,26 bcd
CC 2 0,22 b 0,10 a 1,08 a-d
Table 78. Non significant parameters with non differentiated subsets. Tukey Test (p=0,05).
From the multivariate analysis factor choice, the year and the Tukey statistic test it appears
that most of the parameters tested originate differentiated subsets, exception made for the
variables seed weight/berry, anthocyanins/berry and seed%. In bunch weight, berry weight,
pH, berry skin weight, skins% and seed polyphenols, instead, it is the variables that create
well differentiated subsets that indicate a great variability of data in the three year period
studied. The year 2009 shows the highest parameters that influence the technological ripeness
of the grapes while in the following two years higher quantities of polyphenols are registered
(tab.79).
Variable 2009 2010 2011
Bunch weight (g) 274,97 c 251,167 a 259,16 b
Berry weight (g) 2,26 c 1,85 a 2,03 b
pH 3,53c 3,28 a 3,35 b
°Brix 24,60 b 24,58 b 24,15 a
Titratable acidity (g/L) 6,08 a 7,24 b 6,04 a
Ripening Index 4,21 b 3,68 a 4,06 b
Berry skin weight (g) 0,54 c 0,35 a 0,44 b
Skins % 0,24 c 0,19 a 0,22 b
Berry seed number 2,34 b 2,16 a 2,07 a
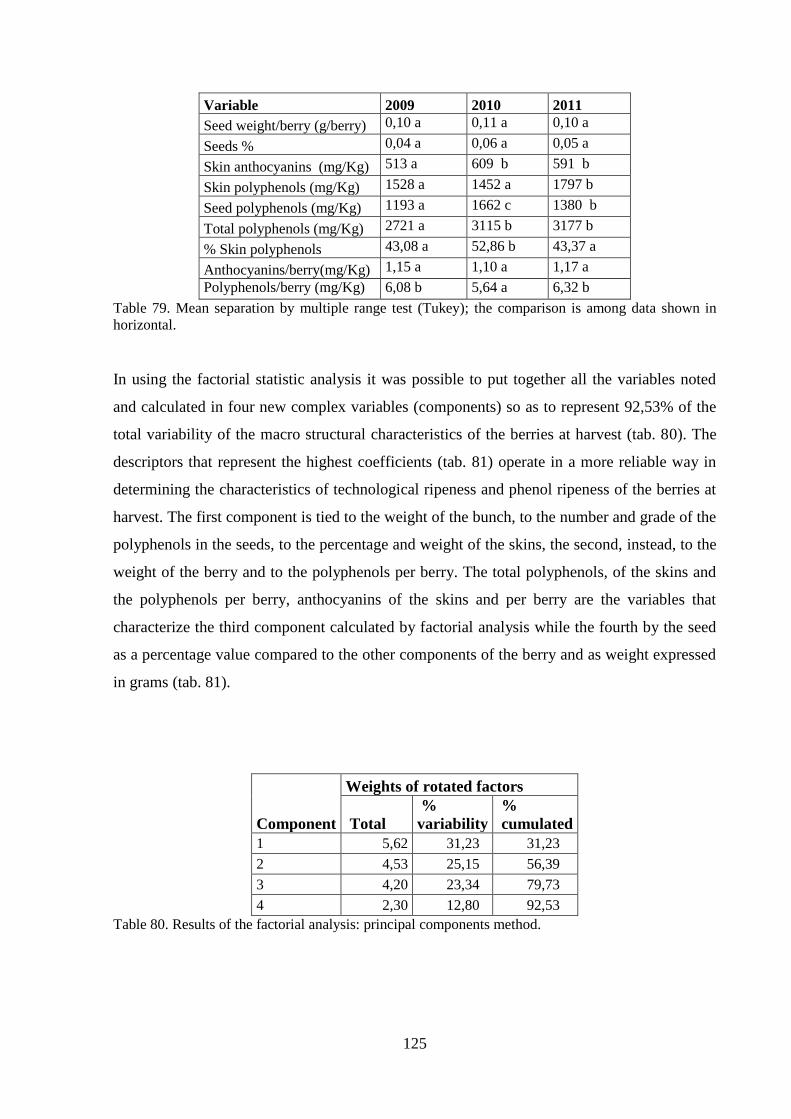
125
Variable 2009 2010 2011
Seed weight/berry (g/berry) 0,10 a 0,11 a 0,10 a
Seeds % 0,04 a 0,06 a 0,05 a
Skin anthocyanins (mg/Kg) 513 a 609 b 591 b
Skin polyphenols (mg/Kg) 1528 a 1452 a 1797 b
Seed polyphenols (mg/Kg) 1193 a 1662 c 1380 b
Total polyphenols (mg/Kg) 2721 a 3115 b 3177 b
% Skin polyphenols 43,08 a 52,86 b 43,37 a
Anthocyanins/berry(mg/Kg) 1,15 a 1,10 a 1,17 a
Polyphenols/berry (mg/Kg) 6,08 b 5,64 a 6,32 b
Table 79. Mean separation by multiple range test (Tukey); the comparison is among data shown in
horizontal.
In using the factorial statistic analysis it was possible to put together all the variables noted
and calculated in four new complex variables (components) so as to represent 92,53% of the
total variability of the macro structural characteristics of the berries at harvest (tab. 80). The
descriptors that represent the highest coefficients (tab. 81) operate in a more reliable way in
determining the characteristics of technological ripeness and phenol ripeness of the berries at
harvest. The first component is tied to the weight of the bunch, to the number and grade of the
polyphenols in the seeds, to the percentage and weight of the skins, the second, instead, to the
weight of the berry and to the polyphenols per berry. The total polyphenols, of the skins and
the polyphenols per berry, anthocyanins of the skins and per berry are the variables that
characterize the third component calculated by factorial analysis while the fourth by the seed
as a percentage value compared to the other components of the berry and as weight expressed
in grams (tab. 81).
Component
Weights of rotated factors
Total
%
variability
%
cumulated
1 5,62 31,23 31,23
2 4,53 25,15 56,39
3 4,20 23,34 79,73
4 2,30 12,80 92,53
Table 80. Results of the factorial analysis: principal components method.

126
Variable Component
1 2 3 4 Seed Polyphenols ,955
Bunch weight ,768 -,605
% Skin polyphenols ,754 -,625
Berry seed number ,735 ,459
Total polyphenols ,767
Skin anthocyanins -,442 ,779
Seeds % -,493 ,762
Anthocyanins/berry ,957
Titratable acidity -,927
Seed weight/berry ,976
Skin polyphenols ,927
Polyphenols /berry ,790 ,507
°Brix ,501 ,582
pH -,649 ,441 -,490
Berry weight -,662 ,729
Berry skin weight -,848 ,420
Skins % -,863
Table 81. Matrix of the rotated components (Varimax) in order of importance. Coefficient values
below 0,4 are not included as of little relevance.
Extracting only two components from all the data collected it is possible to explain 69,85% of
the total variability (tab. 82).
In particular the first component is greatly linked to the polyphenol content of the skin, to the
total polyphenols, to the mean weight of the berry and to that of the seed in terms of the total
weight of the berry, to the total of pH and acidity. The second on the other hand, to the
polyphenols of the seeds and to the grade of polyphenols per berry (tab. 83).
The graph (fig. 61) shows how the descriptors that are in the same quadrant and that are close
to the ripening of the berry are directly correlated to it while those further away are correlated
negatively. The Ripening Index is indeed positively correlated with the sugar level and with
the grade of polyphenols in the berry and skins and negatively with the parameters tied to the
characteristics of the seed. Moreover the first component is positively correlated with all the
variables examined, while the second is correlated only in part, in fact it is tied negatively to
the acidity measure worthy of note, to the polyphenols present in the skins and seeds and to
the average weight of the seeds and of the bunch.

127
Component
Weights of rotated factors
Total
%
variance
%
cumulated 1 6,50 36,13 36,13
2 6,07 33,72 69,85
Table 82. Results of the factorial analysis extracting only the first 2 components: method of the
principal components.
Variable Component
1 2 Skin polyphenols ,829
Total polyphenols ,765
Berry weight ,760 -,577
Seed weight/berry ,667 ,043
% Skin polyphenols ,645 ,712
Polyphenols /berry ,542 ,715
Skin anthocyanins ,541 -,630
Anthocyanins/berry -,606
Ripening Index -,548
Seed Polyphenols ,888
Seeds % -,317
Titratable acidity ,850
Berry skin weight ,789
Polyphenols/berry ,929
pH -,762 ,542
°Brix -,834
Berry seed number -,895
Skins % -,913
Table 83. Matrix rotated (Varimax) of the first two components extracted. Descriptors ordered in
order of importance excluding the <0,4 coefficients as of little relevance .

128
Figure 61. Rotated graph of the first two components obtained from the factorial analysis.
Analysing the multiple linear regression in the four new components and the ripeness index of
the berry, it is possible to note that there is a significant correlation and that the total ripeness
of the berry obtained experimentally is linearly correlated in a significant way (r2 = 0,822) to
that estimated in (tab. 84). Therefore, the total ripeness index of the berry can be expressed in
the following way (tab. 85).
Ripening Index =3,241-F1*0,124+F2*0,729+F3*0,236-F4*0,078
From the table of coefficient values for the estimation of the total ripeness of the berry, it can
be concluded that the model used is of significant importance, that the Ripening Index
variable, is more relevant with the last three constants rather than with the first (tab. 84).
Model R R-square R-square correct
Standard deviation Estimate‟s error
1 ,907 ,822 ,818 ,470
Table 84. Statistic model of relation between the dependant variable of total ripeness of the berry and
the four new components obtained from factorial analysis.

129
Coefficients B
Standard
deviation
Error Sig. (Costant) 3,241 ,048 ,000
F 1 -,124 ,052 ,018
F 2 ,729 ,031 ,000
F 3 ,236 ,048 ,000
F 4 -,078 ,013 ,000
Table 85. Coefficient values for the estimation of the total maturity estimated of the berry,
standard error and their significance.
Calculating the relation between the index ripeness expressed and that estimated statistically it
can be seen graphically how the ripeness expressed by the panel and that determined
statistically are overlapping (fig. 62).
Figure 62. The relation between the ripeness index expressed and that statistically estimated.
Examining the correlation between the parameters analyzed, in the table only the variables
with a probability <0,00001 are reported. and the characters in bold indicate the negativity of
the value indicated.
In most cases there are values of Pearson's correlation positive. However the parameters
connected with the weight of the bunch, and grape skins, are negatively correlated with levels
of total polyphenols, and polyphenols found in the skins and seeds (tab. 86).

130
Bunch
wgt
Berry
wgt pH °Brix
Titr
ac
Rip
Index
Berry
skin
wgt
Skins
%
Berry
seed
num
Seed
wgt/
berry
Seeds
%
Skin
anth
Skin
polyph
Seed
polyph
Tot
polyph
%
Skin
polyph
Anth/
berry
Polyph/
berry F 1 F 2 F 3 F 4
Bunch weight 0,42 0,36 0,37 0,40
Berry weight 0,33 0,29 0,70 0,43 0,46 0,46 0,50 0,62 0,41 0,47 0,36
pH 0,39 0,44
°Brix 0,42 0,33 0,57 0,51 0,34
Titr Acidity 0,39 0,82 0,34 0,81
Rip Index 0,57 0,82 0,37 0,87
Berry skin
weight
0,70 0,70 0,33 0,50 0,46 0,34 0,53
Skins % 0,70 0,33
Berry seed
number
0,43
Seed
weight/berry
0,98 0,58 0,99
Seeds % 0,98 0,49 0,27 0,96
Anthocyanins
skin 0,46 0,33 0,42 0,38 0,75 0,72
Polyphenols
skin 0,46 0,42 0,72 0,41 0,72
Polyphenols
seed 0,36 0,50 0,50 0,83 0,78 0,39 0,74
Total
Polyphenols 0,37 0,62 0,46 0,38 0,72 0,83 0,44 0,60 0,47
% Skin
polyphenols 0,34 0,33 0,41 0,78 0,59 0,38
Anthocyanins
berry
0,75 0,54
Polyphenols/
berry
0,41 0,39 0,44
F 1 0,47 0,34 0,37 0,53 0,58 0,49 0,74 0,60 0,59 0,37 0,62
F 2 0,40 0,44 0,51 0,81 0,87 0,37
F 3 0,36 0,34 0,72 0,72 0,47 0,38 0,54
F 4 0,99 0,96 0,62
Table 86. Pearson‟s correlations. Bold numbers are preceded by the minus sign. Legend abbreviations is on the previous pages.
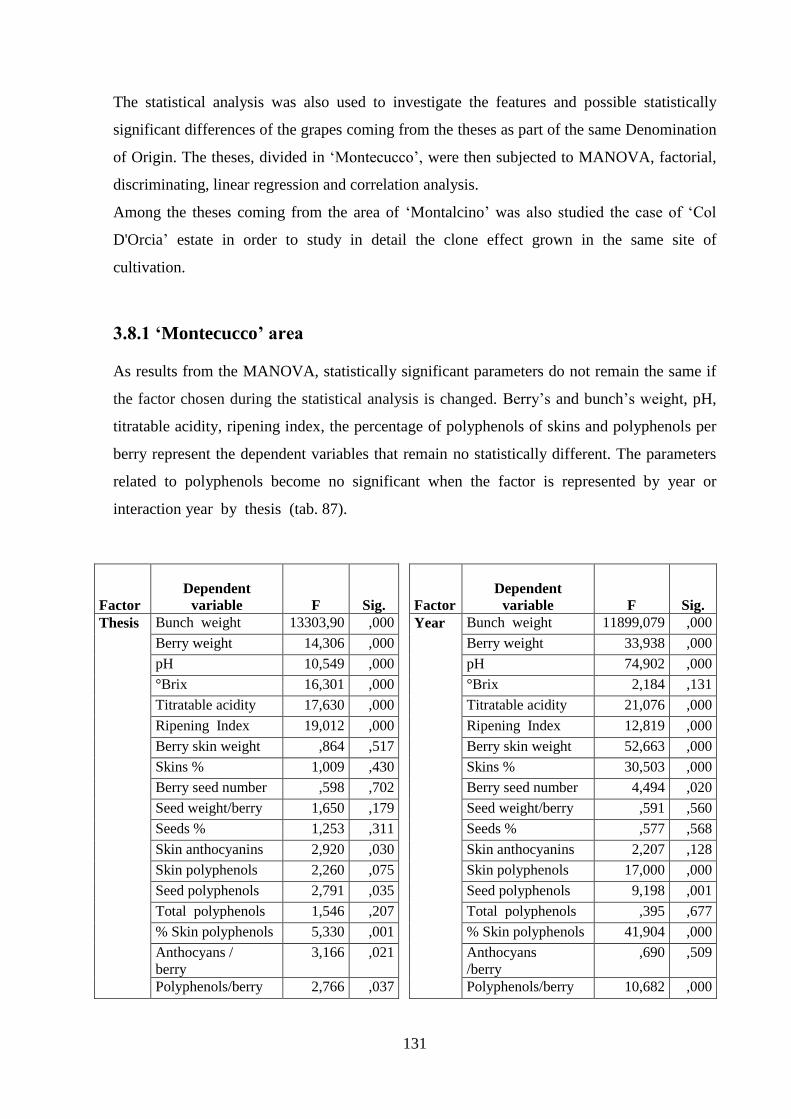
131
The statistical analysis was also used to investigate the features and possible statistically
significant differences of the grapes coming from the theses as part of the same Denomination
of Origin. The theses, divided in „Montecucco‟, were then subjected to MANOVA, factorial,
discriminating, linear regression and correlation analysis.
Among the theses coming from the area of „Montalcino‟ was also studied the case of „Col
D'Orcia‟ estate in order to study in detail the clone effect grown in the same site of
cultivation.
3.8.1 ‘Montecucco’ area
As results from the MANOVA, statistically significant parameters do not remain the same if
the factor chosen during the statistical analysis is changed. Berry‟s and bunch‟s weight, pH,
titratable acidity, ripening index, the percentage of polyphenols of skins and polyphenols per
berry represent the dependent variables that remain no statistically different. The parameters
related to polyphenols become no significant when the factor is represented by year or
interaction year by thesis (tab. 87).
Factor Dependent
variable F Sig. Factor Dependent
variable F Sig. Thesis Bunch weight 13303,90 ,000 Year Bunch weight 11899,079 ,000
Berry weight 14,306 ,000 Berry weight 33,938 ,000
pH 10,549 ,000 pH 74,902 ,000
°Brix 16,301 ,000 °Brix 2,184 ,131
Titratable acidity 17,630 ,000 Titratable acidity 21,076 ,000
Ripening Index 19,012 ,000 Ripening Index 12,819 ,000
Berry skin weight ,864 ,517 Berry skin weight 52,663 ,000
Skins % 1,009 ,430 Skins % 30,503 ,000
Berry seed number ,598 ,702 Berry seed number 4,494 ,020
Seed weight/berry 1,650 ,179 Seed weight/berry ,591 ,560
Seeds % 1,253 ,311 Seeds % ,577 ,568
Skin anthocyanins 2,920 ,030 Skin anthocyanins 2,207 ,128
Skin polyphenols 2,260 ,075 Skin polyphenols 17,000 ,000
Seed polyphenols 2,791 ,035 Seed polyphenols 9,198 ,001
Total polyphenols 1,546 ,207 Total polyphenols ,395 ,677
% Skin polyphenols 5,330 ,001 % Skin polyphenols 41,904 ,000
Anthocyans /
berry 3,166 ,021
Anthocyans /berry
,690 ,509
Polyphenols/berry 2,766 ,037 Polyphenols/berry 10,682 ,000

132
Factor Dependent
variable F Sig. Thesis * Year Bunch weight 3622,812 ,000
Berry weight 13,204 ,000
pH 11,079 ,000
°Brix 17,868 ,000
Titratable acidity 4,188 ,003
Ripening Index 4,018 ,003
Berry skin weight 3,594 ,007
Skins % 2,991 ,017
Berry seed number 3,536 ,007
Seed weight/berry 1,178 ,346
Seeds % 1,610 ,172
Skin anthocyanins 3,775 ,005
Skin polyphenols 1,264 ,302
Seedpolyphenols 3,796 ,005
Total polyphenols 3,192 ,012
% Skin polyphenols 1,727 ,142
Anthocyans /berry 3,447 ,008
Polyphenols/berry 2,587 ,033
Table 87 a, b, c. Test of effects between subjects (p=<0,05).
By using the data previously obtained the level of variability attributable to the different
factor was calculated (tab. 88). For most of the parameters the variability is attributable to the
year; the thesis, however, shows more variability as concerns ripening index, the other
parameters show comparable levels of variability attributable to the different factor.

133
Variable
%
variability
due to the
thesis
%
variability
due to the
year
%
variability
due to
interaction
thesis/year
%
variability
due to
error
Bunch weight 46,15 41,28 12,57 0,00 Berry weight 22,91 54,35 21,14 1,60 pH 10,82 76,80 11,36 1,03 °Brix 43,64 5,85 47,83 2,68 Titratable acidity 40,16 48,02 9,54 2,28 Ripening Index 51,60 34,79 10,90 2,71 Berry skin weight 1,49 90,61 6,18 1,72 Skins % 2,84 85,92 8,42 2,82 Berry seed number 6,21 46,68 36,73 10,39 Seed weight/berry 37,33 13,38 26,65 22,63 Seeds % 28,23 12,99 36,25 22,52 Skin anthocyanins 29,49 22,29 38,12 10,10 Skin polyphenols 10,50 78,98 5,87 4,65 Seedpolyphenols 16,63 54,80 22,62 5,96 Total polyphenols 25,20 6,45 52,05 16,30 % Skin polyphenols 10,67 83,87 3,46 2,00 Anthocyans /berry 38,13 8,31 41,51 12,04 Polyphenols/berry 16,24 62,71 15,18 5,87
Table 88. Level of variability attributable to the different factor.
From Tukey‟s statistic test it is possible to note the table with the different subsets and those
non differentiated (tab 89-91). The significant variables that create the most differentiated
homogenous subsets are those linked to the mean weight of the bunch, to the sugary and acids
content, to the ripening index, and to the percentage of polyphenols contained in the skin.
The values obtained from the analysis of the mean weight of the bunch form a number of
subsets equal to the number of thesis that indicate great variability in the samples tested,
indeed this variable lies between the minimum value of 200 grams and a maximum of 300
grams. The sugar concentration is medium high; the thesis with the lowest value shows about
24° Brix and the one with the highest value is reaching over 28 °Brix: this latter thesis is the
same already mentioned for the heaviest bunch which also differs from the others for the
greatest total polyphenols content and the lowest in anthocyanins.
The berries of the theses show good values of total acidity, this variable in one case has
reached 8 g/L (tab. 90-91).
Between not statistically different variables, only the variable seed weight/berry originates
different subsets (tab. 91).

134
Thesis
Bunch
weight (g)
Berry
weight (g) pH °Brix
Titratable
Acidity (g/L)
Ripen.
Index
Skin
Anthocya-
nins
(mg/kg)
Seed
Polyphe-
nols (mg/Kg)
MC 1 255,47 d 1,75a 3,42 ab 25,07 b 6,92 a 3,68 bc 737b 1817 ab
MC 2 239,37 c 2,07 b 3,43 ab 24,82 ab 8,07 b 3,12 a 661 ab 1374 a
MC 3 290,30 e 2,09 b 3,41 a 23,97 a 6,98 a 3,45 ab 694 ab 1685 ab
MC 4 200,37 a 2,00 b 3,51 bc 25,6 bc 6,33 a 4,07 cd 615ab 1465 ab
MC 5 219,37 b 1,67 a 3,55 c 26,25 c 6,32 a 4,16 d 602 ab 1698 ab
MC 6 305,71 f 2,02 b 3,56 c 27,6 d 6,50 a 4,25 d 498 a 1906 b
Table 89. Significant parameters with differentiated subsets. Tukey Test (p=0,05).
Table 90. Significant parameters with different and non differentiated subsets. Tukey Test (p=0,05).
Thesis
Berry
skin
weight Skins
%
Berry
seed
number Seeds
% % Skin
Polyphenols
Total
Polyphenols
(mg/kg)
Seed
weight/
berry
MC 1 0,36 a 0,20 a 2,42 a 0,06 a 1735,10 a 3552 a 0,10 ab
MC 2 0,39 a 0,19 a 2,49 a 0,05 a 1786,98 a 3161 a 0,10 ab
MC 3 0,36 a 0,17 a 2,42 a 0,04 a 1464,91 a 3149 a 0,09 ab
MC 4 0,37 a 0,18 a 2,31 a 0,06 a 1547,87 a 3013 a 0,12 b
MC 5 0,30 a 0,18 a 2,23 a 0,04 a 1769,04 a 3467 a 0,07 a
MC 6 0,38 a 0,19 a 2,42 a 0,05 a 1489,25 a 3395 a 0,10 ab
Table 91. Non significant parameters with different and non differentiated subsets. Tukey Test
(p=0,05).
The year appears the most of the parameters tested originate differentiated subsets, exception
made for total polyphenols and for variables related to anthocyanins and to seeds. The year
2009 shows the highest parameters that influence the technological ripeness of the grapes at
the harvest while in the following two years higher quantities of polyphenols are registered
(tab. 92).
Thesis
Polyphenols/ berry (mg/berry)
% Skin
Polyphenols
Anthocyanins/
berry
(mg/berry)
MC 1 6,14 ab 50,86 bc 1,29 a
MC 2 6,50 ab 43,19 a 1,36 a
MC 3 6,47 ab 53,04 bc 1,36 a
MC 4 5,99 ab 48,27 ab 1,23 a
MC 5 5,75 a 48,94 ab 1,00 a
MC 6 6,86 b 56,21 c 1,00 a

135
Variable 2009 2010 2011 Bunch weight 229,96 a 237,31 b 272,84 c
Berry weight 2,12 c 1,78 a 1,99 b
pH 3,67 c 3,44 b 3,38 a
°Brix 26,20 b 25,51 a 24,92 a
Titratable acidity 6,86 b 7,36 c 6,38 a
Ripening Index 3,88 b 3,53 a 3,94b
Berry skin weight 0,47 c 0,28 a 0,38 b
Skins % 0,22 c 0,15 a 0,19 b
Berry seed number 2,65 b 2,26 a 2,34 a
Seed weight/berry 0,11 a 0,09 a 0,09 a
Seeds % 0,05 a 0,05 a 0,05 a
Skin anthocyanins 590,39 a 684,46 a 622,34 a
Skin polyphenols 1719,39 b 1399,44 a 1875,36 b
Seed polyphenols 1494,45 a 1873,56 b 1443,98 a
Total polyphenols 3213,84 a 3272,00 a 3319,34 a
% Skin polyphenols 45,49 a 57,14 b 43,35 a
Anthocyans /berry 1,26 a 1,20 a 1,20 a
Polyphenols/berry 6,79 b 5,74 a 6,52 b
Table 92. Mean separation by multiple range test (Tukey); the comparison is among data shown in
horizontal.
By using the factorial statistic analysis it was possible to put together all the variables noted
and calculated in four new complex variables (components) so as to represent 95,49% of the
total variability of the technological characteristics of the berries at harvest (tab. 93). The
descriptors that represent the highest coefficients (tab. 94) operate in a more reliable way in
determining the characteristics of technological ripeness and phenol resources of the berries at
harvest.
There are only three values of the coefficients less than 0.4, including two linked to the
titratable acidity, and then all remaining variables have influence for the purpose of analysis.
The first component is tied to the most of the parameters studied except for the value of total
acidity, mean weight of berry and of anthocyanins present in the skins; these values are
associated with the second component. The last component is characterized, however, to pH
and polyphenols content of skins (tab. 94).

136
Component
Weights of rotated factors
Total % variability % cumulated 1 8,91 49,51 49,51
2 5,28 29,35 78,87
3 2,99 16,63 95,49
Table 93. Results of the factorial analysis: principal components method.
Variable Component
1 2 3 Polyphenols/berry ,986 ,094
Total polyphenols ,980
Seed polyphenols ,952
°Brix ,816 ,483
Skin polyphenols ,811 ,553
Skins % ,788 ,580 Berry skin weight ,721 ,496 ,463
Seeds % ,706 ,599 Seed weight/berry ,693 ,657 Berry seed number ,644 ,472 ,601
pH -,896
Titratable acidity -,951 % Skin polyphenols -,699
Berry weight -,807 -,457
Skin anthocyanins -,740 -,548
Anthocyans /berry -,867 -,463
Bunch weight -,867 -,463
Table 94. Matrix of the rotated components (Varimax) in order of importance. Coefficient values
below 0,4 are not included because unimportant.
Extracting only two components from all the data collected it is possible to explain 88,33% of
the total variability (tab. 95).
In particular the first component is greatly linked to the variables already mentioned for the
description of the first component; the second is composed of the sum of the second and third
component of the previous analysis (tab. 96).
The graph (fig. 63) shows how the descriptors that are in the same quadrant and that are close
to the ripening of the berry are directly correlated to it while those further away are correlated
negatively. The Ripening Index is indeed positively correlated with the sugary content, the
pH, the seeds‟s and skins‟s weight, and with the grade of polyphenols in the berry and skins.

137
On the contrary, it is negatively correlated with the mean weight of the berry and of the bunch
and the titratable acidity.
The first and the second component are negatively correlated with the antochyanins and the
mean weight of the berry and of the bunch.
Component
Weights of rotated factors
Total
%
variance
%
cumulated 1 9,55 53,04 53,04
2 6,35 35,29 88,33
Table 95. Results of the factorial analysis extracting only the first 2 components: method of the
principal components.
Variable Component
1 2 Polyphenols/berry ,993
Total polyphenols ,990
Seed polyphenols ,954
°Brix ,847 ,524
Skin polyphenols ,830 ,476
Skins % ,821 ,556
Berry skin weight ,814 ,555
Seeds % ,749 ,651
Seed weight/berry ,743 ,651
Berry seed number ,727 ,669
pH ,695 ,674
% Skin polyphenols -,803
Titratable acidity -,697
Berry weight
Skin anthocyanins -,906
Anthocyans /berry -,424 -,893
Bunch weight -,889 -,437
Table 96. Matrix rotated (Varimax) of the first two components extracted. Descriptors ordered in
order of importance excluding the <0,4 coefficients as of little relevance.

138
Figure 63. Rotated graph of the first two components obtained from the factorial analysis.
Analysing the multiple linear regression in the three new components and the ripeness index
of the berry, it is possible to note that there is a significant correlation and that the total
ripeness of the berry obtained experimentally is linearly correlated in a significant way (r2 =
0,665) to that estimated in (tab. 97). Therefore, the total ripeness index of the berry can be
expressed in the following way (tab. 98).
Ripening Index = 4,006+F1*0,99+F2*0,160+F3*0,152
From the table of coefficient values for the estimation of the total ripeness of the berry, it can
be concluded that the model used is of significant importance, though the Ripening Index
variable, is more relevant with the last constant rather than with the first two (tab. 98).

139
Model R R-square R-square correct
Standard
deviation Estimate’s error
1 ,815 ,665 ,640 ,351
Table 97. Statistic model of relation between the dependant variable of total ripeness of the berry and
the three new components obtained from factorial analysis.
Coefficients B Standard deviation
Error Sig. (Costant) 4,006 ,062 ,000
F1 ,099 ,103 ,340
F2 ,160 ,055 ,006
F3 ,152 ,031 ,000
Table 98. Coefficient values for the estimation of the total ripeness estimated of the berry,
standard error and their significance.
Examining the correlation between the parameters analyzed, in the table only the variables
with a probability <0,00001 are reported and the characters in bold indicate the negativity of
the value indicated.
There are a few significant Pearson‟s correlations and they are expressed in like way from
positive and negative values.
Bunch weight, pH, berry seed number, polyphenols/berry, are the parameters that don‟t present
significant Pearson‟s correlations (tab. 99).

140
Variable Berry
weight
(g) °Brix
Titr.
Ac.
(g/L)
Rip
Index
Berry
skin
weight
(g)
Seed
weight/
berry
(g)
Seeds
%
Skin
anthocy.
(mg/Kg)
Skin
polyph.
(mg/Kg)
Seed
polyph.
(mg/Kg)
Total
polyph.
(mg/Kg)
%
Skin
polyph.
Anthocy./
berry
(mg/berry)
Berry weight
(g)
0,68 0,66
Titratable acidity
(g/L)
0,88
Ripening Index 0,57 0,88
Berry skin weight (g) 0,68
Skins % 0,88
Seed weight /berry
(g/berry)
0,88
Seeds % 0,88
Skin anthocyanins
(mg/Kg)
0,86
Skin polyphenols
(mg/Kg)
0,64
Seed polyphenols
(mg/Kg) 0,66 0,78 0,79
Total polyphenols
(mg/Kg)
0,78
% Skin polyphenols 0,64 0,79
Anthocyanins/berry
(mg/berry)
0,86
Table 99. Pearson‟s correlations. Bold numbers are preceded by the minus sign. Legend abbreviations is on the previous pages.

141
Discriminant analysis on the technological and phenolic characteristics of the grapes at harvest‟s time
highlighted differences between areas examined and some of which may be distinct (fig. 64).
The first two canonical functions represent more than 77,0 % of the total variability (tab.
100).
Function Eingenvalue % of
variance %
cumulated Canonical
correlation
1 12,212 57,8 57,8 ,961
2 4,083 19,3 77,1 ,896
3 3,029 14,3 91,5 ,867
4 1,457 6,9 98,4 ,770
5 ,346 1,6 100,0 ,507
Table 100. Eigenvalues of discriminant analysis.
From the centroids graph obtained from the discriminant analysis (fig. 64), it is noted that the
points relative to the groups show a limited dispersion. Two distinct groups appear in the
centroid: the first includes the thesis coming from a different a vineyard of a different farm from
the other five theses and that is the only one that well differs from the other, because well detached.
The second the residual theses: the number two is the most distinguishable while some points
linked to number four and five are superimposed.
The 95,5% of the original grouping are classified correctly, while 68,2% of the cases grouped
cross-validated are reclassified correctly (tab. 101).

142
Figure 64. Centroids obtained from the cluster analysis of the characteristics of the grapes at harvest‟s
time.
Thesis
Group expected
Totals 1 2 3 4 5 6 Cross-validation
a % 1 33,3 ,0 50,0 16,7 ,0 ,0 100,0
2 ,0 66,7 16,7 ,0 ,0 16,7 100,0
3 37,5 12,5 50,0 ,0 ,0 ,0 100,0
4 11,1 ,0 11,1 66,7 11,1 ,0 100,0
5 ,0 ,0 ,0 11,1 88,9 ,0 100,0
6 ,0 ,0 ,0 ,0 ,0 100,0 100,0
Table 101. Classification results. a. Cross validation is done only for those cases in the analysis in cross validation, each case is
classified by the functions derived from all cases other than that case. b. 95,5% of original grouped cases correctly classified.
c. 68,2% of cross-validated grouped cases correctly classified.

143
3.8.2 ‘Col d’Orcia’ estate
As results from the multivariance analysis the dependant variables proved to be statistically
significant.
If the thesis is chosen as factor, titratable acidity and percentage of seed‟s polyphenols
become non significant statistical variables; instead choosing the year ripening index, the
percentage of skins and the anthocyanins‟s content, become non significant statistical
variables.
Seed‟s percentage, polyphenols level and skin‟s percentage polyphenols are the parameters
that become non significant when the factor is represented by year by thesis (tab. 102).
Factor Dependent
variable F Sig. Factor Dependent
variable F Sig. Thesis Bunch weight 19832,816 ,000 Year Bunch weight 10903,491 ,000
Berry weight 62,925 ,000 Berry weight 77,761 ,000
pH 11,196 ,000 pH 466,432 ,000
°Brix 22,696 ,000 °Brix 7,985 ,002
Titratable acidity
1,904 ,136
Titratable acidity
19,359 ,000
Ripening Index 8,226 ,000 Ripening Index ,040 ,961
Berry skin weight
29,807 ,000
Berry skin weight
42,400 ,000
Skins % 2,925 ,037 Skins % 1,374 ,269
Berry seed number
21,754 ,000
Berry seed number
6,252 ,005
Seed weight/ berry
11,557 ,000
Seed weight/ berry
5,403 ,010
Seeds % 4,249 ,008 Seeds % 5,840 ,007
Skin anthocyanins
42,798 ,000
Skin anthocyanins
14,454 ,000
Skin polyphenols
13,246 ,000
Skin polyphenols
6,225 ,005
Seed polyphenols
7,521 ,000
Seed polyphenols
3,669 ,038
Total polyphenols
20,314 ,000
Total polyphenols
4,967 ,014
% Skin polyphenols
,941 ,454
%Skin polyphenols
4,243 ,024
Anthocyans
/berry 14,924 ,000
Anthocyans / berry
1,807 ,182
Polyphenols/ berry
4,892 ,004
Polyphenols/ berry
9,494 ,001

144
Factor Dipendent variable F Sig. Thesis *
Year Bunch weight 3184,300 ,000
Berry weight 45,261 ,000
pH 11,801 ,000
°Brix 6,298 ,000
Titratable acidity 35,852 ,000
Ripening Index 13,840 ,000
Berry skin weight 21,948 ,000
Skins % 3,073 ,012
Berry seed number 6,416 ,000
Seed weight/berry 5,539 ,000
Seeds % ,675 ,709
Skin anthocyanins 26,345 ,000
Skin polyphenols 4,834 ,001
Seed polyphenols 1,217 ,323
Total polyphenols 4,816 ,001
% Skin polyphenols ,607 ,765
Anthocyans /berry 25,144 ,000
Polyphenols/berry 9,050 ,000
Table 102 a, b, c. Test of the effects between subjects (p=<0,05).
By using the data previously obtained the level of variability attributable to the different
factor was calculated (tab. 103).
For most of the parameters the variability is attributable to the thesis; the year, however,
shows more variability as concerns berry‟s and seed‟s weight, pH, seed‟s and polyphenols‟s
percentage and polyphenolic content per berry.
Titratable acidity, ripening index and anthocyanins content per berry are the parameters that
show more variability when the factor is represented by year interaction by thesis (tab. 103).
The variability quota attributed to the different factor was calculated using the data previously
obtained.

145
Variable
%
variability
due to
the thesis
%
variability
due to
the year
%
variability
due to
interaction
thesis/year
%
variability
due to
error
Bunch weight 58,47 32,14 9,39 0,00 Berry weight 33,66 41,60 24,21 0,53 pH 2,28 95,11 2,41 0,20 °Brix 59,76 21,02 16,58 2,63 Titratable acidity 3,28 33,31 61,69 1,72 Ripening Index 35,60 0,17 59,90 4,33 Berry skin weight 31,33 44,56 23,07 1,05 Skins % 34,94 16,41 36,71 11,94 Berry seed number 61,41 17,65 18,11 2,82 Seed weight/berry 49,18 22,99 23,57 4,26 Seeds % 36,11 49,64 5,74 8,50 Skin anthocyanins 50,59 17,09 31,14 1,18 Skin polyphenols 52,35 24,60 19,10 3,95 Seed polyphenols 56,10 27,37 9,08 7,46 Total polyphenols 65,32 15,97 15,49 3,22 % Skin polyphenols 13,86 62,48 8,94 14,72 Anthocyans /berry 34,81 4,21 58,64 2,33 Polyphenols/berry 20,02 38,85 37,03 4,09
Table 103. Level of variability attributable to the different factor.
From Tukey‟s statistic test it is possible to note the table with the different subsets and those
non differentiated (tab. 104-106).
The significant variables create differentiated homogenous subsets except for titratable
acidity and seed‟s polyphenols expressed by percentage (tab. 104-105).
The values obtained from the analysis of bunch‟s weight form a number of subsets equal to
the number of theses that indicate great variability in the samples tested, the mean weight of
the bunch lies between a minimum value of 167 grams and a maximum of 274 grams. Berry‟s
weight, instead, creates less homogenous subsets.
The thesis BM5, stands out from others ones, for the highest value of bunch‟s weight, of
sugary content, and of polyphenols‟s supply; besides, this thesis shows the lowest value of pH
(tab. 104-106).

146
Thesis Bunch
weight
(g)
Berry
weight
(g)
pH °Brix Ripening
Index
Berry
skin
weight
(g)
Skins
%
Berry
seed
number
Seed
weight/
berry
(g/berry)
BM 1 267,11 d 2,33 c 3,29 a 25,46 a 4,43 a 0,61 c 0,26 b 2,60 c 0,11 c
BM 2 242,82 c 1,95 b 3,33 ab 25,31 a 4,58 a 0,46 b 0,24 ab 2,16 b 0,09 b
BM 3 195,16 b 1,99 b 3,36 bc 25,62 a 4,48 a 0,47 b 0,23 ab 1,56 a 0,06 a
BM 4 274,46 e 2,25 c 3,30 a 24,97 a 4,16 a 0,48 b 0,21 a 1,87 b 0,08 ab
BM 5 166,08 a 1,60 a 3,38 c 28,62 b 5,74 b 0,40 a 0,26 b 1,93 b 0,07 ab
Table 104. Significant parameters with differentiated subsets. Tukey Test (p=0,05).
Thesis Seeds
%
Skin
anthocyanins
(mg/kg)
Seed
polyphenols
(mg/kg)
Total
polyphenols
(mg/kg)
Anthocyans /
berry
(mg/berry)
Polyphenols/
berry
(mg/berry)
Skin
polyphenols
(mg/kg)
BM 1 0,05 b 359 a 1409 a 2841 a 0,87 a 6,51 b 1433 a
BM 2 0,04 b 570 c 1261 a 2842 a 1,09 b 5,48a 1581 a
BM 3 0,03 a 473 b 1289 a 2808 a 0,93 a 5,58 a 1519 a
BM 4 0,03 ab 521 bc 1193 a 2575 a 1,15 b 5,76 a 1382 a
BM 5 0,04 b 671d 1780 b 3729 b 0,97 a 5,70 a 1949 a
Table 105. Significant parameters with different and non differentiated subsets. Tukey Test (p=0,05).
Thesis Titratable
acidity (g/L)
%Skin
polyphenols
BM 1 5,81 a 49,52 a
BM 2 5,74 a 44,53 a
BM 3 5,88 a 45,94 a
BM 4 6,04 a 46,02 a
BM 5 5,55 a 47,58 a
Table 106. Non significant parameters with different and non differentiated subsets. Tukey Test
(p=0,05).
From the multivariance analysis where factor choice is the year and the Tukey statistic test, it
appears that most of the parameters tested originate differentiated subsets, exception made for
the variables ripening index, anthocyanins‟s content per berry and percentage of skins.
The years 2009 and 2010 show the highest parameters that influence the technological
ripeness of the grapes; the highest quantities of polyphenols, instead are registered in 2011
(tab. 107).
In the year 2009 are highlighted the parameters that influence the technological ripeness of
the grapes while in the following two years higher quantities of polyphenols are registered; in
2010 stood out the parameters that influence the phenolic richness (tab. 107).

147
Variable 2009 2010 2011 Bunch weight 260,24 c 214,36 b 212,773a
Berry weight 2,29 c 1,81 a 1,97 b
pH 3,45 c 3,12 a 3,42 b
°Brix 25,44 a 26,76 b 25,80 a
Titratable acidity 5,58 a 6,31 b 5,52 a
Ripening Index 4,65 a 4,67 a 4,72 a
Berry skin weight 0,56 c 0,42 a 0,48 b
Skins % 0,24 a 0,23 a 0,25 a
Berry seed number 2,18 b 2,03 ab 1,86 a
Seed weight/berry 0,08 ab 0,07 a 0,10 b
Seeds % 0,03 a 0,04 ab 0,05 b
Skin anthocyanins 466 a 570 c 519 b
Skin polyphenols 1474 a 1538 a 1705 b
Seed polyphenols 1288 a 1529 b 1341 ab
Total polyphenols 2763 a 3068 b 3047b
% Skin polyphenols 46,91 ab 49,74 b 43,50 a
Anthocyans /berry 1,04 a 0,98 a 0,98 a
Polyphenols/berry 6,26 b 5,39 a 5,76 a
Table 107. Mean separation by multiple range test (Tukey) the comparison is among data shown in
horizontal.
In using the factorial statistic analysis it was possible to put together all the variables noted
and calculated in four new complex variables (components) so as to represent 96,19% of the
total variability of the technological characteristics of the berries at harvest (tab. 108). The
descriptors that represent the highest coefficients (tab. 109) operate in a more reliable way in
determining the characteristics of technological ripeness and phenol richness of the berries at
harvest‟s time.
Only three values present coefficients of less than 0,4 and two of them are linked to the
titratable acidity and so all the remaining operate in a more reliable way in determining the
characteristics of technological ripeness and phenol richness of the theses.
The first component is tied to the sugar content and to the seeds (expressed in mean number
per berry and in berry‟s total weight); the second, instead to the pH, to the titratable acidity, to
the bunch‟s weight and to the anthocyanins‟s content.
The seed‟s and skin‟s percentage are the variables that characterize the third component
calculated by factorial analysis while the fourth is marked by the polyphenols located in the
seeds and in the skins (tab. 109).

148
Component
Weights of rotated factors
Total %
variability %
cumulated 1 6,61 36,74 36,74
2 6,19 34,43 71,17
3 2,29 12,75 83,92
4 2,21 12,27 96,19
Table 108. Results of the factorial analysis: principal components method.
Component
1 2 3 4 Seed weight/berry ,912
Berry seed number ,901
Polyphenols/berry ,843 ,419
Berry weight ,827 ,467
Berry skin weight ,746 ,650
Anthocyans /berry ,738 -,492
Titratable acidity ,893
% Skin polyphenols ,894
Bunch weight ,938 -,048
pH ,906
Seeds % -,442 ,852
Skins % ,834
Seed polyphenols ,858
Skin anthocyanins -,928
Total polyphenols -,614 ,516
Skin polyphenols -,785 ,462
°Brix -,895
Table 109. Matrix of the rotated components (Varimax) in order of importance. Coefficient values
below 0,4 are not included as of little relevance.
Extracting only two components from all the data collected it is possible to explain 78,42 %
of the total variability (tab. 110).
In particular the first component is greatly linked to the most of the variables analysed in the
study; the second, on the other hand, to only seed‟s anthocyanins and poliphenols content.
(tab. 111).
The graph (fig. 65) shows how the descriptors that are in the same quadrant and that are close
to the ripening of the berry are directly correlated to it while those further away are correlated
negatively. The Ripening Index is indeed positively correlated with the seed‟s polyphenols,

149
and with skin‟s anthocyanins and negatively with the pH, the titratable acidity and bunch‟s
mean weight.
The first and the second component are negatively correlated with the sugar and the total
polyphenols content and with the percentage of skins and seeds.
Moreover the first component is negatively correlated with seed‟s anthocyanins and
polyphenols, while the second is negatively correlated with the acidity and the bunch‟s
weight.
Component
Weights of rotated factors
Totale % variance % cumulated
1 10,380 57,665 57,665
2 3,737 20,762 78,427
Table 110. Results of the factorial analysis extracting only the first two components: method of the
main components.
Component
1 2 Berry weight ,971
Berry skin weight ,941
Polyphenols/berry ,921
Titratable acidity ,895
Berry seed number ,883 ,419
Bunch weight ,826 -,547
pH ,789 -,567
Seed weight/berry ,775
Anthocyans /berry ,878
% Skin polyphenols ,669
Skins % -,643
Seeds % -,545
Seed polyphenols -,616
Skin polyphenols -,783 -,517
°Brix -,839
Total polyphenols -,862
Skin anthocyanins -,868 ,450
Table 111. Matrix rotated (Varimax) of the first two components extracted. Descriptors ordered in
order of importance excluding the <0,4 coefficients as of little relevance .
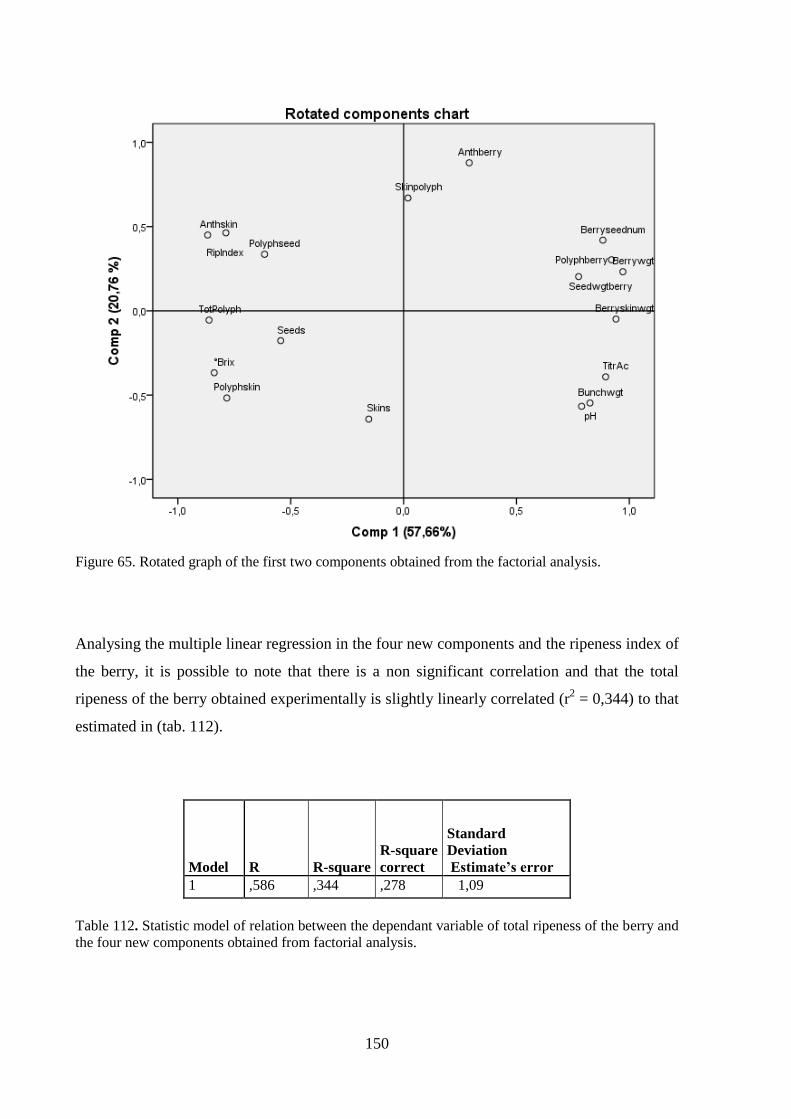
150
Figure 65. Rotated graph of the first two components obtained from the factorial analysis.
Analysing the multiple linear regression in the four new components and the ripeness index of
the berry, it is possible to note that there is a non significant correlation and that the total
ripeness of the berry obtained experimentally is slightly linearly correlated (r2 = 0,344) to that
estimated in (tab. 112).
Model R R-square R-square
correct
Standard Deviation Estimate’s error
1 ,586 ,344 ,278 1,09
Table 112. Statistic model of relation between the dependant variable of total ripeness of the berry and
the four new components obtained from factorial analysis.

151
Therefore, the total ripeness index of the berry can be expressed in the following way
(tab.113).
Ripening Index = 5,583-F1*0,528-F2*0,565+F3*0,136-F4*0,063
From the table of coefficient values for the estimation of the total ripeness of the berry, it can
be concluded that the model used is of significant importance, that the Ripening Index
variable, is more relevant with the first and second constant rather than with the third and
fourth one (tab. 113).
B
Standard
deviation
Error Sig. (Costant) 5,583 ,273 ,000
F1 -,528 ,221 ,022
F2 -,565 ,159 ,001
F3 ,136 ,215 ,530
F4 -,063 ,171 ,714
Table 113. Coefficient values for the estimation of the total ripeness estimated of the berry,
standard error and their significance.
Calculating the relation between the index ripeness expressed and that estimated statistically it
can be seen graphically how the ripeness expressed by the panel and that determined
statistically are overlapping (fig. 66).
Figure 66. The relation between the ripeness index expressed and that statistically estimated.

152
Examining the correlation between the parameters analyzed, in the table only the variables
with a probability <0,00001 are reported and the characters in bold indicate the negativity of
the value indicated.
In most cases there are values of Pearson's correlation positive, however the parameters
connected with the technological maturity of the grapes are negatively correlated.
The pH and anthocyanins‟s level per berry, are the parameters that don‟t present significant
Pearson‟s correlations (tab. 114).

153
Variable Bun.
wght
Ber.
wght °Brix
Titr.
Ac.
Rip
Ind.
Ber.
skin
wght
Ski.
%
Ber.
seed
num.
Seed
wght
/ber.
See.
%
Skin
anth.
Skin
poly.
Sees.
poly.
Tot.
polyp.
%
Skin
polyp.
Polyph
/berry F1 F2 F3 F4
Bunch
weight
0,60 0,88
Berry
weight
0,65 0,84 0,57 0,61 0,63 0,77 0,76 0,70 0,67
°Brix 0,65 0,60 0,58
Titratable
acidity
0,86
Ripening
index
0,86 0,63
Berry skin
weight
0,84 0,60 0,59 0,70 0,61 0,62 0,71
Skins % 0,63
Berry seed
number
0,57 0,59 0,61 0,66
Seed
weight/berry
0,61 0,70 0,61 0,63 0,57 0,87 0,68
Seeds % 0,06 0,63 0,91
Skin
anthocyanins
0,63 0,63 0,60
Skin
polyphenols
0,77 0,61 0,85
Seed
polyphenols
0,86 0,60 0,82
Total
polyphenols 0,60 0,76 0,85 0,86 0,59
% Skin
polyphenols
0,60 0,87
Polyphenols/
berry
0,70 0,62 0,57 0,64
Table 114. Pearson‟s correlations. Bold numbers are preceded by the minus sign. Legend abbreviations is on the previous pages.

154
Discriminant analysis on the technological and phenolic characteristics of the grapes at harvest‟s time
highlighted differences among clones examined and some of which may be distinct (fig. 67).
The first two canonical functions represent more than 90,0 % of the total variability (tab.
115).
Function Eingenvalue % of
variance % cumulated
Canonical correlation
1 21,472 68,5 68,5 0,977 2 6,831 21,8 90,3 0,934 3 2,121 6,8 97 0,824 4 ,937 3 100 0,696
Table 115. Eigenvalues of discriminant analysis.
From the centroids graph obtained from the discriminant analysis (fig. 67), it is noted that the
points relative to the groups show a limited dispersion. Three distinct groups appear in the
centroids: the first comprises the thesis BM2, BM3 e BM4 that intersect each others. The
second BM1 and the third BM5 which well differs from the other, because well detached from the
other theses.
The 100,0% of the original grouping are classified correctly, while 84,4% of the cases
grouped cross-validated are reclassified correctly (tab. 116).

155
Figure 67. Centroids obtained from the cluster analysis of the characteristics of the grapes at harvest‟s
time.
Thesis
Group expected
Totals 1 2 3 4 5 Cross-
validation a % 1 100,0 ,0 ,0 ,0 ,0 100,0
2 ,0 77,8 11,1 11,1 ,0 100,0
3 ,0 11,1 88,9 ,0 ,0 100,0
4 ,0 11,1 11,1 77,8 ,0 100,0
5 11,1 ,0 11,1 ,0 77,8 100,0
Table 116. Classification results.
a. Cross validation is done only for those cases in the analysis In cross validation, each case is
classified by the functions derived from all cases other than that case. b. 100,0% of original grouped cases correctly classified.
c. 84,4% of cross-validated grouped cases correctly classified.

156
3.9 Aroma characteristics of the grapes at harvest’s time
The analysis performed by GC-MS allowed the identification of 220 aromatic compounds;
subdivided into 147 generated by enzymatic hydrolysis and 73 by acid hydrolysis.
Among these, only compounds present in significant quantities underwent statistical analysis
and they were divided into their belonging classes (tab. 117-118).
Ratios between compounds which are reported in literature as varietal ratios of the
„Sangiovese‟ cultivar were also studied (tab. 119).
Acids Aldehydes Benzene derivates
isocrotonic acid nonanal benzaldehyde
hexanoic acid citral methyl benzoate
hexanoic acid, 2-ethyl Aliphatic alcohols acetophenone
2-hexenoic acid isoamyl alcohol ethyl benzoate
sorbic acid 1-pentanol methyl salicylate
nonanoic acid 2-buten-1-ol, 3-methyl benzaldehyde, 2,5-dimethyl
n-decanoic acid 1-hexanol 1-phenylethanol
myristic acid 3-hexen-1-ol benzyl alcohol
pentadecanoic acid trans-2-Hexenol 2-phenylethanol
2,6 dimetil 6-hydroxy-2,7
octadienoic-acid
1-octen-3-ol
benzenepropanol
hexadecanoic acid octanol β-phenoxyethyl alcohol
stearic acid 4-octen-2,7-diol 2-(4-methoxyphenyl)ethanol
oleic acid 6-methoxy-3-methylbenzofuran
linoleic acid benzoic acid
abscisic acid 3',5'-dimethoxyacetophenone
3,4-dimethoxybenzyl alcohol
cinnamic acid
2,3,4-trimethoxybenzyl alcohol
Table117a.Compounds released by enzymatic hydrolysis (heterosides, ET1).

157
Esters Norisoprenoids
dimethyl succinate actinidol A
palmitic acid, methyl ester actinidol B
methyl palmitoleate 3,4-diidro-3-oxo- -ionol I
methyl stearate 3,4-diidro-3-oxo- -ionol II
methyl linoleate 3,4-diidro-3-oxo- -ionol III
methyl linolenate 3-hydroxy- β-damascone
methyl n-pentadecanoate 3-oxo- -ionol
fumaric acid, ethyl 2-methyl allyl ester
2,3-dehydro-4-oxo-7,8-dihydro- β-ionone
Monoterpenols methyl- β-ionone
linalool oxide A blumenol C
linalool oxide B 3-hydroxy-7,8-dihydro- β-ionol
linalool vomifoliol
-terpineol 7,8 dihydrovomifoliol
linalool oxide C (epoxylinalol) Phenols
linalool oxide D (epoxylinalol) guaiacol
citronellol phenol
myrtenol 4-vinylguaiacol
nerol eugenol
isogeraniol methoxyeugenol
geraniol phenol, 3,4,5-trimethoxy
exo-2-hydroxycineole coniferol 1
p-mentha-1,8-dien-6-ol coniferol 2
diol 1 Vanillins
p-cymen-7-ol vanillin
diol 2 methyl vanillate
2,3-pinanediol acetovanillone
trans-8-hydroxy-linalool homosyringic acid
p-menth-8-en-3-ol (isopulegol) zingerone
cis-8- hydroxy-linalool homovanillic alcohol
geranic acid 3,4,5-trimethoxybenzyl alcohol
p-menth-1-ene-7,8-diolo homovanillic acid
acetosyringone
Table117b.Compounds released by enzymatic hydrolysis (heterosides 1, ET1).

158
Alcohols monoterpenols Norisoprenoids
linalool trimethyl-dihydro-naphtalene (TDN)
1-terpinenol calamenene
4-terpineol -calacorene
hotrienol TDN 2
myrcenol 1,1,6,8-tetramethyl-1,2-dihydro-naphthal
cis-β-terpineol naphthalene, 1,4,6-trimethyl-
ocimenol 1 biphenyl, 4-isopropyl-
-terpineol cadalene
-terpineol Alcohols + ethers norisoprenoids
ocimenol 2 vitispiran 1
2-cyclohexene-1-methanol, 2,6,6-trimethyl- vitispiran 2
citronellol riesling acetale
nerol lanceol, cis
geraniol actinidol A
exo-2-hydroxycineole actinidol B
p-menth-1-en-9-ol OH-TDN
p-mentha-1,8-dien-6-ol -eudesmol
p-mentha-1,4-dien-7-ol -cadinol
Hydrocarbon monoterpenols -ionol
-terpin 1,2-naphthalenediol, 1,2,3,4-tetrahydro
-terpin 1-naphthalenol, 1,2,3,4-tetrahydro
terpinolene Ketones norisoprenoids
spiro[4.4]nona-1,6-diene 4-(2,4,4-trimethyl-cyclohexa-1,5-dienyl)
Oxides monoterpenols β-damascenone
2H-pyran, 2-ethenyltetrahydro-2,6,6-
trimethyl
ethanone, 1-(2,3-dihydro-1,1-dimethyl-1H
1,4-cineol
4-(2,6,6-trimethylcyclohexa-1,3-dienyl)but-
3-en-2-one
furan, tetrahydro-2,2-dimethyl mansonone C
trans-rose oxide 1.4,4,5,8-tetramethyl-4H-chromene
cis -rose oxide 4-(2,3,6-trimethylphenyl)-2-butanone
limonene oxide megastigmatrienone
linalool oxide A
1,4-hexadien-3-one, 5-methyl-1-[2,6,6-
trimethyl-2,4-cyclohexadien-1-yl]-
linalool oxide B 3,3,5,6-tetramethyl-1-indanone
2H-pyran, 3,6-dihydro-4-methyl-2-(2-
methyl-1-propenyl)-(nerol oxide 1)
2H-pyran, 3,6-dihydro-4-methyl-2-(2-
methyl-1-propenyl)-(nerol oxide 2)
3,6-dimethyl-2,3,3a,4,5,7a-
hexahydrobenzofuran
Table 118.Compounds released by acid hydrolysis (heterosides 2, ET2).

159
Linalool oxA/linalool oxB >1 (enzymatic hydrolysis)
Linalool oxC/linalool oxD >1 (enzymatic hydrolysis)
Linalool/geraniol < 1 (enzymatic hydrolysis)
Trans 8-OH Linalool/cis 8-OH linalool >1 (enzymatic hydrolysis)
Trans 8-OH Linalool + cis 8-OH linalool/p-menth-1en-7,8-diol >1
(enzymatic hydrolysis)
3-hydroxy β-damascenone/3-oxyde α-ionol <1 (enzymatic hydrolysis)
Linalool oxA/linalool oxB >1 (acid hydrolysis)
Table 119. Ratios between compounds.
The aromatic compounds, underwent MANOVA, factorial, discriminating and correlating
statistical analysis (tab. 120).
Abbreviation Variable M.U.
Aliph. Alc. ET1 Aliphatic alcohols (enzymatic hydrolysis) ng/g
Der. Benzene ET1 Benzene derivates (enzymatic hydrolysis) “
Phenols ET1 Phenols (enzymatic hydrolysis) “
Vanillins ET1 Vanillins (enzymatic hydrolysis) “
Monoterp. ET 1 Monoterpenols (enzymatic hydrolysis) “
Norisopren. ET1 Norisoprenoids (enzymatic hydrolysis) “
Aldehydes ET1 Aldehydes (enzymatic hydrolysis) “
Acids ET1 Acids (enzymatic hydrolysis) “
Esters ET1 Esters (enzymatic hydrolysis) “
Hydro. monot. ET2 Hydrocarbon monoterpenols (acid hydrolysis) “
Oxi. monot. ET2 Oxides monoterpenols (acid hydrolysis) “
Alc. monot. ET2 Alcohols monoterpenols (acid hydrolysis) “
Hydr. norisopr. ET2 Hydrocarbon norisoprenoids (acid hydrolysis) “
Ket. norisopr. ET2 Ketones norisoprenoids (acid hydrolysis) “
Alc. norisopr. + Ether ET2 Alcohols + ethers norisporenoids (acid hydrolysis) “
Heterosides 1 Compounds released by enzymatic hydrolysis “
Heterosides 2 Compounds released by acid hydrolysis “
Total Compounds released by enzymatic and acid hydrolysis “
V158 Linalool oxA /linalool oxB (enzymatic hydrolysis) n
V159 Linalool oxC /linalool oxD “
V161 Linalool/geraniol “
V162 Trans 8-OH linalool/cis 8-OH linalool “
V165 Trans 8-OH linalool + cis 8-OH linalool/p-menth -1ene-7,8-
diol “
V166 3-hydroxy β-Damascenone/3-oxide α-ionol “
V167 Linalool oxA /linalool oxB (acid hydrolysis) “
Table 120. List of abbreviations used in the text.

160
The MANOVA analysis variance was conducted studying the significance of the variables in
function of the factor choice (tab. 121).
Factor Dipendent variable F Sign.
Year Aliph. alc. ET1 0,371 ,691
Der. benzene ET1 29,313 ,000
Phenols ET1 2,738 ,069
Vanillins ET1 5,599 ,005
Monoterp. ET 1 2,413 ,095
Norisopren. ET1 11,626 ,000
Aldehydes ET1 8,097 ,001
Acids ET1 138,683 ,000
Esters ET1 9,283 ,000
Hydro. monot. ET2 23,965 ,000
Oxi. monot. ET2 27,172 ,000
Alc. monot. ET2 6,778 ,002
Hydr. norisopr. ET2 17,320 ,000
Ket. norisopr. ET2 15,929 ,000
Alc. norisopr. + Ether ET2 4,639 ,012
Heterosides 1 8,286 ,000
Heterosides 2 26,103 ,000
Total 26,103 ,000
V158 9,351 ,000
V159 8,722 ,000
V161 35,769 ,000
V162 43,580 ,000
V165 1,498 ,228
V166 9,688 ,000
V167 43,963 ,000
Table 121. Test of the effects between subjects (p=<0,05).
In the interaction thesis by year, all the aromatic classes of the compounds (tab. 120) and the
ratios between aromatic compounds, resulted statistically notable, therefore they have not
been recorded on the table (tab. 121). However, if the year is the factor in the statistic
analysis, some parameters are not statistically important, i.e: aliphatic alcohols, phenols,
monoterpenols from enzymatic hydrolysis and the ratio trans 8-OHlinalool+cis8-
OHlinalool/p-menth-1 en-7,8-diol.
Using data previously obtained the amount of the variability attributed to the different factor
was calculated (tab. 122).

161
Variability is equally attributable to the thesis and to the year as shown in the table 6, more
precisely, the compounds, originating from enzymatic hydrolysis except for aldehydes and
acids, and 3- hydroxy β-damascenone/3-oxide α-ionol and linalool oxA/linalool oxB (acid
hydrolysis) have a greater variability due to the thesis, while the compounds originating from
acid hydrolysis and the other ratios are strongly influenced by the year effect. Aldehydes,
esters and the total of heterosides 1 and hydrocarbon monoterpenols and norisoprenoids for
the heterosides 2, show comparable levels of variability due to thesis and year (tab. 122).
Variable
%
variability
due to
the thesis
%
variability
due to
the year
%
variability
due to the
interaction
thesis/ year
%
variability
due to
error
Aliph. alc. ET1 74,53 1,75 19,01 4,72
Der. benzene ET1 51,86 37,56 9,29 1,28
Phenols ET1 44,97 11,84 38,87 4,32
Vanillins ET1 66,23 18,95 11,43 3,38
Monoterp. ET 1 52,83 20,05 18,81 8,31
Norisopren. ET1 31,20 55,47 8,56 4,77
Aldehydes ET1 40,39 37,95 16,98 4,69
Acids ET1 37,18 52,82 9,62 0,38
Esters ET1 41,30 42,03 12,14 4,53
Hydro. monot. ET2 47,77 44,25 6,13 1,85
Oxi. monot. ET2 34,90 57,56 5,42 2,12
Alc. monot. ET2 59,92 21,37 15,56 3,15
Hydr. norisopr. ET2 42,38 47,12 7,77 2,72
Ket. norisopr. ET2 27,62 56,29 12,55 3,53
Alc. norisopr. + Ether ET2 64,49 20,91 10,09 4,51
Heterosides 1 37,79 37,51 20,17 4,53
Heterosides 2 27,05 62,65 7,90 2,40
Total 27,05 62,65 7,90 2,40
V158 38,00 39,01 18,82 4,17
V159 22,75 42,49 29,89 4,87
V161 33,03 56,29 9,11 1,57
V162 17,53 70,43 10,42 1,62
V165 37,38 19,93 29,38 13,31
V166 47,28 15,62 35,49 1,61
V167 11,25 80,28 6,64 1,83
Table 122. Level of variability attributable to the different factor.

162
Using Tukey test, it is possible to note that all the parameters analyzed have given rise to
homogenous differentiated subsets (tab. 123-125).
The significant variables that create less differentiated homogenous subsets are the
compounds from the esters classis obtained from the enzymatic way and the ratio linalool
oxA /linalool oxB obtained, instead, from the acid hydrolysis.
Within the compounds freed by the enzymatic way the families of the benzene derivatives and
of the norisoprenoids classes are more present in theses while the aldehydes are quantitatively
lower; from a concentration of hundreds of ng/g fresh vegetal tissue weight to values close to
the unit (tab. 123).
Hydrocarbon norisoprenoids and monoterpenols are the classes that are more and less
represented in the hydrolyzing of aromatic compounds by acid way (tab. 124).
Comparing the theses, the „Chianti Colline Pisane‟ thesis is quite distinct from the others for
the quantitative inferior values of most of the aromatic classes. Samples from the province of
Siena, however, have a higher aroma content: benzene derivatives, phenols, vanillins, and
aldehydes. As for enzymatic hydrolysis and hydrocarbon and monoterpenol oxides for the
acid one, are more present in the „Chianti Classico‟ area while the rest are found in the area of
the „Brunello di Montalcino‟. In the province of „Grosseto‟,the „Morellino di Scansano‟ thesis
differs from the others for the highest levels of monoterpenol alcohols, while two thesis from
„Montecucco‟ for the lowest in phenols and aldehydes. The benzene derivatives class is that
with the most variability within the theses. Analyzing the total quantity of aromatic
compounds, those freed by enzymatic hydrolysis are more present in a thesis of the „Brunello
di Montalcino‟ and scarcely present in a „Montecucco‟ thesis, while those freed by acid
hydrolysis are more present in the province of Siena and more precisely in the „Chianti
Classico‟ and in a limited way in the „Chianti Colline Pisane‟ thesis (tab. 123-125).
As can be seen from all the ratios examined there is perfect harmony in the results and in the
values obtained by other authors for the „Sangiovese‟ cultivar (Di Stefano, 1998 et Lanati
2001) The first and second ratio regarding the linalool oxides are completely favourable to the
trans form compounds compared to the cis one; the linalool/geraniol ratio is much less than
one in the grapes with a low linalool concentration (tab. 125).

163
Thesis Aliph.
alc .
Benz
der
Phenols Vanillin Monoterp Norisopr. Aldehyd Acids Esters
CCP 1 51,54 a 281,29 a 44,80a 74,36 a 62,98 a 138,22 a 1,57 ab 55,41abc 14,03a
MC 1 140,95 def 481,98 abc 64,00 a 126,85abc 114,62 a-d 247,61 abc 1,15 a 71,87 ad 11,79a
MC 2 121,62 cd 423,82ab 38,04 a 99,19 ab 68,54 a 168,92 a 2,49 bc 77,45 ad 12,54a
MC 3 173,35 f 606,54bcd 96,92ad 164,31 be 111,47 a-d 297,80 a-e 2,84 c 106,38cd 10,95a
MC 4 164,52 ef 586,38 bcd 92,39abc 166,82 be 111,35 a-d 274,33 a-d 2,28 abc 114,98de 23,26a
MC 5 148,38def 522,82 abc 68,05 a 140,78 ad 106,16 a-d 205,01 abc 1,34 ab 84,11 ad 31,92ab
MC 6 95,50bc 592,49 bcd 175,16de 186,32cde 135,44cd 359,33 b-e 6,14 d 48,8 ab 17,65 a
MS 1 133,26 cde 800,35 de 207,40 e 186,24cde 114,22 a-d 435,53de 6,34 d 39,52 a 20,59 a
BM 1 160,58def 441,89 ab 65,19 a 125,95abc 91,09 abc 242,10 abc 2,22 abc 101,77bcd 15,60 a
BM 2 140,38 def 437,87 ab 59,21 a 120,85abc 66,11a 165,83 a 2,89 c 52,98 abc 11,04 a
BM 3 151,84 def 471,26 abc 52,60 a 111,11abc 75,28 ab 220,42 abc 1,50 ab 86,85 a-d 11,85 a
BM 4 132,60 cde 504,47 abc 71,27 ab 117,05abc 72,52ab 234,71 abc 2,49 bc 79,96 a-d 8,45 a
BM 5 268,26 g 815,22 de 115,79ad 213,84 de 147,66 d 463,41 e 3,42 c 162,38 e 13,38 a
BM 6 96,15 bc 695,46 cde 206,09 e 185,23 be 123,46bcd 481,85 e 8,11 e 39,21 a 5,38a
BM 7 74,96 ab 501,81abc 157,06cde 230,41 e 136,10 cd 388,56 cde 7,03 de 115,72 de 73,12 b
CC 1 132,28 cde 888,43 e 288,65 f 183,45 be 96,65 a-d 377,42 b-e 8,14 e 60,62 abc 26,62 a
CC 2 68,50 ab 575,22bcd 150,32 be 187,16cde 71,27ab 201,86 ab 6,42 d 68,84 a-d 17,56 a
Table 123. Significant parameters with different subsets; heterosides 1. Tukey Test (p=0,05).
Thesis
Hydroc.
monot.
Oxid.
monot.
Alc.
monot.
Hydr.
norisopr.
Ket.
norisopr.
Alc.
norisopr. +
Ethers
CCP 1 0,21 ab 2,19 ab 2,02 a 6,65a 2,42 a 10,61 a
MC 1 0,46 b-g 4,12 de 4,76 b-g 31,01d-g 4,66 ab 30,89 de
MC 2 0,41 a-e 4,08 cde 3,72 ab 26,91 b-g 7,78 a-d 21,78 a-d
MC 3 0,27 abc 3,30 bcd 4,65 b-f 13,95a-d 5,60abc 15,58ab
MC 4 0,26 ab 3,17 a-d 4,07 bcd 19,95 a-f 5,39 abc 16,98 abc
MC 5 0,21 ab 2,31 abc 3,33 ab 11,64 ab 2,55 a 12,06 a
MC 6 0,73 gh 6,06 f 6,43 fg 32,60 efg 9,70 bcd 33,59 e
MS 1 0,58 c-g 3,70 bcd 6,58 g 17,42 a-e 11,90 de 19,57 a-d
BM 1 0,36 a-d 2,86 a-d 3,19 ab 21,10 a-g 6,29 a-d 19,58 a-d
BM 2 0,12 a 3,24 bcd 3,03 ab 22,28 a-g 6,21 a-d 15,67 ab
BM 3 0,42 a-f 3,06 a-d 3,03 ab 19,79 a-f 5,10 abc 16,20 ab
BM 4 0,24 ab 1,40 a 1,97 a 12,66 abc 3,63 a 10,20 a
BM 5 0,72 fgh 4,13 de 5,59 c-g 36,15 fg 10,64 cd 36,62 e
BM 6 0,69 fgh 3,75 bcd 4,31 b-e 22,20 a-g 5,75 abc 29,92 de
BM 7 0,62 d-g 3,72 bcd 3,87 bc 30,29 c-g 6,73 a-d 25,68 b-e
CC 1 1,01 h 5,78 ef 5,91 d-g 39,61 g 17,23 e 29,82 de
CC 2 0,75gh 7,78 g 5,96 efg 39,74 g 16,67 e 28,01 cde
Table 124. Significant parameters with different subsets; heterosides 2. Tukey Test (p=0,05).

164
Thesis
Heter.
1
Heter.
2
Total V158 V159 V161 V162 V165 V166 V167
CCP 1 1155,23ab 24,22 a 1179,45abc 1,15 a 8,22 bc 0,14 f 1,43 a 11,75de 0,05abc 2,55 a
MC 1 1299,30abc 75,9 dg 1375,23 ad 1,29ab 6,95abc 0,04ab 2,68 e 2,25 ab 0,03 ab 2,49 a
MC 2 1046,24 a 64,70bg 1110,94 a 1,26ab 9,51 c 0,07ad 2,76 e 1,76 a 0,06 ad 3,19 a
MC 3 1624,16 af 43,37ad 1667,54 af 1,32abc 7,63abc 0,0 abc 2,48 de 1,68 a 0,05 ad 2,86 a
MC 4 1583,01 ae 49,84ad 1632,85 ag 1,40 ad 8,64 bc 0,05 bc 2,22 be 1,87ab 0,06 ad 2,91a
MC 5 1349,30abc 32,12abc 1381,42 ad 1,41 ad 7,48abc 0,04 ab 2,65 e 1,86 ab 0,04abc 2,73 a
MC 6 1688,44 af 89,1 efg 1777,58 bg 1,33abc 6,31 ab 0,12def 1,55 ab 5,50 bc 0,03 ab 2,94 a
MS 1 2010,67def 59,76 bf 2070,43efg 1,41 ad 6,40 ab 0,12 ef 1,36 a 2,51 ab 0,03 ab 2,59a
BM 1 1304,84abc 54,54 ae 1359,38 ad 1,42 ad 6,77abc 0,08 be 1,63abc 1,95 ab 0,05 ad 4,67 a
BM 2 1098,24ab 50,59 ad 1148,86 ab 1,59 cd 7,89abc 0,05abc 2,23 be 1,93ab 0,09 d 2,77 a
BM 3 1225,09 ab 47,69 ad 1272,77abc 1,47bcd 8,70 bc 0,04 ab 2,18 be 1,40 a 0,06 ad 4,97a
BM 4 1260,88 ab 30,12ab 1290,99abc 1,45bcd 8,44bc 0,05 ab 1,74 ad 1,50 a 0,07 cd 2,79 a
BM 5 2277,13 f 93,86 fg 2370,99 g 1,32abc 8,07abc 0,03 a 2,2 cde 2,29 ab 0,04abc 2,62a
BM 6 1927,83 cf 66,63 cg 1994,46 dg 1,47bcd 7,28abc 0,05abc 1,87 ad 2,20 ab 0,02 a 39,46b
BM 7 1754,55 bf 70,93 dg 1825,48 cg 1,68 d 5,32 a 0,06abc 2,46 de 2,08ab 0,05abc 36,03b
CC 1 2157,71 ef 99,38 g 2257,09 fg 1,47bcd 8,61 bc 0,08 a-e 1,22 a 14,77e 0,02 a 70,54b
CC 2 1394,84 ad 98,93 g 1493,78 ae 1,51bcd 12,53d 0,01 cf 1,31 a 8,70 cd 0,06bcd 2,75a
Table 125. Significant parameters with different subsets; heterosides 1, 2 and ratios. Tukey Test
(p=0,05).
From the multivariate analyses, choosing the year as the factor and the Tukey test, it emerged
that most of the parameters examined originated differentiated subsets in particular in the year
2011 (tab. 126). The year 2010 that stands out as having the highest level of aromatic families
with the exception of aliphatic alcohols (enzymatic hydrolysis) which were quantitatively
higher the year before. The aromas found in the 2011 harvest were mainly the phenols,
vanillins, aldehydes, esters, hydrocarbon and ketones norisoprenoids classes even if the values
were quantitatively similar to those of the other years.
Variable 2009 2010 2011
Aliphatic alcohols ET1 145,40 b 140,13 b 112,36 a
Benzene derivates ET1 549,54 a 605,50 a 543,90 a
Phenols ET1 99,23 a 114,12 ab 131,28 b
Vanillin ET1 141,28 a 158,10 a 162,06 a
Monoterpenols ET 1 94,53 a 117,60 b 88,74 a
Norisoprenoids ET1 251,96 a 337,91 b 275,35a
Aldehydes ET1 2,80 a 3,66 b 5,26 c
Acids ET1 73,10 a 96,20 b 71,92 a
Esters ET1 13,70 a 17,24 a 26,54 a
Hydroc. monot. ET2 0,32 a 0,56 b 0,55 b

165
Variable 2009 2010 2011
Oxid. monot. ET2 3,61 a 4,25 b 3,55 a
Alc. monot. ET2 3,78 a 4,10 b 4,01 a
Hydr. norisopr. ET2 16,96 a 26,68 b 27,80 b
Ket. norisopr. ET2 6,56 a 7,42 ab 8,65 b
Norisopr. alc.+ Ether ET2 13,05 a 27,12 b 25,61 b
Heterosides 1 1444,55 a 1722,22 b 1449,24 a
Heterosides 2 44,32 a 71,04 b 70,24 b
Total 1488,88 a 1793,27 b 1519,48 a
V158 1,34 a 1,49 b 1,40 a
V159 1,34 a 1,49 b 1,40 a
V161 0,08 b 0,09 b 0,04 a
V162 1,87 b 1,62 a 2,53 c
V165 5,00 b 3,33 a 3,32 a
V166 0,06 b 0,03 a 0,06 b
V167 7,56 a 10,93 ab 14,84 b
Table 126. Mean separation by multiple range test (Tukey) the comparison is among data shown in
horizontal.
Using the factorial statistics analysis it was possible to collect all the variables found and
calculated into four new complex variables (components) to represent 96,62% of the total
variability of the aromatic characteristics of the berries at harvest (tab. 127). The first
component is linked to most of the variables studied: to the variables that indicate varietal
ratios except for linalool/geraniol, to many of the families belonging to the heterosides 1, to
the total, between the heterosides 2, to the hydrocarbon and alcohols monoterpenols. The sum
of linalool/geraniol, the aromatic classes freed by acid hydrolysis not previously mentioned
and the aliphatic alcohols from the enzymatic hydrolysis characterize the second component.
The third is linked to the esters and to the acids from the heterosides 1, and the fourth, only to
vanillin from the enzymatic hydrolysis (tab. 128).
Component
Weights of rotated factors
Total
%
variability
%
cumulated
1 15,39 51,16 51,16
2 9,38 31,26 82,42
3 2,35 7,84 90,26
4 1,91 6,36 96,62
Table 127. Results of the factorial analysis: pricipal components method.

166
Component
1 2 3 4
Total ,987
Ketones norisoprenoids ET2 ,983
Hydrocarbon norisoprenoids ET2 ,980
Heterosides 2 ,979
Aliphatic alcohols ET1 -,863
Esters ET1 ,939
Heterosides 1 ,986
Benzene derivates ET1 ,972
Norisoprenoids ET1 ,935
V162 ,935
V167 ,902
Phenols ET1 ,882
Aldehydes ET1 ,873 -,402
Monoterpenols ET 1 ,741 ,464
Alcohols monoterpenols ET2 ,713 ,499
Hydrocarbon monoterpenols ET2 ,702 ,676
Vanillin ET1 ,479 ,511 ,687
Acids ET1 ,465 ,440 ,702
Alcohols + ethers norisoprenoids ET2 ,451 ,804
V161 -,490 ,858
Oxides monoterpenols ET2 -,570 ,755
V165 -,789 -,461
V159 -,856 ,404
V158 -,875
V166 -,986
Table 128. Matrix of the rotated components (Varimax) in order of importance. Coefficient values
below 0,4 are not included as of little relevance.
By extracting only two of the components from the total data it is possible to explain 87,49%
of the total variability (tab. 129). The first component is linked to the variables that represent
the ratios between specific aromas and those of the heterosides 1, while the second to the
heterosides 2 (tab. 130).
On the graph (fig. 68) it is possible to see how the descriptors that are found in the same
quadrant are directly correlated while those further away are correlated negatively. Both
components are negatively correlated to the ratio trans 8-OH linalool+cis 8-OH linalool/p-
menth-1ene-7,8-diol. Furthermore, the first component is negatively correlated to other ratios
between specific components except trans 8-OH linalool/cis 8-OH linalool and linalool oxA/
linalool oxB coming from acid hydrolysis, the esters of the heterosides 1, the total of the
components obtained by acid hydrolysis and the hydrocarbon norisoprenoids and oxides
monoterpenols classes. The second component, is negatively correlated with the sum of the

167
freed components by enzymatic hydrolysis, aliphatic alcohols, benzene derivatives, aldehydes
and the trans 8-OH linalool/cis 8-OHlinalool (fig. 68).
Component
Weights of rotated factors
Total
%
variance
%
cumulated
1 15,51 51,69 51,69
2 10,74 35,81 87,49
Table 129. Results of the factorial analysis extracting only the first 2 components: method of the
principal components.
Variable Component
1 2
Total ,998
Aliphatic alcohols ET1 -,950
Heterosides 2 ,949
Ketones norisoprenoids ET2 ,919
Hydrocarbon norisoprenoids ET2 ,893
Esters ET1 ,555
Heterosides 1 ,997
Benzene derivates ET1 ,959
Norisoprenoids ET1 ,958
V162 ,923
V167 ,913
Phenols ET1 ,906
Aldehydes ET1 ,850 -,457
Monoterpenols ET 1 ,798 ,441
Alcohols monoterpenols ET2 ,750 ,592
Hydrocarbon monoterpenols ET2 ,684 ,595
Vanillin ET1 ,545 ,672
Acids ET1 ,525 ,670
Alcohols + ethers norisoprenoids
ET2 ,470 ,858
V161 -,492 ,830
Oxides monoterpenols ET2 -,551 ,805
V165 -,801 -,493
V159 -,818
V158 -,853 ,460
V166 -,978
Table 130. Matrix rotated (Varimax) of the first two components extracted. Descriptors ordered in
order of importance excluding the <0,4 coefficients as of little relevance.

168
Figure 68. Rotated graph of the first two components obtained from the factorial analysis.
Considering the correlation between the parameters analyzed, only the variables characterized
by a probability < 0,00001 were reported on the table. Pearson‟s significant correlations are
mostly positive while those linked to the variables expressing the ratios between single
aromatic components are negative. Correlations close to the unit value are present between
the value of the heterosides 1 and the content of the benzene derivatives and norisoprenoids
while the heterosides 2 are strictly linked to those of hydrocarbon norisoprenoids and alcohols
plus ether monoterpenols classes. Pearson‟s correlations among ratios and others variables
aren‟t so significant (tab. 131).

169
Aliph.
Alc
ET1
Benz.
Der.
ET1
Phen
ET1
Van.
ET1
Mon.
ET 1
Nor.
ET1
Ald.
ET1
Acid
ET1
Est.
ET1
Hydr.
Monot
ET2
Oxid
Monot.
ET2
Alc.
Monot
ET2
Hydr.
Noris.
ET2
Ket.
Noris.
ET2
Alc+Et.
Noris.
ET2
Heter.
1
Heter.
2 Tot.
Aliph. Alc.ET1 0,37 0,54 0,34 0,33
Benz. Der
ET1
0,37 0,78 0,62 0,42 0,78 0,39 0,31 0,92 0,92
Phenols
ET1
0,78 0,73 0,43 0,79 0,64 0,52 0,39 0,45 0,31 0,83 0,32 0,83
Vanillins
ET1
0,62 0,73 0,58 0,77 0,40 0,32 0,39 0,32 0,77 0,78
Monoterpenols
ET 1
0,42 0,43 0,58 0,58 0,40 0,32 0,40 0,38 0,59 0,60
Norisoprenoids
ET1
0,78 0,79 0,77 0,58 0,47 0,40 0,34 0,90 0,90
Aldehydes
ET1
0,39 0,64 0,40 0,47 0,49 0,35 0,44 0,38 0,41 0,37 0,43
Acids ET1 0,54 0,32 0,40 0,33 0,37 0,36
Esters ET1 0,33
Oxid.
Monot. ET2
0,35 0,61 0,71 0,72 0,66 0,59 0,76
Alcohols
Monot. ET2
0,39 0,40 0,65 0,71 0,61 0,63 0,67 0,73
Hydrocarbon
Norisop.ET2
0,69 0,72 0,61 0,73 0,84 0,97
Ketones
Norisop.ET2
0,45 0,44 0,61 0,66 0,63 0,73 0,55 0,77 0,26
Alcoh.+ Eters
Norisop.ET2
0,31 0,32 0,38 0,34 0,38 0,77 0,59 0,67 0,84 0,55 0,92 0,32
Heterosides 1 0,34 0,92 0,83 0,77 0,59 0,90 0,41 0,37 0,38
Heterosides 2 0,32 0,37 0,78 0,76 0,73 0,97 0,77 0,92
Total 0,33 0,92 0,83 0,78 0,60 0,90 0,43 0,36 0,42 0,34 0,32
Table. 131 Pearson‟s correlations. Legend abbreviations is on the previous pages.

170
The Stepwise discriminant analysis gave the best results compared to the traditional method;
analysis of the most relevant variables for statistics purposes were inserted in stepwise (tab.
132).
Aliphatic alcohols (enzymatic hydrolysis)
Linalool oxA/linalool oxB (acid hydrolysis)
Trans 8-OH linalool + cis 8-OH linalool/p-menth -1ene-7,8-diol
Ketones norisoprenoids (acid hydrolysis)
Compounds released by enzymatic hydrolysis
Benzene derivates (enzymatic hydrolysis)
Aldehydes (enzymatic hydrolysis)
Vanillins (enzymatic hydrolysis)
Table 132. Variables inserted in the analysis.
Discriminating analysis on the aroma characteristics of the berries at harvest has highlighted
differences in the winegrowing areas examined, some of these are distinct (fig. 64). In
particular the first two functions explain over 60% of total variability (tab. 133).
Function Eingenvalue
% of
variance
%
cumulated
Canonical
correlation
1 34,702 48,6 48,6 ,986
2 10,145 14,2 62,8 ,954
3 7,885 11,0 73,9 ,942
4 5,592 7,8 81,7 ,921
5 3,680 5,2 86,9 ,887
6 2,809 3,9 90,8 ,859
7 2,193 3,1 93,9 ,829
8 1,541 2,2 96,0 ,779
9 1,231 1,7 97,8 ,743
10 ,773 1,1 98,8 ,660
11 ,363 ,5 99,3 ,516
12 ,170 ,2 99,6 ,381
13 ,155 ,2 99,8 ,367
14 ,076 ,1 99,9 ,265
15 ,065 ,1 100,0 ,247
Table 133. Eigenvalues of discriminant analysis.

171
Looking at the graph (fig. 69) of the centroids obtained from the discriminating analysis data
subdivided by area (tab. 134), one thesis in the „Chianti Classico‟ area stands out. The other
thesis are close to one another and some points overlap. The two „Montecucco‟ theses do not
appear very close differently from those of the „Brunello and Montalcino‟. In the „Chianti
Classico‟ the two theses are very different. 100% of the original cases grouped are correctly
classified (tab. 135).
Area Denomination area Estate
1 Colline Pisane Beconcini
2 Montecucco Collemassari
3 Montecucco Salustri
4 Morellino di Scansano Fattoria di Magliano
5 Brunello di Montalcino Col D'Orcia
6 Brunello di Montalcino Casanova di Neri
7 Brunello di Montalcino La Mannella
8 Chianti Classico Capannelle
9 Chianti Classico Castello di Albola
Table 134. Area subdivision.
Figure 69. Centroids obtained from the cluster analysis of the aromatic characteristics of the
grapes at harvest‟s time.
Area

172
Thesis
Group expected
Total 1 2 3 4 5 6 7 8 9
Cro
ss-v
alid
atoa
% 1 100,0 ,0 ,0 ,0 ,0 ,0 ,0 ,0 ,0 100,0
2 ,0 100,0 ,0 ,0 ,0 ,0 ,0 ,0 ,0 100,0
3 ,0 ,0 100,0 ,0 ,0 ,0 ,0 ,0 ,0 100,0
4 ,0 ,0 ,0 100,0 ,0 ,0 ,0 ,0 ,0 100,0
5 ,0 ,0 ,0 ,0 100,0 ,0 ,0 ,0 ,0 100,0
6 ,0 ,0 ,0 ,0 ,0 100,0 ,0 ,0 ,0 100,0
7 ,0 ,0 ,0 ,0 ,0 ,0 100,0 ,0 ,0 100,0
8 ,0 ,0 ,0 ,0 ,0 ,0 ,0 100,0 ,0 100,0
9 ,0 ,0 ,0 ,0 ,0 ,0 ,0 ,0 100,0 100,0
Table 135. Classification results.
a. Cross validation is done only for those cases in the analysis in cross validation, each case is
classified by the functions derived from all cases other than that case.
b. 100,0% of original grouped cases correctly classified.
c. 100,0% of cross-validated grouped cases correctly classified.
Statistics analysis was also carried out on the aromatic compounds to study the characteristics
and possible important statistical differences of the grapes from the theses belonging to the
same Denomination of Origin. This is the case of to „Montecucco‟ area where multivariate,
factorial, discriminating and correlation analyses were carried out.
In addition, among the theses coming from the area of „Montalcino‟ was also studied the case
of „Col D'Orcia‟ estate in order to study in detail the clone effect grown in the same site of
cultivation.

173
3.9.1. ‘Montecucco’ area
MANOVA analysis was conducted studying the significance of the variables in function of
the factor choice (tab. 136).
Factor Dipendent variable F Sig. Factor Dipendent variable F Sig. Year Aliph. alc. ET1 0,22 ,804 Thesis*
Year Aliph. alc. ET1 1,07 ,413
Der. benzene ET1 52,55 ,000 Der. benzene ET1 5,69 ,000
Phenols ET1 7,81 ,002 Phenols ET1 3,73 ,002
Vanillins ET1 0,00 ,998 Vanillins ET1 2,13 ,049
Monoterp. ET 1 0,68 ,514 Monoterp. ET 1 4,41 ,000
Norisopren. ET1 8,14 ,001 Norisopren. ET1 4,96 ,000
Aldehydes ET1 5,48 ,009 Aldehydes ET1 3,47 ,003
Acids ET1 101,53 ,000 Acids ET1 9,87 ,000
Esters ET1 0,16 ,850 Esters ET1 2,16 ,045
Hydro. monot. ET2 2,81 ,074 Hydro. monot. ET2 4,35 ,001
Oxi. monot. ET2 3,07 ,059 Oxi. monot. ET2 3,49 ,003
Alc. monot. ET2 14,21 ,000 Alc. monot. ET2 12,06 ,000
Hydr. norisopr.
ET2 21,51 ,000
Hydr.
norisopr. ET2 2,91 ,009
Ket. norisopr. ET2 8,49 ,001 Ket. norisopr. ET2 19,22 ,000
Alc. norisopr. + Ether
ET2 6,71 ,003
Alc. norisopr. +
Ether ET2 10,90 ,000
Heterosides 1 3,390 ,045 Heterosides 1 3,210 ,005
Heterosides 2 12,572 ,000 Heterosides 2 16,391 ,000
Total 12,57 ,000 Total 16,39 ,000
V158 3,17 ,054 V158 3,10 ,006
V159 19,79 ,000 V159 4,31 ,001
V161 29,33 ,000 V161 71,11 ,000
V162 33,80 ,000 V162 35,09 ,000
V165 2,09 ,139 V165 1,52 ,174
V166 48,16 ,000 V166 60,15 ,000
V167 27,50 ,000 V167 3,59 ,002
Table 136. Test of the effects between subjects (p=<0,05).
From MANOVA analysis, the only variable that, apart from the choice of factor, remains
statistically non significant is the ratio trans 8-OH linalool + cis8-OH linalool/p-menth-1-ene-
7,8-diol. Moreover this ratio is the only parameter statistically significant selecting the thesis
as the factor and to this, aliphatic alcohols from enzymatic hydrolysis are added if the
interaction thesis by year is indicated. Vanillins, monoterpenols and esters obteined from
enzymatic hydrolysis and hydrocarbon and monoterpenols oxides from hydrolysis acid, are

174
the aromatic classes that appear statistically non important when the factor is the year. Ratios
between single compounds, linalool oxA/linalool oxB lose importance with the year change.
Using data previously obtained, the amount of the variability attributed to the different factor,
was calculated (tab. 137). For most of the parameters the variability is attributable to the
thesis; the year, however, shows more variability as concerns benzene derivates, phenols,
acids and hydrocarbon norisoprenoids. The parameters linked to the ratios show comparable
levels of variability attributable to the different source, except of linalool oxA/linalool oxB
(acid hydrolysis) and linalool/geraniol (tab. 137).
Variable
%
variability
due to
the thesis
%
variability
due to
the year
%
variability
due to
interaction
thesis/year
%
variability
due to
error
Aliph. alc. ET1 79,61 1,95 9,51 8,92 Benzene der. ET1 18,40 72,38 7,84 1,38 Phenols ET1 17,31 51,50 24,60 6,60 Vanillins ET1 81,77 0,01 12,39 5,83 Monoterp. ET 1 52,46 5,29 34,45 7,80 Norisopren. ET1 43,76 32,48 19,77 3,99 Aldehydes ET1 47,85 28,70 18,21 5,24 Acids ET1 35,23 58,51 5,69 0,58 Esters ET1 54,06 2,25 29,88 13,81
Hydro. monot. ET2 58,89 14,16 21,91 5,03
Oxi. monot. ET2 61,06 15,80 17,98 5,16
Alc. monot. ET2 44,30 29,03 24,63 2,04
Hydr. norisopr. ET2 30,11 59,13 8,00 2,75
Ket. norisopr. ET2 42,72 16,95 38,34 2,00
Alc. norisopr. + Ether ET2 45,19 19,76 32,10 2,95 Heterosides 1 40,67 26,47 25,06 7,81 Heterosides 2 45,59 22,83 29,77 1,82 Total 45,59 22,83 29,77 1,82 V158 41,48 25,53 24,94 8,05 V159 9,02 71,74 15,61 3,63 V161 27,33 21,01 50,94 0,72 V162 32,34 32,72 33,97 0,97 V165 24,97 34,01 24,73 16,29 V166 36,83 27,83 34,76 0,58 V167 10,71 76,52 10,00 2,78
Table 137. Level of variability attributable to the different factor.

175
Using Tukey test, it is possible to note that all the parameters analyzed have given rise to
homogenous differentiated subsets (tab. 138-140).
The compounds originated by enzymatic way, except for benzene derivates and esters classis
and the compounds obtained by acid hidrolysis, create differentiated homogenous subsets
(tab. 138-139).
The variables describing the ratios create both type of homogenous subsets (tab. 140).
Regarding heterosides 1, the most quantitatively present class is that of the benzene
derivatives while the aldehydes and esters the least. The thesis with the highest values in most
of the different families is the same as the one having lower aliphatic alcohols and acid levels
and it is the only thesis not from the „ColleMassari‟ wine farm (tab. 138).
Among the compounds extractedby acid hydrolysis the most present are those from the
hydrocarbon norisoprenoids class and in a minor way those from monoterpenols oxides and
ketones norisoprenoids (tab. 138).
In addition, the grapes from the above mentioned thesis also stand out for the highest aroma
levels from heterosides 2, while the lowest levels belong to another single thesis (tab. 139).
The ratios examined accord perfectly well with each other and with the values obtained by
other authors on the „Sangiovese‟ cultivar (Di Stefano et al, 1998; Lanati et al., 2001) (tab.
140).
Thesis Aliph. alcohols
Phenols Vanil. Monot. Norisop. Aldeh. Acids Esters Benzene der.
MC 1 140,95 bc
64,00 ab
126,85 ab
114,62 bc
247,61 ab
1,15 a
71,87 ab
11,80 a
481,98 a
MC 2 121,62
ab 38,04 a
99,19 a
68,54 a
168,92 a
2,49 c
77,45 ab
12,55 a
423,82 a
MC 3 173,35 d
96,92 b
164,31 bc
111,47 b
297,80 bc
2,84 c
106,38 b
10,95 a
606,54 a
MC 4 164,52
cd 92,39 b
166,82 bc
111,35 b
274,33 b
2,28 bc
114,98 b
23,26 a
586,38 a
MC 5 148,38
bcd 68,05 ab
140,78 abc
106,16 b
205,01 ab
1,34 ab
84,11 ab
31,92 a
522,82 a
MC 6 96,51 a
182,14 c
192,39 c
142,11 c
376,85 c
6,01 d
51,10 a
18,58 a
612,49 a
Table 138. Significant parameters with different and no differentiated subsets; heterosides 1. Tukey
Test (p=0,05).

176
Thesis Hydroc.
monot. Oxid. monot.
Alcoh.
monot. Hydr.
norisopr. Ket. norisopr
Alc.
norisopr.
+ Ethers MC 1 0,47 b 4,12 b 4,76 b 31,01 d 4,66 ab 30,89 c
MC 2 0,41 ab 4,09 b 3,72 b 26,91 cd 7,78 cd 21,78 b
MC 3 0,27 ab 3,30 ab 4,65 ab 13,95 ab 5,60 bc 15,58 ab
MC 4 0,26 ab 3,17 ab 4,07 ab 19,95 bc 5,40 b 16,99 ab
MC 5 0,22 a 2,31 a 3,33 a 11,64 a 2,55 a 12,06 a
MC 6 0,72 c 5,84 c 6,46 c 29,03 d 8,11 d 31,37 c
Table 139. Significant parameters with different subsets; heterosides 2. Tukey Test (p=0,05).
Thesis
Heter.
1
Heter.
2
Total V159 V161 V162 V166 V158 V167 V165
MC 1 1299,30 ab
75,92 de
1375,23 ab
6,95 ab
0,04 a
2,69 b
0,04 ab
1,29 a
2,50 a
2,25 a
MC 2 1046,24 a
64,70 cd
1110,94 a
9,51 c
0,07 b
2,76 b
0,06 b
1,26 a
3,19 a
1,76 a
MC 3 1624,16 b
43,37 ab
1667,54 b
7,63
abc 0,06
ab 2,48
b 0,05
b 1,32
a 2,86
a 1,68
a MC 4 1583,01
b 49,83
bc 1632,85 b
8,64 bc
0,05 ab
2,22 ab
0,06 b
1,40 a
2,90 a
1,87 a
MC 5 1349,30 ab
32,12 a
1381,42 ab
7,49 ab
0,04 a
2,65 b
0,04 ab
1,41 a
2,73 a
1,86 a
MC 6 1755,93 c
81,55 e
1837,48 b
6,41 a
0,13 c
1,53 a
0,03 a
1,34 a
2,97 a
5,21 b
Table 140. Significant parameters with different and no differentiated subsets; heterosides 1,2 and
ratios. Tukey Test (p=0,05).
From the multivariate analysis, choosing the year as the source and from the Tukey test, it
emerged that most of the parameters examined originate differentiated subsets (tab. 141).
The grapes harvested in 2009 and those of the following year stand out in equal measure, for
the highest levels of the aromatic families, with the exception of vanillins, esters and ketones
norisoprenoids classes which were predominant in 2011. The variables indicating the ratios
between single compounds do not predominate in any one year in particular.
Variable 2009 2010 2011
Aliphatic alcohols ET1 174,25 c 150,63 b 97,87 a
Benzene derivates ET1 633,55 c 537,15 ab 436,54 a
Phenols ET1 89,92 a 89,95 a 85,54 a
Vanillins ET1 150,20 a 140,86 a 151,86 a
Monoterpenols ET 1 116,51 b 116,71 b 91,06 a
Norisoprenoids ET1 241,83 a 307,48 b 227,65 a

177
Variable 2009 2010 2011
Aldehydes ET1 1,50 a 2,10 b 4,37 c
Acids ET1 88,05 a 82,52 a 84,22 a
Esters ET1 8,99 a 13,27 a 33,07 b
Hydroc. monot. ET2 0,33 a 0,46 b 0,36 ab
Oxid. monot. ET2 4,51 c 3,71 b 3,03 a
Alc. monot. ET2 4,66 b 5,42 b 3,23 a
Hydr. norisopr. ET2 18,04 a 24,63 b 23,25 b
Ket. norisopr. ET2 6,14 b 4,59 a 6,22 b
Norisopr. alc.+ Ether ET2 14,17 a 28,40 c 21,20 b
Heterosides 1 1560,67 b 1491,68 ab 1248,42 a
Heterosides 2 47,86 a 67,23 b 57,30 a
Total 1608,54 b 1558,91 ab 1305,73 a
V158 1,24 a 1,30 a 1,48 b
V159 8,98 b 6,73 a 7,68 a
V161 0,07 b 0,08 b 0,04 a
V162 2,71 b 1,59 a 2,94 b
V165 3,22 b 1,91 a 2,01 a
V166 0,05 b 0,02 a 0,06 b
V167 2,62 a 2,79 a 3,17 a
Tabella 141. Mean separation by multiple range test (Tukey), the comparison is among data shown in
horizontal.
Using the factorial statistics analysis it was possible to collect all the variables found and
calculated into five new complex variables to represent 94,47% of the total variability of the
aromatic characteristics of the berries at harvest (tab. 142).
The descriptors that represent the highest coefficients (tab. 143) operate in a more reliable
way in determining the aromatic profile of the berries at harvest.
The first component is linked to the total aromatic content of compounds generated by
enzymatic hydrolysis and alcohols monoterpenols classes. Monoterpenols, aliphatic alcohols,
ketones norisoprenoids, oxides monoterpenols, trans 8-OH linalool + cis 8-OH linalool/p-
menth -1-ene-7,8-diol and linalool/geraniol characterize the second component.
The third is linked to 3-hydroxy β-damascenone/3-oxide α-ionol, to trans 8-OH linalool/cis 8-
OH linalool, to hydrocarbon, to monoterpenols and to norisoprenoids. Acids and linalool oxA
/linalool oxB are the only two variables correlated to fourth component.
The last component shows coefficient values below 0,4 (tab. 143).

178
Component
Weights of rotated factors
Total
%
variability
%
cumulated 1 8,88 29,59 29,59
2 8,80 29,34 58,93
3 6,33 21,10 80,03
4 2,99 9,99 90,03
5 1,33 4,44 94,47
Table 142. Results of the factorial analysis: principal components method.
Variable Component
1 2 3 4 5
Total ,964
Heterosides 1 ,958
Phenols ET1 ,953
Benzene derivates ET1 ,948
Norisoprenoids ET1 ,865 -,466
Vanillins ET1 ,825
Esters ET1 ,789 ,458
V159 -,693 -,449 ,441
Alcohols monoterpenols ET2 -,681 ,615
Monoterpenols ET 1 ,981
V165 ,970
V161 ,934
Ketones norisoprenoids ET2 ,904
Oxides monoterpenols ET2 ,852
Aliphatic alcohols ET1 -,766 ,469
V167 ,447
Alcohols + ethers norisoprenoids
ET2 ,975
Heterosides 2 ,896
Hydrocarbon norisoprenoids ET2 ,893
Hydrocarbon monoterpenols ET2 ,844 -,425
V162 -,575 ,767
V166 ,748
Aldeids ET1 ,740
V158 -,925
Acids ET1 ,803
Table 143. Matrix of the rotated components (Varimax) in order of importance. Coefficient values
below 0,4 are not included as of little relevance.

179
By extracting only two of the components from the total data it is possible to explain 64,32%
of the total variability (tab. 144). The variables examined are subdivided into equal parts
between the two extracted components (tab. 145).
The graph (fig. 70) shows how the descriptors that are in the same quadrant and that are close
to the ripening index of the berry are directly correlated to it while those further away are
correlated negatively. The first and the second component are negatively correlated only with
the linalool oxC /linalool oxD e linalool/geraniol. The first component is negatively
correlated with the ratios and the monoterpenols, with oxides e alcohols ,with monoterpenols,
and with ketones norisoprenoids. Most aromatic compounds classes and total are, on the
contrary, negatively correlated with the second component (fig. 70).
Component
Weights of rotated factors
Total
%
variance
%
cumulated 1 10,59 35,30 35,29
2 8,71 29,03 64,32
Table 144. Results of the factorial analysis extracting only the first two components: method of the
principal components.
Variable Component
1 2
Aldeids ET1 ,853
V 162 ,821 ,516
Vanillis ET1 ,781 -,410
Norisoprenoids ET1 ,746 -,509
Hydrocarbon monoterpenols ET2 ,643 ,731
Benzene derivates ET1 ,576 -,659
Total ,575 -,635
Heterosides 1 ,563 -,665
Alcohols + ethers norisoprenoids ET2 ,518 ,791
Esters ET1 ,478 -,685
V167
Heterosides 2 ,874
Hydrocarbon norisoprenoids ET2 ,868
V166 ,745
Acids ET1 -,732
Phenols ET1 -,600
V158 ,547
Aliphatic alcohols ET1
Ketones norisoprenoids ET2 -,533 ,546

180
Oxides monoterpenols ET2 -,573 ,572
V159 -,574
Monoterpenols ET 1 -,691
V165 -,812
V161 -,879
Alcohols monoterpenols ET2 -,959
Table 145. Matrix rotated (Varimax) of the first two components extracted. Descriptors ordered in
order of importance excluding the <0,4 coefficients as of little relevance.
Figure 70. Rotated graph of the first two components obtained from the factorial analysis
Examining the correlation between the parameters analyzed, in the table, only the variables
with a probability <0,00001 are reported and the characters in bold indicate the negativity of
the value indicated. Esters, linalool oxA /linalool oxB, linalool oxC /linalool oxD, 3-hydroxy
β-damascenone/3-oxyde α-ionol and linalool oxA /linalool oxB, are the parameters that don‟t
present significant Pearson‟s correlations (tab. 146). Pearson‟s significant correlations are
mostly positive except for linalool/geraniol, trans 8-OH linalool/cis 8-OH linalool and
alcohols monoterpenols.

181
Table 146. Pearson‟s correlations. Bold numbers are preceded by the minus sign. Legend abbreviations is on the previous pages.
Variable
Aliph.
Alc
ET1
Benz.
Der.
ET1
Phen
ET1
Van.
ET1
Mon.
ET 1
Nor.
ET1
Ald.
ET1
Acid
ET1
Hydr.
Monot.
ET2
Oxid
Monot.
ET2
Alc.
Monot
ET2
Hydr.
Noris.
ET2
Ket.
Noris.
ET2
Alc+Et.
Noris.
ET2
Heter.
1
Heter.
2 Tot. V
161
V
162
V
165
Aliph. Alc.
ET1
0,57
Benz. Deriv.
ET1
0,57 0,66 0,78 0,70 0,95 0,94
Phenols ET1 0,66 0,79 0,82 0,60 0,79 0,80
Vanillins ET1 0,78 0,79 0,76 0,88 0,88
Monoterp.
ET 1
0,54 0,53 0,55 0,53 0,64
Norisopr.ET1 0,70 0,82 0,76 0,86 0,87
Aldehyd.ET1 0,60
Acids ET1 0,52
Hydroc.
Monot. ET2
0,67 0,55 0,71 0,70 0,76
Oxid.
Monot. ET2
0,67 0,71 0,74 0,71 0,57 0,76 0,63 0,61
Alcohols
Monot. ET2
0,54 0,55 0,71 0,59 0,63 0,56 0,62
Hydrocarbon
Norisop.ET2
0,71 0,74 0,65 0,86 0,97
Ketones
Norisop.ET2
0,71 0,65 0,63 0,53
Alcoh.+ Eters
Norisop.ET2
0,70 0,57 0,59 0,86 0,93
Heterosides 1 0,95 0,79 0,88 0,53 0,86 0,52
Heterosides 2 0,76 0,76 0,63 0,97 0,63 0,93
Total 0,94 0,80 0,88 0,55 0,87
V161 0,53 0,63 0,56 0,53 0,69 0,84
V162 0,62 0,69
V165 0,64 0,61 0,84

182
The Stepwise discriminant analysis gave the best results to study the characteristics and
possible important statistical differences of the grapes from the theses belonging to the same
Denomination of Origin (fig. 71).
The first two canonical functions represent more than 94,0 % of the total variability (tab.
147).
Function Eingenvalue
% of
variance
%
cumulated
Canonical
correlation
1 231,771 83,6 83,6 ,998
2 31,404 11,3 94,9 ,984
3 8,452 3,0 97,9 ,946
4 4,525 1,6 99,6 ,905
5 1,219 ,4 100,0 ,741
Table 147. Eigenvalues of discriminant analysis.
Looking at the graph of the centroids obtained from the discriminating analysis data (fig. 71),
is observed that the points relative to centroids present a limited dispersion. In the centroid
there are two distinct groups, the first belonging to a thesis from a different estate from the
other five and it is the only one that stands out. In the second group the other theses: among
these, the second stands out more from the others, while numbers four and five overlap in
some points.
The 100,0% of the original grouping are classified correctly, while 88,7% of the cases
grouped cross-validated are reclassified correctly (tab. 148).

183
Figure 71. Centroids obtained from the cluster analysis of the aromatic characteristics of the grapes at
harvest‟s time.
Thesis
Group expected
Totals 1 2 3 4 5 6
Cro
ss-v
alid
atio
n a
% 1 100,0 ,0 ,0 ,0 ,0 ,0 100,0
2 ,0 100,0 ,0 ,0 ,0 ,0 100,0
3 ,0 ,0 77,8 22,2 ,0 ,0 100,0
4 ,0 ,0 ,0 66,7 33,3 ,0 100,0
5 ,0 ,0 ,0 11,1 88,9 ,0 100,0
6 ,0 ,0 ,0 ,0 ,0 100,0 100,0
Table 148. Classification results.
a. Cross validation is done only for those cases in the analysis in cross validation, each case is
classified by the functions derived from all cases other than that case. b. 100,0% of original grouped cases correctly classified.
c. 88,7% of cross-validated grouped cases correctly classified.

184
3.9.2 ‘Col d’Orcia’ estate
In the multivariate analysis, if the factor is the thesis, all the variables examined appear to be
statistically important, however, if in the course of the analysis the factor choice is the year
the alcohol aliphatic, the vanillins and the aldehydes derived from the enzymatic hydrolysis
lose their statistical significance. From the interaction thesis by year, some variables are not
statistically different for instance: the benzene derivates, esters, hydrocarbon and
monoterpenols alcohols, ketones norisoprenoids, the total compounds originated by acid
hydrolysis and the content of the identified aromatic compounds expressed in ng/g fresh
weight. The ratios linalool oxC/linalool oxD, linalool/geraniol, trans 8-OH linalool/cis 8-OH
linalool and 3-hydroxi β-damascenone/3-oxo-ionol do not appear statistically relevant only by
the interaction thesis by year (tab. 149).
Factor Dipendent variable
F Sign.
Factor Dipendent variable F Sign.
Year Aliph. alc. ET1 1,077 ,353 Thesis* Year
Aliph. alc. ET1 2,138 ,063
Der.b enzene ET1 11,022 ,000 Der. benzene ET1 1,541 ,185
Phenols ET1 3,823 ,033 Phenols ET1 2,633 ,026
Vanillins ET1 ,232 ,794 Vanillins ET1 1,523 ,191
Monoterp. ET 1 4,390 ,021 Monoterp. ET 1 2,582 ,028
Norisopren. ET1 20,674 ,000 Norisopren. ET1 4,548 ,001
Aldehydes ET1 ,023 ,977 Aldehydes ET1 6,453 ,000
Acids ET1 203,831 ,000 Acids ET1 12,527 ,000
Esters ET1 16,687 ,000 Esters ET1 1,780 ,121
Hydro. monot. ET2 13,380 ,000 Hydro. monot. ET2 1,414 ,231
Oxi. monot. ET2 16,655 ,000 Oxi. monot. ET2 2,493 ,033
Alc. monot. ET2 7,753 ,002 Alc. monot. ET2 1,312 ,276
Hydr. norisopr. ET2 12,937 ,000 Hydr. norisopr. ET2 2,756 ,021
Ket. norisopr. ET2 14,228 ,000 Ket. norisopr. ET2 1,201 ,331
Alc.nor. + Ether ET2 18,947 ,000 Alc. nor. + Ether ET2 2,325 ,045
Heterosides 1 3,434 ,045 Heterosides 1 2,678 ,024
Heterosides 2 19,036 ,000 Heterosides 2 1,425 ,227
Total 19,036 ,000 Total 1,425 ,227
V158 3,375 ,048 V158 2,924 ,015
V159 13,964 ,000 V159 1,696 ,140
V161 30,696 ,000 V161 1,373 ,248
V162 44,142 ,000 V162 2,140 ,063
V165 27,556 ,000 V165 3,607 ,005
V166 8,854 ,001 V166 2,162 ,060
V167 4,450 ,020 V167 3,441 ,006
Table 149. Test of the effects between subjects, p= <0,05.

185
Using data previously obtained the amount of variability attributed to the different factor was
calculated (tab. 150). The variability of none of the variables examined is due in percentage to
the interaction thesis by year. The thesis, however, shows more variability as concerns aroma
compounds generated by enzymatic hydrolysis; on the contrary aroma compounds originated
by acid hydrolysis are the variables that show more variability when the factor is represented
by the year. The ratios between the compounds show higher percentage values of variability
for the year.
Variable
%
variability
due to
the thesis
%
variability
due to
the year
%
variability
due to
interaction
thesis/year
%
variability
due to
error
Aliph. alc. ET1 55,29 11,42 22,67 10,61 Derivates benzene ET1 64,01 29,25 4,09 2,65 Phenols ET1 77,26 11,66 8,03 3,05 Vanillins ET1 73,61 2,23 14,59 9,58 Monoterpenols ET 1 69,71 16,68 9,81 3,80 Norisoprenoids ET1 59,35 32,05 7,05 1,55 Aldehydes ET1 84,07 0,05 13,75 2,13 Acids ET1 8,95 85,38 5,25 0,42 Esters ET1 35,95 54,90 5,86 3,29 Hydro. monot. ET2 37,58 52,88 5,59 3,95
Oxi. monot. ET2 43,98 46,31 6,93 2,78
Alc. monot. ET2 42,41 44,37 7,51 5,72
Hydr. Norisopr. ET2 46,56 41,42 8,82 3,20
Ket. norisopr. ET2 24,86 65,07 5,49 4,57
Alc. nor. + Ether ET2 34,06 56,10 6,88 2,96 Heterosides 1 80,88 9,23 7,20 2,69 Heterosides 2 31,24 60,99 4,56 3,20 Total 31,24 60,99 4,56 3,20 V158 82,46 8,11 7,03 2,40 V159 15,48 70,85 8,60 5,07 V161 23,04 71,44 3,20 2,33 V162 30,35 65,03 3,15 1,47 V165 8,89 78,06 10,22 2,83 V166 31,57 50,42 12,31 5,70 V167 28,89 35,59 27,52 8,00
Table 150. Level of variability attributable to the different factor.
From Tukey test it is possible to note the table with the different subsets and those non
differentiated (tab. 151-153).

186
Within the heterosides 1 classis, only the esters class creates non differentiated homogeneous
subsets while in the heterosides 2 there is not even one. In the compounds released by
enzymes, the benzene derivates family is the most prominent in the theses while the aldehydes
are quantitatively inferior; from a concentration of hundreds of ng/g fresh weight of vegetable
tissue to values close to the unit (tab. 151).
Comparing the theses in the study, the second and third show lower levels of compounds
freed by enzymatic way and the fifth, BM5, stands out for the highest heterosides 1 and 2
content and therefore for total aromas. The grapes from the BM4 sample contain lower
quantities of compounds originated by acid hydrolysis, except for the hydrocarbon
monoterpenols class (tab. 152).
As can be seen from all the ratios examined there is perfect harmony in the results and in the
values obtained in literature by other authors for the „Sangiovese‟ cultivar (Di Stefano et al.,
1998; Lanati et al., 2001). The first and second ratio regarding the linalool oxides are
completely favourable to the trans form compounds compared to the cis one; the
linalool/geraniol ratio is much less than one in the grapes with a low linalool concentration
(tab. 153).
Thesis Aliph.
alcoh.
Der.
benzene Phenols Vanillins Monoter. Norisopr. Aldeids Acids Esters
BM 1 160,58 a 441,89 a 65,19 a 125,95 a 91,09 b 242,10 b 2,2 b 101,77 a 15,60 a
BM 2 140,38 a 437,87 a 59,21 a 120,85 a 66,11 a 165,83 a 2,89 cd 52,98 a 11,04 a
BM 3 151,84 a 471,26 a 52,60 a 111,11 a 75,28 ab 220,42 ab 1,50 a 86,85 a 11,84 a
BM 4 132,60 a 504,47 a 71,27 a 117,05 a 72,52 ab 234,71 ab 2,48 bc 79,96 a 8,45 a
BM 5 268,26 b 815,22 b 115,79 b 213,84 b 147,66 c 463,41 c 3,42 d 162,38 b 13,38 a
Table 151. Significant parameters with different and no differentiated subsets; heterosides 1. Tukey
Test (p=0,05).
Thesis
Hydroc.
monot.
Oxid.
monot.
Alc.
monot.
Hydr.
norisopr.
Ket.
norisopr.
Alc.
norisopr
+ Ethers BM 1 0,36 b 2,86 ab 3,19 a 21,99 ab 6,30 a 19,58 a
BM 2 0,12 a 3,24 b 3,03 a 22,28 ab 6,22 a 15,67 a
BM 3 0,42 b 3,06 b 3,03 a 19,79 a 5,10 a 16,20 a
BM 4 0,24 ab 1,40 a 1,97 a 12,66 a 3,63 a 10,20 a
BM 5 0,72 c 4,13 b 5,59 b 36,15 b 10,63 b 36,62 b
Table 152. Significant parameters with different subsets; heterosides 2. Tukey Test (p=0,05).

187
Thesis Heter.
1
Heter.
2
Total V158 V159 V161 V162 V165 V166 V167
BM 1 1304,84 a 54,54 a 1359,38 a 1,42 ab 6,77 a 0,08 c 1,63 a 1,95 ab 0,06 ab 4,67 a
BM 2 1098,24 a 50,59 a 1148,86 a 1,59 b 7,89 ab 0,05 b 2,23 b 1,93 ab 0,09 b 2,77 a
BM 3 1225,09 a 47,69 a 1272,77 a 1,47 ab 8,70 b 0,04 ab 2,18 ab 1,40 a 0,06 ab 4,97 a
BM 4 1260,88 a 30,12 a 129,00 a 1,45 ab 8,44 b 0,05 ab 1,74 ab 1,50 a 0,07 ab 2,80 a
BM 5 2277,13 b 93,86 b 2370,99 b 1,33 a 8,07 ab 0,03 a 2,29 b 2,29 b 0,05 a 2,63 a
Table 153. Significant parameters with different subsets; heterosides 1, 2 and ratios. Tukey
Test (p=0,05).
From the multivariate analysis where factor choice is the year and from the Tukey test, it
appears that most of the parameters tested originate homogenous differentiated subsets,
exception made for phenols, norisoprenoids and esters classes. Linalool oxA/linalool oxB
generated by acid hydrolysis is the only ratio between specific compounds that creates
homogenous non differentiated subsets.
The grapes harvested in 2010 stand out for the highest levels of the aromatic families, with the
exception of esters classes which were predominant in 2009. On the contrary, vanillins,
oxides monoterpenols, norisoprenoids, alcohols + ethers monoterpenols, were predominant in
2011 (tab. 154).
Variable 2009 2010 2011
Aliphatic alcohols ET1 181,65 b 192,78 b 137,77 a
Benzene derivates ET1 565,99 b 557,44 ab 478,99 a
Phenols ET1 69,38 a 76,11 a 72,95 a
Vanillins ET1 130,91 ab 126,06 a 156,31 b
Monoterpenols ET 1 79,04 a 112,37 b 80,18 a
Norisoprenoids ET1 265,76 a 267,16 a 262,96 a
Aldehydes ET1 1,47 a 1,54 a 4,49 b
Acids ET1 86,36 a 139,91 b 64,10 a
Esters ET1 14,83 a 12,83 a 8,53 a
Hydroc. monot. ET2 0,17 a 0,44 b 0,51 b
Oxid. monot. ET2 2,04 a 3,35 b 3,43 b
Alc. monot. ET2 2,28 a 4,18 b 3,62 b
Hydr. norisopr. ET2 10,64 a 25,84 b 31,25 b
Ket. norisopr. ET2 4,19 a 5,69 a 9,25 b
Norisopr. alc.+ Ether ET2 7,52 a 24,10 b 27,34 b
Heterosides 1 1435,53 ab 1557,14 b 1307,02 a
Heterosides 2 26,86 a 63,63 b 75,58 b
Total 1462,39 ab 1620,80 b 1382,61 a

188
Variable 2009 2010 2011
V158 1,28 a 1,58 b 1,49 b
V159 6,67 a 9,94 b 7,31 a
V161 0,07 b 0,06 b 0,02 a
V162 1,66 a 2,06 b 2,34 b
V165 1,62 a 2,23 b 1,59 a
V166 0,06 ab 0,05 a 0,08 b
V167 2,71 a 4,99 a 3,01 a
Table 154. Mean separation by multiple range test (Tukey) the comparison is among data shown in
horizontal.
Using the factorial statistics analysis it was possible to collect all the variables found and
calculated into six new complex variables (components) to represent 95,08% of the total
variability of the aromatic characteristics of the berries at harvest (tab. 155).
The first component is linked to aromatic compounds released by acid hydrolysis, on the
other hand, the second to classes belonging to the heterosides 1. Monoterpenols, esters and
the most of the variables studied characterize the third component. The fourth and the fifth
component are linked to only one variable precisely trans 8-OH linalool/cis 8-OH linalool e
linalool oxA/linalool oxB respectively. Finally the last component shows coefficient values
below 0,4 (tab. 156).
Component
Weights of rotated factors
Total %
variability %
cumulated 1 7,84 26,15 26,15
2 7,09 23,63 49,78
3 6,90 23,01 72,79
4 2,63 8,76 81,55
5 2,40 8,00 89,55
6 1,66 5,53 95,08
Tab 155. Results of the factorial analysis: principal components method.

189
Variable Component
1 2 3 4 5 6 Heterosides 2 ,961
Hydrocarbon norisoprenoids ET2 ,961
Hydrocarbon monoterpenols ET2 ,956
Alcohols + ethers norisoprenoids ET2 ,936
Ketones norisoprenoids ET2 ,806
Alcohols monoterpenols ET2 ,698 ,484
Oxides monoterpenols ET2 ,624 -,492
Aldehydes ET1 ,595 ,613
Benzene derivates ET1 ,953
Phenols ET1 ,939
Vanillins ET1 ,919
Monoterpenols ET 1 ,882
Norisoprenoids ET1 ,881
Heterosides 1 ,969
Total ,951
V158 ,784
V159 ,822
V162 ,472 ,834
V165 ,759
V166 -,961
V167 -,954
Acids ET1 -,400 ,513 ,413 ,430
V161 -,490
Esters ET1 -,601
Aliphatic alcohols ET1 -,701 ,482
Table 156. Matrix of the rotated components (Varimax) in order of importance. Coefficient values
below 0,4 are not included as of little relevance.
Extracting only two components from all the data collected it is possible to explain 62,02 %
of the total variability (tab. 157).
In particular the first component is greatly linked to the most of the ratios analysed, to the
classes generated by enzymatic hydrolysis and to ketones norisoprenoids by acid one.
The second, on the other hand, to herterosides 2, to aliphatic alcohols, to monoterpenols and
to acids classes (tab. 158).
The graph (fig. 72) shows how both of the components are negatively correlated with the
esters, the aliphatic alcohols and the linalool/geraniol. The first component is negatively
correlated with the acids and the monoterpenols derived from enzymatic hydrolysis, with
oxides e alcohols monoterpenols from acid hydrolysis, and with the most of ratios between

190
specific aromatic compounds. Benzene derivates, phenols, vanillins, heterosides 1 and 3-
hydroxi β-damascenone/3-oxo-ionol are negatively correlated with the second component.
Component
Weights of rotated factors
Total
%
variance
%
cumulated 1 9,70 32,32 32,32
2 8,91 29,70 62,02
Table 157. Results of the factorial analysis extracting only the first two components: method of the
principal components.
Variable Component
1 2
Aldehydes ET1 ,921
Norisoprenoids ET1 ,895
Derivates Benzene ET1 ,786
Vanillins ET1 ,781
Total ,734
Ketones norisoprenoids ET2 ,727
Phenols ET1 ,706
Heterosides 1 ,691
V162 ,666
V166 -,700
Acids ET1 -,588
V159 -,644 ,706
V158 -,730 ,482
V161 -,851
Aliphatic alcohols ET1 -,473
Monoterpenols ET 1 ,759
Esters ET1 -,530
Hydrocarbon monoterpenols ET2 ,866
Oxides monoterpenols ET2 ,838
Alcohols monoterpenols ET2 ,952
Hydrocarbon norisoprenoids ET2 ,879
Alcohols + ethers norisoprenoids ET2 ,898
Heterosides 2 ,882
V165 ,829
V167
Table 158. Matrix rotated (Varimax) of the first two components extracted. Descriptors ordered in
order of importance excluding the <0,4 coefficients as of little relevance.

191
Figure 72. Rotated graph of the first two components obtained from the factorial analysis.
Examining the correlation between the parameters analyzed, in the table only the variables
with a probability <0,00001 are reported and the characters in bold indicate the negativity of
the value indicated.
Esters, trans 8-OH linalool/cis 8-OH linalool, 3-hydroxi β-damascenone/3-oxo-ionol, linalool
oxA/linalool oxB, are the parameters that don‟t present significant Pearson‟s correlations. In
most cases there are values of Pearson's correlation positive. However Pearson‟s correlations
among ratios and others variables, are negatively correlated and show lower values (tab. 159).
The following variables show Pearson values close to the unit and thus are closely correlated
to each other: aromatic compounds derivated by enzymatic hydrolysis and total aromatic
compounds, the benzene derivates and the norisoprenoids. Those derived from acid hydrolysis
are closely correlated to hydrocarbon norisoprenoids and alcohols + ethers monoterpenols
(tab. 159).

192
Aliph.
Alc
ET1
Benz.
Der.
ET1
Phen
ET1
Van.
ET1
Mon.
ET 1
Nor.
ET1
Ald.
ET1
Acid
ET1
Hydr.
Monot.
ET2
Oxid
Monot.
ET2
Alc.
Monot
ET2
Hydr.
Noris.
ET2
Ket.
Noris.
ET2
Alc+Et.
Noris.
ET2
Heter.
1
Heter.
2 Tot.
V
158
V
159
V
161
V
165
Aliph. Alc.
ET1
0,84
0,69
0,63
0,82
0,72
0,82
0,90
0,89
Benz. Deriv.
ET1
0,84
0,85
0,81
0,74
0,90
0,59
0,96
0,95
Phenols ET1 0,69 0,85 0,82 0,68 0,84 0,88 0,87
Vanillins ET1 0,63 0,81 0,82 0,59 0,85 0,55 0,56 0,83 0,84
Monoterp.
ET 1
0,82
0,74
0,68
0,59
0,75
0,83
0,56
0,68
0,59
0,85
0,87
0,57
Norisopr. ET1 0,72 0,90 0,84 0,85 0,55 0,57 0,93 0,94
Aldehyd.ET1 0,55 0,68 0,59
Acids ET1 0,82 0,59 0,83 0,55 0,74 0,73
Hydroc.
Monot. ET2
0,56
0,57
0,62
0,73
0,79
0,71
0,85
Oxid.
Monot. ET2
0,62
0,86
0,82
0,64
0,74
0,81
Alcohols
Monot. ET2
0,68
0,73
0,86
0,83
0,68
0,84
0,86
Hydrocarbon
Norisop.ET2
0,79
0,82
0,83
0,86
0,94
0,99
Ketones
Norisop.ET2
0,56
0,68
0,71
0,64
0,68
0,86
0,81
0,88
0,56
Alcoh.+ Eters
Norisop.ET2
0,59
0,90
0,74
0,84
0,94
0,81
0,98
Heterosides 1 0,90 0,96 0,88 0,83 0,85 0,93 0,74 1,00
Heterosides 2 0,85 0,81 0,86 0,99 0,88 0,98
Total 0,89 0,95 0,87 0,84 0,87 0,94 0,73 1,00
V158 0,60
V159 0,60
V161 0,59 0,56
V165 0,57
Table 159. Pearson‟s correlations. Bold numbers are preceded by the minus sign. Legend abbreviations is on the previous pages.

193
The Stepwise discriminant analysis gave the best results to study the characteristics and
possible important statistical differences of the grapes from the theses belonging to the same
estate (fig. 68).
Discriminant analysis on the aromatic characteristics of the grapes at harvest‟s time highlighted
differences between clones examined and some of which may be distinct.
The first two canonical functions represent more than 95,0 % of the total variability (tab.
160).
Function
Eingenvalue % of
variance % cumulated
Canonical correlation
1 71,504 79,3 79,3 ,993
2 14,350 15,9 95,2 ,967
3 3,266 3,6 98,9 ,875
4 1,029 1,1 100,0 ,712
Table 160. Eigenvalues of discriminant analysis.
In the centroids graph obtained from the discriminant analysis (fig. 73), three distinct groups
appear: the first includes the thesis BM2, BM3 e BM4 that intersect each others. The second
only BM1 and the third BM5 which well differs from the others, because well detached from the
other theses.
The original grouping classified correctly 97,8% of the data, while 84,4% of the cases
grouped cross-validated were reclassified correctly (tab. 161).

194
Figure 73. Centroids obtained from the cluster analysis of the characteristics of the grapes at harvest‟s
time.
Cro
ss-
val
idat
oa Thesis
Group expected
Totals 1 2 3 4 5
% 1 100,0 ,0 ,0 ,0 ,0 100,0
2 ,0 77,8 22,2 ,0 ,0 100,0
3 ,0 11,1 66,7 22,2 ,0 100,0
4 ,0 ,0 22,2 77,8 ,0 100,0
5 ,0 ,0 ,0 ,0 100,0 100,0
Table 161. Classification results.
a. Cross validation is done only for those cases in the analysis In cross validation, each case is
classified by the functions derived from all cases other than that case. b. 97,8% of original grouped cases correctly classified. c. 84,4% of cross-validated grouped cases correctly classified.
195
4. DISCUSSION AND CONCUSIONS
The variety „Sangiovese‟ is a genotype characterized by a wide variation of expression due to
its high responsiveness to the environment so it would be possible to obtain in different areas
wines with quality levels very similar, though differentiated between them, thus expressing
the varietal potential in response to a specific terroir (Brancadoro et al., 2006; Bucelli et al.,
2013; Scalabrelli, 2013). These studies of the wines produced with „Sangiovese‟ as the main
variety in Tuscany mainly identify by Denomination of Origin DOCG and DOC suggest that
possible terroirs identifiable, could be still more numerous (Costantini et al., 2006, 2008;
Scalabrelli, 2013). Research carried out in Tuscany showed that measuring several variables
of vine performance could be used to predict wine quality (Bucelli et al., 2010) although the
grape aroma compound were not determined. This method of testing the wine-making
production allowed us to evaluate phenotypic expression of growing and of quality as a
consequence of interaction between genotype and environment (Scienza et al., 1990; Asselin,
2000; Panont et al., 1994). Generally the product of a genotype isn‟t set strictly but it can
have a broad range of expressions, this range is as extensive as greater is the responsiveness to
local influences.
Although the „Sangiovese‟ grapevine was well studied, it is not possible to indicate a
generalized vineyard model adapt to all situations. Our investigations performed on the grapes
at maturity does not aim to make a hierarchical scale of oenological products of a specific
terroir, but to provide a way to understand the potential of a territory in order to enhance its
specificity.
Our research was conducted in three consecutive years (2009, 2010 and 2011), on
„Sangiovese‟ vineyards in five areas of production located in „Grosseto‟, „Pisa‟, and „Siena‟
provinces, involving a total of 17 theses. The corresponding Denomination areas of wine
production were: „Brunello di Montalcino‟, „Chianti Classico‟, „Chianti Colline Pisane‟,
„Montecucco‟ and „Morellino di Scansano‟: the vineyards are similar as the age, training
system, vine density, bud load and yield were maintained close to the limit imposed by the
denominations (7-8 t/ha).
The examined areas are not homogeneous, as for pedological and climatic characteristics,
these ones are modulated by exposure, altitude and by interaction year by site. It follows that
some grapes presented clearly differences attributable to several factors and in other cases the
effects are difficult to generalize because of phenomena of compensation or of complex

196
interaction among factors. Technical soil and canopy management (shoot trimming and
cluster thinning) were necessary to compensate for the factors that act negatively on quality
parameters of „Sangiovese‟ vines, known to be more sensitive to the ecopedological variables,
compared to other international varieties. In this context, we underline the importance of the
winegrower in order to ensure obtaining a product in conformity with the standards of
production and at the same time having specific quality requirements, and possibly a strong
territorial character (Scalabrelli et al., 2004).
Sometimes the climatic parameters among distant areas are more similar than those ones
among areas very close.
The weather conditions affected significantly several parameter of yield and grape quality
according to the year and the site. In fact, 2010 was the coldest year and 2011, instead, the
hottest in June, August and September determining a generalized advanced of the harvest‟s
time in all the Denomination areas. In 2009, however, the temperature reached in some
locations the highest peaks. Most probably the high temperatures of 2009 brought a
degradation of the aromatic substances which remained the same the following year as a
result of the lower temperatures (D‟Onofrio, oral communications). The maximum, minimum
and mean temperature were negatively correlated with most of the aroma compounds (tab.
162) especially regarding to the compounds released by acid hydrolysis.
Aroma classes
T Max
June-
Sept
T Min
June-
Sept
T Mean
June-
Sept
T Max
Aug-
Sept
T Min
Aug-
Sept
T Mean
Aug-
Sept Monoterpenols
ET 1 P.C. -,605 -,586
Sig. ,004 ,005
Acids P.C. -,537 -,503 -,469
ET1 Sig. ,011 ,017 ,025
Hydroc. monot.
ET2 P.C. -,552 -,585 -,566 -,499
Sig. ,009 ,005 ,007 ,017
Oxide monoterp.
ET2 P.C. -,715 -,658 -,710 -,617
Sig. ,000 ,002 ,000 ,003
Hydroc. norisop.
ET2 P.C. -,672 -,731 -,671 -,599
Sig. ,001 ,000 ,001 ,004
Ketones norisop.
ET2 P.C. -,600 -,581
Sig. ,004 ,006
Alcoh. + Eters
norisop. ET2 P.C. -,428 -,591 -,487 -,537
Sig. ,038 ,005 ,020 ,011
Compounds
released by acid
hydrolysis
P.C. -,636 -,680 -,654 -,588
Sig. ,002 ,001 ,002 ,005
Table 162. Pearson‟s correlations.

197
Maximum, minimum and mean temperature in the period June-July were negatively correlated
with aldehydes and esters, too.
Daily excursion, nevertheless, were negatively correlated with most of the aroma compounds
originating from acid hydrolysis and with terpenols from enzymatic hydrolysis because of the
high peak of maximum temperatures.
Minimun and mean temperature in the period June-September, were negatively correlated
with titratable acidity and positively correlated to ripening technological index. Analysing
only June-July period, were found negative correlation between maximum temperature and skin berry
weight and the total berry polyphenols content.
On the basis of the mean climatic data observed during the three years studied, three distinct
groups were obtained: the first represented by the stations of „San Miniato‟ („Chianti Colline
Pisane‟) and „Magliano‟ („Morellino di Scansano‟) that appear less distinct and by the two
stations belonging to the „Montalcino‟ area. The second is constituted by the station of
„Gaiole‟, and the third by „Cinigiano‟ („Montecucco‟) which is the most distinguishable.
The 2011 was the year with the most mature grapes from a sensory point of view, especially
as regards the pulp. The 2010, instead, showed more seeds phenolic maturity.
Regarding the berry sensorial maturity the lowest values were shown in the thesis of „Chianti
Colline Pisane‟ characterized by modest rainfall, high maximum temperatures, by having silt,
alkaline, calcareous soils, poor of organic matter and potassium and with a mean amount of
magnesium and phosphorus. These characteristics, had a negative effect on concentration of
most of the aroma compounds found in the grapes.
In general, optimal value of sensory maturity were observed in „Siena‟s province and
precisely in the vineyards located in the „Chianti Classico‟: they are characterized by medium
to high content of sand, medium silt and a variable amount of clay. Both soils are alkaline,
moderately rich in active limestone, organic matter and mineral elements. In addition we
observed in this area lower mean temperature during the summer months and slower grape
ripening along two years which assured higher concentration of aroma compounds (tab. 162)
and a better seed phenolic maturity.
Although the training systems utilized, e.g. spur cordon and Guyot cannot be compared, it
was observed a tendency on the grapes brought by the last pruning system to induce lower
values of sensorial maturity of berries.
In the year 2009 grapes achieved the highest values of the Ripening Index parameter (sugar
content/titratable acidity) while on 2011 it was observed generally a better phenolic maturity.

198
Regarding the sensorial maturity the values shown are the highest in one thesis of the „Chianti
Classico‟ area and the lowest in the thesis of „Chianti Colline Pisane‟, which showed the
lower seed phenolic maturity while a thesis belonging to „Brunello di Montalcino‟ showed the
ripening technological index highest and the highest value of total polyphenols.
As it was not found any correlation between the amount of aromas perceived in sensory
analysis with aroma analysed by the GC-MS; this fact could be depending on several reasons:
the non contemporary sensorial analysis between the tested thesis, the different threshold of
perception of the several aroma compounds, (De Rosso et al., 2010) and the saturation of
perception of the panelist which occurs when the threshold was overcame.
As for sensory analysis of the grapes and for the technological parameters, the effect due to
the year appeared much more relevant than those dependent on the site.
It was found that the mean bunch weight was positively correlated to the nitrogen
concentration of the soil.
Sugar and polyphenols content showed the highest values in theses characterized by good
daily excursion, an average rainfall able to increase the available water content of the soil
(AWC) and soils for the prevalence of silty particles, alkaline pH, medium quantity of active
limestone, poor of organic matter and of other macro elements (Brancadoro et al., 2006).
The lowest °Brix and the highest value of titratable acidity, on the other hand, were found in
soils characterized by medium to high content of sand, medium silt and variable amount of
clay; alkaline, moderately rich in active limestone, organic matter and mineral elements;
altogether the annual thermal regime can play an important role on sugar accumulation and
final titratable acidity. A direct positive correlation was found between sugar accumulation
and potassium content of the soil.
Soils characterized by a prevalence of sand, sub-alkaline pH, moderate presence of limestone,
low organic matter, and average potassium, magnesium and exchange cation capacity
positively influenced anthocyanins level as in most vineyards of „Montecucco‟ area; on the
contrary they were negatively conditioned by soils clay-sandy (with a consistent content of
clay), poor in organic matter and phosphorus, rich in potassium and with an excess of
magnesium (BM 6).
With regard to the aroma profile of „Sangiovese‟‟s grapes, we can observe how the results
here reported for all the theses examined are in perfect agreement between them and with the
general profiles obtained by other authors for the „Sangiovese‟ (Di Stefano et al., l.c.; Lanati
et al., l.c.). Specifically typical ratios of „Sangiovese‟ aroma compounds are linalool
oxA/linalool oxB, linalool oxC/linalool oxD, linalool/α-terpineol, linalool/geraniol, trans 8-

199
OH linalool/cis 8-OH linalool, trans 8-OH linalool + cis 8-OH linalool/p- menth-1en-7,8-di
and 3-hydroxy β-damascenone/3-oxide α-ionol.
Inside of the compounds released by enzymes hydrolysis, the classes of benzene derivates and
norisoprenoids are present in the most quantity in the samples analyses, while aldehydes are
quantitatively less represented. Chemical hydrolysis to pH 3 made on aglycones obtained by
enzymatic hydrolysis of glycosides precursors has shown that the most represented category
is that of the norisoprenoids hydrocarbon while that of monoterpenols is the less abundant.
Comparing the grapes coming from the different locations we can observe how the „Chianti
Colline Pisane‟ thesis is relatively distinct from the others for the quantitative inferior values
of most aroma classes, which can be attributed to the lower soil content of potassium in this
vineyard. In fact, a positive correlation (r2 = 0,631) with the aroma concentration with soil
potassium content was found.
Samples from the province of „Siena‟, however, had in general a high aroma content. In
particular only one thesis belonging to „Brunello di Montalcino‟ mentioned for the highest
ripening technological index and the value of total polyphenols, besides showed the highest
aroma‟s content.
Among the soil studied, one thesis in the „Chianti Classico‟ area stood out while the other
ones are close to one another and some points overlap: the soil of this vineyard is sub-
alkaline, with prevalence of clay and it is characterized by the highest altitude.
Besides, a good daily excursion, a medium rainfall, a soil alkaline, with the prevalence of silty
particles, with a fair quantity of active limestone but poor of organic matter and of other
macro elements, positively affect the aroma‟s content. Moreover the percentage of the sand in
the soils appeared positively correlated to the level of hydrocarbon, alcohols and ethers
norisoprenoids derivates.
The year 2010 was characterized by the highest level of the most aroma classes while on 2009
the final concentrations were lower, as reported before. Variability was equally attributable to
the thesis and to the year more precisely, the compounds, originating from enzymatic
hydrolysis except for aldehydes and acids, have a greater variability due to the thesis, while
the compounds originating from acid hydrolysis and the other ratios are strongly influenced
by the year effect. Most of the compounds derived by acid hydrolysis and some derived by
enzymatic hydrolysis were negatively correlated to the temperature occurred in the period of
berry growth and ripening (from the beginning of June to the end of September). Moreover,
sugar content and the ripening technological index were negatively correlated with most of
the aroma compounds, while titratable acidity and mean bunch weight showed a positive

200
correlation. Only the class of acids obtained from enzymatic hydrolysis was positive
correlated with °Brix.
Berry size was correlated negatively with anthocyanins and polyphenols concentration while
was not correlated with the aroma content, also it can be highlighted that a positive
relationship with the content of limestone and aroma compounds, referred in literature
(Fregoni, 2005) was not evidenced.
Regarding to the focus of the vineyards of „Montecucco‟ area there were several differences
among them: soil of the vineyard MC7 has a lower pH than the others, almost no limestone,
low organic matter and available nitrogen, meanwhile it has a good amount in phosphorus,
magnesium and potassium content. This thesis which differs from other ones as regards the
characteristics of the soil, not for the climate, because is very close, showed different results
of sensorial, technological and aroma analysis, more provided mainly of norisoprenoids,
phenols and monoterpenols. These differences were partially accounted by the high content of
sand and potassium as resulted by the positive correlation previously indicated.
As for the clone effect grown in the same site of cultivation („Col d‟Orcia‟ estate), three
distinct groups appeared during technological and aromatic analysis: the first comprises the
thesis BM2, BM3 e BM4 that intersect each others. The second only BM1 and the third BM5
which well differs from the others. The five theses appear well detached when they were
examined for sensorial description. It was confirmed that genetic variability affect the
characteristics of „Sangiovese‟ (Egger et al. 2001; Bertuccioli, 2006) although it was less
relevant than the year and the site.
Secondary metabolites are so sensitive to environmental and cultural variables as can be
synthesized in very different levels depending on the influence of the cultivation conditions,
while preserving their quality profile essentially unchanged. It seems that rainfall didn‟t
generate significant correlation with variables linked to the characteristics of the grape.
Some aroma classes (aliphatic alcohols, benzene derivates, phenols), especially as regards the
compounds released by enzymatic hydrolysis, didn‟t correlated with climatic characteristics.
We should suppose that the biosynthesis of these compounds in „Sangiovese‟ are less
influenced by the climatic conditions. It also could be hypothesized that in the area of
cultivation tested even though we had variable conditions, there were not reached limiting
conditions able to modify their biosynthesis.
The main hypothesis of this study was that soil and climate might have a direct relation upon
grape characteristics but there were many consistent grapes effects that could be linked to
both site and climatic characteristics. So, as already highlighted by Reynolds (2012), if we
201
would have studied also the wines, probably we could have generated several questions: „what
factors exert the greatest control over the terroir effect?; do winemakers exert more influence
over wines than site characteristics?; do viticultural and/or oenological practices exert the
greatest influence over wine varietal typicity?‟
Questions which suggest to continue to study the „Sangiovese‟ in Tuscany, a place in which is
able to give several expressions.

202
5. REFERENCES
A.A.V.V. (1996). Giornata di studio sul Sangiovese. Atti Arezzo: 55-63.
A.A.V.V. (2008). Vino e Olio in Toscana. Ed. Il Fiore, Firenze.
ARYANA P., WILSON B., STRAUSS C. R., WILLIAMS P. J. (1987). The properties of
glycosidases of vitis vinifera and a comparison of their β-glucosidase activity with that of
exogenous enzymes. An assessment of possible applications in enology. Am. J. Enol. Vitic.
38(3): 182–188.
ARTEA (2008). Il potenziale viticolo della Toscana. Newsletter, n. 31, marzo: 1-30.
ASSELIN C. (1999). Territoires et zones viticoles: aspect climatiques, pedologiques,
agronomiques. Caractérisassion des terroirs viticoles: un ètude systémique. Atti Simp. Int.
„Territorio e vino: Siena‟, Ed. Cantagalli-Città del vino, Siena: 57-70.
ASSELIN C. (2001). Relazioni e interazioni tra i fattori dell’ambiente viticolo e la qualità
dell’uva e dei vini. Atti Simp. Int. „Il Sangiovese‟ Firenze, Ed. ARSIA: 151-158.
ASSELIN C., MORLAT R., BARBEAU G. (2003). Les Terroirs Viticoles: du concept au
produit. In „Terroir Zonazione Viticoltura‟, Phytoline Editore, Rivoli Veronese: 159-186.
AUSTERWEIL G. (1946)-Ind. Parfum: 1-195.
BANDINELLI R., LORETI F., MANCUSO S., PISANI P.L., PORCINAI S.,
SCALABRELLI G. (2001). Osservazioni comparative su sette cloni di ‘Sangiovese’ nel
‘Chianti Classico’. Atti Simp. Int. „Il Sangiovese‟ Firenze, Ed. ARSIA: 219-232.
BANDINELLI R., BOSELLI M., DI COLLALTO G., PISANI P.L. (2006). Ricerche
Preliminari su alcuni biotipi di Sangiovese reperiti in Toscana. Atti Simp. Int. „Il Sangiovese
identità e peculiarità di un vitigno tipico e internazionale‟ Firenze, Ed. ARSIA: 297-306.
BAGNOLI G., BRUGALI L., DI COLLALTO G., SCALABRELLI G. (2001). Ricerche sulla
densità di piantagione del ‘Sangiovese’ in Maremma toscana: risultati di un triennio di
osservazioni. Atti Simp. Int. „Il Sangiovese‟ Firenze, Ed. ARSIA: 271-276.
BAGNOLI R., MATTII G.B., GALLUZZI G. (2006). Valutazione bio-agronomica di cloni di
Sangiovese in Toscana. Atti Simp. Int. „Il Sangiovese‟, identità e peculiarità di un vitigno
tipico e internazionale‟ Firenze, Ed. ARSIA: 371-378.
BASSO M. (1982). ‘Agrumi, frutta e uve nella Firenze di Bartolomeo Bimbi pittore mediceo’.
F.&F. Parretti Grafiche, Firenze: 137-157.

203
BAYANOVE C.(1993) Les composés terpeniques.: Les acquisitions récentes en
chromatographie du vin. Applications á l´ analyse sensorielle des vins, B. Doneche, (Ed.), 99-
119, ISBN: 2877773647, Paris, France .
BERTUCCIOLI M., FERRARI S., SILIANI A., ZINI S. (2001). Il ruolo del Sangiovese per
la produzione di vini di qualità. Atti Simp. Int. „Il Sangiovese‟ Firenze, 15-17 febbraio 2000.
Ed. ARSIA: 364-372.
BERTUCCIOLI M., FERRARI S., LENCIONI L., SILIANI A., ZINI S. (2001). Effetti della
densità di piantagione e del sesto di impianto sulla composizione delle uve e vini di
Sangiovese in due zone del Chianti Classico. Atti Simp. Int. „Il Sangiovese‟ Firenze ,15-17
febbraio 2000. Ed. ARSIA: 457-470.
BERTUCCIOLI M. (2006). Idoneità e peculiarità del Sangiovese e gusto internazionale. Atti
Simp. Int. „Il Sangiovese, identità e peculiarità di un vitigno tipico e internazionale‟ Firenze,
Ed. ARSIA: 253-264.
BIAGIOLI G. (1999). Les vignes en pente des ‘Cinque terre’ une merveille humane en
danger, in La protection des terroir viticoles. CERVIM Univ M de Montaigne Bordeaux III,
Paris: 114-222.
BOGONI M. (1998). Capire il territorio per attuare una politica di qualità: I risultati della
zonazione viticola del territorio di Castagneto Carducci. Il Consenso (1-2).
BOGONI M. (1999). La zonazione della DOC Bolgheri: aspetti metodologici ed applicativi.
Atti del Simp. Int. „Territorio e vino: Siena‟, Ed. Cantagalli-Città del vino, Siena: 1877-198.
BOIDRON J. N. (1978)-Ann. Technol. Agric. 27 (1) 141.
BOSELLI M., PISANI P.L., BANDINELLI R., MANCUSO S., MASI E. (2001). Influenze
genetiche e colturali sull’equilibrio produttivo del vitigno Sangiovese. Atti Simp. Int. „Il
Sangiovese‟ Firenze, Ed. ARSIA: 213-218.
BOSELLI M. (2006). Tradizione e innovazione nella gestione tecnico-viticola del
Sangiovese. Atti Simp. Int. „Il Sangiovese, identità e peculiarità di un vitigno tipico e
internazionale‟ Firenze, Ed. ARSIA: 171-175.
BOSELLI M., BANDINELLI R., PISANI L., LORETI F., SCALABRELLI G, TRIOLO E.,
MATERAZZI A., BERTUCCIOLI M., PORCINAI S. (2006). Risultati vegeto produttivi di
sette nuovi cloni di ‘Sangiovese’ nel territorio di produzione del Chianti Classico. Atti Simp.
Int. „Il Sangiovese, identità e peculiarità di un vitigno tipico e internazionale‟ Firenze, Ed.
ARSIA: 523-528.

204
BRANCADORO L., FAILLA O., SCIENZA A. (2006). Indagini sulla maturazione fenolica
del Sangiovese nell’ambiente di Montalcino. Atti Simp. Int. Il „Sangiovese, identità e
peculiarità di un vitigno tipico e internazionale‟ Firenze, Ed. ARSIA: 361-364.
BRANCADORO L., FAILLA O., TONINATO L., SCIENZA A. (2006). Risultati di indagini
di zonazione a diversa scala effettuate nel territorio toscano. Quad. Vitic. Enol. Univ. Torino,
28, 2005-2006: 281-291.
BRANCADORO L.,TONINATO L., FAILLA O., MARIANI L., SCIENZA A. (2006).
Influenza di diversi pedoclimi toscani sulle risposte produttive e qualitative del Sangiovese.
Atti Simp. Int. „Il Sangiovese, identità e peculiarità di un vitigno tipico e internazionale‟
Firenze, Ed. ARSIA: 353-360.
BUCELLI P., COSTANTINI A.C., STORCHI P. (2010). It is possible to predict Sangiovese
wine quality through limited number of variables measured on the vines. J. Int. Sci. Vigne
Vin, 44, n°4: 207-218.
CABRITA J.M.,FREITAS C.A.M., LAUEANO O., DI STEFANO R. (2006). Glycoside
aroma compounds of some Portuguese grape cultivar–J. Sci. Food Agric. 86: 926-931.
CAMPOSTRINI F., COSTANTINI E. (1996). Vino nobile di Montepulciano: zonazione e
valorizzazione del territorio. Ed. Regione Toscana, Firenze.
CARBONNEAU A. (1993). Définition du terroir ou des terroirs. Comm. 8° session G. E.
Physiologie de la vigne, O.I.V., Paris.
CARBONNEAU A. (2000). Climat et sol: critères d’évaluation et effets sur le comportement
de la vigne. 3° Simp. Int. Zonificacion vitivinicola, 6-13 de Mayo 2000, Tenerife, Sotés ed.,
Madrid.
CARBONNEAU A. (2003). Ecophysiologie de la vigne et terroir. “Terroir Zonazione
Viticoltura”, Phytoline Ed., Rivoli Veronese: 61-102.
CASTERAN P. (1971). Conduite de la vigne. Sciences et techniques de la vigne- Tome II‟,
Dunod, Paris : 101-207.
CORDONNIER R. (1956) - Recherches sur l’aromatisation et le parfum des vins doux
naturels et des vins de liqueur. Ann. Technol. Agr. 5, 75-110.
CORDONNIE R. e BAYANOVE C. (1974) C. R. Acad. Sci. Paris 278- 387.
COSTANTINI E.A.C., CAMPOSTRINI F., ARCARA P.G., CHERUBINI P., STORCHI P.
and PIERUCCI M. (1996). Soil and climate functional characters of grape ripening and wine
quality of „Vino Nobile di Montepulciano‟. Acta Hort. 427 ISHS: 45-55.
COSTANTINI E.A.C., BARBETTI R., L‟ABATAE G., BUCELLI P., PELLEGRINI S.,
STORCHI P. (2006). La cartografia della provincia di Siena attraverso un approccio

205
climatico, geomorfologico, pedologico ed agronomico. Atti Conv. Int. Paesaggi, terroirs e i
paesaggi del vino. Perugia 6-9 novembre 2006. AIS: 123-139.
COSTANTINI E.A.C., BARBETTI R., BUCELLI P., L‟ ABATE G., LELLI L.,
PELLEGRINI S., STORCHI P. (2006). Land peculiarity of the vine cultivation areas in the
province of Siena (Italy), with reference to the viticultural and oenological results of
Sangiovese vine. Boll. Soc. Geol. It., Vol. Speciale n. 6: 147-159.
COSTANTINI E.A.C., PELLEGRINI S., VIGNOZZI N. and BARBETTI R. (2006).
Micomorphological characterization and monitoring of internal drainage in soils of
vineyards and olive groves in central Italy. Geoderma 131: 388-403.
COSTANTINI E.A.C., BUCELLI P. (2008). Suolo ed altre colture di qualità: l’introduzione
e la pratica dei concetti di ‘terroir’ e zonazione. Ital. J. Agron./Riv. Agron., 1 Suppl.: 23-33.
COSTANTINI E. A.C., BARBETTI R., BUCELLI P., L‟ABATE G., PELLEGRINI S.,
STORCHI P. (2008). Scale dependance of soil and climate functional characteristics for
qualitative Sangiovese vine production. Atti Congresso Mondiale della vigna e del vino OIV,
Verona,15-20 giugno 2008: 1- 8.
COSTANTINI E.A.C., PELLEGRINI S., BUCELLI P.,STORCHI P., VIGNOZZI N.,
BARBETTI R., CAMPAGNOLO S. (2008). Using ΔC13 to assess viticultural and
oenological suitability for Sangiovese of different pedoclimatic conditions in Chianti. VIIth
Int. terroir Congress, Nyon (Swiss) 19-23 mai 2008 ACW:1-6.
COSTANTINI E.A.C., BUCELLI P., STORCHI P.,PELLEGRINI S., VIGNOZZI N.,
PRIORI S., BARBETTI R., NATAREKKI L., PERRIA R., L‟ABATE G. (2010) Carattteri e
qualità pedologiche e climatiche funzionali alla valorizzazione della vocazione del territorio
al Sangiovese Riv . Enol.N 1-2-3-4 149-161.
COTARELLA R. (2001). Aspetti del marketing del Sangiovese. Atti Simp. Int. „Il
Sangiovese‟, Firenze, Ed. ARSIA: 63-66.
CRICCO J. and TONINATO L. (2004). La zonazione di Cerreto Guidi e Vinci. La scoperta
di un territorio. Comuni di Cerreto Guidi e Vinci.
DELOIRE, A. LOPEZ, F. and CARBONNEAU, A. (2002). Responses de la vigne et terroir
elements pour une methode d'etude. Progrès Agricole et Viticole 119(4): 78-86.
DE ROSSO M., PANIGHEL A. (2010). Chemical Characterization and Ecological Potential
of Raboso Varities by study of Secondary Grape Metabolites J.Agric. Food Chem 11364-
11371.
DI COLLALTO G., SCALABRELLI G. and FERRONI G. (2001). Osservazioni preliminari
sull’attività vegeto-produttiva del ‘Sangiovese’ innestato su tredici portinnesti nella zona di

206
produzione del Morellino di Scansano. Atti Simp. Int. „Il Sangiovese‟ Firenze , Ed. ARSIA:
259-264.
DI STEFANO R.,BOTTERO S., PIGELLA R., BORSA D., BEZZO G., CORINO L. (1998).
Precursori d’aroma glicosilati presenti nelle uve di alcune cultivar a frutto colorato.
L‟enotecnico: 63-73.
DI STEFANO R., GENTILINI N.,UMMARINO I. (2000). Studio dei profili aromatici di
varietà a frutto bianco coltivate nella zona del collio. L‟enologo: 95-102.
DI VECCHI STARAZ M., BANDINELLI R., BOSELLI M., PATRICE T., BOURSIQUOT
J.M., LAUCOU V., LACOMBE T. (2007). Genetic Structuring and Parentage Analysis for
Evolutionary Studies in Grapevine: Kin Group and Origin of the Cultivar Sangiovese
Revealed. Journal of the American Society for Horticultural Science.
D‟ONOFRIO C. (2011). Caratterizzazione funzionale di alcuni geni della biosintesi degli
aromi delle uve durante lo sviluppo dell’acino e controllo della qualità aromatica delle uve.
Italus Hortus 18 (1): 39-61. Review n.13.
D‟ONOFRIO C., MATARESE F., SCALABRELLI G., BOSS P.K (2012). Caratterizzazione
funzionale di alcuni geni della biosintesi degli aromi nelle uve. Italus Hortus: 3-5, 68-71.
DUCCI E., D‟ONOFRIO C., FERRONI G., SCALABRELLI G. (2012). Contributo
dell’analisi sensoriale allo studio della maturità delle uve ‘Sangiovese’ di diverse zone della
Toscana. Acta Italus Hortus :3-5, 144-149.
EGGER, E. GRECO, G. STORCHI, P., GRILLO, S. (1996). First results of the research on
the ecology of the Sangiovese variety in the province of Arezzo. Acta Hort. (427) : 295-302.
ENZEL C. R. (1985)–Pure Appl.–Chem. 57 (5) 693.
FAILLA O., SCIENZA A. (1999). Le zonazioni, esercizio accademico e servizio al mondo
vitivinicolo?. Supplemento a L‟informatore agrario16:5.
FALCETTI M. 1994. Le terroir. Qu’est qu’un terroir? Pourquoi l’etudier? Pourquoi
l’enseigner?. Bulletin de l‟O.I.V., 757-758: 246-275.
FREGONI M. (2003). Definizione di terroir e di zonazione. ‘Terroir zonazione viticoltura’
.Phytoline editore, Rivoli veronese: 23-25, 115-128.
FREGONI M. (2005). Viticoltura di Qualità. Phytoline.
FREGONI M. (2006). Il Sangiovese, vitigno autoctono e internazionale: evoluzione e
strategie di sviluppo. Atti Simp. Int. „Il Sangiovese. identità e peculiarità di un vitigno tipico e
internazionale‟ Firenze, Ed. ARSIA: 171-175.

207
GALLENTI G., COSMINA M. (2001). L’analisi sensoriale e la valorizzazione qualitativa
del prodotto vitivinicolo: problematiche teoriche e verifiche empiriche. Atti Simp. Int. Il
„Sangiovese‟. Firenze, Ed. ARSIA: 67-78.
GIANNETTI F., FAVIERE V., BUCELLI P., PIRACCI A.( 2001). Caratteri enologici di
Sangiovese in quattro diverse zone della Toscana. Atti Simp. Int. „Il Sangiovese‟ Firenze, Ed.
ARSIA: 379-384.
GROSSMAN M., SUKRAN I. RAPP A. (1990). Deutsche Lebensmitt. Rund
GUNATA Y. Z. (1984). Rechercher sur la fraction lièe de l’arome du raisin. Importance des
terpenylglycosides. Action des glycosidases. These Dr. Ing. University of Montpellier, France.
GUNATA Z., BIRON C., SAPIS J. C., BAYANOVE C. (1989).Vitis 28 191.
GUTH H. (1997). Quantification and sensory studies of character impact odorants of
different white wine varieties. J.Agric.Food Chem. 45: 3027-3032.
IACONO, F., PORRO D., BRANCADORO L., SCIENZA A. (2001). Tipicizzazione del vino
Sangiovese attraverso tecniche di assemblaggio di differenti selezioni clonali: applicazione
innovativa dell’analisi sensoriale. Atti Simp. Int. „Il Sangiovese‟ Firenze, Ed. ARSIA: 461-
468 .
INTRIERI C. (1995). La densità di impianto e l’equilibrio fisiologico: due principi a
confronto per la viticoltura del 2000. Rivista di Frutticoltura, 11: 11-23.
INTRIERI C., PONI S. (2000). Physiological response of winegrape to management practice
for successful mechanization of quality vineyards. Acta Hort. (ISHS) 526: 33-48.
JOHNSON H., HALLIDAY J. (1992). The sinther’s Art. New York, Simmer and Shuster.
Scienza A. 1998. La zonazione tra natura e cultura. Il Consenso (1-2): 31-38.
KALUA C.M.,BOSS P.K., (2009). Evolution of voltaic compounds during the development
of Cabernet- Sauvignon grapes. J. Sci. Food Agric.
LANATI D., BONONO M., MAZZA G. (2001). Precursori d’aroma e profilo varietale della
cultivar Sangiovese. Atti Simp. Int. Firenze 15-17 febbraio.447- 452.
LAWLEY F. (1870). Modo di coltivare le viti e di fare il vino. Manuale del Vignajuolo. Ed.
Bettini, Firenze.
LORETI F., SCALABRELLI G. (2007). Sistemi di impianto, forme di allevamento, tecniche
di potatura. In „Storia Regionale della Vite e del Vino in Italia. Toscana‟, Firenze: 393-444.
LOSCOS N., HERNANDEZ HORTE P., CACHO J., FERREIRA V. (2007). Release and
formation on varietas aroma compounds during alcoholic fermentation from non floral grape
odorless flavor precursors fraction. J. Sci. Agric. Food Chem. 55: 6674-6684.

208
MAINARDI G. (2000). Storia di un grande protagonista dell’enologia italiana: il Sangiovese
Atti Simp. Int. Firenze, Palazzo dei Congressi Arsia 15- 17 Febbraio 2000, 17-25.
MALTMAN A. (2008). The role of Vineyard Geology in Wine Typicity Journal of Wine
Research Vol. 19 No 1: 1-17.
MARAIS J. (1983). Terpenes in the aroma of grapes and wines, a review S. Afr J. Enol vitic
4: 49-60.
MATEO J.J., GENTILINI N., HUERTA T., JIMENEZ M., DI STEFANO R. (1997).
Fractionation of glycoside precursors of aroma in grapes and wine. Ed. Elsevier : 219-224.
MATTII G.B., ORLANDINI S., CALABRESE C.E. (2005). Analysis of grapevine vegeto-
productive responses to plant density and rootstock. XIV Int. GESCO Viticulture Congress,
Geisenheim, Germany, 23-27 August, 2005: pag. 6.
MORETTI G., SCALABRELLI G. (2007). Catalogo dei Cloni di vite Omologati dei vitigni
ad uva da vino in Italia. Unione Italiana Vini – Enovitis: 1-207.
MORLAT R. (1989). Le terroir viticole: contribution a l’ètude de sa carecterisation et de son
influence sur le vins; application aux vignolese rouges de la Moyenne Vallee de la Loire.
These d‟Etat Bordeaux II.
MORLAT R., GUILBAULT P., THELIER-HUCHE L., RIOUX D. (1999). Ètude intégrée et
alleégée des terroirs viticoles en Anjou: Caractérisation et zonage de l’unité terroir de base,
en relation avec une enquête parcellaire. Atti del Simposio Internazionale „Territorio e vino:
Siena‟, Edizioni Cantagalli-Città del vino, Siena: 293-306.
MORLAT R. (2001). Terroirs viticoles: ètude et valorisation. Openplurumedia Chaintrè.
ORLANDINI S., DELLA MARTA A., ZIPOLI G., MANCINI M. (2003). Monitoraggio
agroclimatico a scala aziendale. Supplemento a „L‟informatore agrario‟, 14: 19-25.
PALLIOTTI A., CARTECHINI A., PETOUMENOU D., STORCHI P., VALRENTINI P.,
DEI BANCHI R., PERSIA A. (2001). Valutazione dell’attività vegetativa e produttiva del
Sangiovese innestato su diversi portinnesti in Italia centrale. Atti Simp. Int. „Il Sangiovese
identità e peculiarità di un vitigno tipico e internazionale‟. Firenze, Ed. ARSIA: 379-386.
PINNA M.B., MURRU M., ARGIOLAS F., ARGIOLAS A., FILIPPINO G., FLORIS T.,
SCRUGLI S. (2009). Aromatic characterizazion of Cagliari Malvasia. III Simposio Inter.
Malvasia Spagna 26-30 maggio.
PIRACCI A. (2001). Innovazioni tecnologiche per l’esaltazione delle caratteristiche
specifiche del Sangiovese. Atti Simp. Int. „Il Sangiovese‟ Firenze, 15-17 febbraio 2000. Ed.
ARSIA: 373-378.

209
PISANI P.L., BOSELLI M., BANDINELLI R., LORETI F., SCALABRELLI G. (2000).
Risultati conseguiti dalle ricerche nel quinquennio 1995-1999: aspetti agronomici, biologici,
fisiologici ed ampelografici. Progetto Chianti Classico 2000 settore Viticoltura, 5: 11-68.
PONI S. (2001). Fisiologia di comportamento del Sangiovese: aspetti di base e
considerazioni applicative. Atti Simp. Int. „Il Sangiovese‟ Firenze, 15-17 febbraio 2000. Ed.
ARSIA: 159-167.
PONI S. (2003). La potatura verde nel vigneto aspetti fisiologici e colturali. L‟Informatore
Agrario (26), 37-49.
PONI S., BERNIZZONI F.,CIVARDI S. (2008). The effect of early leaf removal on whole
canopy gas exchange and vine performance of Vitis vinifera L. ‘Sangiovese’ Vitis 47 :1-6.
QUADERNI TECNICI VCR (2003). I cloni originali vcr di Sangiovese 1-27.
RAPP A. (1987). In frontiers of flavor. Ed. Charalambous Ensevier Amsterdam.
REMORINI D., SCALABRELLI G., MASSAI R., TATTINI M. (2007). Risposte fisiologiche
di due vitigni al diverso regime idrico, con particolare riguardo al contenuto di sostanze
fenoliche nelle foglie e negli acini. Italus Hortus, vol. 14 (3): 382-385.
REYNOLDS G. (2012). Soil and Climate Interaction with Grapevines. IXe International
Terroirs Congress 2012.
RIBEREAU-GAYON P., DUBOURDIEU D.,DONECHE B., LONVAUD A. (2003).
Trattato di Enologia 1. Microbiologia del vino e Vinificazioni. Edagricole, Bologna.
RIBEREAU-GAYON P., DUBOURDIEU D.,DONECHE B., LONVAUD A. (2003).
Trattato di Enologia 2. Chimica del vino, stabilizzazione e trattamenti. Edagricole, Bologna.
RIBEREAU-GAYON P., BOIDRON,J.N. & TERRIER,A. (1975). Aroma of muscat grape
varieties. J.Agric.Food Chem. 23(6):1042-1047.
RIOU C., MORLAT R., ASSELIN C. (1995). Une approche intégrée des terroirs viticoles:
discussion sur les critères de caractérisation accessibles. „Bulletin O.I. V.‟ 767-768: 92-106.
RYONA I., PAN B.S., INTRIGLIOLO D.S.,LAKSO A.N., SACKS G.L. (2008). Effects of
cluste light exposure on 3-isobutyl-2-methoxypyrazine accumulation and degradation pattern
in red wine grape .J. Agric. Food Chem.
SCALABRELLI G., DI COLLALTO G. (1999). Progetto per il rinnovamento e la
valorizzazione della viticoltura della provincia di Grosseto. In „Rinnovamento e
Valorizzazione della viticoltura della provincia di Grosseto‟. Provincia di Grosseto. ARSIA.
Regione Toscana: 1-64.

210
SCALABRELLI G., LORETI F., PISANI P.L., BANDINELLI R., PORCINAI S. (2001).
Effetto della densità di piantagione sull’attività vegeto produttiva del ‘Sangiovese’ nel
Chianti Classico. Atti Simp. Int. „Il Sangiovese‟ Firenze, Ed. ARSIA: 233-240.
SCALABRELLI G., LORETI F., PISANI P.L., BANDINELLI R. and PORCINAI S. (2001).
Comportamento bio-agronomico del ‘Sangiovese’ su diversi portinnesti nel Chianti Classico.
Atti Simp. Int. „Il Sangiovese‟ Firenze, Ed ARSIA: 233-240.
SCALABRELLI G. (2002). La Vitivinicoltura e il carattere del ‘Morellino’. In Ciuffoletti Z.,
Nanni P. Un vino di Maremma: il Morellino di Scansano. Editrice Laurum: 77-129.
SCALABRELLI, G. FERRONI G., D'ONOFRIO C., DI COLLALTO G., VENERINI F.
(2003). Trials with ‘Sangiovese’ grafted on several grapevine rootstocks in two different
areas of Tuscany. Acta Hort. (ISHS) 617:73-83.
SCALABRELLI G., BORGO M., D‟ONOFRIO C., ANGELINI E. and DE LORENZIS G.,
(2006). Il recupero del germoplasma viticolo nell’area della DOC Montecucco. Convegno „I
Vitigni Autoctoni Minori‟, Villa Gualino, Torino, 30-11-2006/01-12-2006. Vol. unico,
Sessione 3 N-Z: 6-13.
SCALABRELLI G., D‟ONOFRIO C., MACCHIA A., ROSELLINI D., BERTUCCIOLI M.,
BOSELLI M. (2006). Comportamento agronomico del vitigno ‘Sangiovese’ in undici zone del
Chianti Classico. Atti Simp. Int. „Il Sangiovese identità e peculiarità di un vitigno tipico e
internazionale‟ Firenze, Ed. ARSIA: 529-540.
SCALABRELLI G., D‟ONOFRIO C., FERRONI G., BAGNOLI G., DI COLLALTO G.
(2006). Osservazioni sul comportamento del vitigno ‘Sangiovese’ allevato a diversa altezza
della parete vegetativa. II° Simp. Int. „Il Sangiovese identità e peculiarità di un vitigno tipico
e internazionale‟ Firenze, Ed ARSIA: 205-214.
SCALABRELLI G., D‟ONOFRIO C., FERRONI G., BAGNOLI G., DI COLLALTO G.
(2006). Osservazioni sul comportamento del vitigno ‘Sangiovese’ allevato a diversa altezza
della parete vegetativa. Atti Simp. Int. “Il Sangiovese identità e peculiarità di un vitigno
tipico e internazionale” Firenze, Ed. ARSIA: 205-214.
SCALABRELLI G. (2007). I vitigni autoctoni.Locus (n. 7), Felici Editore, Pisa: 45-52.
SCALABRELLI G. (2008). I terroir di eccellenza qualitativa e internazionale del Sangiovese
in Toscana. Atti III Simp. Int. „Il Sangiovese‟ Firenze, Ed. ARSIA.
SCALABRELLI G., LAGOMARSINI G. (2008). Should we concern about the future of
disadvantaged viticulture areas with globalization?, Acta, 2nd Int. Cong. of Mountain And
Steep Slope Viticulture, CERVIM, Monforte de Lemos, Espagna, Feb. 13-15: 1-11.

211
SCALABRELLI G. (2009). Quale futuro per il vivaismo viticolo toscano?. I Georgofili,
Quaderni 2008 III Sezione Centro Ovest, Lo Sviluppo del vivaismo toscano, Pistoia
5/12/2008: 147-177, Felici editore.
SCALABRELLI G. (2009). Viticulture for the third millenium, safeguard and innovation.
Acta 16th
International GIESCO Symposium, July 12-15, 2009 University of California,
Davis: 63-70.
SCALABRELLI G. (2010). Non solo vino dal vigneto: agresto e altro. Vitenda N°16 (1):
136-137.
SCALABRELLI G. (2013). Wine and Food Excellence between Local identity and market
requirements. Wine and Food Tourism First European Conference. Ed. ETS: 87-120.
SCHREIER P., DRAWERT F., JUNKER A. (1976). Identification of volatile constituents
from grapes. J. Agric Food Chem. 24: 331-336.
SCIENZA A., BOGONI M., BRANCADORO L., VALENTI L., ROMANO F. (1990). La
conoscenza dei rapporti tra vitigno ed ambiente quale strumento programmatorio in
viticoltura: stima della vocazionalità viticola dell’Oltrepò Pavese. Vignevini, Suppl. al n.12,
4-62.
SCIENZA A. (1998). La zonazione viticola tra natura e cultura. In ‘Capire il territorio per
attuare una politica di qualità‟. Seminario Permanente Luigi Vigorelli, Bergamo: 31-38.
SCIENZA A. (2002). Viticoltura di precisione: programmare la qualità del vigneto.
Supplemento a „L‟informatore agrario‟.
SIMPSON R.F. (1978). 1,1,6-trimethyl-1,2-dihydronaphtalene: an important contributor to
the bottle aged bouquet of wine. Chem. Industr. 1:37.
SKOUROUMOUNISG. K., MASSY-WESTROPP R. A., SEFTON M. A., WILLIAMS P. J.
(1992). Tetrahed Lett. 33 (24) 3533.
STORCHI P., COSTANTINI., E.A.C., BUCELLI P. (2005). The Influence of Climate and
Soil on Viticultural and Enological Parameters of ‘Sangiovese’ Grapevines under Non-
irrigated Conditions. Proc. VIIth IS on Grapevine, Acta Hort. 689, ISHS: 333-340.
STORCHI P., ORLANDINI S., GALLIGANI U., PINZAUTI S., D‟ARCANGELO M.,
MANCINI M., DALLA MARTA A., MATTEOLI A. (2006). Valorizzazione del Sangiovese
attraverso lo studio dei rapporti tra ambiente e vitigno a scala aziendale: l’esempio della
fattoria ‘Poggio Casciano’. Atti Simp. Int. „Il Sangiovese identità e peculiarità di un vitigno
tipico e internazionale‟. Firenze, Ed. ARSIA: 387-394.
STRAUSS C. R., WILSON B., GOODLEY P. R., WILLIAMS P. J. (1986). Role of
monoterpenes in grape and wine PHENOL-FREE RIESLING GLYCOSIDES 247 flavor. In

212
Biogeneration of Aroma.(T. H. Parliament and R. Croteau, Eds.), pp. 222–242. Am. Chem.
Society, Washington.
STRAUSS C. R., WILSON B., WILLIAMS P. J. (1988) – J. Agric Food Chem. 36 569.
TAMAI G. (2009). Catalogo dei Cloni.Varietà di uva da vino. Edagricole, Calderini,
Bologna.
TOMASI D., CALO‟ A., PASCARELLA G., PITACCOA., BORSA D., GAIOTTI F. (2007).
Effetti dell’incremento termico sulla qualità dell’uva: il caso della Garganega e le sue forme
di allevamento. XXX Congresso mondiale della viticoltura e dell‟enologia Budapest 10-16
giugno.
TONINATO L., BERNAVA M., CRICCO J. BRANCADORO L. (2005). Caratterizzazione
dei terroirs di Vinci e Cerreto Guidi mediante le risposte del Sangiovese. L‟Informatore
Agrario, 2: 7-13.
TONINATO, L. BONCOMPAGNI, S. BRANCADORO, L. FAILLA, O. SCIENZA, A.
(2006). Zonazione e qualità dei vini nella provincia di Arezzo. L'Informatore Agrario (25):
54-57.
TURRI S. and INTRIERI C. (1987). Mappe isotermiche ed insediamenti viticoli in Emilia
Romagna. Vignevini, 10.
TURRI S. and INTRIERI C (1988). Fenologia e climatologia applicata alla Vitis vinifera:
appunti metodologici. ATTI, Accademia Italiana della Vite e del Vino, Siena, 40: 191-206.
UNIONE ITALIANA VINI. Laboratorio Chimico Sensoriale.
VAN LEEUWEN C., FRIANT P., CHONE‟ X.,TREGOAT O., KONDOURAS S.,
DUBORDIEU D. (2004). Influence of climate, soil, and Cultivar on terroir Am.
J.Enol.Vitic.55:3 207-217.
VAN LEEUWEN C., SEGUIN G. (2006). The concept of Terroir in Viticulture Journal of
Wine Research , Vol 17, No 1 1-10.
VAUDOUR E. (2002). The quality of Grapes and Wine in Relation to Geography: Notions of
Terroir at Various Scales. Journal of Wine Research Vol. 13 No 2 , 117-141.
VAUDOUR E. (2005). Grapevine responses to terroir: a gllobal approach J.Int.Sci.Vigna
Vin 39, n° 4, 149-162.
VAUDOUR E. (2005). I terroir. Definizioni, caratterizzazione e protezione, Edagricole,
Bologna.
VOIRIN S., BAUMES R., BITTEUR S., GUNATA Y., BAYANOVE C. (1990). Novel
monoterpene disaccharide glycosides of vitis vinifera grapes. J.Agric.Food Chem. 38:1373-
78.

213
VOUILLAMOZ F., IMAZIO S., STEFANINIM., SCIENZA A., GRANDO M.S. (2004).
Relazioni genetiche del Sangiovese. Atti II° Simp. Int. „Il Sangiovese identità e peculiarità di
un vitigno internazionale‟ (Abstract 22), Firenze 17-19 novembre.
WILLIAMS P., STRAUSS C., WILSON B., MASSY WESTROPP R. (1982). Novel
monoterpene disaccharide glycosides of vitis vinifera grapes and wines. Phytochem.,
21(8):2013-20.
WINTERHALTER P. (1993). In flavour precursors. Thermal and enzymatic conversions.
eds. R. Teranishi, G. Takeoka and M. Guntert. Acs series 490.

ACKNOWLEDGEMENTS TO:
Prof. Giancarlo Scalabrelli, Dr. Claudio D’Onofrio of Department of Agriculture, Food
and Environment, University of Pisa for viticultural advice and all the staff of „Laboratory of
Viticulture and Oenology‟ of San Piero a Grado.
Dott.ssa Angela Cuzzola of Department of Agriculture, Food and Environment, University
of Pisa for gas chromatography – mass spectrometry advice.
Dr. Giuseppe Ferroni of Department of Agriculture, Food and Environment, University of
Pisa for advice in the sensorial analysis of wines.
‘Beconcini’ estate, ‘Capannelle’ estate, ‘Casanova di Neri’ estate, ‘Castello di Albola’
estate, ‘ColleMassari’ estate, ‘Col d’Orcia’ estate, ‘Fattoria di Magliano’ estate, ‘La
Mannella’ estate and ‘Salustri’ estate for „Sangiovese‟ sampling.
Research carried out within the project „Qualitative characterization of grapevine Sangiovese
and wines in different area‟ supported by „Montecucco‟ and „Bertarelli‟ Foundations.