Embed Size (px)
Citation preview
The Propagation of Shocks Across International Equity Markets:
A Microstructure Perspective
Dion Bongaerts, Richard Roll, Dominik Rösch, Mathijs van Dijk, and Darya Yuferova∗
July 2015
Abstract
We study the high-frequency propagation of shocks across international equity mar-kets. We identify intraday shocks to stock prices, liquidity, and trading activity for12 equity markets around the world based on non-parametric jump statistics at the5-minute frequency from 1996 to 2011. Shocks to prices are prevalent and large, withregular spillovers across markets – even within the same 5-minute interval. We findthat price shocks are predominantly driven by information rather than liquidity. Con-sistent with the information channel, price shocks do not revert and often occur aroundmacroeconomic news announcements. Liquidity shocks tend to be isolated events thatare neither associated with price shocks nor with liquidity shocks on other markets.Our results challenge the widespread view that liquidity plays an important role in theorigination and propagation of financial market shocks.
∗Bongaerts, Rösch, van Dijk, and Yuferova are at the Rotterdam School of Management, ErasmusUniversity; Roll is at the California Institute of Technology. E-mail addresses: [email protected],[email protected], [email protected], [email protected], and [email protected]. We are grateful to Yakov Amihud,Torben Andersen, Joachim Grammig, Charles-Albert Lehalle, Francis Longstaff, Albert Menkveld, AsaniSarkar, Ramabhadran Thirumalai, Michel van der Wel, Christian Voight, Avi Wohl, seminar participants atErasmus University, and conference participants at the 5th Emerging Markets Finance Conference in Bombay,the 2014 Extreme Events in Finance conference in Royaumont, the 8th Financial Risks International Forumin Paris, the 2014 German Finance Association meeting in Karlsruhe, and the 2014 INFER workshop in Bor-deaux for helpful comments. We thank Michel van der Wel for sharing the U.S. macro news announcementsdata. Van Dijk gratefully acknowledges financial support from the Vereniging Trustfonds Erasmus Univer-siteit Rotterdam and from the Netherlands Organisation for Scientific Research through a “Vidi” grant. Thiswork was carried out on the National e-infrastructure with the support of SURF Foundation. We thankOneMarket Data for the use of their OneTick software.
1. Introduction
Since at least the stock market crash of October 1987, investors, policy makers, and
researchers have been interested in whether and how shocks to one financial market spread
to other markets. The Mexican, Asian, and LTCM crises in the 1990s were accompanied by
the emergence of a large literature on international financial market linkages and financial
contagion. The recent global financial crisis has further highlighted how shocks to certain
financial markets can rapidly spread to markets for other asset classes and to markets in other
countries. Yet, the channels through which financial market shocks originate and propagate
across markets are not well understood.1
A growing body of theoretical research points at an important role for market liquidity. In
particular, recent theories feature “sudden liquidity dry-ups,” “liquidity crashes,” or “liquidity
black holes” that arise through channels related to the supply of and/or demand for liquidity;
in turn, these liquidity shocks induce shocks to security prices and spillovers to other markets.2
Prominent accounts of the recent crisis (e.g., Brunnermeier, 2008; Brunnermeier, Crockett,
Goodhart, Persaud, and Shin, 2009; Gorton, 2009a,b) emphasize the importance of these
liquidity channels, but direct empirical evidence is limited.
In this paper, we aim to test the relevance of the liquidity channel for the origination and
propagation of financial market shocks by taking a microstructure perspective. Specifically,
we analyze why shocks to equity prices occur and whether and how they spread across markets
by investigating their relation with shocks to market liquidity and trading activity, using
microstructure data for 12 developed and emerging equity markets around the world over
the period 1996-2011. To the best of our knowledge, we are the first to study cross-market
1See, among others, Eun and Shim (1989), Roll (1989), Hamao, Masulis, and Ng (1990), and Lin, Engle,and Ito (1994) for early research on the propagation of financial market shocks; Reinhart and Calvo (1996),Forbes and Rigobon (2002), Bae, Karolyi, and Stulz (2003), and Hartmann, Straetmans, and de Vries (2004)for studies on contagion; Karolyi (2003) for a literature review; and Longstaff (2010) and Bekaert, Ehrmann,Fratzscher, and Mehl (2014) for analyses of the propagation of shocks across, respectively, markets for differentasset classes and international equity markets during the recent crisis.
2Recent theoretical studies on such liquidity channels include Kyle and Xiong (2001), Gromb and Vayanos(2002), Kodres and Pritsker (2002), Bernardo and Welch (2004), Morris and Shin (2004), Yuan (2005);Gârleanu and Pedersen (2007), Pasquariello (2007), Andrade, Chang, and Seasholes (2008), Brunnermeierand Pedersen (2009), Huang and Wang (2009), and Cespa and Foucault (2014).
1
linkages of stock prices jointly with liquidity and trading activity.3 Our main alternative
hypothesis to the liquidity explanation is that shocks are driven by information; i.e., shocks
to prices may reflect economic news that could also be relevant for securities traded on other
markets (e.g., King and Wadhwani, 1990).
Our microstructure perspective also involves analyzing the origination and propagation of
shocks at a much higher frequency than prior work: 5-minute intervals within the trading day.
Most studies to date study the interconnectedness of financial markets at the daily or even
lower frequency (e.g., Bae, Karolyi, and Stulz, 2003; Hartmann, Straetmans, and de Vries,
2004; Longstaff, 2010; Bekaert, Ehrmann, Fratzscher, and Mehl, 2014; Pukthuanthong and
Roll, 2015). However, a relatively low-frequency approach could miss spillovers at higher
frequencies and fail to uncover patterns in liquidity and/or trading activity that could help
to explain the occurrence and propagation of shocks to prices within and across markets.4
We note that for developed markets in recent years, the 5-minute frequency might no longer
be perceived as high-frequency. But for emerging markets and for our full sample period
1996-2011, this seems a reasonable frequency to ensure sufficient trading in each interval as
well as sufficient time for shocks to propagate to other markets.
Using global tick-by-tick trade and quote data from the Thomson Reuters Tick History
(TRTH) database, we construct time-series at the 5-minute frequency of market-wide stock
returns (based on midquotes), liquidity (quoted and effective spreads), and trading activity
(turnover and order imbalance) for 12 equity markets over the period 1996-2011. We include
both developed and emerging equity markets within three regions: America (Brazil, Canada,
Mexico, and the U.S.), Asia (Hong Kong, India, Japan, and Malaysia), and Europe/Africa
3Several papers examine co-movement in liquidity within and across equity markets (e.g., Chordia, Roll,and Subrahmanyam, 2000; Brockman, Chung, and Pérignon, 2009; Zhang, Cai, and Cheung, 2009; Karolyi,Lee, and van Dijk, 2012) and co-movement in the turnover of individual U.S. stocks (e.g., Lo and Wang, 2000and Cremers and Mei, 2007), but none of these papers also studies stock price linkages.
4Some prior work does study intraday spillover effects of returns and/or volatility across markets (e.g.,Hamao, Masulis, and Ng, 1990; King and Wadhwani, 1990; Lin, Engle, and Ito, 1994; Susmel and Engle,1994; Ramchand and Susmel, 1998; Connolly and Wang, 2003), but these studies generally measure returnsand/or volatility over intervals of 15 minutes or one hour, look at a more limited sample of markets, and donot consider these variables jointly with liquidity and/or trading activity.
2
(France, Germany, South Africa, and the U.K.).
We identify shocks to prices, liquidity, and trading activity in each country using the jump
measure of Barndorff-Nielsen and Shephard (2006), which is a statistical non-parametric
method to test for jumps in a time-series. We propose a refinement of their method so that
we are not only able to infer whether a jump occurred on a certain day, but also in which
exact 5-minute interval. This approach allows us to create time-series of jumps in prices,
liquidity, and trading activity at the 5-minute frequency for each equity market over the
period 1996-2011 (based on data on over 5 billion transactions in total).
We first study the origination of shocks on the 12 equity markets in our sample. We
find that 5-minute jumps in prices, quoted spreads, and order imbalance are frequent, while
jumps in effective spreads and turnover are rare for most markets. The magnitudes of typical
jumps in prices, quoted spreads, and order imbalance are large, at around 4 to 6 jump-free
standard deviations.
We find little evidence that jumps in prices are accompanied by jumps in liquidity, as
measured by quoted spreads. This constitutes initial evidence that liquidity may not play
a central role in the origination of price jumps. We do find a relation between jumps in
prices and jumps in trading activity, as measured by order imbalance. Around 20% of the
jumps in prices in our sample are accompanied by jumps in order imbalance on the same day,
which is far more than expected if jumps in prices and order imbalance were independent.
Close to 8% of price jumps happen simultaneously with order imbalance jumps in the same
5-minute interval, and almost all of these involve jumps in prices and order imbalance of
the same sign. This finding could be an indication that at least some of the price jumps
are driven by temporary price pressure effects (i.e., a liquidity demand channel), but could
also be consistent with speculative trading around or portfolio rebalancing in response to the
arrival of news (i.e., an information channel).
We carry out two specific tests to distinguish the liquidity and information hypotheses.
First, we investigate whether there are reversals after jumps in prices (and after simultaneous
jumps in prices and order imbalance). We find that, whether accompanied by jumps in order
3

imbalance or not, price jumps represent sudden and permanent shocks to prices; there is
no evidence of subsequent price reversals. Second, we examine whether jumps in prices
(and simultaneous jumps in prices and order imbalance) occur around macroeconomic news
announcements stemming from one of the countries in our sample. We find that a substantial
fraction of the jumps in prices (and of the simultaneous jumps in prices and order imbalance)
occur around such announcements. For example, in developed Europe, almost 40% of the
jumps in prices and around 50% of the simultaneous jumps in prices and order imbalance
happen within one hour after a macroeconomic news announcement.5 The evidence that
price jumps do not revert and often occur around macroeconomic news announcements is
most consistent with the information channel.
We then investigate within-region and across-region spillover effects of jumps in prices,
quoted spreads, and order imbalance. We document significant spillover effects at the 5-
minute frequency for jumps in prices as well as for jumps in trading activity, based on
correlations of the time-series of jumps in prices and order imbalance, taking into account
the magnitude of the jump. These correlations are especially strong within Europe and
between Europe and the U.S. However, jumps in quoted spreads are not correlated across
different markets, which suggests that liquidity shocks do not propagate across markets and
“sudden liquidity dry-ups” are mainly local phenomena.
We further estimate logit regressions with the jumps in prices on a particular market as
the dependent variable to distinguish between same-country, within-region, and across-region
spillover effects of jumps in prices and order imbalance. This analysis confirms our findings
based on the correlations and furthermore provides evidence of the existence of spillover
effects between jumps in prices and order imbalance not only within the same country but
also within and across regions.
Overall, this paper finds little empirical support for theories in which liquidity plays a
key role in the origination and propagation of financial market shocks. Jumps in equity
5These fractions are lower for other countries, primarily because U.S. macroeconomic news announce-ments yield the strongest results, and the most important U.S. announcements (e.g., GDP, nonfarm payrollemployment) fall outside of the opening hours of the American and Asian markets.
4
prices are prevalent and large, and regularly coincide with jumps in order imbalance and
with price jumps in other markets. However, price jumps do not revert and often happen
around macroeconomic news announcements. Jumps in quoted spreads tend to be isolated
events that are neither associated with jumps in prices nor with jumps in quoted spreads on
other markets.
Of course, there are limitations to our analysis. Our focus is on the high-frequency
origination and propagation of financial market shocks, so we may miss lower-frequency
shocks to prices, liquidity, and trading activity. Nevertheless, our results also hold at the
15-minute and 1-hour frequencies (instead of the 5-minute frequency). Our evidence based on
intraday data seems to at least challenge the widely held view that financial market liquidity
can suddenly evaporate and thereby cause precipitous price drops and spillover effects to
other markets. In fact, by analyzing shocks at relatively high frequencies, we stack the cards
in favor of finding supportive evidence of a liquidity channel, since our approach allows us to
identify price jumps that revert within the day, which lower frequency analyses might miss.
Notwithstanding, our results indicate that sudden price shocks are predominantly driven by
information.
Also, our liquidity measures are limited to quoted and effective spreads, which may not
cover all relevant aspects of market liquidity. However, price impact measures estimated at
the 5-minute frequency are extremely noisy and may be mechanically related to price changes.
We do obtain similar results using a liquidity measure based on the number of stocks trading
in an interval. In separate tests, we also find little evidence that shocks to a variety of proxies
for funding liquidity (a potential liquidity supply channel) are associated with a relatively
greater prevalence of jumps in prices, liquidity, or trading activity. Furthermore, it is hard
to imagine that a true liquidity crash would not show up in quoted spreads.
Our primary contribution is to the literature on international financial market linkages
and financial contagion. We add to this line of research by analyzing such linkages across
international equity markets at the 5-minute frequency, and by offering a detailed analysis
of the dynamics of liquidity and trading activity around shocks to equity prices. We thereby
5
investigate the prediction of a number of recent theoretical studies that channels related to
the supply of and/or demand for market liquidity play an important role in the propagation
of financial market shocks. Moreover, we contribute to the literature on commonality in
liquidity and trading activity by studying the degree of cross-market co-movement in large,
sudden changes in liquidity and trading activity.
We believe that our paper sheds new light on a number of important issues. In today’s
complex, dynamic, and interconnected global financial system, it is important for investors,
exchanges, and regulators to understand whether and how shocks are propagated from one
financial market to another at high speed, what the role of liquidity and trading activity is in
the occurrence and propagation of shocks to prices, and how strong cross-market linkages are
within and across different regions. Our results may help investors to make better decisions
regarding optimal portfolio diversification, financial institutions to develop better risk man-
agement policies, and exchange officials and regulators to develop better policies to reduce
international financial fragility.
2. Data and methods
This section describes the data, variable definitions, and methods used in the paper. We
obtain intraday data on trades and quotes (and their respective sizes) from the Thomson
Reuters Tick History (TRTH) database. TRTH is provided by Securities Industry Research
Centre of Asia-Pacific (SIRCA) and includes tick-by-tick data for trades and best bid-offer
quotes stamped to the millisecond. The database is organized by Reuters Instrumental Codes
(RICs), spans different asset classes, and covers more than 400 exchanges since 1996.6
To obtain a sample that is representative of global equity markets but still manageable
in light of the vast size of the global tick-by-tick data, we pick four countries (with different
levels of development) from each of three regions classified based on their time zone: America,
6Recent papers that use the TRTH database include Boehmer, Fong, and Wu (2012), Lau, Ng, andZhang (2012), Marshall, Nguyen, and Visaltanachoti (2012), Marshall, Nguyen, and Visaltanachoti (2013a,b),Boehmer, Fong, and Wu (2014), Fong, Holden, and Trzcinka (2014), Frino, Mollica, and Zhou (2014), Lai,Ng, and Zhang (2014), and Rösch, Subrahmanyam, and van Dijk (2015).
6
Asia, and Europe/Africa.7 In particular, we select Brazil, Canada, Mexico, and the U.S. from
the American region; Hong Kong, India, Japan, and Malaysia from the Asian region; and
France, Germany, South Africa, and the U.K. from the European/African region. We obtain
the RICs for all common stocks that are traded on the major stock exchange (defined as
the exchange that handles the majority of trading volume) in each of these countries from
Datastream and then collect the RICs for all of these stocks that were part of the main local
market index at some point during the sample period from 1996 till 2011 from the TRTH
Speedguide (see Appendix A.1). Following Rösch, Subrahmanyam, and van Dijk (2015), we
apply extensive data filters to deal with outliers and trades and quotes outside of the daily
trading hours (details are in Appendix A.2).
2.1. Variable definitions
Our primary goal is to provide a microstructure perspective on the propagation of shocks
across international equity markets and to test the liquidity vs. information explanations
for why such shocks occur and spillover to other markets. Therefore, we focus on intraday
data for returns, liquidity, and trading activity at the market-level. Specifically, we choose
5-minute intervals as our unit of observation, which seems to be a reasonable compromise
between intervals that are sufficiently fine-grained to study the high-frequency propagation
of price shocks and their relation to liquidity and trading activity on the one hand, and
intervals that have enough trades to adequately measure trading activity and effective spreads
(especially in the beginning of our sample period and for the emerging markets in our sample)
and that are long enough to capture spillovers to other markets on the other hand. Our
choice of 5-minute intervals is also motivated by Tauchen and Zhou (2011), who use the
same frequency to analyze jumps in the S&P500 index (1986-2005), 10-year Treasury bonds
(1991-2005) and the dollar/yen exchange rate (1997-2004). We discard overnight changes in
prices, liquidity, and trading activity. In supplementary tests, we rerun all of our analyses at
the 15-minute and 1-hour frequencies.
7We note that even within these regions there are small differences in time zones and trading hours.
7
We first measure variables at the individual stock-level and then aggregate to the market-
level. Following Chordia, Roll, and Subrahmanyam (2008), log returns are computed over
5-minute intervals based on midpoints between the quoted bid and ask prices (rather than
based on the trade prices or on midquotes matched with the last trade in the interval) of
individual stocks. Using midquote returns has two advantages. First, it avoids the bid-ask
bounce problem that is inherent in returns based on trade prices. Second, it ensures that
returns for every stock are computed over the same 5-minute interval despite differences in
trading frequency across stocks.
We use proportional quoted spreads and proportional effective spreads (PQSPR and
PESPR) as measures of liquidity. While the former measures transaction costs only if the
trade does not exceed the depth at the best bid-offer (BBO), the latter measures the actual
transaction costs when a trade takes place. We compute PQSPR based on quote data only,
for the last BBO available for a given stock in a particular 5-minute interval. For PESPR,
we first match trade and quote data and then compute the effective spread based on the
last trade within a particular 5-minute interval as the difference between the trade price
and the prevailing midquote. PESPR is thus only available for 5-minute intervals with at
least one trade. This restriction is not very onerous as in total there are more than 5 billion
trades in our sample. We stay away from estimating price impact measures at the 5-minute
frequency, since they tend to be very noisy and may be mechanically related to price changes.
As a further test, we redo all of our analyses based on the number of stocks trading in a
specific interval as an alternative market-wide liquidity measure. Motivated by the emerging
literature on the link between market liquidity and funding liquidity (e.g., Brunnermeier and
Pedersen, 2009), we also examine whether shocks to various measures of funding liquidity
are associated with shocks to prices, liquidity, and trading activity.
We use turnover and order imbalance (OIB) to measure trading activity. We compute
turnover as the total trading volume (in local currency) of a stock during the 5-minute
interval, and scale this number by the aggregate market capitalization at the end of the
previous year. To compute OIB, we need to determine whether a trade is buyer- or seller-
8
initiated. We use the Lee and Ready (1991) algorithm to sign trades. We then compute the
OIB of a given stock as the difference between buyer- and seller-initiated trading volume (in
local currency) during the 5-minute interval, scaled by the aggregate market capitalization
at the end of the previous year. We obtain data on aggregate market capitalization (in USD)
and exchange rates from the World Bank website.
We aggregate our five main variables (returns, quoted and effective spreads, turnover,
and order imbalance) to the market-level by taking an equally-weighted average of the stock-
level variables for returns and spreads, and by summing up the scaled stock-level variables
for turnover and order imbalance. To reduce the impact of stock-level noise and to secure
a certain level of representativeness, we discard 5-minute intervals for a given market when
there are fewer than ten stocks with a trade.
2.2. Jump measure (BNS)
There is a vast literature that studies spillover effects from one market to another as
well as a plethora of different methods. For example, Bae, Karolyi, and Stulz (2003) define
“coexceedances” as the simultaneous incidence of extreme returns (identified as those in the
top or bottom 5% of the return distribution by country over the whole sample period) and
model the determinants of such coexceedances using multinomial logit models. Hartmann,
Straetmans, and de Vries (2004) use extreme value theory to show that the actual probability
of a simultaneous crash on two markets is much higher than the expected probability under
the assumption that extreme events are independent across markets. Chiang, Jeon, and Li
(2007) use a dynamic conditional correlation (DCC) model, while Rodriguez (2007) employs
a switching copula approach to document spillover effects.
In this paper, we follow Pukthuanthong and Roll (2015) and use a statistical jump measure
to identify a shock.8 Advantages of this method are that it adheres closely to the intuitive view
of a shock to financial markets as a discontinuous event in an otherwise continuous time-series,
that it does not require arbitrary definitions of extreme events, and that it is easy to compute
8Various jump measures include those devised by Barndorff-Nielsen and Shephard (2006), Jiang andOomen (2008), Lee and Mykland (2008), and Jacod and Todorov (2009).
9

and does not require the estimation of a large number of parameters. Furthermore, it can
pinpoint the particular interval when the shock occurs and it can detect both country-specific
shocks and shocks that are transmitted to other markets, without a need to make assumptions
regarding the joint distribution of variables across multiple markets. Potential disadvantages
are that on days with many observations in the tail of the full-sample distribution, it may
not classify observations as jumps that could be regarded as extreme under different methods
and, similarly, it may not identify “clumps” (series of changes in the variables of interest that
may accumulate to a large change but do not constitute discontinuous jumps). To mitigate
the latter concern, we also measure jumps at the 15-minute and 1-hour frequencies.
In this paper, we use the jump measure proposed by Barndorff-Nielsen and Shephard
(2006) [BNS] which is based on the ratio of scaled bipower (continuous) variation to squared
variation and which is “by far the most developed and widely applied of the different [jump]
methods” (Bollerslev, Law, and Tauchen, 2008, p. 239) and the best jump measure in
the simulations of Pukthuanthong and Roll (2015). The squared variation is obtained by
summing up the squared 5-minute observations during a day, while the bipower variation
is based on the scaled summation of the products of the absolute values of the current and
lagged 5-minute observations. The bipower and squared variations on a particular day are
similar in the absence of jumps, while the bipower variation is significantly smaller than the
squared variation if the time-series has a jump on that day.
Under the null hypothesis of no jumps, the BNS measure follows a standard normal
distribution, so statistical significance can be determined based on standard normal critical
values. Since the time-series of jumps in prices, liquidity, and trading activity form the inputs
of our subsequent analyses, the usual tradeoff between type I and type II errors is especially
relevant in our setting. In particular, we are concerned about incorrectly classifying “normal”
observations as jumps. To limit the type I error, we use a 0.1% significance level (instead
of the common 10%, 5%, or 1% thresholds). Our time-series based on 5-minute intraday
intervals over 1996-2011 contain sufficient observations (up to around 370,000) to still have
the potential to detect a substantial number of jumps based on this strict statistical criterion.
10
For each day, we can thus identify whether there was a jump in any of these variables on
any market. A drawback of the standard application of the BNS method is that it cannot
pinpoint the exact 5-minute interval when the jump occurs. We thus propose a refinement
of the BNS approach in the form of an algorithm that allows us to infer the exact interval in
which the jump occurs. In short, for each day with a significant jump statistic for a certain
variable, we identify the 5-minute return interval with the observation that has the greatest
effect on the jump statistic and is greater in absolute terms than 1.96 jump-free standard
deviations (i.e., the square root of the scaled bipower variation for that variable on that
day). We classify such observations as jumps. It turns out that on all days in our sample for
which the BNS statistic is significant, there is at least one such observation. Subsequently, we
remove it from the time-series of that variable on that day and again test for the occurrence of
a jump on that day, repeating the procedure until no further jumps are detected. Appendix
B presents a more detailed description of this algorithm.9
3. Empirical results
This section first presents summary statistics for the returns, liquidity, and trading activ-
ity at the market-level (Section 3.1), followed by summary statistics of the BNS jump meas-
ures for each of these variables (Section 3.2). Subsequently, we investigate the link between
jumps in prices, liquidity, and trading activity within each market (Section 3.3) and whether
any such link is driven by liquidity or information (Section 3.4). Then, we study the propaga-
tion of shocks to prices, liquidity, and trading activity across equity markets within the same
region and also across regions, for the same variable and across different variables (Section
3.5). We conclude this section with a discussion of a number of supplementary tests (Section
3.6).
9We thank Torben Andersen for his advice on this approach.
11
3.1. Summary statistics
Table 1 shows the mean and the standard deviation of the 5-minute equally-weighted mar-
ket returns, equally-weighted proportional quoted spreads (PQSPR) and effective spreads
(PESPR), aggregate market turnover, and aggregate market order imbalance scaled by ag-
gregate market capitalization (OIB) for each of the 12 markets.
Averaged across the 12 markets in our sample, the mean 5-minute return equals -0.1 basis
points per 5-minute interval, with an average standard deviation of around 10 basis points.
Average returns are slightly negative for 9 out of 12 countries, primarily because we include
the recent crisis in our sample period and exclude overnight returns (Berkman, Koch, Tuttle,
and Zhang (2012) show that intraday returns tend to be lower than overnight returns). The
average mean PQSPR (PESPR) across markets is equal to 0.49% (0.36%), with an average
standard deviation of 0.34% (0.24%). As a comparison, Chordia, Roll, and Subrahmanyam
(2011) report an average PESPR of 0.0223% for NYSE stocks over 2001-2008, which is of
roughly the same order of magnitude as the number of 0.088% reported for the U.S. in Table
1, especially when taking into account that spreads were considerably higher over the period
1996-2000. Averaged across markets, scaled turnover (OIB) is equal to 0.19 (0.003) basis
points, with a standard deviation of 0.17 (0.08) basis points.
The final row of Table 1 shows the number of 5-minute intervals for which the various
variables can be computed for each market; this number varies across markets according to
the sample period available in TRTH, the opening hours, and the intensity of trading activity
(since we discard 5-minute intervals during which fewer than ten stocks are traded). The
average number of 5-minute intervals across all markets is 236,775. We transform the stock
variables PQSPR and PESPR to a flow variable by taking 5-minute log-changes (in line
with Pukthuanthong and Roll (2015), who compute shocks to prices based on the return
series). We also take log-changes of turnover to construct a variable with a mean close to
zero. We then compute the daily BNS jump measure for the five key variables of interest
and use the algorithm described in Appendix B to identify the exact 5-minute interval when
a jump occurs in case the daily BNS statistic is statistically significant.
12
3.2. Frequency and magnitude of jumps in prices, liquidity, and trading activity
Panel A of Table 2 shows the total number of 5-minute intervals with jumps across vari-
ables and markets. Positive (“POS”) and negative (“NEG”) jumps are reported separately.
We observe a substantial number of jumps in prices, PQSPR, and OIB. Averaged across all
12 markets, there are 196 (210) positive (negative) jumps in prices; 117 (65) positive (neg-
ative) jumps in PQSPR; and 256 (242) positive (negative) jumps in OIB. Jumps in these
variables occur much more often than under the no jumps assumption. We reject the null
hypothesis of no jumps if the BNS statistic for a particular day is below the 0.1% percentile
of the standard normal distribution (one-sided test). Thus, the type I error (erroneously
rejecting the null hypothesis of no jumps) is 0.1% of the total number of days in our sample.
Put differently, over the entire 1996-2011 sample period we would expect to see four days
being classified as days with jumps under the null hypothesis of no jumps. However, the
numbers of jumps in prices, PQSPR, and OIB are much higher. For example, in Germany
there are 205 5-minute intervals with a negative jump in prices, which occur on 178 different
days (compared to four days under the null hypothesis) or approximately 5.1% (compared to
0.1% under the null hypothesis) of all 3,523 trading days from 1999 to 2011 for which jumps
could be estimated for Germany. The finding that jumps in prices, PQSPR, and OIB occur
much more frequently than under the no jumps assumption is obtained for all markets in the
sample. While positive and negative jumps in prices and order imbalance are equally likely,
we identify almost twice as many positive as negative jumps in PQSPR. Intuitively, sudden
evaporations of liquidity are more common than sudden liquidity improvements.
Jumps in PESPR and turnover are considerably less prevalent than jumps in prices,
PQSPR, and OIB. In fact, PESPR (11 positive and 7 negative jumps on average across
markets) and turnover (14 positive and 19 negative jumps on average across markets) almost
never jump. With the notable exceptions of PESPR for Japan and turnover for India, the
number of days on which we identify jumps in PESPR and turnover is only slightly greater
than the type I error of our test. A potential explanation for the low number of jumps in
PESPR (as compared to jumps in PQSPR) is that PESPR can only be measured when
13
a trade occurs; rational investors observing a jump in quoted spreads could abandon the
market and return when liquidity improves. Based on the results in Panel A of Table 2, we
exclude the time-series of jumps in PESPR and turnover from the remainder of our analyses.
Although these empirical patterns of jumps in the different variables are overall quite
similar across markets, there is also considerable cross-market variation in the number of
jumps for individual variables. For example, the number of positive (negative) 5-minute
jumps in prices varies from 19 to 500 (from 39 to 637) across different markets; the number
of positive (negative) jumps in PQSPR varies from 6 to 278 (from 7 to 154); and the number
of positive (negative) jumps in OIB varies from 54 to 590 (from 25 to 560). There is no clear
pattern across developed and emerging markets. In unreported analyses (available from the
authors), we also study the time-series development of the number of jumps by country and
by variable and find little evidence of consistent patterns (e.g., trends or clustering).10
The jumps documented in Panel A of Table 2 are all statistically significant at a very high
confidence level. However, market participants not only care about the frequency and stat-
istical significance of shocks to financial markets, but also about their economic magnitude.
Therefore, in Panel B of Table 2, we present summary statistics (means and standard devi-
ations) of the magnitudes of the 5-minute market-wide jumps in prices, PQSPR, and OIB.
To obtain a consistent measure of the magnitude of jumps across the different variables and
markets, we assess the magnitude in terms of the number of “jump-free standard deviations”
or the square root of the scaled bipower variation (since the bipower variation measures the
variation of the continuous, i.e., non-jump, part of the process only).
It is clear from Panel B of Table 2 that the magnitudes of the jumps in prices, PQSPR,
and OIB we detect using the BNS approach are large for all markets in the sample. The
average jump magnitude for both negative and positive jumps in prices, PQSPR, and OIB
is around five jump-free standard deviations, with a range in absolute terms from 3.85 (neg-
10We also find only limited evidence that jumps in prices, liquidity, and trading activity cluster duringa trading day on a specific market. For example, averaged across the 12 markets, 89% of the days with asignificant BNS statistic for the time-series of aggregate equity prices have only one price jump, 9% have twoprice jumps, and 2% have three or more price jumps.
14
ative PQSPR jumps in Hong Kong) to 7.61 (negative PQSPR jumps in France) jump-free
standard deviations.11
For jumps in prices, five jump-free standard deviations correspond to a 5-minute market-
wide shock to equity prices of around 40 basis points, which signifies an economically large
market-wide price shock over such a short interval (40 basis points is 400 times greater than
the absolute value of the average 5-minute market return across markets). Jumps in PQSPR
of five jump-free standard deviations amount to a market-wide shock to quoted spreads of
42%, which is 83 times greater than the absolute value of the average 5-minute change in
market-wide quoted spreads.
The results in Table 2 thus indicate that jumps in prices, PQSPR, and OIB are prevalent
and large. In the next subsection, we examine the relation between jumps in prices, liquidity,
and trading activity within each market.
3.3. Coinciding jumps in prices, liquidity, and trading activity within a market
Recent theoretical studies (referenced in footnote 2) suggest an important role for channels
related to the supply of and/or demand for liquidity in the origination and propagation of
price shocks. A common thread in these theories is that shocks to prices are accompanied
by shocks to liquidity and/or trading activity. For example, price shocks can arise because
financial intermediaries reduce the supply of liquidity in the face of funding constraints (e.g.,
Gromb and Vayanos, 2002; Brunnermeier and Pedersen, 2009) or because of a surge in the
demand for liquidity when wealth effects, loss limits, or hedging desires induce traders to sell
(e.g., Kyle and Xiong, 2001; Morris and Shin, 2004; Andrade, Chang, and Seasholes, 2008).
In several of these models, feedback loops (e.g., “liquidity black holes” or “liquidity spirals”)
can arise in which deteriorating market liquidity, tightening funding constraints, and selling
reinforce each other, causing the decline in liquidity and prices to worsen over time.
11The theoretical probability of observing a five standard deviation shock to a normally distributed variableis 0.006 basis points. This probability corresponds to one 5-minute interval out of 1,744,277, or one 5-minuteinterval every 96 years (assuming six-hour trading days and 252 trading days per year). In other words,the observed frequency of such substantial shocks is much higher than the expected frequency under theassumption of normally distributed variables.
15
As a first assessment of the importance of the liquidity channel for the origination and
propagation of price shocks, we are therefore interested in whether price shocks tend to be
accompanied by shocks to liquidity and/or trading activity.
We start by documenting the links among jumps in the different variables within each
market. To that end, we treat a jump in prices (or in one of the other variables) as an event
and examine whether there are jumps in liquidity and/or trading activity at the same time
as the event (i.e., in the same 5-minute interval), before the event (from the beginning of
the same trading day – or from the previous price jump on the same day – until the event),
or after the event (from the event until the end of the same trading day – or until the next
price jump on the same day). We refer to co-jumps on the same day as “coinciding” and to
co-jumps in the same 5-minute interval as “simultaneous.”
The results are in Table 3. Panels A and B assess whether price jumps (the event) are
accompanied by jumps in, respectively, PQSPR and OIB on the same market on the same
day. Panel C assesses whether OIB jumps (the event) are accompanied by jumps in PQSPR
on the same market on the same day. The first two columns of each panel show the signs of
the jumps in the variables under consideration. For example, in Panel A, the first column
shows the sign of the price jump events (“POS” or “NEG”). The first two rows of Panel A
show the number of positive or negative price jumps that are not associated with a jump
in PQSPR on the same market on the same day. The next four rows show the number
of positive or negative price jumps that are accompanied by a “simultaneous” positive or
negative jump in PQSPR on the same market. The following four rows show the number of
positive or negative price jumps that were preceded by a positive or negative jump in PQSPR
on the same market on the same day. The final four rows show the number of positive or
negative price jumps that were followed by a positive or negative jump in PQSPR on the
same market on the same day. The structure of Panels B and C is the same.12
12We note that the sum of the numbers of price jumps in the columns of Panel A of Table 3 sometimesslightly exceeds the total number of price jumps for the respective market reported in Table 2 in case someprice jumps are accompanied by more than one jump in PQSPR on the same day. The fractions of coincidingjumps reported in this subsection are corrected for any such double counting.
16
Panel A of Table 3 shows no consistent pattern in the coincidence of jumps in prices and
jumps in PQSPR. Very few price jumps are accompanied by jumps in PQSPR, either in the
same 5-minute interval or before or after the price jump on the same trading day. And even
for markets for which prices and proportional quoted spreads regularly jump on the same day
(such as Japan), there is no consistent pattern in the direction of the jumps. As an example,
although all of the 19 PQSPR jumps in Japan that accompany a negative price jump in
the same 5-minute interval are of positive sign (in line with the prediction of the liquidity
hypothesis that a price decline is associated with a sudden deterioration in liquidity), we also
observe that 13 of the 16 PQSPR jumps in Japan that accompany a positive price jump
in the same 5-minute interval are positive, which is hard to reconcile with a liquidity story.
Only 6.9% of all price jumps in the sample are accompanied by a jump in PQSPR on the
same day, and this fraction drops to 2.2% for the same 5-minute interval. Moreover, only
about half of the coinciding jumps in prices and PQSPR are of opposite sign, as predicted
by the liquidity hypothesis.13
Panel B of Table 3 shows a considerably stronger relation between jumps in prices and
jumps in OIB. Not only do we observe a greater incidence of coinciding jumps in prices and
OIB, these coinciding jumps also more often have the sign predicted by price pressure effects
(a liquidity demand channel). In particular, Panel B shows that positive (negative) jumps in
prices are regularly associated with positive (negative) jumps in OIB, especially when prices
and OIB jump in the same 5-minute interval (as indicated by the higher numbers in the
first and the last rows of the “Simultaneous jumps” section in Panel B). Across the whole
sample, 19.3% of the jumps in prices are accompanied by a jump in OIB on the same day.
Approximately 8% of all price jumps in the sample are accompanied by an OIB jump in
the same 5-minute interval, and almost all of these involve same-sign jumps. The finding of
regular co-jumps in prices and OIB of the same sign is consistent with the view that prices
jump in part because of sudden shifts in the demand for liquidity, but it could also arise as
13This finding contrasts the results of Jiang, Lo, and Verdelhan (2011), who show that market liquidityshocks have significant predictive power for jumps in U.S. Treasury-bond prices.
17
a result of speculative trading around or portfolio rebalancing in response to the arrival of
new information.
Panel C of Table 3 shows that the pattern of coincidences of jumps in PQSPR and jumps
in OIB is about as weak as in Panel A. In short, there is little evidence that jumps in OIB
are related to jumps in PQSPR. Only 5.1% (0.28%) of the OIB jumps are accompanied by
a PQSPR jump on the same day (in the same 5-minute interval).
Overall, the results in Table 3 indicate that a non-trivial fraction of the 5-minute jumps
in prices are accompanied by same-sign jumps in order imbalance, even within the same
5-minute interval. We find little evidence of such links between jumps in prices and jumps
in PQSPR and between jumps in PQSPR and jumps in OIB.
To fully understand the strength of the relation between jumps in prices and jumps in
OIB, we need to examine how likely simultaneous jumps in these variables are given the
total number of jumps in prices and OIB. As an example, in Germany 28 out of the 205
negative price jumps are accompanied by jumps in OIB of the same sign in the same 5-minute
interval. Put differently, approximately 14% of the negative jumps in prices on the German
equity market are accompanied by a simultaneous negative jump in OIB. We need a metric
to judge whether 14% is abnormally high relative to the benchmark where jumps in prices
and jumps in OIB are completely independent. To construct such a metric, we conduct
a statistical test to compare the empirically observed frequency of simultaneous jumps in
prices and OIB to the theoretical frequency that we would observe if jumps in prices and
OIB were independent. The test is based on the comparison of two binomial distributions.
The first distribution has a probability of success equal to the empirically observed frequency
of simultaneous jumps in prices and OIB. The second distribution has a probability of
success equal to the theoretical frequency of such simultaneous jumps under the assumption
of independence. We test whether these two probabilities are the same, against the alternative
hypothesis that the empirical probability is greater than the theoretical probability.
Table 4 shows the number of simultaneous jumps in prices and OIB in the same 5-minute
interval by market, as well as the associated empirical probability of simultaneous jumps, the
18
theoretical probability of simultaneous jumps under the independence assumption, and a one-
sided p-value of the binomial test described above. For example, for Germany the empirical
probability of a jump in prices equals 11.36 basis points and of a jump in OIB equals 14.55
basis points (based on Table 2). Thus, under the assumption that jumps in prices and OIB
are independent, the probability of observing a simultaneous jump in prices and OIB in
the same 5-minute interval is 0.02 basis points (11.36 basis points × 14.55 basis points).
However, Table 3 shows that simultaneous jumps in prices and OIB are observed in 59 5-
minute intervals, which corresponds to an empirical probability of simultaneous jumps of 1.83
basis points. The final row of Table 4 shows that the p-value of the test that the empirical
probability of simultaneous jumps (1.83 basis points) is equal to the theoretical probability
(0.02 basis points) is <0.001, which implies a clear rejection of the null hypothesis that jumps
in prices and OIB on the German equity market are independent.
For all countries except South Africa, we reject the null hypotheses that jumps in prices
occur independently from jumps in OIB at the 1% level or better. On some markets (Brazil
and Mexico), the number of simultaneous jumps in prices and OIB is quite small, but on
many other markets we document frequent simultaneous jumps in prices and OIB in the same
5-minute interval (most notably Japan, with 100 such cases). In other words, a significant
fraction of price jumps is associated with simultaneous jumps in OIB, which suggests that
studying such co-jumps can help us to understand why price jumps occur.
The evidence in this subsection suggests that price jumps occur independently of PQSPR
jumps, but not of OIB jumps. Although we thus find little support for the main prediction
of the liquidity hypothesis that shocks to prices are accompanied by shocks to liquidity, the
finding that a subset (around 8%) of price jumps occur simultaneously with OIB jumps
could be consistent with a liquidity demand channel at least for this subset of price jumps.
In the next subsection, we present two specific tests of the predictions of the liquidity and
information hypotheses.
19
3.4. Jumps in prices and OIB: Liquidity vs. information
The liquidity and information hypotheses offer competing explanations for why price
jumps occur, and why they occur simultaneously with jumps in order imbalance. On the one
hand, jumps in prices can occur as the result of the price pressure associated with large one-
directional uninformed order flow when markets are less than perfectly resilient. On the other
hand, a sudden and permanent price adjustment can occur as a result of new information
arriving on the market that may also give rise to market-wide order imbalances – for example
due to speculative trading or large-scale portfolio rebalancing. (We note that given the fact
that many co-jumps in prices and OIB occur within the same 5-minute interval, it is hard
to pin down causality or the exact sequence of these jump events.)
We conduct two empirical tests to distinguish between these hypotheses. First, we in-
vestigate whether prices exhibit a reversal after a price jump (and after a simultaneous jump
in prices and OIB) in Section 3.4.1. The liquidity hypothesis predicts that price pressure
is temporary and prices should revert, while the information hypothesis predicts that price
adjustments are permanent and no reversal should be observed. Then, we examine whether
jumps in prices (and OIB) are associated with macroeconomic news announcements, which
represent the arrival of important information on the market (Section 3.4.2).
3.4.1. Price reversals after jumps in prices (and OIB)
Figure 1 presents graphs of the cumulative market return in 5-minute intervals from one
hour before (t = −12) until one hour after jumps (t = +12) in prices (positive jumps in
Panel A and negative jumps in Panel B) and jumps in prices that are accompanied by jumps
in OIB of the same sign in the same 5-minute interval (positive co-jumps in Panel C and
negative co-jumps in Panel D), aggregated across all jumps on the 12 markets in our sample
and measured in basis points.14 The total number of jumps underlying Panels A and B is
2,348 and 2,521, respectively (obtained by aggregating the number of positive and negative
jumps in prices across all markets from Table 2). The total number of jumps underlying
14We substitute missing data with zeroes in case of jumps for which we do not have data for the completeperiod from one hour before to one hour after the jump.
20
Panels C and D is 184 and 185, respectively (obtained by aggregating the number of positive
and negative simultaneous jumps in prices and OIB across all markets from Table 3). As
also shown in Table 2, Figure 1 indicates that the average price jump is around 40-50 basis
points, which is a substantial market-wide return over a 5-minute interval. Negative price
jumps tend to be slightly larger than positive price jumps, but there is little indication that
price jumps that are accompanied by same-sign jumps in OIB are of a different magnitude
than price jumps in isolation.
The graphs in the four panels of Figure 1 also show that price jumps are truly sudden:
there is a clear discontinuity relative to cumulative returns before the 5-minute interval of the
jump – although there is some indication of a slight run-up in the same direction in the hour
before the jump (the run-up is statistically significant at the 5% level or better starting at
t = −8, possibly suggesting a slight amount of information leakage). These patterns indicate
that our identification of price jumps is quite clean; unreported results show that jumps in
PQSPR and in OIB represent similarly sudden and discontinuous changes in the variable
of interest.
More importantly from the perspective of distinguishing the liquidity and information
channels, there is little evidence of any reversal following either price jumps or simultaneous
jumps in prices and OIB. If anything, there is some slight return continuation, especially
after positive price jumps. In other words, price jumps tend to constitute permanent price
changes, consistent with the hypothesis that price jumps (as well as simultaneous jumps in
prices and OIB) occur due to the arrival of new information on the market rather than due
to price pressure effects or other liquidity channels.
3.4.2. Macroeconomic news announcements and jumps in prices (and OIB)
The second test of the liquidity vs. information hypotheses aims to examine more directly
whether price jumps (and simultaneous jumps in prices and OIB) are related to information
events. In particular, we investigate whether jumps in prices (and OIB) are associated with
macroeconomic news announcements from a number of different countries in our sample over
the period 2001-2011, obtained from the Econoday database (the data on macroeconomic
21
news announcements includes scheduled announcements regarding GDP, nonfarm payroll
employment, producer and consumer price indices, etc.).15 We manually select similar cat-
egories of macroeconomic news announcements as used in Andersen, Bollerslev, Diebold, and
Vega (2003) and Opschoor, Taylor, Van der Wel, and van Dijk (2014) based on the description
of the announcement. We only include announcements that fall within the opening hours of
at least one of the markets in our sample. In total, we analyze 6,037 different macroeconomic
news announcements from Canada, China, the European Monetary Union (EMU), France,
Germany, Japan, the U.K., and the U.S., out of which 1,921 occur within the opening hours
of the American markets, 2,304 occur within the opening hours of the Asian markets, and
4,751 occur within the opening hours of the European/African markets in our sample.16
We examine how many of the jumps in prices (and OIB) in our sample occur within a
short window (from five minutes before till one hour after the event) around the release time
of any of the macroeconomic news announcements we collected. We use a one-hour window
after the announcements to allow for some time for the news to be incorporated in prices.
One hour may seem like a long period of time to capture the response of U.S. markets to
U.S. macroeconomic news announcements in recent years. However, for other markets, for
the earlier years in our sample, and for news from other countries/regions, it may take more
than a few minutes for the news to be fully incorporated into local prices. As a comparison,
Lee (2012) uses a 30-minute post-announcement window in her analysis of jumps in market-
wide and firm-specific U.S. equity prices around U.S. macroeconomic news announcements
in the period 1993-2008.
15We are grateful to Michel van der Wel for providing the data on U.S. macroeconomic news announcementsover 2004-2009, as used in Opschoor, Taylor, Van der Wel, and van Dijk (2014), and for his advice on obtainingand filtering the data for the other years and for several of the other countries in our sample. We note that theEconoday database does not cover our full sample period 1996-2011, but starts in 2001. For some countries,coverage starts even later (for example, coverage of macroeconomic news announcements in China – whichwe include because of their relevance for Hong Kong – starts in 2007) and some of the other countries in oursample are not covered at all during our sample period.
16We aggregate multiple macroeconomic announcements with the same release time to one event, so thenumbers of announcements reported in the text and in Table 5 refer to the number of unique release times.
22
Table 5 presents the results. The first line in the table shows the total number of mac-
roeconomic news announcements we collected from around the globe that occurred within
the opening hours of each of the 12 markets in our sample. The other four lines in the
table show the total number of price jumps on each market over the period 2001-2011, the
number of price jumps that occur within the event window around the macroeconomic news
announcements, the total number of simultaneous jumps in prices and OIB on each market
over the period 2001-2011, and the number of simultaneous jumps in prices and OIB that
occur within the event window around the news announcements.
For all of the markets in our sample except Japan, our sample includes at least 500 news
announcements from different countries that occur within the market’s opening hours over
the period 2001-2011. For most markets, a considerable fraction of the price jumps (and
simultaneous jumps in prices and OIB) occur within one hour of a macroeconomic news an-
nouncement. Around 17% of the price jumps (and 31% of the simultaneous jumps in prices
and OIB) on the American markets are associated with a macroeconomic news announce-
ment. These news announcements are mainly European and U.S. announcements, though
we note that the most important U.S. announcements (e.g., nonfarm payroll, employment,
producer and consumer price indices) fall outside the opening hours of the American markets.
For Asia, we find that 6% of the price jumps (and 7% of the simultaneous jumps in prices
and OIB) occur within the event window. However, none of the U.S. macroeconomic news
announcements and very few of the news announcements from China and Japan take place
within the opening hours of the Asian markets. In other words, the vast majority of the mac-
roeconomic news announcements reported in Table 5 for markets in Asia are announcements
from Europe, which may be of comparatively little relevance for Asian markets.
For European markets, we find strong evidence that jumps in prices (and OIB) are
related to macroeconomic news announcements. For example, for Germany, we document
303 5-minute intervals with price jumps over 2001-2011, of which 119 (or 40%) occur around
one of the news announcements in our sample. Over the same period, we observe 54 5-minute
intervals with simultaneous jumps in prices and OIB in Germany, of which 29 (or 54%) are in
23
the event window surrounding one of the announcements. Across the three European markets
in our sample, 37% of the price jumps and 52% of the simultaneous jumps in prices and OIB
occur around an announcement. The relative strength of the results for European markets
is likely driven by the fact that many of the U.S. macroeconomic news announcements –
arguably the most influential in the world – fall within the opening hours of the European
markets.17
Across all 12 markets in the sample, 15% of the price jumps (and 30% of the simultaneous
jumps in prices and OIB) are associated with a macroeconomic news announcement. We
interpret this as evidence that a considerable fraction of the jumps in prices (and OIB) in
our sample are associated with the arrival of important economic news, consistent with the
information hypothesis. Of course, our results do not imply that we can trace each price jump
to one of the many macroeconomic news announcements in our sample. However, we would
like to point out that these announcements often involve relatively minor news events or news
that was anticipated, and that many of the most important (notably U.S.) announcements
do not occur within the trading hours of most markets in our sample. For European markets,
which do tend to be open during U.S. macroeconomic news announcements, we find a much
stronger association between price jumps and economic news. Furthermore, there is a host
of other news events (e.g., unscheduled news announcements, policy speeches, industry news,
local or global political news, acts of terrorism, natural or nuclear disasters) that could
cause sudden shocks to equity prices but that are hard to measure in a consistent way. Our
estimates are therefore likely to heavily underestimate the fraction of price jumps associated
with news events.
Nonetheless, to examine whether there is stronger evidence in favor of the liquidity hy-
pothesis for the jumps in prices (and OIB) that we are unable to relate to macroeconomic
news, we repeat the price reversal analysis from Section 3.4.1 for the subsets of jumps in
17In an unreported analysis, we examine whether jumps in prices (and simultaneous jumps in prices andOIB) in Europe tend to occur around particular categories of U.S. macroeconomic news announcements.We find that especially nonfarm payroll employment, producer and consumer price indices, and initial un-employment claims announcements are often accompanied by jumps in prices (and OIB) in Europe.
24
prices (and OIB) that do and that do not occur within the event window around one of the
macroeconomic news announcements over 2001-2011. The results, which are unreported but
available from the authors, show that the graphs of the cumulative market return from one
hour before until one hour after price jumps are very similar for jumps in prices (and OIB)
that are and that are not associated with macroeconomic news; there is no evidence of price
reversals in either case. This finding suggests that even price jumps outside of the event
window around the macroeconomic news announcements in our sample are mainly driven by
information rather than liquidity.
Taken together, the evidence in this subsection based on return reversals surrounding
price jumps (and simultaneous jumps in prices and OIB) and based on the occurrence of
jumps in prices (and OIB) around macroeconomic news announcements is most consistent
with the information hypothesis. In the next subsection, we assess whether and why jumps
in prices, liquidity, and trading activity spill over across markets.
3.5. Spillovers in jumps in prices, liquidity, and trading activity across markets
So far, we have provided evidence on the prevalence of jumps in prices, liquidity, and
trading activity, on coinciding jumps in different variables within one market, and on the
main channel through which jumps in prices (and OIB) arise. We now turn to one of the
main further goals of the paper: to analyze the role of liquidity and trading activity in the
within-region and across-region propagation of shocks to financial markets. To the best of
our knowledge, our paper is the first to study high-frequency spillover effects of shocks to
liquidity and trading activity across equity markets, and to link these to spillovers of price
shocks.
We start with presenting summary statistics for coinciding jumps in price, PQSPR, and
OIB across markets within each of the three regions, followed by an examination of spillover
effects within and across regions for each of the variables separately (Section 3.5.1). In Section
3.5.2, we aim to explain price jumps on one market based on variables from the same market,
the same region, and other regions.
25
3.5.1. Coinciding jumps in prices, liquidity, and trading activity across markets
Table 6 reports the number of days on which one, two, or three or more markets within
the same region exhibit a positive/negative jump in prices, PQSPR, or OIB. Here, we only
analyze co-jumps by region since, for example, there is no overlap in trading hours between
markets in America and in Asia and we exclude overnight changes in our variables.
In most instances, there is at most one market that has a jump in prices, PQSPR, or
OIB during a particular day in a particular region, but there are also a considerable number
of cases of two or more countries having a jump in the same variable of the same sign on the
same day. For example, in the European/African region, we observe 566 days over our sample
period on which at least one of the four markets in that region experiences a negative price
jump. Out of those 566 days, 489 (86.4%) are days on which only one of the four markets
faces a negative price jump, on 56 days (9.9%) two markets face a negative price jump, and
on 21 days (3.7%) at least 3 markets face a negative price jump.
Similar results are obtained for positive price jumps and for negative and positive OIB
jumps in Europe/Africa and for negative and positive jumps in prices and in OIB in Asia.
Co-jumps in the same variable of the same sign on different markets within a region are much
less likely in America. Across all 12 markets in the sample, 11.3% (8.7%) of all days with
price (OIB) jumps exhibit same-sign price (OIB) jumps in at least two different markets
within the same region. In contrast, we find very few occasions of co-jumps in PQSPR on
different markets within the same region. Across all markets, only 2.0% of the days with
PQSPR jumps exhibit same-sign PQSPR jumps in more than one market. This finding
suggests that shocks to liquidity do not tend to occur on multiple markets in the same time
frame.
Overall, the results in Table 6 indicate that although the majority of jumps in prices,
PQSPR, or OIB are market-specific, we regularly observe co-jumps in prices and OIB of
the same sign on the same day across multiple markets in the Asian and European/African
regions. However, jumps in PQSPR on a given day are almost always contained to a single
market.
26
In Table 7, we extend the analysis in Table 6 by presenting correlations of jumps in
prices, PQSPR, and OIB at the 5-minute (instead of daily) frequency and not only across
individual markets within each region, but also across markets in different regions. Table 7
shows contemporaneous spearman rank correlations for the 5-minute time-series of jumps in
prices (Panel A), PQSPR (Panel B), and OIB (Panel C) across different markets (during
overlapping trading hours only). We take into account the sign, magnitude, and significance
of the jumps by setting our jump variables equal to zero in 5-minute intervals without a sig-
nificant jump in the respective variable, and to the signed magnitude of the jump (measured
in jump-free standard deviations) in 5-minute intervals with a jump. Bold correlations are
significant at the 1% level or better. We do not report 5-minute correlations across markets
in America and Asia since trading hours do not overlap.
The table shows that the time-series of signed price jumps are significantly correlated
at the 5-minute frequency within the European/African region, and in particular within de-
veloped Europe. For example, the correlation between price jumps in Germany and the U.K.
is equal to 15.71%. The correlations between price jumps on developed markets in Europe
and South Africa are considerably smaller (around 2%) but still statistically significant. We
note that since the vast majority of the observations of the 5-minute time-series of jumps are
zero, high correlations are not to be expected and even very small correlations can be viewed
as economically meaningful.
Price jumps on European markets are also significantly correlated with price jumps on
American markets, especially with the U.S. (correlations around 7.5%), but also with Brazil,
Canada, and Mexico (correlations in the range of 1-7%). Within the American region, we
also observe several significant correlations in price jumps across different markets, though
the economic magnitude of the correlations is more modest (up to 4%). Co-jumps in prices
across markets in Asia are not a prominent phenomenon, with the notable exception of Hong
Kong and Malaysia, which exhibit a significant correlation in price jumps of almost 10%.
There is little evidence of co-jumps in prices across markets in Europe and Asia.
All in all, we find that 21 out of the 46 market-pairs in our sample exhibit significantly (at
27
the 1% level) positive correlations in price jumps at the 5-minute frequency. We view this as
evidence that, even at a very high-frequency, shocks to prices show economically meaningful
spillover effects across equity markets around the world.
In contrast, Panel B of Table 7 shows almost no significant correlations in 5-minute jumps
in PQSPR across individual markets within and across regions. The exceptions are the
correlations between PQSPR jumps in Canada and the U.S. and between PQSPR jumps
in France and the U.K.. Both of these correlations are statistically significant, but at around
1% they are considerably smaller than the price jumps correlations in Panel A. These results
confirm the conclusion from Table 6 that “sudden liquidity dry-ups” or “liquidity black holes”
are mainly local phenomena that do not tend to spill over to other markets within or across
regions.
The correlations between jumps in OIB across different markets presented in Panel C
of Table 7 show a similar pattern as the price jump correlations in Panel A, although both
economic and statistical significance are somewhat weaker. 14 out of the 46 market-pairs in
our sample show significantly positive correlations. Jumps in OIB are significantly correlated
within the European/African region and between developed Europe and the U.S., while –
like price jumps – OIB jumps are only weakly correlated within the Asian region and across
Europe/Africa and Asia. Although prior studies have identified links between shocks to prices
on different equity markets, we believe we are the first to document that shocks to order
imbalance can also be propagated across international equity markets at a high-frequency.
3.5.2. Coinciding jumps in prices, liquidity, and trading activity across markets and variables
We now build upon the analyses in Tables 6 and 7 by not only studying coinciding jumps
in the same variable within and across regions, but also examining whether the likelihood
of a price jump on a particular market can be explained by jumps in other variables on the
same market and on different markets in the same region as well as in other regions. In
other words, we attempt to answer the question of how price shocks are propagated from one
market to another, with a specific focus on microstructure variables.
28
We adopt the method proposed by Bae, Karolyi, and Stulz (2003) and estimate logit
models to explain the occurrence of price jumps on each individual market at the 5- minute
frequency. The results are in Table 8. As dependent variable, we use an indicator variable
of whether there was a price jump on a particular market i in a particular 5-minute interval.
All of our logits are estimated separately for negative and positive price jumps, to allow for
asymmetric effects depending on the sign of the jumps. As independent variables, we use
an indicator variable of same-sign OIB jumps on market i in the same 5-minute interval,
indicator variables of whether at least one other market in the same region (labeled “not i”
in Table 8) has a same-sign jump in prices or in OIB in the same 5-minute interval, and
indicator variables of whether at least one market in a different region has a same-sign jump
in prices or in OIB in the same 5-minute interval. Since the independent variables based
on different markets than market i are only defined during overlapping trading hours, we
only include indicator variables of jumps in prices and OIB in Europe/Africa in the logits
explaining price jumps on American markets and on Asian markets, while jumps in prices
and OIB in both America and Asia serve as independent variables in the logits for price
jumps on European markets. Since our results so far indicate little role for liquidity in the
occurrence and spillovers of price jumps, we exclude PQSPR jumps from the logit models.18
Table 8 presents the marginal effects (in %) of the logit models, organized by region
(Panel A: America; Panel B: Asia; Panel C: Europe/Africa) and by the sign of the price
jumps within each panel (Part I: positive; Part II: negative). Bold numbers are significant
at the 10% level or better. For each market in each region, we estimate one, two, or three
logit models, depending on the number of regions with overlapping trading hours with that
market. The first model includes only independent variables from the same region. The
18In reported tests, we do include PQSPR jumps in the logit models, but find that they can often notbe estimated because of “separation problems” in the estimation. Put differently, if one of the independentvariables could almost perfectly explain jumps in prices on market i, then numerically we observe fittedprobabilities equal to either 0 or 1, which results in unreliable model estimation. For instance, if positivejumps in prices on market i never coincide during the same 5-minute interval with positive jumps in PQSPRfrom another region, then having an indicator variable for positive jumps in PQSPR from another regionequal to 1 guarantees no positive jumps in prices on market i during that interval.
29
second and third models also include independent variables from one or two other regions
– if there is any overlap in the trading hours. We note that the number of observations
available for the estimation of the second and third models is substantially reduced relative
to the first model.19
We hypothesize that the probability of negative (positive) price jumps on market i in-
creases with negative (positive) jumps in OIB on the same market and with negative (pos-
itive) jumps in prices and OIB on other markets in the same and in other regions. In other
words, the marginal effects in Table 8 are all expected to be positive.
The results of the logit models in Table 8 are consistent with our findings in Table 3 that
price jumps on a particular market are linked to OIB jumps of the same sign on the same
market in the same 5-minute interval. For 12 out of the 24 cases (negative and positive price
jumps on 12 markets), we find a positive and significant marginal effect of OIB jumps on
market i (based on the first logit model for each market). These effects are often economically
substantial, especially for markets in Asia and Europe: they vary from 6.10% (positive price
jumps in Hong Kong) to 41.64% (negative price jumps in Japan) in Asia and from 0.53%
(negative price jumps in the U.K.) to 3.10% (positive price jumps in the U.K.) in Europe. In
only two cases (Brazil and South Africa) do we observe significantly negative marginal effects
of OIB jumps on the same market, but, at -0.03% and -0.04%, their economic magnitude is
small.
Table 8 also confirms the results of the correlation analysis in Table 7. In particular,
price jumps on other markets in the same region significantly increase the probability of a
price jump on market i in 11 out of the 24 cases (based on the first logit model for each
country). These effects are observed in all regions. For instance, price jumps on the other
markets within the Europe/Africa region have positive and significant marginal effects on
price jumps on market i varying from 2.25% to 3.58%. Only in two cases (Mexico and
Japan) do we observe significantly negative marginal effects of jumps in prices on the other
19We generally estimate two models for markets in America, one model for markets in Asia, and threemodels for markets in Europe/Africa, but have to discard some individual models for individual markets incase there is a separation problem in the estimation.
30
markets within the same region, but their economic magnitude is relatively small.
The results on the effect of OIB jumps on other markets in the same region on price
jumps on market i are mixed for America and Asia. If anything, the significant marginal
effects for this variable in Panels A and B suggest that price jumps on a particular market
are associated with OIB jumps of the opposite sign on other markets in the same region.
In contrast, for the three European markets in our sample, there is consistent evidence that
the probability of price jumps on one market is positively related to same-sign OIB jumps
on other markets in the same 5-minute interval. These marginal effects are all positive and
significant within developed Europe, but are relatively modest, ranging from 0.29% to 0.60%.
The second and third logit models for each market in Table 8 assess cross-region spillovers
of jumps in prices and OIB. Perhaps not surprisingly, the evidence for cross-region spillovers
of price jumps is weaker and less consistent than for within-region spillovers. The marginal
effect of price jumps in other regions is positive and significant only in few cases: for negative
price jumps in the U.S. vis-à-vis the European/African region (marginal effect of 0.63%, see
Panel A), for positive price jumps in the U.K. vis-à-vis the American region (0.81%, Panel
C), and for negative price jumps in Germany vis-à-vis the American region (0.95%, Panel C).
Similarly, in most cases, the effect of OIB jumps in other regions on price jumps on market i
is not significant either in statistical or in economic terms, except for price jumps in Canada
and the U.S. vis-à-vis OIB jumps in the European/African region (marginal effect between
0.82% and 1.84%, see Panel A) and for positive price jumps in France vis-à-vis OIB jumps
in America (effect of 0.82%, Panel C). Some of the marginal effects in Table 8 are not in line
with expectations. For example, the marginal effect of OIB jumps in Asia on the likelihood
of positive price jumps in Germany is -0.05% (Panel C). Although some of these exceptions
are statistically significant, their economic magnitude is small.
In sum, the results in Table 8 highlight that shocks to prices can be propagated from
one market to another within a 5-minute horizon. Such propagation is especially strong
across markets within the same region, although some cross-region effects are also observed.
Furthermore, price jumps are regularly linked to same-sign OIB jumps on the same market,
31
and, for Europe, also to same-sign OIB jumps on other markets in the same region.
To address the question whether the high-frequency propagation of shocks to equity prices
across markets is driven by liquidity or by information, we repeat the price reversal analysis
from Section 3.4.1 for the subsets of jumps in prices that only occur on one market and
that occur simultaneously on at least two of the markets in our sample. Of the 2348 (2521)
positive (negative) price jumps in our sample, 200 (253) occur simultaneously with a price
jump on at least one other market. Unreported results show that the price reversal graphs
are very similar for both subsets of price jumps. In other words, there is no evidence that
price jumps that occur simultaneously in multiple markets exhibit reversals, consistent with
the hypothesis that these jumps are primarily driven by information rather than liquidity.
3.6. Supplementary tests
Our analyses so far suggest that shocks to equity prices are prevalent and large, are linked
to shocks to order imbalance, exhibit regular high-frequency spillovers across international
markets, and are mainly driven by information rather than liquidity. In this section, we
discuss the results of a number of supplementary tests that we carried out to evaluate the
robustness of these conclusions.
3.6.1. Alternative frequencies
One potential limitation of our study is that we measure jumps in prices, liquidity, and
trading activity at a relatively high frequency: 5-minute intervals within the trading day.
Our choice for this frequency was motivated by our aim of a detailed, intraday analysis
of the dynamics of liquidity and trading activity around financial market shocks and by
issues concerning non-overlapping trading hours, overnight returns, and special features of
the opening session that arise in analyses of cross-market spillovers at the daily frequency.
Nonetheless, we repeat all of our analyses at the 15-minute and 1-hour frequencies to assess
whether we may have missed lower-frequency shocks, or lower-frequency relations between
shocks to prices, liquidity, and trading activity (results available from the authors). At these
lower frequencies, the number of jumps is naturally smaller, but we still find quite frequent
32
jumps in prices, quoted spreads, and order imbalance, while jumps in effective spreads are
rare; we do now also observe regular jumps in turnover. The economic magnitudes of the
jumps are still around five jump-free standard deviations. Similar to Table 3, we find virtually
no evidence that price jumps are associated with PQSPR jumps (nor with turnover jumps).
In contrast to Table 3, we no longer observe a significant relation between price jumps and
same-sign OIB jumps in the same interval at the 15-minute and 1-hour frequencies, which
underlines the value of using a relatively high frequency to study the role of liquidity and
trading activity around financial market shocks. Similar to Figure 1 and Table 5, we find
that price jumps are not followed by reversals, and that a substantial fraction of price jumps
occur around macroeconomic news announcements. Both pieces of evidence suggest that 15-
minute and 1-hour price jumps are also primarily driven by information rather than liquidity.
These price jumps also regularly spill over across markets, consistent with Tables 6 and 7.
There is no evidence of spillovers in PQSPR jumps to other markets, but both jumps in
OIB and in turnover exhibit significant correlations across markets, especially for Europe.
In short, we conclude that our inferences are not materially affected by redoing our analyses
at a lower frequency within the trading day.
3.6.2. The dynamics of liquidity and trading activity around price jumps
Table 3 shows that price jumps are regularly associated with same-sign jumps in OIB
in the same 5-minute interval, but not with PQSPR jumps. However, it is possible that
this result is affected by our approach to identify shocks to liquidity and order imbalance as
discontinuous jumps. To obtain a broader picture of the behavior of liquidity and trading
activity around price jumps, Figure 2 shows the cumulative change in PQSPR (Panels A
and B; in %) as well as the dynamics of OIB (Panels C and D; in basis points) from one hour
before until one hour after positive and negative jumps in prices, aggregated across all jumps
on the 12 markets in our sample. Panels A and B show that liquidity does fluctuate around
price jumps; quoted spreads tend to fall slightly in the hour before a price jump, followed by a
small upward blip in the 5-10 minutes before the price jump, and a more pronounced decline
after the price jump. Nonetheless, the observed patterns seem hard to square with theories
33
that propose a key role for liquidity in the origination of price shocks. First, the quoted
spread effects are small. The blip in PQSPR just before the price jump has a magnitude of
4-5 percentage points, which is much smaller than the average PQSPR jump of around 42%.
Second, liquidity tends to improve following a price jump, but Figure 1 shows no evidence of
any accompanying price reversal. Third, the liquidity patterns around price jumps are very
similar for positive and negative price jumps. Fourth, there is little indication of “liquidity
black holes” or “liquidity spirals” in the sense that feedback effects cause liquidity crashes
to worsen over time. Rather, the observed patterns in quoted spreads in Figure 2 seem to
accord well with an increase in adverse selection costs just before the arrival of economic
news, and the resolution of asymmetric information following the news arrival.20 Panels C
and D of Figure 2 show a clear, once-off spike in OIB in the same direction as the price
jump, in the same interval. Given the absence of reversals after price jumps, this pattern
seems more consistent with speculative trading or portfolio rebalancing around the arrival of
news than with temporary price pressure effects or with feedback loops in which initial price
drops induce further selling.
3.6.3. Alternative liquidity measures
Liquidity is a multi-faceted concept and the liquidity measures used in this paper (PQSPR
and PESPR) may not cover all relevant aspects of liquidity. However, we would expect sig-
nificant shocks to liquidity to also be reflected in quoted or effective spreads. Moreover,
price impact measures suffer from large estimation errors at high frequencies and could be
mechanically linked to price changes. In unreported analyses, we redo all of our analyses
with an alternative liquidity measure based on the number of different stocks that traded
on a specific market in a specific interval. This trade-based liquidity measure builds on the
20To the extent that the PQSPR patterns in Panels A and B of Figure 2 are driven by macroeconomic newsannouncements, one might wonder about the scope for asymmetric information around such announcements.However, we note that Boudt and Petitjean (2014) document significant increases in trading costs and thedemand for immediacy around macroeconomic news releases and price jumps in Dow Jones stocks. And Jiang,Lo, and Valente (2014) find that high-frequency trading adversely affects liquidity around macroeconomicnews announcements. Alternatively, the blip in quoted spreads in Figure 2 could be due to concerns aboutinventory risk instead of adverse selection.
34
premise that stocks may not trade in a certain interval in part because of high trading costs.
The trade-based measure should thus be positively associated with the level of market liquid-
ity. Indeed, this measure is highly, but not perfectly, correlated with the illiquidity measures
PQSPR and PESPR; for most markets, these correlations roughly range from -0.4 to -0.7.
On average, jumps in the trade-based measures are about as frequent as PQSPR jumps, and
are also of similar magnitude. Similar to Table 3, we find little evidence that price jumps
coincide with jumps in the trade-based liquidity measure. Similar to Tables 6 and 7, jumps
in the trade-based measure are almost always isolated events that do not spillover to other
markets. Our conclusion that liquidity does not play more than a minor role the origination
and propagation of prices shocks is thus not sensitive to the use of this alternative liquidity
measure.
Several studies that model liquidity supply channels for the origination and propagation
of financial market shocks feature an important role of funding liquidity. For example, in
Brunnermeier and Pedersen (2009), “liquidity spirals” arise when financial intermediaries
reduce the supply of liquidity in response to worsening funding liquidity (e.g., increasing
margins) and when funding liquidity, in turn, is decreasing in market illiquidity. To more
specifically test the implications of these liquidity supply channels, in Table 9, we examine
whether shocks to prices, liquidity, and trading activity are associated with shocks to funding
liquidity. This table assesses whether jumps in prices, PQSPR, and OIB are more likely to
occur on days with a jump in the TED spread (the difference between the 3-month LIBOR
and the 3-month T-bill rate, obtained from the Federal Reserve Bank of St. Louis), which
is a common proxy for funding liquidity.21 TED spread jumps are measured at the daily
frequency, since funding liquidity may not be likely to exhibit sudden intraday changes, since
one component of the TED spread (the LIBOR) is determined only once per day, and since
we lack intraday data on the other component (the T-bill).
21We obtain similar results when, instead of the TED spread, we use the U.S. default spread (Baa-Aaa),the LIBOR, country-specific short-term interest rates, or country-specific banking industry index returns asproxies for funding liquidity.
35
Panels A and B of Table 9 document the number and empirical frequency of days with
negative price jumps, positive PQSPR jumps, negativeOIB jumps, and positive TED spread
jumps for each of the 12 markets. We focus on jumps with these signs since theories on funding
liquidity primarily associate a drop in funding liquidity with a drop in prices, a worsening of
liquidity, and securities sales. The TED spread exhibits a positive jump on only 9 days over
the entire sample period 1996-2011. We note that the number of TED spread jumps reported
in the table differs across countries because not all of these jumps occur within the available
sample period for all countries, as the TRTH data coverage for some countries starts later
than 1996 (see Appendix A.1). Panel C shows that negative price jumps, positive PQSPR
jumps, and negative OIB jumps almost never coincide with positive TED spread jumps on
the same day. Panel D presents the results of a test of whether the empirical probability of
such coinciding jumps is greater than the theoretical probability under the assumption that
the jumps in the individual variables are independent (similar to Table 4). The results in
this panel indicate very little evidence that shocks to prices, liquidity, and trading activity
are associated with shocks to funding liquidity.
4. Conclusion
The recent financial crisis has highlighted the importance of global systemic risk in the
current environment of globally integrated financial markets and fast trading technology. We
conduct a study of the intraday propagation of shocks across 12 equity markets around the
world at the 5-minute frequency over 1996-2011 – with a particular focus not only on shocks
to prices, but also on shocks to liquidity (quoted and effective spreads) and trading activity
(turnover and order imbalance). Our main purpose is to test the liquidity vs. information
channels for the origination and propagation of financial market shocks.
Our findings are based on jump statistics in these five variables at the 5-minute frequency
and can be summarized as follows. First, jumps in prices, quoted spreads, and order im-
balance are large and occur much more often than jumps in effective spreads and turnover.
Second, we document a significant association between jumps in prices and in order im-
36

balance, while jumps in quoted spreads are independent from jumps in the other variables.
Third, we show that jumps in prices and simultaneous jumps in prices and order imbalance
are primarily driven by information rather than liquidity. Fourth, jumps in prices and order
imbalance exhibit significant spillover effects across markets (even in the same 5-minute in-
terval and especially for markets in Europe and the U.S.), but spillovers of jumps in quoted
spreads to other markets are rare.
To sum up, our study provides evidence that the propagation speed of shocks across
international equity markets is very high. In designing optimal financial regulation and risk
management, policy makers and investors should not neglect microstructure effects related to
the occurrence of price shocks. In particular, price shocks should not be viewed independently
from shocks to trading activity. Shocks to liquidity, however, seem to play a less central role
in the origination and propagation of price shocks than previously thought.
We leave further analyses of the speed and mechanism of the propagation of price shocks
across markets for future research. In particular, recent advances in trading technology
suggest that, in the later years of our sample period, the propagation of shocks across markets
may take place at an even higher frequency than the one studied in this paper. Moving to a
higher frequency of analysis would also allow for the estimation of daily vector autoregressions
to get a better handle on causality, but will likely limit the sample to developed markets in
recent years in order to construct meaningful measures of trading activity over such ultra-
short horizons. Another potential extension would be to broaden the scope of the analysis
beyond the 12 markets in our sample, which would enable an analysis of the determinants of
the speed and the strength of the propagation of stocks across different (pairs of) markets.
37
Appendix A: Sample selection and data screens
This appendix describes the sample and data filters used in the paper. We start with a
detailed description of the data sources and sample selection, subsequently discuss our data
screens, and conclude with a discussion of potential limitations in our sample construction.
A.1. Data sources and sample selection
We use two databases to build our sample: Datastream and Thomson Reuters Tick His-
tory (TRTH). From the former, we obtain Reuters Instrument Codes (RICs) for all common
stocks that are traded on 12 exchanges around the world. Then, we identify common stocks
that were ever part of the major local equity index for each of these exchanges from 1996 till
2011 through the TRTH Speedguide. We obtain tick-by-tick data on trades and quotes for
these stocks from TRTH. The exchanges in our sample can be classified into three regions
based on time zones: America, Asia, and Europe/Africa. The American region includes
the following countries (the major equity index used is in parentheses): Brazil (BOVESPA),
Canada (TSX COMPOSITE), Mexico (IPC), and the U.S. (S&P100). The Asian region in-
cludes Hong Kong (HSI), India (NIFTY50), Japan (NIKKEI225), and Malaysia (KLCI). The
European/African region includes France (CAC40), Germany (DAX), South Africa (JALSH),
and the U.K. (FTSE100). Data for these exchanges are generally available over 1996-2011,
with a few exceptions. In particular, data availability for Germany and South Africa starts
in 1997, for Mexico in 1998, for India in 2000, and for Brazil in 2004.
We obtain the historical opening hours for each of the exchanges from several sources:
the TRTH Speedguide, Skeete (2004), exchanges’ websites, and the Federation of European
Securities Exchanges. We cross-check these opening hours by examining the trading activity
patterns observed in the data and select the shortest opening hours when in doubt. Since
we cannot clearly distinguish between auctions and continuous trading sessions, we disregard
the first and the last 15 minutes of each trading day.
38
A.2. Data screens
We filter the data following Rösch, Subrahmanyam, and van Dijk (2015). We use two
sets of screens: one set for trade data and another set for quote data. We discard trades
when they occur outside the opening hours of the exchange; the trade price is not positive;
the trade size is more than 10,000 shares (to exclude block trades from our sample); the
trade price differs from the prices of the 10 surrounding ticks by more than 10% since these
are likely to be erroneous entries. We discard quotes when quotes occur outside the opening
hours of the exchange; the bid and ask prices are not positive; the bid price is higher than the
ask price; the bid or ask price differs from the bid or ask price of the 10 surrounding ticks by
more than 10% since these are likely to be erroneous entries; the proportional bid-ask spread
exceeds 25%. In addition, we discard stock-days if a stock is traded fewer than ten 5-minute
intervals per day. When aggregating stock level data to the market-level, we discard 5-minute
intervals in which fewer than 10 stocks are traded.
A.3. Sample construction limitations
There are several potential limitations in our sample construction. First, we use RICs
that ever refer to the stock that was part of the index during our sample period (1996-2011).
However, RICs can change through time and TRTH does not provide information on re-used
RICs. Therefore, some of the data in our sample could stem from different stocks than the
index constituents. Second, for the same reason linking TRTH data to data on the market
capitalization of individual stocks (for example, from Datastream) is challenging. All of our
analyses are therefore based on equally-weighted averages of the variables across stocks only.
We believe that these limitations are not severe due to the trading activity filters we apply:
stocks should trade at least ten 5-minute intervals per day. Hereby, we avoid many small
and illiquid stocks that could definitely not be part of the index in the time interval under
consideration. Because the stocks in our sample are relatively large and liquid, analyzing
equally-weighted averages seems an appropriate choice. Using an equally-weighted average
also reduces the problem of one stock dominating the whole market (e.g., Nokia in Finland).
39
Appendix B: Jump measure (BNS)
This appendix describes the BNS jump measure (Barndorff-Nielsen and Shephard, 2006)
computation together with the algorithm that we use to determine the exact 5-minute in-
terval during which a jump occurs. Following Pukthuanthong and Roll (2015), we use jump
measures to identify extreme events on financial markets. A jump measure is a statistical
non-parametric way to test for jumps in a time-series. In this paper, we use the BNS ratio
measure:
Ht =√T(π2Bt
St− 1
)√υ Qt
B2t
St = ΣTk=2(Vk,t)2
Bt = ΣTk=2|Vk,t||Vk−1,t|
Qt = T · ΣTk=4|Vk,t||Vk−1,t||Vk−2,t||Vk−3,t|
υ =(π
2
)2+ π − 5
where Ht is the BNS ratio measure on day t, St is the squared variation on day t based on
5-minute observations within the day, Bt is the bipower variation on day t based on 5-minute
observations within the day, Qt is the “quarticity” of the process (which is part of the scaling
factor for statistics to follow a standard normal distribution), Vkt is the variable of interest
(returns, changes in proportional quoted or effective spreads, turnover, or order imbalance) at
k-th 5-minute interval during day t, T is the total number of valid 5-minute intervals within
day t. Under the null hypothesis of no jumps, Ht follows a standard normal distribution.
The BNS jump statistic is based on the assumption that Vkt follows a Brownian motion
with zero drift and some diffusion plus a Poisson jump process. The bipower variation is
the variation of the continuous part of process (the Brownian motion itself) that is free of
any jumps, while the squared variation is the variation of the process including the jumps.
40
Thus, without jumps, the squared variation should be approximately the same as the scaled
bipower variation. But in case there is a jump, the squared variation exceeds the bipower
variation. Hence, the ratio of these two variables gives an indication of whether a jump
occurred. If there is a jump on day t, then Ht should be negative and large in absolute
terms. In addition to the assumption that our variables follow a Brownian motion with zero
drift plus a Poisson jump process, there are several other important assumptions underlying
the formulas above. First, we assume that variation is constant over day t. We acknowledge
that volatility exhibits intraday patterns, but we circumvent this issue to a large extent by
discarding the first and last 15 minutes of the trading session. Second, we also assume that
T is large enough (T ∼ T − 1 ∼ T − 3).
The BNS measure indicates whether there was a jump on a given trading day, but does
not pinpoint the exact 5-minute interval when the jump occurs. To determine the exact time
of the jump, we propose the following algorithm. We first compute Ht for any day with at
least 25 5-minute observations within the day. Then, we check whether we can reject the null
hypothesis of no jumps (based on a threshold of the 0.1% percentile of the standard normal
distribution). If the null hypothesis is rejected, we search for the most influential observation
within day t. In other words, we identify the observation that has the maximum effect on
the jump measure and is greater in absolute terms than 1.96 jump-free standard deviations
(that is, the square root of the scaled bipower variation). We mark this 5-minute interval
as a jump interval. We repeat the procedure (temporarily discarding 5-minute intervals that
have been identified as jump observations) until we no longer reject the null hypothesis of no
jumps or until there are fewer than 10 observations left. In our sample, the latter of these
two conditions never becomes binding.
41
References
Andersen, T. G., T. Bollerslev, F. X. Diebold, and C. Vega (2003). Micro effects of macro
announcements: Real-time price discovery in foreign exchange. American Economic Re-
view 93 (1), 36–62.
Andrade, S. C., C. Chang, and M. S. Seasholes (2008). Trading imbalances, predictable
reversals, and cross-stock price pressure. Journal of Financial Economics 88 (2), 406–423.
Bae, K.-H., G. A. Karolyi, and R. M. Stulz (2003). A new approach to measuring financial
contagion. Review of Financial Studies 16 (3), 717–763.
Barndorff-Nielsen, O. E. and N. Shephard (2006). Econometrics of testing for jumps in
financial economics using bipower variation. Journal of Financial Econometrics 4 (1), 1–
30.
Bekaert, G., M. Ehrmann, M. Fratzscher, and A. Mehl (2014). The global crisis and equity
market contagion. Journal of Finance 69 (6), 2597–2649.
Berkman, H., P. D. Koch, L. Tuttle, and Y. J. Zhang (2012). Paying attention: overnight
returns and the hidden cost of buying at the open. Journal of Financial and Quantitative
Analysis 47 (04), 715–741.
Bernardo, A. E. and I. Welch (2004). Liquidity and financial market runs. Quarterly Journal
of Economics, 135–158.
Boehmer, E., K. Y. Fong, and J. Wu (2012). Algorithmic trading and changes in firms’ equity
capital. Working paper .
Boehmer, E., K. Y. Fong, and J. Wu (2014). International evidence on algorithmic trading.
Working paper .
Bollerslev, T., T. H. Law, and G. Tauchen (2008). Risk, jumps, and diversification. Journal
of Econometrics 144 (1), 234–256.
Boudt, K. and M. Petitjean (2014). Intraday liquidity dynamics and news releases around
price jumps: Evidence from the DJIA stocks. Journal of Financial Markets 17, 121–149.
42
Brockman, P., D. Y. Chung, and C. Pérignon (2009). Commonality in liquidity: A global
perspective. Journal of Financial and Quantitative Analysis 44 (4), 851–882.
Brunnermeier, M. K. (2008). Deciphering the liquidity and credit crunch 2007-08. Journal
of Economic Perspectives 23 (1), 77–100.
Brunnermeier, M. K., A. Crockett, C. A. Goodhart, A. Persaud, and H. S. Shin (2009). The
fundamental principles of financial regulation. Geneva Reports on the World Economy 11.
Brunnermeier, M. K. and L. H. Pedersen (2009). Market liquidity and funding liquidity.
Review of Financial Studies 22 (6), 2201–2238.
Cespa, G. and T. Foucault (2014). Illiquidity contagion and liquidity crashes. Review of
Financial Studies 27 (6), 1615–1660.
Chiang, T. C., B. N. Jeon, and H. Li (2007). Dynamic correlation analysis of financial conta-
gion: Evidence from Asian markets. Journal of International Money and Finance 26 (7),
1206–1228.
Chordia, T., R. Roll, and A. Subrahmanyam (2000). Commonality in liquidity. Journal of
Financial Economics 56 (1), 3–28.
Chordia, T., R. Roll, and A. Subrahmanyam (2008). Liquidity and market efficiency. Journal
of Financial Economics 87 (2), 249–268.
Chordia, T., R. Roll, and A. Subrahmanyam (2011). Recent trends in trading activity and
market quality. Journal of Financial Economics 101 (2), 243–263.
Connolly, R. A. and F. A. Wang (2003). International equity market comovements: Economic
fundamentals or contagion? Pacific-Basin Finance Journal 11 (1), 23–43.
Cremers, K. M. and J. Mei (2007). Turning over turnover. Review of Financial Studies 20 (6),
1749–1782.
Eun, C. S. and S. Shim (1989). International transmission of stock market movements.
Journal of Financial and Quantitative Analysis 24 (2), 241–256.
43
Fong, K., C. Holden, and C. Trzcinka (2014). What are the best liquidity proxies for global
research? Working paper .
Forbes, K. J. and R. Rigobon (2002). No contagion, only interdependence: Measuring stock
market comovements. Journal of Finance 57 (5), 2223–2261.
Frino, A., V. Mollica, and Z. Zhou (2014). Commonality in liquidity across international
borders: Evidence from futures markets. Journal of Futures Markets 34 (8), 807–818.
Gârleanu, N. B. and L. H. Pedersen (2007). Liquidity and risk management. American
Economic Review 97 (2), 193–197.
Gorton, G. B. (2009a). Information, liquidity, and the (ongoing) panic of 2007. American
Economic Review 99 (2), 567–572.
Gorton, G. B. (2009b). The subprime panic. European Financial Management 15 (1), 10–46.
Gromb, D. and D. Vayanos (2002). Equilibrium and welfare in markets with financially
constrained arbitrageurs. Journal of Financial Economics 66 (2), 361–407.
Hamao, Y., R. W. Masulis, and V. Ng (1990). Correlations in price changes and volatility
across international stock markets. Review of Financial Studies 3 (2), 281–307.
Hartmann, P., S. Straetmans, and C. G. de Vries (2004). Asset market linkages in crisis
periods. Review of Economics and Statistics 86 (1), 313–326.
Huang, J. and J. Wang (2009). Liquidity and market crashes. Review of Financial Stud-
ies 22 (7), 2607–2643.
Jacod, J. and V. Todorov (2009). Testing for common arrivals of jumps for discretely observed
multidimensional processes. The Annals of Statistics, 1792–1838.
Jiang, G., I. Lo, and G. Valente (2014). High-frequency trading around macroeconomic news
announcements: Evidence from the us treasury market. Bank of Canada Working Paper
2014-56 .
44
Jiang, G. J., I. Lo, and A. Verdelhan (2011). Information shocks, liquidity shocks, jumps,
and price discovery: Evidence from the US treasury market. Journal of Financial and
Quantitative Analysis 46 (2), 527–551.
Jiang, G. J. and R. C. Oomen (2008). Testing for jumps when asset prices are observed with
noise – a “swap variance” approach. Journal of Econometrics 144 (2), 352–370.
Karolyi, G. A. (2003). Does international financial contagion really exist? International
Finance 6 (2), 179–199.
Karolyi, G. A., K.-H. Lee, and M. A. van Dijk (2012). Understanding commonality in
liquidity around the world. Journal of Financial Economics 105 (1), 82–112.
King, M. A. and S. Wadhwani (1990). Transmission of volatility between stock markets.
Review of Financial studies 3 (1), 5–33.
Kodres, L. E. and M. Pritsker (2002). A rational expectations model of financial contagion.
Journal of finance 57 (2), 769–799.
Kyle, A. S. and W. Xiong (2001). Contagion as a wealth effect. Journal of Finance 56 (4),
1401–1440.
Lai, S., L. Ng, and B. Zhang (2014). Does PIN affect equity prices around the world? Journal
of Financial Economics 114 (1), 178–195.
Lau, S. T., L. Ng, and B. Zhang (2012). Information environment and equity risk premium
volatility around the world. Management Science 58 (7), 1322–1340.
Lee, C. and M. J. Ready (1991). Inferring trade direction from intraday data. Journal of
Finance 46 (2), 733–746.
Lee, S. S. (2012). Jumps and information flow in financial markets. Review of Financial
Studies 25 (2), 439–479.
Lee, S. S. and P. A. Mykland (2008). Jumps in financial markets: A new nonparametric test
and jump dynamics. Review of Financial Studies 21 (6), 2535–2563.
45
Lin, W.-L., R. F. Engle, and T. Ito (1994). Do bulls and bears move across borders? in-
ternational transmission of stock returns and volatility. Review of Financial Studies 7 (3),
507–538.
Lo, A. W. and J. Wang (2000). Trading volume: Definitions, data analysis, and implications
of portfolio theory. Review of Financial Studies 13 (2), 257–300.
Longstaff, F. A. (2010). The subprime credit crisis and contagion in financial markets. Journal
of Financial Economics 97 (3), 436–450.
Marshall, B. R., N. H. Nguyen, and N. Visaltanachoti (2012). Commodity liquidity meas-
urement and transaction costs. Review of Financial Studies 25 (2), 599–638.
Marshall, B. R., N. H. Nguyen, and N. Visaltanachoti (2013a). Liquidity commonality in
commodities. Journal of Banking and Finance 37 (1), 11–20.
Marshall, B. R., N. H. Nguyen, and N. Visaltanachoti (2013b). Liquidity measurement in
frontier markets. Journal of International Financial Markets, Institutions and Money 27,
1–12.
Morris, S. and H. S. Shin (2004). Liquidity black holes. Review of Finance 8 (1), 1–18.
Opschoor, A., N. Taylor, M. Van der Wel, and D. van Dijk (2014). Order flow and volatility:
An empirical investigation. Journal of Empirical Finance 28, 185–201.
Pasquariello, P. (2007). Imperfect competition, information heterogeneity, and financial con-
tagion. Review of Financial Studies 20 (2), 391–426.
Pukthuanthong, K. and R. Roll (2015). Internationally correlated jumps. Review of Asset
Pricing Studies 5 (1), 92–111.
Ramchand, L. and R. Susmel (1998). Volatility and cross correlation across major stock
markets. Journal of Empirical Finance 5 (4), 397–416.
Reinhart, C. and S. Calvo (1996). Capital flows to Latin America: Is there evidence of
contagion effects? Working paper .
46
Rodriguez, J. C. (2007). Measuring financial contagion: A copula approach. Journal of
Empirical Finance 14 (3), 401–423.
Roll, R. (1989). Price volatility, international market links, and their implications for regu-
latory policies. Journal of Financial Services Research 3, 211–246.
Rösch, D. M., A. Subrahmanyam, and M. A. van Dijk (2015). An empirical analysis of
co-movement in market efficiency measures. Working paper .
Skeete, H. (Ed.) (2004). The Handbook of World Stock, Derivative and Commodity Exchanges.
Mondovisione.
Susmel, R. and R. F. Engle (1994). Hourly volatility spillovers between international equity
markets. Journal of International Money and Finance 13 (1), 3–25.
Tauchen, G. and H. Zhou (2011). Realized jumps on financial markets and predicting credit
spreads. Journal of Econometrics 160 (1), 102–118.
Yuan, K. (2005). Asymmetric price movements and borrowing constraints: A rational ex-
pectations equilibrium model of crises, contagion, and confusion. Journal of Finance 60 (1),
379–411.
Zhang, Z., J. Cai, and Y. L. Cheung (2009). Explaining country and cross-border liquidity
commonality in international equity markets. Journal of Futures Markets 29 (7), 630–652.
47
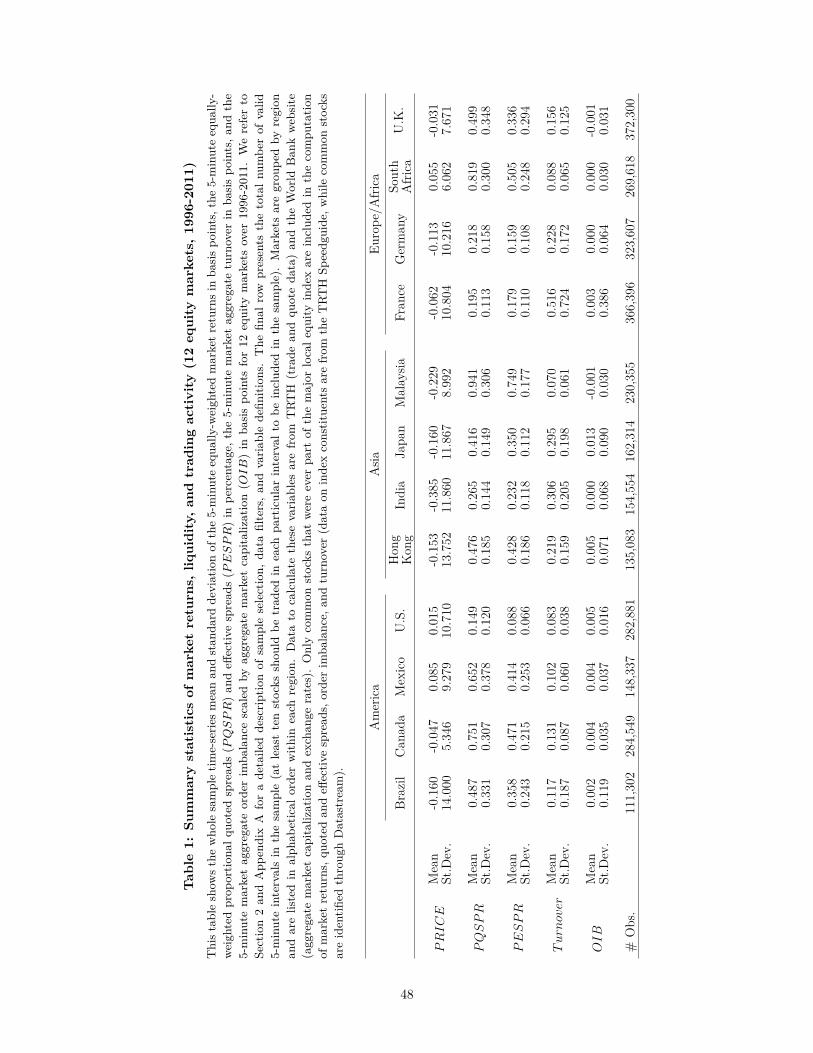
Tab
le1:
Sum
mar
yst
atis
tics
ofm
arke
tre
turn
s,liq
uidi
ty,
and
trad
ing
acti
vity
(12
equi
tym
arke
ts,
1996
-201
1)Thistableshow
sthewho
lesampletim
e-serie
smeanan
dstan
dard
deviationof
the5-minuteequa
lly-w
eigh
tedmarketreturnsin
basispo
ints,the
5-minuteequa
lly-
weigh
tedprop
ortio
nalq
uotedspread
s(P
QS
PR)an
deff
ectiv
espread
s(P
ES
PR)in
percentage,t
he5-minutemarketaggregateturnover
inba
sispo
ints,a
ndthe
5-minutemarketaggregateorde
rim
balancescaled
byaggregatemarketcapitalization(O
IB)in
basispo
ints
for12
equity
markets
over
1996-2011.
Wereferto
Section2an
dApp
endixA
forade
taile
dde
scrip
tionof
sampleselection,
data
filters,a
ndvaria
blede
finition
s.The
final
row
presents
thetotaln
umbe
rof
valid
5-minuteintervalsin
thesample(atleasttenstocks
shou
ldbe
trad
edin
each
particular
interval
tobe
includ
edin
thesample).Markets
aregrou
pedby
region
andarelistedin
alph
abetical
orde
rwith
ineach
region
.Datato
calculatethesevaria
bles
arefrom
TRT
H(trade
andqu
oteda
ta)an
dtheWorld
Ban
kweb
site
(aggregate
marketcapitalizationan
dexchan
gerates).Onlycommon
stocks
that
wereever
part
ofthemajor
locale
quity
inde
xareinclud
edin
thecompu
tatio
nof
marketreturns,qu
oted
andeff
ectiv
espread
s,orde
rim
balance,
andturnover
(dataon
inde
xconstit
uentsarefrom
theTRT
HSp
eedg
uide
,while
common
stocks
areidentifi
edthroug
hDatastream).
Am
eric
aA
siaEu
rope
/Afri
ca
Bra
zil
Can
ada
Mex
ico
U.S
.H
ong
Kon
gIn
dia
Japa
nM
alay
siaFr
ance
Ger
man
ySo
uth
Afri
caU
.K.
PR
IC
EM
ean
-0.1
60-0
.047
0.08
50.
015
-0.1
53-0
.385
-0.1
60-0
.229
-0.0
62-0
.113
0.05
5-0
.031
St.D
ev.
14.0
005.
346
9.27
910
.710
13.7
5211
.860
11.8
678.
992
10.8
0410
.216
6.06
27.
671
PQ
SP
RM
ean
0.48
70.
751
0.65
20.
149
0.47
60.
265
0.41
60.
941
0.19
50.
218
0.81
90.
499
St.D
ev.
0.33
10.
307
0.37
80.
120
0.18
50.
144
0.14
90.
306
0.11
30.
158
0.30
00.
348
PE
SP
RM
ean
0.35
80.
471
0.41
40.
088
0.42
80.
232
0.35
00.
749
0.17
90.
159
0.50
50.
336
St.D
ev.
0.24
30.
215
0.25
30.
066
0.18
60.
118
0.11
20.
177
0.11
00.
108
0.24
80.
294
Turn
over
Mea
n0.
117
0.13
10.
102
0.08
30.
219
0.30
60.
295
0.07
00.
516
0.22
80.
088
0.15
6St
.Dev
.0.
187
0.08
70.
060
0.03
80.
159
0.20
50.
198
0.06
10.
724
0.17
20.
065
0.12
5
OIB
Mea
n0.
002
0.00
40.
004
0.00
50.
005
0.00
00.
013
-0.0
010.
003
0.00
00.
000
-0.0
01St
.Dev
.0.
119
0.03
50.
037
0.01
60.
071
0.06
80.
090
0.03
00.
386
0.06
40.
030
0.03
1
#O
bs.
111,
302
284,
549
148,
337
282,
881
135,
083
154,
554
162,
314
230,
355
366,
396
323,
607
269,
618
372,
300
48
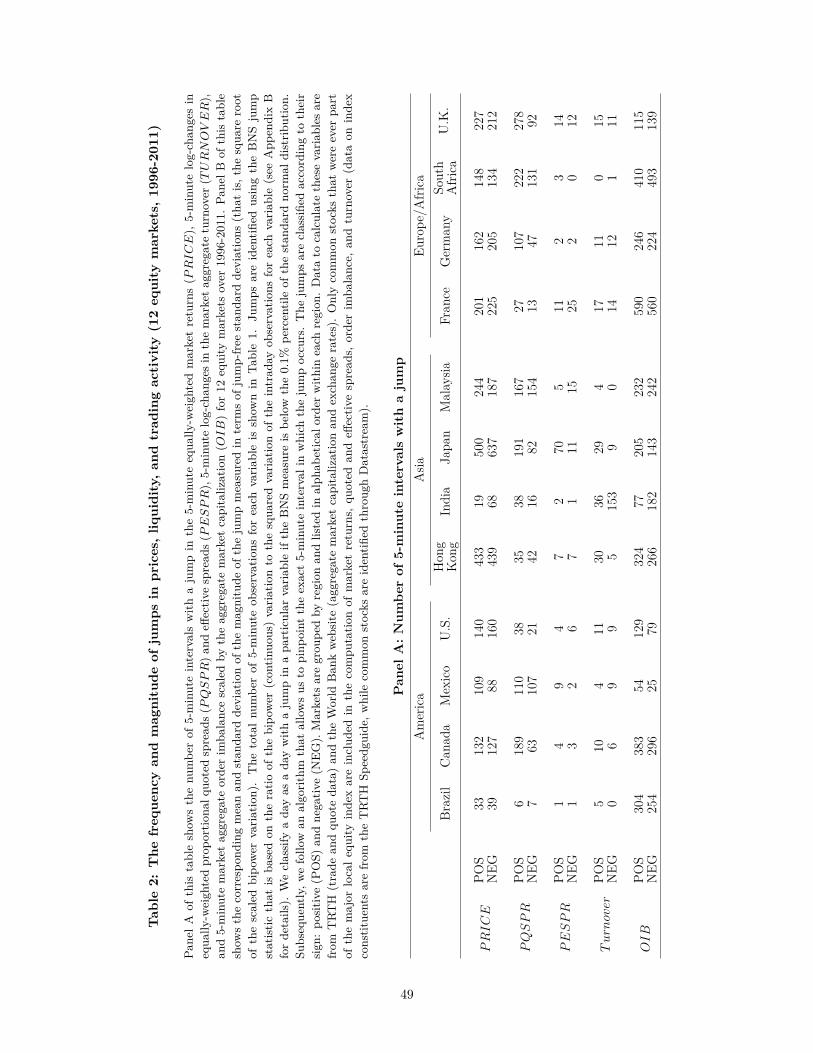
Tab
le2:
The
freq
uenc
yan
dm
agni
tude
ofju
mps
inpr
ices
,liq
uidi
ty,
and
trad
ing
acti
vity
(12
equi
tym
arke
ts,
1996
-201
1)
Pane
lAof
this
tableshow
sthenu
mbe
rof
5-minuteintervalswith
ajumpin
the5-minuteequa
lly-w
eigh
tedmarketreturns(P
RIC
E),
5-minutelog-chan
gesin
equa
lly-w
eigh
tedprop
ortio
nalq
uotedspread
s(P
QS
PR)an
deff
ectiv
espread
s(P
ES
PR),5-minutelog-chan
gesin
themarketaggregateturnover
(TU
RN
OV
ER
),an
d5-minutemarketaggregateorde
rim
balancescaled
bytheaggregatemarketcapitalization(O
IB)for12
equity
markets
over
1996-2011.
Pane
lBof
thistable
show
sthecorrespo
ndingmeanan
dstan
dard
deviationof
themagnitude
ofthejumpmeasuredin
term
sof
jump-free
stan
dard
deviations
(tha
tis,the
squa
reroot
ofthescaled
bipo
wer
varia
tion).The
totalnu
mbe
rof
5-minuteob
servations
foreach
varia
bleis
show
nin
Table1.
Jumps
areidentifi
edusingtheBNSjump
statistic
that
isba
sedon
theratio
ofthebipo
wer
(con
tinuo
us)varia
tionto
thesqua
redvaria
tionof
theintrad
ayob
servations
foreach
varia
ble(see
App
endixB
forde
tails).
Weclassify
ada
yas
ada
ywith
ajumpin
apa
rticular
varia
bleiftheBNSmeasure
isbe
low
the0.1%
percentileof
thestan
dard
norm
aldistrib
ution.
Subseque
ntly,w
efollo
wan
algorit
hmthat
allowsus
topinp
oint
theexact5-minuteinterval
inwhich
thejumpoccurs.The
jumps
areclassifie
daccordingto
their
sign
:po
sitiv
e(P
OS)
andne
gativ
e(N
EG).Markets
aregrou
pedby
region
andlistedin
alph
abetical
orde
rwith
ineach
region
.Datato
calculatethesevaria
bles
are
from
TRT
H(trade
andqu
oteda
ta)an
dtheWorld
Ban
kweb
site
(aggregate
marketcapitalizationan
dexchan
gerates).Onlycommon
stocks
that
wereever
part
ofthemajor
locale
quity
inde
xareinclud
edin
thecompu
tatio
nof
marketreturns,
quoted
andeff
ectiv
espread
s,orderim
balance,
andturnover
(dataon
inde
xconstit
uentsarefrom
theTRT
HSp
eedg
uide
,while
common
stocks
areidentifi
edthroug
hDatastream).
Pan
elA
:N
umbe
rof
5-m
inut
ein
terv
als
wit
ha
jum
pA
mer
ica
Asia
Euro
pe/A
frica
Bra
zil
Can
ada
Mex
ico
U.S
.H
ong
Kon
gIn
dia
Japa
nM
alay
siaFr
ance
Ger
man
ySo
uth
Afri
caU
.K.
PR
IC
EPO
S33
132
109
140
433
1950
024
420
116
214
822
7N
EG39
127
8816
043
968
637
187
225
205
134
212
PQ
SP
RPO
S6
189
110
3835
3819
116
727
107
222
278
NEG
763
107
2142
1682
154
1347
131
92
PE
SP
RPO
S1
49
47
270
511
23
14N
EG1
32
67
111
1525
20
12
Turn
over
POS
510
411
3036
294
1711
015
NEG
06
99
515
39
014
121
11
OIB
POS
304
383
5412
932
477
205
232
590
246
410
115
NEG
254
296
2579
266
182
143
242
560
224
493
139
49
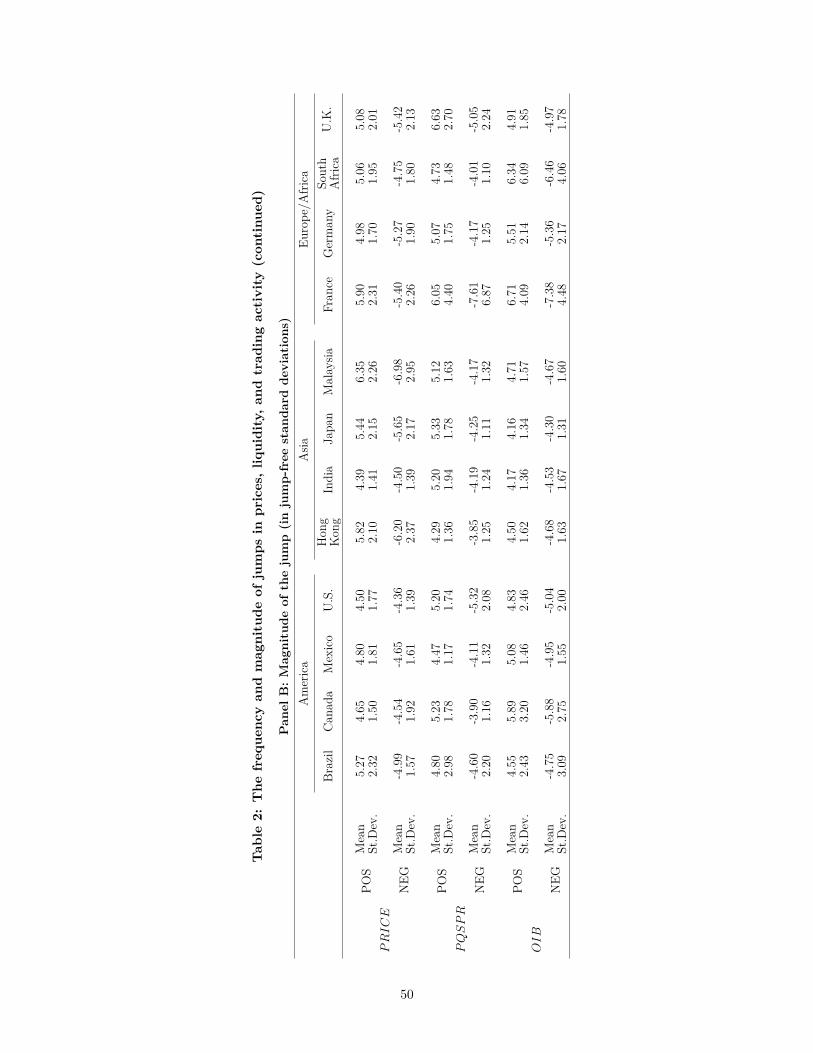
Tab
le2:
The
freq
uenc
yan
dm
agni
tude
ofju
mps
inpr
ices
,liq
uidi
ty,
and
trad
ing
acti
vity
(con
tinu
ed)
Pan
elB
:M
agni
tude
ofth
eju
mp
(in
jum
p-fr
eest
anda
rdde
viat
ions
)A
mer
ica
Asia
Euro
pe/A
frica
Bra
zil
Can
ada
Mex
ico
U.S
.H
ong
Kon
gIn
dia
Japa
nM
alay
siaFr
ance
Ger
man
ySo
uth
Afri
caU
.K.
PR
IC
E
POS
Mea
n5.
274.
654.
804.
505.
824.
395.
446.
355.
904.
985.
065.
08St
.Dev
.2.
321.
501.
811.
772.
101.
412.
152.
262.
311.
701.
952.
01
NEG
Mea
n-4
.99
-4.5
4-4
.65
-4.3
6-6
.20
-4.5
0-5
.65
-6.9
8-5
.40
-5.2
7-4
.75
-5.4
2St
.Dev
.1.
571.
921.
611.
392.
371.
392.
172.
952.
261.
901.
802.
13
PQ
SP
R
POS
Mea
n4.
805.
234.
475.
204.
295.
205.
335.
126.
055.
074.
736.
63St
.Dev
.2.
981.
781.
171.
741.
361.
941.
781.
634.
401.
751.
482.
70
NEG
Mea
n-4
.60
-3.9
0-4
.11
-5.3
2-3
.85
-4.1
9-4
.25
-4.1
7-7
.61
-4.1
7-4
.01
-5.0
5St
.Dev
.2.
201.
161.
322.
081.
251.
241.
111.
326.
871.
251.
102.
24
OIB
POS
Mea
n4.
555.
895.
084.
834.
504.
174.
164.
716.
715.
516.
344.
91St
.Dev
.2.
433.
201.
462.
461.
621.
361.
341.
574.
092.
146.
091.
85
NEG
Mea
n-4
.75
-5.8
8-4
.95
-5.0
4-4
.68
-4.5
3-4
.30
-4.6
7-7
.38
-5.3
6-6
.46
-4.9
7St
.Dev
.3.
092.
751.
552.
001.
631.
671.
311.
604.
482.
174.
061.
78
50
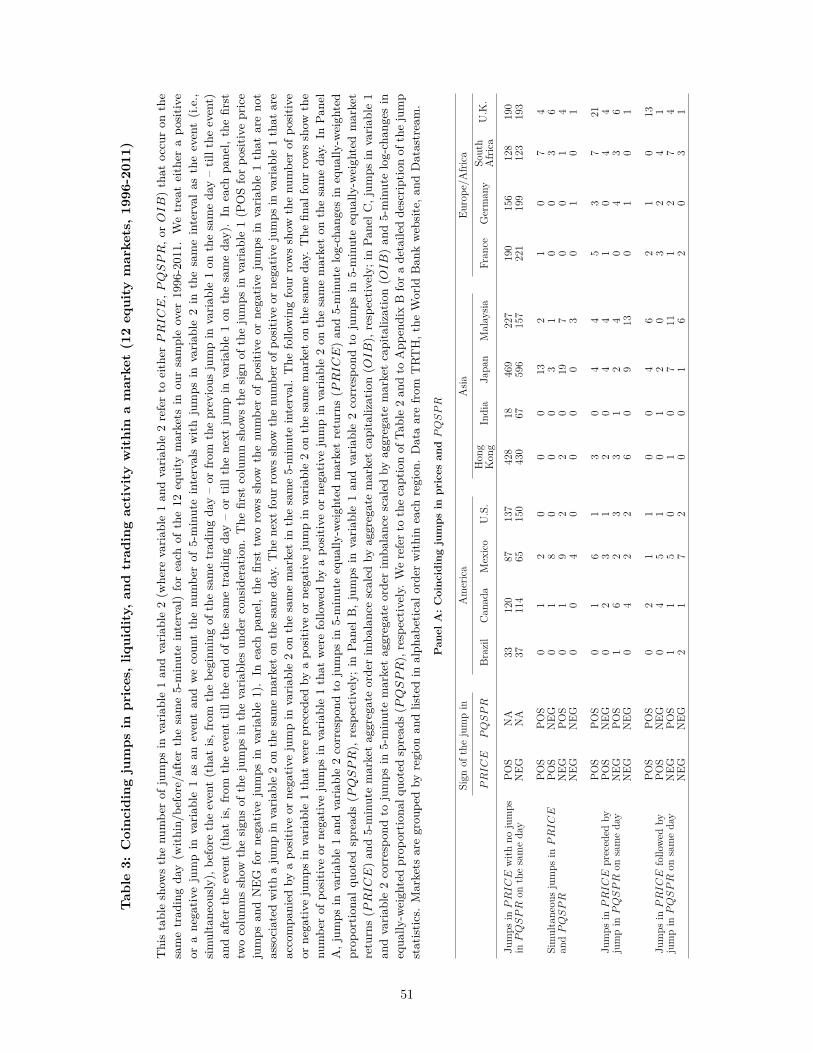
Tab
le3:
Coi
ncid
ing
jum
psin
pric
es,
liqui
dity
,an
dtr
adin
gac
tivi
tyw
ithi
na
mar
ket
(12
equi
tym
arke
ts,
1996
-201
1)
Thistableshow
sthenu
mbe
rof
jumps
invaria
ble1an
dvaria
ble2(w
here
varia
ble1an
dvaria
ble2referto
either
PR
IC
E,P
QS
PR,o
rO
IB)that
occuron
the
sametrad
ingda
y(w
ithin/b
efore/afterthesame5-minuteinterval)foreach
ofthe12
equity
markets
inou
rsampleover
1996-2011.
Wetreateither
apo
sitiv
eor
ane
gativ
ejumpin
varia
ble1as
aneventan
dwecoun
tthenu
mbe
rof
5-minuteintervalswith
jumps
invaria
ble2in
thesameinterval
astheevent(i.e.,
simultane
ously),b
eforetheevent(tha
tis,from
thebe
ginn
ingof
thesametrad
ingda
y–or
from
theprevious
jumpin
varia
ble1on
thesameda
y–tillthe
event)
andaftertheevent(tha
tis,from
theeventtillt
heen
dof
thesametrad
ingda
y–or
tillt
hene
xtjumpin
varia
ble1on
thesameda
y).In
each
pane
l,thefirst
twocolumns
show
thesign
sof
thejumps
inthevaria
bles
unde
rconsideration.
The
first
columnshow
sthesign
ofthejumps
invaria
ble1(P
OSforpo
sitiv
eprice
jumps
andNEG
forne
gativ
ejumps
invaria
ble1).In
each
pane
l,thefirst
tworowsshow
thenu
mbe
rof
positiv
eor
negativ
ejumps
invaria
ble1that
areno
tassociated
with
ajumpin
varia
ble2on
thesamemarketon
thesameda
y.The
next
four
rowsshow
thenu
mbe
rof
positiv
eor
negativ
ejumps
invaria
ble1that
are
accompa
nied
byapo
sitiv
eor
negativ
ejumpin
varia
ble2on
thesamemarketin
thesame5-minuteinterval.The
follo
wingfour
rowsshow
thenu
mbe
rof
positiv
eor
negativ
ejumps
invaria
ble1that
werepreced
edby
apo
sitiv
eor
negativ
ejumpin
varia
ble2on
thesamemarketon
thesameda
y.The
final
four
rowsshow
the
numbe
rof
positiv
eor
negativ
ejumps
invaria
ble1that
werefollo
wed
byapo
sitiv
eor
negativ
ejumpin
varia
ble2on
thesamemarketon
thesameda
y.In
Pane
lA,jum
psin
varia
ble1an
dvaria
ble2correspo
ndto
jumps
in5-minuteequa
lly-w
eigh
tedmarketreturns(P
RIC
E)an
d5-minutelog-chan
gesin
equa
lly-w
eigh
ted
prop
ortio
nalq
uotedspread
s(P
QS
PR),
respectiv
ely;
inPa
nelB
,jum
psin
varia
ble1an
dvaria
ble2correspo
ndto
jumps
in5-minuteequa
lly-w
eigh
tedmarket
returns(P
RIC
E)an
d5-minutemarketaggregateorde
rim
balancescaled
byaggregatemarketcapitalization(O
IB),respectiv
ely;
inPa
nelC
,jum
psin
varia
ble1
andvaria
ble2correspo
ndto
jumps
in5-minutemarketaggregateorde
rim
balancescaled
byaggregatemarketcapitalization(O
IB)an
d5-minutelog-chan
gesin
equa
lly-w
eigh
tedprop
ortio
nalq
uotedspread
s(P
QS
PR),respectiv
ely.
Wereferto
thecaptionof
Table2an
dto
App
endixBforade
taile
dde
scrip
tionof
thejump
statistic
s.Markets
aregrou
pedby
region
andlistedin
alph
abetical
orde
rwith
ineach
region
.Dataarefrom
TRT
H,t
heWorld
Ban
kwebsite,a
ndDatastream.
Pan
elA
:C
oinc
idin
gju
mps
inpr
ices
and
PQ
SP
R
Sign
ofth
eju
mp
inA
mer
ica
Asia
Euro
pe/A
frica
PR
IC
EP
QS
PR
Bra
zil
Can
ada
Mex
ico
U.S
.H
ong
Kon
gIn
dia
Japa
nM
alay
siaFr
ance
Ger
man
ySo
uth
Afri
caU
.K.
Jum
psin
PR
IC
Ew
ithno
jum
psin
PQ
SP
Ron
the
sam
eda
yPO
SN
A33
120
8713
742
818
469
227
190
156
128
190
NEG
NA
3711
465
150
430
6759
615
722
119
912
319
3
Sim
ulta
neou
sju
mps
inP
RIC
Ean
dP
QS
PR
POS
POS
01
20
00
132
10
74
POS
NEG
01
80
00
31
00
36
NEG
POS
01
92
20
197
00
14
NEG
NEG
00
40
00
03
01
01
Jum
psin
PR
IC
Epr
eced
edby
jum
pin
PQ
SP
Ron
sam
eda
y
POS
POS
01
61
30
44
53
721
POS
NEG
02
31
20
44
10
44
NEG
POS
16
23
31
24
04
36
NEG
NEG
04
22
60
913
01
01
Jum
psin
PR
IC
Efo
llowe
dby
jum
pin
PQ
SP
Ron
sam
eda
y
POS
POS
02
11
00
46
21
013
POS
NEG
04
51
01
20
32
41
NEG
POS
11
50
10
711
12
74
NEG
NEG
21
72
00
16
20
31
51

Tab
le3:
Coi
ncid
ing
jum
psin
pric
es,
liqui
dity
,an
dtr
adin
gac
tivi
tyw
ithi
na
mar
ket
(con
tinu
ed)
Pan
elB
:C
oinc
idin
gju
mps
inpr
ices
and
OIB
Sign
ofth
eju
mp
inA
mer
ica
Asia
Euro
pe/A
frica
PR
IC
EO
IB
Bra
zil
Can
ada
Mex
ico
U.S
.H
ong
Kon
gIn
dia
Japa
nM
alay
siaFr
ance
Ger
man
ySo
uth
Afri
caU
.K.
Jum
psin
PR
IC
Ew
ithno
jum
psin
OIB
onth
esa
me
day
POS
NA
2510
910
612
036
912
419
226
118
104
104
190
NEG
NA
3310
685
149
359
4251
017
313
714
710
917
9
Sim
ulta
neou
sju
mps
inP
RIC
Ean
dO
IB
POS
POS
18
215
222
424
4331
113
POS
NEG
00
00
10
00
00
00
NEG
POS
00
00
10
10
00
20
NEG
NEG
23
13
2217
583
3428
014
Jum
psin
PR
IC
Epr
eced
edby
jum
pin
OIB
onsa
me
day
POS
POS
24
03
200
85
154
60
POS
NEG
43
01
102
21
95
94
NEG
POS
24
03
131
80
1610
21
NEG
NEG
17
02
168
65
154
53
Jum
psin
PR
IC
Efo
llowe
dby
jum
pin
OIB
onsa
me
day
POS
POS
35
10
192
215
2613
1313
POS
NEG
57
00
80
54
174
189
NEG
POS
35
10
161
271
95
197
NEG
NEG
25
13
363
246
216
105
Pan
elC
:C
oinc
idin
gju
mps
inO
IB
and
PQ
SP
R
Sign
ofth
eju
mp
inA
mer
ica
Asia
Euro
pe/A
frica
OIB
PQ
SP
RB
razi
lC
anad
aM
exic
oU
.S.
Hon
gK
ong
Indi
aJa
pan
Mal
aysia
Fran
ceG
erm
any
Sout
hA
frica
U.K
.
Jum
psin
OIB
with
noju
mps
inP
QS
PR
onth
esa
me
day
POS
NA
301
352
5012
831
975
195
222
576
236
366
108
NEG
NA
253
259
2574
263
174
136
221
552
216
451
116
Sim
ulta
neou
sju
mps
inO
IB
and
PQ
SP
R
POS
POS
01
00
00
31
10
00
POS
NEG
00
00
00
00
10
10
NEG
POS
01
00
00
24
01
01
NEG
NEG
00
00
00
00
00
00
Jum
psin
OIB
prec
eded
byju
mp
inP
QS
PR
onsa
me
day
POS
POS
117
10
21
23
29
113
POS
NEG
15
20
22
24
15
153
NEG
POS
020
03
04
23
23
1513
NEG
NEG
03
01
20
15
02
72
Jum
psin
OIB
follo
wed
byju
mp
inP
QS
PR
onsa
me
day
POS
POS
27
01
00
45
43
141
POS
NEG
15
10
00
00
12
40
NEG
POS
04
00
12
03
23
174
NEG
NEG
03
01
01
02
11
60
52
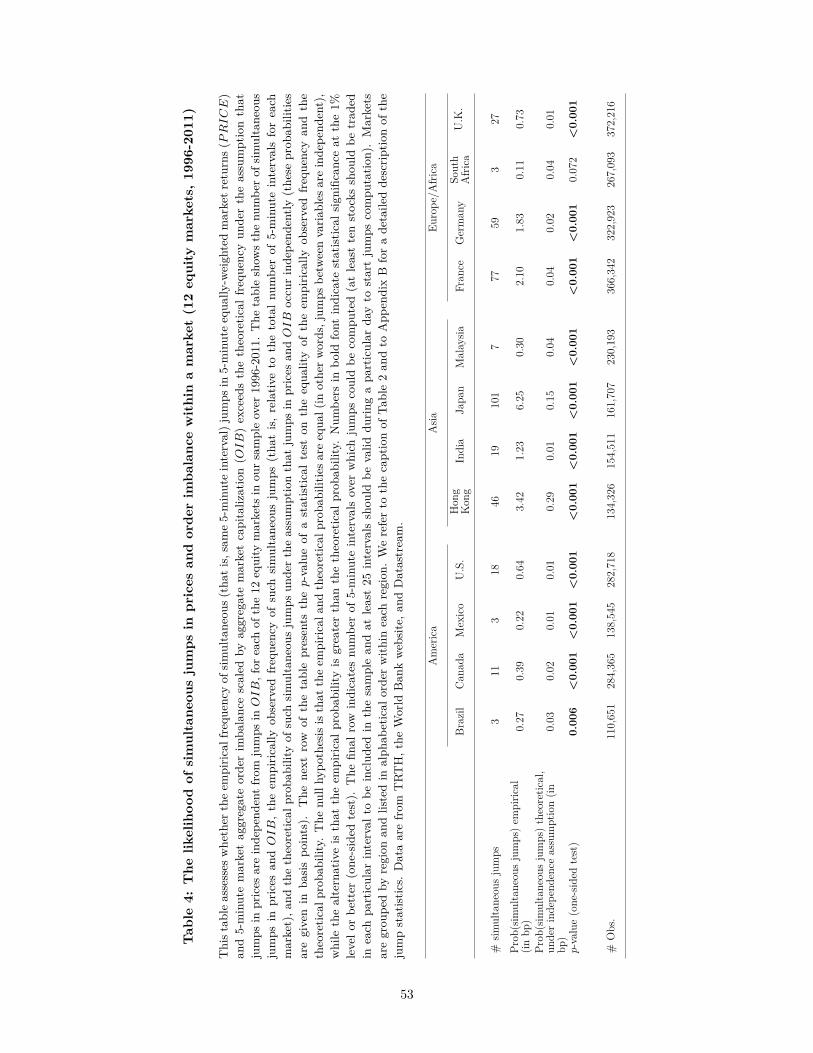
Tab
le4:
The
likel
ihoo
dof
sim
ulta
neou
sju
mps
inpr
ices
and
orde
rim
bala
nce
wit
hin
am
arke
t(1
2eq
uity
mar
kets
,19
96-2
011)
Thist
ableassesses
whe
ther
theem
piric
alfreque
ncyof
simultane
ous(
that
is,sam
e5-minuteinterval)jum
psin
5-minuteequa
lly-w
eigh
tedmarketr
eturns
(PR
IC
E)
and5-minutemarketaggregateorde
rim
balancescaled
byaggregatemarketcapitalization(O
IB)exceed
sthetheoretic
alfreque
ncyun
dertheassumptionthat
jumps
inprices
areinde
pend
entfrom
jumps
inO
IB,for
each
ofthe12
equity
markets
inou
rsampleover
1996-2011.
The
tableshow
sthenu
mbe
rof
simultane
ous
jumps
inprices
and
OIB,theem
piric
ally
observed
freque
ncyof
such
simultane
ousjumps
(tha
tis,relativ
eto
thetotalnu
mbe
rof
5-minuteintervalsforeach
market),a
ndthetheoretic
alprob
ability
ofsuch
simultane
ousjumps
unde
rtheassumptionthat
jumps
inprices
and
OIB
occurinde
pend
ently
(the
seprob
abilitie
saregivenin
basispo
ints).
The
next
row
ofthetablepresents
the
p-value
ofastatistic
altest
ontheequa
lityof
theem
piric
ally
observed
freque
ncyan
dthe
theoretic
alprob
ability.The
nullhy
pothesisisthat
theem
piric
alan
dtheoretic
alprob
abilitie
sareequa
l(in
othe
rwords,jum
psbe
tweenvaria
bles
areinde
pend
ent),
while
thealternativeis
that
theem
piric
alprob
ability
isgreaterthan
thetheoretic
alprob
ability.Num
bers
inbo
ldfont
indicate
statistic
alsign
ificanceat
the1%
levelo
rbe
tter
(one
-sided
test).
The
final
row
indicatesnu
mbe
rof
5-minuteintervalsover
which
jumps
couldbe
compu
ted(atleasttenstocks
shou
ldbe
trad
edin
each
particular
interval
tobe
includ
edin
thesamplean
dat
least25
intervalsshou
ldbe
valid
durin
gapa
rticular
dayto
startjumps
compu
tatio
n).Markets
aregrou
pedby
region
andlistedin
alph
abetical
orde
rwith
ineach
region
.Wereferto
thecaptionof
Table2an
dto
App
endixB
forade
taile
dde
scrip
tionof
the
jumpstatistic
s.Dataarefrom
TRT
H,t
heWorld
Ban
kweb
site,a
ndDatastream.
Am
eric
aA
siaEu
rope
/Afri
ca
Bra
zil
Can
ada
Mex
ico
U.S
.H
ong
Kon
gIn
dia
Japa
nM
alay
siaFr
ance
Ger
man
ySo
uth
Afri
caU
.K.
#sim
ulta
neou
sju
mps
311
318
4619
101
777
593
27
Prob
(sim
ulta
neou
sju
mps
)em
piric
al(in
bp)
0.27
0.39
0.22
0.64
3.42
1.23
6.25
0.30
2.10
1.83
0.11
0.73
Prob
(sim
ulta
neou
sju
mps
)th
eore
tical
,un
der
inde
pend
ence
assu
mpt
ion
(inbp
)0.
030.
020.
010.
010.
290.
010.
150.
040.
040.
020.
040.
01
p-va
lue
(one
-sid
edte
st)
0.00
6<
0.00
1<
0.00
1<
0.00
1<
0.00
1<
0.00
1<
0.00
1<
0.00
1<
0.00
1<
0.00
10.
072
<0.
001
#O
bs.
110,
651
284,
365
138,
545
282,
718
134,
326
154,
511
161,
707
230,
193
366,
342
322,
923
267,
093
372,
216
53
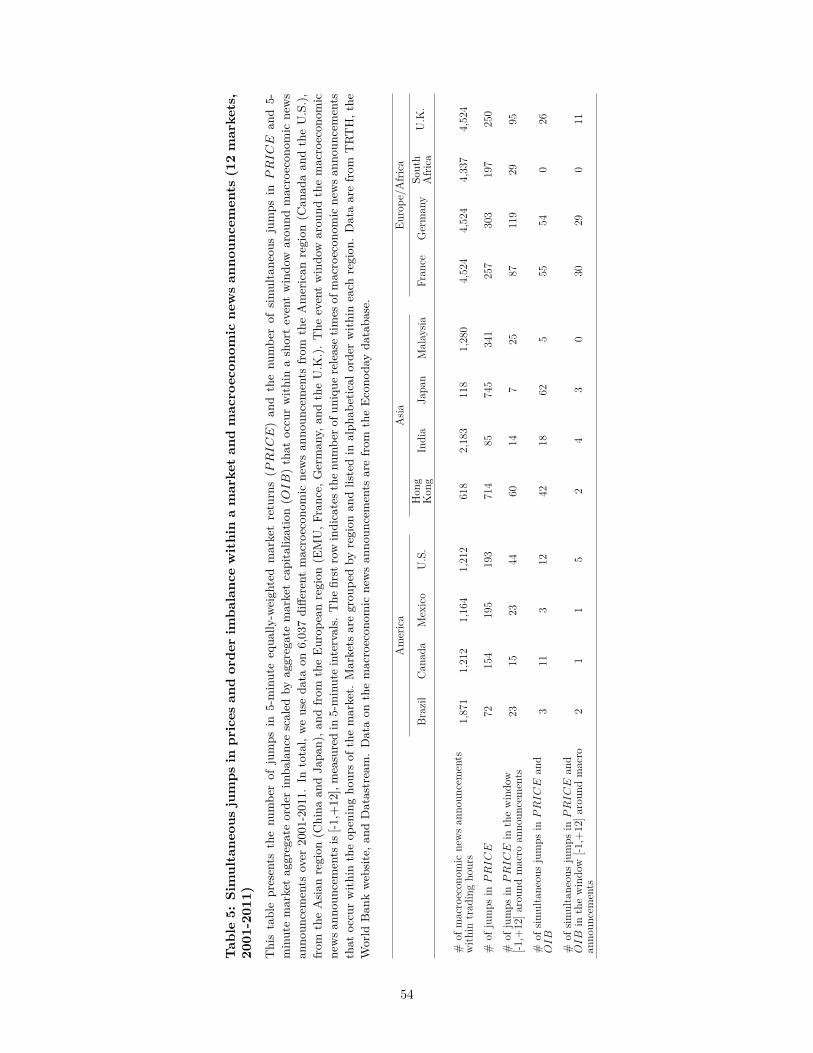
Tab
le5:
Sim
ulta
neou
sju
mps
inpr
ices
and
orde
rim
bala
nce
wit
hin
am
arke
tan
dm
acro
econ
omic
new
san
noun
cem
ents
(12
mar
kets
,20
01-2
011)
Thistablepresents
thenu
mbe
rof
jumps
in5-minuteequa
lly-w
eigh
ted
marketreturns(P
RIC
E)an
dthenu
mbe
rof
simultane
ousjumps
inP
RIC
Ean
d5-
minutemarketaggregateorde
rim
balancescaled
byaggregatemarketcapitalization(O
IB)that
occurwith
inashorteventwindo
warou
ndmacroecon
omic
news
anno
uncements
over
2001-2011.
Intotal,weuseda
taon
6,037diffe
rent
macroecon
omic
newsan
noun
cements
from
theAmerican
region
(Can
adaan
dtheU.S.),
from
theAsian
region
(China
andJa
pan),a
ndfrom
theEurop
eanregion
(EMU,F
rance,
German
y,an
dtheU.K
.).The
eventwindo
warou
ndthemacroecon
omic
newsa
nnou
ncem
ents
is[-1
,+12],measuredin
5-minuteintervals.
The
first
rowindicatest
henu
mbe
rofu
niqu
ereleasetim
esof
macroecon
omicne
wsa
nnou
ncem
ents
that
occurwith
intheop
eningho
ursof
themarket.
Markets
aregrou
pedby
region
andlistedin
alph
abetical
orde
rwith
ineach
region
.Dataarefrom
TRT
H,the
World
Ban
kweb
site,a
ndDatastream.Dataon
themacroecon
omic
newsan
noun
cements
arefrom
theEcono
dayda
taba
se.
Am
eric
aA
siaEu
rope
/Afri
ca
Bra
zil
Can
ada
Mex
ico
U.S
.H
ong
Kon
gIn
dia
Japa
nM
alay
siaFr
ance
Ger
man
ySo
uth
Afri
caU
.K.
#of
mac
roec
onom
icne
ws
anno
unce
men
tsw
ithin
trad
ing
hour
s1,
871
1,21
21,
164
1,21
261
82,
183
118
1,28
04,
524
4,52
44,
337
4,52
4
#of
jum
psin
PR
IC
E72
154
195
193
714
8574
534
125
730
319
725
0#
ofju
mps
inP
RIC
Ein
the
win
dow
[-1,+
12]a
roun
dm
acro
anno
unce
men
ts23
1523
4460
147
2587
119
2995
#of
simul
tane
ous
jum
psin
PR
IC
Ean
dO
IB
311
312
4218
625
5554
026
#of
simul
tane
ous
jum
psin
PR
IC
Ean
dO
IB
inth
ew
indo
w[-1
,+12
]aro
und
mac
roan
noun
cem
ents
21
15
24
30
3029
011
54
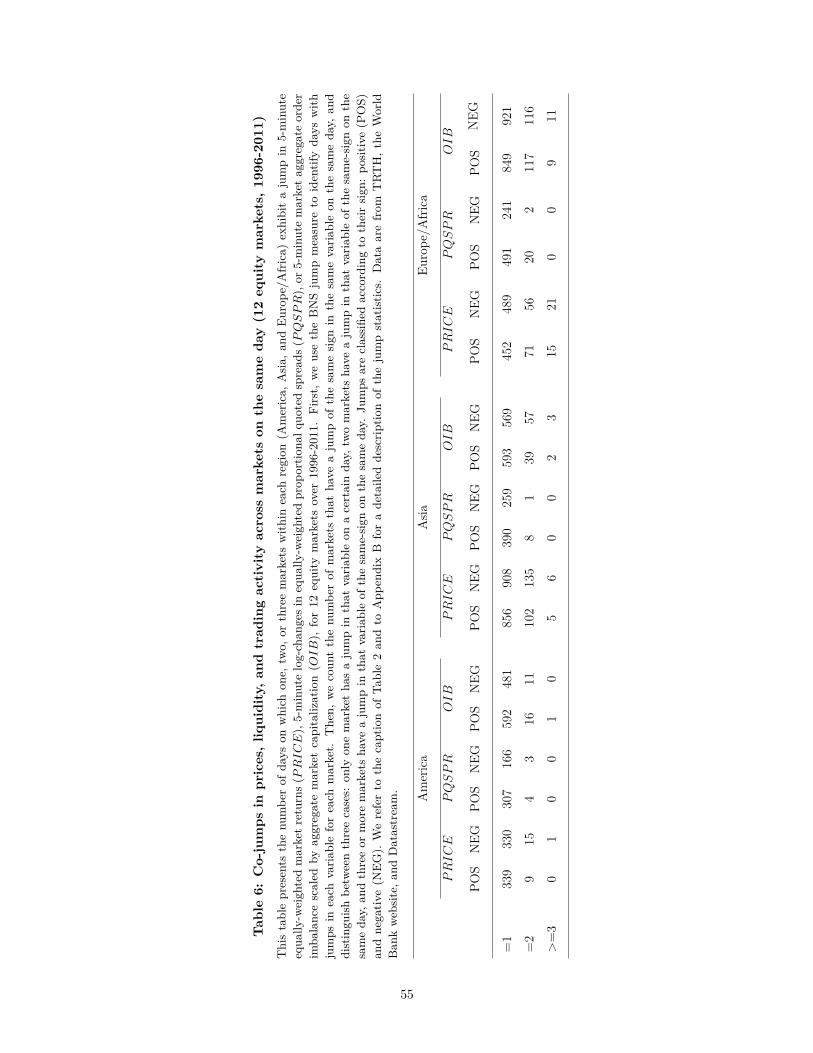
Tab
le6:
Co-
jum
psin
pric
es,
liqui
dity
,an
dtr
adin
gac
tivi
tyac
ross
mar
kets
onth
esa
me
day
(12
equi
tym
arke
ts,
1996
-201
1)Thistablepresents
thenu
mbe
rof
days
onwhich
one,
two,
orthreemarkets
with
ineach
region
(America,
Asia,
andEurop
e/Africa)
exhibitajumpin
5-minute
equa
lly-w
eigh
tedmarketreturns(P
RIC
E),5-minutelog-chan
gesin
equa
lly-w
eigh
tedprop
ortio
nalq
uotedspread
s(P
QS
PR),or
5-minutemarketaggregateorde
rim
balancescaled
byaggregatemarketcapitalization(O
IB),
for12
equity
markets
over
1996-2011.
First,
weusetheBNSjumpmeasure
toidentifyda
yswith
jumps
ineach
varia
bleforeach
market.
The
n,wecoun
tthenu
mbe
rof
markets
that
have
ajumpof
thesamesign
inthesamevaria
bleon
thesameda
y,an
ddistingu
ishbe
tweenthreecases:
only
onemarketha
sajumpin
that
varia
bleon
acertainda
y,tw
omarkets
have
ajumpin
that
varia
bleof
thesame-sign
onthe
sameda
y,an
dthreeor
moremarkets
have
ajumpin
that
varia
bleof
thesame-sign
onthesameda
y.Ju
mps
areclassifie
daccordingto
theirsign
:po
sitiv
e(P
OS)
andne
gativ
e(N
EG).
Wereferto
thecaptionof
Table2an
dto
App
endixB
forade
taile
dde
scrip
tionof
thejumpstatistic
s.Dataarefrom
TRT
H,t
heWorld
Ban
kweb
site,a
ndDatastream. Am
eric
aA
siaEu
rope
/Afri
ca
PR
IC
EP
QS
PR
OIB
PR
IC
EP
QS
PR
OIB
PR
IC
EP
QS
PR
OIB
POS
NEG
POS
NEG
POS
NEG
POS
NEG
POS
NEG
POS
NEG
POS
NEG
POS
NEG
POS
NEG
=1
339
330
307
166
592
481
856
908
390
259
593
569
452
489
491
241
849
921
=2
915
43
1611
102
135
81
3957
7156
202
117
116
>=
30
10
01
05
60
02
315
210
09
11
55
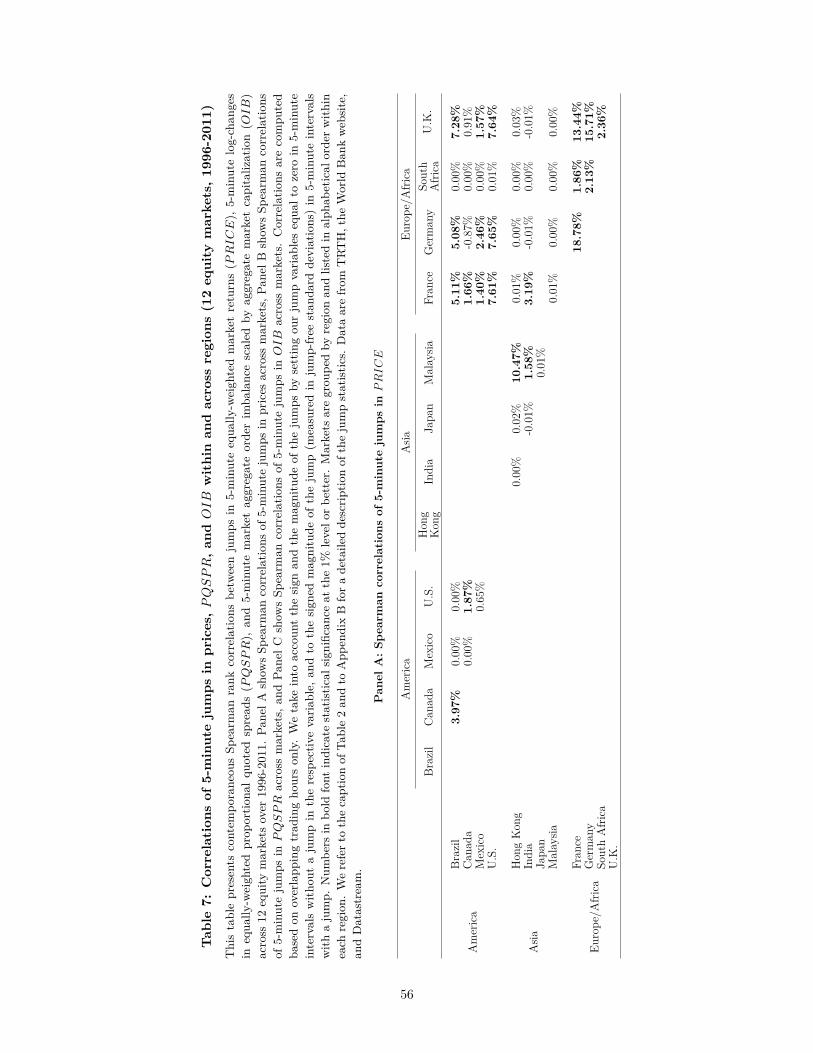
Tab
le7:
Cor
rela
tion
sof
5-m
inut
eju
mps
inpr
ices
,P
QS
PR
,an
dO
IB
wit
hin
and
acro
ssre
gion
s(1
2eq
uity
mar
kets
,19
96-2
011)
Thistablepresents
contem
porane
ousSp
earm
anrank
correlations
betw
eenjumps
in5-minuteequa
lly-w
eigh
tedmarketreturns(P
RIC
E),
5-minutelog-chan
ges
inequa
lly-w
eigh
tedprop
ortio
nalqu
oted
spread
s(P
QS
PR),
and5-minutemarketaggregateorde
rim
balancescaled
byaggregatemarketcapitalization(O
IB)
across
12equity
markets
over
1996-2011.
Pane
lAshow
sSp
earm
ancorrelations
of5-minutejumps
inprices
across
markets,P
anel
Bshow
sSp
earm
ancorrelations
of5-minutejumps
inP
QS
PR
across
markets,a
ndPa
nelC
show
sSp
earm
ancorrelations
of5-minutejumps
inO
IB
across
markets.Correlatio
nsarecompu
ted
basedon
overlapp
ingtrad
ingho
urson
ly.Wetake
into
accoun
tthesign
andthemagnitude
ofthejumps
bysettingou
rjumpvaria
bles
equa
ltozero
in5-minute
intervalswith
outajumpin
therespectiv
evaria
ble,
andto
thesign
edmagnitude
ofthejump(m
easuredin
jump-free
stan
dard
deviations)in
5-minuteintervals
with
ajump.
Num
bers
inbo
ldfont
indicate
statistic
alsign
ificanceat
the1%
levelo
rbe
tter.Markets
aregrou
pedby
region
andlistedin
alph
abetical
orde
rwith
ineach
region
.Wereferto
thecaptionof
Table2an
dto
App
endixBforade
taile
dde
scrip
tionof
thejumpstatistic
s.Dataarefrom
TRT
H,the
World
Ban
kweb
site,
andDatastream.
Pan
elA
:Sp
earm
anco
rrel
atio
nsof
5-m
inut
eju
mps
inP
RIC
E
Am
eric
aA
siaEu
rope
/Afri
ca
Braz
ilC
anad
aM
exic
oU
.S.
Hon
gK
ong
Indi
aJa
pan
Mal
aysia
Fran
ceG
erm
any
Sout
hA
frica
U.K
.
Am
eric
aBr
azil
3.97
%0.
00%
0.00
%5.
11%
5.08
%0.
00%
7.28
%C
anad
a0.
00%
1.87
%1.
66%
-0.8
7%0.
00%
0.91
%M
exic
o0.
65%
1.40
%2.
46%
0.00
%1.
57%
U.S
.7.
61%
7.65
%0.
01%
7.64
%
Asia
Hon
gK
ong
0.00
%0.
02%
10.4
7%0.
01%
0.00
%0.
00%
0.03
%In
dia
-0.0
1%1.
58%
3.19
%-0
.01%
0.00
%-0
.01%
Japa
n0.
01%
Mal
aysia
0.01
%0.
00%
0.00
%0.
00%
Euro
pe/A
frica
Fran
ce18
.78%
1.86
%13
.44%
Ger
man
y2.
13%
15.7
1%So
uth
Afri
ca2.
36%
U.K
.
56
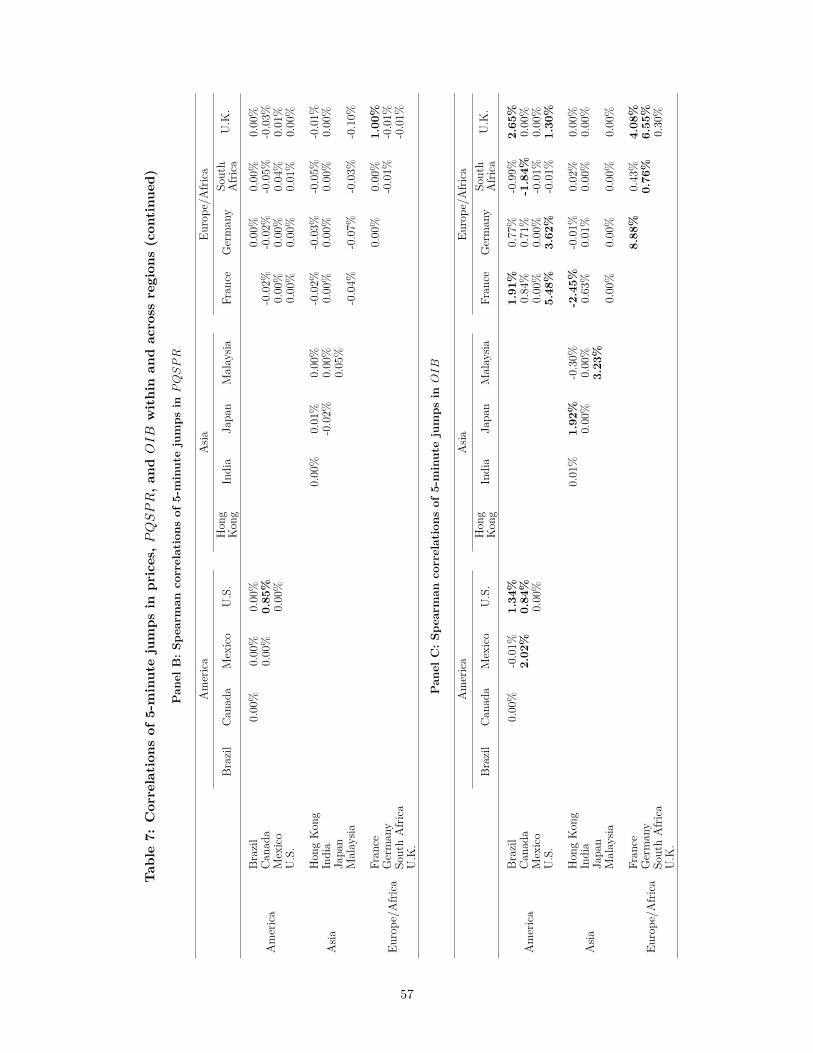
Tab
le7:
Cor
rela
tion
sof
5-m
inut
eju
mps
inpr
ices
,P
QS
PR
,an
dO
IB
wit
hin
and
acro
ssre
gion
s(c
onti
nued
)
Pan
elB
:Sp
earm
anco
rrel
atio
nsof
5-m
inut
eju
mps
inP
QS
PR
Am
eric
aA
siaEu
rope
/Afri
ca
Braz
ilC
anad
aM
exic
oU
.S.
Hon
gK
ong
Indi
aJa
pan
Mal
aysia
Fran
ceG
erm
any
Sout
hA
frica
U.K
.
Am
eric
aBr
azil
0.00
%0.
00%
0.00
%0.
00%
0.00
%0.
00%
Can
ada
0.00
%0.
85%
-0.0
2%-0
.02%
-0.0
5%-0
.03%
Mex
ico
0.00
%0.
00%
0.00
%0.
04%
0.01
%U
.S.
0.00
%0.
00%
0.01
%0.
00%
Asia
Hon
gK
ong
0.00
%0.
01%
0.00
%-0
.02%
-0.0
3%-0
.05%
-0.0
1%In
dia
-0.0
2%0.
00%
0.00
%0.
00%
0.00
%0.
00%
Japa
n0.
05%
Mal
aysia
-0.0
4%-0
.07%
-0.0
3%-0
.10%
Euro
pe/A
frica
Fran
ce0.
00%
0.00
%1.
00%
Ger
man
y-0
.01%
-0.0
1%So
uth
Afri
ca-0
.01%
U.K
.
Pan
elC
:Sp
earm
anco
rrel
atio
nsof
5-m
inut
eju
mps
inO
IB
Am
eric
aA
siaEu
rope
/Afri
ca
Braz
ilC
anad
aM
exic
oU
.S.
Hon
gK
ong
Indi
aJa
pan
Mal
aysia
Fran
ceG
erm
any
Sout
hA
frica
U.K
.
Am
eric
aBr
azil
0.00
%-0
.01%
1.34
%1.
91%
0.77
%-0
.99%
2.65
%C
anad
a2.
02%
0.84
%0.
84%
0.71
%-1
.84%
0.00
%M
exic
o0.
00%
0.00
%0.
00%
-0.0
1%0.
00%
U.S
.5.
48%
3.62
%-0
.01%
1.30
%
Asia
Hon
gK
ong
0.01
%1.
92%
-0.3
0%-2
.45%
-0.0
1%0.
02%
0.00
%In
dia
0.00
%0.
00%
0.63
%0.
01%
0.00
%0.
00%
Japa
n3.
23%
Mal
aysia
0.00
%0.
00%
0.00
%0.
00%
Euro
pe/A
frica
Fran
ce8.
88%
0.43
%4.
08%
Ger
man
y0.
76%
6.55
%So
uth
Afri
ca0.
30%
U.K
.
57
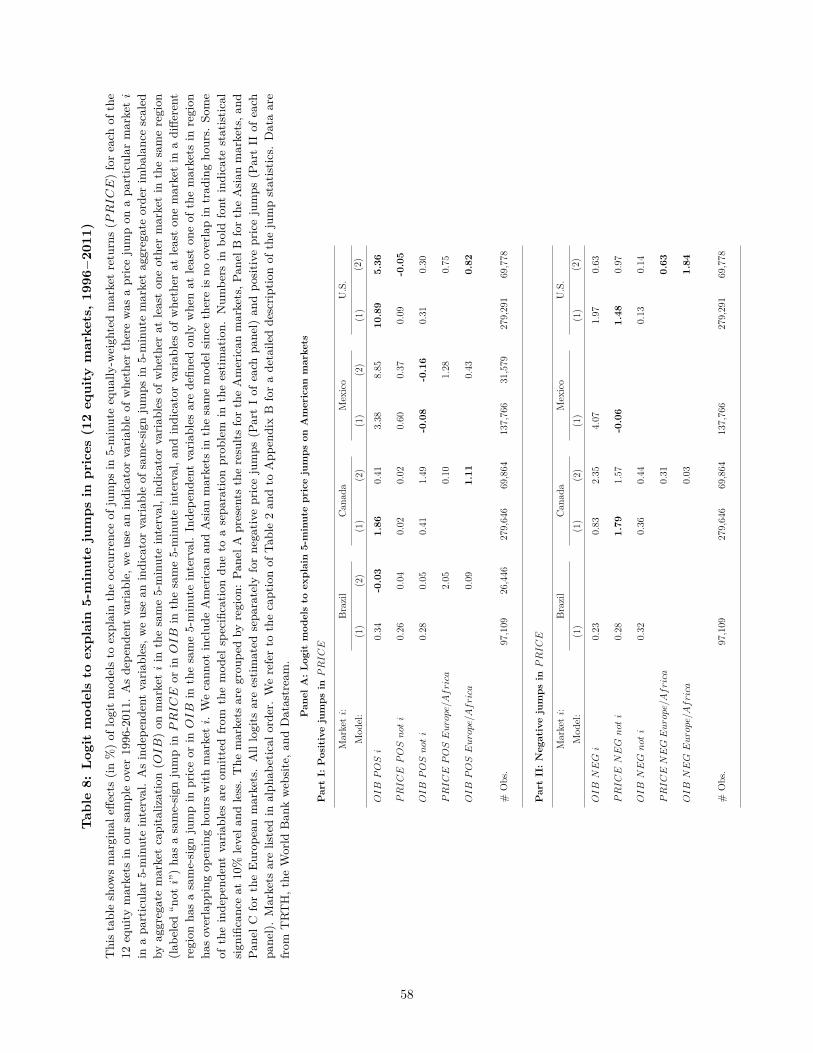
Tab
le8:
Logi
tm
odel
sto
expl
ain
5-m
inut
eju
mps
inpr
ices
(12
equi
tym
arke
ts,
1996
−20
11)
Thistableshow
smargina
leffe
cts(in
%)of
logitmod
elsto
explaintheoccurren
ceof
jumps
in5-minuteequa
lly-w
eigh
tedmarketreturns(P
RIC
E)foreach
ofthe
12equity
markets
inou
rsampleover
1996-2011.
Asde
pend
entvaria
ble,
weusean
indicatorvaria
bleof
whe
ther
therewas
apricejumpon
apa
rticular
market
i
inapa
rticular
5-minuteinterval.Asinde
pend
entvaria
bles,w
eusean
indicatorvaria
bleof
same-sign
jumps
in5-minutemarketaggregateorde
rim
balancescaled
byaggregatemarketcapitalization(O
IB)on
market
iin
thesame5-minuteinterval,ind
icator
varia
bles
ofwhether
atleaston
eothe
rmarketin
thesameregion
(labe
led“n
oti”)ha
sasame-sign
jumpin
PR
IC
Eor
inO
IB
inthesame5-minuteinterval,a
ndindicatorvaria
bles
ofwhe
ther
atleaston
emarketin
adiffe
rent
region
hasasame-sign
jumpin
priceor
inO
IB
inthesame5-minuteinterval.Inde
pend
entvaria
bles
arede
fined
only
whe
nat
leaston
eof
themarkets
inregion
hasoverlapp
ingop
eningho
urswith
market
i.Wecann
otinclud
eAmerican
andAsian
markets
inthesamemod
elsincethereisno
overlapin
trad
ingho
urs.
Some
oftheinde
pend
entvaria
bles
areom
itted
from
themod
elspecificatio
ndu
eto
asepa
ratio
nprob
lem
intheestim
ation.
Num
bers
inbo
ldfont
indicate
statistic
alsign
ificanceat
10%
levela
ndless.The
markets
aregrou
pedby
region
:Pa
nelA
presents
theresults
fortheAmerican
markets,P
anel
BfortheAsian
markets,a
ndPa
nelC
fortheEurop
eanmarkets.Alllogits
areestim
ated
sepa
rately
forne
gativ
epricejumps
(PartIof
each
pane
l)an
dpo
sitiv
epricejumps
(PartII
ofeach
pane
l).Markets
arelistedin
alph
abetical
orde
r.Wereferto
thecaptionof
Table2an
dto
App
endixB
forade
taile
dde
scrip
tionof
thejumpstatistic
s.Dataare
from
TRT
H,t
heWorld
Ban
kweb
site,a
ndDatastream.
Pan
elA
:Lo
git
mod
els
toex
plai
n5-
min
ute
pric
eju
mps
onA
mer
ican
mar
kets
Par
tI:
Pos
itiv
eju
mps
inP
RIC
E
Mar
ket
i:Br
azil
Can
ada
Mex
ico
U.S
.M
odel
:(1
)(2
)(1
)(2
)(1
)(2
)(1
)(2
)
OIB
PO
Si
0.34
-0.0
31.
860.
413.
388.
8510
.89
5.36
PR
IC
EP
OS
not
i0.
260.
040.
020.
020.
600.
370.
09-0
.05
OIB
PO
Sn
oti
0.28
0.05
0.41
1.49
-0.0
8-0
.16
0.31
0.30
PR
IC
EP
OS
Euro
pe/A
fri
ca2.
050.
101.
280.
75
OIB
PO
SE
uro
pe/A
fri
ca0.
091.
110.
430.
82
#O
bs.
97,1
0926
,446
279,
646
69,8
6413
7,76
631
,579
279,
291
69,7
78
Par
tII
:N
egat
ive
jum
psin
PR
IC
E
Mar
ket
i:Br
azil
Can
ada
Mex
ico
U.S
.M
odel
:(1
)(1
)(2
)(1
)(1
)(2
)
OIB
NE
Gi
0.23
0.83
2.35
4.07
1.97
0.63
PR
IC
EN
EG
not
i0.
281.
791.
57-0
.06
1.48
0.97
OIB
NE
Gn
oti
0.32
0.36
0.44
0.13
0.14
PR
IC
EN
EG
Euro
pe/A
fri
ca0.
310.
63
OIB
NE
GE
uro
pe/A
fri
ca0.
031.
84
#O
bs.
97,1
0927
9,64
669
,864
137,
766
279,
291
69,7
78
58
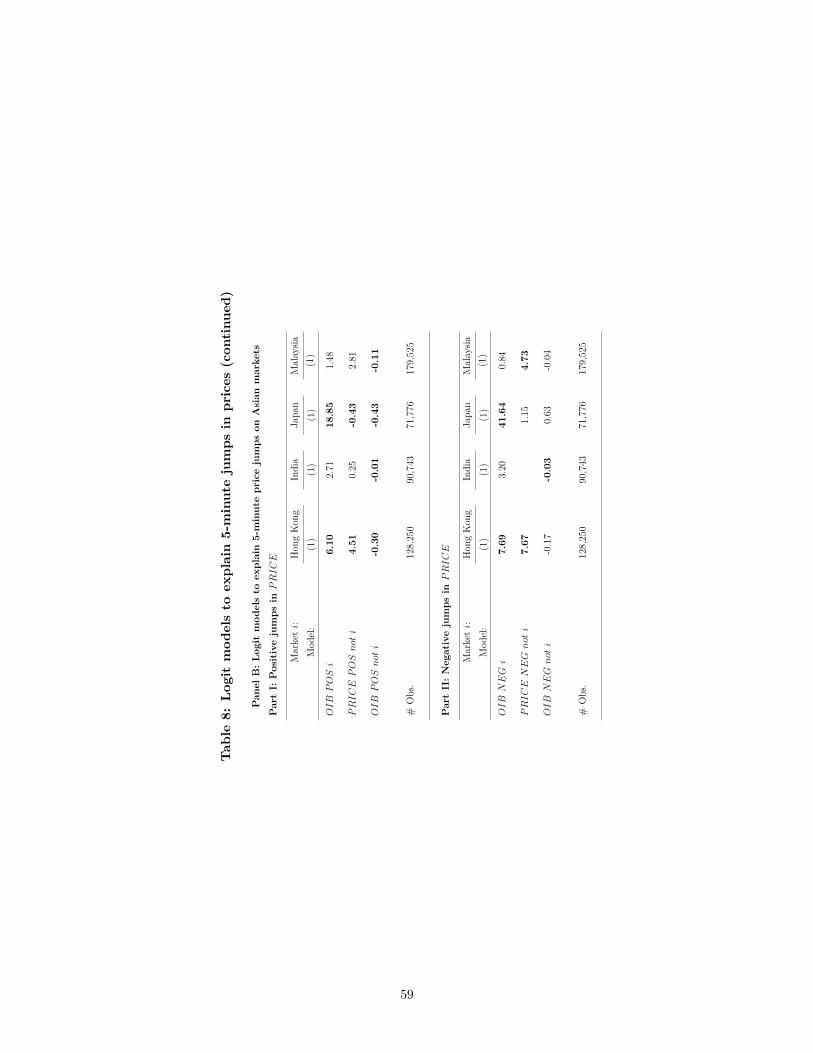
Tab
le8:
Logi
tm
odel
sto
expl
ain
5-m
inut
eju
mps
inpr
ices
(con
tinu
ed)
Pan
elB
:Lo
git
mod
els
toex
plai
n5-
min
ute
pric
eju
mps
onA
sian
mar
kets
Par
tI:
Pos
itiv
eju
mps
inP
RIC
E
Mar
ket
i:H
ong
Kon
gIn
dia
Japa
nM
alay
siaM
odel
:(1
)(1
)(1
)(1
)
OIB
PO
Si
6.10
2.71
18.8
51.
48
PR
IC
EP
OS
not
i4.
510.
25-0
.43
2.81
OIB
PO
Sn
oti
-0.3
0-0
.01
-0.4
3-0
.11
#O
bs.
128,
250
90,7
4371
,776
179,
525
Par
tII
:N
egat
ive
jum
psin
PR
IC
E
Mar
ket
i:H
ong
Kon
gIn
dia
Japa
nM
alay
siaM
odel
:(1
)(1
)(1
)(1
)
OIB
NE
Gi
7.69
3.20
41.6
40.
84
PR
IC
EN
EG
not
i7.
671.
154.
73
OIB
NE
Gn
oti
-0.1
7-0
.03
0.63
-0.0
4
#O
bs.
128,
250
90,7
4371
,776
179,
525
59
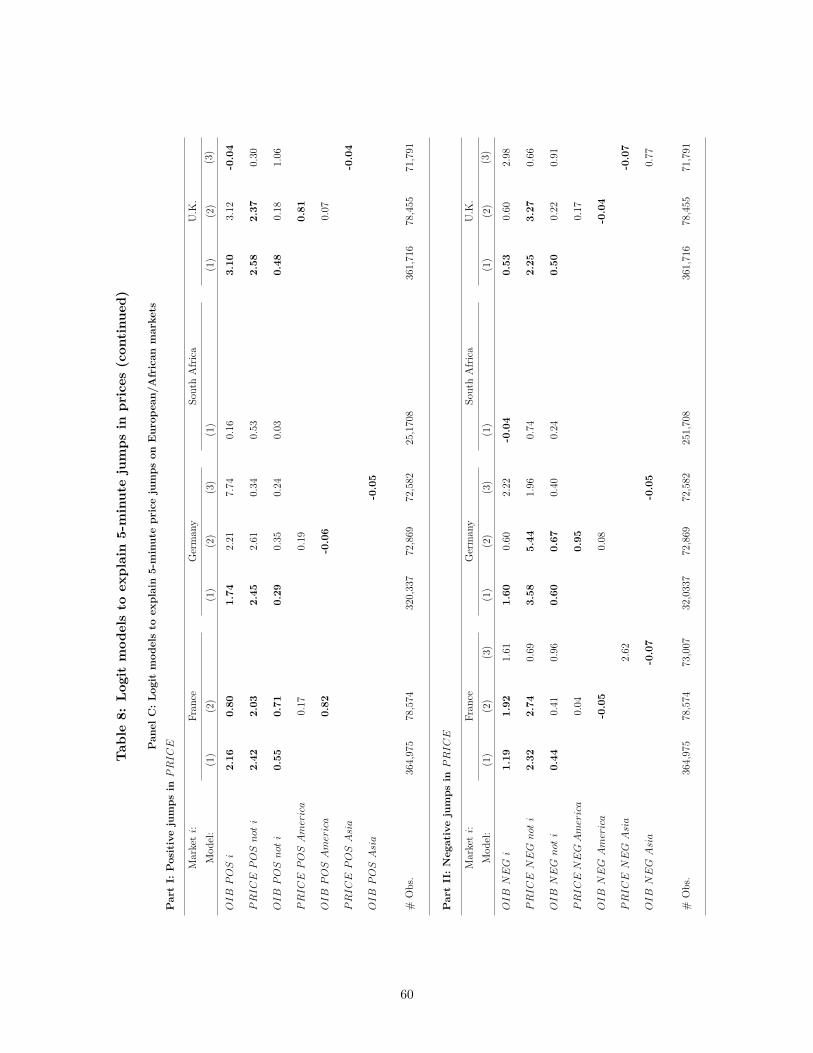
Tab
le8:
Logi
tm
odel
sto
expl
ain
5-m
inut
eju
mps
inpr
ices
(con
tinu
ed)
Pan
elC
:Lo
git
mod
els
toex
plai
n5-
min
ute
pric
eju
mps
onE
urop
ean/
Afr
ican
mar
kets
Par
tI:
Pos
itiv
eju
mps
inP
RIC
E
Mar
ket
i:Fr
ance
Ger
man
ySo
uth
Afri
caU
.K.
Mod
el:
(1)
(2)
(1)
(2)
(3)
(1)
(1)
(2)
(3)
OIB
PO
Si
2.16
0.80
1.74
2.21
7.74
0.16
3.10
3.12
-0.0
4
PR
IC
EP
OS
not
i2.
422.
032.
452.
610.
340.
532.
582.
370.
30
OIB
PO
Sn
oti
0.55
0.71
0.29
0.35
0.24
0.03
0.48
0.18
1.06
PR
IC
EP
OS
Am
eric
a0.
170.
190.
81
OIB
PO
SA
mer
ica
0.82
-0.0
60.
07
PR
IC
EP
OS
Asi
a-0
.04
OIB
PO
SA
sia
-0.0
5
#O
bs.
364,
975
78,5
7432
0,33
772
,869
72,5
8225
,170
836
1,71
678
,455
71,7
91
Par
tII
:N
egat
ive
jum
psin
PR
IC
E
Mar
ket
i:Fr
ance
Ger
man
ySo
uth
Afri
caU
.K.
Mod
el:
(1)
(2)
(3)
(1)
(2)
(3)
(1)
(1)
(2)
(3)
OIB
NE
Gi
1.19
1.92
1.61
1.60
0.60
2.22
-0.0
40.
530.
602.
98
PR
IC
EN
EG
not
i2.
322.
740.
693.
585.
441.
960.
742.
253.
270.
66
OIB
NE
Gn
oti
0.44
0.41
0.96
0.60
0.67
0.40
0.24
0.50
0.22
0.91
PR
IC
EN
EG
Am
eric
a0.
040.
950.
17
OIB
NE
GA
mer
ica
-0.0
50.
08-0
.04
PR
IC
EN
EG
Asi
a2.
62-0
.07
OIB
NE
GA
sia
-0.0
7-0
.05
0.77
#O
bs.
364,
975
78,5
7473
,007
32,0
337
72,8
6972
,582
251,
708
361,
716
78,4
5571
,791
60
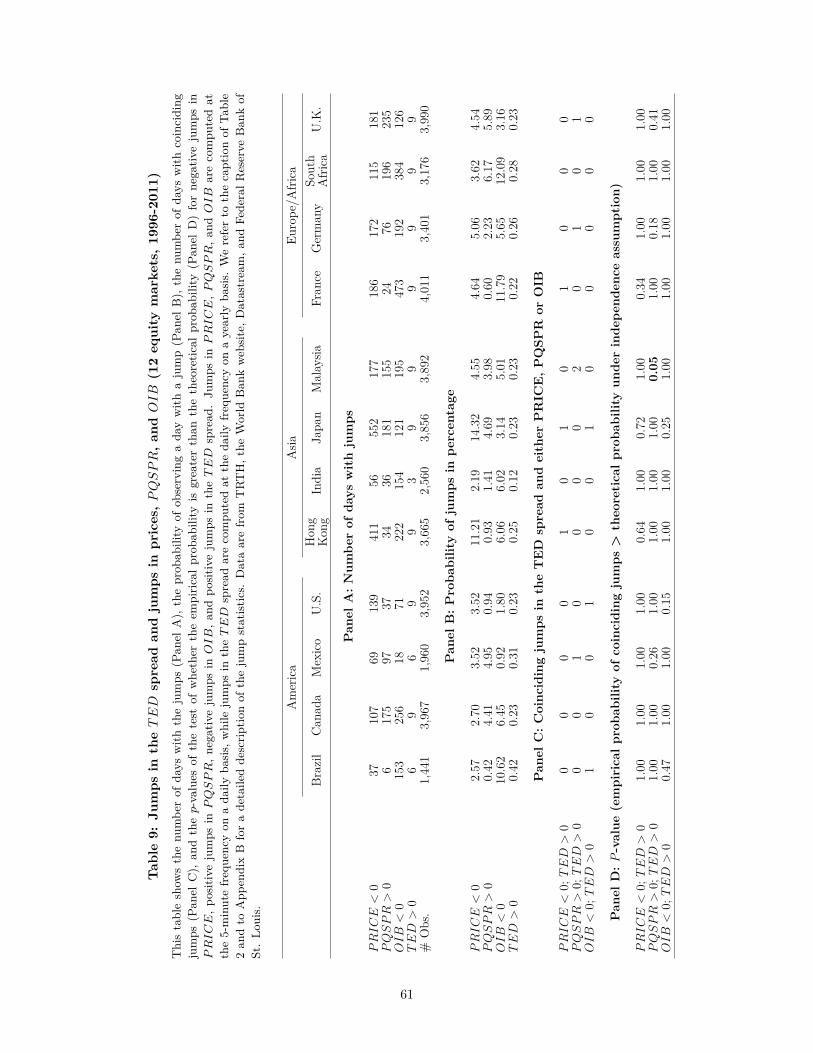
Tab
le9:
Jum
psin
the
TE
Dsp
read
and
jum
psin
pric
es,
PQ
SP
R,
and
OIB
(12
equi
tym
arke
ts,
1996
-201
1)Thistableshow
sthenu
mbe
rof
days
with
thejumps
(Pan
elA),
theprob
ability
ofob
servingada
ywith
ajump(P
anel
B),
thenu
mbe
rof
days
with
coinciding
jumps
(Pan
elC),
andthe
p-value
sof
thetest
ofwhe
ther
theem
piric
alprob
ability
isgreaterthan
thetheoretic
alprob
ability
(Pan
elD)forne
gativ
ejumps
inP
RIC
E,p
ositive
jumps
inP
QS
PR,n
egativejumps
inO
IB,a
ndpo
sitiv
ejumps
inthe
TE
Dspread
.Ju
mps
inP
RIC
E,P
QS
PR,a
ndO
IB
arecompu
tedat
the5-minutefreque
ncyon
ada
ilyba
sis,
while
jumps
inthe
TE
Dspread
arecompu
tedat
theda
ilyfreque
ncyon
ayearly
basis.
Wereferto
thecaptionof
Table
2an
dto
App
endixB
forade
taile
dde
scrip
tionof
thejumpstatistic
s.Dataarefrom
TRT
H,t
heWorld
Ban
kweb
site,D
atastream,a
ndFe
deralR
eserve
Ban
kof
St.Lo
uis.
Am
eric
aA
siaEu
rope
/Afri
ca
Braz
ilC
anad
aM
exic
oU
.S.
Hon
gK
ong
Indi
aJa
pan
Mal
aysia
Fran
ceG
erm
any
Sout
hA
frica
U.K
.
Pan
elA
:N
umbe
rof
days
wit
hju
mps
PR
IC
E<
037
107
6913
941
156
552
177
186
172
115
181
PQ
SP
R>
06
175
9737
3436
181
155
2476
196
235
OIB
<0
153
256
1871
222
154
121
195
473
192
384
126
TE
D>
06
96
99
39
99
99
9#
Obs
.1,
441
3,96
71,
960
3,95
23,
665
2,56
03,
856
3,89
24,
011
3,40
13,
176
3,99
0
Pan
elB
:P
roba
bilit
yof
jum
psin
perc
enta
ge
PR
IC
E<
02.
572.
703.
523.
5211
.21
2.19
14.3
24.
554.
645.
063.
624.
54P
QS
PR
>0
0.42
4.41
4.95
0.94
0.93
1.41
4.69
3.98
0.60
2.23
6.17
5.89
OIB
<0
10.6
26.
450.
921.
806.
066.
023.
145.
0111
.79
5.65
12.0
93.
16T
ED
>0
0.42
0.23
0.31
0.23
0.25
0.12
0.23
0.23
0.22
0.26
0.28
0.23
Pan
elC
:C
oinc
idin
gju
mps
inth
eT
ED
spre
adan
dei
ther
PR
ICE
,P
QSP
Ror
OIB
PR
IC
E<
0;T
ED
>0
00
00
10
10
10
00
PQ
SP
R>
0;T
ED
>0
00
10
00
02
01
01
OIB
<0;
TE
D>
01
00
10
01
00
00
0
Pan
elD
:P
-val
ue(e
mpi
rica
lpr
obab
ility
ofco
inci
ding
jum
ps>
theo
reti
cal
prob
abili
tyun
der
inde
pend
ence
assu
mpt
ion)
PR
IC
E<
0;T
ED
>0
1.00
1.00
1.00
1.00
0.64
1.00
0.72
1.00
0.34
1.00
1.00
1.00
PQ
SP
R>
0;T
ED
>0
1.00
1.00
0.26
1.00
1.00
1.00
1.00
0.05
1.00
0.18
1.00
0.41
OIB
<0;
TE
D>
00.
471.
001.
000.
151.
001.
000.
251.
001.
001.
001.
001.
00
61
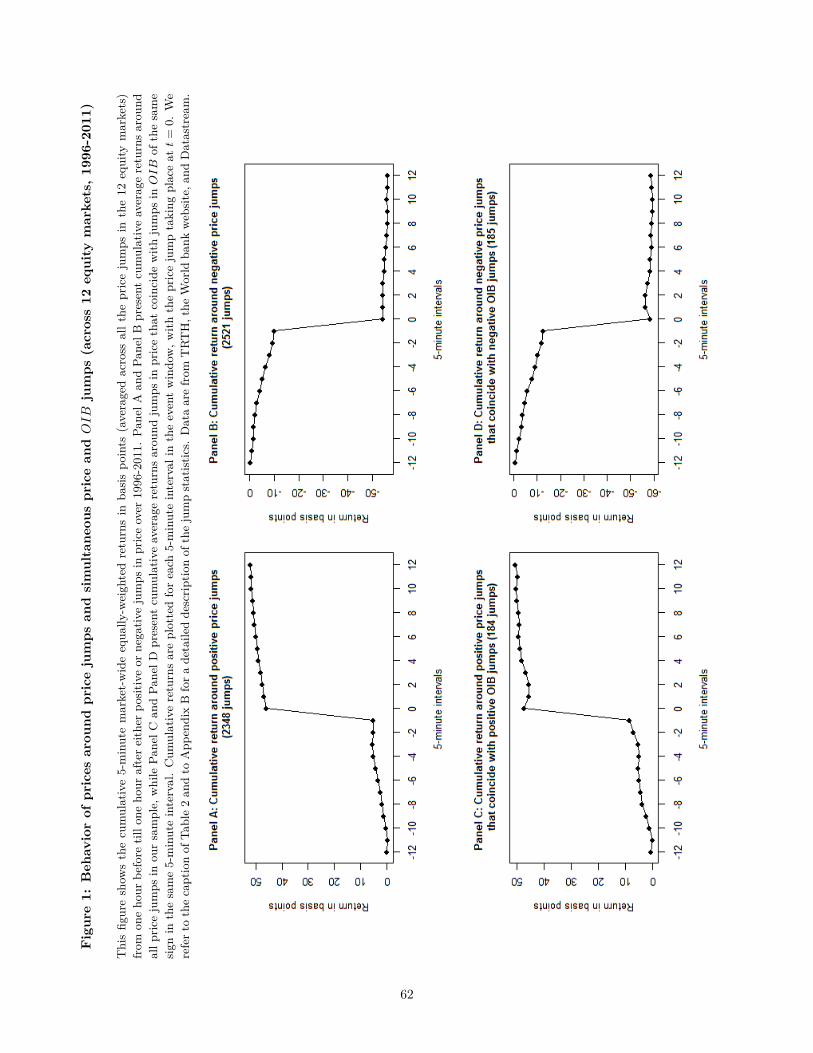
Fig
ure
1:B
ehav
ior
ofpr
ices
arou
ndpr
ice
jum
psan
dsi
mul
tane
ous
pric
ean
dO
IB
jum
ps(a
cros
s12
equi
tym
arke
ts,
1996
-201
1)
Thisfig
ureshow
sthecumulative5-minutemarket-wideequa
lly-w
eigh
tedreturnsin
basispo
ints
(averagedacross
allt
hepricejumps
inthe12
equity
markets)
from
oneho
urbe
fore
tillo
neho
uraftereither
positiv
eor
negativ
ejumps
inpriceover
1996-2011.
Pane
lAan
dPa
nelB
presentcumulativeaveragereturnsarou
ndallp
ricejumps
inou
rsample,
while
PanelC
andPa
nelD
presentcumulativeaveragereturnsarou
ndjumps
inpricethat
coincide
with
jumps
inO
IB
ofthesame
sign
inthesame5-minuteinterval.Cum
ulativereturnsareplottedforeach
5-minuteinterval
intheeventwindo
w,w
iththepricejumptaking
placeat
t=
0.We
referto
thecaptionof
Table2an
dto
App
endixBforade
taile
dde
scrip
tionof
thejumpstatistic
s.Dataarefrom
TRT
H,the
World
bank
web
site,a
ndDatastream.
62
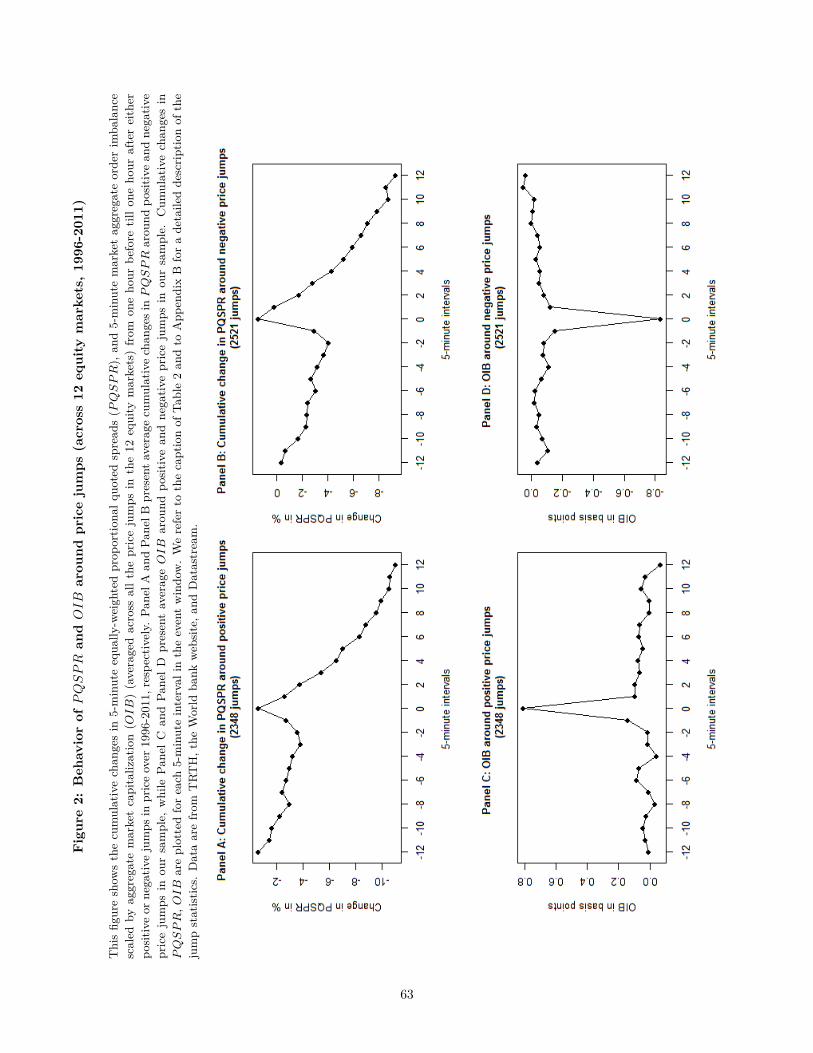
Fig
ure
2:B
ehav
ior
ofP
QS
PR
and
OIB
arou
ndpr
ice
jum
ps(a
cros
s12
equi
tym
arke
ts,
1996
-201
1)
Thisfig
ureshow
sthecumulativechan
gesin
5-minuteequa
lly-w
eigh
tedprop
ortio
nalq
uotedspread
s(P
QS
PR),
and5-minutemarketaggregateorde
rim
balance
scaled
byaggregatemarketcapitalization(O
IB)(averagedacross
allt
hepricejumps
inthe12
equity
markets)from
oneho
urbe
fore
tillo
neho
uraftereither
positiv
eor
negativ
ejumps
inpriceover
1996-2011,
respectiv
ely.
Pane
lAan
dPa
nelB
presentaveragecumulativechan
gesin
PQ
SP
Rarou
ndpo
sitiv
ean
dne
gativ
epricejumps
inou
rsample,
while
Pane
lC
andPa
nelD
presentaverage
OIB
arou
ndpo
sitiv
ean
dne
gativ
epricejumps
inou
rsample.
Cum
ulativechan
gesin
PQ
SP
R,O
IB
areplottedforeach
5-minuteinterval
intheeventwindo
w.Wereferto
thecaptionof
Table2an
dto
App
endixB
forade
taile
dde
scrip
tionof
the
jumpstatistic
s.Dataarefrom
TRT
H,t
heWorld
bank
web
site,a
ndDatastream.
63