Embed Size (px)
Citation preview
The Economic Consequences of the U.S. Supreme Court’s Morrison v. National Australia Bank Decision for Foreign Stocks Cross-listed in U.S.
Markets
by
Louis Gagnon and G. Andrew Karolyi*
Abstract
We show that the U.S. Supreme Court’s ruling in the case of Morrison v. National Australia Bank in June of 2010 was associated with a statistically significant 37 basis point increase on the day in the price deviation between the U.S. cross-listed shares trading in U.S. markets and the underlying home market shares. Our sample includes 1,000 foreign firms from 42 different countries and comprises those cross-listed on the major U.S. exchanges (Nasdaq, New York Stock Exchange) in direct form and as American Depositary Receipts (ADRs), as well as those trading on over-the-counter (OTC) markets in sponsored and unsponsored form. The price deviations between the cross-listed and underlying home market shares widen more dramatically for those companies with a lower presence in the U.S. as measured by the fraction of global trading that takes place in U.S. markets. We interpret this evidence in the context of existing theories about why firms choose to secondarily list their shares overseas and particularly in U.S. markets. First Version: November 14, 2011. This Version: November 14, 2011. Key words: Multi-market trading; Cross-listed stocks; Regulatory change. JEL Classification Codes: F30, G32, G15. * Gagnon is Professor of Finance and Distinguished Faculty Fellow of Finance of the School of Business, Queen’s University, and Karolyi is Professor of Finance and Economics and Alumni Chair in Asset Management at the Johnson Graduate School of Management, Cornell University. We are grateful for financial support from the Social Sciences and Humanities Research Council of Canada, the D.I. McLeod Fund at Queen’s University and the Alumni Professorship in Asset Management at Cornell University and for useful comments from and discussions with Thomas Dubbs at Labaton Sucharow. We are also grateful for the assistance of Rui Duan and Simon Cai. All remaining errors are our own. Address correspondence to: G. Andrew Karolyi, Johnson Graduate School of Management, Cornell University, Ithaca, NY 14853-6201, U.S.A. Phone: (607) 255-2153, Fax:,(607) 254-4590, E-mail: [email protected]
1
1. Introduction
On June 24, 2010, the United States Supreme Court issued a decision of great importance to
global financial markets. They ruled that the main fraud-related provisions of U.S. securities laws, namely
Section 10(b) of the Securities Exchange Act of 1934 and specifically its Rule 10b-5, apply only to
transactions in securities that take place in the United States or to transactions in securities listed on a U.S.
securities exchange. The Court overturned a Federal Appeals Court ruling arguing that the key provisions
of Rule 10b-5 do not have an explicit statement about extraterritorial effects. The specific case in
question, Morrison v. National Australia Bank (hereafter “Morrison”), involved plaintiffs who were
Australian residents and who had alleged violations of Rule 10b-5 based on purchases of ordinary shares
of National Australia Bank (“NAB”) stock in Australia.1 Plaintiffs alleged misstatements regarding a
failed wholly-owned U.S.-based subsidiary mortgage business (HomeSide Lending, Inc. in Jacksonville,
Florida). An important fact was that NAB’s American Depositary Receipts (ADRs) were listed and traded
on the New York Stock Exchange. The Court did mention that NAB had listed ADRs and acknowledged
that NAB was a reporting company under the Securities Exchange Act of 1934, which may have led
investors to believe that the company was subject to U.S. anti-fraud rules. But a salient fact for the Court
decision was that the transactions in the NAB shares took place abroad and in the ordinary shares, not in
the ADRs trading in U.S. markets.2
Why this Court decision is important for global financial markets is that ADRs are generally
regarded by investors as substantially equivalent to a purchase of the underlying ordinary shares. Indeed,
there is a substantial body of evidence that shows how economically small the price deviations are
between U.S. cross-listed shares and their home-market counterparts.3 Given the Court’s decision to limit
1 See Robert Morrison, et al., Petitioners, v. National Australia Bank Ltd., et al., Supreme Court of the United States, No. 08-1191, decided June 24, 2010. Justice Antonin Scalia delivered the opinion of the Court. 2 From Justice Scalia’s statement (p. 5, No. 08-1191): “It is a ‘longstanding principle of American law ‘that legislation of Congress, unless a contrary intent appears, is meant to apply only within the territorial jurisdiction of the United States.’” 3 For example, Gagnon and Karolyi (2010) compare the intraday prices and quotes of American Depositary Receipts (ADRs) and other types of cross-listed shares in U.S. markets with synchronous prices of their home-market shares on a currency-adjusted basis for a sample of 506 U.S. cross-listed stocks from 35 different countries. Deviations
2
extraterritorial application of the statute, an interesting question is whether market participants reacted in
a way that reflects that they care about how the laws of securities fraud are differentially enforced for
internationally cross-listed securities.4
The goal of this study is to conduct just such a test. We examine whether and how the price
deviations between the ADRs and other cross-listed shares and their respective home market shares (on a
currency- and bundling-ratio adjusted basis) changed on key dates around the time of the Supreme
Court’s decision. Our sample includes 1,000 foreign firms from 42 different countries and comprises
those cross-listed on the major U.S. exchanges (Nasdaq, New York Stock Exchange) in direct form and as
American Depositary Receipts (ADRs), as well as those trading on over-the-counter (OTC) markets in
sponsored and unsponsored form. We find that the price deviations widen by a statistically significant
and economically large 37 basis points, on average. The price deviations arise from a 44 basis point
increase in the prices of the ADRs and a statistically insignificant increase of only 7 basis points in the
prices of the home-market shares.
We test whether the price deviations widen any differently for direct listings compared to ADR
listings, for sponsored compared to unsponsored ADR programs, for companies domiciled in tax havens,
and for those cross-listed stocks trading on the OTC market compared to major exchanges. Differences
are usually statistically insignificant and always economically small. What we do show, however, is that
the price deviations between the cross-listed and underlying home market shares widen more dramatically
for those companies with a lower presence in the U.S. as measured by the fraction of global trading that
from price parity average an economically small 4.9 basis points, but they are volatile and can reach large extremes. Price parity deviations and their daily changes are positively related to proxies for holding costs that can impede arbitrage, even after controlling for transactions costs and foreign investment restrictions. Other important studies include Maldonado and Saunders (1983), Kato, Linn, and Schallheim (1991), Wahab, Lashgari, and Cohn (1992), Park and Tavakkol (1994), Miller and Morey (1996), and Blouin, Hail, and Yetman (2009). 4 The Morrison decision was expected to decide the legitimacy of so-called “foreign-cubed” cases (that is, those involving non-U.S. foreign defendants involving purchases of non-U.S. foreign securities in transactions abroad on foreign markets). However, within one week of the decision, the U.S. Congress passed the Wall Street Reform and Consumer Protection Act of 2010 which directed the Securities and Exchange Commission to conduct a study to determine the extent to which private rights of action should be extended to cover transnational securities fraud. See www.sec.gov and Notice 34-63174 dated October 25, 2010 requesting comments.
3
takes place in U.S. markets. This particular finding is robust to the inclusion of various controls for
different firm-specific and country-level attributes.
Our findings on the Morrison decision contribute in an important way to the ongoing debate over
the beneficial “bonding” role that U.S. markets play. Attributed to Coffee (1999, 2002) and Stulz (1999),
the so-called bonding hypothesis argues that a secondary listing of a firm’s stock on an exchange, like in
the U.S., that imposes higher legal and regulatory costs than the firm’s primary exchange can benefit the
firm because that action “bonds” its managers and controlling shareholders not to take excessive private
benefits. This bonding eases an important source of potential agency conflict with the firm’s public
shareholders. After all, firms can raise external financing only to the extent that they can commit to return
this capital to investors and not extract it for the controlling shareholders’ or managers’ personal uses.
Coffee (2002) emphasizes the “legal bonding” mechanisms associated with cross-listings in the U.S. that
can impose limits on these private benefits, such as the enforcement powers of a better-resourced
securities market regulator in the Securities and Exchange Commission (SEC), investors’ ability to
exercise effective and low-cost legal actions not available in the home market, and the commitment to
furnish fuller financial information in response to SEC requirements. Stulz (1999) emphasizes the role of
“reputational bonding” through financial market intermediaries in U.S. markets, such as underwriters,
auditors, rating agencies, securities analysts and the exchanges themselves, that provide additional
scrutiny unavailable in the home market.
A wide variety of studies have furnished empirical evidence in support of the bonding hypothesis
in its “legal” or “reputational” forms, including, most notably, Reese and Weisbach (2002), Doidge,
Karolyi, and Stulz (2004, 2009, 2010), Doidge (2004), Hail and Leuz (2009), Lel and Miller (2008), and
Doidge, Karolyi, Lins, Miller, and Stulz (2009). But, at the same time, there have been many critics of
bonding, including, among others, Licht (1998, 2000, 2001, and 2003), Pinegar and Ravichandran (2003),
Siegel (2005), Gozzi, Levine, and Schmukler (2008), King and Segal (2009), Litvak (2007a, 2007b,
2009), and Sarkissian and Schill (2009, 2011). The counterarguments cover issues from empirical
methodology to firm sample composition, and from the permanence of the economic benefits of bonding
4
to interpretations related to competing hypotheses. Karolyi (2011) provides a survey of all the evidence
for and against the bonding hypothesis. 5 What all studies agree is that the debate is important for
understanding the current and future competitiveness of U.S. capital markets as a magnet for secondary
listings from around the world.
We interpret our findings in this study as further empirical evidence in favor of the bonding
hypothesis. That the price deviations between the ADRs and other cross-listed shares widened relative to
the home market shares around the days of the Supreme Court decision reveals that market participants
revalued the newly differentiated application of the anti-fraud provisions of Rule 10b-5 to investors in the
ADRs and in the home-market shares. The evidence is consistent with positive economic value associated
with U.S. civil liability cause of action for foreign firms.6
Ours is not the first study of the Supreme Court’s Morrison decision. Licht, Li, and Siegel
(hereafter LLS, 2011) uncover a positive, statistically-significant aggregate abnormal return of 74 basis
points in both the U.S. and home markets for cross-listed firms around the date of the oral arguments of
the case (March 26 and 29, 2010), and a positive, but statistically insignificant aggregate abnormal return
of 39 basis points in the U.S. and 26 basis points in the home-market around the dates of the decision
(June 23, 24, and 25, 2010). They also find similarly positive reactions for OTC listings, for direct listings
(in addition to ADRs), and even for foreign firms incorporated in tax havens. Our focus is different from
LLS in that our sample includes only firms for which the U.S. listed and home-market shares have been
carefully matched so that both are viably trading. This is an important distinction because our outcome
measure of interest is the price deviations between the simultaneously-traded shares, and not the overall
returns to them. We do, however, focus on LLS’ same calendar event dates. LLS further show that the
positive share price reactions are larger in magnitude for those stocks with a greater fraction of non-U.S.
5 Other earlier survey studies include McConnell, Dybevik, Haushalter, and Lie (1995), Karolyi (1998, 2006), and Benos and Weisbach (2004). Gagnon and Karolyi (2011) review the cross-listing literature that focuses on multi-market trading, liquidity, and arbitrage. 6 A new working paper by Gande and Miller (2011) shows how economically significant these legal penalties are in examining 269 securities class-action lawsuits filed against foreign firms from 1996 to 2008. They uncovered significant negative stock price reactions of -6.21% around the filing dates aggregating to a total value loss of $73 billion.
5
ownership (measured by the fraction of the company’s shares not outstanding in the form of ADRs),
which they argue is evidence against the legal bonding hypothesis. After all, by denying a U.S. civil
liability cause of action from foreign securities transactions, they argue Morrison should have had a
negative impact on the shares and one that is greater for those with a larger non-U.S. ownership base.
They argue, by contrast, that the positive reactions they uncovered are consistent with the idea that the
Morrison decision relieved issuers from unnecessary and costly burdens of legal actions.
In the next section, we outline our sample of U.S. cross-listed firms. Section 3 presents the overall
evidence on the price deviations in response to the Supreme Court decision and describes the results of
our cross-sectional tests. Conclusions follow in Section 4.
2. The sample of U.S. cross-listed firms
We assemble a comprehensive list of foreign stocks cross-listed on U.S. exchanges in the form of
American Depositary Receipts (ADRs) or in the form of ordinary shares, such as direct listings from
Canada and Israel. This list includes, as a subset, all the home-U.S. pairs from the Securities and
Exchange Commission’s list of Foreign Private Issuers (FPI) for which data is available in Thomson
Reuters’ Datastream database.7
Our sample construction begins with the June 1, 2011 edition of BNY Mellon’s DR Directory,
which provides information about the 3,394 Depositary Receipt programs that were outstanding at the
time along with the underlying stocks’ respective International Securities Identification Numbers
(ISINs).8 Given that our focus is on cross-listed common stocks listed on U.S. trading venues, we exclude
non-U.S. DR programs (368), Rule 144a (436) and Regulation S (632) programs, as well as preferred
shares (40). We exclude pairs for which the underlying stock’s ISIN was not included in the Directory,
thereby eliminating a further 78 pairs from the sample. The remaining 2,186 pairs were then matched to
7 See “Foreign Companies Registered and Reporting with the U.S. Securities and Exchange Commission, December 31, 2009” available on the SEC website at www.sec.gov. 8 BNY Mellon’s DR Directory is available at http://www.adrbnymellon.com. The DR Directory, which is accessible via the Investor link on this web site, is an interactive DR database with comprehensive profiles of individual DR programs. Note that this list included global registered shares (GRSs) and New York registered shares.
6
Thomson Reuter’s Datastream and Worldscope databases, yielding a total of 1,338 pairs with both
security-level and firm-level (i.e., accounting) data available on Datastream and Worldscope.
The next step in our sampling process consists of matching our preliminary sample of ADRs, by
hand, with the ADRs listed in the SEC’s 2009 FPI list. This list is compiled annually by the SEC and is
posted to its web site at the end of each year. According to the SEC, 965 firms qualified as foreign private
issuers at the end of 2009. Among these issuers, we were able to identify 485 valid home-ADR pairs in
Datastream. Of this subset, 467 were already included in our preliminary sample. The other 18 pairs were
absent from our preliminary sample because they had been delisted at some point between the publication
date of the FPI 2009 list and that of the DR Directory (June 1, 2011). In order to include all ‘feasible’
stocks from the SEC’s 2009 FPI list, we added these 18 pairs to our ADR list, bringing the number of
ADRs included to 1,356.
Next, we extract direct listings from Canada and Israel from Datastream, yielding 344 valid pairs
trading on these countries’ main exchanges (TSX and Tel Aviv), all of which are also present in the
SEC’s FPI list. In order to include all feasible pairs from the FPI list, we add to our sample the remaining
55 valid pairs from Canada that are listed on the TSX Venture Exchange. Finally, we end up with a
sample consisting of 1,755 pairs (1,356 ADRs and 399 direct listings), which includes all pairs from the
FPI 2009 list that are covered in Datastream.
Our sample period starts on January 1, 2008, and ends on August 30, 2010. For each sample firm,
we extract from Thomson Reuters’ Datastream daily closing unadjusted price, return index, and trading
volume series for the underlying stock at home and for its cross-listed counterpart in the U.S. We use
home market price and return series that are translated into U.S. dollars by Datastream at the end of each
trading day using the appropriate exchange rates. Each ADR represents a specific number of shares,
referred to as bundling or ADR ratio, that are immobilized in the home market by the depositary bank’s
custodian. On each day, we calculate the price deviation between the ADR and its underlying stock by
subtracting the home stock’s bundling-ratio-adjusted U.S. dollar-denominated closing price from the
ADR’s closing price. In certain cases, we supplement the bundling ratios supplied by BNY Mellon and
7
the other depositary banks with other sources, including Datastream, company annual reports, and
company web sites. Bundling ratios occasionally change, which we track carefully in Datastream and
adjust the price deviations accordingly. Bundling ratios for direct listings are implicitly equal to one since
the same share trades in the U.S. market as in the home market.
Since our experiment consists of an event study focusing on price deviations arising between
home stocks and their U.S. cross-listed counterparts, we only include pairs that satisfy a number of
validity screens. First, following Gagnon and Karolyi (2010), we only retain firm-days during which both
members of a particular pair had non-zero trading volume. Non-trading days for either stock are
considered to be unreliable for the purpose of measuring price deviations due to concerns about stale
prices. Second, similar to LLS (2011), in order to be represented in our final sample, a pair needs to have
(a) at least 60 valid return observations during our estimation period, which extends from January 1,
2008, to December 31, 2009, and (b) at least one valid return day during one of the five key Supreme
Court decision dates spanning our two event periods (March 26 and 29 as well as June 23, 24, and 25, all
in 2010). We provide further details concerning our empirical strategy in the next section. After imposing
these two validity screens, our final sample consists of 1,000 pairs from 42 countries, incorporated in 48
separate jurisdictions, and spanning 39 industries as defined by Thomson Reuters.9 Of these 1,000 pairs,
475 are included in the SEC’s 2009 FPI list and 525 are not.
For our event study analysis, we need to employ stock index returns in order to benchmark and
compute abnormal returns on our sample stocks. We use Standard & Poor’s 500 index as our benchmark
for the U.S. market and the Morgan Stanley Capital International (MSCI) All-Capital World Index
excluding the U.S. index as our world market benchmark. We obtain these series from Datastream.
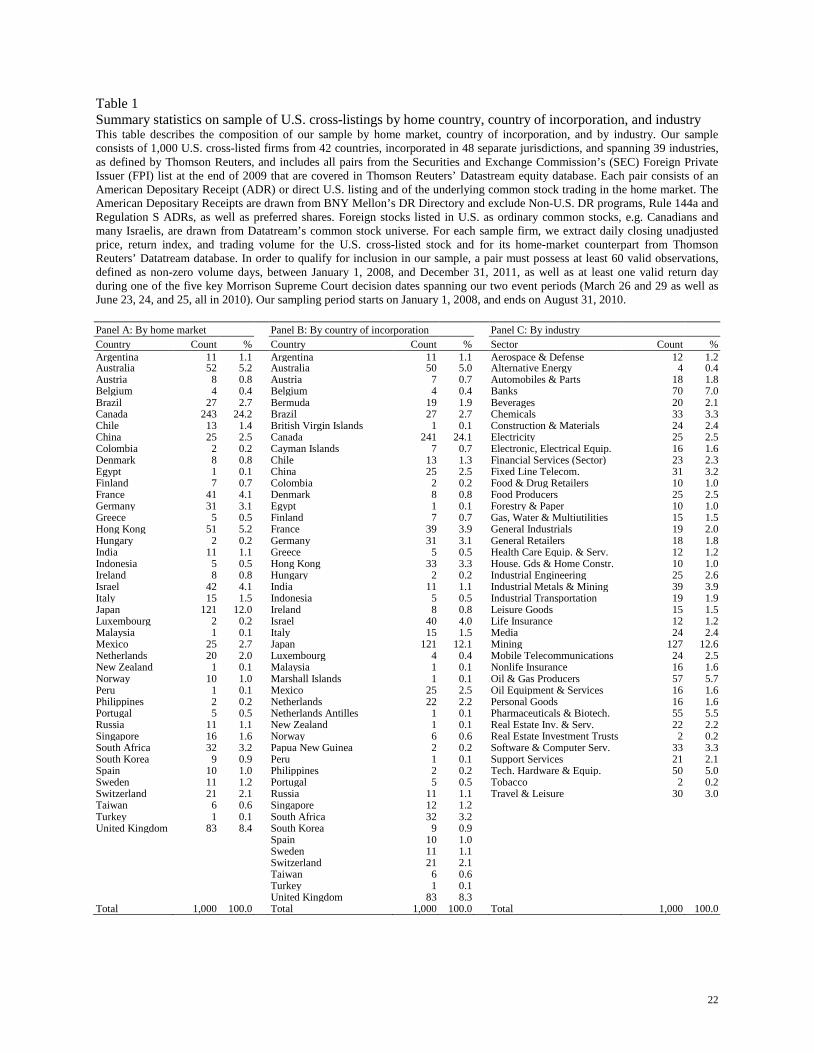
We report summary statistics on the firms included in our sample in Table 1. In Panel A, we
observe that Canada contributes the largest number of pairs represented in our sample, with 243 firms,
followed by Japan (121), the United Kingdom (83), Australia (52), Hong Kong (51), France (41), and
9 The jurisdictions of incorporation are based on the Securities and Exchange Commission’s Foreign Private Issuer list, as published at the end of 2009, from Capital IQ, individual company annual reports, and company web sites.
8
Israel (42). Panel B reveals that a fair number of our sample firms are incorporated in jurisdictions other
than their home market, usually in tax haven countries such as Bermuda, where 19 of our sample firms
are incorporated, the British Virgin Islands (1), Cayman Islands (7), Marshall Islands (1), Netherland
Antilles (1), and Papua New Guinea (2). Panel C reveals that Mining is the largest industry group
represented in our sample with 127 firms, 99 of which are based in Canada. Banks are the second largest
industry group represented in our sample, with 70 pairs, of which 6 are based in Japan, 5 in Canada, and
the rest widely distributed across other sample countries. Oil & Gas Producers is the next largest industry
groups with 57 firms, again mostly from Canada where 27 firms are domiciled. The Pharmaceuticals &
Biotechnology sector is next with 55 firms, followed by Technology, Hardware, & Equipment (50), and
Industrial Metals & Mining (39).
3. Results
The main goal of our study is to test whether the Supreme Court’s decision to limit extraterritorial
application of the anti-fraud statute led market participants to revalue the U.S. cross-listed shares relative
to the home market shares in a way that reflects their newly differentiated legal treatment. As a result, we
compute the price deviations between the cross-listed and home market shares and their changes at the
daily frequency, which we refer to as daily return differentials, around the key dates for the Supreme
Court’s Morrison decision. If the Supreme Court’s decision was interpreted by the market as limiting the
anti-fraud provision of the Securities Act (specifically, the 10b-5 provision) to the ADRs and other cross-
listed shares trading on U.S. markets and if this newly binding constraint was value relevant, then we
would expect to see the price of the cross-listed shares appreciate relative to that of its equivalent home-
market shares, thereby widening the return differentials between them. If either the Court’s decision as
not interpreted as limiting or if the change in these limitations was perceived to be value irrelevant, we
would expect to see no reaction and the return differentials would be zero.
We investigate two supplementary hypotheses. First, we evaluate whether the market’s reaction
to the Court’s decision was concentrated on only certain subsets of U.S. cross-listed shares for a variety of
9
reasons. We examine, for example, whether the return differentials widened around the Court’s decision
for direct listings in a way that is different for ADRs to see if the market might have perceived the Court’s
decision to limit the anti-fraud provisions differently for securities traded through a more complex,
intermediated depositary receipt facility. Similar experiments are conducted between sponsored versus
unsponsored ADRs, the latter being an ADR created by the depositary bank without consultation of the
firm, between exchange-listed versus OTC-traded firms, and between those incorporated in taxable
jurisdictions versus tax haven countries. Second, we test whether the market’s reaction around the Court’s
decision was concentrated in those stocks that are more or less actively traded in U.S. markets. If the
court’s decisions were interpreted as limiting the anti-fraud provisions and if the binding constraints were
perceived to be value relevant, those cross-listed stocks with a lower fraction of their global trading that
takes place in the U.S. markets should experience an economically larger value reaction. Investors in
these stocks, after all, would be more vulnerable to the exclusions introduced by the Court’s decision.
We follow LLS (2011) in identifying the key dates of the Morrison decision. The oral arguments
before the Court took place on the morning of March 29, 2010 and the publication of the Court’s decision
took place on June 24, 2010. In order to fully capture the market’s reaction, we also include March 26,
2010, like LLS, in the event window (together we refer to both dates as “Event 1”) and we add June 23
and 25, 2010, like LLS, in the event window (together, in turn, we refer to these three calendar dates as
“Event 2”).10
A. Experiment 1 – Market reactions around the Supreme Court Decision
Did the return differentials between the U.S. cross-listed and home market shares widen around
the key dates related to the Morrison decision? To assess the effect of the Morrison decision, we construct
10 Within 24 hours of the June 24, 2010 decision, a Congressional conference committee had approved the final version of the Wall Street Reform and Consumer Protection Act of 2010 (“Dodd-Frank Act”). In the last round of the committee’s deliberations, two sections were added to the statute (Sections 929P, 929Y) that instructed the SEC to conduct a study on the desirability of using the new “transactions” test of the Court’s decision. The transactions test implies that civil liability applies only to transactions in securities in the U.S. This test superseded two previously established tests: the so-called “conduct test” which requires at least some of the fraudulent conduct to take place in the U.S. and the so-called “effects test” which requires at least some fraudulent conduct outside the U.S. to affect domestic securities markets. For more details on these distinctions, see www.sec.gov and Notice 34-63174 dated October 25, 2010 requesting comments.
10
separately equally-weighted and value-weighted portfolios of the daily home-market share returns (all
U.S. dollar-denominated), the daily equivalent cross-listed share returns, and the daily return differentials
between the cross-listed shares and the home market shares. The return differential is always defined as
the difference between the cross-listed share return on the day and the equivalent home-market share
return and both are computed from the closing share prices in the respective markets.11 The portfolio
approach allows us to estimate the overall impact of the Supreme Court decision our sample firms while
accounting for cross-correlations in the firms’ stock returns (and return differentials) when we compute t-
statistics, a critical issue when analyzing the impact of common events, like regulatory changes, across
firms (see Schwert (1981), Schipper and Thompson (1983), and Binder (1985)). To estimate the abnormal
stock-price reactions for the Supreme Court event dates, we specify and estimate by ordinary least squares
(OLS) the following regression over the period from January 1, 2010 to August 30, 2010:
RHp,t = α + βUS × RUS
m,t + βW × RWm,t + δ × Supreme Court dummy + εp,t, (1a)
where RHp,t is the daily U.S. dollar-denominated return on the (equally- or value-weighted) portfolio of
home-market shares for our sample of cross-listed stocks, RUSm.t is the return on the U.S. market portfolio
which is the S&P 500 index, RWm.t is the return on the world market portfolio which is the MSCI All-
Capital World Index excluding the U.S., and Supreme Court dummy equals one for our list of event dates
(March 26 and 29, 2010, the combined “Event 1,” June 23, 24, and 25, 2010, and the combined “Event
2”). We also specify and estimate in the same the following two regressions:
RUSp,t = α + βUS × RUS
m,t + βW × RWm,t + δ × Supreme Court dummy + εp,t, (1b)
RDiffp,t = α + βUS × RUS
m,t + βW × RWm,t + δ × Supreme Court dummy + εp,t, (1c)
where RUSp,t is the daily (equally- or value-weighted) portfolio return of U.S. cross-listed shares for our
sample of cross-listed stocks, and where RDiffp,t is the daily (equally- or value-weighted) portfolio return of
11 This, of course, induces a bias in the return differentials due to non-synchronous market trading hours around the world. In preliminary experiments, we introduced multi-day leading and lagging U.S. and world market index returns as controls in our regression tests to account for cross-autocorrelations among the return differentials due to non-synchronous trading hours. These additional tests did not change our basic results.
11
the return differentials between the U.S. cross-listed shares and the equivalent home-market shares for our
sample of cross-listed stocks.
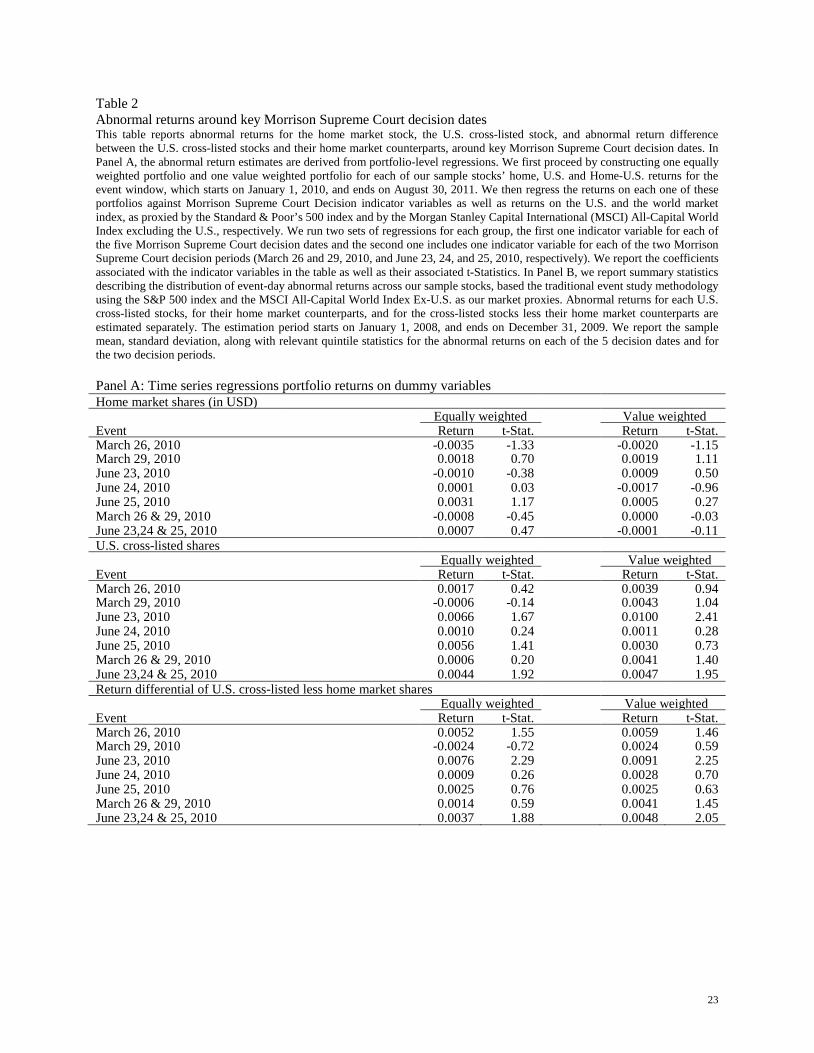
Panel A of Table 2 presents the coefficient estimates on the Supreme Court decision dates for
each of the portfolios with the associated t-statistics. For the portfolio of U.S. dollar-denominated home
market share returns, we find that none of the dummy variable coefficients are statistically different from
zero, both for the equally- and value-weighted portfolios. For the equally-weighted portfolio of U.S.
cross-listed share returns, we do uncover a statistically significant 66 basis point share price reaction on
June 23, 2010, the day before the Supreme Court decision was made public. When we examine Event 2,
which also includes June 24 and 25, the return is only 44 basis points in magnitude and statistically
reliably different from zero. None of the other dates are significant. Interestingly, the value-weighted
portfolio’s reactions are larger in magnitude (100 basis point on June 23, 47 basis points for Event 2) and
also reliably different from zero. It is useful to compare our findings to those of LLS (2011) though they
include a different sample of firms and employ a very different methodology. They uncover a large
positive share price reaction in both the cross-listed share and home market returns of 67 and 68 basis
points, respectively, on March 29, the date of the oral arguments in the case. Further, they uncover
another large positive reaction on June 25, the day after the Supreme Court decision, of 56 and 52 basis
points for the cross-listed and home market share returns. The average reaction they find for June 23, the
event date with the most pronounced reaction in our findings, is actually negative (-19 and -23 basis
points), though insignificant.
The return differentials at the bottom of the panel reveal the most interesting finding. The price
deviations widen between the cross-listed and home-market shares on a currency- and bundling-ratio-
adjusted basis by 76 basis points on June 23 for the equally-weighted portfolio and by an even larger 91
basis points for the value-weighted portfolio. The equivalent results for Event 2, including June 24 and
25, is smaller (37 and 48 basis points, respectively), but both are statistically reliably different from zero.
This finding implies that the market did, in fact, revalue upward the U.S. cross-listed shares relative to
their home-market equivalent shares in an economically important way. We can interpret this as
12
consistent with the market recognizing value for the anti-fraud protections now afforded uniquely to the
U.S. traded securities by way of the Court’s decision.
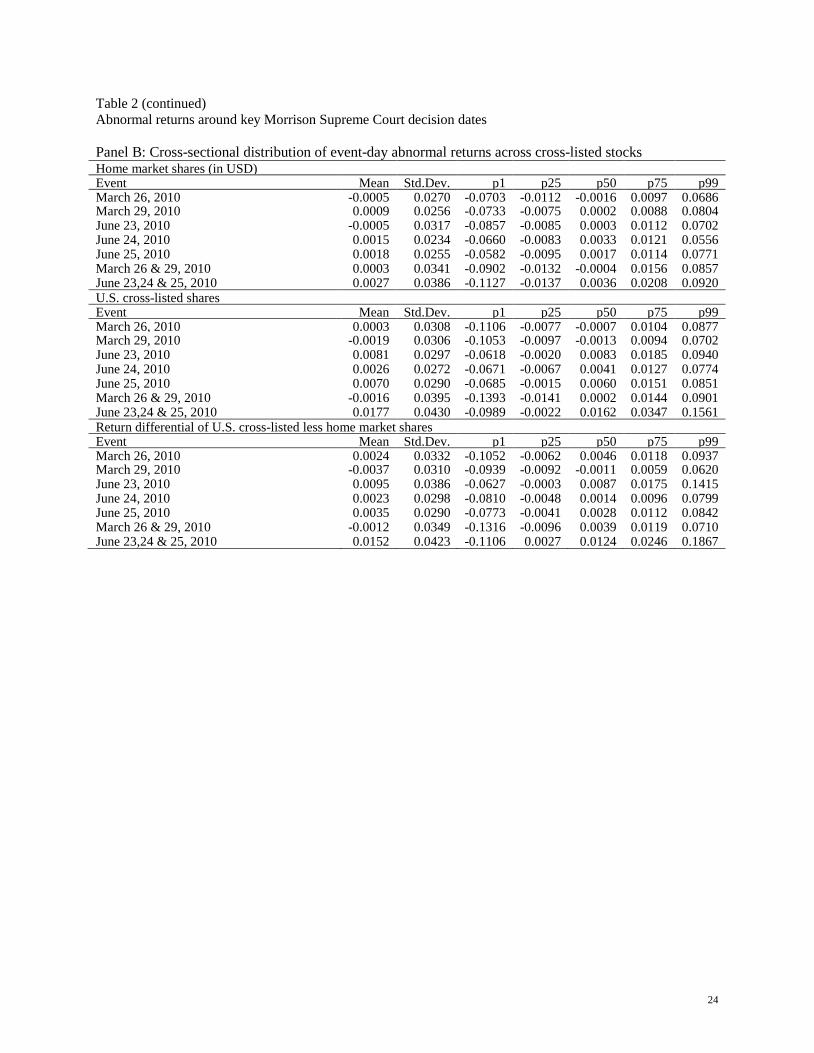
In Panel B of Table 2, we examine the firm-level cross-sectional differences in U.S. cross-listed
share returns, home market share returns, and return differentials for our firm sample. However, we
compute the abnormal returns at the individual firm level in a different way than for the portfolios in
Panel A. We first estimate a two-index market model for each stock (subject to our data constraints
defined above) during an estimation period beginning on January 1, 2008 and ending December 31, 2009
using the S&P 500 index and the MSCI All-Capital World index excluding the U.S. as the market
proxies. We retain the intercept and slope coefficients from this estimation period and compute the
abnormal returns (and return differentials) during the event period of January 1, 2010 through August 31,
2010 using the following specifications:
ARHi,t = RH
i,t – [α* + βUS* × RUSm,t + βW* × RW
m,t ], (2a)
ARUSi,t = RUS
i,t – [α* + βUS* × RUSm,t + βW* × RW
m,t ], (2a)
ARDiffi,t = RDiff
i,t – [α* + βUS* × RUSm,t + βW* × RW
m,t ], (2a)
where ARHi,t, ARUS
i,t, and ARDiffi,t are the abnormal returns for the home-market shares, U.S. cross-listed
shares and abnormal return differentials, respectively. The superscript “*” denotes the estimated
coefficients from the estimation window.
The average individual firm share price reaction for the home-market shares is -5 basis points on
June 23, which corresponds closely to the equivalent share price-reaction in Panel A for the equally-
weighted portfolio (-10 basis points) and the value-weighted portfolio (9 basis points). The interquartile
range of reactions across the firms is substantial ranging from -85 basis points at the 25th percentile to 112
basis points at the 75th percentile. The distribution is not dramatically skewed. The average reactions on
the other calendar dates and those for the U.S. cross-listed share returns are also comparable between the
two panels. For the return differentials in the bottom part of Panel B, we see that the average widening
around June 23 is 95 basis points, which is similar to the statistically-significant value-weighted portfolio
return differential of 91 basis points. More interesting perhaps is the larger than usual dispersion in firm-
13
level abnormal returns on June 23 (3.86% standard deviation, extreme range from -6.27% at the 1st
percentile to +14.15% at the 99th percentile). An abnormally large return differential and wider than
normal dispersion of reactions also obtains for Event 2, which includes June 24 and 25.
B. Experiment 2 – Comparing different market reactions across types of cross-listings
To now, we have shown that price deviations between the U.S. cross-listed shares and their
home-market shares widened on some key dates around the Supreme Court’s Morrison decision. Our next
experiment investigates whether some of the U.S. cross-listed stocks were impacted differently by the
Supreme Court’s decision to limit the anti-fraud protections. In order to perform this analysis, we identify
different subsamples of the stocks according to various criteria. These criteria relate to their reporting
status in the U.S., the form of cross-listing, their country of incorporation, as well as their listing venue.
We construct equally-weighted portfolios of the return differentials for the stocks in each
subsample using the same methodology as in the first experiment above. To estimate whether the
abnormal return differentials for the Supreme Court event dates are different between the two portfolios,
we specify and estimate by seemingly-unrelated regression (SUR) models the following two
specifications over the period from January 1, 2010 to August 30, 2010:
RDiffp1,t = αp1 + βp1
US × RUSm,t + βp1
W × RWm,t + δp1 × Supreme Court dummy + εp1,t, (3a)
RDiffp2,t = αp2 + βp2
US × RUSm,t + βp2
W × RWm,t + δp2 × Supreme Court dummy + εp2,t, (3b)
where RDiffp1,t and RDiff
p2,t are the daily return differentials on the equally-weighted portfolios for our first
subsample of cross-listed stocks (denoted “p1”) and those for our second subsample (denoted “p2”),
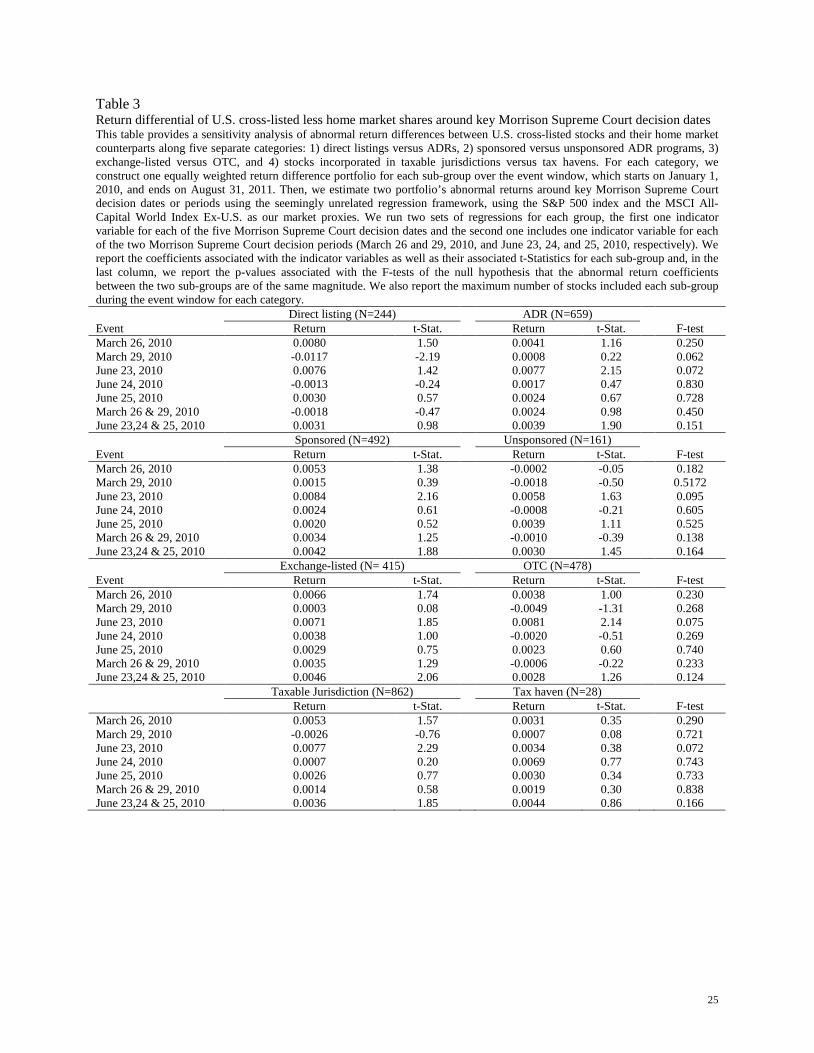
respectively. The focus of our test is a cross-equation restriction on whether δp1 equals δp2. In Table 3, we
report the coefficient estimates (δp1, δp2), their respective t-statistics and the p-value of an F-test that they
are equal.
In Gagnon and Karolyi (2010, Table 2, Panel A), they show that the average price deviations
between the cross-listed and home-market shares among Canadian stocks cross-listed in the U.S. via
direct listing are smaller in magnitude than those of others around the world, most of which rely on the
depositary receipt facility to arrange multi-market issuance and trading. Our first test in Table 3 examines
14
whether the return differentials widened to a different extent for Canadian and other direct listings
compared to those cross-listed via ADRs. The p-values that test for the differences in reactions across
these two groups for each event date are insignificant, except for that on June 23 and March 29. Both are
statistically significant at the 10% level, but not at the 5% level which recommends caution in interpreting
the reliability of these results. Further, the economic magnitude of the differences - especially on June 23
- is trivially small.
Our second test focuses on the difference between sponsored and unsponsored ADRs for the
subset of cross-listed firms that use an ADR facility. Unsponsored ADRs are those issued by the
depositary bank without the involvement of the foreign company for which the stock underlies the ADR.
Shareholder benefits, voting rights and other attached rights may not be extended to the holders of these
particular securities.12 We find no differences in abnormal return differentials between the sponsored and
unsponsored ADRs across the event dates, except for June 23. On that date, the return differentials
widened by a statistically-significant 84 basis points whereas those for the unsponsored programs
increased by an insignificant 58 basis points. The difference is statistically significant, but only at the 10%
level.
The trading venue of the cross-listed firm could impact how investors perceive the degree to
which they are protected by the anti-fraud regime under Rule 10b-5. However, many OTC-traded stocks
are SEC-compliant (they are listed among the FPIs disclosed by the SEC list each year) and are subject to
the same anti-fraud provisions. In our third test, we divide the sample into exchange-listed and OTC-
traded stocks. As in the previous two experiments, we are unable to uncover any differences in the
abnormal return differentials for the two portfolios, except for June 23. However, on that date, we find
that the return differentials widened even more dramatically for the OTC-traded ADRs (81 basis points)
12 Until 2008, few unsponsored ADR programs existed and they had been originally established before 1983. An SEC Amendment to Rule 12g3-2(b) on September 5, 2008 eliminated the requirement that foreign firms submit a written application for an exemption from U.S. registration requirements. Its original design was to make it easier for foreign firms to seek out sponsored ADRs in the U.S., but inadvertently created a channel for depositary banks to establish unsponsored ADRs. Almost 800 new unsponsored ADR programs were created in the six months following the rule change. Iliev, Miller and Roth (2010) study the economic consequences of this rule change.
15
than the exchange-listed ADRs (71 basis points). The difference is only significant at the 10% level. In an
unreported supplementary test, we further analyze the differences in the June 23 abnormal return
differentials for the exchange-listed and OTC-traded ADRs that are exclusively on the 2009 SEC FPI list.
The differences are insignificant (p-value of 0.201).
In our final test, we perform a similar test to that of LLS (2011) and examine a subsample of
cross-listed stocks incorporated in tax havens (e.g., Bermuda, Cayman Islands, and British Virgin
Islands), all of which have a common law legal origin. Investors may have perceived that the anti-fraud
provision of Rule 10b-5 may not have applied to these cross-listed stocks. We find that the differences in
abnormal return differentials around the key dates of the Morrison decision are indistinguishable for these
tax-haven firms, except again for June 23. The return differentials widen substantially more for those
cross-listed stocks in taxable jurisdictions (77 basis points) than for those from tax havens (34 basis
points). This economically large difference, however, is only significant at the 10% level.
Overall, our findings for these different subsamples of cross-listed stocks sorted by criteria related
to their reporting status in the U.S., the form of cross-listing, their country of incorporation, as well as
their listing venue suggest that these differences do not matter.
C. Experiment 3 – Cross-sectional regressions
In our final experiment, we perform cross-sectional regression analysis of the individual cross-
listed firm abnormal return differentials for key dates around the Morrison decision. We focus on the
cumulative abnormal return differentials around Event 2, which includes all three dates of the Supreme
Court decision of June 23, 24, and 25, 2010. What we seek to understand is whether the cumulative
abnormal return differentials widened differently for stocks that have a different level of exposure to U.S.
markets. If legal bonding matters, one may predict that the lower the exposure to the U.S. markets for a
cross-listed firm, the more investors may perceive that the newly-differentiated application of anti-fraud
provisions stipulated by the Morrison decision would apply. That is, investors in these firms (especially,
those that owned and traded the ordinary shares in the home market) would have become more vulnerable
to newly defined limits introduced by the Supreme Court. It is difficult to measure the extent to which a
16
given cross-listed stock is exposed to U.S. markets, but one useful proxy is the fraction of global share
trading that takes place in the U.S.13 We test whether the cumulative abnormal return differentials around
the Morrison decision widened more dramatically for those cross-listed stocks in the U.S. for which a
larger fraction of shares were traded at home, what we call our more vulnerable “treatment” group. The
U.S. share of total volume is computed over our estimation period of January 1, 2008 through December
31, 2009.
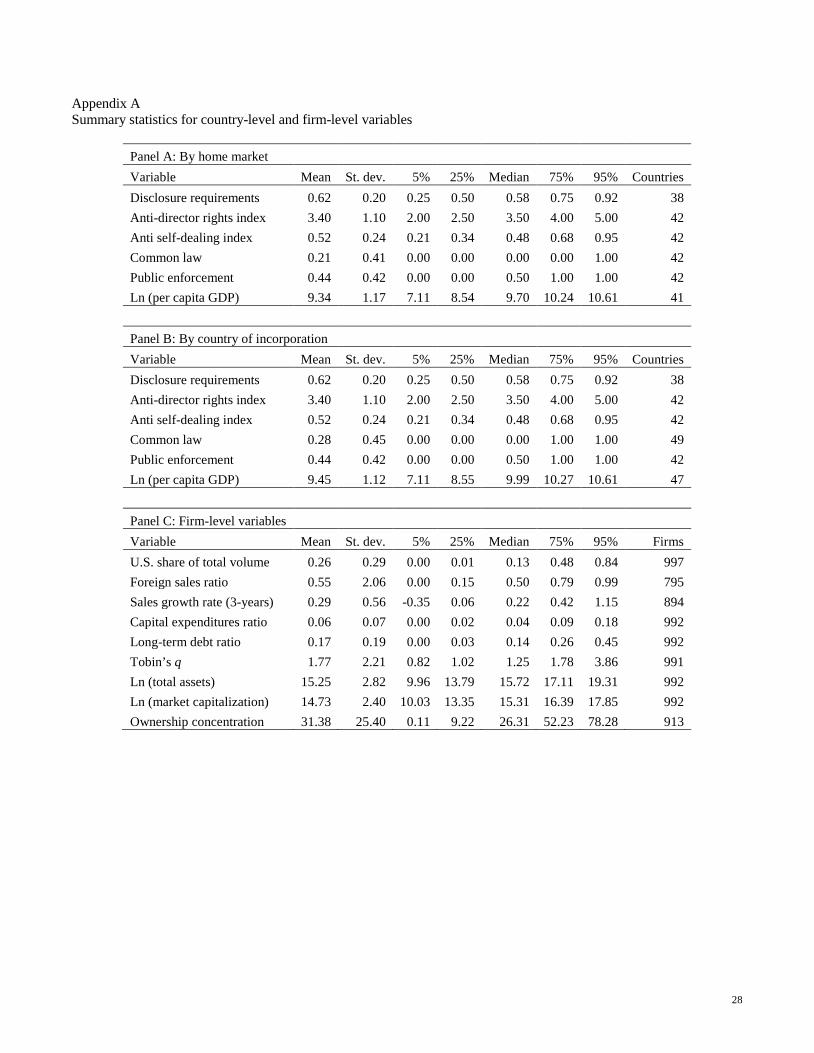
We need to control for other important firm-specific and country-level factors that may influence
the return differentials. Our other covariates in the regression analysis includes a number of firm-specific
variables, such as sales growth (trailing 3-year), capital expenditures relative to total assets, long-term
debt leverage ratio, Tobin’s q valuation ratio, natural logarithm of total assets, the firm’s ownership
concentration, and the fraction of sales targeting foreign markets. These variables are obtained from
Thomson Reuters’ Datastream and Worldscope database and are described in detail in Appendix B. They
are computed as of the end of 2009. Summary statistics for the sample are also provided in Appendix A.
We also include covariates at the country level related to the quality of investor legal protections against
anti-self-dealing, anti-director rights, the quality of public enforcement, disclosure requirements, as well
as a common law origin dummy variable, and the natural logarithm of per capita gross domestic product
(GDP). Details are again furnished in Appendices A and B.
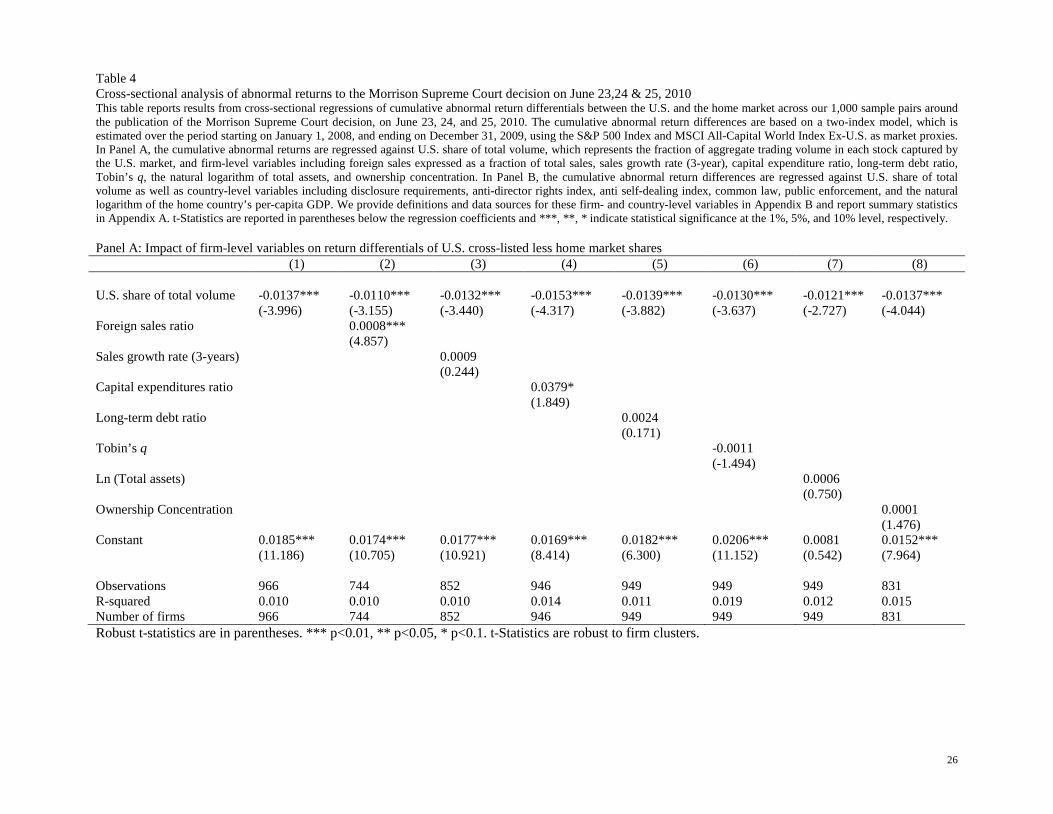
Table 4 presents the results. Panel A focuses on the firm-level variables and Panel B examines the
country level factors. Robust t-statistics with firm-level clusters are reported in parentheses below the
coefficients. In Panel A, we find that the U.S. share of trading volume is statistically significantly and
negatively related to the cumulative return differentials. In Model (1), the coefficient is -0.0137 with a
robust t-statistic of -3.99. In terms of economic importance, a one standard-deviation increase in the U.S.
share of trading volume (0.29, Appendix A) is associated with a 39 basis point lower cumulative return
13 Baruch, Karolyi, and Lemmon (2007) develop a theoretical model to rationalize how trading activity is distributed across competing trading venues for internationally cross-listed stocks. They find empirical evidence in support of their predictions. An important result in their paper is that the fraction of shares traded in the U.S. is statistically significantly and economically importantly linked to the fraction of shares held by U.S. institutions.
17
differential, which constitutes 10% of its unconditional standard deviation (0.0386, Panel B of Table 2).
This is an economically important factor influencing the cumulative return differential over the Event 2
period of June 23, 24, and 25. The adjusted R2 is, however, low at around 1%. The sign and magnitude of
the coefficient on U.S. share of total volume is similar even when we include control variables related to
other firm-specific characteristics. It is interesting to note that the fraction of foreign sales is positively
related to the cumulative return differential implying that cross-listed stocks with global operations and
product market experienced a larger reaction to the Supreme Court decision. The economic magnitude of
this relationship is less than half that of the U.S. share of total volume. We offer no theory to guide us on
this result. The only other variable with any explanatory power is the capital expenditure ratio (as a
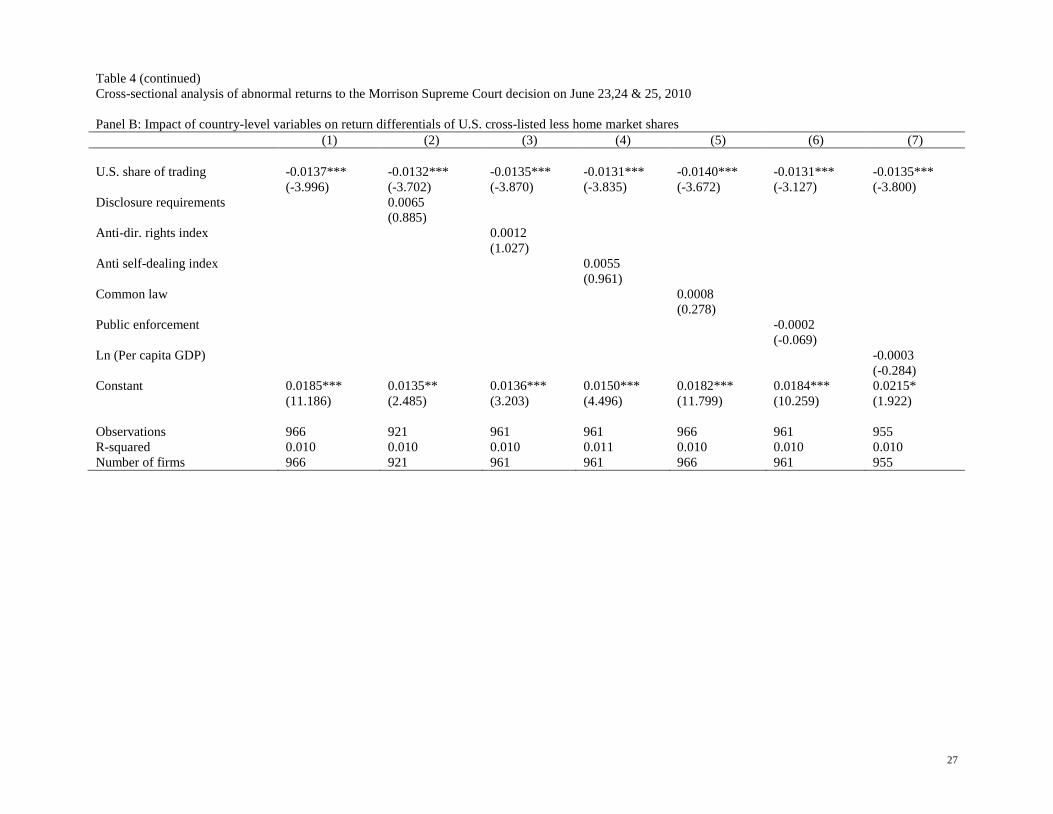
fraction of total assets). The coefficient is positive, but only at the 10% level. In Panel B of Table 4, we
affirm the statistically significant negative relationship with the U.S. share of trading volume even with
controls for the country level factors related to the level of economic development, legal origin and other
measures of the quality of investor legal protections. None of these variables, however, offers any reliable
explanatory power for the cross-section of cumulative abnormal return differentials during our event
period.
4. Conclusions
We show that the U.S. Supreme Court’s ruling in the case of Morrison v. National Australia Bank
in June of 2010 was associated with a statistically significant 37 basis point increase on the day in the
price deviation between the U.S. cross-listed shares trading in U.S. markets and the underlying home
market shares. Our sample includes 1,000 foreign firms from 42 different countries and comprises those
cross-listed on the major U.S. exchanges (Nasdaq, New York Stock Exchange) in direct form and as
American Depositary Receipts (ADRs), as well as those trading on over-the-counter (OTC) markets in
sponsored and unsponsored form. The price deviations between the cross-listed and underlying home
market shares widen more dramatically for those companies with a lower presence in the U.S., as
measured by the fraction of global trading that takes place in U.S. markets.
18
We interpret our findings in this study as further empirical evidence in favor of the bonding
hypothesis. That the price deviations between the ADRs and other cross-listed shares widened relative to
the home market shares around the days of the Supreme Court decision reveals that market participants
revalued the newly differentiated application of the anti-fraud provisions of Rule 10b-5 in the ADRs and
in the home-market shares. The evidence is consistent with positive value associated with U.S. civil
liability cause of action for foreign firms.
Of course, our study is subject to a number of limitations. One challenge inherent with a single-
event event study is that it is difficult for researchers to control for all the other macroeconomic and
capital market influences that may have been taking place around the key dates surrounding the Supreme
Court’s Morrison decision. Indeed, the deliberations and ultimate passage of the Dodd-Frank Act created
much political and economic uncertainty. But one cannot ignore the fact that the provision in the Act for
the SEC’s Extraterritorial Rights study followed closely on the heels of the Morrison decision. One could
also criticize our reliance on closing prices in measuring the price deviations and the abnormal return
differences for pairs of securities that are trading in markets that have very different trading hours. Indeed,
there are likely important intraday movements in the price deviations that are lost in our daily frequency
of analysis. Third, the experiment we conduct has a short horizon, which is necessarily limiting. It
remains to be seen whether there are any longer term economic consequences to the Morrison decision.
Finally, one would hope for a more reliable proxy for the measure of the U.S. exposure of a particular
cross-listed company to the U.S. markets than the fraction of global trading that takes place in the U.S.
markets. Experimentally, it would be useful to take advantage of different proxies in order to identify the
relative importance of different channels through which bonding effects – in their legal or reputational
form – are realized. For example, one could investigate changes in U.S. institutional holdings around the
Morrison decision through their 13F filings. We could also test whether the abnormal return differentials
widened more so for those cross-listed stocks in which disproportionately more of the shares were held in
ordinary form in the home markets by U.S. institutions before the Morrison decision was returned.
19
References
Baruch, S., Karolyi, G.A., Lemmon, M., 2007. Multimarket trading and liquidity: theory and evidence.
Journal of Finance 62, 2169–2200. Benos, E., Weisbach, M., 2004. Private benefits and cross-listings in the United States. Emerging Markets
Review 5, 217–240. Binder, J. J., 1985, On the use of the multivariate regression model in event studies, Journal of Accounting
Research 23, 370–383. Blouin, J., Hail, L., Yetman, M., 2009. Capital gains taxes, pricing spreads and arbitrage: evidence from
U.S. cross-listed firms. The Accounting Review 84, 1321–1361. Coffee, J., 1999. The future as history: the prospects for global convergence in corporate governance and its
implications. Northwestern University Law Review 93, 641–708. Coffee, J., 2002. Racing towards the top? The impact of cross-listings and stock market competition on
international corporate governance. Columbia Law Review 102, 1757–1831. Djankov, S., La Porta, R., Lopez-de-Silanes, F., Shleifer, A., 2008. The law and economics of self-dealing.
Journal of Financial Economics 88, 430–465. Doidge, C., 2004. U.S. cross-listings and the private benefits of control: evidence from dual class firms.
Journal of Financial Economics 72, 519–554. Doidge, C., Karolyi, G.A., Lins, K., Miller, D., Stulz, R., 2009. Private benefits of control, ownership, and
the cross-listing decision. Journal of Finance 64, 425–466. Doidge, C., Karolyi, G.A., Stulz, R., 2004. Why are foreign firms that are listed in the U.S. worth more?
Journal of Financial Economics 71, 205–238. Doidge, C., Karolyi, G.A., Stulz, R., 2009. Has New York become less competitive than London in global
markets? Evaluating foreign listing choices over time. Journal of Financial Economics 91, 253–277.
Doidge, C., Karolyi, G.A., Stulz, R., 2010. Why do foreign firms leave U.S. equity markets? Journal of
Finance 65, 1507-1553. Gagnon, L., Karolyi, G.A., 2010. Multi-market trading and arbitrage. Journal of Financial Economics 97,
53–80. Gagnon, L., Karolyi, G.A., 2011. Do international cross-listings still matter? in Evidence on Financial
Globalization and Crises, Thorsten Beck, Sergio Schmukler and Stijn Claessens (eds.), Elsevier North Holland Publishers, Amsterdam, Netherlands.
Gande, A., Miller, D. P., 2011. Why do U.S. securities laws matter to non-U.S. firms? Evidence from
private class-action lawsuits, Unpublished working paper, Southern Methodist University.
20
Gozzi, J., Levine, R., Schmukler, S., 2008. Internationalization and the evolution of corporate valuation. Journal of Financial Economics 88, 607–632.
Hail, L., Leuz, C., 2009. Cost of capital effects and changes in growth expectations around U.S. cross-
listings. Journal of Financial Economics 93, 428–454. Iliev, P., Miller, D.P., Roth, L., 2009. Uninvited U.S. investors? Economic consequences of involuntary
cross-listings. Unpublished working paper, Pennsylvania State University. Karolyi, G.A., 1998. Why do companies list shares abroad? A survey of the evidence and its managerial
implications. Financial Markets, Institutions and Instruments 7, 1–60. Karolyi, G.A., 2006. The world of cross-listings and cross-listings of the world: challenging conventional
wisdom. Review of Finance 10, 99–152. Karolyi, G. A., 2011. Corporate governance, agency problems and international cross-listings: A defense of
the bonding hypothesis, Unpublished working paper, Cornell University. Kato, K., Linn, S., Schallheim, J., 1991. Are there arbitrage opportunities in the market for American
depositary receipts? Journal of International Financial Markets, Institutions, and Money 1, 73–89. King, M., Segal, D., 2009. The long-term effects of cross-listing, investor recognition, and ownership
structure on valuation. Review of Financial Studies 22, 2394–2421. LaPorta, R., Lopez-de-Silanes, F., Shleifer, A., Vishny, R., 1998. Law and finance. Journal of Political
Economy 106(6), 1113-1155. Lel, U., Miller, D., 2008. International cross-listing, firm performance, and top management turnover: A
test of the bonding hypothesis. Journal of Finance 63, 1897-1937. Licht, A., 1998. Regulatory arbitrage for real: international securities regulation in a world of interacting
securities markets. Virginia Journal of International Law 38, 563–638. Licht, A., 2000. Genie in a bottle? Assessing managerial opportunism in international securities
transactions, Columbia Business Law Review 51, 351-377. Licht, A., 2001. Managerial opportunism and foreign listing: some direct evidence. University of
Pennsylvania Journal of Economic Law 22, 325–347. Licht, A., 2003. Cross-listing and corporate governance: bonding or avoiding? Chicago Journal of
International Law 4, 122–141. Licht, A., X. Li, Siegel, J., 2011. What makes the bonding stick? A natural experiment involving the
Supreme Court and cross-listed firms. Unpublished working paper, Harvard Business School. Litvak, K., 2007a, The effect of the Sarbanes-Oxley Act on non-U.S. companies cross-listed in the U.S.,
Journal of Corporate Finance 13, 195–228. Litvak, K., 2007b. Sarbanes-Oxley and the cross-listing premium. Michigan Law Review 105, 1857-1898. Litvak, K., 2009. The relationship among U.S. securities laws, cross-listing premia, and trading volumes.
21
Unpublished working paper, Northwestern University. Maldonado, W., Saunders, A., 1983. Foreign exchange futures and the law of one price. Financial
Management 12, 19–23. McConnell, J., Dybevik, H., Haushalter, D., Lie, E., 1995. A survey of evidence on domestic and
international stock exchange listings with implications for markets and managers. Pacific Basin Finance Journal 4, 347–376.
Miller, D., Morey, M., 1996. The intraday pricing behavior of international dually listed securities. Journal
of International Financial Markets, Institutions & Money 6, 79–89. Park, J., Tavakkol, A., 1994. Are ADRs a dollar translation of their underling securities? The case of
Japanese ADRs. Journal of International Financial Markets, Institutions and Money 4, 77–87. Pinegar, J., Ravichandran, R., 2003. U.S. investors’ perceptions of corporate control in Mexico: evidence
from sibling ADRS. Journal of Financial and Quantitative Analysis 38, 213–230. Reese, W., Weisbach, M., 2002. Protection of minority shareholder interests, cross-listings in the United
States, and subsequent equity offerings. Journal of Financial Economics 66, 65–104. Reynolds, T., Flores, A., 1989. Foreign law: current sources of basic legislation in jurisdictions of the
world. Rothman and Co., Littleton, Colorado. Sarkissian, S., Schill, M.J., 2009. Are there permanent valuation gains to overseas listing? The Review of
Financial Studies 22, 371–412. Sarkissian, S., Schill, M.J., 2011. Why are U.S. firms listed in foreign markets worth more? Unpublished
working paper, McGill University. Siegel, J., 2005. Can foreign firms bond themselves effectively by submitting to U.S. law? Journal of
Financial Economics 75, 319–360. Spamann, H., 2010. The “Anti-director rights index” revisited. Review of Financial Studies 23, 467–486. Schipper, K., and R. Thompson, 1983, The impact of merger-related regulations on the shareholders of
acquiring firms, Journal of Accounting Research 21, 184–221. Schwert, G. W., 1981, Using financial data to measure effects of regulation, Journal of Law and Economics
24, 121–158. Stulz, R., 1999. Globalization, corporate finance, and the cost of capital. Journal of Applied Corporate
Finance 12, 8–25. Wahab, M., Lashgari, M., Cohn, R., 1992. Arbitrage opportunities in the American depositary receipts
market revisited. Journal of International Financial Markets, Institutions and Money 2, 97–130.
22
Table 1 Summary statistics on sample of U.S. cross-listings by home country, country of incorporation, and industry This table describes the composition of our sample by home market, country of incorporation, and by industry. Our sample consists of 1,000 U.S. cross-listed firms from 42 countries, incorporated in 48 separate jurisdictions, and spanning 39 industries, as defined by Thomson Reuters, and includes all pairs from the Securities and Exchange Commission’s (SEC) Foreign Private Issuer (FPI) list at the end of 2009 that are covered in Thomson Reuters’ Datastream equity database. Each pair consists of an American Depositary Receipt (ADR) or direct U.S. listing and of the underlying common stock trading in the home market. The American Depositary Receipts are drawn from BNY Mellon’s DR Directory and exclude Non-U.S. DR programs, Rule 144a and Regulation S ADRs, as well as preferred shares. Foreign stocks listed in U.S. as ordinary common stocks, e.g. Canadians and many Israelis, are drawn from Datatream’s common stock universe. For each sample firm, we extract daily closing unadjusted price, return index, and trading volume for the U.S. cross-listed stock and for its home-market counterpart from Thomson Reuters’ Datatream database. In order to qualify for inclusion in our sample, a pair must possess at least 60 valid observations, defined as non-zero volume days, between January 1, 2008, and December 31, 2011, as well as at least one valid return day during one of the five key Morrison Supreme Court decision dates spanning our two event periods (March 26 and 29 as well as June 23, 24, and 25, all in 2010). Our sampling period starts on January 1, 2008, and ends on August 31, 2010. Panel A: By home market Panel B: By country of incorporation Panel C: By industry Country Count %
Country Count %
Sector Count %
Argentina 11 1.1
Argentina 11 1.1
Aerospace & Defense 12 1.2 Australia 52 5.2
Australia 50 5.0
Alternative Energy 4 0.4
Austria 8 0.8
Austria 7 0.7
Automobiles & Parts 18 1.8 Belgium 4 0.4
Belgium 4 0.4
Banks 70 7.0
Brazil 27 2.7
Bermuda 19 1.9
Beverages 20 2.1 Canada 243 24.2
Brazil 27 2.7
Chemicals 33 3.3
Chile 13 1.4
British Virgin Islands 1 0.1
Construction & Materials 24 2.4 China 25 2.5
Canada 241 24.1
Electricity 25 2.5
Colombia 2 0.2
Cayman Islands 7 0.7
Electronic, Electrical Equip. 16 1.6 Denmark 8 0.8
Chile 13 1.3
Financial Services (Sector) 23 2.3
Egypt 1 0.1
China 25 2.5
Fixed Line Telecom. 31 3.2 Finland 7 0.7
Colombia 2 0.2
Food & Drug Retailers 10 1.0
France 41 4.1
Denmark 8 0.8
Food Producers 25 2.5 Germany 31 3.1
Egypt 1 0.1
Forestry & Paper 10 1.0
Greece 5 0.5
Finland 7 0.7
Gas, Water & Multiutilities 15 1.5 Hong Kong 51 5.2
France 39 3.9
General Industrials 19 2.0
Hungary 2 0.2
Germany 31 3.1
General Retailers 18 1.8 India 11 1.1
Greece 5 0.5
Health Care Equip. & Serv. 12 1.2
Indonesia 5 0.5
Hong Kong 33 3.3
House. Gds & Home Constr. 10 1.0 Ireland 8 0.8
Hungary 2 0.2
Industrial Engineering 25 2.6
Israel 42 4.1
India 11 1.1
Industrial Metals & Mining 39 3.9 Italy 15 1.5
Indonesia 5 0.5
Industrial Transportation 19 1.9
Japan 121 12.0
Ireland 8 0.8
Leisure Goods 15 1.5 Luxembourg 2 0.2
Israel 40 4.0
Life Insurance 12 1.2
Malaysia 1 0.1
Italy 15 1.5
Media 24 2.4 Mexico 25 2.7
Japan 121 12.1
Mining 127 12.6
Netherlands 20 2.0
Luxembourg 4 0.4
Mobile Telecommunications 24 2.5 New Zealand 1 0.1
Malaysia 1 0.1
Nonlife Insurance 16 1.6
Norway 10 1.0
Marshall Islands 1 0.1
Oil & Gas Producers 57 5.7 Peru 1 0.1
Mexico 25 2.5
Oil Equipment & Services 16 1.6
Philippines 2 0.2
Netherlands 22 2.2
Personal Goods 16 1.6 Portugal 5 0.5
Netherlands Antilles 1 0.1
Pharmaceuticals & Biotech. 55 5.5
Russia 11 1.1
New Zealand 1 0.1
Real Estate Inv. & Serv. 22 2.2 Singapore 16 1.6
Norway 6 0.6
Real Estate Investment Trusts 2 0.2
South Africa 32 3.2
Papua New Guinea 2 0.2
Software & Computer Serv. 33 3.3 South Korea 9 0.9
Peru 1 0.1
Support Services 21 2.1
Spain 10 1.0
Philippines 2 0.2
Tech. Hardware & Equip. 50 5.0 Sweden 11 1.2
Portugal 5 0.5
Tobacco 2 0.2
Switzerland 21 2.1
Russia 11 1.1
Travel & Leisure 30 3.0 Taiwan 6 0.6
Singapore 12 1.2
Turkey 1 0.1
South Africa 32 3.2 United Kingdom 83 8.4
South Korea 9 0.9
Spain 10 1.0
Sweden 11 1.1
Switzerland 21 2.1
Taiwan 6 0.6
Turkey 1 0.1
United Kingdom 83 8.3
Total 1,000 100.0
Total 1,000 100.0
Total 1,000 100.0
23
Table 2 Abnormal returns around key Morrison Supreme Court decision dates This table reports abnormal returns for the home market stock, the U.S. cross-listed stock, and abnormal return difference between the U.S. cross-listed stocks and their home market counterparts, around key Morrison Supreme Court decision dates. In Panel A, the abnormal return estimates are derived from portfolio-level regressions. We first proceed by constructing one equally weighted portfolio and one value weighted portfolio for each of our sample stocks’ home, U.S. and Home-U.S. returns for the event window, which starts on January 1, 2010, and ends on August 30, 2011. We then regress the returns on each one of these portfolios against Morrison Supreme Court Decision indicator variables as well as returns on the U.S. and the world market index, as proxied by the Standard & Poor’s 500 index and by the Morgan Stanley Capital International (MSCI) All-Capital World Index excluding the U.S., respectively. We run two sets of regressions for each group, the first one indicator variable for each of the five Morrison Supreme Court decision dates and the second one includes one indicator variable for each of the two Morrison Supreme Court decision periods (March 26 and 29, 2010, and June 23, 24, and 25, 2010, respectively). We report the coefficients associated with the indicator variables in the table as well as their associated t-Statistics. In Panel B, we report summary statistics describing the distribution of event-day abnormal returns across our sample stocks, based the traditional event study methodology using the S&P 500 index and the MSCI All-Capital World Index Ex-U.S. as our market proxies. Abnormal returns for each U.S. cross-listed stocks, for their home market counterparts, and for the cross-listed stocks less their home market counterparts are estimated separately. The estimation period starts on January 1, 2008, and ends on December 31, 2009. We report the sample mean, standard deviation, along with relevant quintile statistics for the abnormal returns on each of the 5 decision dates and for the two decision periods. Panel A: Time series regressions portfolio returns on dummy variables Home market shares (in USD)
Equally weighted Value weighted Event Return t-Stat.
Return t-Stat.
March 26, 2010 -0.0035 -1.33 -0.0020 -1.15 March 29, 2010 0.0018 0.70 0.0019 1.11 June 23, 2010 -0.0010 -0.38 0.0009 0.50 June 24, 2010 0.0001 0.03 -0.0017 -0.96 June 25, 2010 0.0031 1.17 0.0005 0.27 March 26 & 29, 2010 -0.0008 -0.45 0.0000 -0.03 June 23,24 & 25, 2010 0.0007 0.47 -0.0001 -0.11 U.S. cross-listed shares
Equally weighted Value weighted Event Return t-Stat. Return t-Stat. March 26, 2010 0.0017 0.42 0.0039 0.94 March 29, 2010 -0.0006 -0.14 0.0043 1.04 June 23, 2010 0.0066 1.67 0.0100 2.41 June 24, 2010 0.0010 0.24 0.0011 0.28 June 25, 2010 0.0056 1.41 0.0030 0.73 March 26 & 29, 2010 0.0006 0.20 0.0041 1.40 June 23,24 & 25, 2010 0.0044 1.92 0.0047 1.95 Return differential of U.S. cross-listed less home market shares
Equally weighted Value weighted Event Return t-Stat. Return t-Stat. March 26, 2010 0.0052 1.55 0.0059 1.46 March 29, 2010 -0.0024 -0.72 0.0024 0.59 June 23, 2010 0.0076 2.29 0.0091 2.25 June 24, 2010 0.0009 0.26 0.0028 0.70 June 25, 2010 0.0025 0.76 0.0025 0.63 March 26 & 29, 2010 0.0014 0.59 0.0041 1.45 June 23,24 & 25, 2010 0.0037 1.88 0.0048 2.05
24
Table 2 (continued) Abnormal returns around key Morrison Supreme Court decision dates Panel B: Cross-sectional distribution of event-day abnormal returns across cross-listed stocks Home market shares (in USD)
Event Mean Std.Dev. p1 p25 p50 p75 p99 March 26, 2010 -0.0005 0.0270 -0.0703 -0.0112 -0.0016 0.0097 0.0686 March 29, 2010 0.0009 0.0256 -0.0733 -0.0075 0.0002 0.0088 0.0804 June 23, 2010 -0.0005 0.0317 -0.0857 -0.0085 0.0003 0.0112 0.0702 June 24, 2010 0.0015 0.0234 -0.0660 -0.0083 0.0033 0.0121 0.0556 June 25, 2010 0.0018 0.0255 -0.0582 -0.0095 0.0017 0.0114 0.0771 March 26 & 29, 2010 0.0003 0.0341 -0.0902 -0.0132 -0.0004 0.0156 0.0857 June 23,24 & 25, 2010 0.0027 0.0386 -0.1127 -0.0137 0.0036 0.0208 0.0920 U.S. cross-listed shares
Event Mean Std.Dev. p1 p25 p50 p75 p99 March 26, 2010 0.0003 0.0308 -0.1106 -0.0077 -0.0007 0.0104 0.0877 March 29, 2010 -0.0019 0.0306 -0.1053 -0.0097 -0.0013 0.0094 0.0702 June 23, 2010 0.0081 0.0297 -0.0618 -0.0020 0.0083 0.0185 0.0940 June 24, 2010 0.0026 0.0272 -0.0671 -0.0067 0.0041 0.0127 0.0774 June 25, 2010 0.0070 0.0290 -0.0685 -0.0015 0.0060 0.0151 0.0851 March 26 & 29, 2010 -0.0016 0.0395 -0.1393 -0.0141 0.0002 0.0144 0.0901 June 23,24 & 25, 2010 0.0177 0.0430 -0.0989 -0.0022 0.0162 0.0347 0.1561 Return differential of U.S. cross-listed less home market shares
Event Mean Std.Dev. p1 p25 p50 p75 p99 March 26, 2010 0.0024 0.0332 -0.1052 -0.0062 0.0046 0.0118 0.0937 March 29, 2010 -0.0037 0.0310 -0.0939 -0.0092 -0.0011 0.0059 0.0620 June 23, 2010 0.0095 0.0386 -0.0627 -0.0003 0.0087 0.0175 0.1415 June 24, 2010 0.0023 0.0298 -0.0810 -0.0048 0.0014 0.0096 0.0799 June 25, 2010 0.0035 0.0290 -0.0773 -0.0041 0.0028 0.0112 0.0842 March 26 & 29, 2010 -0.0012 0.0349 -0.1316 -0.0096 0.0039 0.0119 0.0710 June 23,24 & 25, 2010 0.0152 0.0423 -0.1106 0.0027 0.0124 0.0246 0.1867
25
Table 3 Return differential of U.S. cross-listed less home market shares around key Morrison Supreme Court decision dates This table provides a sensitivity analysis of abnormal return differences between U.S. cross-listed stocks and their home market counterparts along five separate categories: 1) direct listings versus ADRs, 2) sponsored versus unsponsored ADR programs, 3) exchange-listed versus OTC, and 4) stocks incorporated in taxable jurisdictions versus tax havens. For each category, we construct one equally weighted return difference portfolio for each sub-group over the event window, which starts on January 1, 2010, and ends on August 31, 2011. Then, we estimate two portfolio’s abnormal returns around key Morrison Supreme Court decision dates or periods using the seemingly unrelated regression framework, using the S&P 500 index and the MSCI All-Capital World Index Ex-U.S. as our market proxies. We run two sets of regressions for each group, the first one indicator variable for each of the five Morrison Supreme Court decision dates and the second one includes one indicator variable for each of the two Morrison Supreme Court decision periods (March 26 and 29, 2010, and June 23, 24, and 25, 2010, respectively). We report the coefficients associated with the indicator variables as well as their associated t-Statistics for each sub-group and, in the last column, we report the p-values associated with the F-tests of the null hypothesis that the abnormal return coefficients between the two sub-groups are of the same magnitude. We also report the maximum number of stocks included each sub-group during the event window for each category. Direct listing (N=244) ADR (N=659) Event Return t-Stat.
Return t-Stat. F-test
March 26, 2010 0.0080 1.50 0.0041 1.16 0.250 March 29, 2010 -0.0117 -2.19 0.0008 0.22 0.062 June 23, 2010 0.0076 1.42 0.0077 2.15 0.072 June 24, 2010 -0.0013 -0.24 0.0017 0.47 0.830 June 25, 2010 0.0030 0.57 0.0024 0.67 0.728 March 26 & 29, 2010 -0.0018 -0.47 0.0024 0.98 0.450 June 23,24 & 25, 2010 0.0031 0.98 0.0039 1.90 0.151 Sponsored (N=492) Unsponsored (N=161) Event Return t-Stat. Return t-Stat. F-test March 26, 2010 0.0053 1.38 -0.0002 -0.05 0.182 March 29, 2010 0.0015 0.39 -0.0018 -0.50 0.5172 June 23, 2010 0.0084 2.16 0.0058 1.63 0.095 June 24, 2010 0.0024 0.61 -0.0008 -0.21 0.605 June 25, 2010 0.0020 0.52 0.0039 1.11 0.525 March 26 & 29, 2010 0.0034 1.25 -0.0010 -0.39 0.138 June 23,24 & 25, 2010 0.0042 1.88 0.0030 1.45 0.164 Exchange-listed (N= 415) OTC (N=478) Event Return t-Stat. Return t-Stat. F-test March 26, 2010 0.0066 1.74 0.0038 1.00 0.230 March 29, 2010 0.0003 0.08 -0.0049 -1.31 0.268 June 23, 2010 0.0071 1.85 0.0081 2.14 0.075 June 24, 2010 0.0038 1.00 -0.0020 -0.51 0.269 June 25, 2010 0.0029 0.75 0.0023 0.60 0.740 March 26 & 29, 2010 0.0035 1.29 -0.0006 -0.22 0.233 June 23,24 & 25, 2010 0.0046 2.06 0.0028 1.26 0.124 Taxable Jurisdiction (N=862) Tax haven (N=28) Return t-Stat. Return t-Stat. F-test March 26, 2010 0.0053 1.57 0.0031 0.35 0.290 March 29, 2010 -0.0026 -0.76 0.0007 0.08 0.721 June 23, 2010 0.0077 2.29 0.0034 0.38 0.072 June 24, 2010 0.0007 0.20 0.0069 0.77 0.743 June 25, 2010 0.0026 0.77 0.0030 0.34 0.733 March 26 & 29, 2010 0.0014 0.58 0.0019 0.30 0.838 June 23,24 & 25, 2010 0.0036 1.85 0.0044 0.86 0.166
26
Table 4 Cross-sectional analysis of abnormal returns to the Morrison Supreme Court decision on June 23,24 & 25, 2010 This table reports results from cross-sectional regressions of cumulative abnormal return differentials between the U.S. and the home market across our 1,000 sample pairs around the publication of the Morrison Supreme Court decision, on June 23, 24, and 25, 2010. The cumulative abnormal return differences are based on a two-index model, which is estimated over the period starting on January 1, 2008, and ending on December 31, 2009, using the S&P 500 Index and MSCI All-Capital World Index Ex-U.S. as market proxies. In Panel A, the cumulative abnormal returns are regressed against U.S. share of total volume, which represents the fraction of aggregate trading volume in each stock captured by the U.S. market, and firm-level variables including foreign sales expressed as a fraction of total sales, sales growth rate (3-year), capital expenditure ratio, long-term debt ratio, Tobin’s q, the natural logarithm of total assets, and ownership concentration. In Panel B, the cumulative abnormal return differences are regressed against U.S. share of total volume as well as country-level variables including disclosure requirements, anti-director rights index, anti self-dealing index, common law, public enforcement, and the natural logarithm of the home country’s per-capita GDP. We provide definitions and data sources for these firm- and country-level variables in Appendix B and report summary statistics in Appendix A. t-Statistics are reported in parentheses below the regression coefficients and ***, **, * indicate statistical significance at the 1%, 5%, and 10% level, respectively. Panel A: Impact of firm-level variables on return differentials of U.S. cross-listed less home market shares (1) (2) (3) (4) (5) (6) (7) (8) U.S. share of total volume -0.0137*** -0.0110*** -0.0132*** -0.0153*** -0.0139*** -0.0130*** -0.0121*** -0.0137*** (-3.996) (-3.155) (-3.440) (-4.317) (-3.882) (-3.637) (-2.727) (-4.044) Foreign sales ratio 0.0008*** (4.857) Sales growth rate (3-years) 0.0009 (0.244) Capital expenditures ratio 0.0379* (1.849) Long-term debt ratio 0.0024 (0.171) Tobin’s q -0.0011 (-1.494) Ln (Total assets) 0.0006 (0.750) Ownership Concentration 0.0001 (1.476) Constant 0.0185*** 0.0174*** 0.0177*** 0.0169*** 0.0182*** 0.0206*** 0.0081 0.0152*** (11.186) (10.705) (10.921) (8.414) (6.300) (11.152) (0.542) (7.964) Observations 966 744 852 946 949 949 949 831 R-squared 0.010 0.010 0.010 0.014 0.011 0.019 0.012 0.015 Number of firms 966 744 852 946 949 949 949 831 Robust t-statistics are in parentheses. *** p<0.01, ** p<0.05, * p<0.1. t-Statistics are robust to firm clusters.
27
Table 4 (continued) Cross-sectional analysis of abnormal returns to the Morrison Supreme Court decision on June 23,24 & 25, 2010 Panel B: Impact of country-level variables on return differentials of U.S. cross-listed less home market shares (1) (2) (3) (4) (5) (6) (7) U.S. share of trading -0.0137*** -0.0132*** -0.0135*** -0.0131*** -0.0140*** -0.0131*** -0.0135*** (-3.996) (-3.702) (-3.870) (-3.835) (-3.672) (-3.127) (-3.800) Disclosure requirements 0.0065 (0.885) Anti-dir. rights index 0.0012 (1.027) Anti self-dealing index 0.0055 (0.961) Common law 0.0008 (0.278) Public enforcement -0.0002 (-0.069) Ln (Per capita GDP) -0.0003 (-0.284) Constant 0.0185*** 0.0135** 0.0136*** 0.0150*** 0.0182*** 0.0184*** 0.0215* (11.186) (2.485) (3.203) (4.496) (11.799) (10.259) (1.922) Observations 966 921 961 961 966 961 955 R-squared 0.010 0.010 0.010 0.011 0.010 0.010 0.010 Number of firms 966 921 961 961 966 961 955
28
Appendix A Summary statistics for country-level and firm-level variables
Panel A: By home market Variable Mean St. dev. 5% 25% Median 75% 95% Countries Disclosure requirements 0.62 0.20 0.25 0.50 0.58 0.75 0.92 38 Anti-director rights index 3.40 1.10 2.00 2.50 3.50 4.00 5.00 42 Anti self-dealing index 0.52 0.24 0.21 0.34 0.48 0.68 0.95 42 Common law 0.21 0.41 0.00 0.00 0.00 0.00 1.00 42 Public enforcement 0.44 0.42 0.00 0.00 0.50 1.00 1.00 42 Ln (per capita GDP) 9.34 1.17 7.11 8.54 9.70 10.24 10.61 41
Panel B: By country of incorporation Variable Mean St. dev. 5% 25% Median 75% 95% Countries Disclosure requirements 0.62 0.20 0.25 0.50 0.58 0.75 0.92 38 Anti-director rights index 3.40 1.10 2.00 2.50 3.50 4.00 5.00 42 Anti self-dealing index 0.52 0.24 0.21 0.34 0.48 0.68 0.95 42 Common law 0.28 0.45 0.00 0.00 0.00 1.00 1.00 49 Public enforcement 0.44 0.42 0.00 0.00 0.50 1.00 1.00 42 Ln (per capita GDP) 9.45 1.12 7.11 8.55 9.99 10.27 10.61 47
Panel C: Firm-level variables Variable Mean St. dev. 5% 25% Median 75% 95% Firms U.S. share of total volume 0.26 0.29 0.00 0.01 0.13 0.48 0.84 997 Foreign sales ratio 0.55 2.06 0.00 0.15 0.50 0.79 0.99 795 Sales growth rate (3-years) 0.29 0.56 -0.35 0.06 0.22 0.42 1.15 894 Capital expenditures ratio 0.06 0.07 0.00 0.02 0.04 0.09 0.18 992 Long-term debt ratio 0.17 0.19 0.00 0.03 0.14 0.26 0.45 992 Tobin’s q 1.77 2.21 0.82 1.02 1.25 1.78 3.86 991 Ln (total assets) 15.25 2.82 9.96 13.79 15.72 17.11 19.31 992 Ln (market capitalization) 14.73 2.40 10.03 13.35 15.31 16.39 17.85 992 Ownership concentration 31.38 25.40 0.11 9.22 26.31 52.23 78.28 913
29
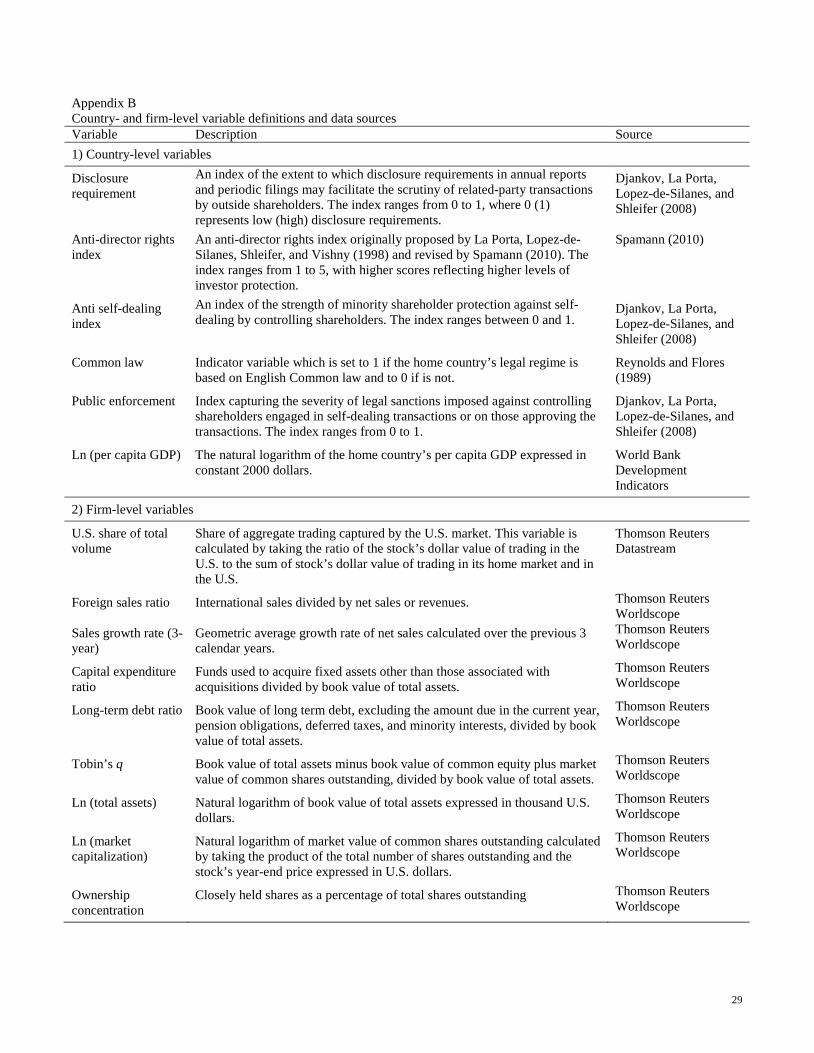
Appendix B Country- and firm-level variable definitions and data sources Variable Description Source 1) Country-level variables
Disclosure requirement
An index of the extent to which disclosure requirements in annual reports and periodic filings may facilitate the scrutiny of related-party transactions by outside shareholders. The index ranges from 0 to 1, where 0 (1) represents low (high) disclosure requirements.
Djankov, La Porta, Lopez-de-Silanes, and Shleifer (2008)
Anti-director rights index
An anti-director rights index originally proposed by La Porta, Lopez-de-Silanes, Shleifer, and Vishny (1998) and revised by Spamann (2010). The index ranges from 1 to 5, with higher scores reflecting higher levels of investor protection.
Spamann (2010)
Anti self-dealing index
An index of the strength of minority shareholder protection against self-dealing by controlling shareholders. The index ranges between 0 and 1.
Djankov, La Porta, Lopez-de-Silanes, and Shleifer (2008)
Common law Indicator variable which is set to 1 if the home country’s legal regime is based on English Common law and to 0 if is not.
Reynolds and Flores (1989)
Public enforcement Index capturing the severity of legal sanctions imposed against controlling shareholders engaged in self-dealing transactions or on those approving the transactions. The index ranges from 0 to 1.
Djankov, La Porta, Lopez-de-Silanes, and Shleifer (2008)
Ln (per capita GDP) The natural logarithm of the home country’s per capita GDP expressed in constant 2000 dollars.
World Bank Development Indicators
2) Firm-level variables
U.S. share of total volume
Share of aggregate trading captured by the U.S. market. This variable is calculated by taking the ratio of the stock’s dollar value of trading in the U.S. to the sum of stock’s dollar value of trading in its home market and in the U.S.
Thomson Reuters Datastream
Foreign sales ratio International sales divided by net sales or revenues. Thomson Reuters Worldscope
Sales growth rate (3-year)
Geometric average growth rate of net sales calculated over the previous 3 calendar years.
Thomson Reuters Worldscope
Capital expenditure ratio
Funds used to acquire fixed assets other than those associated with acquisitions divided by book value of total assets.
Thomson Reuters Worldscope
Long-term debt ratio Book value of long term debt, excluding the amount due in the current year, pension obligations, deferred taxes, and minority interests, divided by book value of total assets.
Thomson Reuters Worldscope
Tobin’s q Book value of total assets minus book value of common equity plus market value of common shares outstanding, divided by book value of total assets.
Thomson Reuters Worldscope
Ln (total assets) Natural logarithm of book value of total assets expressed in thousand U.S. dollars.
Thomson Reuters Worldscope
Ln (market capitalization)
Natural logarithm of market value of common shares outstanding calculated by taking the product of the total number of shares outstanding and the stock’s year-end price expressed in U.S. dollars.
Thomson Reuters Worldscope
Ownership concentration
Closely held shares as a percentage of total shares outstanding Thomson Reuters Worldscope