Embed Size (px)
Citation preview
UCLI I
The Production and use of cyclohexanone
monooxygenase for Baeyer-Villiger biotransformations
Scott Sinclair Barclay, BSc
A thesis submitted for the degree of
Doctor of Philosophy to the University of London
Supervisor - Dr. J. M. Woodley Industrial Supervisor - Dr. P. L. Spargo
The Advanced Centre for Biochemical Engineering Department of Biochemical Engineering
University College London Torrington Place, London
WC1E 7JE, UK
ProQuest Number: 10609398
All rights reserved
INFORMATION TO ALL USERS The quality of this reproduction is dependent upon the quality of the copy submitted.
In the unlikely event that the author did not send a com p le te manuscript and there are missing pages, these will be noted. Also, if material had to be removed,
a note will indicate the deletion.
uestProQuest 10609398
Published by ProQuest LLC(2017). Copyright of the Dissertation is held by the Author.
All rights reserved.This work is protected against unauthorized copying under Title 17, United States C ode
Microform Edition © ProQuest LLC.
ProQuest LLC.789 East Eisenhower Parkway
P.O. Box 1346 Ann Arbor, Ml 48106- 1346
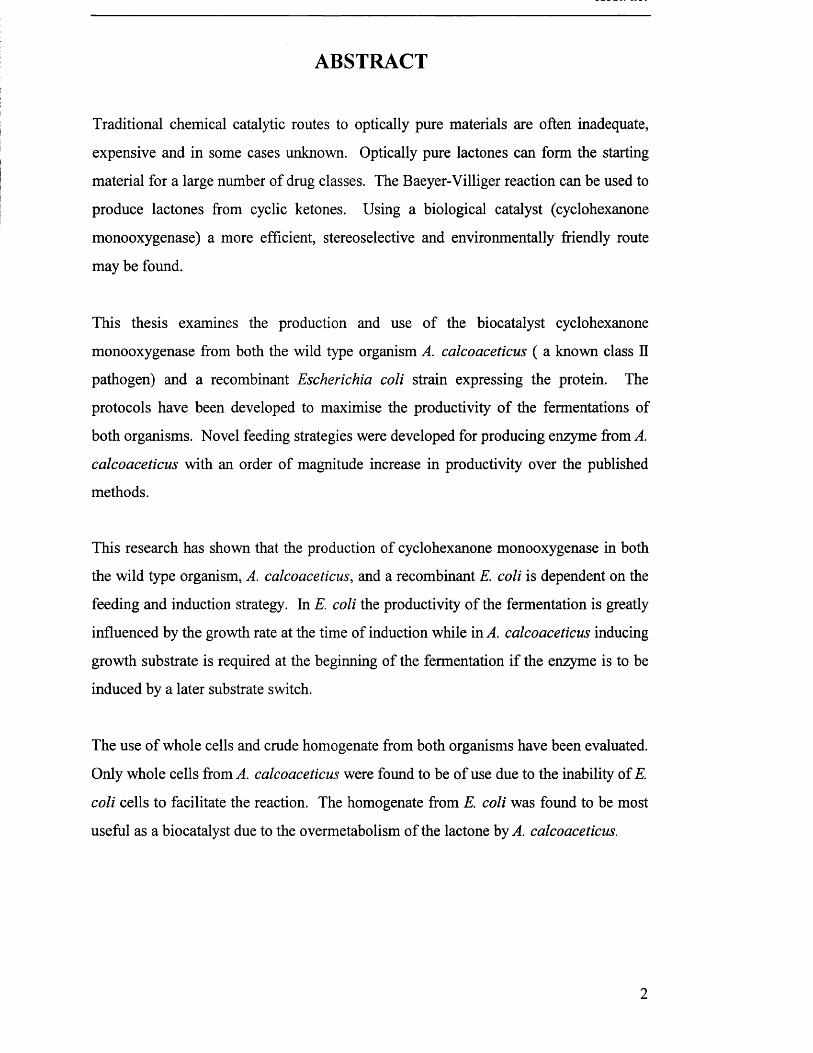
ABSTRACT
Traditional chemical catalytic routes to optically pure materials are often inadequate,
expensive and in some cases unknown. Optically pure lactones can form the starting
material for a large number of drug classes. The Baeyer-Villiger reaction can be used to
produce lactones from cyclic ketones. Using a biological catalyst (cyclohexanone
monooxygenase) a more efficient, stereoselective and environmentally friendly route
may be found.
This thesis examines the production and use of the biocatalyst cyclohexanone
monooxygenase from both the wild type organism A. calcoaceticus ( a known class II
pathogen) and a recombinant Escherichia coli strain expressing the protein. The
protocols have been developed to maximise the productivity of the fermentations of
both organisms. Novel feeding strategies were developed for producing enzyme from A.
calcoaceticus with an order of magnitude increase in productivity over the published
methods.
This research has shown that the production of cyclohexanone monooxygenase in both
the wild type organism, A. calcoaceticus, and a recombinant E. coli is dependent on the
feeding and induction strategy. In E. coli the productivity of the fermentation is greatly
influenced by the growth rate at the time of induction while in A. calcoaceticus inducing
growth substrate is required at the beginning of the fermentation if the enzyme is to be
induced by a later substrate switch.
The use of whole cells and crude homogenate from both organisms have been evaluated.
Only whole cells from A. calcoaceticus were found to be of use due to the inability of E.
coli cells to facilitate the reaction. The homogenate from E. coli was found to be most
useful as a biocatalyst due to the overmetabolism of the lactone by A. calcoaceticus.
2
ACKNOWLEDGEMENTS
I would like to take this opportunity to thank the people who have assisted me
during the course of this PhD project. Firstly my love and appreciation to Alan and Liz
without whose support and understanding I would never have been given the chance to
even begin.
To my supervisors Malcolm Lilly and John Woodley for all their advice and
encouragement. Malcolm is greatly missed by many, both personally and
professionally; his contribution to Biochemical engineering and enzyme technology
continues to be an inspiration.
I am grateful to all the members of the Baeyer-Villiger group both at UCL and
Exeter for all their help, especially Matt Hogan and Rachel Stones for their work with E.
coli biotransformations. Thanks also to Dr. Sejal Patel for producing the recombinant E
coli.
I acknowledge the support of the Biotechnology and Biological Sciences
Research Council and Pfizer Pharmaceuticals especially Dr. Peter Spargo and Alan
Pettman for all their assistance with organic chemistry (see I managed not to bum down
the labs after all!).
A special thanks for Dr. Kate Large for providing love and much needed
encouragement without whom this may never have been completed.
3
ABSTRACT.........................................................................................................................................................2
ACKNOWLEDGEMENTS.............................................................................................................................. 3
TABLE OF CONTENTS...................................................................................................................................4
LIST OF TABLES............................................................................................................................................. 8
LIST OF FIGURES........................................................................................................................................... 9
ABBREVIATIONS.......................................................................................................................................... 15
NOMENCLATURE......................................................................................................................................... 16
1 INTRODUCTION..................................................................................................................................17
1.1 B io t r a n s f o r m a t io n ............................................................................................................................................................17
1.1.2 Enzyme biotransformation..............................................................................................................18
1.2 T h e B a e y e r -V illig er o x id a t io n .................................................................................................................................18
1.2.1 General..............................................................................................................................................18
1.2.2 Mechanism .......................................................................................................................................19
1.2.2 Chemical methods............................................................................................................................20
1.2.3 Biological methods.......................................................................................................................... 20
1.3 B a e y e r -V illiger c a t a l y s t s ..........................................................................................................................................21
1.3.1 Range o f organisms..........................................................................................................................21
1.3.2 Baeyer- Villiger reactions using Pseudomonas putida ...............................................................23
1.3.3 Baeyer-Villiger reactions using Acinetobacter calcoaceticus NCIM B9871..........................27
1.3.4 Mechanism ........................................................................................................................................30
2 PROJECT RATIONALE.....................................................................................................................32
2.1 C h o ic e o f o r g a n is m ........................................................................................................................................................... 32
2 .2 C h o ic e o f s u b s t r a t e ..........................................................................................................................................................33
3 MATERIALS AND METHODS......................................................................................................... 37
3.1 A n a l y t ic a l m e t h o d s .........................................................................................................................................................37
3.1.1 Cell growth analysis........................................................................................................................ 57
3.1.2 Cyclohexanone monooxygenase activity assay........................................................................... 37
3.1.3 Protein assay.................................................................................................................................... 41
3.1.4 GC assay fo r reactants and products............................................................................................41
3 .2 E q u ip m e n t .................................................................................................................................................................................41
3.2.1 Chromatographic apparatus..........................................................................................................41
3.2.2 Spectroscopic apparatus................................................................................................................ 42
4
3.2.3 Fermentation equipment and analysis..........................................................................................42
3.2.4 Downstream processing equipment..............................................................................................43
3 .3 R e c o m b in a n t E. c o l i ........................................................................................................................................................43
3 .4 Fe r m e n t a t io n m e d ia ........................................................................................................................................................4 4
3 .5 M i c r o o r g a n is m s .................................................................................................................................................................45
3.5.1 Maintenance o f organisms..............................................................................................................45
3.5.2 Solid culture m edia ..........................................................................................................................45
3 .6 G r o w t h o f A c in e t o b a c t e r c a l c o a c e t i c u s .......................................................................................................... 45
3.6.1 M edia .................................................................................................................................................45
3.6.2 Shake flask growth ...........................................................................................................................46
3.6.3 Batch fermentation ...........................................................................................................................47
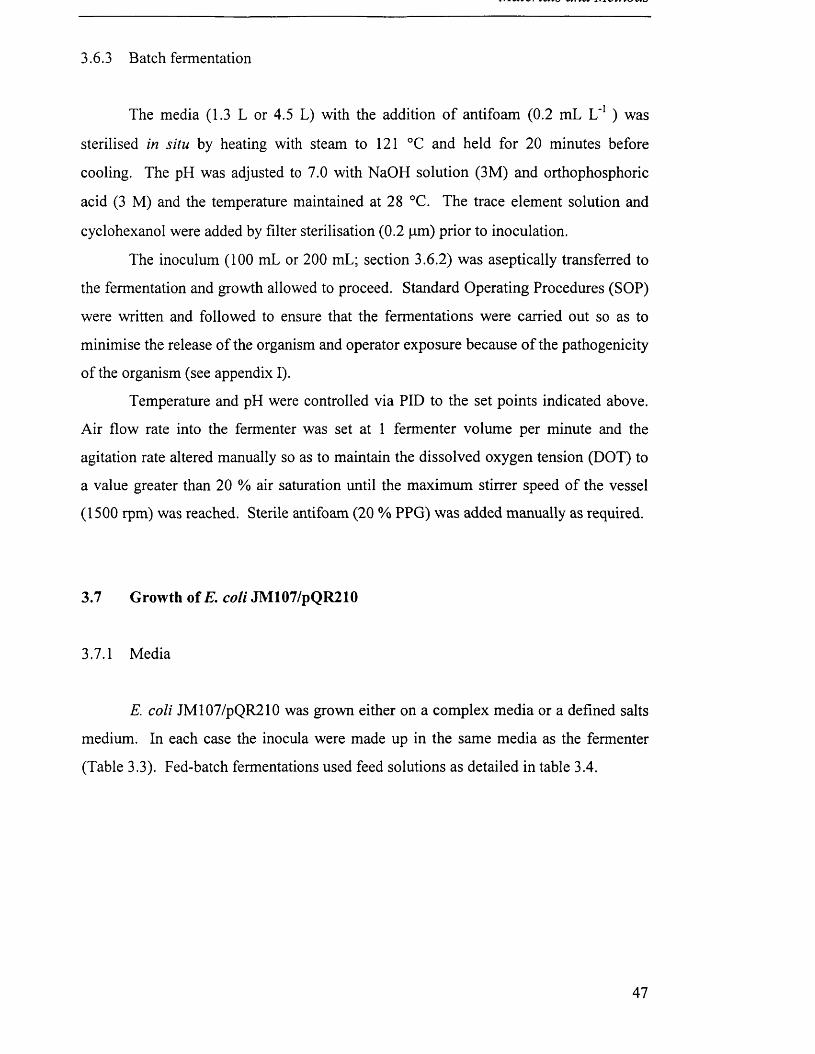
3 .7 G r o w t h o f J M 10 7 /P Q R 2 10 .............................................................................................................................................. 4 7
3.7.1 M edia .................................................................................................................................................47
3.7.2 Shake flask growth ...........................................................................................................................49
3.7.3 Batch fermentation ...........................................................................................................................49
3.7.4 Fed-batch fermentation ...................................................................................................................50
3.7.5 Plasmid stability...............................................................................................................................51
3 .8 D o w n s t r e a m p r o c e s sin g m e t h o d s ........................................................................................................................... 51
3.8.1 Preparation o f crude extract by sonication..................................................................................51
3.8.2 Preparation o f crude extract by Lab 40 homogenisation.......................................................... 52
3.8.3 Storage and stability o f cells..........................................................................................................52
3.8.4 Storage and stability o f homogenate.............................................................................................52
3 .9 B io t r a n s f o r m a t io n s ......................................................................................................................................................... 53
3.9.1 Whole cell biotransformations....................................................................................................... 53
3.9.2 Homogenate biotransformations................................................................................................... 53
3 .1 0 Ch e m ic a l S y n t h e s e s .................................................................................................................................................. 54
3.10.1 Literature M ethod ............................................................................................................................54
3.10.2 Developed method............................................................................................................................55
4 RESULTS.................................................................................................................................................58
4.1 C y c l o h e x a n o n e m o n o o x y g e n a s e a s s a y .............................................................................................................58
4 .2 G r o w t h o f A c in e t o b a c t e r c a l c o a c e t ic u s ....................................................................................................... 61
4.2.1 Growth on cyclohexanol.................................................................................................................61
4.2.2 Production o f biomass on sodium succinate............................................................................... 65
4.2.3 Production o f biomass on monosodium glutamate.................................................................... 65
4.2.4 Diauxic growth investigation.........................................................................................................70
4.2.5 Production o f CHMO ...................................................................................................................... 70
4 .3 G r o w t h o f E s c h e r ic h ia c o l i JM 107/P Q R 21 0 .................................................................................................... 77
4.3.1 Carbon source investigation.......................................................................................................... 77
5
4.3.2 IPTG concentration investigation................................................................................................. 77
4.3.3 Plasmid retention during shake flask fermentations................................................................80
4.3.4 Growth on complex medium ........................................................................................................... 80
4.3.5 Growth on defined medium ............................................................................................................ 87
4 .4 In d u c t io n o f c y c l o h e x a n o n e m o n o o x y g e n a s e ..............................................................................................91
4.4.1 Batch fermentation .......................................................................................................................... 91
4.4.2 Batch fermentation with supplementation...................................................................................91
4.4.3 Fed batch exponential feed ing .................................................................................................... 101
4.4.4 Fed batch linear feed ing .............................................................................................................. 108
4 .5 S t a b i l i t y o f s t o r e d c a t a l y s t s ................................................................................................................................. 115
4.5.1 Whole cells...................................................................................................................................... 115
4.5.2 Homogenate................................................................................................................................... 115
4 .6 B i o t r a n s f o r m a t i o n s - w h o l e c e l l A c in e t o b a c t e r c a l c o a c e t ic u s ................................................. 119
4.6.2 Bioti'ansformation o f 2-ethyl cyclopentanone...........................................................................119
4.6.3 Biotransformation o f 4-methyl cyclohexanone.........................................................................120
4 .1 B i o t r a n s f o r m a t i o n - A c in e t o b a c t e r c a l c o a c e t ic u s h o m o g e n a t e ................................................127
4.7.1 Biotransformations o f 4-methyl cyclohexanone........................................................................127
4.7.2 Biotransformation o f 2-methyl cyclohexanone.........................................................................131
4 .8 B io t r a n s f o r m a t i o n s - w h o l e c e l l E sc h e r ic h ia c o l i ................................................................................ 131
4 .9 B io t r a n s f o r m a t i o n s - e s c h e r ic h ia . c o l i h o m o g e n a t e ............................................................................131
5 DISCUSSION........................................................................................................................................ 139
5.1 B i o c a t a l y s t p r o d u c t io n in A c in e t o b a c t e r c a l c o a c e t i c u s ................................................................. 139
5.1.1 Carbon source investigation........................................................................................................139
5.1.2 CHMO production ........................................................................................................................ 141
5 .2 B i o c a t a l y s t p r o d u c t io n in Es c h e r ic h ia c o l i .................................................................................................144
5.2.1 Over expression o f CHMO in an Escherichia coli construct...................................................144
5.2.2 Plasmid stability.............................................................................................................................145
5.2.3 IPTG concentration....................................................................................................................... 145
5.2.4 Growth and production o f CHMO on complex m edia .............................................................146
5.2.5 Initial study o f growth and production o f CHMO on defined m edia ....................................147
5.2.6 Development o f fed-batch fermentation .....................................................................................150
5.2.7 Constant growth rate.....................................................................................................................151
5.2.8 Constant feed rate ..........................................................................................................................153
5.3 S t a b il it y o f s t o r e d c a t a l y s t s .................................................................................................................................155
5.3.1 Whole cells......................................................................................................................................155
5.3.2 Homogenate................................................................................................................................... 156
5 .4 B i o t r a n s f o r m a t i o n - A. c a l c o a c e t ic u s W h o le c e l l s ............................................................................. 157
5.4.1 Stability o f CHMO activity during biotransformations........................................................... 157
6
5.4.2 Cyclohexanone..............................................................................................................................158
5.4.3 2-ethyl cyclopentanone................................................................................................................158
5.4.4 4-methyl cyclohexanone.............................................................................................................. 159
5.5 B i o t r a n s f o r m a t i o n - E. c o l i W h o l e c e l l ....................................................................................................160
5 .6 B i o t r a n s f o r m a t i o n - A. c a l c o a c e t ic u s h o m o g e n a t e ...................................................................................161
5 .7 B i o t r a n s f o r m a t i o n - E. c o n h o m o g e n a t e ...................................................................................................163
5 .8 Su m m a r y ................................................................................................................................................................................164
6 CONCLUSIONS AND FURTHER WORK............................................................................................ 169
6.1 C o n c l u s i o n .......................................................................................................................................................................... 169
6 .2 F u r t h e r W o r k ..................................................... 171
7 APPENDICES......................................................................................................................... 173
A p p e n d ix 1 ...........................................................................................................................................................................................173
A p p e n d ix I I ......................................................................................................................................................................................... 181
A ppenddc III........................................................................................................................................................................................184
8 REFERENCES ....................................................................................................................... 186
7
LIST OF TABLES
Table 3.1 Suppliers of the fermentation media and the grade used. 44
Table 3.2 Mineral media constituents for A. calcoaceticus fermentation 46
Table 3.3 Composition of culture media for JM107/pQR210. 48
Table 3.4 Composition of feed solutions 1-4 used in fed-batch 49
fermentations of JM 107/pQR210.
Table 4.1 Summary of growth of Acinetobacter in shake flasks 62
Table 4.2 Effect of cyclohexanol as co-growth substrate on CHMO 70
production.
Table 4.3 Plasmid stability of E. coli JM107/pQR210 in shake flasks. 80
Table 5.1 Summary of carbon source investigation 142
Table 5.2 Summary of biocatalyst production 164
8
LIST OF FIGURES
Figure 1.1 The Baeyer-Villiger reaction 19
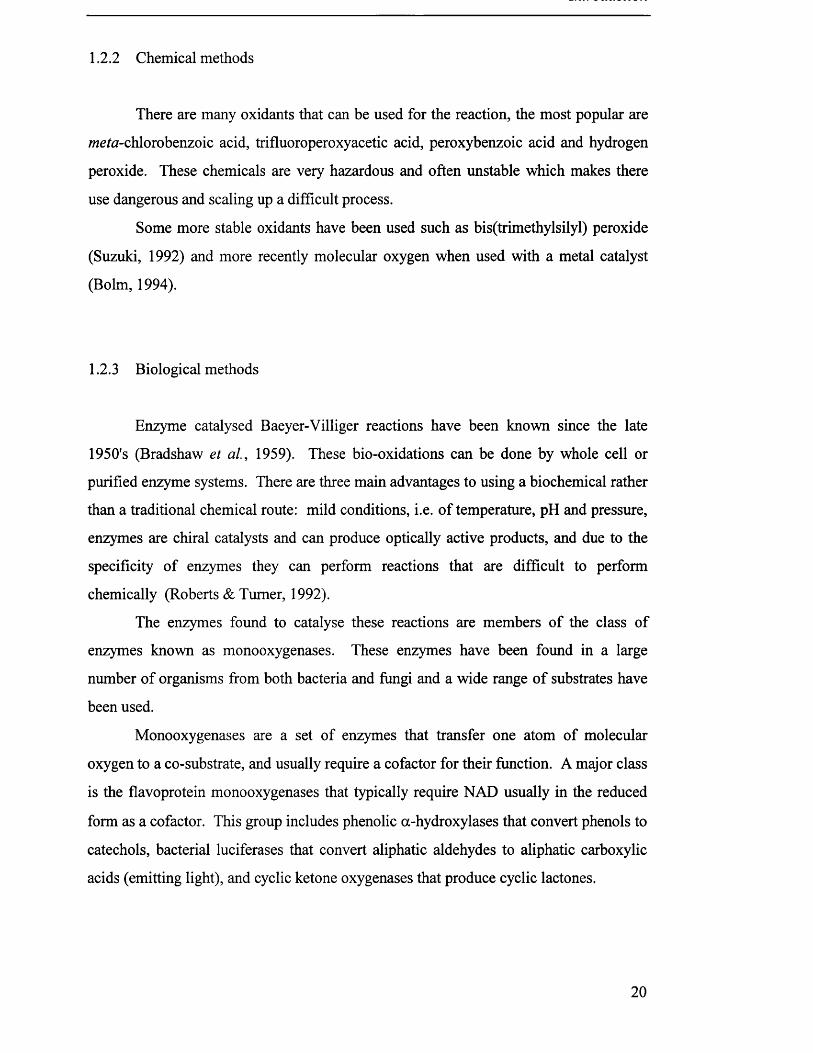
Figure 1.2 Mechanism of the Baeyer-Villiger reaction 19
Figure 1.3 The Baeyer-Villiger oxidation of sulphides 23
Figure 1.4 Baeyer-Villiger oxidation of 4-thiocyclohexanone 23
Figure 1.5 Biooxidation of norbanone 25
Figure 1.6 Recycle of NADPH by linkage to alcohol dehydrogenase 26
Figure 1.7 Recycle of NADPH by linkage to G-6-P dehydrogenase 26
Figure 1.8 Metabolic pathway of cyclohexanol in Acinetobacter 27
calcoaceticus
Figure 1.9 Biooxidation of fenchone 28
Figure 1.10 Baeyer-Villiger oxidation of bicyclo[3.2.0]hept-2-en-6-one 29
Figure 1.11 Proposed mechanism of action of cyclohexanone 31
monooxygenase
Figure 2.1 Baeyer-Villiger oxidation of 2-(2',4',7'-trioxaoctyl) 34
cyclopentanone
Figure 2.2 Methyl l,4-dioxaspiro[4.4]nonane-6-carboxylate 35
Figure 3.1 Correlation between optical density and dry cell 38
weight for A. calcoaceticus
Figure 3.2 Correlation between optical density and dry cell weight 39
for E. Coli JM107/pQR210
Figure 3.3 Methyl l,4-dioxaspiro[4.4]nonane-6-carboxylate 54
Figure 3.4 2-hydroxymethyl cyclopentanone 55
9
Figure 3.5
Figure 3.6
Figure 4.1
Figure 4.2
Figure 4.3
Figure 4.4
Figure 4.5
Figure 4.6
Figure 4.7
Figure 4.8
Figure 4.9
Figure 4.10
Figure 4.11
Synthesis of 2-(2',4',7'-trioxaoctyl)cyclopentanone 56
Synthesis of 6-(2',4',7'-trioxaoctyl)tetrahydropyran-2-one 57
Errors at low volume handling of enzyme preparation 59
Initial rate of background NADPH oxidation in CHMO 60
activity assay.
Biomass production in 2L fed batch fermentation of 63
A. calcoaceticus on cyclohexanol.
Biomass production in 2L fed batch fermentation 64
of A. calcoaceticus on cyclohexanol.
Biomass production in 2L batch fermentation of 66
A. calcoaceticus on succinate.
Biomass production in 2L batch fermentation 67
of A. calcoaceticus on succinate
Biomass production in 2L batch fermentation 68
of A. calcoaceticus on glutamate.
Biomass production in 2L batch fermentation 69
of A. calcoaceticus on glutamate
Fermentation profile for 7 L batch fermentation of 72
A. calcoaceticus.
Productivity of 7L batch fermentation of 73
A. calcoaceticus.
Fermentation profile for 7 L batch fermentation of 74
A. calcoaceticus.
10
Figure 4.12 Productivity of 7 L batch fermentation of Acinetobacter 75
calcoaceticus.
Figure 4.13 Productivity of 7 L batch fermentation of Acinetobacter 16
calcoaceticus
Figure 4.14 Expression of CHMO in recombinant E. coli in shake flasks. 78
Figure 4.15 Effect of IPTG concentration on CHMO induction in 79
shake flasks.
Figure 4.16 Fermentation profile for 7 L batch fermentation of 82
JM107/pQR210 on complex medium.
Figure 4.17 Productivity of 7 L batch fermentation of JM107/pQR210. 83
Figure 4.18 Productivity of 7 L batch fermentation of JM107/pQR210 84
Figure 4.19 Fermentation profile for 7 L batch fermentation of 85
JM107/pQR210 with oxygen limitation.
Figure 4.20 Productivity of 7 L batch fermentation of JM 107/pQR210 86
with oxygen limitation.
Figure 4.21 Fermentation profile for 7 L batch fermentation of 88
JM107/pQR210 on defined medium.
Figure 4.22 Biomass production in 7 L batch fermentation of 89
JM107/pQR210 on defined medium.
Figure 4.23 Biomass production in 7 L batch fermentation of 90
JM 107/pQR210 on defined medium
Figure 4.24 Fermentation profile for 7 L batch fermentation of 91
JM107/pQR210 on defined medium with induction of CHMO.
11
Figure 4.25
Figure 4.26
Figure 4.27
Figure 4.28
Figure 4.29
Figure 4.30
Figure 4.31
Figure 4.32
Figure 4.33
Figure 4.34
Figure 4.35
Figure 4.36
Productivity of batch fermentation of JM 107/pQR210 93
on defined medium with induction of CHMO.
Biomass production in batch fermentation of JM 107/pQR210 94
on defined medium with induction of CHMO
Fermentation profile for 7 L batch fermentation of 95
JM107/pQR210 on defined medium with induction of CHMO.
Productivity of batch fermentation of JM 107/pQR210 96
on defined medium with induction of CHMO.
Biomass production in batch fermentation of JM 107/pQR210 97
on defined medium with induction of CHMO
Fermentation profile for 7 L batch fermentation of 98
JM107/pQR210 on defined medium with media supplementation.
Productivity of 7 L batch fermentation of JM 107/pQR210 99
on defined medium with supplementation.
Biomass production in 7 L batch fermentation of 100
JM107/pQR210 on defined medium with supplementation
Fermentation profile for 7 L fed batch fermentation of 102
JM107/pQR210.
Productivity of 7 L fed batch fermentation of JM 107/pQR210. 103
Biomass production in 7 L fed batch fermentation of 104
JM107/pQR210
Fermentation profile for 7 L fed batch fermentation of 105
JM107/pQR210.
12
106
107
109
110
111
112
113
114
116
117
118
121
122
123
Productivity of 7 L fed batch fermentation of JM107/pQR210.
Biomass production in 7 L fed batch fermentation of
JM107/pQR210
Fermentation profile for 7 L exponential then linear fed
batch fermentation of JM107/pQR210
Productivity of 7 L fed batch fermentation of JM107/pQR210.
Biomass production in 7 L fed batch fermentation of
JM107/pQR210
Fermentation profile for 7 L linear fed batch fermentation
of JM107/pQR210.
Productivity of 7 L fed batch fermentation of JM107/pQR210.
Biomass production in 7 L fed batch fermentation of
JM107/pQR210
Stability of CHMO activity in Acinetobacter cells stored
at -18 °C.
Stability of CHMO activity in E. coli cells stored at -18 °C.
Stability of CHMO activity in clarified homogenate of
Escherichia coli.
Biotransformation of cyclohexanone by whole cell
A. calcoaceticus.
Specific activity of cyclohexanone monooxygenase during
a cyclohexanone biotransformation.
Biotransformation of 2-ethyl cyclopentanone by whole cell
A. calcoaceticus.
Figure 4.51
Figure 4.52
Figure 4.53
Figure 4.54
Figure 4.55
Figure 4.56
Figure 4.57
Figure 4.58
Figure 4.59
Figure 4.60
Figure 4.61
Figure 4.62
Figure 5.1
Specific activity of cyclohexanone monooxygenase during 124
a 20 mM 2-ethyl cyclopentanone biotransformation.
Biotransformation of 20 mM 4-methyl cyclohexanone, 125
with cyclohexanol co-substrate, by whole cell A. calcoaceticus.
Biotransformation of 20 mM 4-methyl cyclohexanone, 126
with cyclohexanol co-substrate, by whole cell A. calcoaceticus.
Biotransformation of 4-methyl cyclohexanone by 128
A. calcoaceticus homogenate.
Biotransformation of 20 mM 4-methyl cyclohexanone by 129
A. calcoaceticus homogenate with cyclohexanol cosubstrate.
Stability of CHMO in A. calcoaceticus homogenate. 130
Biotransformation of 20 mM 2-methyl cyclohexanone 133
by A. calcoaceticus homogenate with isatoic anhydride.
Biotransformation of 20 mM 2-ethyl cyclopentanone by 134
whole cell E. coli.
Biotransformation of 20 mM 2-methyl cyclohexanone by 135
E. coli homogenate
Biotransformation of 20 mM 2-methyl cyclohexanone by 136
E. coli homogenate
Comparison between A. calcoaceticus and E. coli 137
homogenate biotransformation of 2-methyl cyclohexanone.
Comparison between A calcoaceticus and E. coli 138
homogenate biotransformation of 2-methyl cyclohexanone
Carbon sources for A. calcoaceticus 142
14
ABBREVIATIONSNAD Nicotinamide adenine dinucleotideR & S Absolute conformation of isomerse.e. Enantiomeric excessNADH Nicotinamide adenine dinucleotide (reduced form)NADPH Nicotinamide adenine dinucleotide phosphate (reduced
form)FMN Flavin mononucleotideG GlucoseP PhosphateFAD Flavin adenine dinucleotideTEPP Tetraethyl pyrophosphatem Multiplets Singlett Tripletd Doubletdd Double doubletbr Broad peakMe MethylTHF Tetrahydrafuran°C Degrees centigradeHC1 Hydrochloric acidRf Relative retention timeDCM DichloromethanemmHg millimetres of mercuryGC Gas chromatographyTLC Thin layer chromatographyUV Ultra violet(*H) designates proton NMRE coli Escherichia coliAnalR Analytical reagentGLR General laboratory reagentM molar concentrationSOP Standard operating procedurePID Proportional Integral DerivativePPG Polypropylene glycolmol MolesCHMO Cyclohexanone monooxygenaseIPT G Isopropyl- (3 -D-thiogalactopyranosideT ris T ris(hydroxymethyl)aminomethaneBSA Bovine serum albumin1 Light pathOD Optical densitygdc Grams of dry cellslac Lactose operontac hybrid lactose and tryptophan operon
15
NOMENCLATURE
OUR Oxygen uptake rate mmole L'1 min'CER Carbon evolution rate mmole L'1 min'RQ Respiratory quotient CER/OURDOT Dissolved oxygen tension % saturation
Specific growth rate h '1F Feed rate g h ’1Y g ly Yield on glycerol g g '1
g L '1X Dry biomass concentrationV Fermenter volume LSf Glycerol concentration gL ’1X Wavelength nmU Units of enzyme activity pmol min'1AA Change in absorbance8 Extinction coefficientrpm Revolutions per minute
gL*1dew Dry cell weight
16
1 INTRODUCTION
1.1 Biotransformation
1.1.1 Whole cell biotransformation
Biotransformation is the chemical modification of a compound using a
biological catalyst, which may be an enzyme or whole cell, to facilitate the reaction. In
the case of an enzyme this might be a highly purified protein or simply a cell extract,
while the whole cell may be actively growing or 'resting' in buffered solution.
The use of biotransformation is becoming increasingly recognised as an
important tool in organic synthesis for a wide range of reactions (Jones, 1986; Davies et
al., 1990; Faber, 1992). The specific nature of bio-reactions means that
biotransformations can be used as an alternative to traditional methods and to facilitate
reactions not currently possible through chemistry (Roberts and Turner, 1992).
Developments in protein and genetic engineering allow manipulation of catalysts
to improve both activity and stability of the catalyst. Protein engineering can be used to
increase catalytic activity and stability, while genetic engineering can achieve greater
expression of the enzyme or produce overexpression in a recombinant organism that is
more convenient to handle, often E. coli (Hanna, 1987, Prentis, 1984).
Whole cells are probably the most commonly used biocatalysts because of their
more robust nature and the lack of purification required prior to use (Lilly, 1977). There
can however be some significant problems associated with this.
17
One of the major problems is the possibility of further metabolism of the product
caused by the required enzyme being part of a pathway. The product of the required
reaction may in turn be a substrate for the next enzyme in the pathway (Faber, 1992).
In some cases this can be catastrophic for product yield and in others merely introduce
by-products that must be removed, often with difficulty, in downstream processing.
1.1.2 Enzyme biotransformation
Pure or practically pure enzymes may be used to catalyse reactions with very
good specificity and high yields. The formation of by-products can be kept to a
minimum and product recovery therefore simple. Problems with the stability of the
enzyme during the reaction may be encountered (Faber, 1992) and if the presence of
cofactors are required in stoichiometric quantities they may become prohibitively
expensive (Roberts and Willetts, 1993).
Cofactor recycling systems have been used successfully but this adds to the
complexity of a multi-enzyme system.
1.2 The Baeyer-Villiger oxidation
1.2.1 General
The Baeyer-Villiger reaction can be described as the transformation of a ketone
to an ester, or a cyclic ketone to a lactone using an oxidant such as a peroxy acid (Figure
1.1) (Baeyer and Villiger, 1899). This reaction is very important in organic synthesis
and has been much studied (Krow, 1981).
18
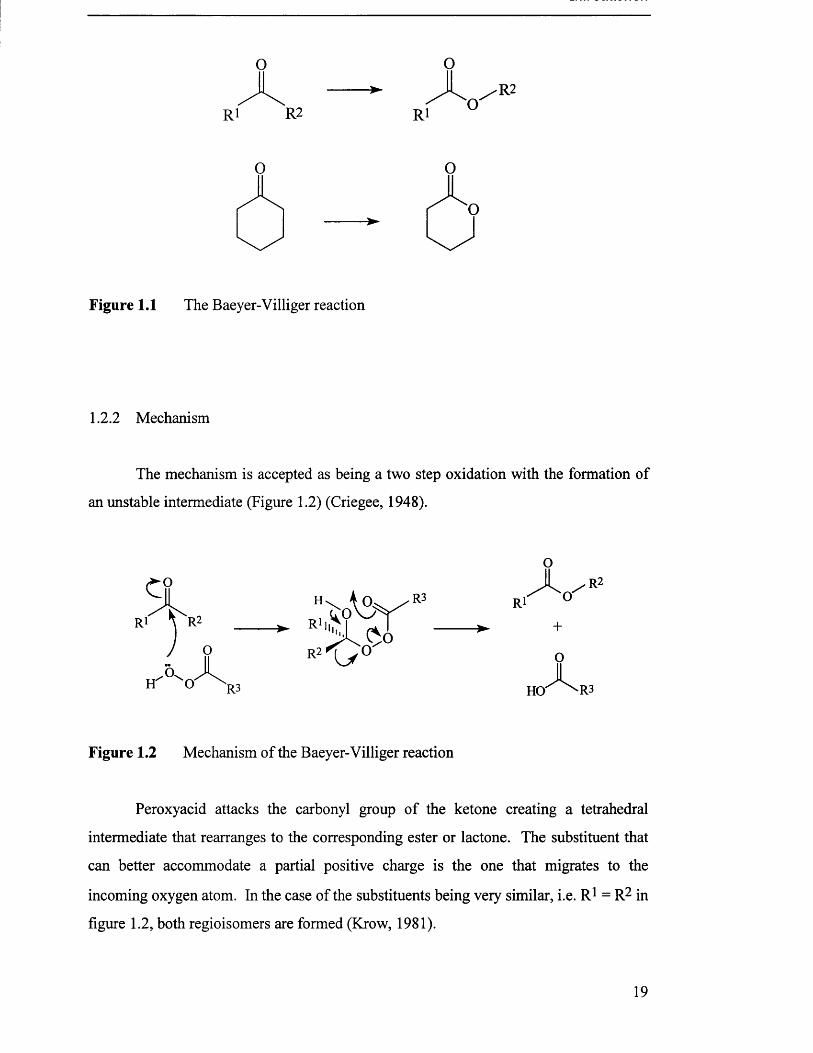
Figure 1.1 The Baeyer-Villiger reaction
1.2.2 Mechanism
The mechanism is accepted as being a two step oxidation with the formation of
an unstable intermediate (Figure 1.2) (Criegee, 1948).
O
/ R2H. W /R ? K’T 0+Ri' ̂ R2 _______^ R i i,t< 9
f R2 V ° oH" 0 ^ \ R3 H O ^ R 3
Figure 1.2 Mechanism of the Baeyer-Villiger reaction
Peroxyacid attacks the carbonyl group of the ketone creating a tetrahedral
intermediate that rearranges to the corresponding ester or lactone. The substituent that
can better accommodate a partial positive charge is the one that migrates to the
incoming oxygen atom. In the case of the substituents being very similar, i.e. R1 = R2 in
figure 1.2, both regioisomers are formed (Krow, 1981).
19
1.2.2 Chemical methods
There are many oxidants that can be used for the reaction, the most popular are
mefa-chlorobenzoic acid, trifluoroperoxyacetic acid, peroxybenzoic acid and hydrogen
peroxide. These chemicals are very hazardous and often unstable which makes there
use dangerous and scaling up a difficult process.
Some more stable oxidants have been used such as bis(trimethylsilyl) peroxide
(Suzuki, 1992) and more recently molecular oxygen when used with a metal catalyst
(Bolm, 1994).
1.2.3 Biological methods
Enzyme catalysed Baeyer-Villiger reactions have been known since the late
1950's (Bradshaw et al., 1959). These bio-oxidations can be done by whole cell or
purified enzyme systems. There are three main advantages to using a biochemical rather
than a traditional chemical route: mild conditions, i.e. of temperature, pH and pressure,
enzymes are chiral catalysts and can produce optically active products, and due to the
specificity of enzymes they can perform reactions that are difficult to perform
chemically (Roberts & Turner, 1992).
The enzymes found to catalyse these reactions are members of the class of
enzymes known as monooxygenases. These enzymes have been found in a large
number of organisms from both bacteria and fungi and a wide range of substrates have
been used.
Monooxygenases are a set of enzymes that transfer one atom of molecular
oxygen to a co-substrate, and usually require a cofactor for their function. A major class
is the flavoprotein monooxygenases that typically require NAD usually in the reduced
form as a cofactor. This group includes phenolic a-hydroxylases that convert phenols to
catechols, bacterial luciferases that convert aliphatic aldehydes to aliphatic carboxylic
acids (emitting light), and cyclic ketone oxygenases that produce cyclic lactones.
20
1.3 Baeyer-Villiger catalysts
1.3.1 Range of organisms
Many organisms that have been used for Baeyer-Villiger type reactions are
Xanthobacter autotrophicus NCIMB 10811 and other species (Magor et al., 1976) and
it has been found that although the enzymes catalyse the same reaction, i.e. the insertion
of molecular oxygen into the carbon ring, there are marked differences in both
regioselectivity and enantiospecificity depending on the catalyst used (Wright et al.,
1994).
There has also been work by groups exploring the use of actinomycete species
notably Corynebacterium that have been found to be diastereo-selective and
enantioselective in the oxidation of p methyl secondary alcohols. This organism has
also been used to produce the cortisone derivative prednisolone (Ohta et al., 1986).
During the 1980's many researchers began to screen large numbers of organisms
for transformation ability including a large number of fungi. Cylindrocarpon radicicola
was found to produce enzymes that acted on a number of steroids to produce the
corresponding lactones (Itagaki, 1986). Other work with Cylindrocarpon radicicola has
shown that this organism is capable of producing Baeyer-Villiger reactions with bicyclic
ketones (Konigsberger et a l , 1990). These workers discovered problems with volatility
of products that made yields very difficult to ascertain.
Other problems that they encountered were caused by the presence of other
enzymes, mainly hydrolases, that resulted in acid production. Enantioselectivity was not
reported for the majority of the substrates tested and was only limited on others when
compared to later work with A. calcoaceticus using similar substrates.
Camell and Willetts (1990) undertook a screening programme, after work by
Ouazzani-Chahdi (1987) showed that the fungus Curvularia lunata could give
enantioselective degradation of racemic (R,S)-2,2,5,5-tetramethyl-l,4-hydroxy-
cyclohexanone to produce optically pure (R)-ketone and (S)-lactone, to find other fungi
with similar properties. The rationale was that filamentous fungi would make
downstream processing far simpler. Twenty nine organisms from thirteen genera were
tested. They were all grown on complex media and racemic bicyclo[3.2.0]hept-2-en-6-
21
one added directly, i.e. no special induction mechanism was used. Most later work with
Acinetobacter calcoaceticus and Pseudomonas putida involved growth on substrates
with an enzyme inducing carbon source and then the addition of the reaction substrate.
Camell and Willetts (1990) found that certain fungi, especially C. lunata, would
produce both regioisomers in equal amounts both in enantiomeric excesses of
approximately 70%, when the substrate was fully utilised, and both regioisomers in the
ratio of 5:1 after 70% conversion. These results showed that the isomers were produced
at different rates although no reasons were postulated at this time.
In a later paper (Camell and Willetts, 1992) they showed that a variation in
products is possible from a racemic starting material when different species of
Curvularia were used. These experiments showed that one enantiomer of each
regioisomer was produced in greater quantity and this was most often the (-)3-oxa and
(-)2-oxa lactones from bicyclo[3.2.0]hept-2-en-6-one. One example however gave an
e.e. of 68% for the (-)3-oxa lactone but produced racemic 2-oxa-lactone, highlighting
the difference the organism can make to the selectivity of the biotransformation of
optically active chemicals.
Much interest has been shown by a number of workers in the use of
cyclohexanone monooxygenase to produce sulphoxides (Figure 1.3) (Ryerson et al.,
1982; Pasta et al., 1995). High enantiomeric excesses have been reported, with the
structure of the sulphide being a determining factor in the enantioselectivity with
products reported to range from e.e. 99% (R) to e.e. 93% (S) when using the same
enzyme (Carrea et al., 1992; Pasta et a l, 1995; Secundo et al., 1993).
22
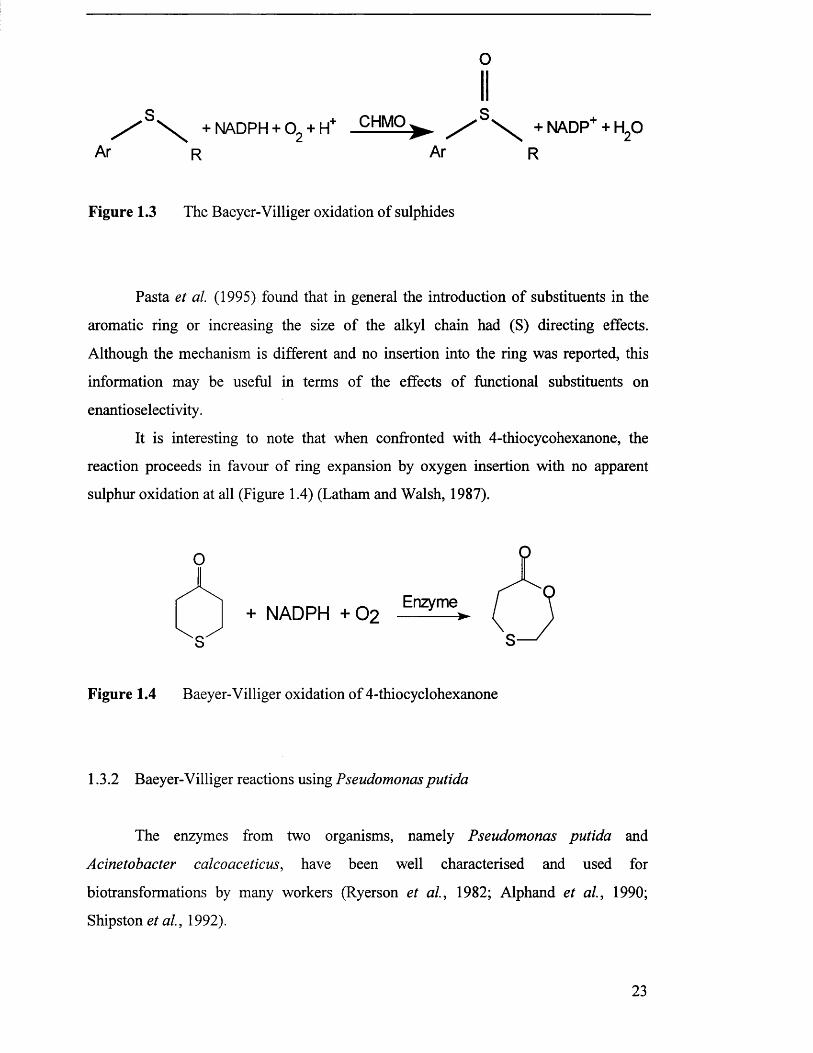
Z ' ' \ + NADPH+ 0 2 + H,+ CHMO^ X . + NADP+ + H20Ar Ar R
Figure 1.3 The Baeyer-Villiger oxidation of sulphides
Pasta et al. (1995) found that in general the introduction of substituents in the
aromatic ring or increasing the size of the alkyl chain had (S) directing effects.
Although the mechanism is different and no insertion into the ring was reported, this
information may be useful in terms of the effects of functional substituents on
enantioselectivity.
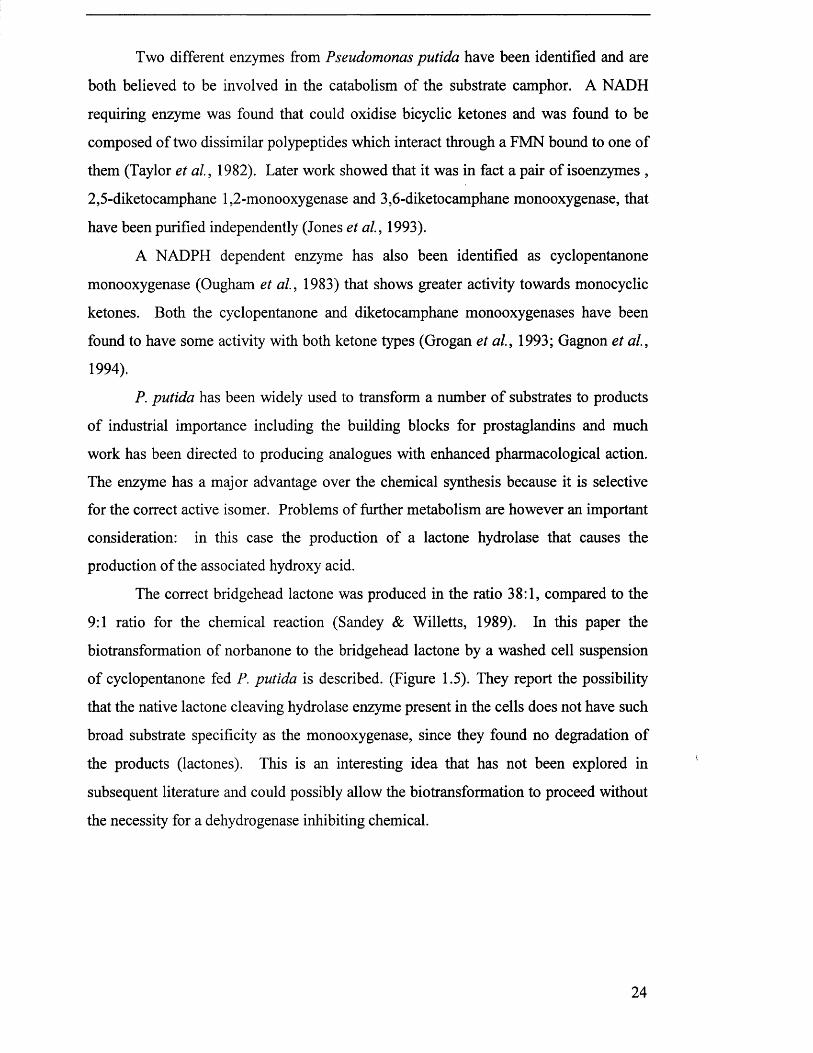
It is interesting to note that when confronted with 4-thiocycohexanone, the
reaction proceeds in favour of ring expansion by oxygen insertion with no apparent
sulphur oxidation at all (Figure 1.4) (Latham and Walsh, 1987).
Figure 1.4 Baeyer-Villiger oxidation of 4-thiocyclohexanone
1.3.2 Baeyer-Villiger reactions using Pseudomonas putida
The enzymes from two organisms, namely Pseudomonas putida and
Acinetobacter calcoaceticus, have been well characterised and used for
biotransformations by many workers (Ryerson et al., 1982; Alphand et a l, 1990;
Shipston et al., 1992).
O
Enzyme
O
+ NADPH +02
Two different enzymes from Pseudomonas putida have been identified and are
both believed to be involved in the catabolism of the substrate camphor. A NADH
requiring enzyme was found that could oxidise bicyclic ketones and was found to be
composed of two dissimilar polypeptides which interact through a FMN bound to one of
them (Taylor et a l , 1982). Later work showed that it was in fact a pair of isoenzymes ,
2,5-diketocamphane 1,2-monooxygenase and 3,6-diketocamphane monooxygenase, that
have been purified independently (Jones et al., 1993).
A NADPH dependent enzyme has also been identified as cyclopentanone
monooxygenase (Ougham et al., 1983) that shows greater activity towards monocyclic
ketones. Both the cyclopentanone and diketocamphane monooxygenases have been
found to have some activity with both ketone types (Grogan et a l , 1993; Gagnon et a l,
1994).
P. putida has been widely used to transform a number of substrates to products
of industrial importance including the building blocks for prostaglandins and much
work has been directed to producing analogues with enhanced pharmacological action.
The enzyme has a major advantage over the chemical synthesis because it is selective
for the correct active isomer. Problems of further metabolism are however an important
consideration: in this case the production of a lactone hydrolase that causes the
production of the associated hydroxy acid.
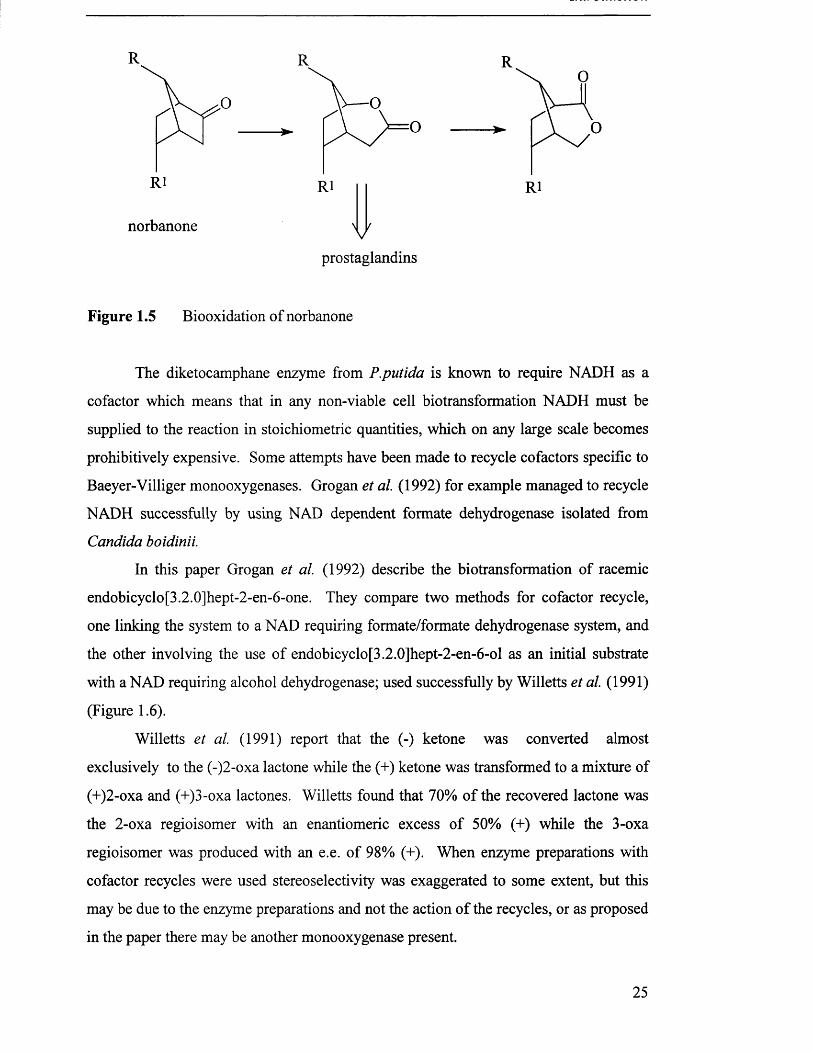
The correct bridgehead lactone was produced in the ratio 38:1, compared to the
9:1 ratio for the chemical reaction (Sandey & Willetts, 1989). In this paper the
biotransformation of norbanone to the bridgehead lactone by a washed cell suspension
of cyclopentanone fed P. putida is described. (Figure 1.5). They report the possibility
that the native lactone cleaving hydrolase enzyme present in the cells does not have such
broad substrate specificity as the monooxygenase, since they found no degradation of
the products (lactones). This is an interesting idea that has not been explored in
subsequent literature and could possibly allow the biotransformation to proceed without
the necessity for a dehydrogenase inhibiting chemical.
24
R
R1
R
norbanone
Ri
=0
Rl
prostaglandins
Figure 1.5 Biooxidation of norbanone
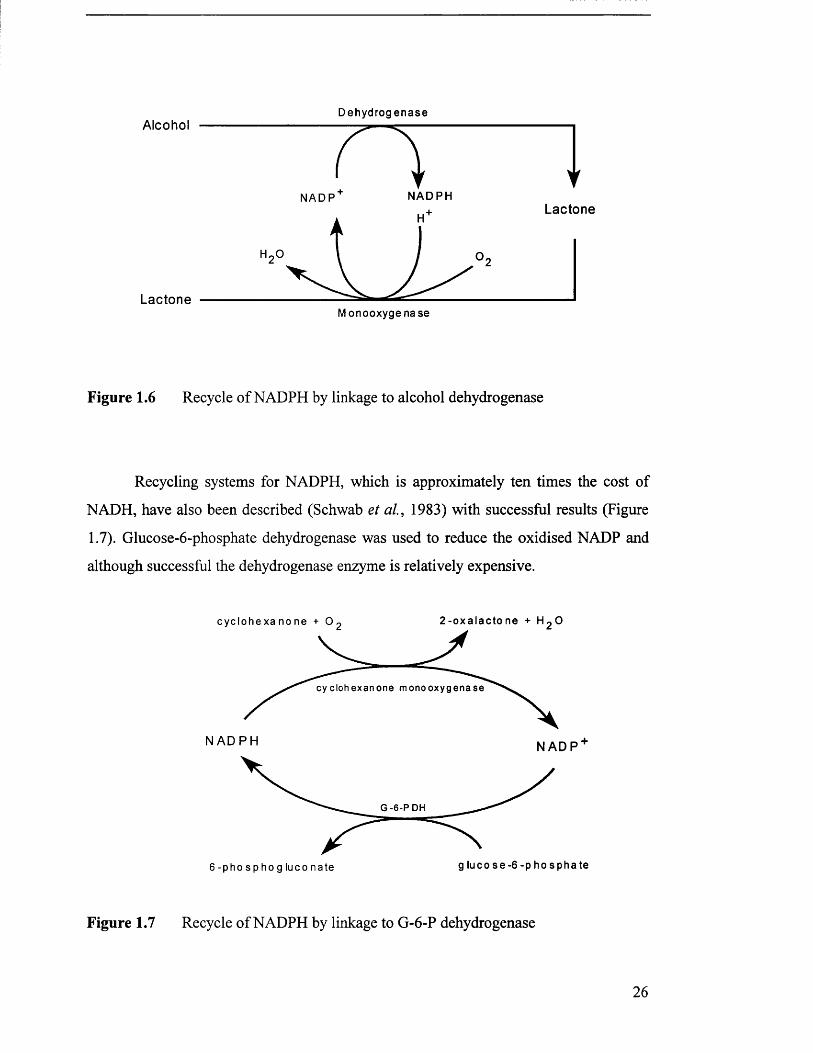
The diketocamphane enzyme from P.putida is known to require NADH as a
cofactor which means that in any non-viable cell biotransformation NADH must be
supplied to the reaction in stoichiometric quantities, which on any large scale becomes
prohibitively expensive. Some attempts have been made to recycle cofactors specific to
Baeyer-Villiger monooxygenases. Grogan et al. (1992) for example managed to recycle
NADH successfully by using NAD dependent formate dehydrogenase isolated from
Candida boidinii.
In this paper Grogan et al. (1992) describe the biotransformation of racemic
endobicyclo[3.2.0]hept-2-en-6-one. They compare two methods for cofactor recycle,
one linking the system to a NAD requiring formate/formate dehydrogenase system, and
the other involving the use of endobicyclo[3.2.0]hept-2-en-6-ol as an initial substrate
with a NAD requiring alcohol dehydrogenase; used successfully by Willetts et al (1991)
(Figure 1.6).
Willetts et al. (1991) report that the (-) ketone was converted almost
exclusively to the (-)2-oxa lactone while the (+) ketone was transformed to a mixture of
(+)2-oxa and (+)3-oxa lactones. Willetts found that 70% of the recovered lactone was
the 2-oxa regioisomer with an enantiomeric excess of 50% (+) while the 3-oxa
regioisomer was produced with an e.e. of 98% (+). When enzyme preparations with
cofactor recycles were used stereoselectivity was exaggerated to some extent, but this
may be due to the enzyme preparations and not the action of the recycles, or as proposed
in the paper there may be another monooxygenase present.
25
De h y dr og en a se
N A D P H
H +
N A D PL actone
L actoneM on o o x y g e n a se
Figure 1.6 Recycle of NADPH by linkage to alcohol dehydrogenase
Recycling systems for NADPH, which is approximately ten times the cost of
NADH, have also been described (Schwab et a l , 1983) with successful results (Figure
1.7). Glucose-6-phosphate dehydrogenase was used to reduce the oxidised NADP and
although successful the dehydrogenase enzyme is relatively expensive.
c y c l o h e x a n o n e + O
cy c lo h e x a n o n e m o n o o x y g e n a s e
N A D P H N A D P
G- 6 - PD H
glu c o s e - 6 - p h o s p h a t e6 - p h o s p h o g l u c o n a t e
Figure 1.7 Recycle of NADPH by linkage to G-6-P dehydrogenase
26
1.3.3 Baeyer-Villiger reactions using Acinetobacter calcoaceticus NCIMB9871
The enzyme from A. calcoaceticushas a molecular weight of approximately
59,000 and is a single polypeptide chain with one molecule of FAD bound to it firmly
enough to insure that it does not dissociate during purification (Donoghue et al., 1976).
It is described as cyclohexanone monooxygenase and is believed to be part of the
metabolic pathway in the biodegradation of cyclohexane present in fossil fuels. This
part of the pathway gives the biodegradation of cyclohexanol to lactone then subsequent
hydrolysis to 6-hydroxyhexanoate, followed by oxidation to adipate (Donoghue and
Trudgill, 1975) and p-oxidation to acetyl coenzyme A and succinyl coenzyme A (Figure
1.8) (Chapman & Duggleby, 1967).
OH
cyclohexanol
NAD NADP
cyclohexanoldehydrogenase
cyclohexanonemonooxygenase
cyclohexanone 1 oxa-2oxocycloheptane
lactonase
COO’ NADPH2 NADP c o o - COO" V J S ' CHO
NADH2 NAD
H20
adipate
p-oxidation
dehydrogenase
COO'
► c h 2 I
c h 2 +
c=oI
s —CoAsuccinyl coenzyme A
dehydrogenase
COO'c h 2o
6-oxohexanoate6-hydroxyhexanoate
CH3ic=oI
S — CoAacetyl coenzyme A
Figure 1.8 Metabolic pathway of cyclohexanol in Acinetobacter calcoaceticus.
Reproduced from Donoghue and Trudgill, 1975 and Chapman & Duggleby, 1967.
27
The regioselectivity and enantioselectivity of the cyclohexanone monooxygenase
from Acinetobacter calcoaceticus NCIB9871 have been shown by many workers.
Taschner and Black (1988) transformed a number of substituted cyclohexanones
including non chiral para substituted compounds to form chiral products. Abril and co
workers (1989) found a number of substrates that were transformed by enzyme
preparations with some regioselectivity a good example being fenchone which was
transformed to 1,2-fencholide and 2,3-fencholide in an 8:1 ratio (Figure 1.9), although
this shows good regioselectivity they concluded that no advantage is to be gained over
the chemical route in terms of enantioselectivity.
L-fenchone
O
1,2-fencholide 2,3-fencholid<
Figure 1.9 Biooxidation of fenchone
It has been shown that the enzyme system using whole washed cells of A.
calcoaceticus can achieve a reaction equivalent to the chemical one and offer significant
regioselective advantage, in this case however no information is given on
enantioselectivity (Levitt et al., 1990).
Alphand et al (1990) used whole cells to produce the enantiopure pheromone 5-
hexadecanolide. They found that the lactone product reached a maximum yield of 10%
and then was found to disappear. The action of a lactone hydrolase as previously
reported known to have 27 times the activity of the monooxygenase (Donoghue et al.,
1975; Schwab et al. 1983) was proposed as the cause and investigated. Using TEPP
(tetraethyl pyrophosphate) to block the action of dehydrogenase they found that the
product reached a yield of 40 %. They discovered that only one regioisomer was formed
as expected by the normal rules of the reaction, i.e. the oxygen atom is inserted into the
28
ring between the ketyl and the most substituted carbon atom. Only one enantiomer was
transformed to produce the (+) lactone while ketone of the (-) form was recovered with
95% e.e.
Selectivity was further explored by Shipston et a l (1992) where racemic
bicyclo[3.2.0]hept-2-en-6-one (Figure 1.10) was transformed and the production of the
four possible products monitored. It was discovered that yields were lower i.e. lactone
yield dropped from 98% to 67% when whole cells rather than enzyme preparations were
used as has been reported in earlier work where the presence of a lactone dehydrogenase
causes break down of the lactone product (Schwab et al., 1983). However the relative
amounts of each lactone were found to be very similar indicating that the lactone
dehydrogenase is most likely not stereo or regio selective. In both cases the
regioisomers were produced in approximately equal amounts with the (-)2-oxa and
(-)3-oxa lactones produced in high (94%) e.e. which is markedly different from the
results achieved with P.pntida where the (+)2 and (+)3-oxa lactones were produced in
high e.e., and the relative amounts of the two regioisomers were different.
H H O
+
H
'hi
Figure 1.10 Baeyer-Villiger oxidation of bicyclo[3.2.0]hept-2-en-6-one
The biotransformation was repeated using individual enantiomers of the starting
ketone and it was shown that the (+)ketone was transformed to (-)2-oxa lactone (99.8%
e.e.) whilst (-) ketone was transformed more slowly to (-)3-oxa lactone (100% e.e.)
(Shipston et a l, 1992). These results show a very high stereoselectivity but no
regioselectivity from racemic starting material. Earlier work by Alphand et al (1989)
show similar results while other workers have shown that from essentially the same
conditions the reaction proceeds with a good degree of regioselectivity to produce the
29
(-)2-oxa and (-)3-oxa regioisomers in a 9:1 ratio. There is no evidence to explain these
differences in the biotransformation although differences in the time of harvesting the
cells prior to the biotransformation may have an effect due to the presence of lactase and
dehydrogenase enzymes.
Many of these workers showed that, in the case of bicyclic ketones at least, the
substitutions affect both regio and enantioselectivity. Camell et a l (1991) showed that
depending on the substitution good regio with poor enantio, good regio and enantio or
poor regio and good enantioselectivity could be observed. These results show that the
starting material could be manipulated to produce the required selectivity.
1.3.4 Mechanism
Work by Ryerson et al. (1982) on cyclohexanone monooxygenase from A.
calcoaceticusshowed that NADPH was consumed at the same rate as oxygen and this
together with other experimental evidence is given as proof that NADPH oxidation was
fully coupled to substrate oxygenation. They describe the mechanism as one where a
4a-peroxyflavin complex is formed as this would explain the capability of the enzyme
to deliver both electrophilic and nucleophilic oxygen.
Braunchaud and Walsh (1985) showed from a wide range of substrates that the
enzyme was capable of delivering nucleophilic oxygen to substrates such as
cyclohexanone and butyraldehyde and electrophilic oxygen to a wide range of sulphides.
There studies also show the similarity between the action of the enzyme and that of the
classical model based on peroxide chemistry.
Alphand and Furstoss (1992) proposed a model representing the active site as a
cube with stereoselectivity imposed by a forbidden zone within the cube. Tashner's
model (Taschner et al., 1992) is based on a similar theory with the formation of a
hydroperoxyflavin complex. Neither of these models allow for the wide range of
substrates that have been observed especially the sulphide oxidation. This lack of
flexibility in the model lead Ottolina et al. (1995) to propose a variation where the
spatial arrangement of active sites allows not only for the insertion of oxygen into a
30
Introduction
wide variety of cyclic and bicyclic ketones and the observation that each enantiomer
tends to produce one regioisomer but also the oxidation of sulphides.
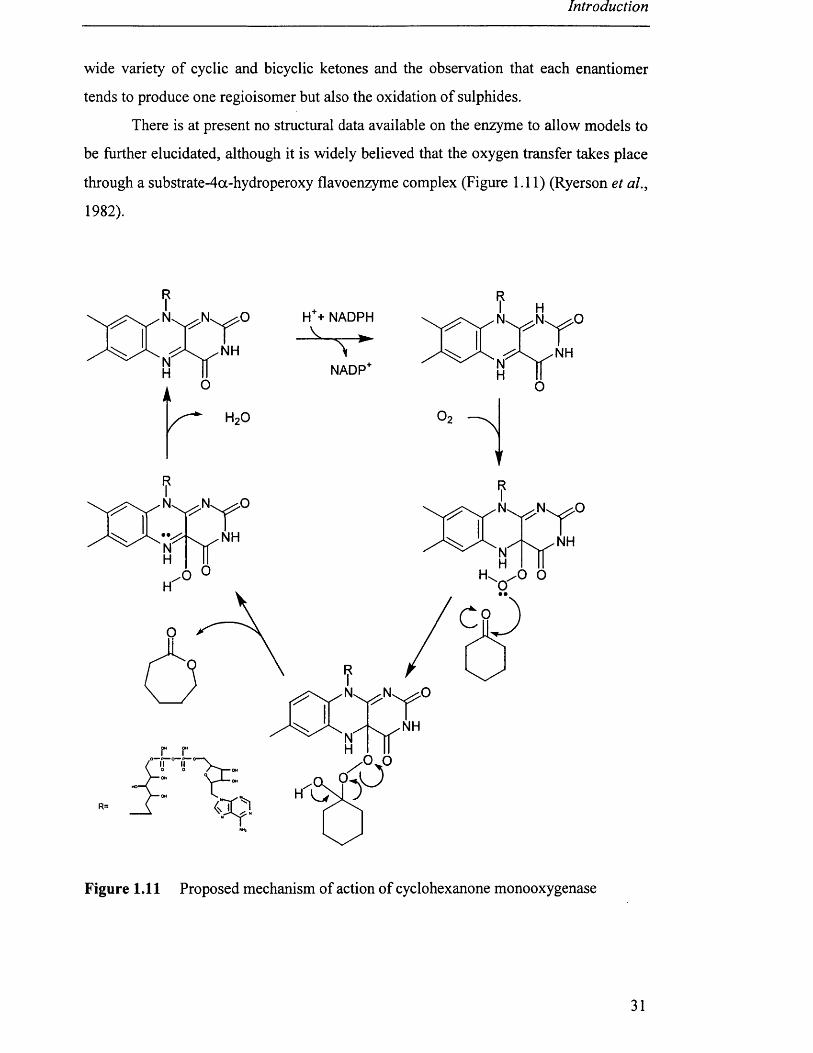
There is at present no structural data available on the enzyme to allow models to
be further elucidated, although it is widely believed that the oxygen transfer takes place
through a substrate-4oc-hydroperoxy flavoenzyme complex (Figure 1.11) (Ryerson et al.,
1982).
nY nY °
Nk
H + NADPH
NADP
Figure 1.11 Proposed mechanism of action of cyclohexanone monooxygenase
31
Project Rationale
2 Project rationale
2.1 Choice of organism
This research was carried out in order to investigate the production of a
biocatalyst in the wild type organism and a recombinant E. coli expressing the
biocatalyst. This thesis aims to identify the important factors in the production of the
biocatalyst from the wild type and the recombinant organisms and to produce rules for
biocatalyst production that have wider applicability.
While the use of both whole cells and enzyme preparations have been used for
Baeyer-Villiger oxidations there is little data concerning direct comparisons. Data from
whole cell and homogenate biotransformations will also be gathered. The process of
biocatalyst production and use will be examined as a whole, and the factors identified
which allow an informed choice of route.
This project is concerned with the production of biocatalyst for use in the
transformation of cyclic ketones into lactones. The Baeyer-Villiger monooxygenase
from Acinetobacter calcoaceticus has been produced in both the wild type organism and
in a recombinant E. coli expressing the protein..
Despite the fact that the enzyme from A. calcoaceticus requires an expensive
cofactor (NADPH) and is known to be a class two pathogen it was decided that this
should be the organism and enzyme for study for two main reasons
The enzyme has been well studied and many successful biotransformations have
been recorded. As mentioned earlier the enzyme from A. calcoaceticus is a single
polypeptide sequence which made subsequent cloning and overexpression in E. coli
easier to achieve. A recombinant should eliminate the possibility of product degradation
32
Project Rationale
by lactone dehydrogenase as the host organism is unlikely to have enzymes capable of
utilising these compounds as substrates. This method also allows for the use of an
inducing agent specified by the promoter cloned with the CHMO gene. This would
allow the cells to be grown on a nutrient media to achieve good growth. The gene
encoding for CHMO could then be induced by chemical addition and not by growth on
cyclohexanol which gives poor growth.
The second factor that influenced the choice is the future possibility of
immobilising the enzyme. Immobilising an enzyme that a requires a coenzyme can
create many problems on its own without the added complication of having a multi
subunit enzyme such as the monooxygenase from P. putida.
2.2 Choice of substrate
As can be seen from the literature the majority of work with this enzyme
concerning regio and enantioselectivity has been carried out using various bicyclic
ketones, the diversity of which is wide (Taschner and Peddada, 1992) . A simple
molecule that would give the same selectivity was considered to be required if the
reaction was to be performed on a larger scale. Taschner et a l (1993) describe the
production of optically active lactones from a range of asymmetrically substituted
cyclohexanones with most showing a high degree of enantioselectivity typically above
98%. However they do not report the relative amounts of the regioisomers produced or
any regioselectivity
Far less work has been reported on cyclopentanones, however the
biotransformation of various 2 substituted cyclopentanones has been described (Alphand
et al., 1990). They discovered that as the length of aliphatic chain increased and the
molecule became more hydrophobic, the yield of lactone increased. Alphand et al.
(1990) also found that the addition of 1,2-cyclohexanediol increased yields of the
shorter chain substituted lactones but decreased yields of the longer ones. They propose
that the 1,2-cyclohexanediol acts as a substrate for a separate metabolic pathway and
hence competes with the ketone increasing yields of lactone. Enantiomeric excess
however behaves in the opposite manner, decreasing as chain length increases. They
33
Project Rationale
expected that e.e. would fall after 50% conversion as the other enantiomer was used but
this was not observed, and postulate that the second metabolic pathway uses up the
ketone that is not used for lactone production while neither forming nor consuming
lactone.
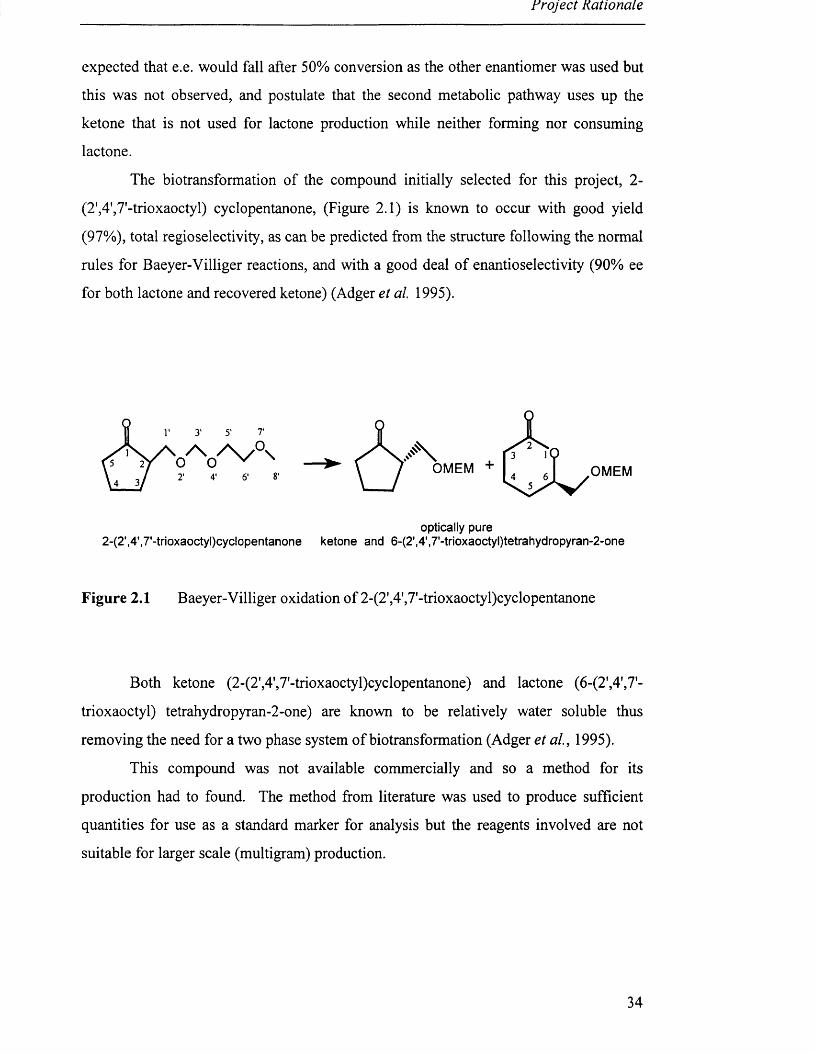
The biotransformation of the compound initially selected for this project, 2-
(2',4',7'-trioxaoctyl) cyclopentanone, (Figure 2.1) is known to occur with good yield
(97%), total regioselectivity, as can be predicted from the structure following the normal
rules for Baeyer-Villiger reactions, and with a good deal of enantioselectivity (90% ee
for both lactone and recovered ketone) (Adger et al 1995).
r 3. 5, T
/ \ / \ s ° \O O '2 ' 4 ' 6 ' 8 '
OMEM + OMEM
optically pure2-(2,,4',7'-trioxaoctyl)cyclopentanone ketone and 6-(2,,4,,7,-trioxaoctyl)tetrahydropyran-2-one
Figure 2.1 Baeyer-Villiger oxidation of 2-(2',4,,7'-trioxaoctyl)cyclopentanone
Both ketone (2-(2',4',7'-trioxaoctyl)cyclopentanone) and lactone (6-(2',4',7'-
trioxaoctyl) tetrahydropyran-2-one) are known to be relatively water soluble thus
removing the need for a two phase system of biotransformation (Adger et al., 1995).
This compound was not available commercially and so a method for its
production had to found. The method from literature was used to produce sufficient
quantities for use as a standard marker for analysis but the reagents involved are not
suitable for larger scale (multigram) production.
34
rro ject Kationale
After the initial production of this compound it was found that scaling up the
reaction would prove to be problematic. It was decided that the production of similar
compounds would prove to be equally difficult because of the reagents involved, the
cost and the amount of time it would take to manufacture.
A substrate would have to be found that was available commercially. Although
the substrates available were not as substituted and hence would not show the same
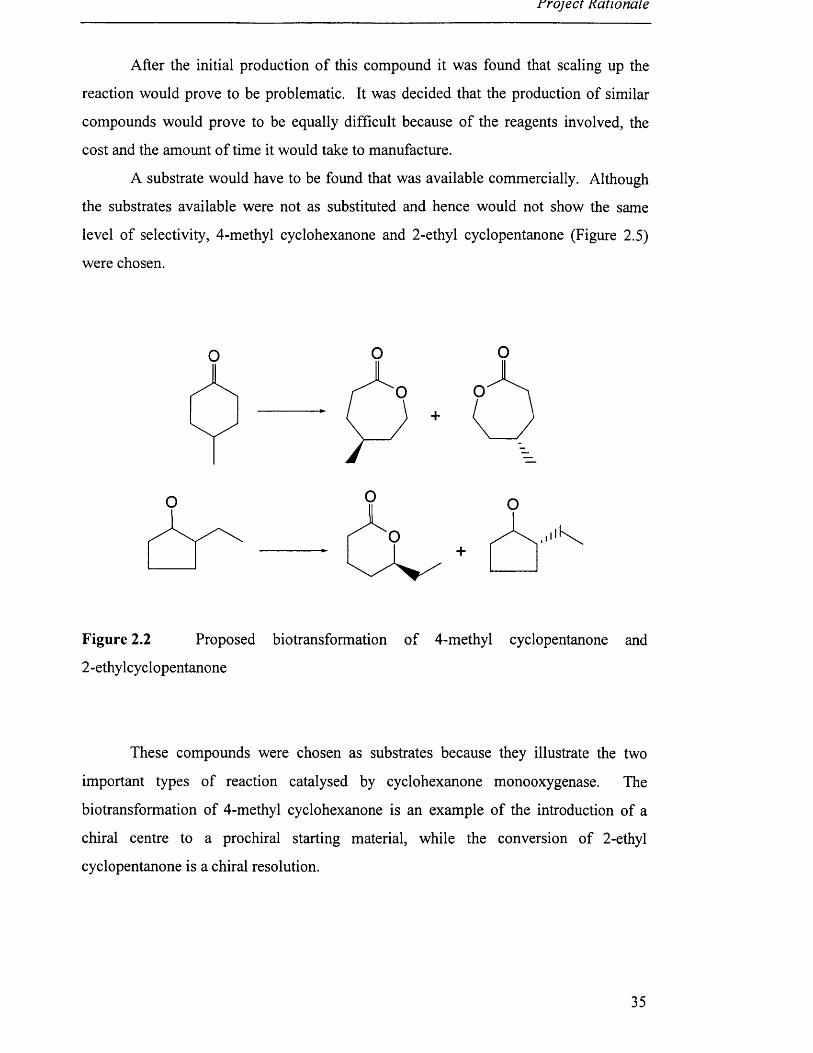
level of selectivity, 4-methyl cyclohexanone and 2-ethyl cyclopentanone (Figure 2.5)
were chosen.
O O o
o
o
o
o
Figure 2.2 Proposed biotransformation of 4-methyl cyclopentanone and
2 -ethylcyclopentanone
These compounds were chosen as substrates because they illustrate the two
important types of reaction catalysed by cyclohexanone monooxygenase. The
biotransformation of 4-methyl cyclohexanone is an example of the introduction of a
chiral centre to a prochiral starting material, while the conversion of 2-ethyl
cyclopentanone is a chiral resolution.
35
Project Rationale
After performing biotransformations using these substrates it was found that the
chiral GC column could not discriminate between the enantiomers of substituted
cyclopentanones. This meant that the selectivity could not be measured. The column
was however capable of separating the enantiomers of substituted cyclohexanones. For
this reason 2-methyl cyclohexanone (which was available commercially) was substituted
for 2-ethyl cyclopentanone in later biotransformations.
36
Materials ana Metnoas
3 MATERIALS AND METHODS
3.1 Analytical methods
3.1.1 Cell growth analysis
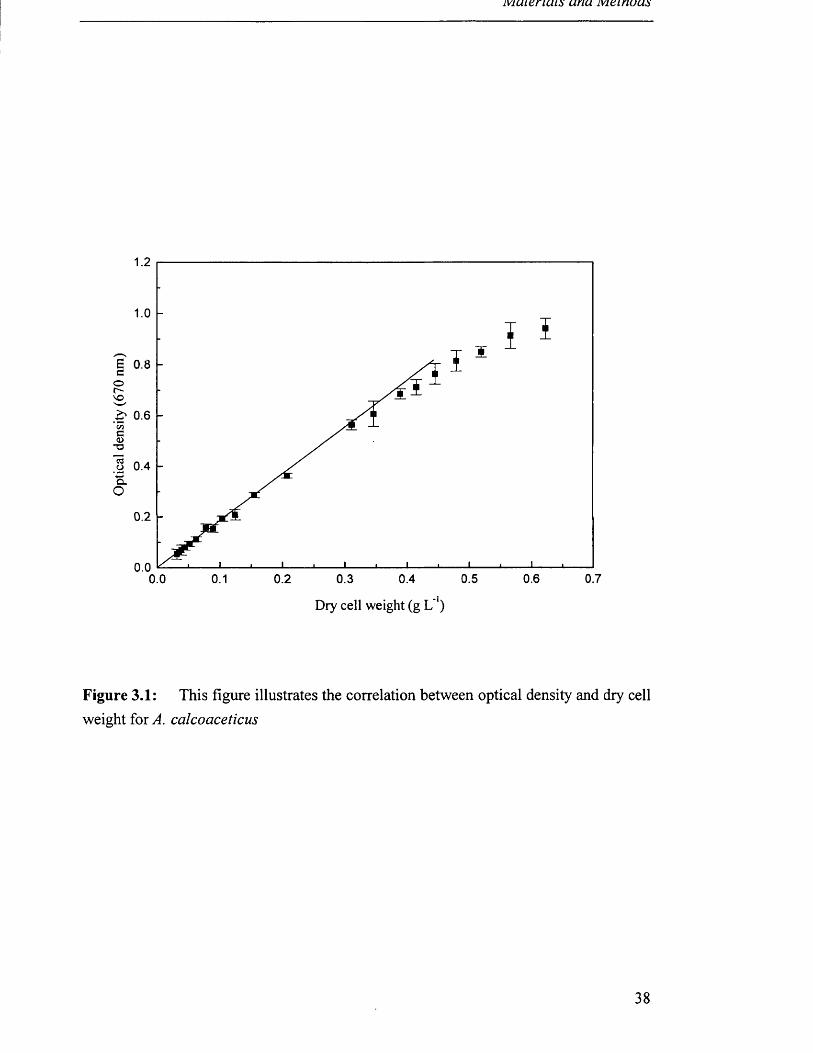
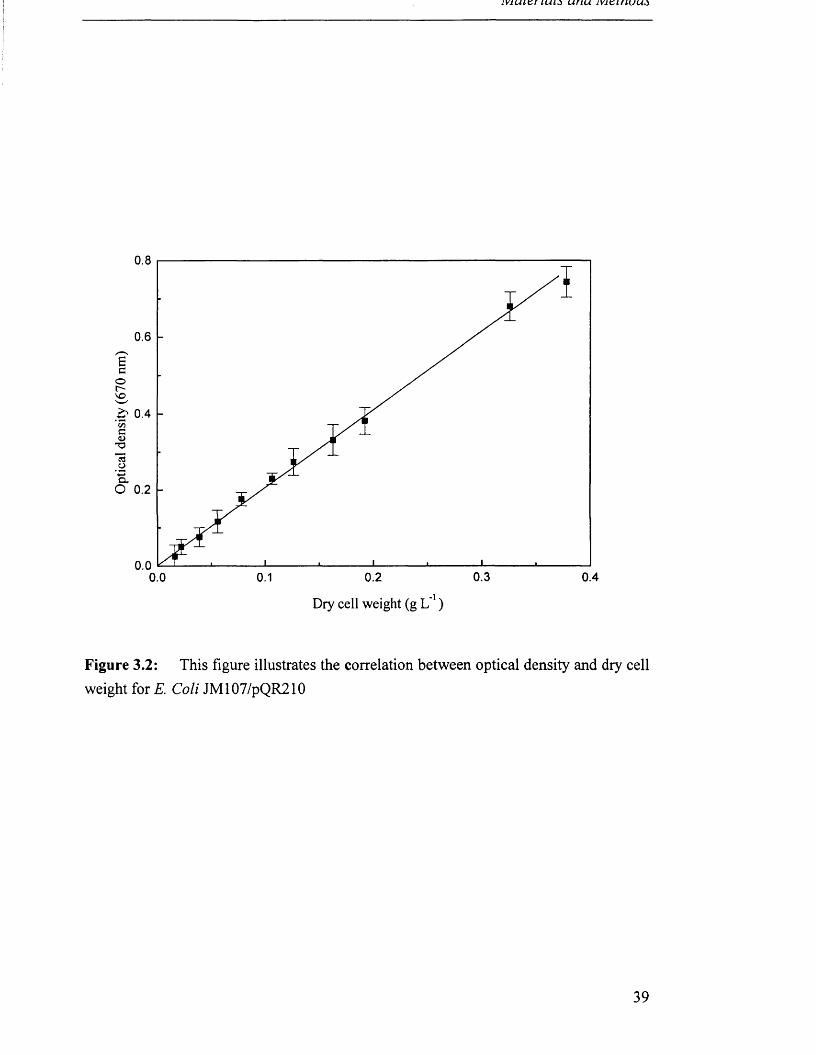
All optical densities of growing cultures reported were measured at X = 670 nm.
A correlation was produced by measuring the cell mass in a known volume of culture
passed through a pre-dried nitro-cellulose membrane (0.2 pm) and kept in an oven at
100 °C until a constant mass was recorded. Figure 3.1 illustrates this correlation
between optical density and dry cell weight for A. calcoaceticus and Figure 3.2 for E.
Coli JM107/pQR210.
3.1.2 Cyclohexanone monooxygenase activity assay
The CHMO assay used for all quantitative determinations of CHMO was based
on a method described by Donoghue et al. (1976). This involves the cyclohexanone
stimulated oxidation of NADPH to NADP+. The assay was therefore followed
spectrophotometrically at 340 nm. The rate of oxidation of NADPH (indicated by a
decrease in absorbance at 340 nm) was directly proportional to the concentration of
CHMO in the assay.
In a final volume of 1 mL the following reagents, expressed in their final
concentrations were added to a spectroscopic cuvette: Tris-HCL buffer, 50 mM; pH 9.0
37
Opt
ical
den
sity
(670
nm)
Materials ana meinuas
0.8
0.6
0.4
0.2
0.00.5 0.6 0.70.0 0.1 0.2 0.3 0.4
Dry cell weight (g L'1)
Figure 3.1: This figure illustrates the correlation between optical density and dry cellweight for A. calcoaceticus
38
Opt
ical
den
sity
(670
nm)
iv iu ic r lu io u n u lv i t i r iu u z
0.8
0.6
0.4
0.2
0.00.30.2 0.40.0 0.1
Dry cell weight (g L 1)
Figure 3.2: This figure illustrates the correlation between optical density and dry cellweight for E. Coli JM107/pQR210
39
iv iu ie r l u u uriu lv ie ir iu u s
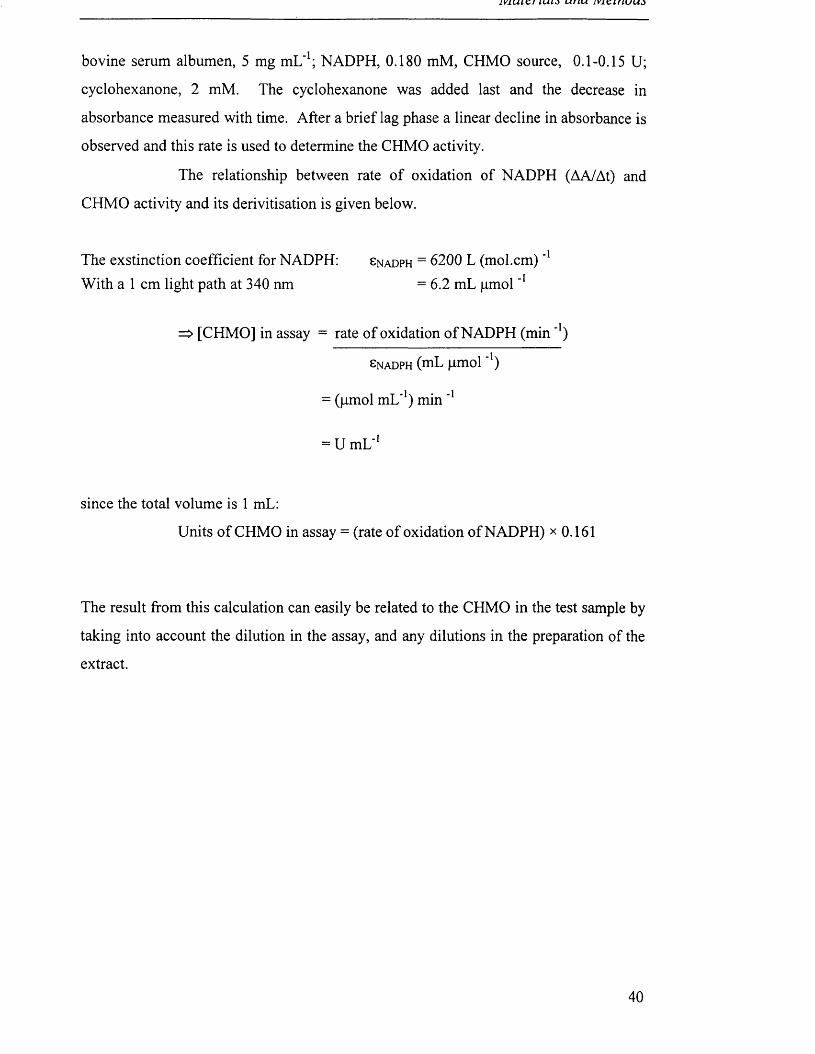
bovine serum albumen, 5 mg mL'1; NADPH, 0.180 mM, CHMO source, 0.1-0.15 U;
cyclohexanone, 2 mM. The cyclohexanone was added last and the decrease in
absorbance measured with time. After a brief lag phase a linear decline in absorbance is
observed and this rate is used to determine the CHMO activity.
The relationship between rate of oxidation of NADPH (AA/At) and
CHMO activity and its derivitisation is given below.
The exstinction coefficient for NADPH: Sn a d p h = 6200 L (mol.cm) AWith a 1 cm light path at 340 nm = 6.2 mL pm ol_I
=> [CHMO] in assay = rate of oxidation of NADPH (min '*)
Sn a d p h (mL pmol ' l)
= (pmol mL’1) min
= U mL*1
since the total volume is 1 mL:
Units of CHMO in assay = (rate of oxidation of NADPH) x 0.161
The result from this calculation can easily be related to the CHMO in the test sample by
taking into account the dilution in the assay, and any dilutions in the preparation of the
extract.
i i t t ' k j u * / ± r ± \ , i ' / n y u j
3.1.3 Protein assay
Protein concentrations were routinely determined using Coomassie Plus Protein
Reagent. The assay reagent (950 pL) was added to the protein solution or crude cell
extract (50pL), left to stand at room temperature for 5 minutes and the absorbance read
at 595 nm. Samples to be assayed were diluted so as to give a protein concentration of
between 0.05 and 0.5 mg mL’1. The protein concentration was standardised using
bovine serum albumin solutions of known concentration (0.025 to 0.6 mg mL’1). A
standard curve was produced for each set of assays (Appendix III).
3.1.4 GC assay for reactants and products
Samples containing biotransformation reactants and products were analysed
using a lipodex chiral GC capillary column (section 3.1.1). Samples were prepared for
analysis by deproteination with an equal volume of ice cold 2 -propanol, standing on ice
for 5 min and centrifugation (5 min at 15000 rpm). This technique was found to
adequately remove protein to avoid build up of organic matter in the injector of the gas
chromatograph. The supernatant (1 mL) was then analysed by injection onto the column
by autosampler. Standard solutions containing both reactants and products (where
available), prepared in cell homogenate and treated in the same manner, were used to
establish retention times and to calibrate the peak area to component concentration.
3.2 Equipment
3.2.1 Chromatographic apparatus
Thin layer chromatography (TLC) was performed on pre-coated silica glass plates (Merck gel 60F 254) and were visualised using a 1% solution of bismuth oxynitrate (4BiN03(0 H)2) in acetic acid and 1% potassium permanganate (KMnCU) solution in ethanol.
41
lv iu ie r iu iz u r iu iv i e u iu u z
Flash chromatography was performed on silica (Merck Kieselgel 60) and the mass of silica was approximately ten fold greater than the mass of sample.
3.2.2 Spectroscopic apparatus
UV spectra, spectrophotometric assays and optical density readings were
recorded on a Kontron Instruments, Uvikon 922 Spectrophotometer (Kontron
Instruments Ltd, Watford, Herts., UK). Microtitre plates were read by Dynatech
MR7000 microtitre plate reader (Dynatech, Guernsey, Channel Islands, UK).
Gas chromatography was performed on a Lipodex C chiral capillary column
(0.25 pm x 30 m). A Perkin Elmer Gas Chromatograph (Perkin Elmer, Norwlk, CT,
USA) was used with flame ionisation detection. The injection volume was 1 pL with a
split ratio of 1 TOO. The carrier gas was helium at a pressure of 5 psi for a run time of 5
min at 80 °C followed by a 2 °C min' 1 ramp to 140 °C.
Nuclear magnetic resonance (NMR) spectra (1H) were recorded on a Bruker AM300
(Bruker UK LTD, Coventry, UK) 300 MHz *H spectrometer, with samples made up in
CDC13. All chemical shifts (5) are reported in parts per million (ppm) and the results
are given as :
6 (number of protons, multiplicity, assignment)
where the multiplicity is denoted as:
s = singlet, d = doublet, dd = double doublet, br = broad, m = multiplet.
I am grateful to Alan Pettman (Pfizer) for his help in NMR spectrogram analysis.
3.2.3 Fermentation equipment and analysis
Inocula flasks were incubated on a ISF-l-V orbital shaker at 200 rpm (Adolf
Kuhner, Schmeiz, Switzerland) with a throw diameter of 0.1 m. Fermentations were
performed in an LH Inceltech Series 210 2L glass fermenter (Inceltech/LH Fermentation
Ltd., Reading, Berks., UK). For larger scale fermentations a 7 L stainless steel
42
iviuiC'f luia uriu iviciriwuo
fermenter (FT Applikon Series 230, Applikon Dependable Instruments BV, Schiedam,
The Netherlands) with a height to diameter ratio of 2.2, fitted with three six bladed
turbine impellers (diameter 0.06 m). Analysis of fermentation exit gases was achieved
with a VG Prima mass spectrometer controlled by a VG gas analysis microprocessor
(MM8-80F, VG Gas Analysis, Winsford, Cheshire, UK). The analysis produces O2
,C 02 ,N2 and Ar percentage composition. Control and logging of the fermentation
parameters and logging of the gas analysis data was achieved with BioXpert software
which was used to calculate the values of oxygen uptake rate (OUR), carbon dioxide
evolution rate (CER) and the respiratory quotient (RQ). The information was logged
every minute during the fermentation.
Fed batch fermentations were controlled with a Lab View software program
designed by M. Gregory (1993) run via a personal computer.
3.2.4 Downstream processing equipment
Disruption of cells by sonication was performed using a Sanyo, MSE Soniprep
150 (Sanyo Gallenkamp PLC, Loughborough, UK). Centrifugation of fermentation
broth and debris post disruption was performed using either a Heraeus Sepatech
Megafuge 1.0R (Heraeus Instruments GmBH, Hanau, Germany) with an HFA 15.2 rotor
for small scale samples, or a Beckman J2MI (Beckman Instruments Inc., Beaconsfleld,
UK) with a JA10 rotor for larger volumes.
An APV Lab 40 (APV Ltd, Crawley, UK) Manton Gaulin homogeniser was used
for larger scale cell disruption.
3.3 Recombinant E. coli
The recombinant E. Coli stain JM107/pQR210 expressing cyclohexanone
monooxygenase was prepared by Dr. Sejal Patel of the Department of Biochemistry and
Molecular Biology, UCL.
43
Materials and Methods
3.4 Fermentation media
Reagent Supplier GradeAmmonia (0.880) BDH AnalaRAmpicillin Sigma AnalaRAntifoam (PPG) BDH 2000Boric acid Sigma AnalaRCaCl2 Sigma GLRCaC03 Sigma GLRCitric acid Sigma AnalRCoCl2 Sigma AnalRCuS04.5H20 Sigma AnalRFe(NH4)2(S04)2.7H20 Sigma AnalRFeS04.7H20 Sigma AnalRGlycerol BDH AnalRHC1 Sigma GLRk h 2p o 4 Sigma AnalRk 2s o 4 Sigma AnalRMgS04.7H20 Sigma AnalRMnCl2.4H20 Sigma AnalRMnS04.4H20 Sigma AnalRNaCl2 Sigma GLRNa2HP04 Sigma AnalRNH4C1 Sigma GLRTryptone Oxoid -
(NH4)2S04 Sigma AnalRYeast Extract Oxoid -
ZnS04.7H20 Sigma AnalRCyclohexanol Sigma AnalR
Table 3.1 Suppliers of the fermentation media and the grade used.
Aldrich Chemical Company, New Rd, Gillingham, Dorset, SP8 4JL, UK.
BDH, Merck Ltd, Merck House, Poole, Dorset, BH15 1TD, UK.
Oxoid Chemical Company Ltd, Wade Rd, Basingstoke, Hampshire, RG24 OPW, UK.
Sigma Chemical Company, Fancy Rd, Poole, Dorset, BH17 7BR, UK.
44
m uieriuis unu ivieinuus
3.5 Microorganisms
3.5.1 Maintenance of organisms
The cyclohexanol oxidising strain of A. calcoaceticusc,di\Q,o?iQ,Q\\c\xs NCIMB
9872 was kindly supplied by Dr. Ewald Schroder of Exeter University, Exeter, UK. The
Escherichia coli construct JM107/pQR210 was obtained from Dr. Sejal Patel (UCL) on
agar plates.
Stock cultures of both organisms were routinely prepared by suspending freshly
grown culture from a shake flask in a sterile (50:50) glycerol/phosphate buffer solution
and stored as 1 mL aliquots at -70 °C. The phosphate buffer was prepared by dissolving
N a2 HP0 4 (4 g L '1) and KH2 PO 4 (2 g L’1) in demineralised water and adjusting to pH7
with phosphoric acid (phospahte buffer). These stock cultures were reactivated by
streaking onto sterile agar plates (section 3.5.2).
3.5.2 Solid culture media
The medium used for solid culture was as table 3.2 for A. calcoaceticus with the
addition of glutamate and technical agar (15 g L' 1 ). For the JM107 E. coli strain
nutrient agar was used. When selective pressure was required ampicillin (500 mg L' 1 )
was added by filtration through 0.2 pm nitrocellulose membrane filters when the
medium had cooled to approximately 50 °C.
3.6 Growth of Acinetobacter calcoaceticus
3.6.1 Media
A defined aqueous salts media, pH 7, was used for both shake flask and
fermenter growth. For composition see Table 3.2.
45
Materials and Methods
Succinic acid or monosodium glutamate, both neutralised with sodium
hydroxide, or cyclohexanol was then added. In the case of succinic acid and
monosodium glutamate this was added prior to sterilisation by autoclaving, while
cyclohexanol was added by direct injection after sterilisation. The amount of
ammonium sulphate was increased for some fermentations so as to maintain a
concentration that was 20 % by weight of the concentration of the carbon source.
Anhydrous constituent g L 1Sodium hydrogen phosphate (Na2HP04) 4
Potassium dihydrogen phosphate (KH2PO4) 2
Ammonium sulphate ((NLL^ SO4 2
Trace element solution (4 mL) g L 1Magnesium sulphate (MgS04 .7H20 ) 19.6
Iron sulphate (FeS0 4 .7H20) 5.6
Calcium carbonate (CaCOs) 2
Zinc sulphate (ZnS04 .7H20) 1.4
Manganese chloride (MnCbALLO) 1.1
Cobalt chloride (C0CI2) 0.28
Copper sulphate (CUSO4) 0.25
Boric acid 0.06
Hydrochloric acid 53 mL
Table 3.2 Mineral media constituents for A. calcoaceticus fermentation
3.6.2 Shake flask growth
Stored cultures (3.5.1) were used to inoculate an agar plate from which two or
three colonies were used to inoculate the above media (200 mL) in a shake flask (2 L)
with either succinic acid, monosodium glutamate, cyclohexanol or a combination of
carbon sources. The flasks were then incubated at 28 °C in a LH Mk X Incubator
Shaker at 200 rpm for 16 to 24 hours.
46
3.6.3 Batch fermentation
The media (1.3 L or 4.5 L) with the addition of antifoam (0.2 mL L'1 ) was
sterilised in situ by heating with steam to 121 °C and held for 20 minutes before
cooling. The pH was adjusted to 7.0 with NaOH solution (3M) and orthophosphoric
acid (3 M) and the temperature maintained at 28 °C. The trace element solution and
cyclohexanol were added by filter sterilisation (0.2 pm) prior to inoculation.
The inoculum (100 mL or 200 mL; section 3.6.2) was aseptically transferred to
the fermentation and growth allowed to proceed. Standard Operating Procedures (SOP)
were written and followed to ensure that the fermentations were carried out so as to
minimise the release of the organism and operator exposure because of the pathogenicity
of the organism (see appendix I).
Temperature and pH were controlled via PID to the set points indicated above.
Air flow rate into the fermenter was set at 1 fermenter volume per minute and the
agitation rate altered manually so as to maintain the dissolved oxygen tension (DOT) to
a value greater than 20 % air saturation until the maximum stirrer speed of the vessel
(1500 rpm) was reached. Sterile antifoam (20 % PPG) was added manually as required.
3.7 Growth of E. coli JM107/pQR210
3.7.1 Media
E. coli JM107/pQR210 was grown either on a complex media or a defined salts
medium. In each case the inocula were made up in the same media as the fermenter
(Table 3.3). Fed-batch fermentations used feed solutions as detailed in table 3.4.
47
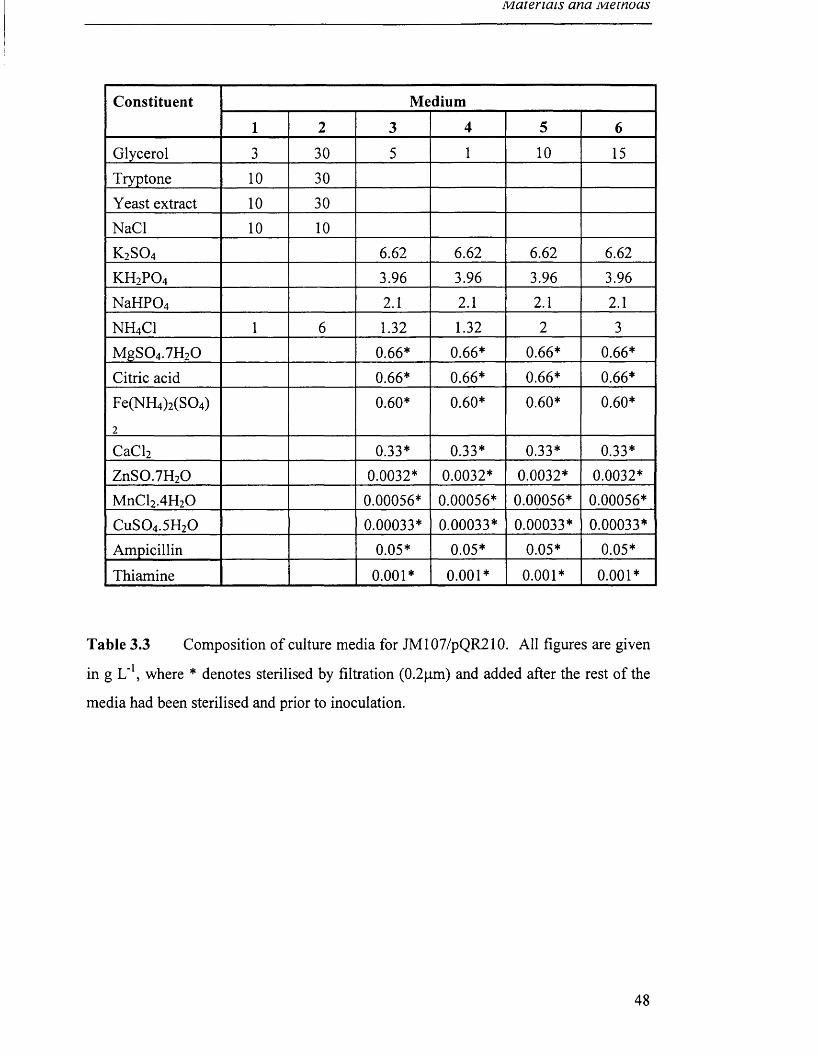
Materials ana Memoas
Constituent Medium
1 2 3 4 5 6
Glycerol 3 30 5 1 10 15
Tryptone 10 30Yeast extract 10 30NaCl 10 10
K2S 0 4 6.62 6.62 6.62 6.62
KH2PO4 3.96 3.96 3.96 3.96
NaHP04 2.1 2.1 2.1 2.1
NH4CI 1 6 1.32 1.32 2 3
M gS04.7H20 0.66* 0.66* 0.66* 0.66*
Citric acid 0.66* 0.66* 0.66* 0.66*
Fe(NH4)2(S04)
2
0.60* 0.60* 0.60* 0.60*
CaCl2 0.33* 0.33* 0.33* 0.33*ZnS0.7H20 0.0032* 0.0032* 0.0032* 0.0032*MnCl2.4H20 0.00056* 0.00056* 0.00056* 0.00056*
CuS04.5H20 0.00033* 0.00033* 0.00033* 0.00033*
Ampicillin 0.05* 0.05* 0.05* 0.05*
Thiamine 0.001* 0.001* 0.001* 0.001*
Table 3.3 Composition of culture media for JM107/pQR210. Ail figures are given
in g L"1, where * denotes sterilised by filtration (0.2pm) and added after the rest of the
media had been sterilised and prior to inoculation.
48
m aterials ana ivieinuas
Constituent Feed Solution
1 2 3 4
Glycerol 210 246 210 355
M gS04.7H20 15 15 15 15
Ampicillin* 0.05 0.05 0.05 0.05
Table 3.4 Composition of feed solutions 1-4 used in fed-batch fermentations of
JM107/pQR210. All figures are given in g L’1, where * denotes sterilised by filtration
(0.2 pm) and added after the rest of the media had been sterilised by autoclave.
3.7.2 Shake flask growth
Stored cultures were used to aseptically inoculate an agar plate from which two
or three colonies were used to inoculate complex media 1 (100 mL) in a shake flask
(1 L) which was incubated at 37 °C in an LH Mk X Incubator Shaker at 200 rpm for 16
hours. A 10 mL aliquot was then transferred to another shake flask (2 L) containing
sterile defined medium 3 (200 mL) and incubated as before.
3.7.3 Batch fermentation
Media 2 or 6 (4.8 L) with the addition of antifoam (0.2 mL L '1) was sterilised in
situ by heating with steam to 121 °C and held for twenty minutes before cooling. The
pH was adjusted to 6.8 with ammonia solution (1:1, 0.880 ammonia: water) and the
temperature maintained at 37 °C. The selective antibiotic ampicillin (0.05 g L '1 ) was
sterilised by passing it through a 0.2 pm membrane filter and added to the medium prior
to inoculation.
The inoculum (200 mL) was aseptically transferred to the fermentation and
growth allowed to proceed. Temperature and pH were controlled via PID to the set
points indicated above. Air flow was set to 1 fermenter volume per minute and the
49
M aterials ana Metnoas
agitation rate altered manually so as to maintain the dissolved oxygen tension (DOT) to
a value greater than 20 % air saturation until the maximum stirrer speed of the vessel
was reached. Sterile antifoam (20 % PPG) was added manually as required.
3.7.4 Fed-batch fermentation
Media 3, 4 or 5 (3.8 L or 4.3 L) were prepared, with sufficient glycerol and other
nutrients for a final volume of 5 L and 5.5 L respectively. The fermenter was then
sterilised and prepared for inoculation as for the batch fermentations (section 3.6.3).
The fermenter was inoculated as for the batch process and growth allowed to
continue until the carbon source was depleted. This was indicated by a rapid increase in
the DOT and subsequent fall in both the OUR and CER. At this point the feed was
started either by the initiation of a computer controlled fed batch procedure (Gregory &
Turner, 1993) or by a constant rate pump. The feeding of sterile feed solution (1,2,3 or
4, section 4.1.1) was controlled to give a constant growth rate, p., of 0.15 h _1. In some
fermentations the feed was then set to a constant rate to maintain a maximum OUR that
was less than 70 mmol L '1 h'1.
The feed solution was controlled by the LabView software program (Gregory
and Turner 1993) using the following control algorithms
F = (p/Ygly).x(t).V(t)
x (t) = x (t-At).exp(pAt)
V(t) = V (t-At) + (FAt/sf)
where F is the glycerol feed rate (g h '1), p, is the specific growth rate (h'1 ), Ygiy is the
yield on glycerol (g g '1 ), x is the dry biomass concentration (g L"1 ), V is the fermenter
volume (L), Sf is the glycerol concentration of the feed (g L '1).
Using these equations, values for Ygiy determined from batch fermentations
(section 4.3.5), the glycerol concentration in the feed and the biomass when feeding
begins, the computer program calculates the required feed rate for any required growth
rate. This is translated to a pump speed using the calibration curves for the variable
50
speed peristaltic pumps used and thus the software is able to maintain a constant growth
rate.
At varying times the production of CHMO was then induced by the addition of
IPTG and the broth was harvested if required.
3.7.5 Plasmid stability
Plasmid stability of the E. coli JM107/pQR210 recombinant was determined
from the ratio of number of colonies from selective agar plates (with ampicillin) to that
from non-selective plates. Sterile culture taken at intervals was diluted in sterile
phosphate buffer to give approximately 100 colonies per plate in a 50 pL aliquot and
spread aseptically. Plates were incubated at 37 °C for 12-16 hours and the colonies
counted.
3.8 Downstream processing methods
3.8.1 Preparation of crude extract by sonication
Sonication was used as a method of cell disruption in samples of shake flasks or
to monitor the production of CHMO after induction of a fermentation.
Cells were removed from the broth sample (1-3 mL depending on the dry cell
weight) by centrifugation (2 min, 15000 rpm) and resuspended in phosphate buffer
(sction 3.5.1) The cells were then removed again by centrifugation and resuspended in
phosphate buffer (1 mL). The crude extract was then prepared by sonication: For A.
calcoaceticus cells, 3 x 30 sec separated by 1 min on ice, and for E. coli
JM107/pQR210, 4 x 10 sec separated by 10 sec on ice (Appendix II), followed by
centrifugation to remove cell debris (5 min, 15000 rpm).
51
iviaiencus unu ivieinuus
3.8.2 Preparation of crude extract by Lab 40 homogenisation
A Lab40 homogeniser was used to disrupt cells when a larger volume was
required for analysis or to harvest the cyclohexanone monooxygenase. Cells were
removed from the broth by centrifugation (15 min, 10000 rpm) and resuspended in
phosphate buffer (section 3.5.1). Crude extracts from E. coli and A. calcoaceticus were
prepared by high pressure homogenisation, 2 and 4 passes at 900 bar respectively,
followed by centrifugation to remove cell debris (45 min, 10000 rpm).
3.8.3 Storage and stability of cells
Cells were removed from culture medium by centrifugation (15 min, 10000 rpm)
and resuspended in phosphate buffer (section 3.5.1). The resulting suspension was then
either stored at 4 °C, -18 °C or mixed with an equal volume of sterile glycerol. The
suspension was then aliquoted and stored at -18 °C. When required the suspension was
centrifuged (15 min, 15000 rpm) and resuspended in buffer. Crude extracts were
routinely tested for CHMO activity by disrupting the cells (section 3.8.1) and assaying
the crude extract (3.1.2).
3.8.4 Storage and stability of homogenate
Homogenate (section 4.4.2) was either stored at 4 °C, -18 °C or mixed with an
equal volume of glycerol and stored at -18 °C. It was routinely tested for CHMO
activity.
52
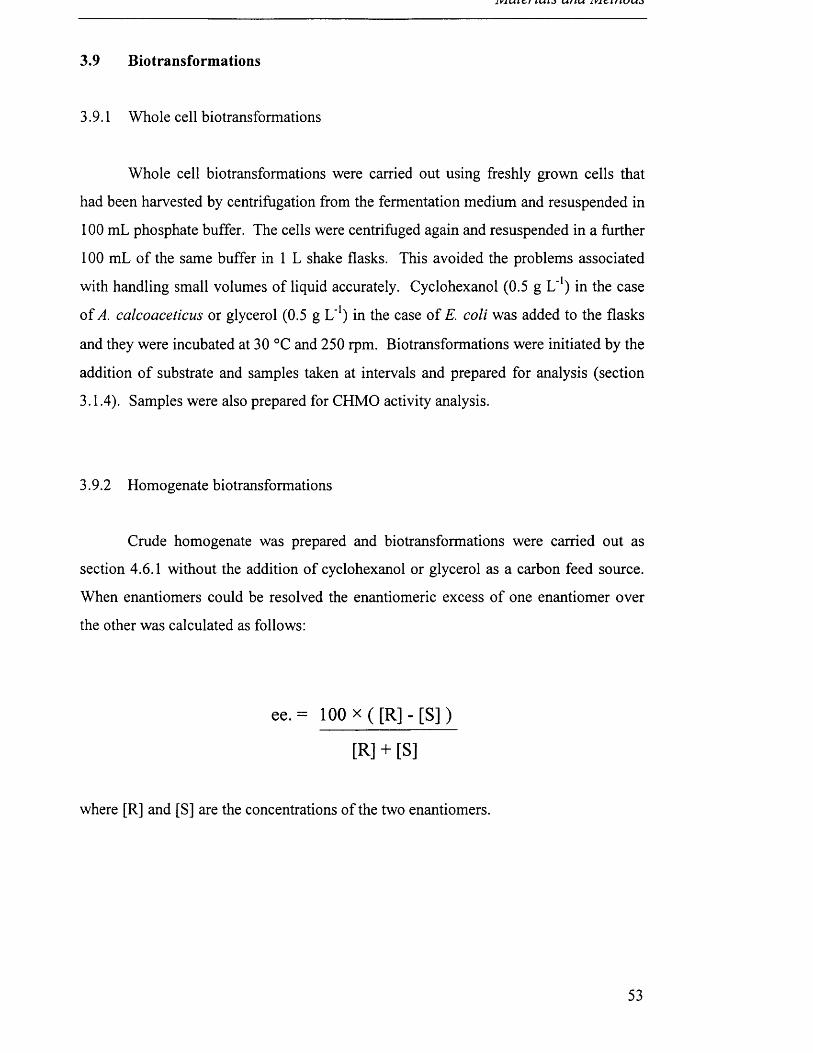
A V I U ' l & f ( U t J L i f t L i A V A C r i r i V L l * }
3.9 Biotransformations
3.9.1 Whole cell biotransformations
Whole cell biotransformations were carried out using freshly grown cells that
had been harvested by centrifugation from the fermentation medium and resuspended in
100 mL phosphate buffer. The cells were centrifuged again and resuspended in a further
100 mL of the same buffer in 1 L shake flasks. This avoided the problems associated
with handling small volumes of liquid accurately. Cyclohexanol (0.5 g L '1) in the case
of A. calcoaceticus or glycerol (0.5 g L'1) in the case of E. coli was added to the flasks
and they were incubated at 30 °C and 250 rpm. Biotransformations were initiated by the
addition of substrate and samples taken at intervals and prepared for analysis (section
3.1.4). Samples were also prepared for CHMO activity analysis.
3.9.2 Homogenate biotransformations
Crude homogenate was prepared and biotransformations were carried out as
section 4.6.1 without the addition of cyclohexanol or glycerol as a carbon feed source.
When enantiomers could be resolved the enantiomeric excess of one enantiomer over
the other was calculated as follows:
ee. = 100 x ( [R] - [ S ] )
[R] + [S]
where [R] and [S] are the concentrations of the two enantiomers.
53
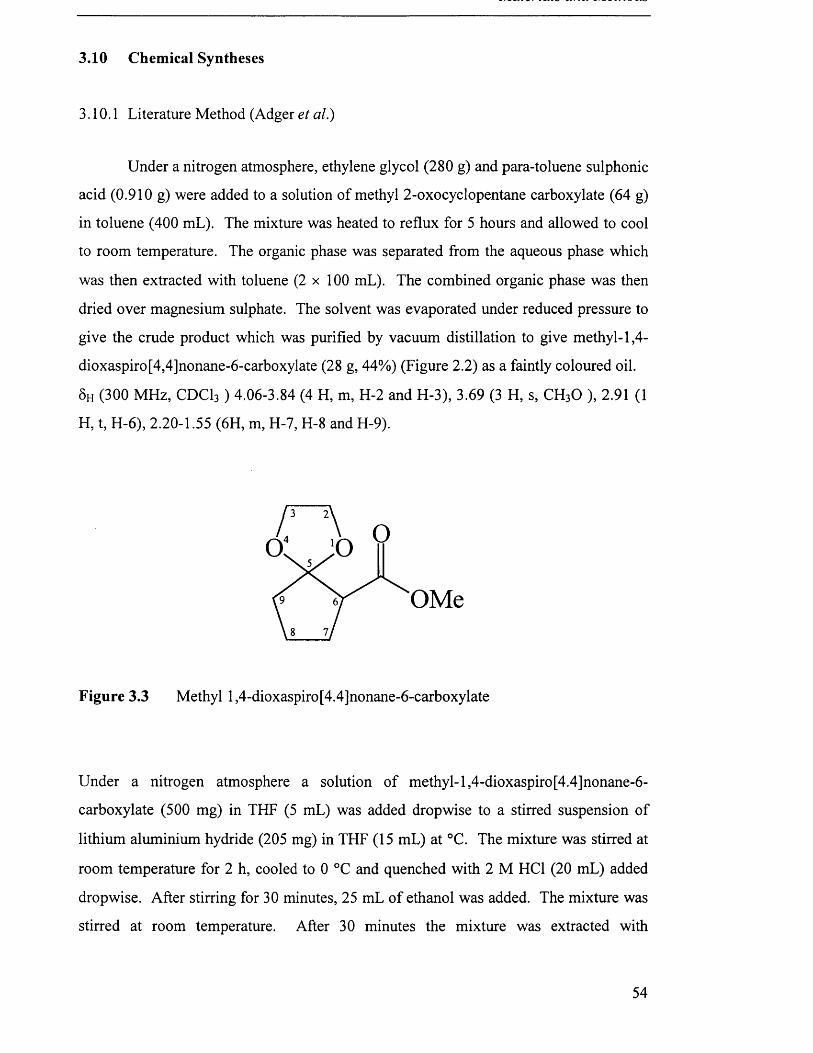
3.10 Chemical Syntheses
3.10.1 Literature Method (Adger et al.)
Under a nitrogen atmosphere, ethylene glycol (280 g) and para-toluene sulphonic
acid (0.910 g) were added to a solution of methyl 2-oxocyclopentane carboxylate (64 g)
in toluene (400 mL). The mixture was heated to reflux for 5 hours and allowed to cool
to room temperature. The organic phase was separated from the aqueous phase which
was then extracted with toluene (2 x 100 mL). The combined organic phase was then
dried over magnesium sulphate. The solvent was evaporated under reduced pressure to
give the crude product which was purified by vacuum distillation to give methyl-1,4-
dioxaspiro[4,4]nonane-6-carboxylate (28 g, 44%) (Figure 2.2) as a faintly coloured oil.
5h (300 MHz, CDCI3 ) 4.06-3.84 (4 H, m, H-2 and H-3), 3.69 (3 H, s, CH30 ), 2.91 (1
H, t, H-6), 2.20-1.55 (6H, m, H-7, H-8 and H-9).
Figure 3.3 Methyl l,4-dioxaspiro[4.4]nonane-6-carboxylate
Under a nitrogen atmosphere a solution of methyl-l,4-dioxaspiro[4.4]nonane-6-
carboxylate (500 mg) in THF (5 mL) was added dropwise to a stirred suspension of
lithium aluminium hydride (205 mg) in THF (15 mL) at °C. The mixture was stirred at
room temperature for 2 h, cooled to 0 °C and quenched with 2 M HC1 (20 mL) added
dropwise. After stirring for 30 minutes, 25 mL of ethanol was added. The mixture was
stirred at room temperature. After 30 minutes the mixture was extracted with
O M e
54
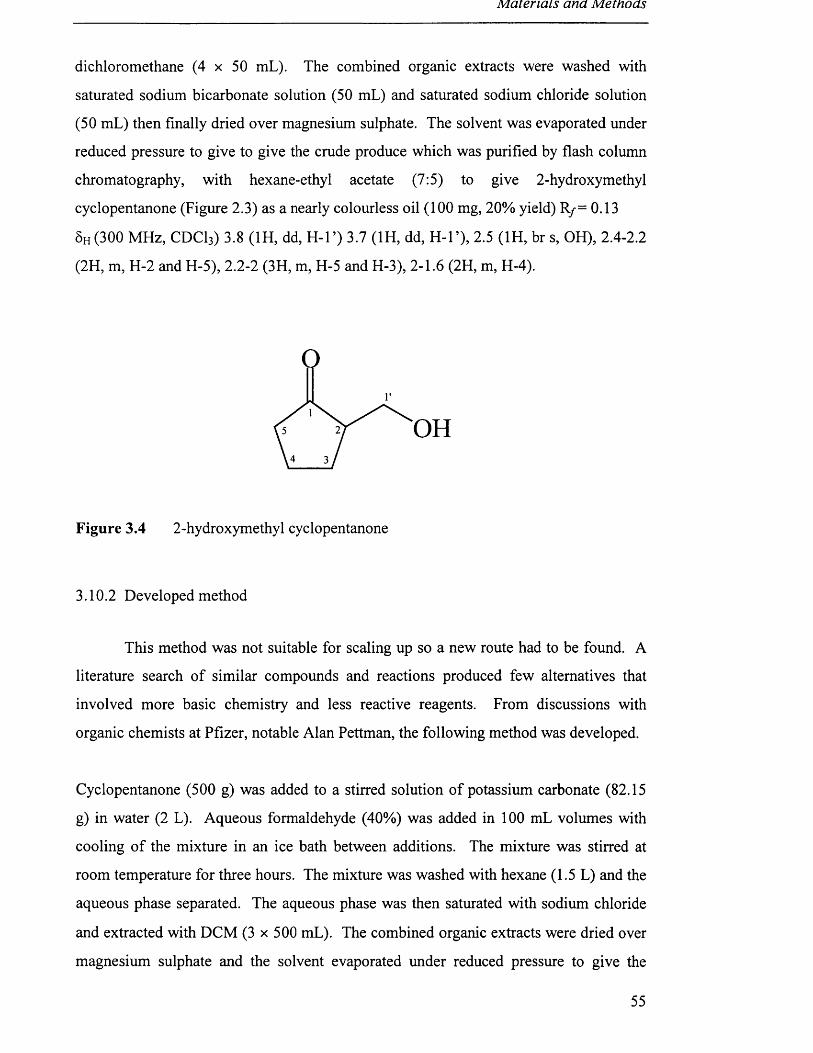
Materials ana Metnoas
dichloromethane (4 x 50 mL). The combined organic extracts were washed with
saturated sodium bicarbonate solution (50 mL) and saturated sodium chloride solution
(50 mL) then finally dried over magnesium sulphate. The solvent was evaporated under
reduced pressure to give to give the crude produce which was purified by flash column
chromatography, with hexane-ethyl acetate (7:5) to give 2-hydroxymethyl
cyclopentanone (Figure 2.3) as a nearly colourless oil (100 mg, 20% yield) R/= 0.13
6h (300 MHz, CDC13) 3.8 (1H, dd, H -l’) 3.7 (1H, dd, H -l’), 2.5 (1H, br s, OH), 2.4-2.2
(2H, m, H-2 and H-5), 2.2-2 (3H, m, H-5 and H-3), 2-1.6 (2H, m, H-4).
O H
Figure 3.4 2-hydroxymethyl cyclopentanone
3.10.2 Developed method
This method was not suitable for scaling up so a new route had to be found. A
literature search of similar compounds and reactions produced few alternatives that
involved more basic chemistry and less reactive reagents. From discussions with
organic chemists at Pfizer, notable Alan Pettman, the following method was developed.
Cyclopentanone (500 g) was added to a stirred solution of potassium carbonate (82.15
g) in water (2 L). Aqueous formaldehyde (40%) was added in 100 mL volumes with
cooling of the mixture in an ice bath between additions. The mixture was stirred at
room temperature for three hours. The mixture was washed with hexane (1.5 L) and the
aqueous phase separated. The aqueous phase was then saturated with sodium chloride
and extracted with DCM (3 x 500 mL). The combined organic extracts were dried over
magnesium sulphate and the solvent evaporated under reduced pressure to give the
55
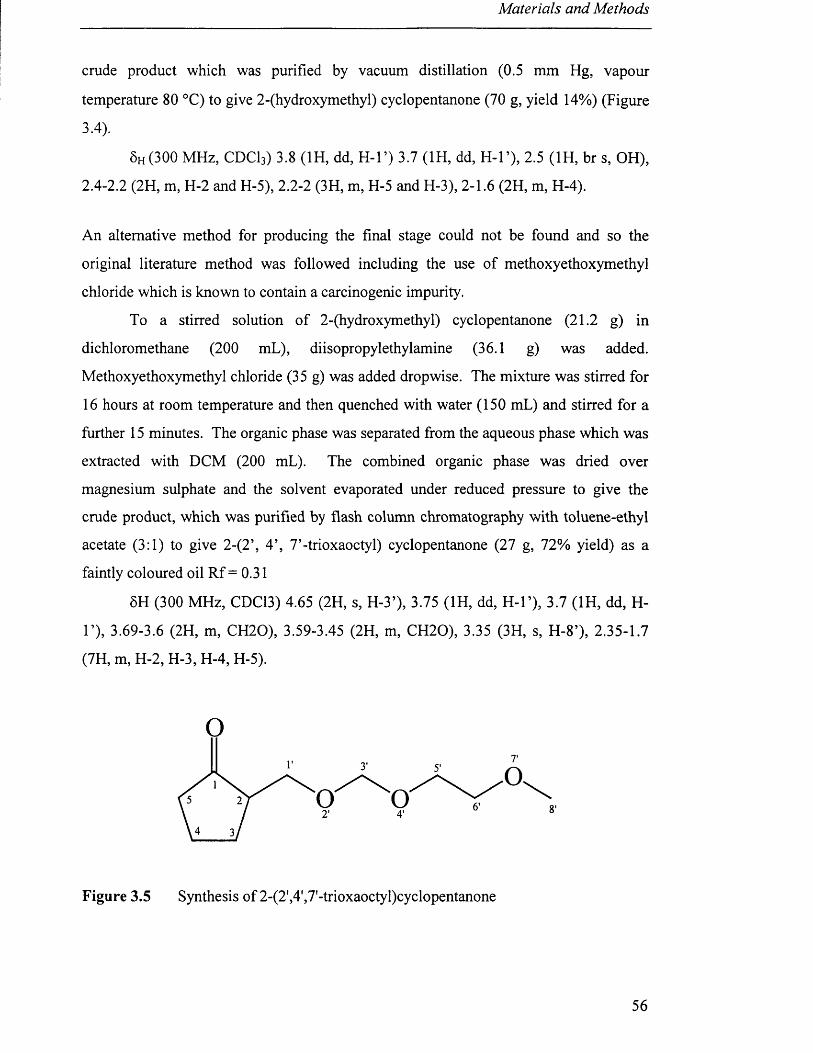
Materials and Methods
crude product which was purified by vacuum distillation (0.5 mm Hg, vapour
temperature 80 °C) to give 2-(hydroxymethyl) cyclopentanone (70 g, yield 14%) (Figure
3.4).
5h (300 MHz, CDC13) 3.8 (1H, dd, H -l’) 3.7 (1H, dd, H -l’), 2.5 (1H, br s, OH),
2.4-2.2 (2H, m, H-2 and H-5), 2.2-2 (3H, m, H-5 and H-3), 2-1.6 (2H, m, H-4).
An alternative method for producing the final stage could not be found and so the
original literature method was followed including the use of methoxyethoxymethyl
chloride which is known to contain a carcinogenic impurity.
To a stirred solution of 2-(hydroxymethyl) cyclopentanone (21.2 g) in
dichloromethane (200 mL), diisopropylethylamine (36.1 g) was added.
Methoxyethoxymethyl chloride (35 g) was added dropwise. The mixture was stirred for
16 hours at room temperature and then quenched with water (150 mL) and stirred for a
further 15 minutes. The organic phase was separated from the aqueous phase which was
extracted with DCM (200 mL). The combined organic phase was dried over
magnesium sulphate and the solvent evaporated under reduced pressure to give the
crude product, which was purified by flash column chromatography with toluene-ethyl
acetate (3:1) to give 2-(2’, 4’, 7’-trioxaoctyl) cyclopentanone (27 g, 72% yield) as a
faintly coloured oil Rf = 0.31
5H (300 MHz, CDC13) 4.65 (2H, s, H-3’), 3.75 (1H, dd, H -l’), 3.7 (1H, dd, H-
1’), 3.69-3.6 (2H, m, CH20), 3.59-3.45 (2H, m, CH20), 3.35 (3H, s, H-8’), 2.35-1.7
(7H, m, H-2, H-3, H-4, H-5).
3 ' 5 '
O O '2 ’ 4 '
0 .
Figure 3.5 Synthesis of 2-(2',4',7'-trioxaoctyl)cyclopentanone
56
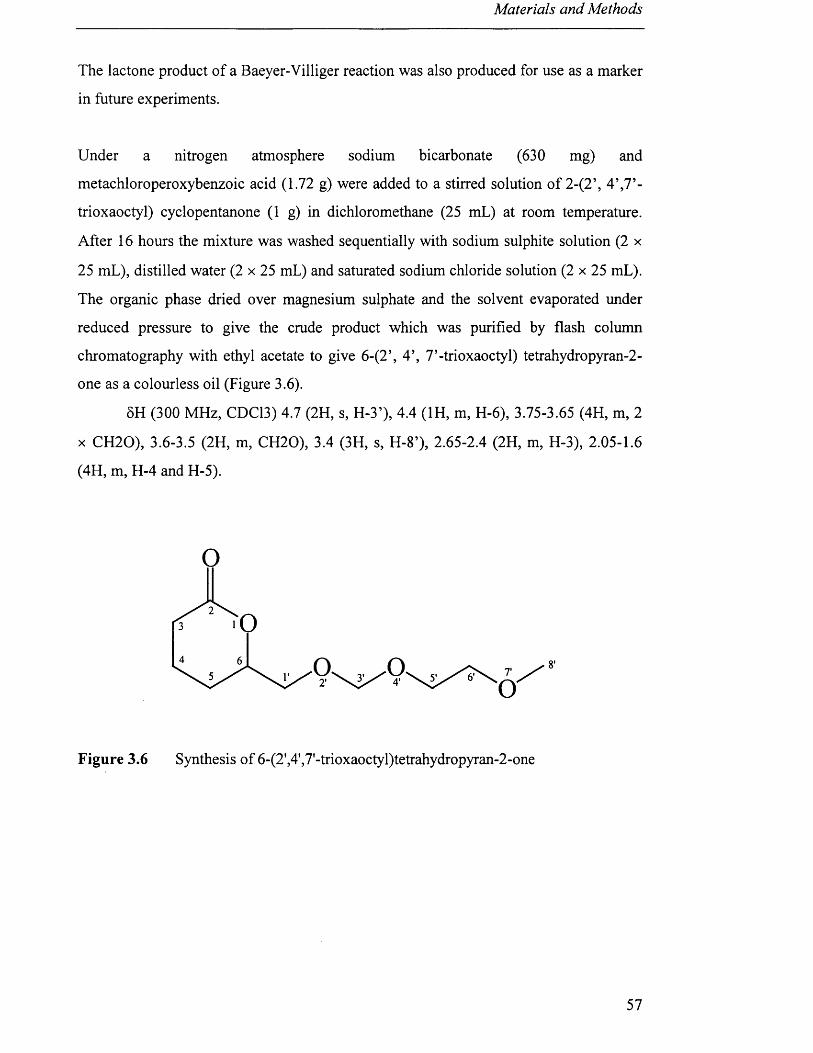
Materials and Methods
The lactone product of a Baeyer-Villiger reaction was also produced for use as a marker
in future experiments.
Under a nitrogen atmosphere sodium bicarbonate (630 mg) and
metachloroperoxybenzoic acid (1.72 g) were added to a stirred solution of 2-(2’, 4’,7’-
trioxaoctyl) cyclopentanone (1 g) in dichloromethane (25 mL) at room temperature.
After 16 hours the mixture was washed sequentially with sodium sulphite solution (2 x
25 mL), distilled water (2 x 25 mL) and saturated sodium chloride solution (2 x 25 mL).
The organic phase dried over magnesium sulphate and the solvent evaporated under
reduced pressure to give the crude product which was purified by flash column
chromatography with ethyl acetate to give 6-(2’, 4’, 7’-trioxaoctyl) tetrahydropyran-2-
one as a colourless oil (Figure 3.6).
6H (300 MHz, CDC13) 4.7 (2H, s, H-3’), 4.4 (1H, m, H-6), 3.75-3.65 (4H, m, 2
x CH20), 3.6-3.5 (2H, m, CH20), 3.4 (3H, s, H-8’), 2.65-2.4 (2H, m, H-3), 2.05-1.6
(4H, m, H-4 and H-5).
0 .2'
O '
Figure 3.6 Synthesis of 6-(2',4',7'-trioxaoctyl)tetrahydropyran-2-one
57
Results
4 RESULTS
4.1 Cyclohexanone monooxygenase assay
The spectrophotometric assay used to measure CHMO activity was based on the
literature method of Donoghue et al. (1976). The process was slightly modified by the
addition of BSA (5 mg mL'1) to the reaction mixture before the addition of the crude
preparation to avoid CHMO binding to the walls of the cuvette. The procedure was also
modified to remove errors present at low enzyme activities. The quoted linear range in
the reference (Donoghue 1976) was found to result in a lower specific activity due to
errors in the handling of small volumes when samples with high CHMO activities were
assayed and the subsequent high factor multiplication. The method was therefore
modified to use a minimum of 20 pL addition of enzyme preparation which was found
to eliminate this error (Figure 4.1). This could have been caused by protein adhering to
the pipette tips and the proportionally larger contribution of the background oxidation of
NADPH.
The method was further modified to take into account an initial rapid oxidation
of some of the NADPH. It was found that upon addition of the enzyme to the assay mix
the initial rate of background NADPH oxidation slowed to a steady state (Figure 4.2).
The original Donoghue method detailed determinations of background and CHMO
stimulated NADPH oxidation from separate assays. Allowing the background oxidation
to stabilise before the addition of cyclohexanone allowed a more reproducible and
accurate background measurement.
58
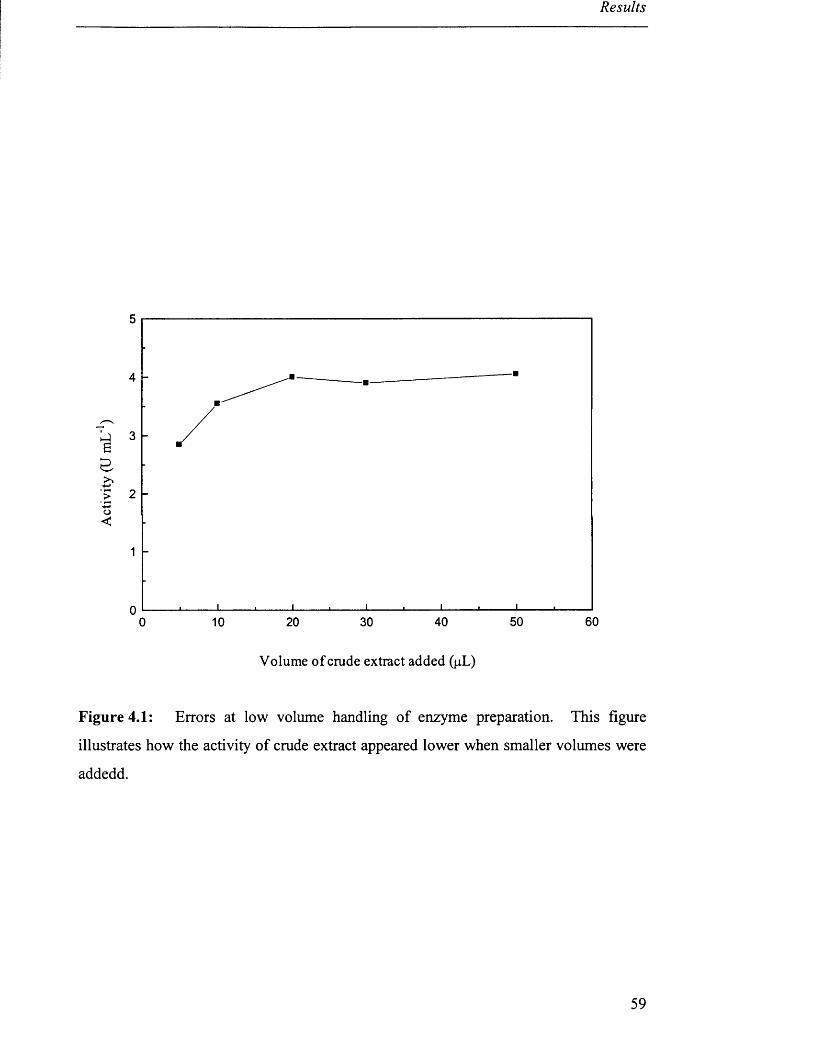
Activ
ity
(U m
L’ )
Results
5
4
3
2
1
050 6020 30 400 10
Volume of crude extract added (pL)
Figure 4.1: Errors at low volume handling of enzyme preparation. This figure
illustrates how the activity of crude extract appeared lower when smaller volumes were
addedd.
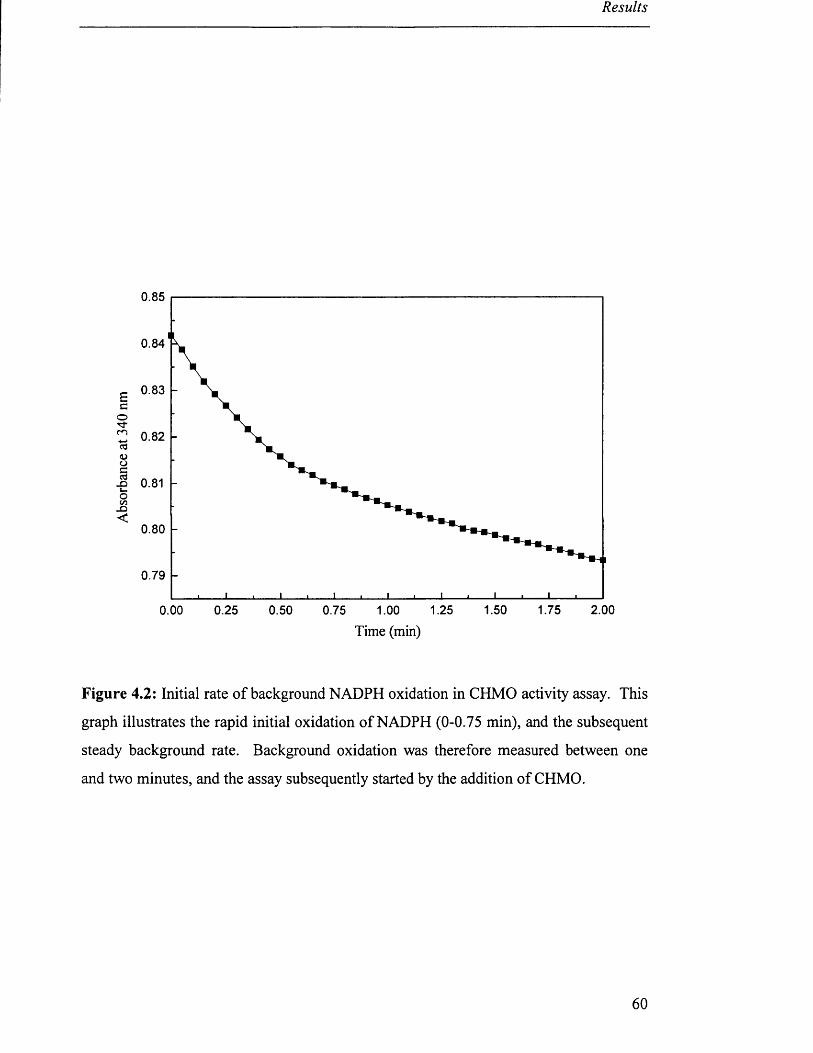
Results
0.85
0.84
0.83
0.82
0.81
0.80
0.79
1.50 1.75 2.000.00 0.25 0.50 0.75 1.251.00
Time (min)
Figure 4.2: Initial rate of background NADPH oxidation in CHMO activity assay. This
graph illustrates the rapid initial oxidation of NADPH (0-0.75 min), and the subsequent
steady background rate. Background oxidation was therefore measured between one
and two minutes, and the assay subsequently started by the addition of CHMO.
60
Results
It was demonstrated that this assay allowed quantitative measurement of CHMO activity
between 0.01 U and 0.2 U. Below 0.01 U the background oxidation became significant
and above 0.2 U the rate of NADPH oxidation was too rapid to follow accurately.
4.2 Growth of Acinetobacter calcoaceticus
4.2.1 Growth on cyclohexanol
The Neisseriaceae family of bacteria are known to grow poorly if at all with
hexose sugars as their sole carbon source but do grow well on acetate or pyruvate
(Lautrop 1974).
Previous work on biotransformation using this organism describes the use of
mainly washed cell suspensions (Camell et al., 1991; Alphand and Furstoss, 1990;
Levitt et al., 1990). This involves the growth of the organism in a minimal salts
medium and the addition of cyclohexanol as the sole carbon source which causes the
induction of the enzyme to facilitate growth.
When grown in a batch mode with an initial cyclohexanol concentration of 1 mL
L"1, the growth was poor producing an optical density of only about 2 absorbance units
at 500 nm. The specific enzyme activity throughout the period of growth showed that
the activity was greater at the late log stage of growth (Sandey, 1991). This means that
unless the cells are harvested at the correct time i.e. 0.8 OD the productivity is low.
Cyclohexanol is known to be toxic to the organism (Sandey, 1991) so the
concentration can not be increased above 1 mL L'1. This leads to the possibility of a fed
batch production where the concentration is maintained at a level to keep the growth in
the log phase for a greater period. This should provide more cells and hence greater
productivity from the fermentation.
Growth of A. calcoaceticus in shake flasks on minimal medium (section 3.5)
with cyclohexanol (1 g L*1) as the sole carbon and energy source was found to be very
slow, typically taking 26 hours to reach an optical density of 0.9 at 670 nm (Table 4.1).
This represents a dry cell weight concentration of 0.5 g L '1 and a yield on cyclohexanol
of 0.5 gdc g"1.
61
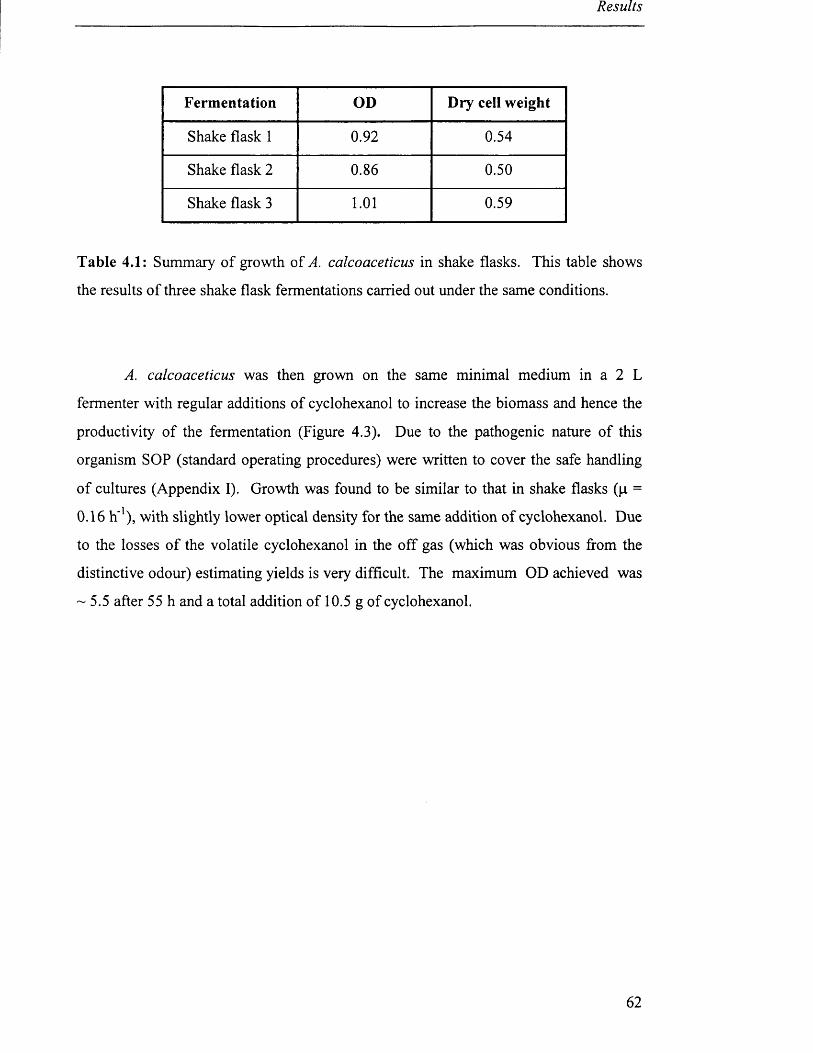
Results
Fermentation OD Dry cell weight
Shake flask 1 0.92 0.54
Shake flask 2 0.86 0.50
Shake flask 3 1.01 0.59
Table 4.1: Summary of growth of A. calcoaceticus in shake flasks. This table shows
the results of three shake flask fermentations carried out under the same conditions.
A. calcoaceticus was then grown on the same minimal medium in a 2 L
fermenter with regular additions of cyclohexanol to increase the biomass and hence the
productivity of the fermentation (Figure 4.3). Due to the pathogenic nature of this
organism SOP (standard operating procedures) were written to cover the safe handling
of cultures (Appendix I). Growth was found to be similar to that in shake flasks (p =
0.16 h '1), with slightly lower optical density for the same addition of cyclohexanol. Due
to the losses of the volatile cyclohexanol in the off gas (which was obvious from the
distinctive odour) estimating yields is very difficult. The maximum OD achieved was
-5 .5 after 55 h and a total addition of 10.5 g of cyclohexanol.
62
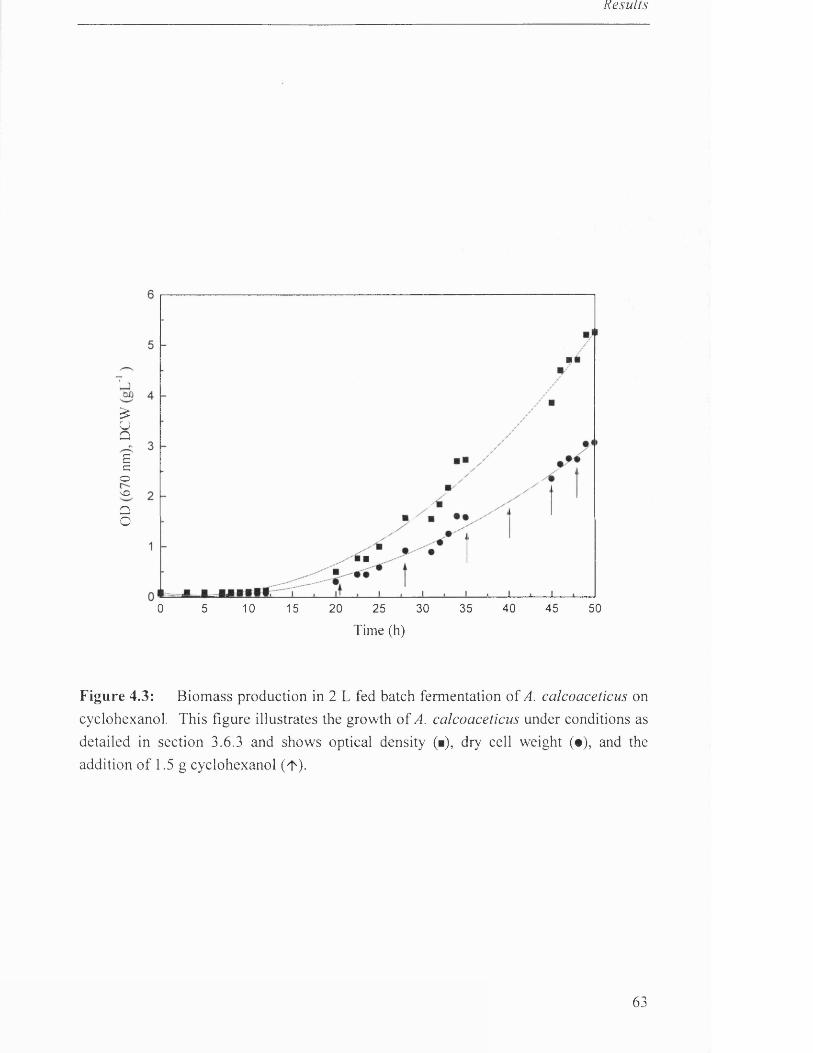
Results
■-a
£UQEc
ovOQO
■ ■
0 5 35 40 45 5010 15 20 25 30
Time (h)
Figure 4.3: Biomass production in 2 L fed batch fermentation of A. calcoaceticus oncyclohexanol. This figure illustrates the growth of A. calcoaceticus under conditions as detailed in section 3.6.3 and shows optical density (■), dry cell weight (•), and the addition of 1.5 g cyclohexanol (4s).
63
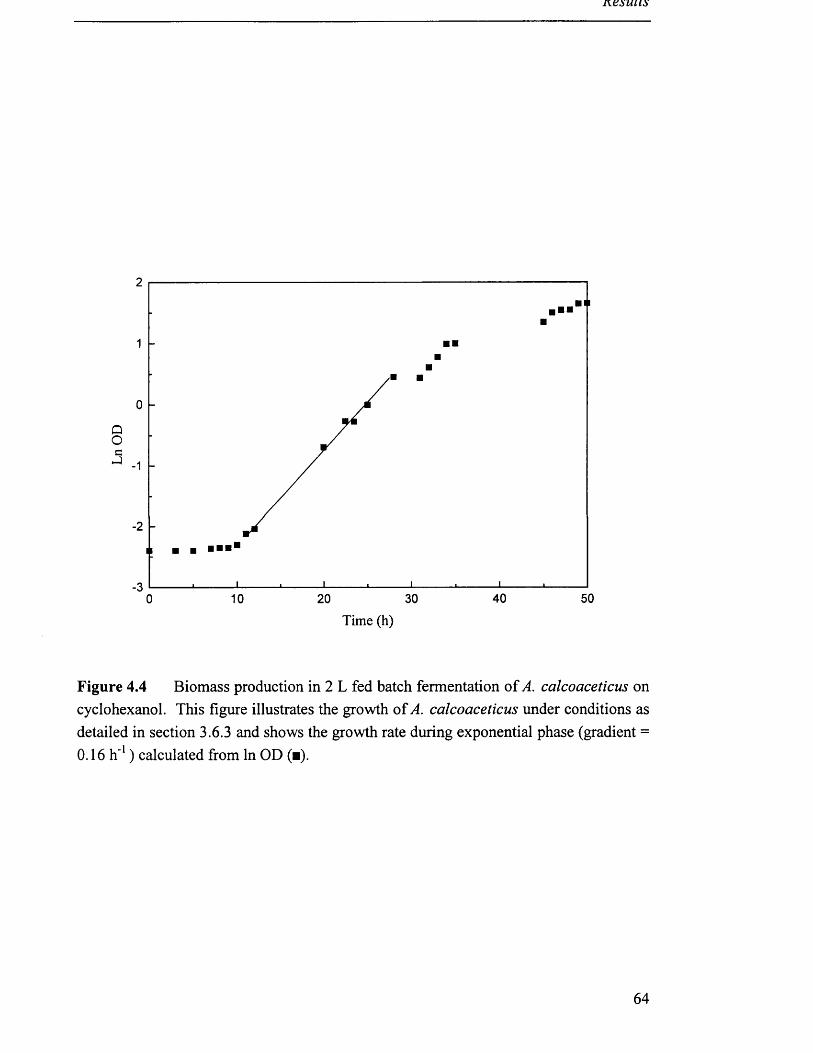
jsesuus
2■ ii
1 ■ ■
0
1
2
340 503010 200
Time (h)
Figure 4.4 Biomass production in 2 L fed batch fermentation of A. calcoaceticus on cyclohexanol. This figure illustrates the growth of A. calcoaceticus under conditions as detailed in section 3.6.3 and shows the growth rate during exponential phase (gradient = 0 .16b '1) calculated from In OD (■).
64
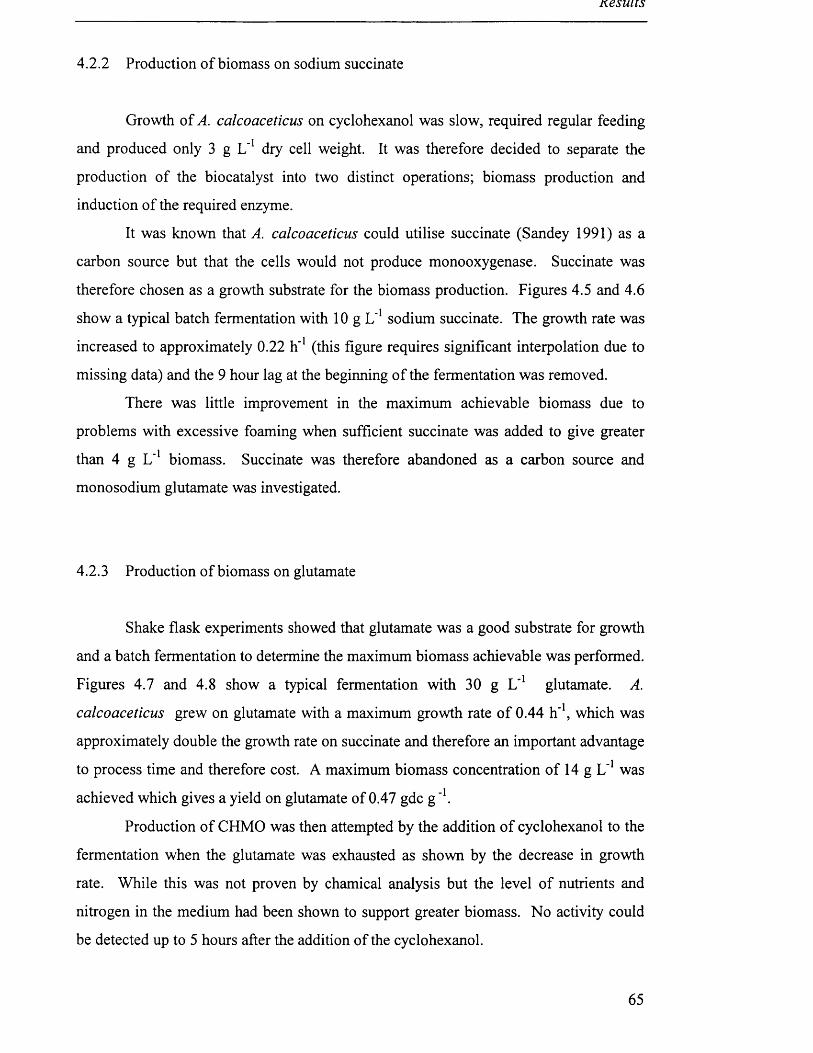
Kesuus
4.2.2 Production of biomass on sodium succinate
Growth of A. calcoaceticus on cyclohexanol was slow, required regular feeding
and produced only 3 g L'1 dry cell weight. It was therefore decided to separate the
production of the biocatalyst into two distinct operations; biomass production and
induction of the required enzyme.
It was known that A. calcoaceticus could utilise succinate (Sandey 1991) as a
carbon source but that the cells would not produce monooxygenase. Succinate was
therefore chosen as a growth substrate for the biomass production. Figures 4.5 and 4.6
show a typical batch fermentation with 10 g L'1 sodium succinate. The growth rate was
increased to approximately 0.22 h '1 (this figure requires significant interpolation due to
missing data) and the 9 hour lag at the beginning of the fermentation was removed.
There was little improvement in the maximum achievable biomass due to
problems with excessive foaming when sufficient succinate was added to give greater
than 4 g L '1 biomass. Succinate was therefore abandoned as a carbon source and
monosodium glutamate was investigated.
4.2.3 Production of biomass on glutamate
Shake flask experiments showed that glutamate was a good substrate for growth
and a batch fermentation to determine the maximum biomass achievable was performed.
Figures 4.7 and 4.8 show a typical fermentation with 30 g L '1 glutamate. A.
calcoaceticus grew on glutamate with a maximum growth rate of 0.44 h"1, which was
approximately double the growth rate on succinate and therefore an important advantage
to process time and therefore cost. A maximum biomass concentration of 14 g L '1 was
achieved which gives a yield on glutamate of 0.47 gdc g _1.
Production of CHMO was then attempted by the addition of cyclohexanol to the
fermentation when the glutamate was exhausted as shown by the decrease in growth
rate. While this was not proven by chamical analysis but the level of nutrients and
nitrogen in the medium had been shown to support greater biomass. No activity could
be detected up to 5 hours after the addition of the cyclohexanol.
65
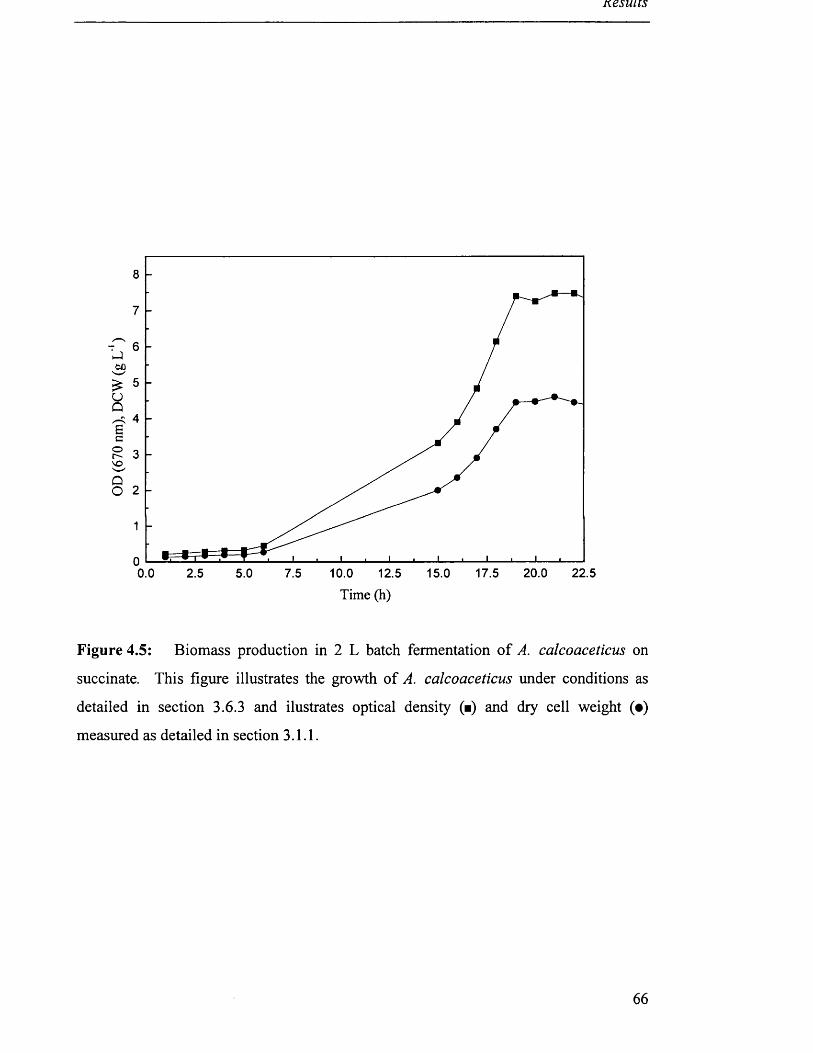
Kesuns
8
7
6oo'w'£ 5OO
4BcO oovo
O 2
1
02 0 .0 2 2 .50.0 2 .5 5 .0 10.0 1 2 .5 1 5 .0 1 7 .57 .5
Time (h)
Figure 4.5: Biomass production in 2 L batch fermentation of A. calcoaceticus on
succinate. This figure illustrates the growth of A. calcoaceticus under conditions as
detailed in section 3.6.3 and ilustrates optical density (■) and dry cell weight (•)
measured as detailed in section 3.1.1.
66
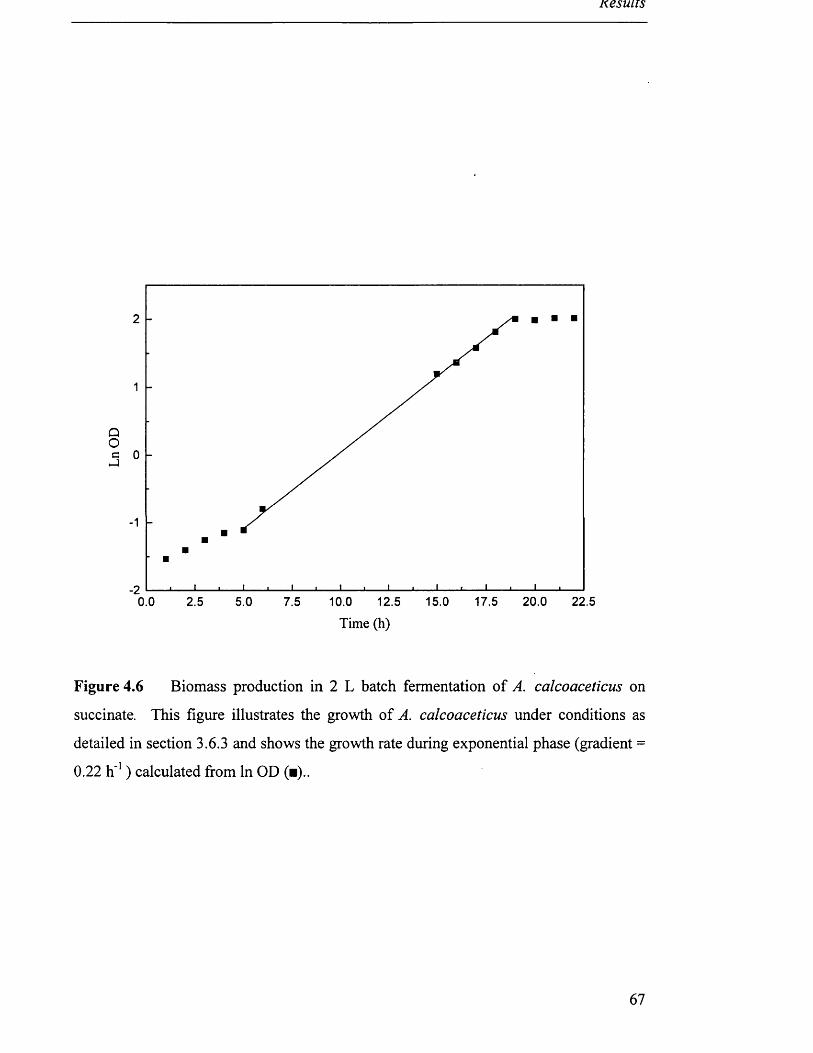
Kesuits
2
1
0
1
•217.5 20.0 22.50.0 2.5 5.0 10.0 12.5 15.07.5
Time (h)
Figure 4.6 Biomass production in 2 L batch fermentation of A. calcoaceticus on
succinate. This figure illustrates the growth of A. calcoaceticus under conditions as
detailed in section 3.6.3 and shows the growth rate during exponential phase (gradient =
0.22 h '1) calculated from In OD (■)..
67
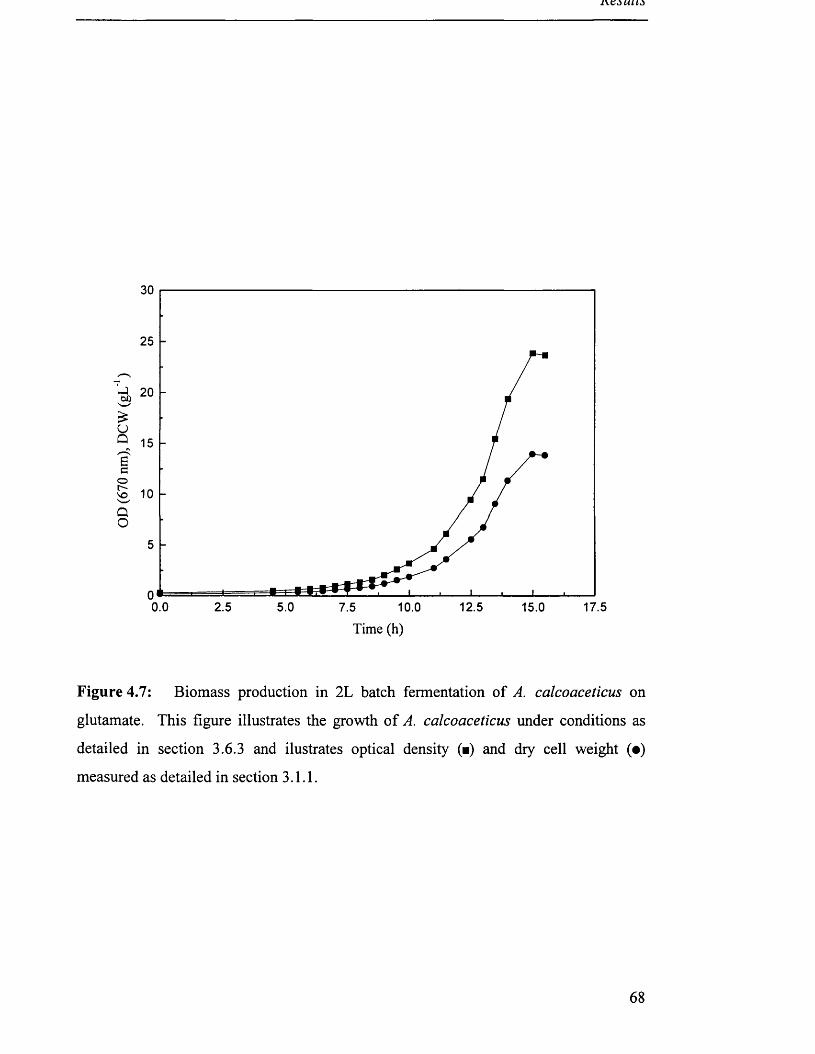
£oQ
0.0 2 .5 5 .0 1 2 .5 1 7 .510.0 15 .07 .5
Time (h)
Figure 4.7: Biomass production in 2L batch fermentation of A. calcoaceticus on
glutamate. This figure illustrates the growth of A. calcoaceticus under conditions as
detailed in section 3.6.3 and ilustrates optical density (■) and dry cell weight (•)
measured as detailed in section 3.1.1.
68
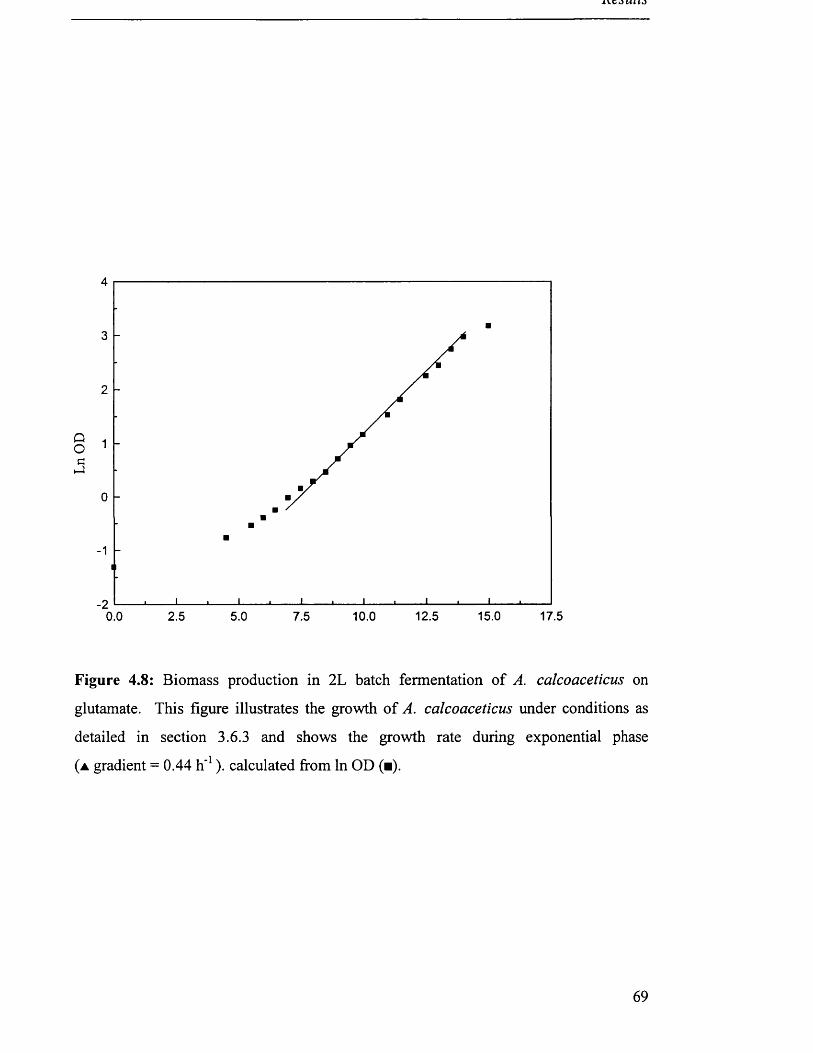
4
3
2
GH-)
0
-1
-20 .0 2 .5 5 .0 7 .5 10 .0 1 2 .5 1 5 .0 17 .5
Figure 4.8: Biomass production in 2L batch fermentation of A. calcoaceticus on
glutamate. This figure illustrates the growth of A. calcoaceticus under conditions as
detailed in section 3.6.3 and shows the growth rate during exponential phase
( a gradient = 0.44 h '1). calculated from In OD (■).
■■
69
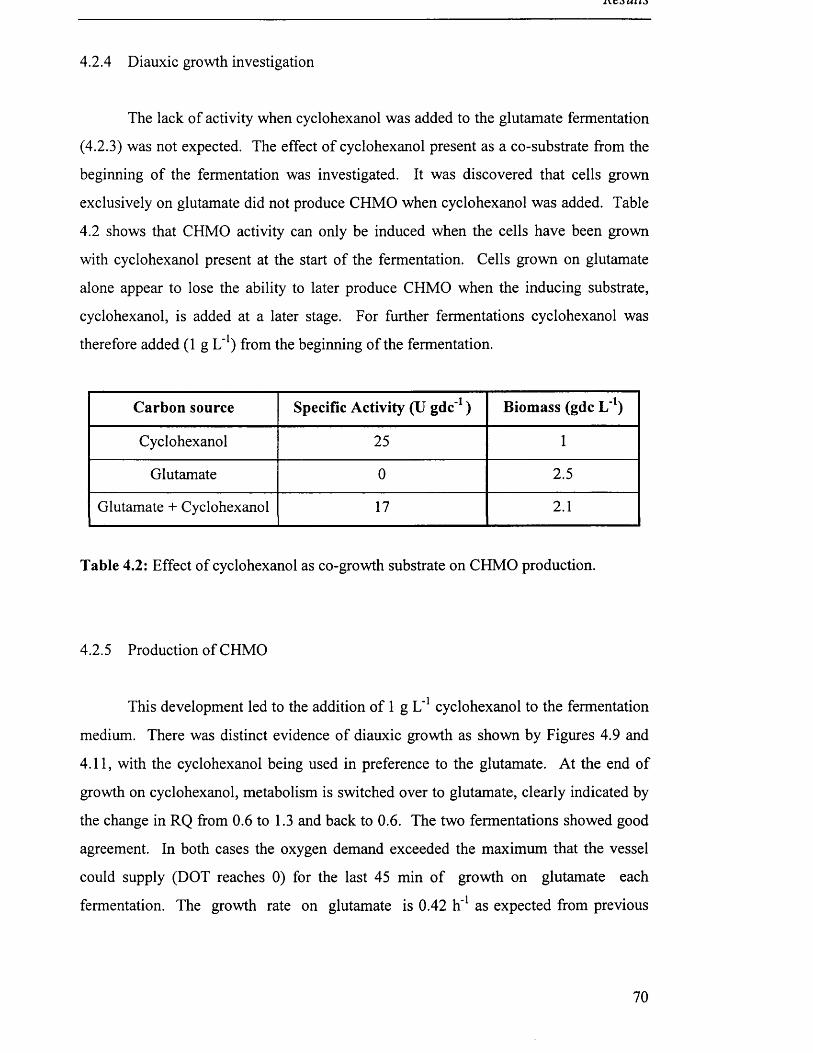
1 Y C O U t t J
4.2.4 Diauxic growth investigation
The lack of activity when cyclohexanol was added to the glutamate fermentation
(4.2.3) was not expected. The effect of cyclohexanol present as a co-substrate from the
beginning of the fermentation was investigated. It was discovered that cells grown
exclusively on glutamate did not produce CHMO when cyclohexanol was added. Table
4.2 shows that CHMO activity can only be induced when the cells have been grown
with cyclohexanol present at the start of the fermentation. Cells grown on glutamate
alone appear to lose the ability to later produce CHMO when the inducing substrate,
cyclohexanol, is added at a later stage. For further fermentations cyclohexanol was
therefore added (1 g L '1) from the beginning of the fermentation.
Carbon source Specific Activity (U gdc"1) Biomass (gdc L'1)
Cyclohexanol 25 1
Glutamate 0 2.5
Glutamate + Cyclohexanol 17 2.1
Table 4.2: Effect of cyclohexanol as co-growth substrate on CHMO production.
4.2.5 Production of CHMO
This development led to the addition of 1 g L '1 cyclohexanol to the fermentation
medium. There was distinct evidence of diauxic growth as shown by Figures 4.9 and
4.11, with the cyclohexanol being used in preference to the glutamate. At the end of
growth on cyclohexanol, metabolism is switched over to glutamate, clearly indicated by
the change in RQ from 0.6 to 1.3 and back to 0.6. The two fermentations showed good
agreement. In both cases the oxygen demand exceeded the maximum that the vessel
could supply (DOT reaches 0) for the last 45 min of growth on glutamate each
fermentation. The growth rate on glutamate is 0.42 h '1 as expected from previous
70
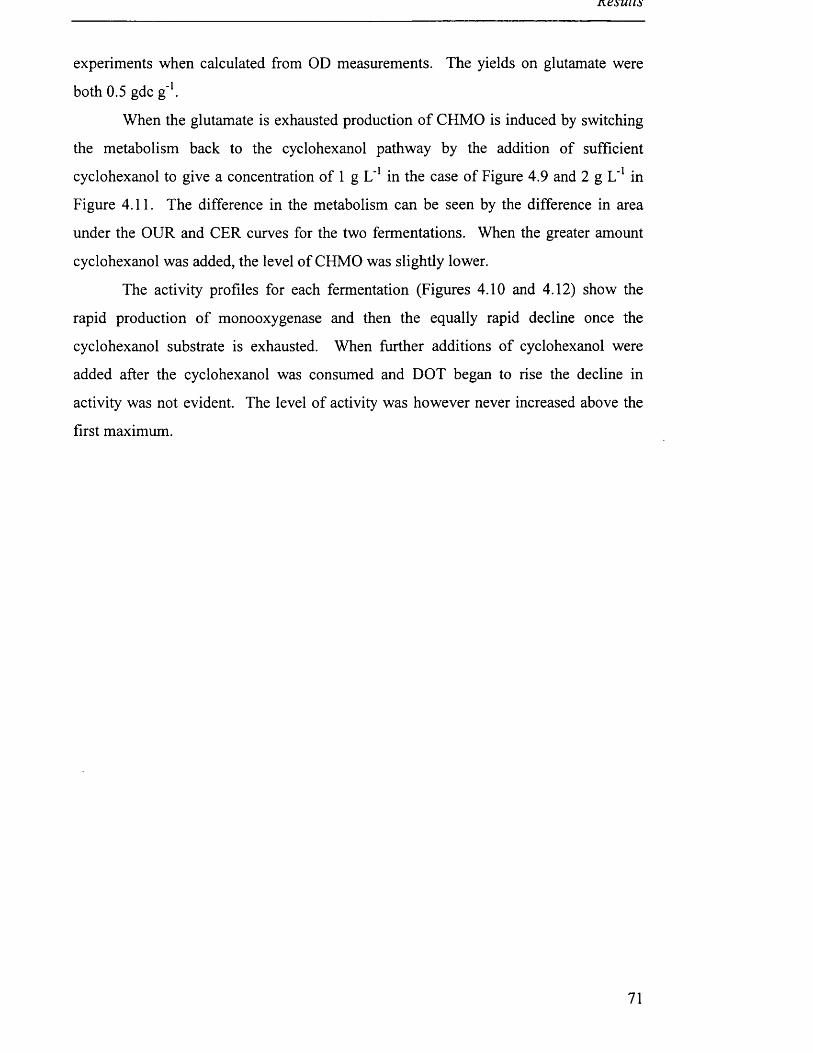
Jesuits
experiments when calculated from OD measurements. The yields on glutamate were
both 0.5 gdc g '1.
When the glutamate is exhausted production of CHMO is induced by switching
the metabolism back to the cyclohexanol pathway by the addition of sufficient
cyclohexanol to give a concentration of 1 g L'1 in the case of Figure 4.9 and 2 g L’1 in
Figure 4.11. The difference in the metabolism can be seen by the difference in area
under the OUR and CER curves for the two fermentations. When the greater amount
cyclohexanol was added, the level of CHMO was slightly lower.
The activity profiles for each fermentation (Figures 4.10 and 4.12) show the
rapid production of monooxygenase and then the equally rapid decline once the
cyclohexanol substrate is exhausted. When further additions of cyclohexanol were
added after the cyclohexanol was consumed and DOT began to rise the decline in
activity was not evident. The level of activity was however never increased above the
first maximum.
71
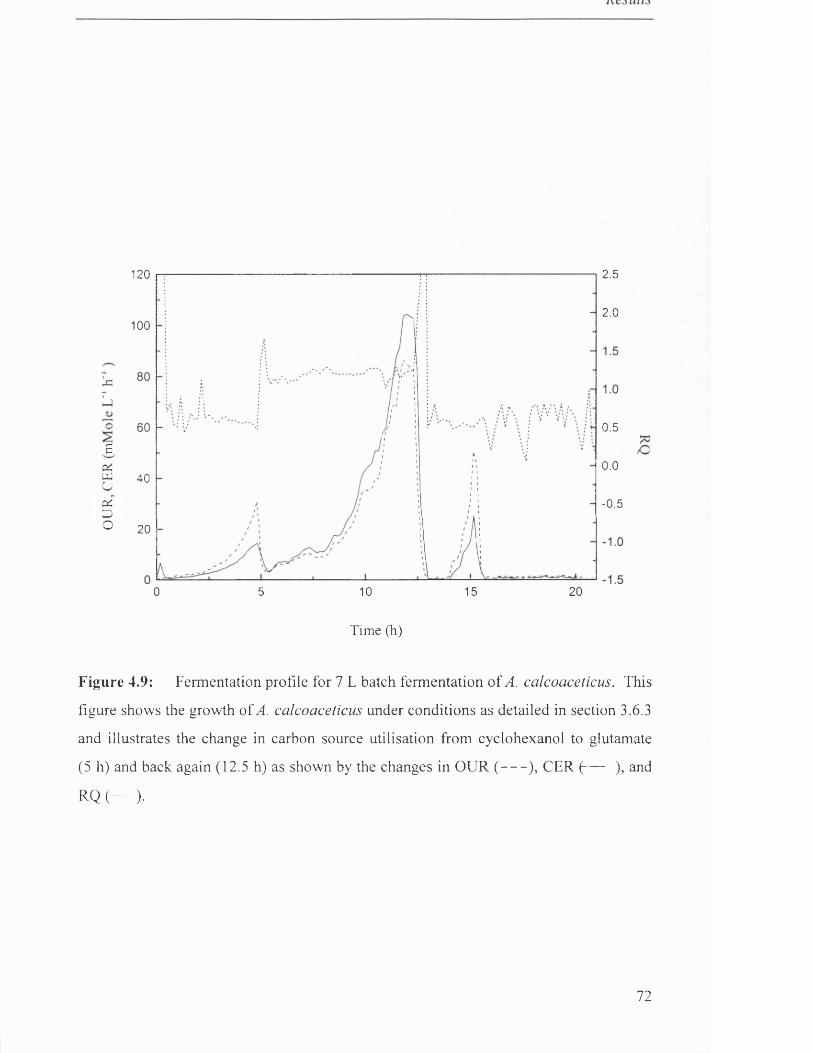
120 2.5
2.0100
0.5Gc
o.oC4LUuCCDo
40
-0.5
20
200 5 10 15
Time (h)
Figure 4.9: Fermentation profile for 7 L batch fermentation of A. calcoaceticus. This
figure shows the growth of A. calcoaceticus under conditions as detailed in section 3.6.3
and illustrates the change in carbon source utilisation from cyclohexanol to glutamate
(5 h) and back again (12.5 h) as shown by the changes in OUR (----- ), CER (— ), and
RQ( )•
72
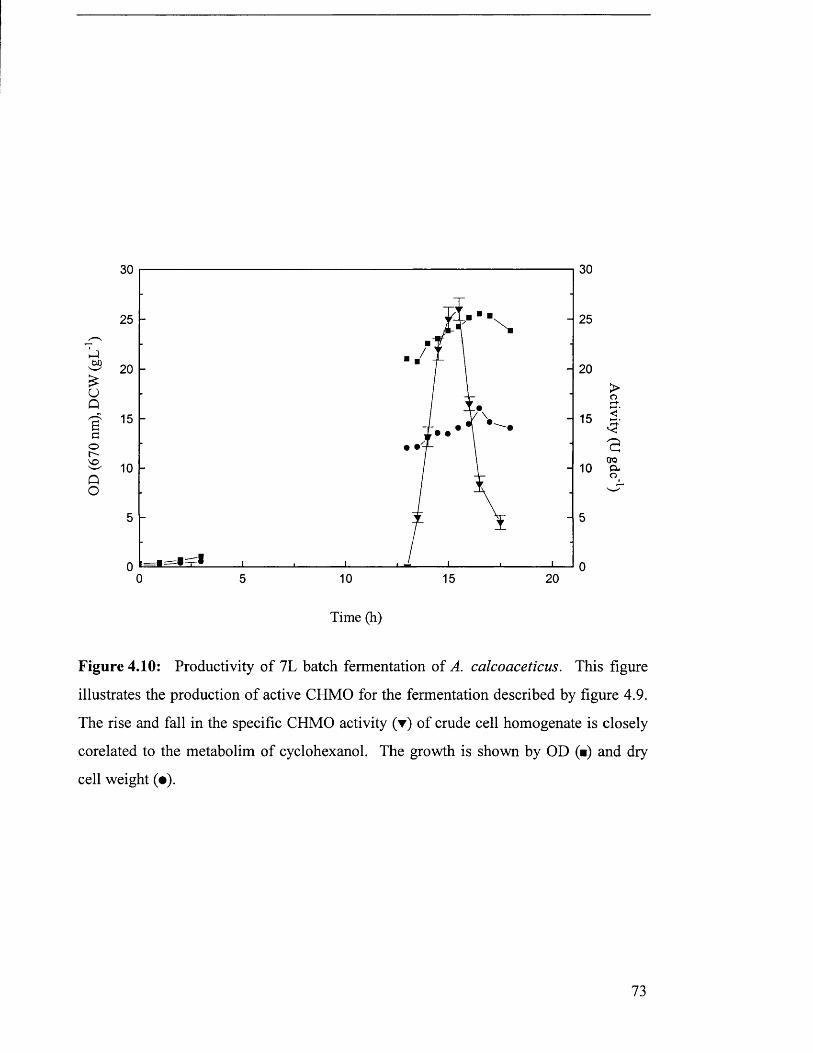
M£uQI fco
QO
30
25
20
15• •
• •'10
5
0 10 15 205
30
25
20>o
15 5c*+*v:-a
10 o-
Time (h)
Figure 4.10: Productivity of 7L batch fermentation of A. calcoaceticus. This figure
illustrates the production of active CHMO for the fermentation described by figure 4.9.
The rise and fall in the specific CHMO activity (▼) of crude cell homogenate is closely
corelated to the metabolim of cyclohexanol. The growth is shown by OD (■) and dry
cell weight (•).
73
2.0120
100
60
0.5
40
0.0
-0.50 5 10 15
Time (h)
Figure 4.11: Fermentation profile for 7 L batch fermentation of A. calcoaceticus. This
figure shows the growth of A. calcoaceticus under conditions as detailed in section 3.6.3
and illustrates the change in carbon source utilisation from cyclohexanol to glutamate
(6 h) and back again (13 h) as shown by the changes in OUR (----- ), CER-(----- ), and
RQ ( )•
74
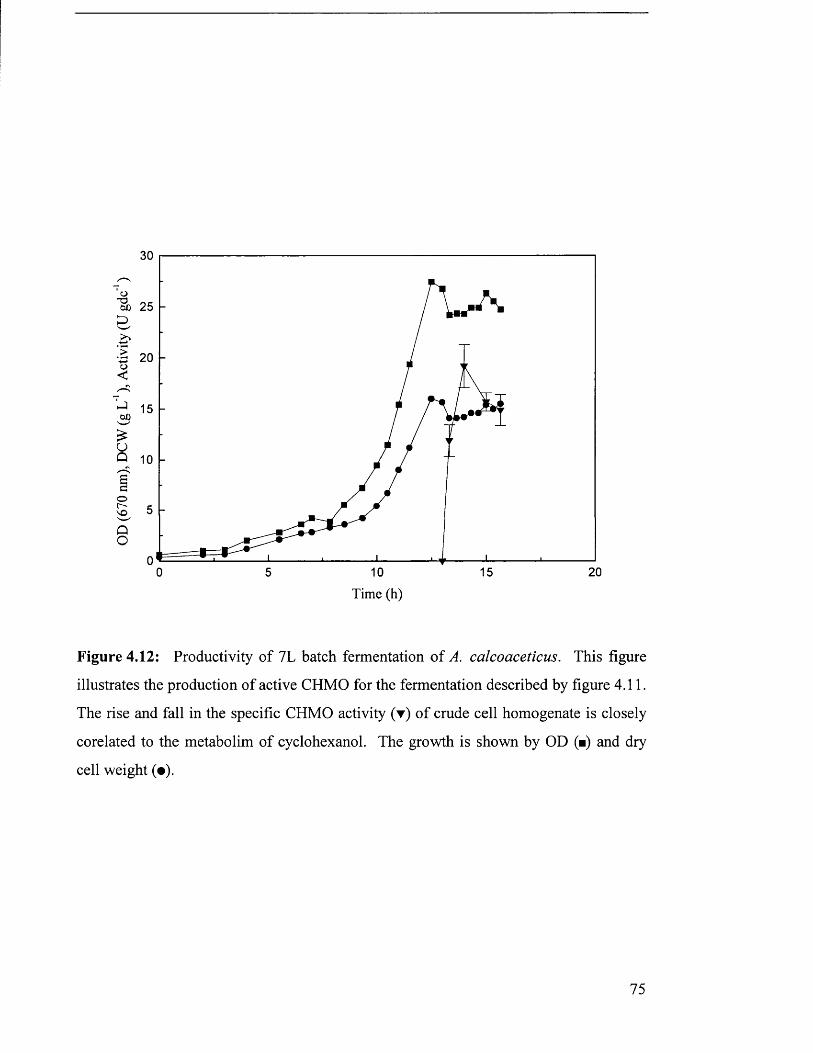
30
o~o00D&> 20
£UQ
or-voQO
10 15 200 5
Time (h)
Figure 4.12: Productivity of 7L batch fermentation of A. calcoaceticus. This figure
illustrates the production of active CHMO for the fermentation described by figure 4.11.
The rise and fall in the specific CHMO activity (▼) of crude cell homogenate is closely
corelated to the metabolim of cyclohexanol. The growth is shown by OD (■) and dry
cell weight (•).
75
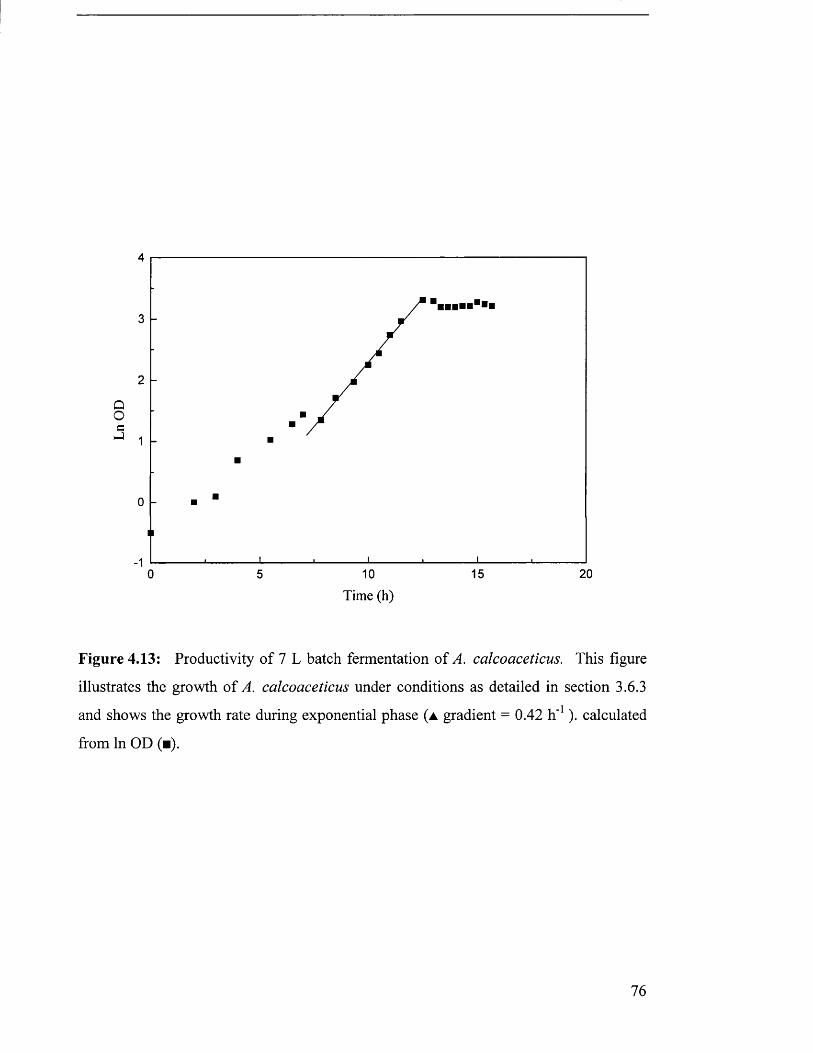
4
3
2
Q O cJ 1
0
-120
Figure 4.13: Productivity of 7 L batch fermentation of A. calcoaceticus. This figure
illustrates the growth of A. calcoaceticus under conditions as detailed in section 3.6.3
and shows the growth rate during exponential phase ( a gradient = 0.42 h '1). calculated
from In OD (■).
76
4.3 Growth of Escherichia coli JM107/pQR210
4.3.1 Carbon source investigation
A recombinant E. coli strain containing a plasmid pQR210 with the CHMO gene
from A. calcoaceticus was constructed (section 3.3). The gene was under the control of
a tac promoter and was thus induced by the addition of IPTG to the culture. Shake flask
experiments to assess the levels of CHMO expression in the recombinant E. coli strain
JM107/pQR210 were performed. The construct was found to express active CHMO
when grown on a proprietary nutrient complex medium (50 Ugdc'1). This medium
contains some glucose which is known to repress the tac promoter so a complex
medium (medium 1, table 3.3) with glycerol as the sole carbon source was used. The
specific CHMO activity (330 U gdc'1) was found to be increased six fold (Figure 4.14).
4.3.2 IPTG concentration investigation
Isopropyl thiogalactopyranoside (IPTG) is used to induce the expression of
genes under the control of lac/tac promoters. It is however expensive to use and so the
minimum required concentration for maximum expression should be used. Flasks with
medium 1 were inoculated with an aliquot from a growing culture and incubated and
monitored under the usual conditions.
After 6 hours varying amounts of IPTG were added and samples taken for
analysis at intervals. Figure 4.15 shows that there is no significant difference
between the induction of CHMO when the concentration of IPTG is 0.25 mM and
above. It is interesting to note the apparent interruption to growth as the IPTG was
added presumably as metabolism changed to produce CHMO. There was a lag of 80
minutes before CHMO activity could be detected and production of CHMO increased as
the growth rate picked up once again. The specific activity reached a maximum of
between 180 and 230 U g'1 dry cells 4 hours after addition of IPTG.
77
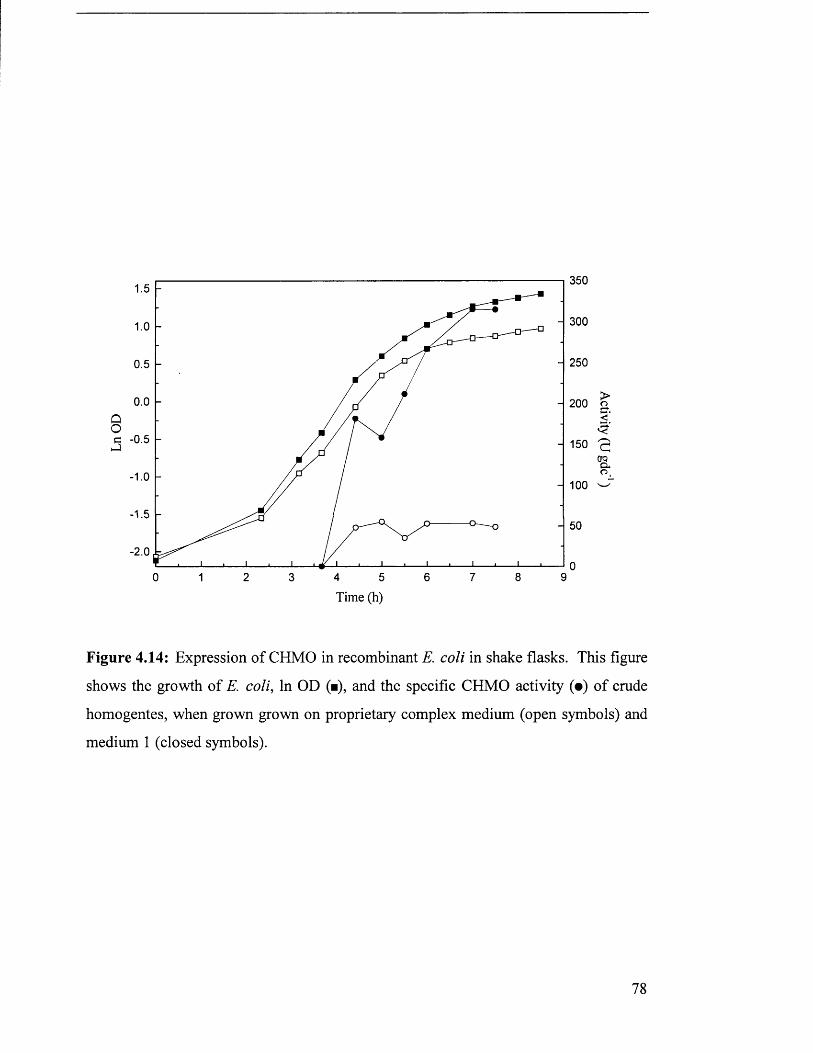
350
300
0.5
0.0QOC -0.5
200
150
100
- 2.0
6 8 90 1 2 3 5 74Time (h)
Figure 4.14: Expression of CHMO in recombinant E. coli in shake flasks. This figure
shows the growth of E. coli, In OD (■), and the specific CHMO activity (•) of crude
homogentes, when grown grown on proprietary complex medium (open symbols) and
medium 1 (closed symbols).
78
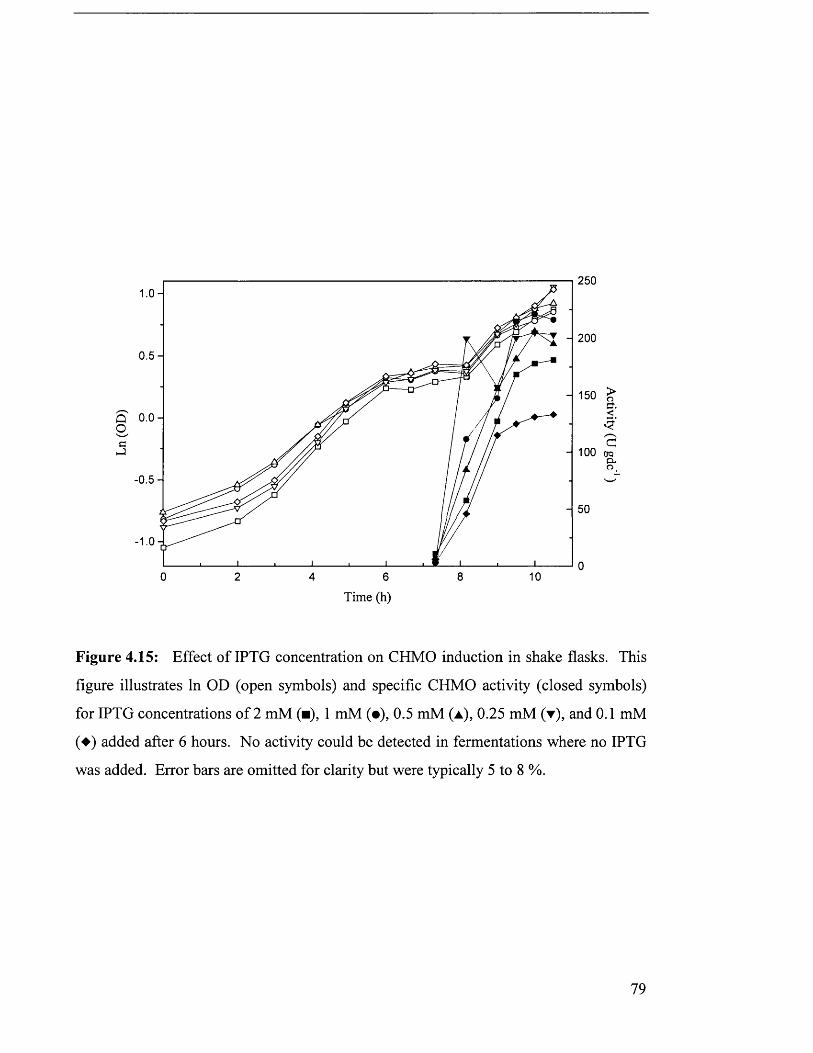
250
2000.5
150
Q 0.0 O c 100
-0.5
8 100 2 4 6Time (h)
Figure 4.15: Effect of IPTG concentration on CHMO induction in shake flasks. This
figure illustrates In OD (open symbols) and specific CHMO activity (closed symbols)
for IPTG concentrations of 2 mM (■), 1 mM (•), 0.5 mM (a ), 0.25 mM (y ), and 0.1 mM
(♦) added after 6 hours. No activity could be detected in fermentations where no IPTG
was added. Error bars are omitted for clarity but were typically 5 to 8 %.
19
4.3.3 Plasmid retention during shake flasks fermentations
There are two main factors that could have affected the productivity when grown
on defined medium. Protein expression could have been lower due to a lack of some
nutrient or the loss of the plasmid from some of the cells. Cells that have lost the
plasmid containing the CHMO gene will not produce the desired protein.
Plasmid stability is therefore vital to a highly productive fermentation. Table 4.3
illustrates the plasmid retention which was determined as described in section 3.7.5.
The results show that the plasmid displayed good stability in shake flasks and are
therefore likely to be of sufficient stability for fermenter growth.
Flask Complex Medium 1 Defined Medium 3
6 h (%) 10 h (%) 22 h (%) 6 h (%) 12 h (%) 22 h (%)
1 99 99 95 100 98 94
2 100 100 97 99 97 88
3 98 97 94 96 98 91
Table 4.3: Plasmid stability of E. coli JM107/pQR210 in shake flasks.
4.3.4 Growth on complex medium
From these experiments the fermentation was scaled up to 7 L (5 L working
volume) with 15 g L'1 glycerol (medium 2, section 3.7.1) to find the growth and CHMO
induction profile characteristics (Figure 4.16). The induction of CHMO was achieved
by the addition of sufficient IPTG to give a final concentration of 0.5 mM.
A dry cell weight concentration of 7 g L’1 (Figure 4.17) was achieved with a
growth rate of 0.7 h’1 giving a yield of ~ 0.5 g dry cells g '1 glycerol. The values for OUR
and CER are higher than previously achieved due to increased pressure within the vessel
80
caused by a partial blockage of the outlet filter by condensation of water in the off-gas.
This allowed a greater cell concentration to be achieved before the fermentation
conditions became oxygen limiting than would otherwise have been possible. Growth
on this complex medium produced a large amount of foam that required large additions
of antifoam.
CHMO production was induced after 3.5 hours when growth was exponential
with a maximum specific enzyme activity of 800 U g’1 dry cells, two hours after
induction. This is over twice the activity that was in found in shake flasks most likely
due to the increased mass transfer in the fermenter allowing more optimal metabolism.
This was investigated by repeating the fermentation with 30 g L '1 glycerol and
with induction after 6 hours; the culture becoming oxygen limited during the production
of CHMO (Figures 4.19 and 4.20).
The fermentation profile shows good agreement with the previous fermentation
although there is less of a lag before exponential growth phase. The growth rate and the
expression of CHMO is reduced (280 U gdc'1) as the culture becomes oxygen limited.
The dissolved oxygen tension during this period fell to 3 % with the gas flow rate at
1 v v ' 1 and the stirrer speed at 1100 rpm, the maximum for the vessel.
It was therefore important that subsequent fermentations be induced before any
oxygen limitation.
81
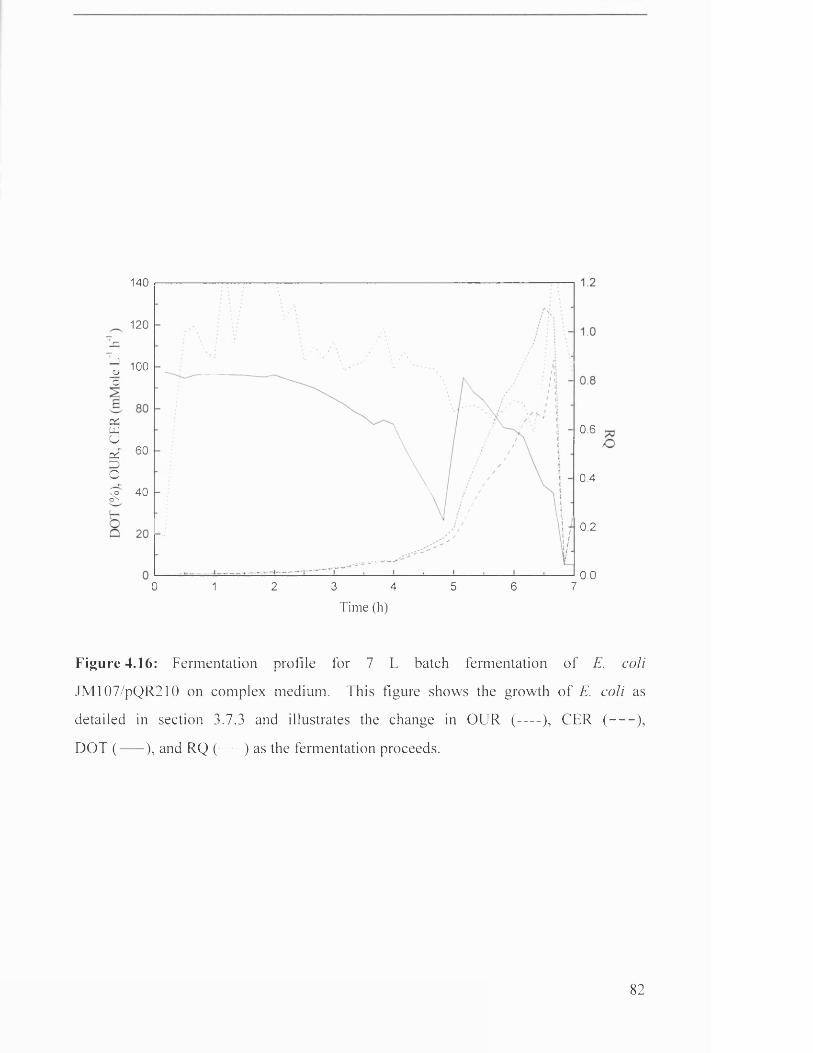
140
120r—
J 100jUo
O'UJ O * 60
OCo' 40ox
0.6
0.4
0.2
0.00 1 2 3 5 6 74
Tim e (h)
Figure 4.16: Fermentation profile for 7 L batch fermentation of E. coli
JM107/pQR210 on complex medium. This figure shows the growth of E. coli as
detailed in section 3.7.3 and illustrates the change in OUR (-----), CER (----- ),
DOT ( ----- ), and RQ ( ) as the fermentation proceeds.
82
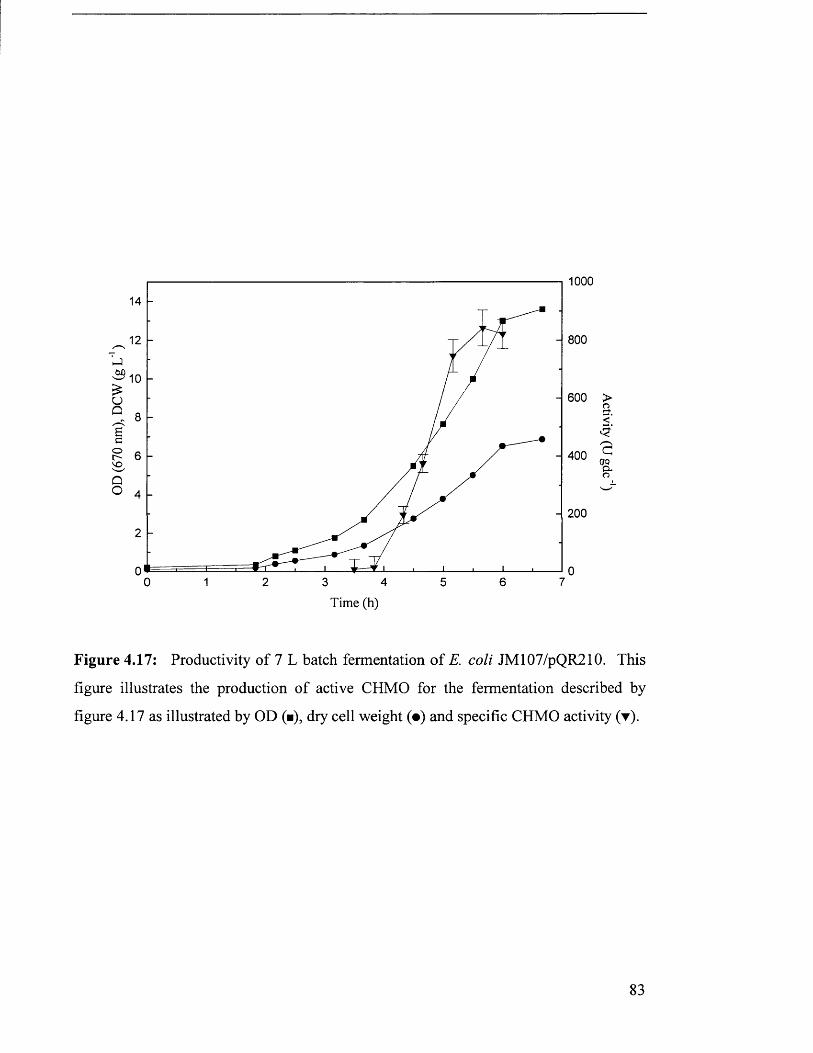
39£uQ
or-~VOQO
100014
80012
10600
8
4006
4200
2
00 3 6 71 2 4 5
or+<’*5’
CTQCLo
Time (h)
Figure 4.17: Productivity of 7 L batch fermentation of E. coli JM107/pQR210. This
figure illustrates the production of active CHMO for the fermentation described by
figure 4.17 as illustrated by OD (■), dry cell weight (•) and specific CHMO activity (▼).
83
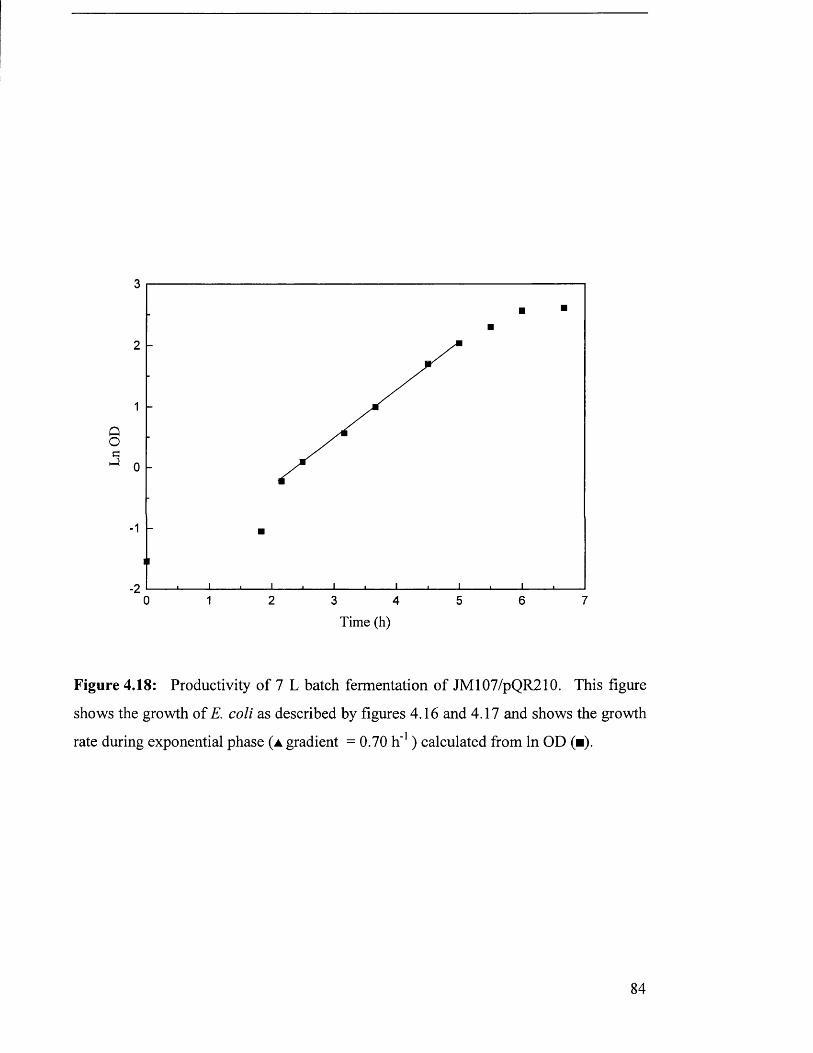
3
2
1
0
1
20 1 2 3 6 74 5
Time (h)
Figure 4.18: Productivity of 7 L batch fermentation of JM107/pQR210. This figure
shows the growth of E. coli as described by figures 4.16 and 4.17 and shows the growth
rate during exponential phase ( a gradient = 0.70 h '1) calculated from In OD (■).
84
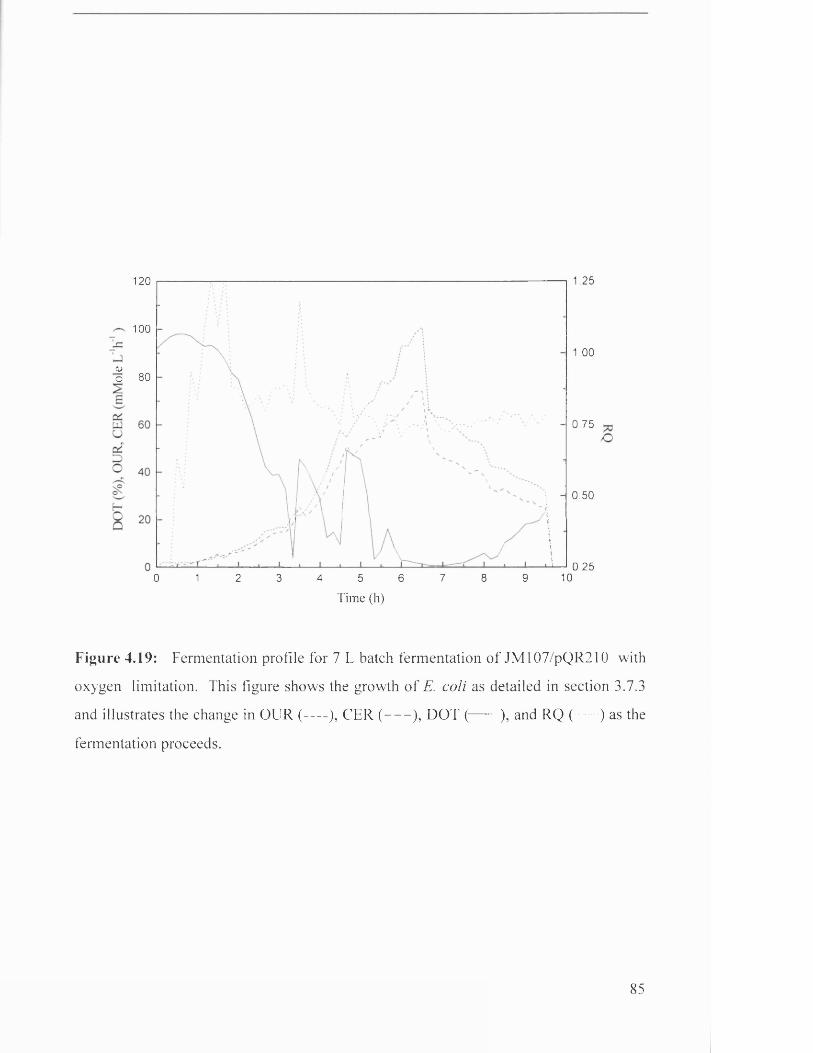
1.25120
1001.00
<L>o 80
0.75
0.50
0.25100 1 2 3 6 7 8 94 5
Time (h)
Figure 4.19: Fermentation profile for 7 L batch fermentation of JM107/pQR210 with
oxygen limitation. This figure shows the growth of E. coli as detailed in section 3.7.3
and illustrates the change in OUR (-----), CER-(------),-DOT-(---- ), and RQ ( ) as the
fermentation proceeds.
85
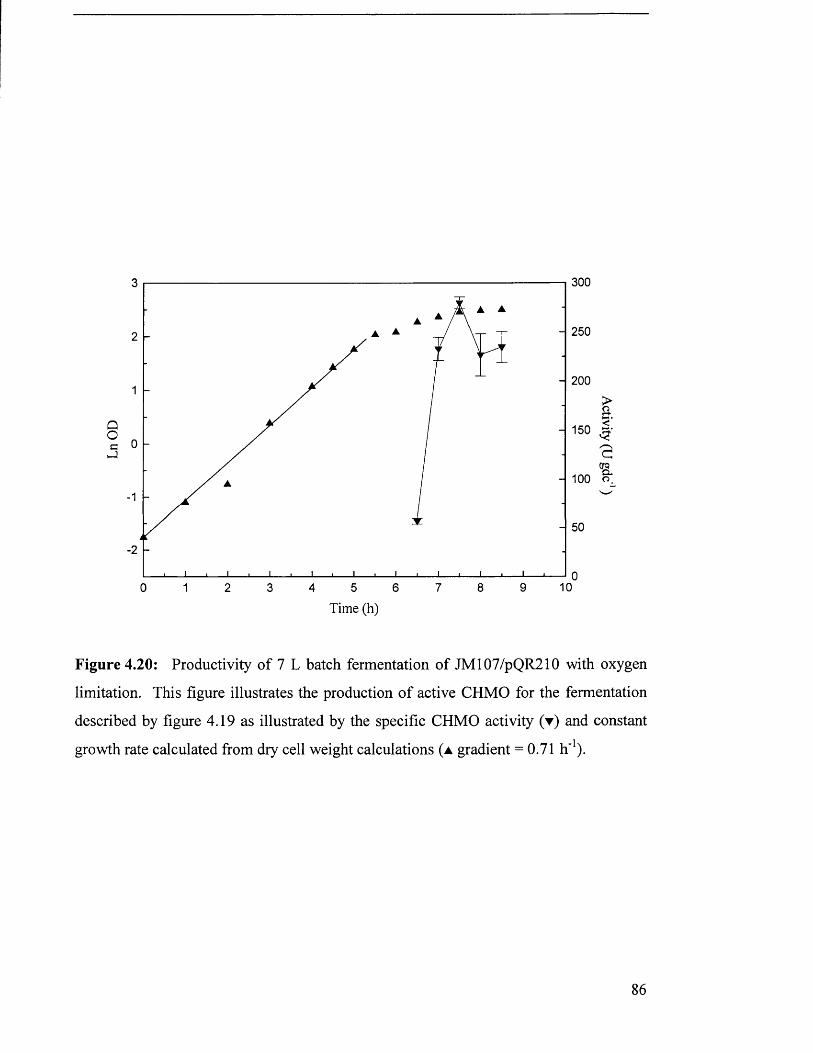
QOc
3003
2502
2001
1500
1001
■2
04 5 6
Time (h)10
>a<"
•a'S.
Figure 4.20: Productivity of 7 L batch fermentation of JM107/pQR210 with oxygen
limitation. This figure illustrates the production of active CHMO for the fermentation
described by figure 4.19 as illustrated by the specific CHMO activity (y ) and constant
growth rate calculated from dry cell weight calculations ( a gradient = 0.71 h’1).
86
4.3.5 Growth on defined medium
Defined minimal media are preferred for industrial fermentations so it was
considered necessary to examine any changes that such a medium may have on
productivity. A defined medium would also allow the implementation of a fed batch
regime to increase maximum cell density and hence productivity, without the foaming
problems encountered with a complex proteinaceous medium.
A defined medium was chosen (media 3-6, section 3.7.1) that was known to be a
good medium for this strain of E. coli (Hobbs et al. 1996).
To maximise productivity from the fermentation it would be necessary to grow
the cells to the highest cell concentration possible. This would require a fed batch
regime since dissolved oxygen concentration has been shown to be an important factor
in the expression of CHMO. The growth rate can be controlled so as not to exceed the
oxygen transfer capabilities of the fermenter.
Initial experiments used medium 6 (section 3.7.1) with 15 g L’1 glycerol so as to
gain data that would be required for future fed batch fermentations.
Figure 4.21 shows a typical fermentation profile. The growth rate was
significantly lower ( p = 0.43 h _1) than with a complex medium. The growth rate
estimated from the natural logarithm of OUR and CER was 0.47 h _1 which showed
good agreement with that taken from OD measurements.
The culture grew to a dry cell weight of 7 g L"1, (Figures 4.22 and 4.23) with a
yield on glycerol of 0.47 g g"1. These data were used to control fed batch fermentations
using the algorithms outlined in section 3.7.4.
87
100
'_c
cc DULUuo'O 40
Q
106 80 2 4
Tim e (h)
Figure 4.21: Fermentation profile for 7 L batch fermentation of E. coli
JM107/pQR210 on defined medium. This figure shows the growth of E. coli as detailed
in section 3.7.3 and illustrates the change in OUR (-----), CER (------), DOT (---- ), and
RQ ( ) as the fermentation proceeds.
88
00£UQS'cor-voQO
16
14
12
10
8
6
4
2
00 2 6 8 10 124
Time (h)
Figure 4.22: Biomass production in 2L batch fermentation of JM107/pQR210 on
defined medium. This figure illustrates the growth of E. coli as described in figure 4.21
and illustrates optical density (■) and dry cell weight (•) measured as detailed in section
3.1.1
89
3
2
1
0
1120 2 6 8 104
Time (h)
Figure 4.23: Biomass production in 7 L batch fermentation of JM107/pQR210 on
defined medium. This figure illustrates the growth of E. coli under conditions as
described by figures 4.21 and 4.22 and shows the growth rate during exponential phase
(■ gradient = 0.43 h '1).
90
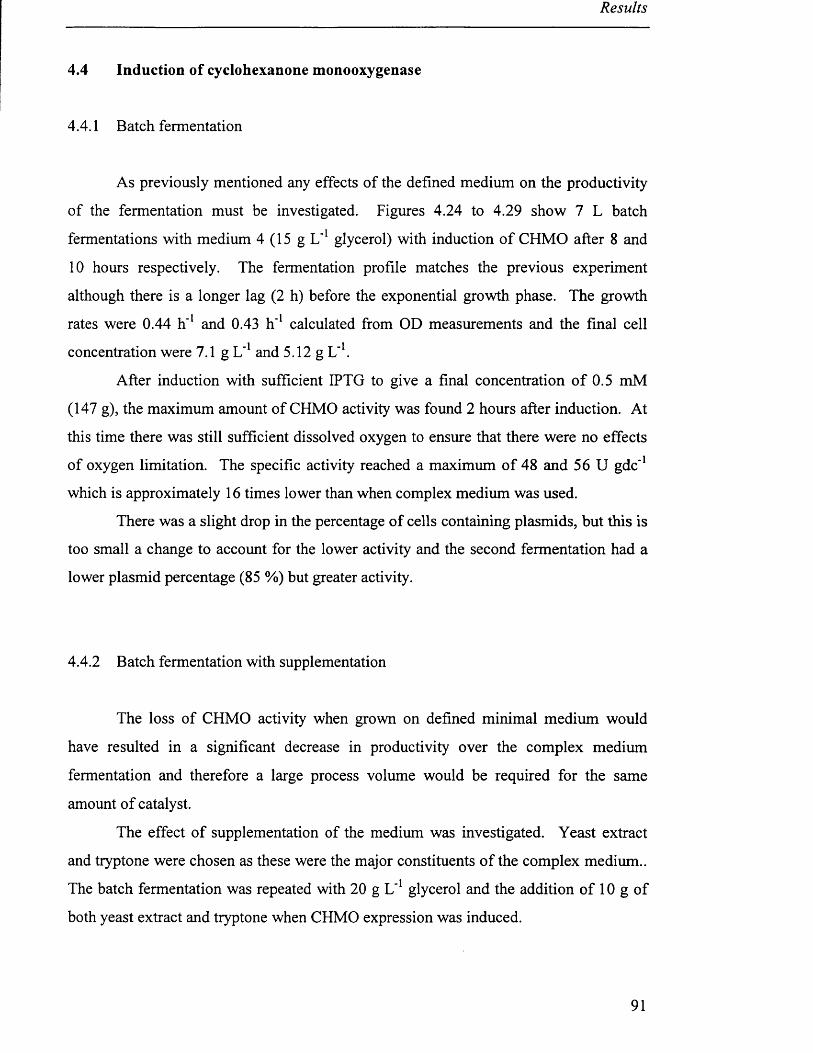
Results
4.4 Induction of cyclohexanone monooxygenase
4.4.1 Batch fermentation
As previously mentioned any effects of the defined medium on the productivity
of the fermentation must be investigated. Figures 4.24 to 4.29 show 7 L batch
fermentations with medium 4 (15 g L '1 glycerol) with induction of CHMO after 8 and
10 hours respectively. The fermentation profile matches the previous experiment
although there is a longer lag (2 h) before the exponential growth phase. The growth
rates were 0.44 h '1 and 0.43 h*1 calculated from OD measurements and the final cell
concentration were 7.1 g L '1 and 5.12 g L'1.
After induction with sufficient IPTG to give a final concentration of 0.5 mM
(147 g), the maximum amount of CHMO activity was found 2 hours after induction. At
this time there was still sufficient dissolved oxygen to ensure that there were no effects
of oxygen limitation. The specific activity reached a maximum of 48 and 56 U gdc*1
which is approximately 16 times lower than when complex medium was used.
There was a slight drop in the percentage of cells containing plasmids, but this is
too small a change to account for the lower activity and the second fermentation had a
lower plasmid percentage (85 %) but greater activity.
4.4.2 Batch fermentation with supplementation
The loss of CHMO activity when grown on defined minimal medium would
have resulted in a significant decrease in productivity over the complex medium
fermentation and therefore a large process volume would be required for the same
amount of catalyst.
The effect of supplementation of the medium was investigated. Yeast extract
and tryptone were chosen as these were the major constituents of the complex medium..
The batch fermentation was repeated with 20 g L*1 glycerol and the addition of 10 g of
both yeast extract and tryptone when CHMO expression was induced.
91
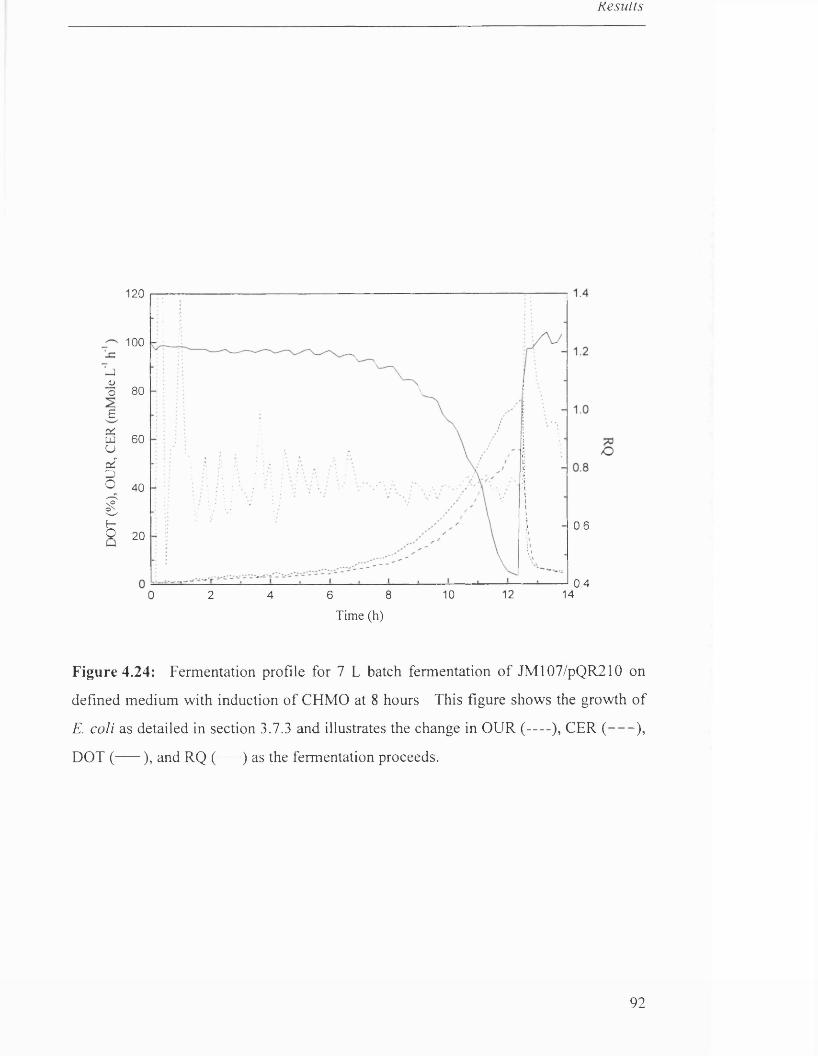
Results
120
100
— i<L>o 80
£cCuli 60 Uo£DO 40
gt—Q 20
0.6
0.410 12 146 80 2 4
Tim e (h)
Figure 4.24: Fermentation profile for 7 L batch fermentation of JM107/pQR210 on
defined medium with induction of CHMO at 8 hours This figure shows the growth of
E. coli as detailed in section 3.7.3 and illustrates the change in OUR (---- ), CER (------),
DOT (----- ), and RQ ( ) as the fermentation proceeds.
92
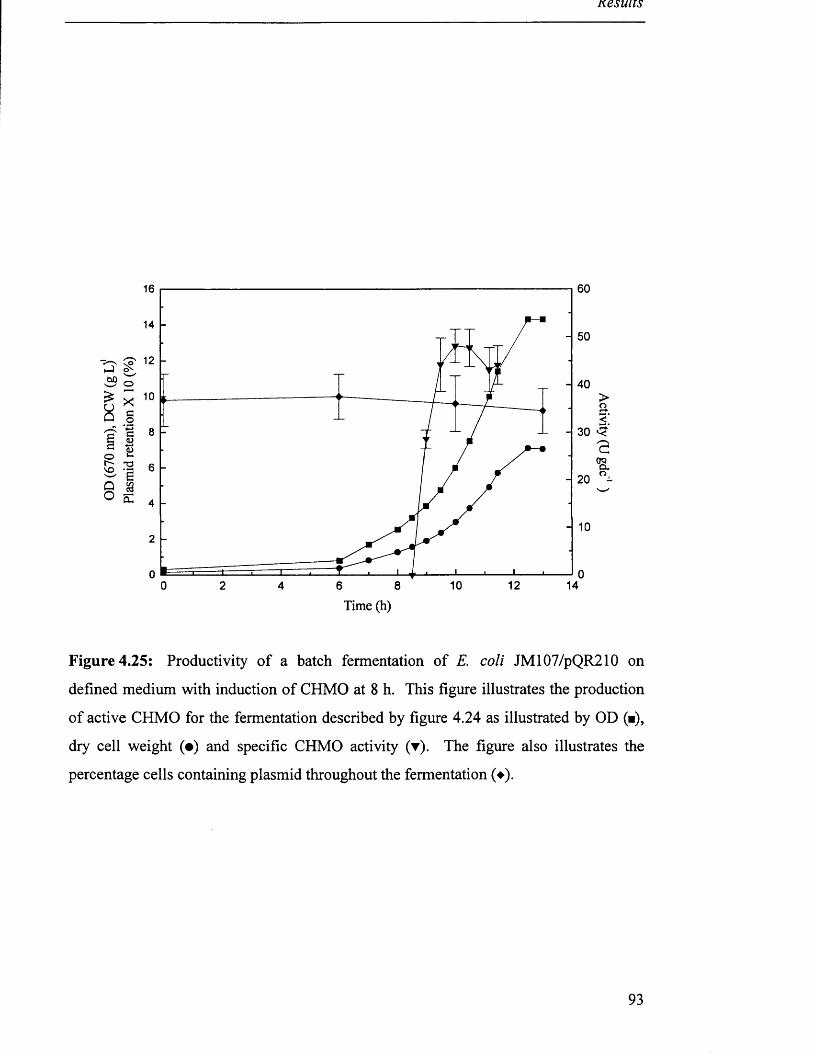
Results
16
14
40
30 C?8o (JQ
C l6
o E 4
2
010 12 140 82 64
Time (h)
Figure 4.25: Productivity of a batch fermentation of E. coli JM107/pQR210 on
defined medium with induction of CHMO at 8 h. This figure illustrates the production
of active CHMO for the fermentation described by figure 4.24 as illustrated by OD (■),
dry cell weight (•) and specific CHMO activity (▼). The figure also illustrates the
percentage cells containing plasmid throughout the fermentation (♦).
93
ncsuiis
3
2
1
0
1
210 12 140 2 6 84
Time (h)
Figure 4.26: Productivity of batch fermentation of E. coli JM107/pQR210 on defined
medium with induction of CHMO at 8 h. This figure illustrates the growth of E. coli
under conditions as described by figures 4.24 and 4.25 and shows the growth rate during
exponential phase (■ gradient = 0.44 h’1).
94
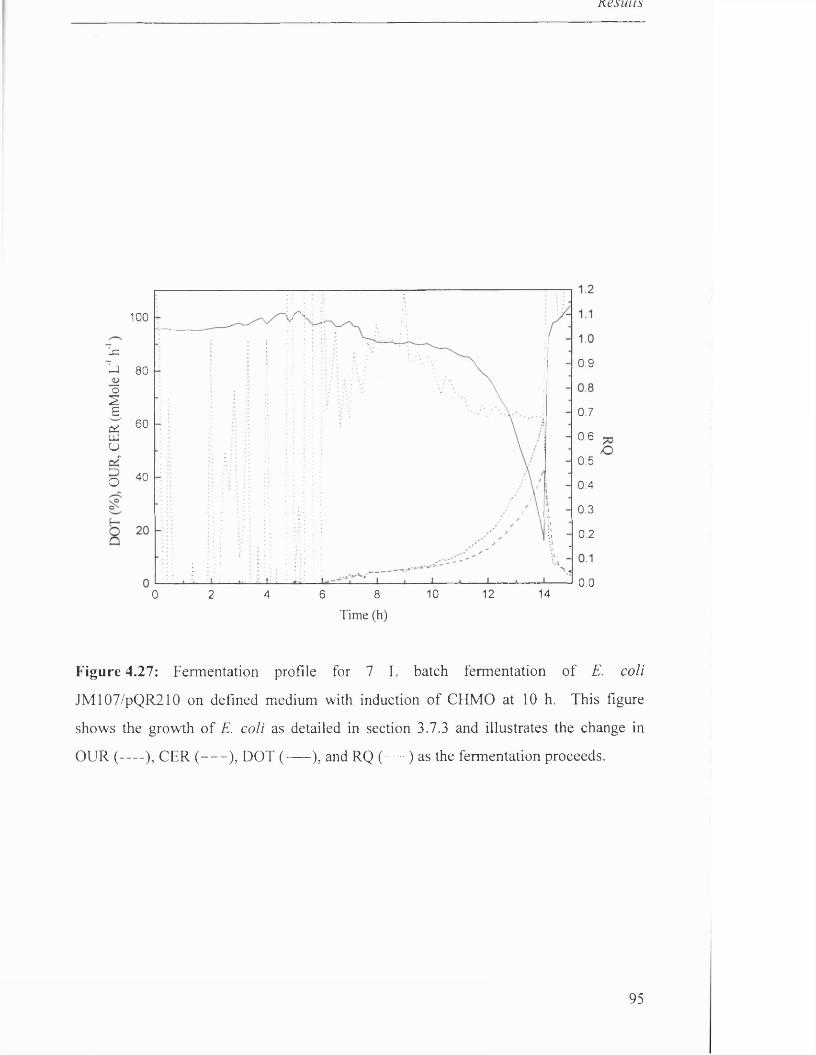
Kesuiis
100
_c
T-> 80o2ES 60UJu
o 40
0.9
0.7
0.6
0.5
0.4
0.3
0.2
0.01410 120 2 6 84
Tim e (h)
Figure 4.27: Fermentation profile for 7 L batch fermentation of E. coli
JM107/pQR210 on defined medium with induction of CHMO at 10 h. This figure
shows the growth of E. coli as detailed in section 3.7.3 and illustrates the change in
OUR (---- ), CER (----- ), DOT ( ----- ), and RQ ( ) as the fermentation proceeds.
95
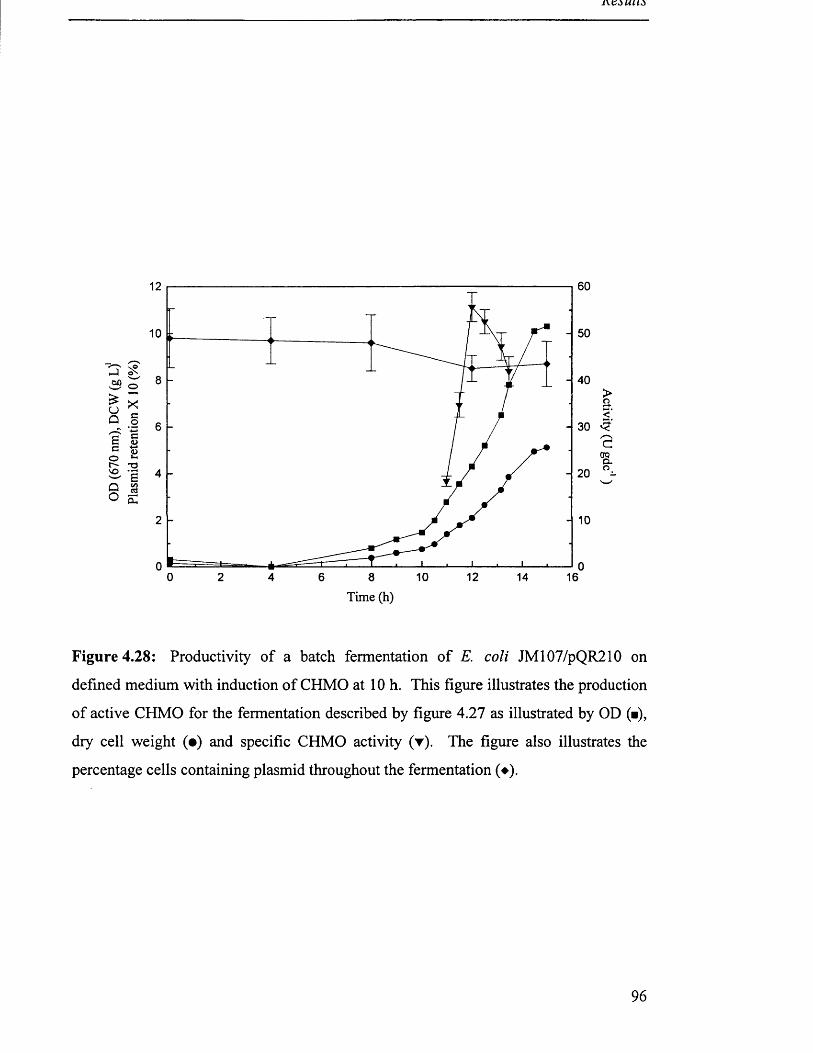
12
10
8 40
6
oq4
2
0120 2 6 8 10 14 164
Time (h)
Figure 4.28: Productivity of a batch fermentation of E. coli JM107/pQR210 on
defined medium with induction of CHMO at 10 h. This figure illustrates the production
of active CHMO for the fermentation described by figure 4.27 as illustrated by OD (■),
dry cell weight (•) and specific CHMO activity (▼). The figure also illustrates the
percentage cells containing plasmid throughout the fermentation (♦).
96
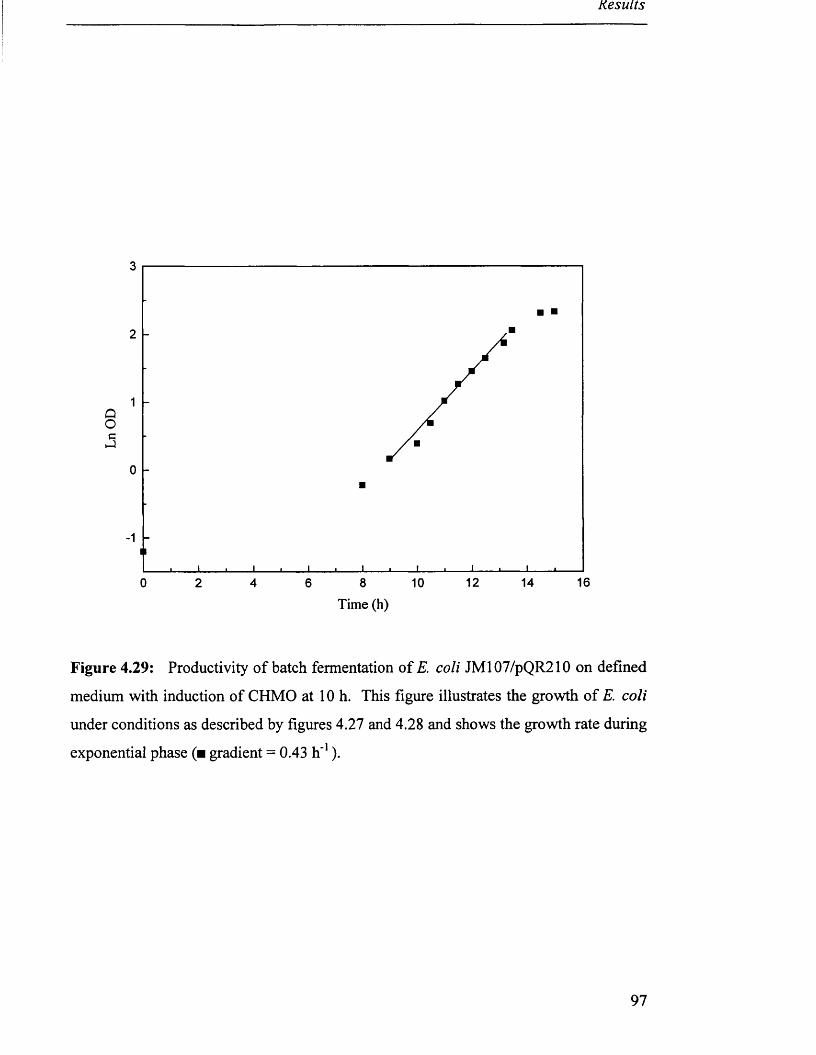
Results
3
2
1
0
1
12 168 140 2 6 104
Time (h)
Figure 4.29: Productivity of batch fermentation of E. coli JM107/pQR210 on defined
medium with induction of CHMO at 10 h. This figure illustrates the growth of E. coli
under conditions as described by figures 4.27 and 4.28 and shows the growth rate during
exponential phase (■ gradient = 0.43 h '1).
97
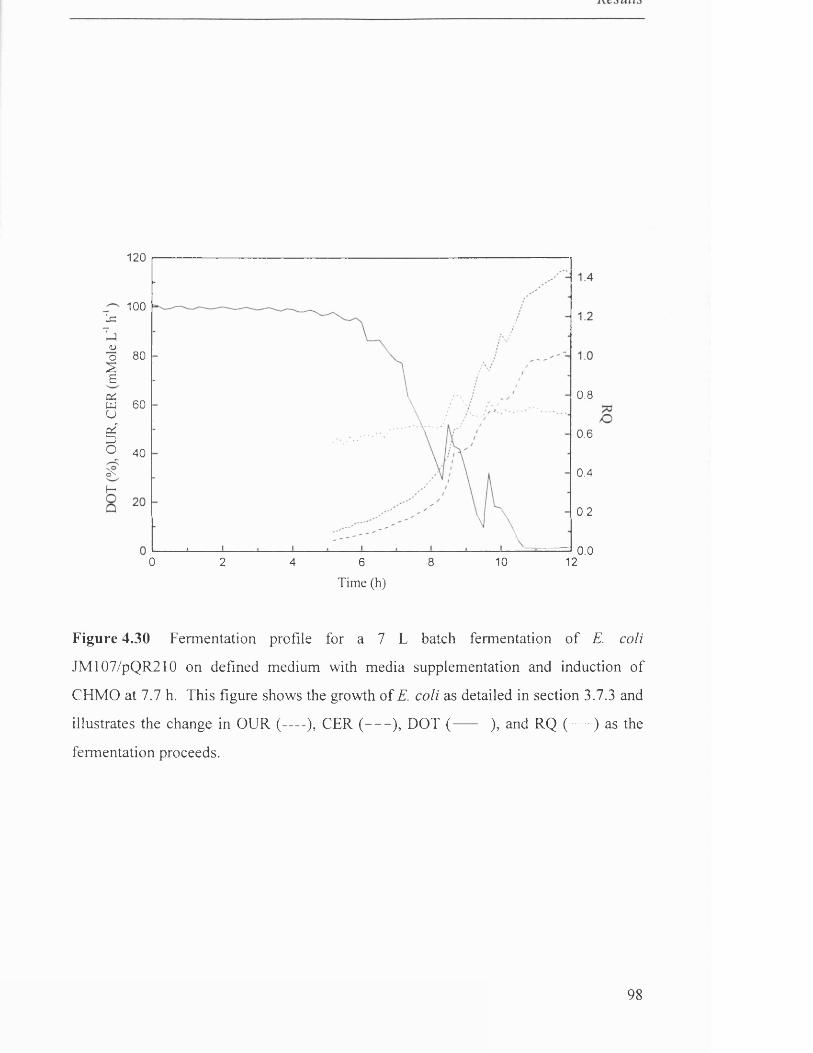
120
100Lc
<Do 80 2 B
2 60 Uo£DO 40
oNH
0.8
0.6
0.4
0.2
0.00 10 122 864
T im e (h)
Figure 4.30 Fermentation profile for a 7 L batch fermentation of E. coli
JM107/pQR210 on defined medium with media supplementation and induction of
CHMO at 7.7 h. This figure shows the growth of E. coli as detailed in section 3.7.3 and
illustrates the change in OUR (-----), CER (----- ), DOT ( ----- ), and RQ ( ) as the
fermentation proceeds.
98
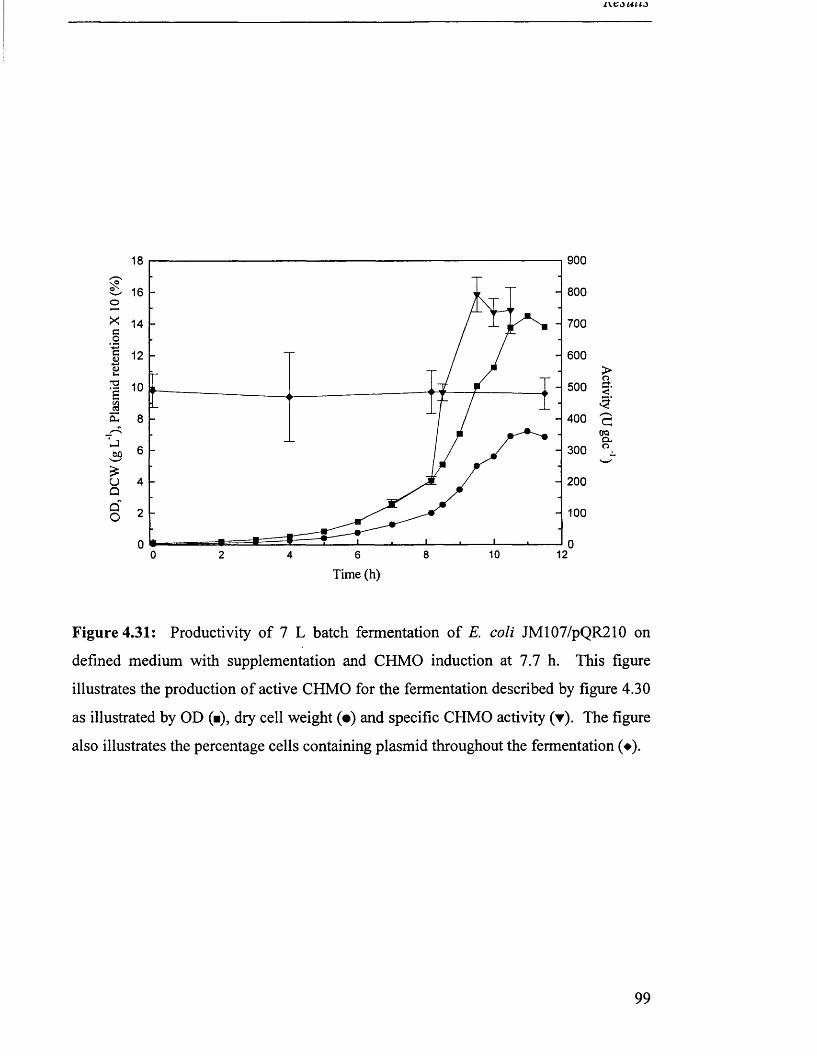
l\CdUUJ
Figure 4.31: Productivity of 7 L batch fermentation of E. coli JM107/pQR210 on
defined medium with supplementation and CHMO induction at 7.7 h. This figure
illustrates the production of active CHMO for the fermentation described by figure 4.30
as illustrated by OD (■), dry cell weight (•) and specific CHMO activity (▼). The figure
also illustrates the percentage cells containing plasmid throughout the fermentation (♦).
99
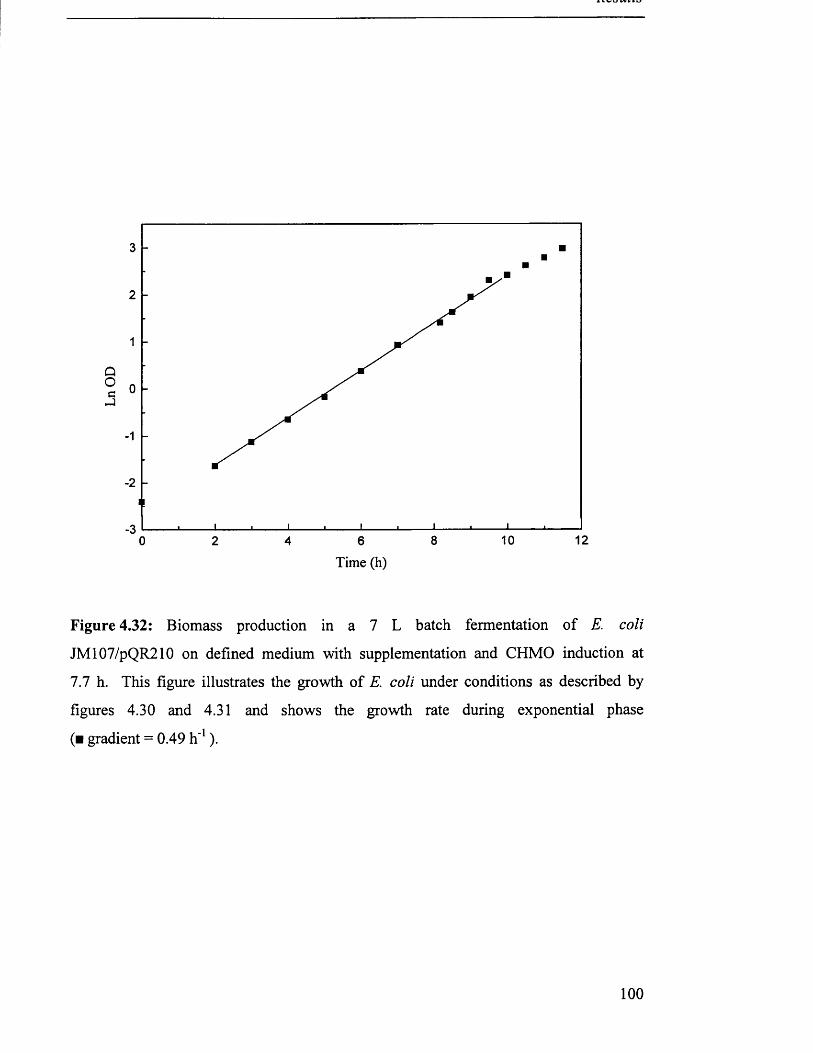
3
2
1
0
1
•2
■3128 102 60 4
Time (h)
Figure 4.32: Biomass production in a 7 L batch fermentation of E. coli
JM107/pQR210 on defined medium with supplementation and CHMO induction at
7.7 h. This figure illustrates the growth of E. coli under conditions as described by
figures 4.30 and 4.31 and shows the growth rate during exponential phase
(■ gradient = 0.49 h '1).
1 0 0
Figures 4.30 to 4.32 show the fermentation followed the expected profile with a
growth rate of 0.49 h '1. CHMO production was induced at 7.66 hours and the maximum
activity of 792 U gdc'1 found after approximately 2 hours. At maximum CHMO activity
the cell concentration was 5 g L '1 and the dissolved oxygen tension was above 20 %
saturation. The addition of the complex nutrients gave the same level of activity as the
complex medium fermentation.
4.4.3 Fed batch exponential feeding
A fed batch strategy allows greater biomass to be produced, without the
problems associated with oxygen limitation by restricting the growth rate, (Paalme et al
1990, Riesenberg et al., 1991). In addition the maintenance of a low constant growth
rate has often been reported to increase the stability of recombinant organisms (Yoon
and Kang, 1994, Hellmuth et a l 1994) and increase productivity.
Yeast extract and tryptone were added to fed batch fermentations at the time of
induction as this had been proven to be necessary for maximum expression during batch
fermentations on minimal medium.
Figures 4.33 to 4.38 show the data from a typical fermentation with defined
medium 4 and 3. The LabView software was set up as described in section 3.7.4 with
feed solution 4 (p = 0.15 h '1). CHMO production was induced after 20.5 and 20 h
respectively and reached a maxima of 436 and 388 U gdc _1 approximately 2.5 hours
later. Induction was effected by the addition of IPTG at a point during the controlled
growth rate that would ensure that the culture did not become oxygen limited during
CHMO synthesis.
The growth rates during feeding as determined by optical density measurements
were both 0.14 h -1. When calculated from regressed OUR data the growth rates were
both 0.14 h '1, which shows good agreement and shows that the control was adequate.
When regressed CER data were used the growth rates were estimated as 0.13 h _1 and
0.12 h ml.
101
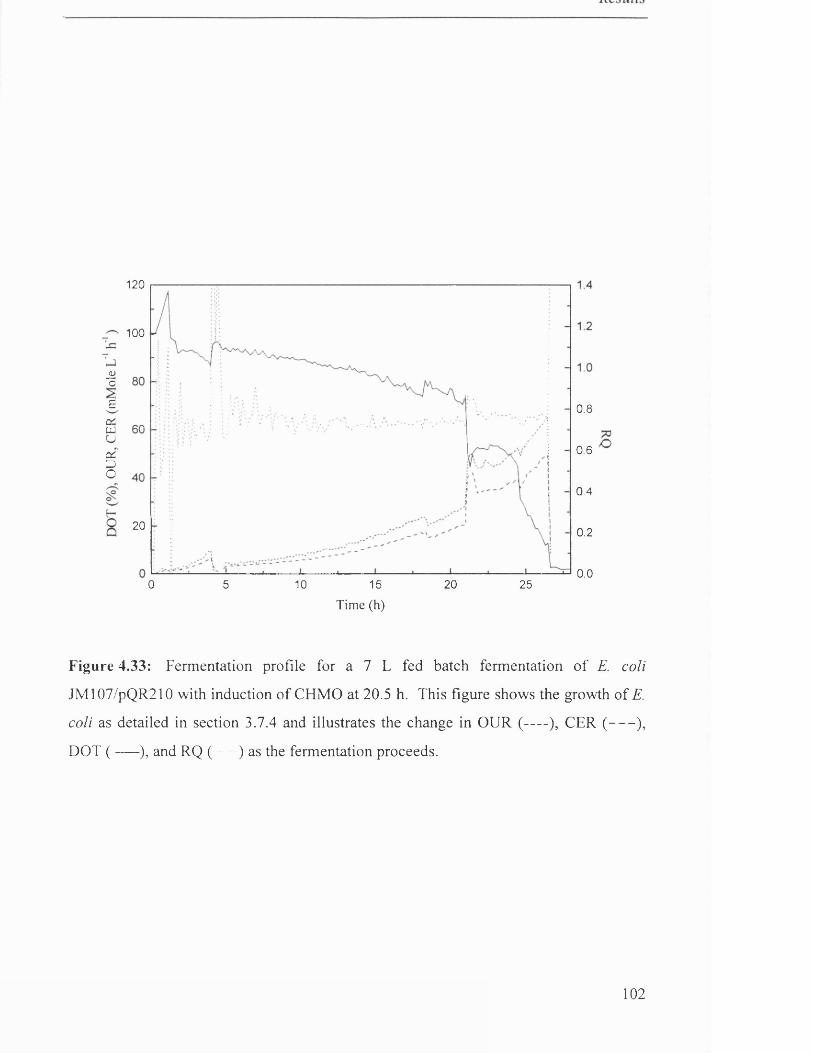
120
100
jho
5o'UJUQCDO
0.8
0.6
0.4
20 0.2
0.00 205 10 15 25
Tim e (h)
Figure 4.33: Fermentation profile for a 7 L fed batch fermentation of E. coli
JM107/pQR210 with induction of CHMO at 20.5 h. This figure shows the growth of E.
coli as detailed in section 3.7.4 and illustrates the change in OUR (-----), CER (----- ),
DOT ( -----), and RQ ( ) as the fermentation proceeds.
102
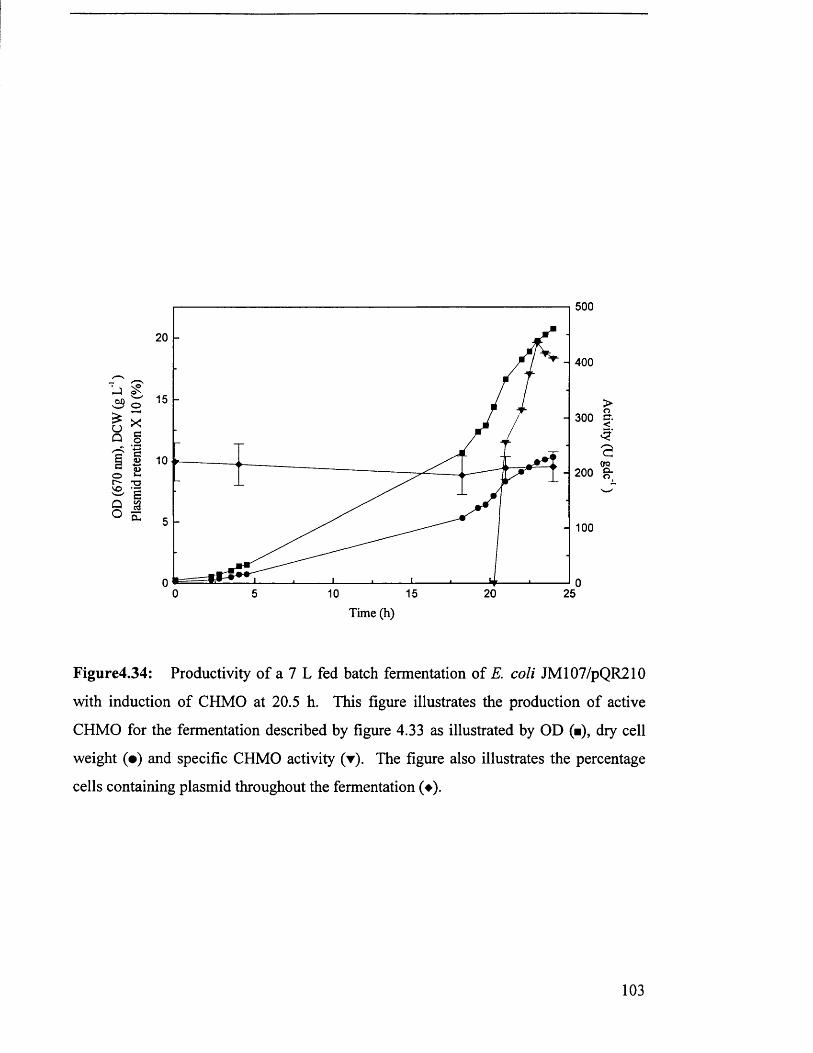
500
400
> o300 ft
<?
CTQ200 g*
100
00 5 10 15 20 25
Time (h)
Figure4.34: Productivity of a 7 L fed batch fermentation of E. coli JM107/pQR210
with induction of CHMO at 20.5 h. This figure illustrates the production of active
CHMO for the fermentation described by figure 4.33 as illustrated by OD (■), dry cell
weight (•) and specific CHMO activity (▼). The figure also illustrates the percentage
cells containing plasmid throughout the fermentation (♦).
103
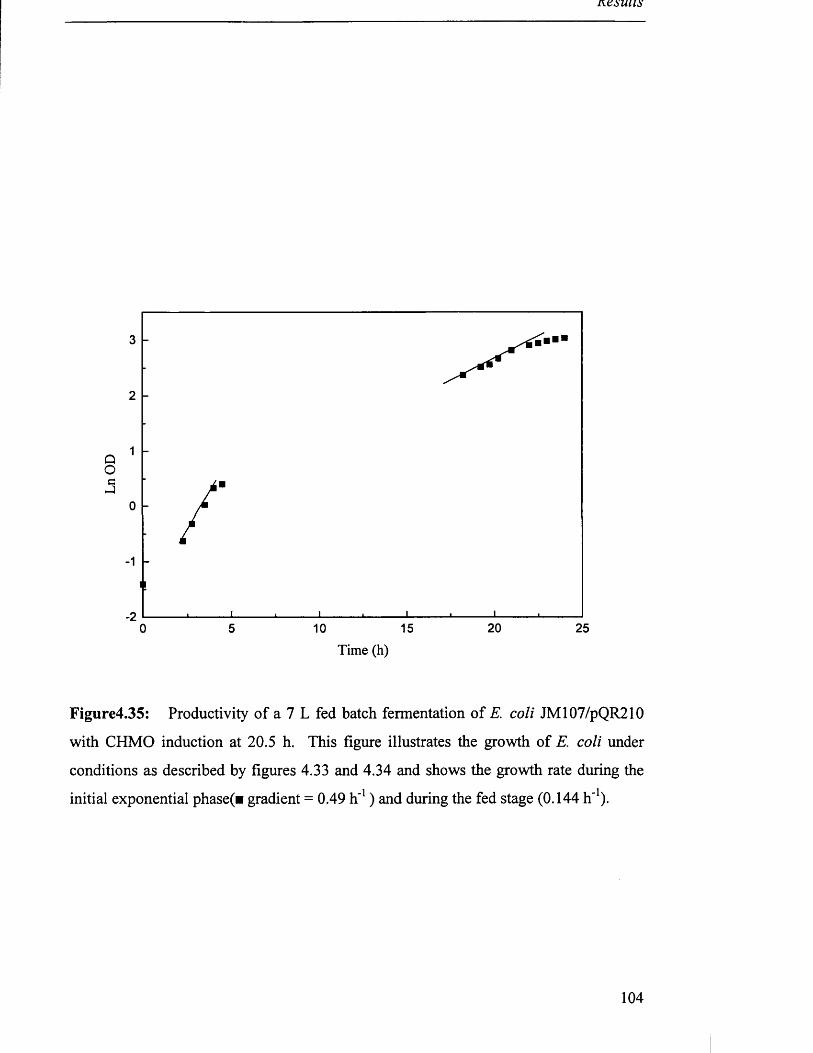
kcsuus
3
2
1
0
1
■220 25150 5 10
Time (h)
Figure4.35: Productivity of a 7 L fed batch fermentation of E. coli JM107/pQR210
with CHMO induction at 20.5 h. This figure illustrates the growth of E. coli under
conditions as described by figures 4.33 and 4.34 and shows the growth rate during the
initial exponential phase(« gradient = 0.49 h '1) and during the fed stage (0.144 h '1).
104
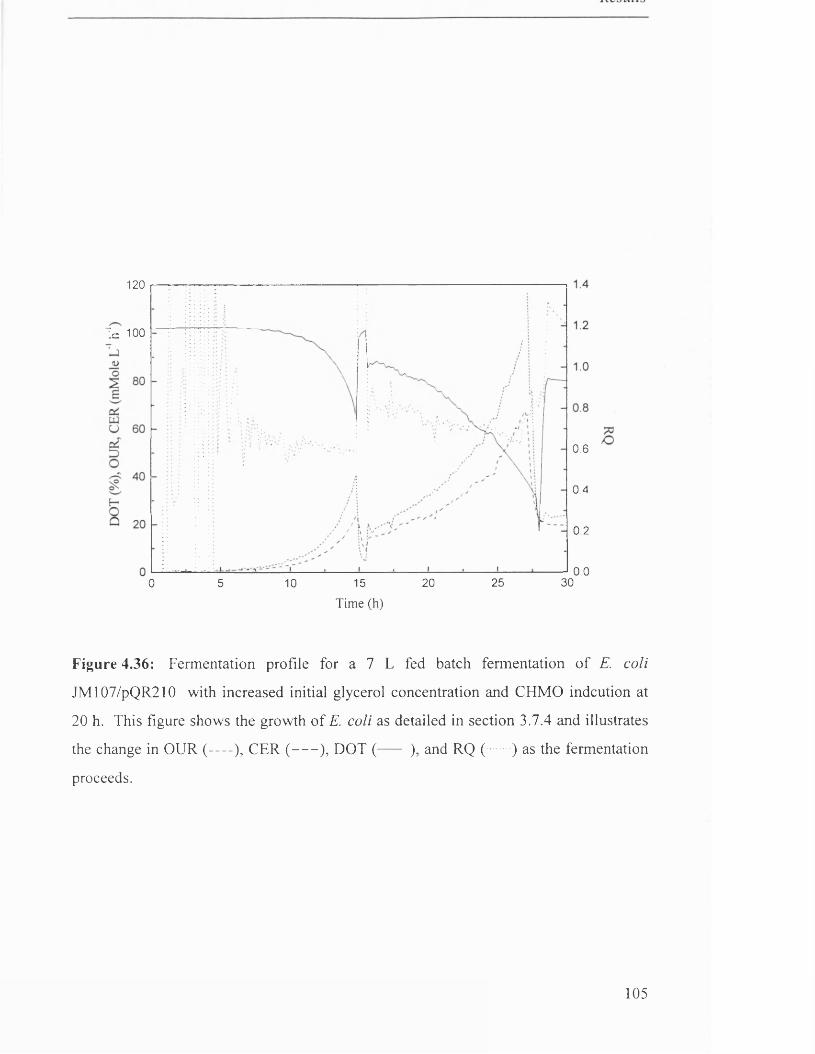
120
Tc 100
0.6
0.4
0.2
0.03020 255 150 10
Tim e (h)
Figure 4.36: Fermentation profile for a 7 L fed batch fermentation o f E. coli
JM107/pQR210 with increased initial glycerol concentration and CHMO indcution at
20 h. This figure shows the growth of E. coli as detailed in section 3.7.4 and illustrates
the change in OUR (---- ), CER (----- ), DOT (------ ), and RQ ( ) as the fermentation
proceeds.
105
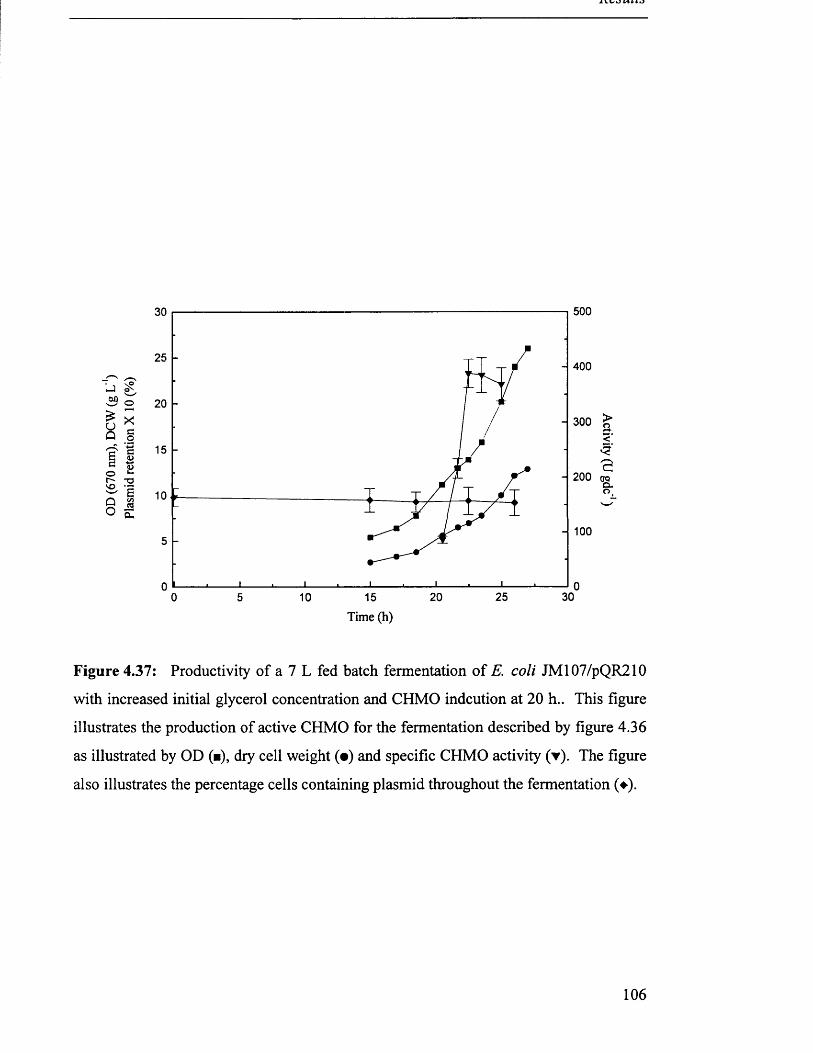
500
400
oo o
300
4-*ao>+-»<D1*4 200
100
3020 250 10 155Time (h)
Figure 4.37: Productivity of a 7 L fed batch fermentation of E. coli JM107/pQR210
with increased initial glycerol concentration and CHMO indcution at 20 h.. This figure
illustrates the production of active CHMO for the fermentation described by figure 4.36
as illustrated by OD (■), dry cell weight (•) and specific CHMO activity (▼). The figure
also illustrates the percentage cells containing plasmid throughout the fermentation (♦).
106
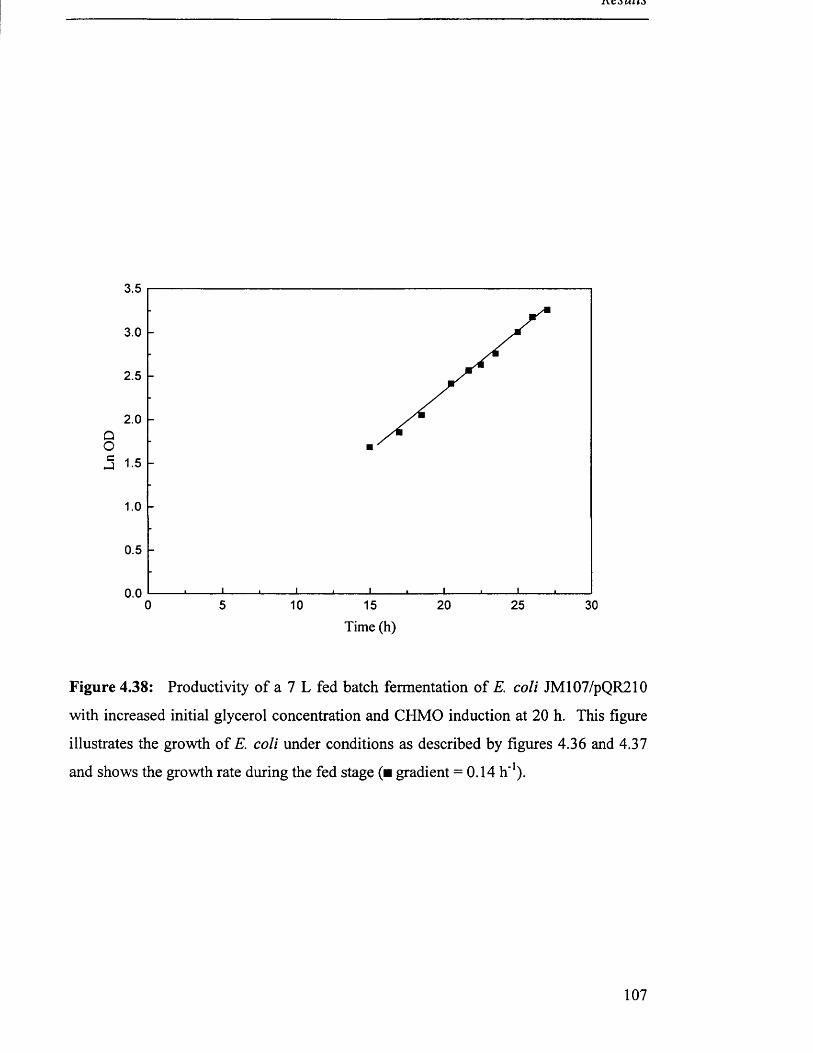
3.5
3.0
2.5
2.0QOc
0.5
0.00 5 10 15 20 25 30
Time (h)
Figure 4.38: Productivity of a 7 L fed batch fermentation of E. coli JM107/pQR210
with increased initial glycerol concentration and CHMO induction at 20 h. This figure
illustrates the growth of E. coli under conditions as described by figures 4.36 and 4.37
and shows the growth rate during the fed stage (■ gradient = 0.14 h '1).
107
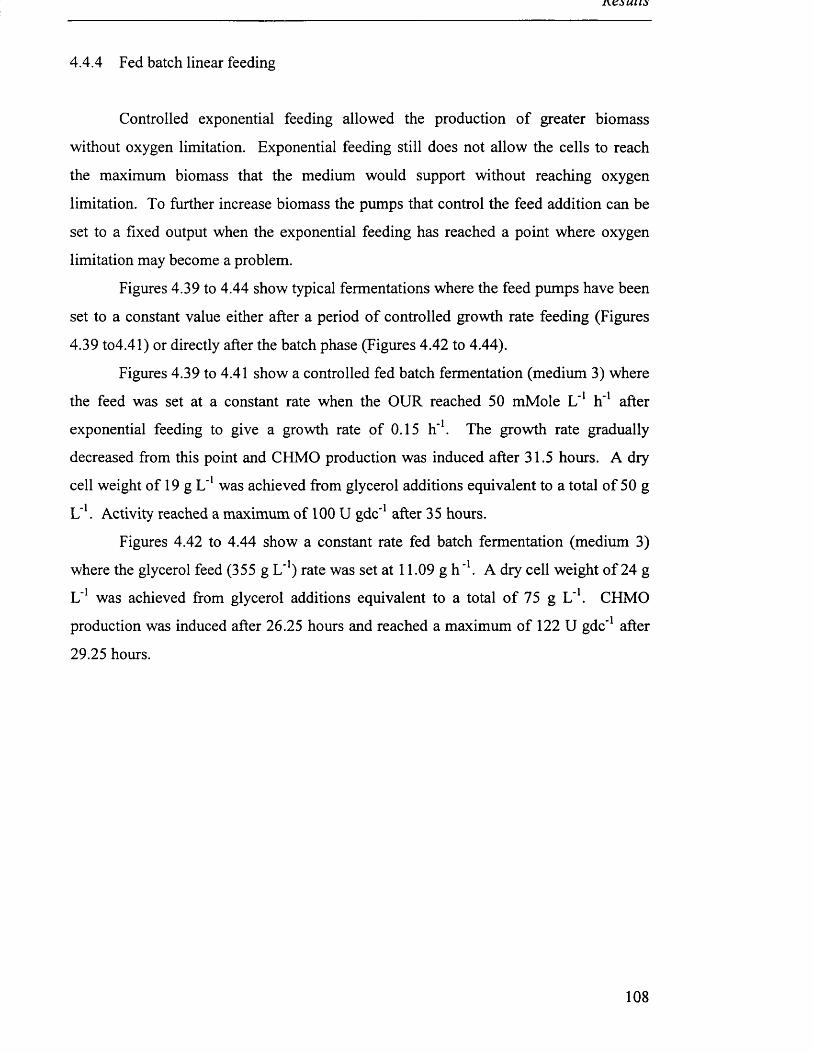
JWSUllS
4.4.4 Fed batch linear feeding
Controlled exponential feeding allowed the production of greater biomass
without oxygen limitation. Exponential feeding still does not allow the cells to reach
the maximum biomass that the medium would support without reaching oxygen
limitation. To further increase biomass the pumps that control the feed addition can be
set to a fixed output when the exponential feeding has reached a point where oxygen
limitation may become a problem.
Figures 4.39 to 4.44 show typical fermentations where the feed pumps have been
set to a constant value either after a period of controlled growth rate feeding (Figures
4.39 to4.41) or directly after the batch phase (Figures 4.42 to 4.44).
Figures 4.39 to 4.41 show a controlled fed batch fermentation (medium 3) where
the feed was set at a constant rate when the OUR reached 50 mMole L '1 h '1 after
exponential feeding to give a growth rate of 0.15 h '1. The growth rate gradually
decreased from this point and CHMO production was induced after 31.5 hours. A dry
cell weight of 19 g L '1 was achieved from glycerol additions equivalent to a total of 50 g
L’1. Activity reached a maximum of 100 U gdc'1 after 35 hours.
Figures 4.42 to 4.44 show a constant rate fed batch fermentation (medium 3)
where the glycerol feed (355 g L*1) rate was set at 11.09 g h '1. A dry cell weight of 24 g
L '1 was achieved from glycerol additions equivalent to a total of 75 g L"1. CHMO
production was induced after 26.25 hours and reached a maximum of 122 U gdc'1 after
29.25 hours.
108
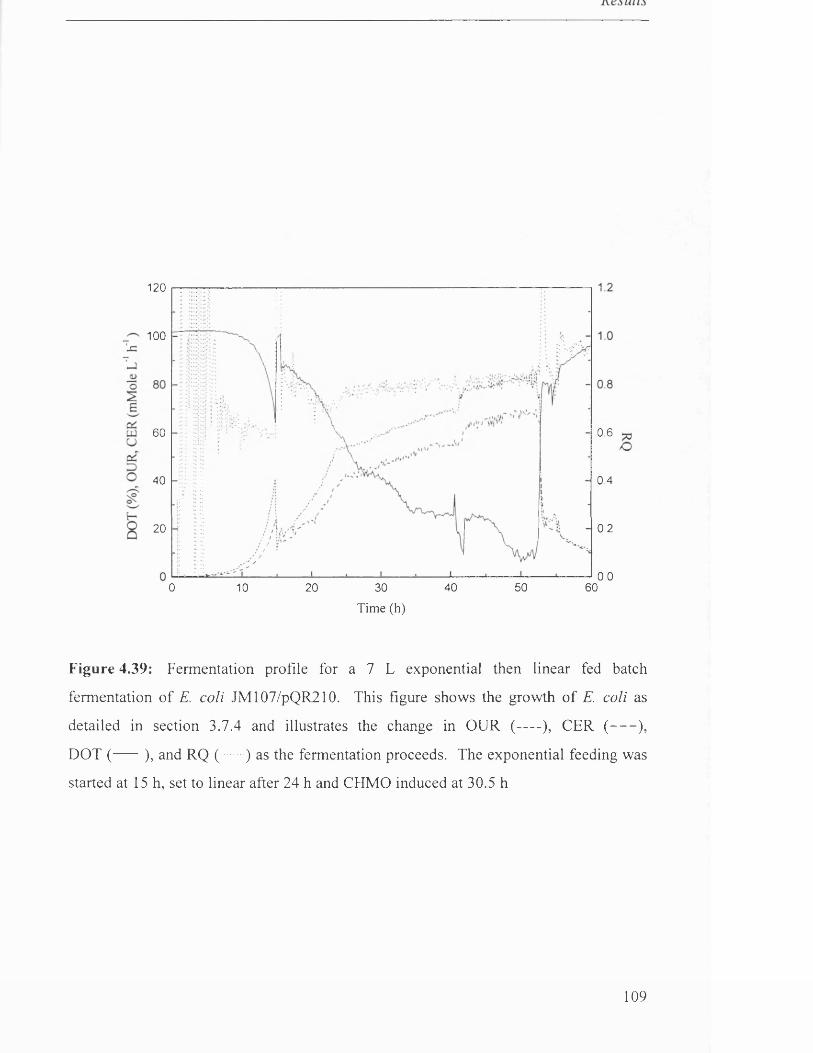
120
100
0.660
40 0.4
0.220
0.040 50 600 10 20 30
T im e (h)
Figure 4.39: Fermentation profile for a 7 L exponential then linear fed batch
fermentation of E. coli JM107/pQR210. This figure shows the growth of E. coli as
detailed in section 3.7.4 and illustrates the change in OUR (-----), CER (------),
DOT (-----), and RQ ( ) as the fermentation proceeds. The exponential feeding was
started at 15 h, set to linear after 24 h and CHMO induced at 30.5 h
109
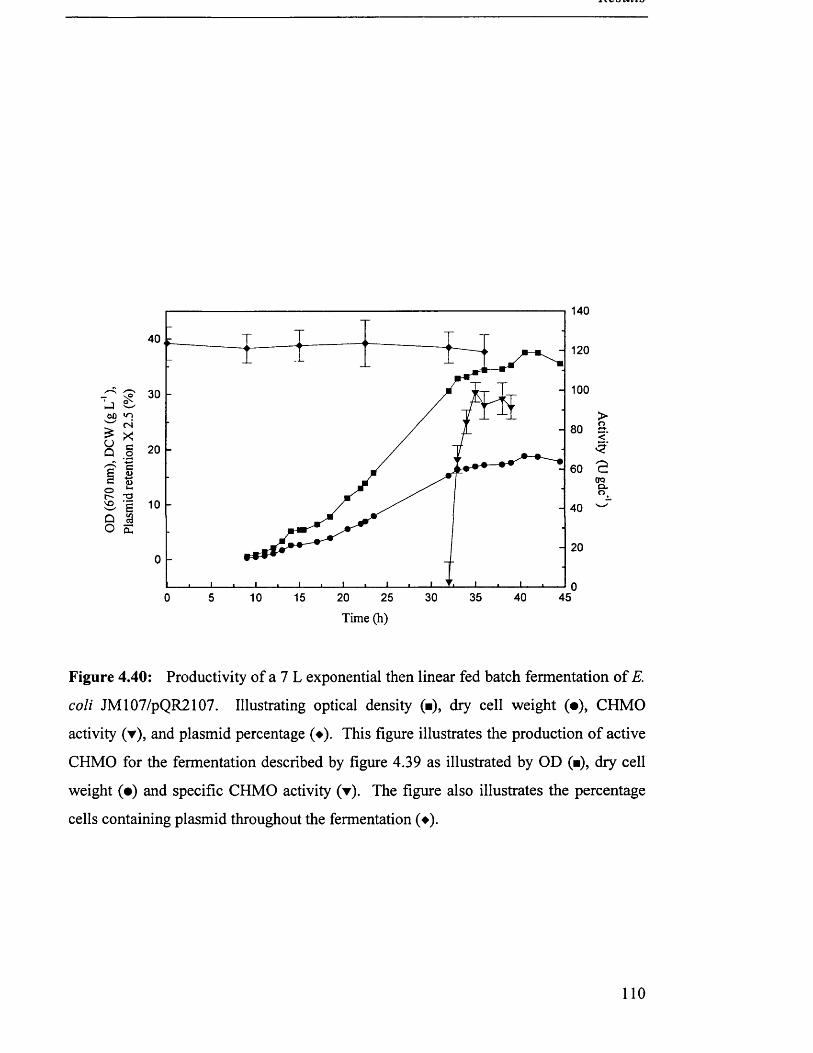
140
40120
100
60
> 04 > X U c Q o+-*ao>•4-*
40
35 40 45
<$
OTQClo
Time (h)
Figure 4.40: Productivity of a 7 L exponential then linear fed batch fermentation of E.
coli JM107/pQR2107. Illustrating optical density (■), dry cell weight (•), CHMO
activity (y ), and plasmid percentage (♦). This figure illustrates the production of active
CHMO for the fermentation described by figure 4.39 as illustrated by OD (■), dry cell
weight (•) and specific CHMO activity (y). The figure also illustrates the percentage
cells containing plasmid throughout the fermentation (♦).
110
4
3 -
2 -
Q O e J
1 -
0 -
0
Figure 4.41: Productivity of a 7 L exponential then linear fed batch fermentation of E.
coli JM107/pQR2107. This figure illustrates the growth of E. coli under conditions as
described by figures 4.39 and 4.340 and shows the growth rate during the initial
exponential phase fed stage (■ gradient = 0.44 h '1) and the exponential fed stage
(0.143 h’1).
I l l
100
J=
0.8
0.6
0.4
r™
3 20 0.2
0.035 40 4520 25 300 5 10 15
Tim e (h)
Figure 4.42: Fermentation profile for a 7 L linear fed batch fermentation of E. coli
JM107/pQR210. This figure shows the growth of E. coli as detailed in section 3.7.4 and
illustrates the change in OUR (---- ), CER (----- ), DOT ( ----- ), and RQ ( ) as the
fermentation proceeds. The linear feeding was started at 14 h and CHMO induced at
26.25 h
112

120
10040
U 30
0 5 10 15 20 25 30 35
Time (h)
Figure 4.43: Productivity of a 7 L fed batch fermentation of E. coli JM107/pQR210.
This figure illustrates the production of active CHMO for the fermentation described by
figure 4.42 as illustrated by OD (■), dry cell weight (•) and specific CHMO activity (▼).
The figure also illustrates the percentage cells containing plasmid throughout the
fermentation (♦).
113
4
3
2
1
0
1
30 350 5 10 15 20 25
Time (h)
Figure 4.44: Productivity of a 7 L fed batch fermentation of E. coli JM107/pQR210.
This figure illustrates the growth of E. coli under conditions as described by figures 4.42
and 4.43 and shows the growth rate during the initial exponential phase fed stage (■
gradient = 0.38 h '1).
114
4.5 Stability of stored catalysts
4.5.1 Whole cells
An important factor in the usefulness of any biocatalyst is the length of time that
the catalyst can be stored without losing significant amounts of activity. This period of
time determines the size of fermentation and the frequency with which they will be
required. The relative stability of stored CHMO in whole cells and crude homogenate
would determine their relative usefulness as catalysts.
Whole cells of both A. calcoaceticus and E. coli were prepared and stored as
described in section 3.8.3. The stability profiles of CHMO activity in A.
calcoaceticuscells stored at -18 °C are shown in Figure 4.45. The figure illustrates that
stability did not change significantly when the cells were stored in glycerol and that the
cells had lost only 40 % o f their activity after 5 months. The error bars in figures 4.45 to
4.47 represent the standard deviation calculated from five repeat samples.
In E. coli cells, as illustrated by Figure 4.46, CHMO activity is stable when
stored in a buffered 50 % glycerol solution for over 6 months without a significant loss
of activity. The cells have retained half of the original activity after nearly two years of
storage.
4.5.2 Homogenate
Clarified homogenate of E. coli was prepared and stored as described in section 3.8.4.
Figure 4.47 shows the stability profile for CHMO activity under a variety of conditions.
Activity is lost very rapidly at 4 °C with no measurable activity after 3 weeks of storage
with the addition of sodium azide or ampicillin to inhibit bacterial growth. When stored
at -18 °C there is a gradual loss of activity with a loss o f 50% activity after
approximately 5 months. When the homogenate is stored with an equal volume of
glycerol at -18 °C there is no significant change in activity after 5 months.
115
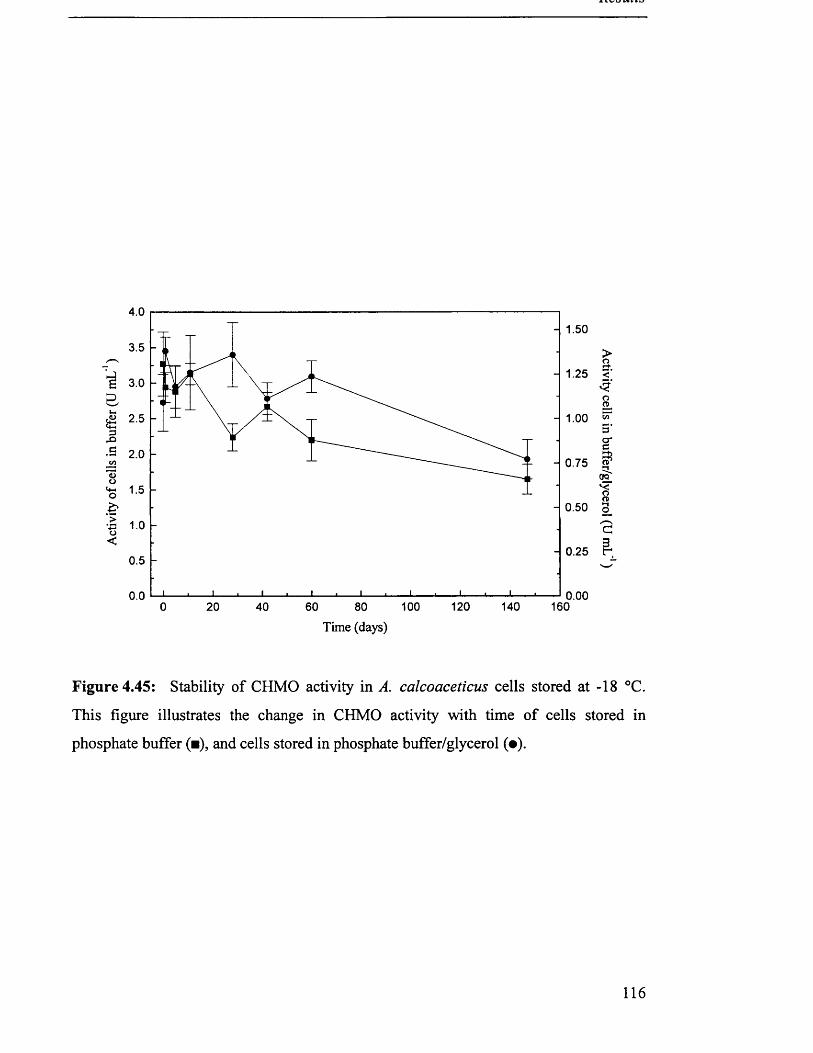
4.0
3.5
Is 3.0 D
2.53 X>■S 2.0to’3o*s 15 £■3 1 .0o<
0.5
0.00 20 40 60 80 100 120 140 160
Time (days)
Figure 4.45: Stability of CHMO activity in A. calcoaceticus cells stored at -18 °C.
This figure illustrates the change in CHMO activity with time of cells stored in
phosphate buffer (■), and cells stored in phosphate buffer/glycerol (•).
1.50
1.25>or-+<’
1.00 w 5'a*
0.75 §*ctcTvroo
0.50 3
0.25
n nn
116
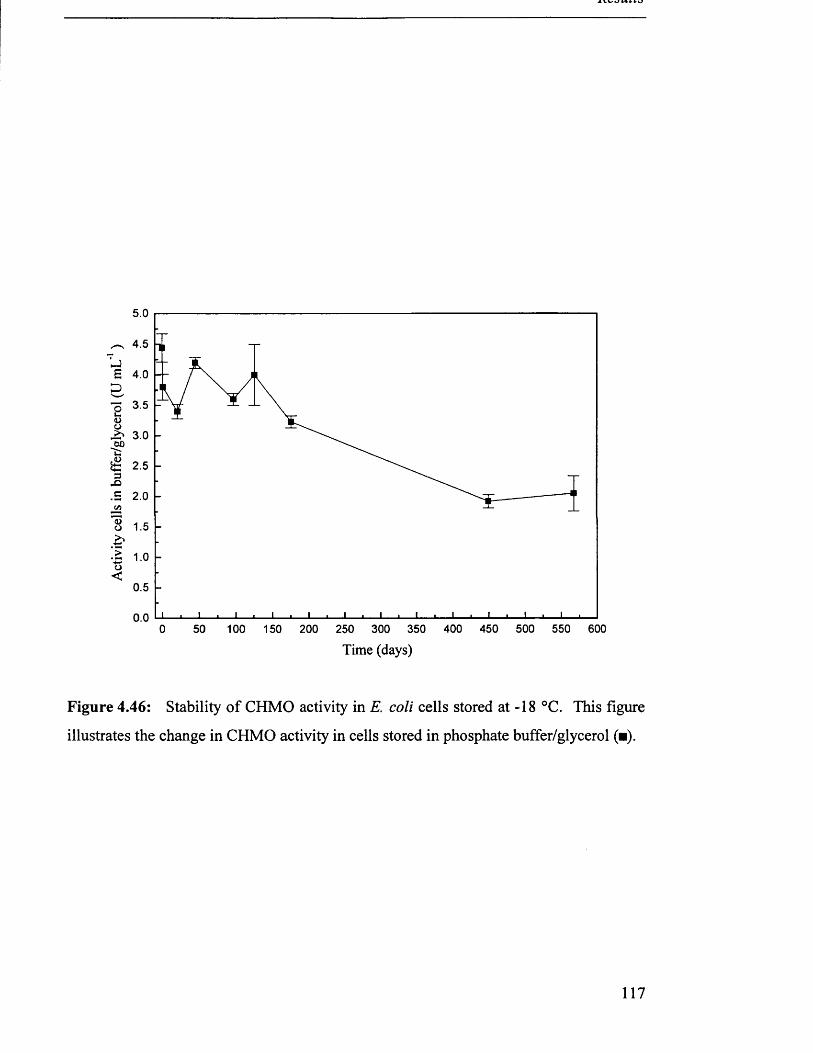
Activ
ity
cells
in
buffe
r/gly
cero
l (U
mL’
1)
5.0
4.5
4.0
3.5
3.0 -
2.5
2.0
0.5
0.050 100 150 200 250 300 350 400 450 500 550 6000
Time (days)
Figure 4.46: Stability of CHMO activity in E. coli cells stored at -18 °C. This figure
illustrates the change in CHMO activity in cells stored in phosphate buffer/glycerol (■).
117
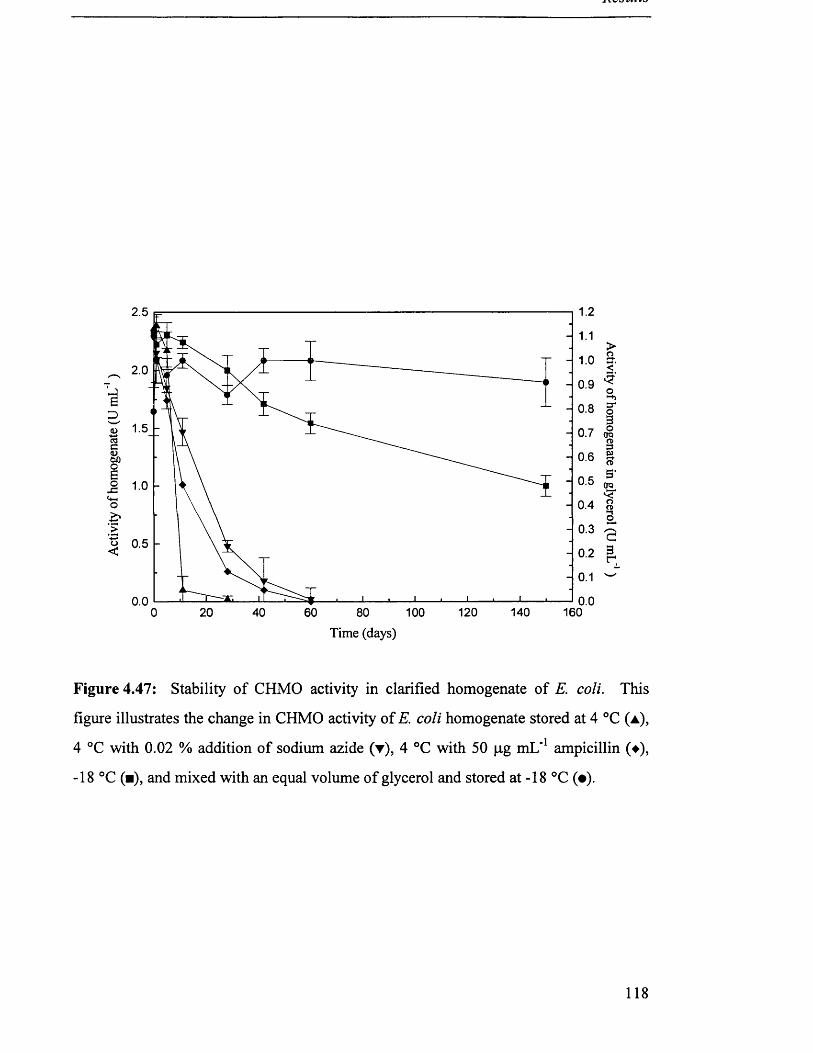
1.2
1.1>. _ o
1.0 S'.
0.9 f
0.8 g*3
0 .7 <g ro0-6 I0.5 |
v f 0 .4 8
o0-3 £
0.2 3
0.1 w
0.00 2 0 4 0 6 0 80 100 1 20 14 0 160
Time (days)
Figure 4.47: Stability of CHMO activity in clarified homogenate of E. coli. This
figure illustrates the change in CHMO activity of E. coli homogenate stored at 4 °C (a),
4 °C with 0.02 % addition of sodium azide (▼), 4 °C with 50 pg mL'1 ampicillin (♦),
-18 °C (■), and mixed with an equal volume of glycerol and stored at -18 °C (•).
2.0
£D<DCOC<uOX)
0.5
0.0
118
4.6 Biotransformations - whole cell Acinetobacter calcoaceticus
4.6.1 Biotransformation of cyclohexanone
Whole cells of A. calcoaceticus were grown and prepared, and
biotransformations carried out in an orbital shaker as detailed in section 3.9.1. The
reactions were buffered to pH 7 as at this pH any potential instability of the lactone
products would be reduced. pH 9 is the optimum for maximum enzyme activity
(Trudgill, 1990) but under these conditions the possibility of lactone ring opening is
increased.
Figure 4.48 illustrates a typical biotransformation of cyclohexanone, the natural
substrate of the enzyme. The whole cells contain cyclohexanol dehydrogenase enzymes
which are clearly driven in the reverse direction to produce cyclohexanol. Due to the
action of the lactone dehydrogenase enzyme no lactone products could be detected. The
presence of a substrate for the cyclohexanol degradation pathway confers stability to the
CHMO activity as can be seen (Figure 4.49) by the fall in activity sifter 2 hours and the
loss of activity by 5 hours.
4.6.2 Biotransformation of 2-ethyl cyclopentanone
The biotransformation of 2-ethyl cyclopentanone (figure 4.50) followed a similar
pattern to that of cyclohexanone. This racemic substrate allows the examination of a
chiral resolution. Based on relative retention time to other cyclic alcohols the unknown
species was most likely 2-ethyl cyclopentanol. Lactone products could not be detected
implying that the lactone product was a substrate for the lactone dehydrogenase enzyme.
The concentration of alcohol produced was significantly lower than that produced in the
biotransformation of the more simple cyclohexanone substrate, only reaching a
concentration of 1 mM.
119
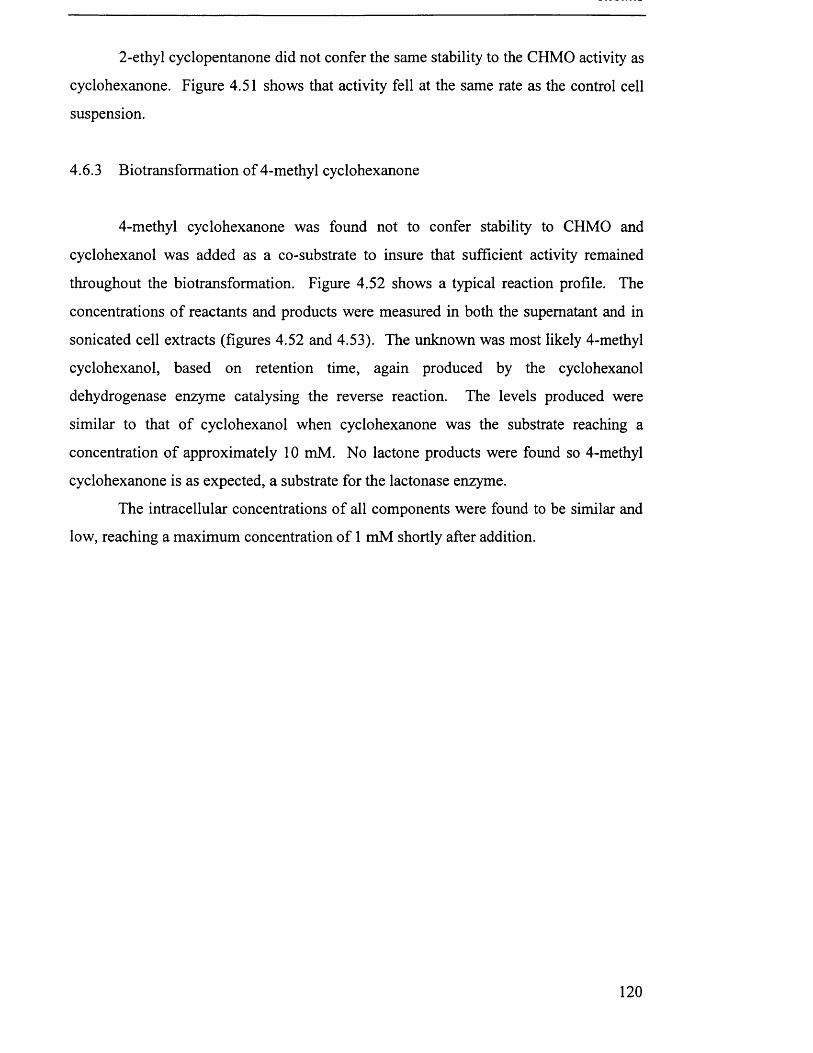
2-ethyl cyclopentanone did not confer the same stability to the CHMO activity as
cyclohexanone. Figure 4.51 shows that activity fell at the same rate as the control cell
suspension.
4.6.3 Biotransformation of 4-methyl cyclohexanone
4-methyl cyclohexanone was found not to confer stability to CHMO and
cyclohexanol was added as a co-substrate to insure that sufficient activity remained
throughout the biotransformation. Figure 4.52 shows a typical reaction profile. The
concentrations of reactants and products were measured in both the supernatant and in
sonicated cell extracts (figures 4.52 and 4.53). The unknown was most likely 4-methyl
cyclohexanol, based on retention time, again produced by the cyclohexanol
dehydrogenase enzyme catalysing the reverse reaction. The levels produced were
similar to that of cyclohexanol when cyclohexanone was the substrate reaching a
concentration of approximately 10 mM. No lactone products were found so 4-methyl
cyclohexanone is as expected, a substrate for the lactonase enzyme.
The intracellular concentrations of all components were found to be similar and
low, reaching a maximum concentration of 1 mM shortly after addition.
120
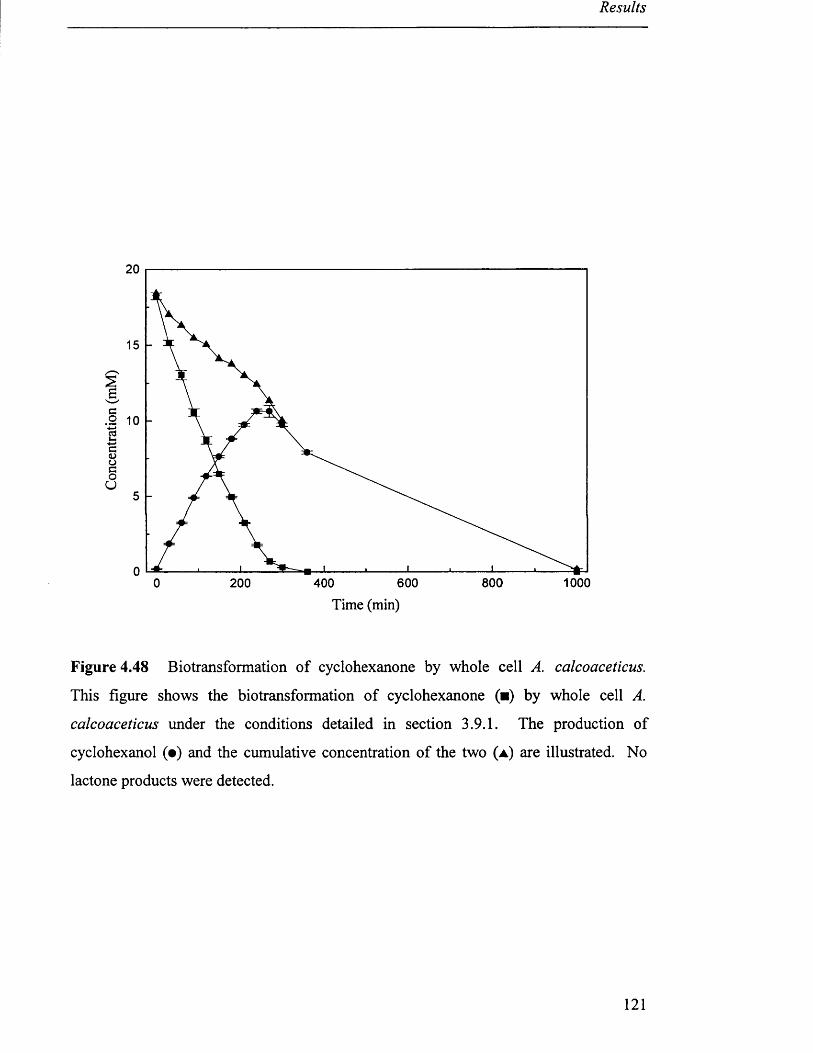
Results
20
.2 10
800 10000 200 400 600
Time (min)
Figure 4.48 Biotransformation of cyclohexanone by whole cell A. calcoaceticus.
This figure shows the biotransformation of cyclohexanone (■) by whole cell A.
calcoaceticus under the conditions detailed in section 3.9.1. The production of
cyclohexanol (•) and the cumulative concentration of the two (a ) are illustrated. No
lactone products were detected.
121
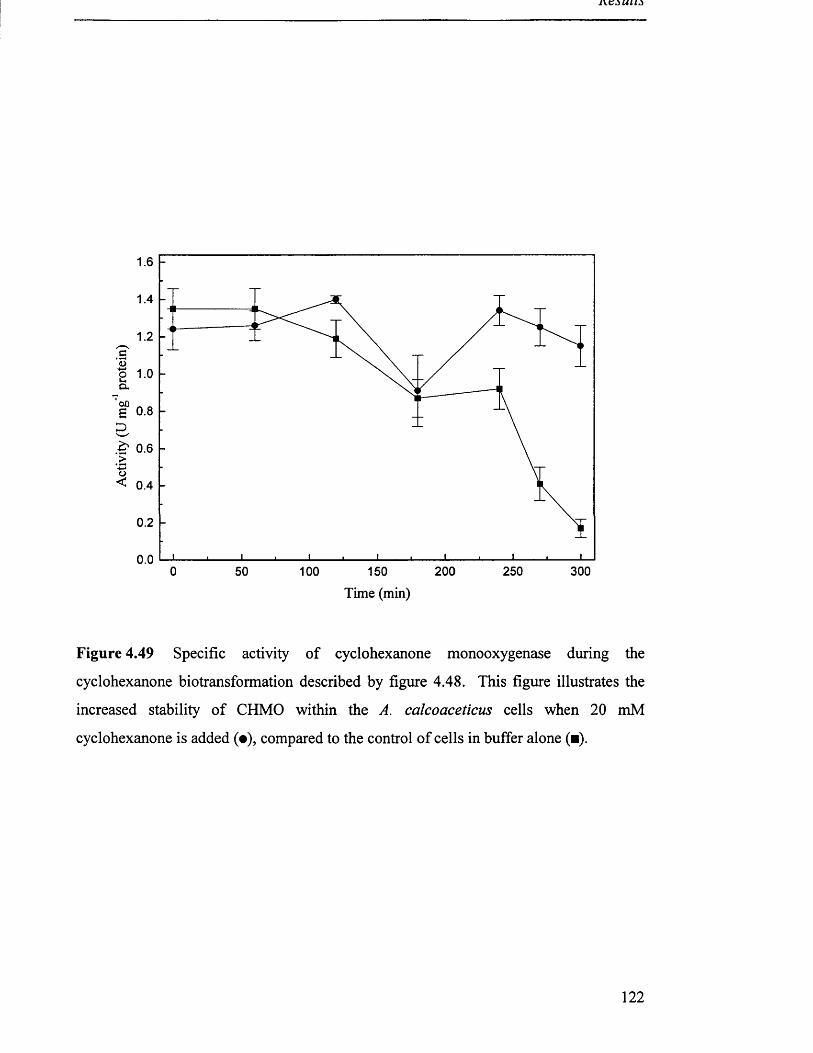
is* 0.6
0.2
0.00 200 250 30050 100 150
Time (min)
Figure 4.49 Specific activity of cyclohexanone monooxygenase during the
cyclohexanone biotransformation described by figure 4.48. This figure illustrates the
increased stability of CHMO within the A. calcoaceticus cells when 20 mM
cyclohexanone is added (•), compared to the control of cells in buffer alone (■).
122
20
15
10
5
0250 300 3500 50 100 150 200
Time (min)
Figure 4.50 Biotransformation of 20 mM 2-ethyl cyclopentanone by whole cell A.
calcoaceticus. This figure shows the biotransformation of 2-ethyl cyclopentanone (■)
by whole cell A. calcoaceticus under the conditions detailed in section 3.9.1. The
production of an unknown (•) (believed to be 2-ethyl cyclopantanol by GC retention
time) and the cumulative concentration of the two (a ) are illustrated. No lactone
products were detected
123
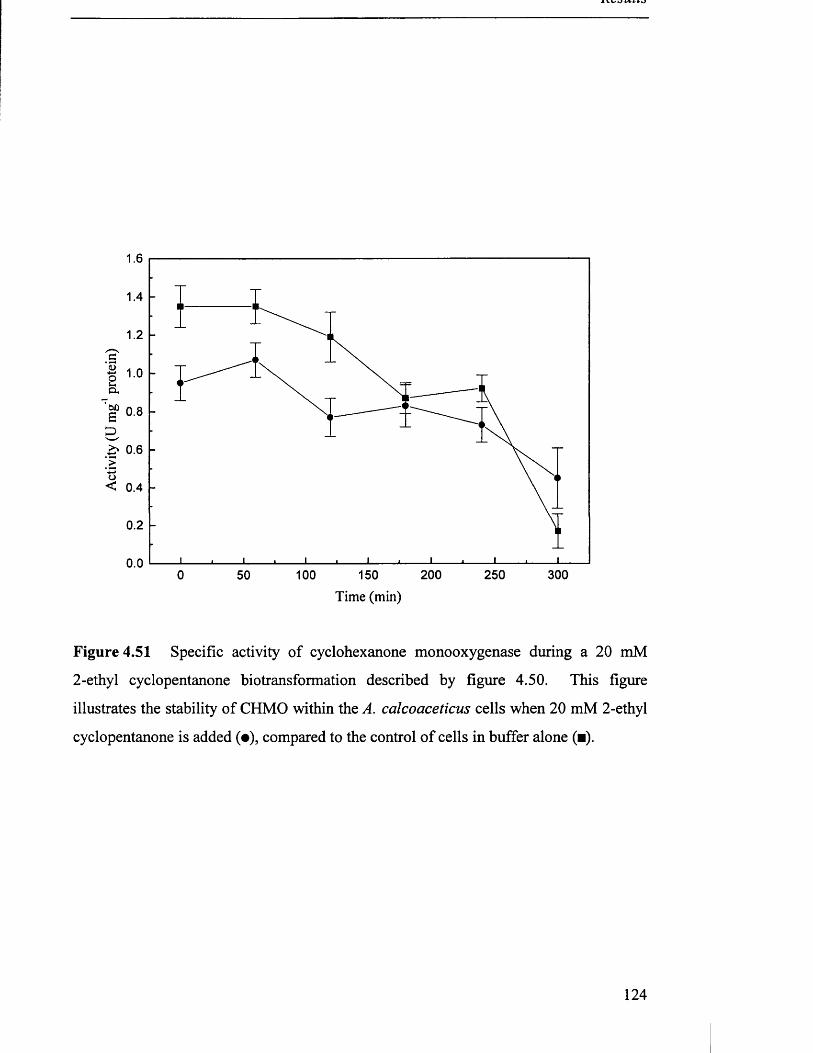
1.6
1.4
1.2
Z 10Q.
0.8
£» 0.6
0.4
0.2
0.0250 300100 150 2000 50
Time (min)
Figure 4.51 Specific activity of cyclohexanone monooxygenase during a 20 mM
2-ethyl cyclopentanone biotransformation described by figure 4.50. This figure
illustrates the stability of CHMO within the A. calcoaceticus cells when 20 mM 2-ethyl
cyclopentanone is added (•), compared to the control of cells in buffer alone (■).
124
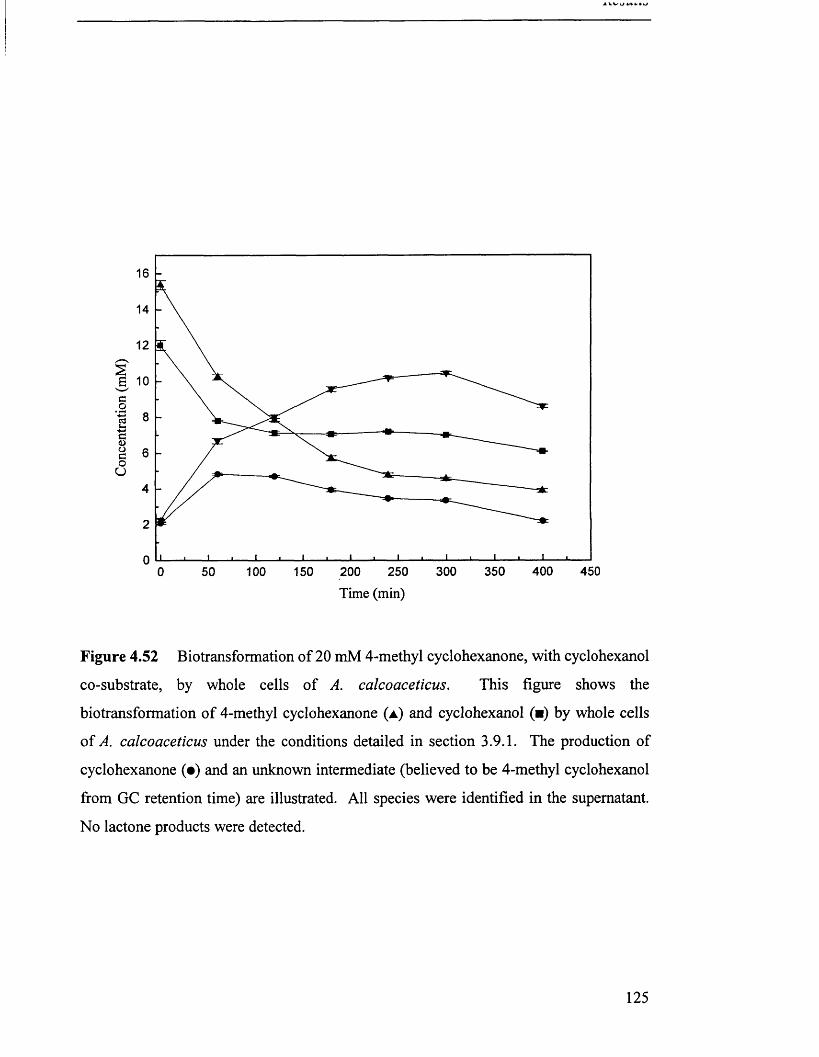
16
14
12
10
8
6
4
2
0350 400 450250 300150 2000 50 100
Time (min)
Figure 4.52 Biotransformation of 20 mM 4-methyl cyclohexanone, with cyclohexanol
co-substrate, by whole cells of A. calcoaceticus. This figure shows the
biotransformation of 4-methyl cyclohexanone (a ) and cyclohexanol (■) by whole cells
of A. calcoaceticus under the conditions detailed in section 3.9.1. The production of
cyclohexanone (•) and an unknown intermediate (believed to be 4-methyl cyclohexanol
from GC retention time) are illustrated. All species were identified in the supernatant.
No lactone products were detected.
125
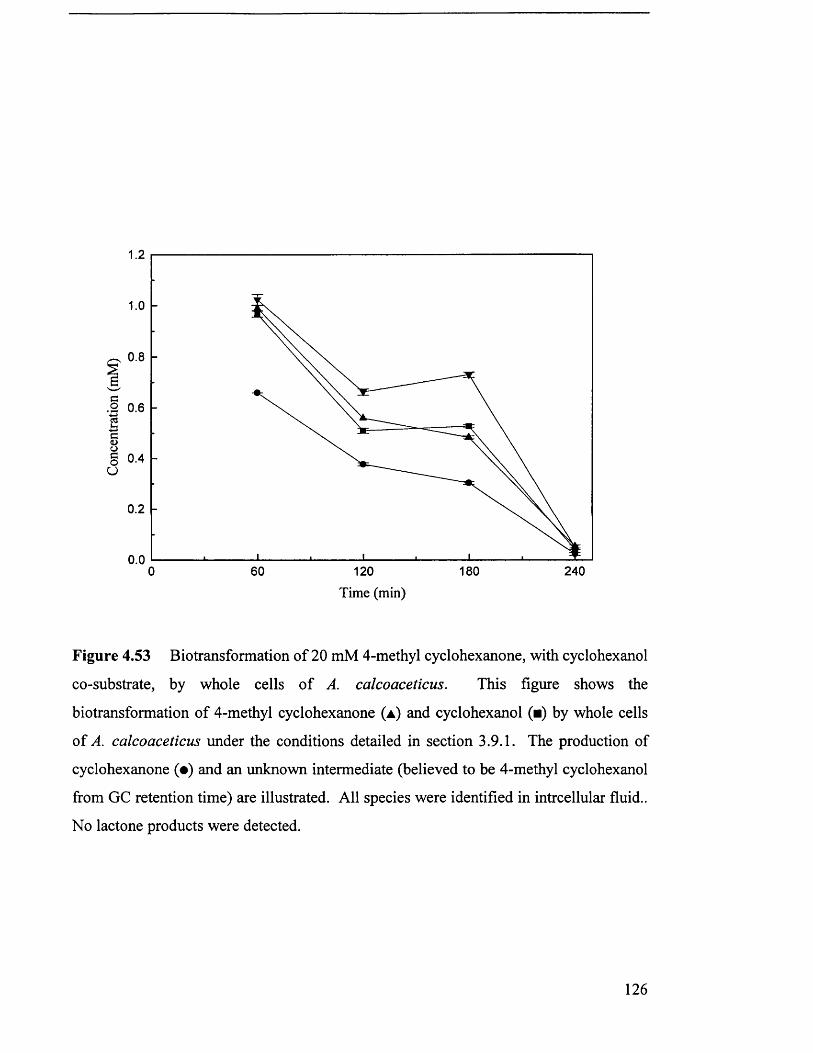
1.2
0.8
COIG<UocoO
0.2
0.0180 2400 60 120
Time (min)
Figure 4.53 Biotransformation of 20 mM 4-methyl cyclohexanone, with cyclohexanol
co-substrate, by whole cells of A. calcoaceticus. This figure shows the
biotransformation of 4-methyl cyclohexanone (a ) and cyclohexanol (■) by whole cells
of A. calcoaceticus under the conditions detailed in section 3.9.1. The production of
cyclohexanone (•) and an unknown intermediate (believed to be 4-methyl cyclohexanol
from GC retention time) are illustrated. All species were identified in intrcellular fluid..
No lactone products were detected.
126
4.7 Biotransformation - Acinetobacter calcoaceticus homogenate
4.7.1 Biotransformations of 4-methyl cyclohexanone
A. calcoaceticus homogenate was prepared as described in section 3.8.2 and
biotransformations were performed as section 3.9.2.
The results of the whole cell biotransformations showed that the lactone
products of the chosen substrates were substrates for the lactonase enzyme and thus no
lactone products could be found. Therefore for homogenate biotransformations the
addition of an inhibitor of lactonase activity would be required. Literature suggested
that tetraethylpyrophosphate (TEPP) is an effective inhibitor of the lactonase enzyme
(Donoghue et a l, 1975). After careful consideration this chemical, belonging to the
organophosphate group, was considered to be too toxic for routine use even on a small
scale.
Isatoic anhydride has been used in to inhibit dehydrogenase activity with purified
enzyme but it is not as effective as TEPP and has not been found to be an inhibitor when
whole cell catalysts are used.
Crude homogenate was found to require the addition of NADPH to allow the
reaction to proceed. Figure 4.54 shows the disappearance of 4-methyl cyclohexanone
with and without the addition of a stoichiometric quantity of NADPH.
Figure 4.55 shows a typical reaction profile for 20 mM biotransformation of
4-methyl cyclohexanone. Once again no lactone products could be identified. The
isatoic anhydride interfered with the reaction and slowed down the rate. The unknown
intermediate, most likely the alcohol, has been produced much more slowly and has not
been totally transformed. Unlike in whole cells the CHMO activity was not protected
by the presence of added cyclohexanol (Figure 4.56).
127
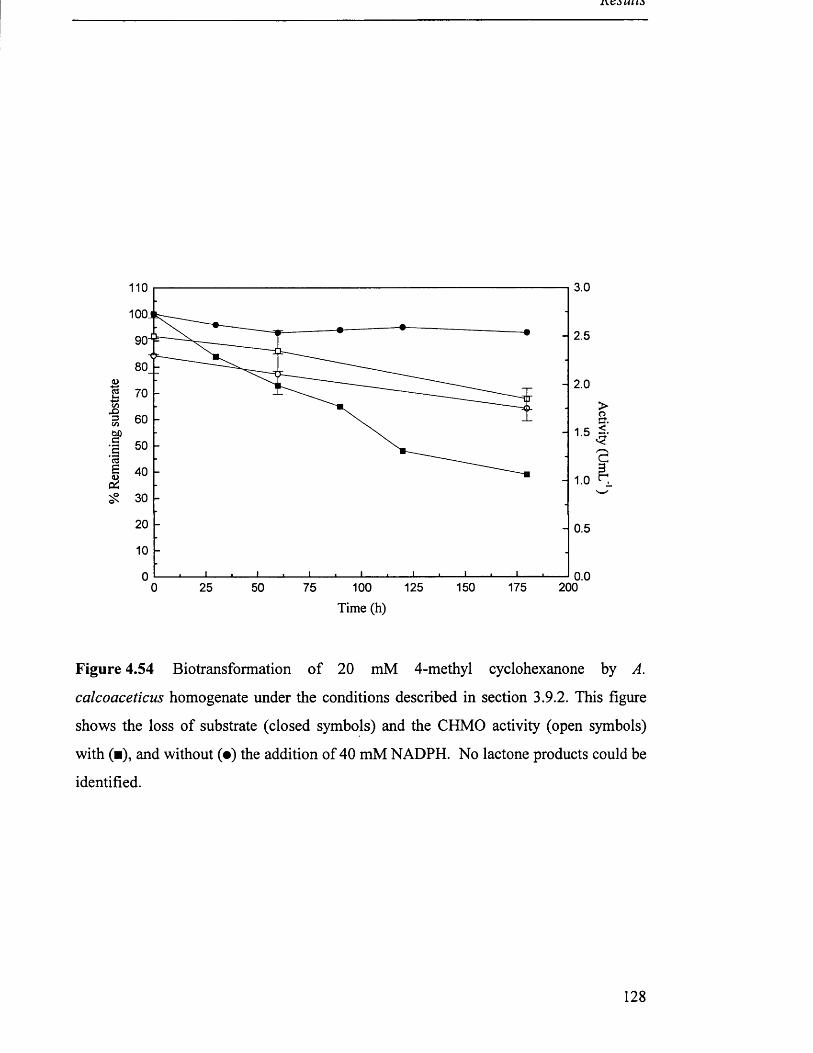
3.0110
100.2.5
2.0
CxO
0.5
0.0200125 150 1750 25 50 75 100
T im e (h )
Figure 4.54 Biotransformation of 20 mM 4-methyl cyclohexanone by A.
calcoaceticus homogenate under the conditions described in section 3.9.2. This figure
shows the loss of substrate (closed symbols) and the CHMO activity (open symbols)
with (■), and without (•) the addition of 40 mM NADPH. No lactone products could be
identified.
128
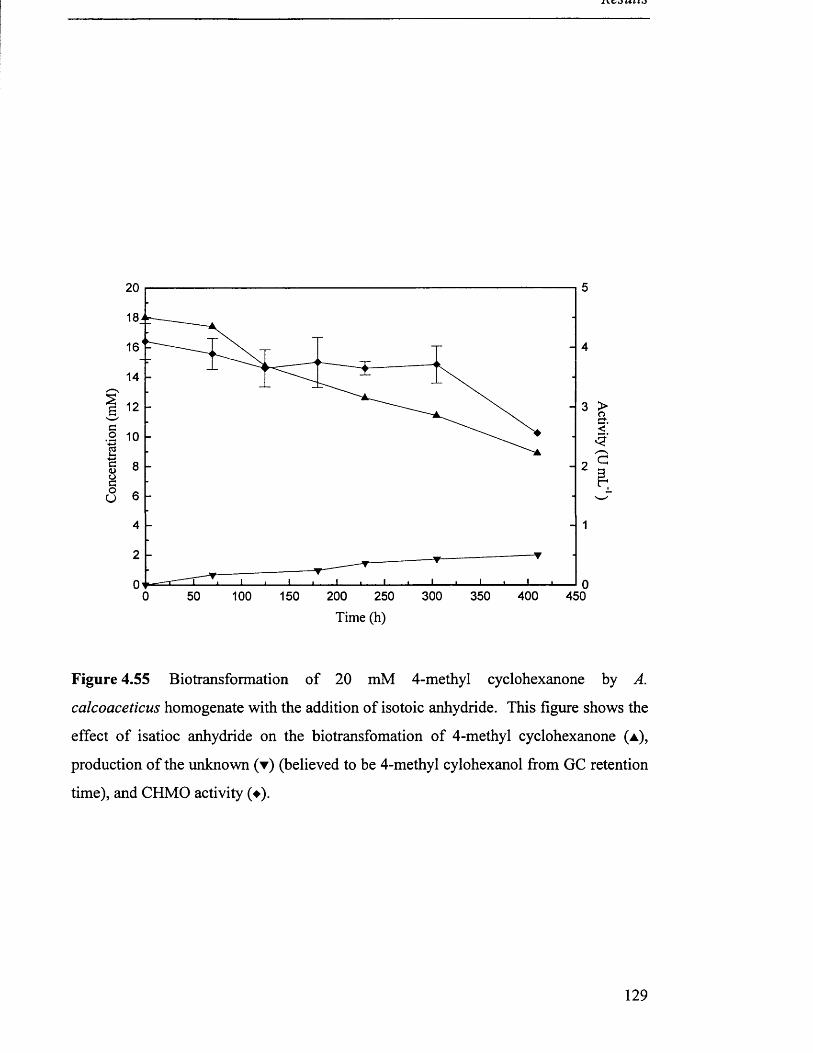
aot•*->cCDOcoU
300 350 4000 50 100 150 200 250 450T im e (h )
Figure 4.55 Biotransformation of 20 mM 4-methyl cyclohexanone by A.
calcoaceticus homogenate with the addition of isotoic anhydride. This figure shows the
effect of isatioc anhydride on the biotransfomation of 4-methyl cyclohexanone (a ),
production of the unknown (▼) (believed to be 4-methyl cylohexanol from GC retention
time), and CHMO activity (♦).
129
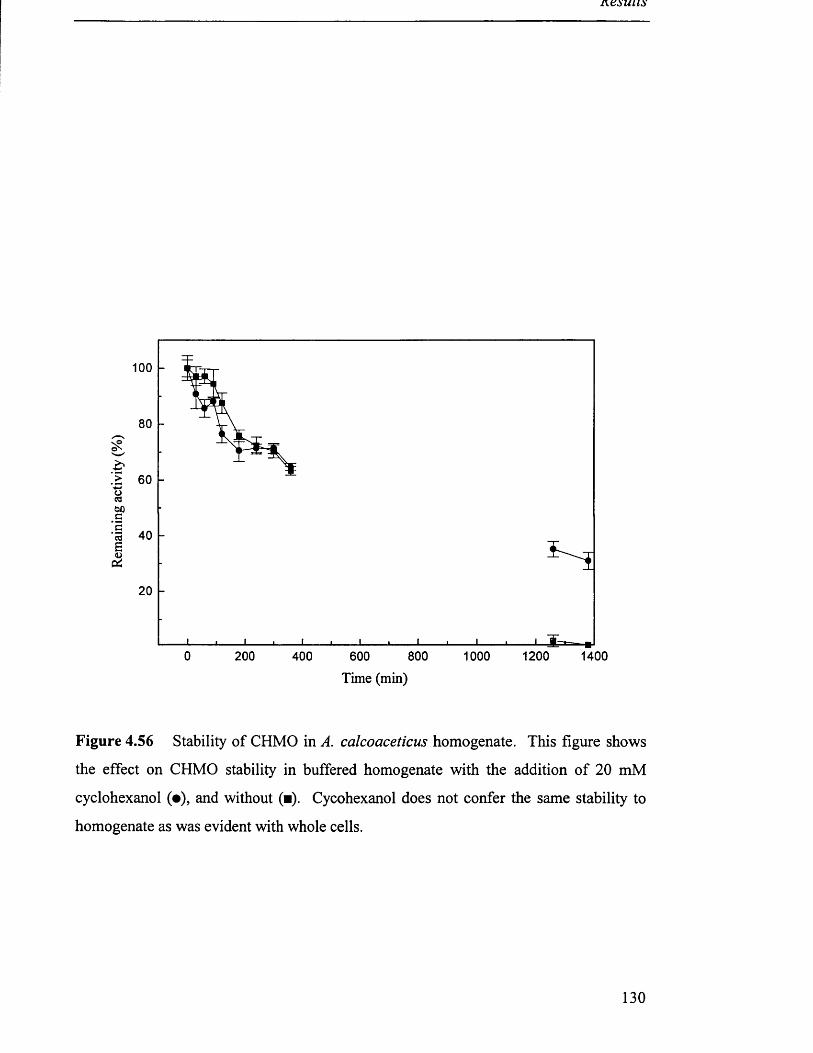
nesuiis
100
£§_>oCOW>C
0 200 800 1000 1200 1400400 600
Time (min)
Figure 4.56 Stability of CHMO in A. calcoaceticus homogenate. This figure shows
the effect on CHMO stability in buffered homogenate with the addition of 20 mM
cyclohexanol (•), and without (■). Cycohexanol does not confer the same stability to
homogenate as was evident with whole cells.
130
4.7.2 Biotransformation of 2-methyl cyclohexanone
2-methyl cyclohexanone was chosen because the column was unable to resolve
the enantiomers of substituted cyclopentanone as mentioned in section 2.2.2. Figure
4.57 shows a typical profile for a 20 mM biotransformation. No lactone products could
be found indicating that the lactone dehydrogenase enzyme was not inhibited by the
presence of isatoic anhydride. The enzyme showed a distinct preference for one
enantiomer with the enantiomeric excess being approximately 30 %. No cyclic alcohol
products of the back reaction of cyclohexanol dehydrogenase could be found.
4.8 Biotransformations - whole cell Escherichia coli
Whole cells of E. coli were grown and prepared, and biotransformations carried
out in an orbital shaker as detailed in section 3.9.1. The reactions were buffered to pH 7
for reasons outlined previously (section 4.6.1).
Figure 4.58 shows a typical reaction with whole cells and 20 mM 2-ethyl
cyclopentanone. Lactone product was identified but as discussed earlier the column was
unable to resolve the enantiomers of the ketone substrates lactone product. It can be
seen that the maximum concentration of lactone product is approximately 2 mM while
the concentration of ketone has fallen by 5 mM. The control shows that the additional
.losses of ketone could not be attributed to evaporation.
4.9 Biotransformations - E. coli homogenate
The data for E. coli homogenate biotransformation was kindly supplied by
Rachel Stones, Dept. Biochemical Engineering, University College London.
Figure 4.59 shows the stereoselective biotransformation of 20 mM 2-methyl
cyclohexanone. Lactone products could be identified from their relative retention times
and the two isomers are clearly resolved. The absolute conformations of these isomers
131
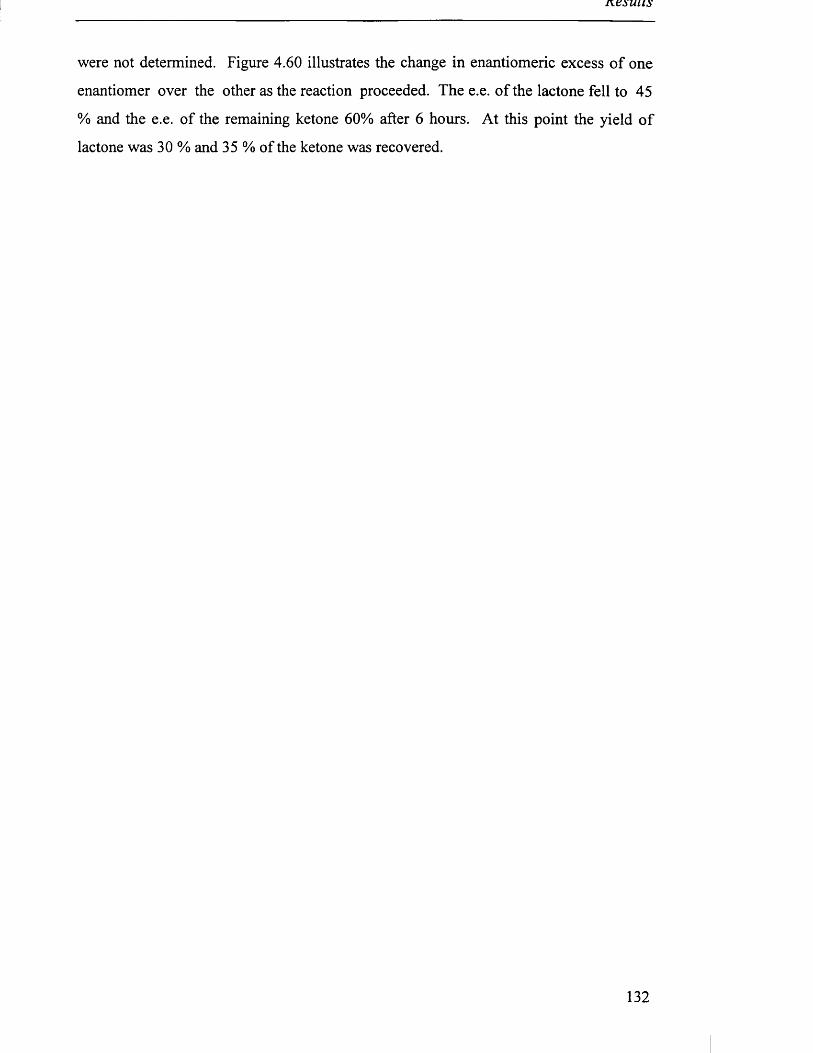
nesuus
were not determined. Figure 4.60 illustrates the change in enantiomeric excess of one
enantiomer over the other as the reaction proceeded. The e.e. of the lactone fell to 45
% and the e.e. of the remaining ketone 60% after 6 hours. At this point the yield of
lactone was 30 % and 35 % of the ketone was recovered.
132
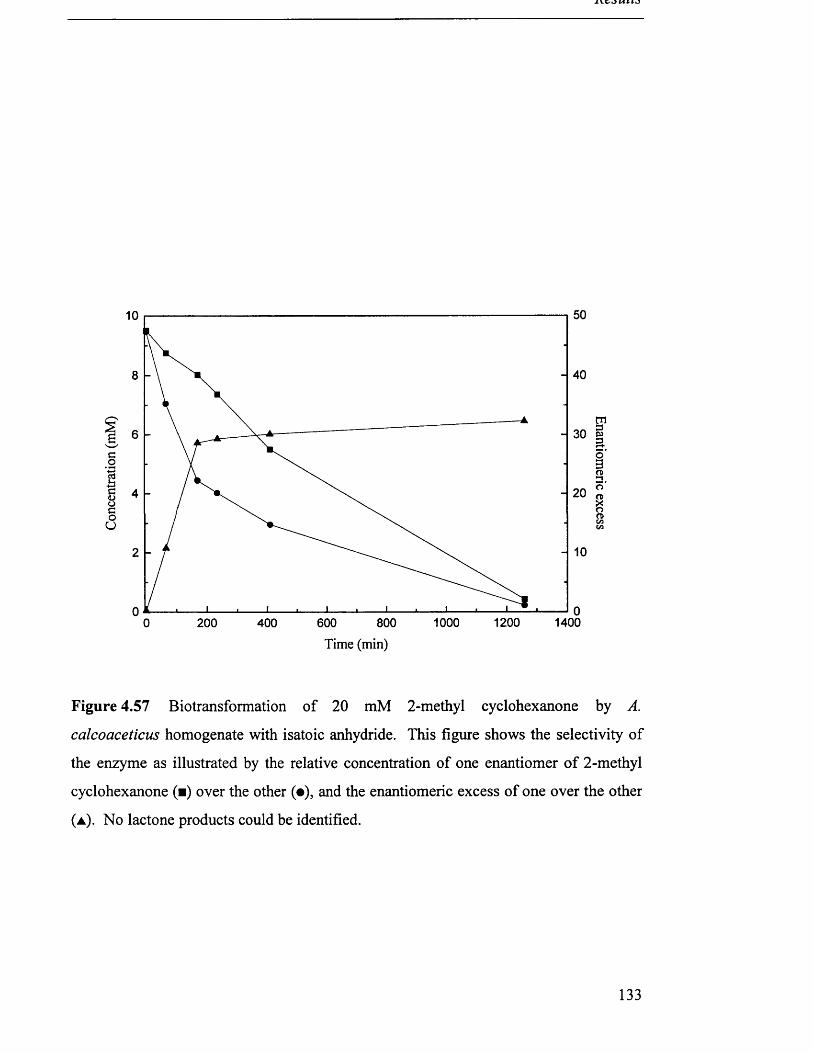
10 50
8
6
□.4
2
01200 14001000200 400 600 8000
Time (min)
Figure 4.57 Biotransformation of 20 mM 2-methyl cyclohexanone by A.
calcoaceticus homogenate with isatoic anhydride. This figure shows the selectivity of
the enzyme as illustrated by the relative concentration of one enantiomer of 2-methyl
cyclohexanone (■) over the other (•), and the enantiomeric excess of one over the other
(a ). No lactone products could be identified.
133
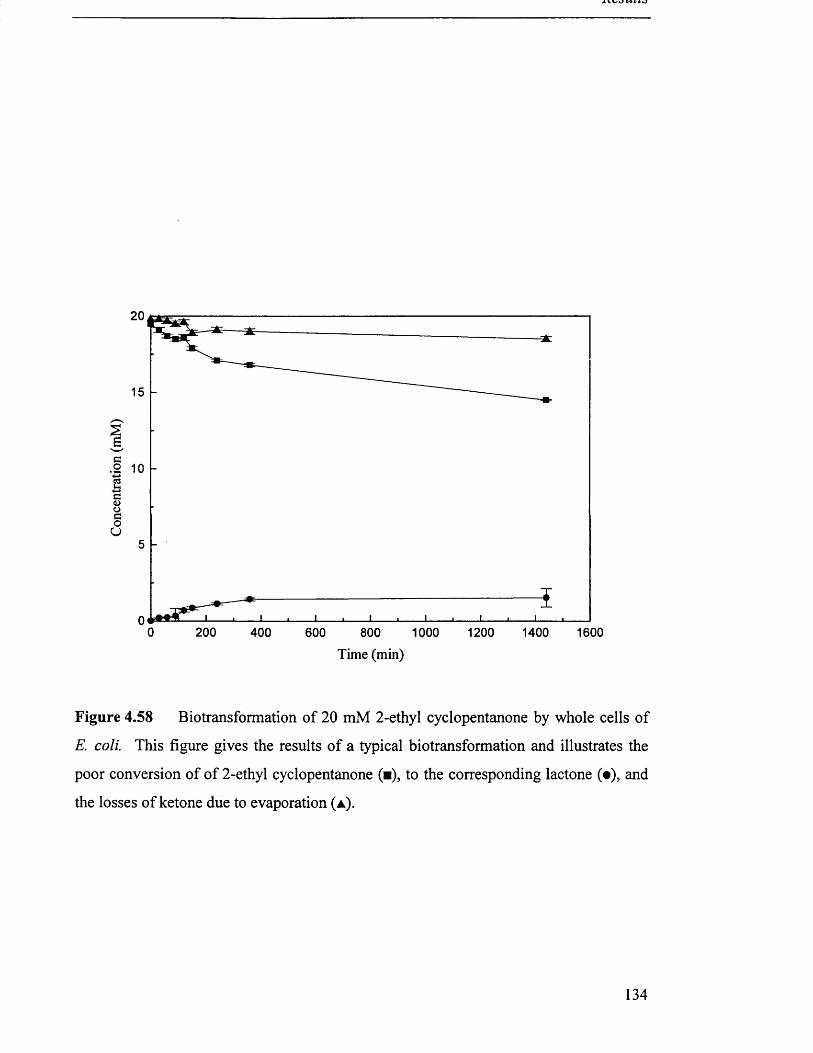
20
co
1c<L>OcoU
0 200 1400 1600400 600 800 1000 1200
Time (min)
Figure 4.58 Biotransformation of 20 mM 2-ethyl cyclopentanone by whole cells of
E. coli. This figure gives the results of a typical biotransformation and illustrates the
poor conversion of of 2-ethyl cyclopentanone (■), to the corresponding lactone (•), and
the losses of ketone due to evaporation (a ).
134
c01c<uocou
10
8
6
4
2
050 100 150 200 250
Time (min)300 350 400
Figure 4.59: Biotransformation of 20 mM 2-methyl cyclohexanone by E. coli
homogenate. This figure shows the selectivity of the enzyme as illustrated by the
relative concentration of one enantiomer of the substrate, 2-methyl cyclohexanone (■)
over the other (•), and the concentration of one isomer of the product, 2-methyl
capralactone (□) over the other (o).
135
100
Co' 70
% 60
w 50 olx
I
§cw
40
20
l0 50 100 150 200 250 300 350 400
Time (min)
Figure 4.60: Biotransformation of 20 mM 2-methyl cyclohexanone by E. coli
homogenate. This figure illustrates the enantiomeric excess of ketone substrate (■), and
lactone product (•), for the biotransfomation as described by figure 4.59.
136
c01c<uoco
10
8
6
4
2
00 200 400 600 800 1000 1200 1400
Tim e (min)
Figure 4.61 Comparison between A. calcoaceticus and E. coli homogenate
biotransformation of 2-methyl cyclohexanone. This figure shows the increased
utilisation of 2-methyl cyclohexanone by E. coli homogenate illustrated by the
concentrations of the two isomers of the ketone in the A. calcoaceticus (■ and •) and E.
coli (□ and o) reactions.
137
60
40
W 20
1200200 800 1000 14000 400 600Time (min)
Figure 4.62 Comparison between A. calcoaceticus and E. coli homogenate
biotransformation of 2-methyl cyclohexanone. This figure illustrates the enantiomeric
excess of one isomer of the ketone substrate over the other in the A. calcoaceticus (■)
and E. coli (□) reactions described by figure 4.61.
138
5 DISCUSSION
5.1 Biocatalyst production in Acinetobacter calcoaceticus
5.1.1 Carbon source investigation
Growth of A. calcoaceticus using cyclohexanol as the sole carbon source was
found to be impractical for a number of reasons. There is a large lag phase, typically 9
hours, which was due in part to variability in the inoculum. There was large variability
in the growth in shake flasks and predicting the optimum time for transfer to the
fermenter was difficult. Inoculum transfer to the fermenter typically occurred between
16 and 25 hours after inoculation of the shake flask. There was still variation in the lag
phase in the fermenter, however, when the inocula were at almost identical optical
densities after the same length of time.
Due to the toxicity of cyclohexanol to the cells above approximately 1 g L '1
cyclohexanol had to be added to the vessel at intervals. The flammability of
cyclohexanol prohibited its use in large quantities in the process area so a continuous
feed was not possible.
The medium (table 3.2) provided sufficient nutrients to produce 15 g L'1 dry
cells as shown when glutamate was used as the carbon source (figure 4.10). With
cyclohexanol as the sole carbon source only 3 g L'1 was produced regardless of further
additions. This was most likely due to an accumulation of toxic metabolites or the
stress on the cell membranes of maintained exposure to cyclohexanol.
139
Biocatalyst production was therefore separated into biomass production and
induction of cyclohexanone monooxygenase.
The use of succinate as a carbon source was found to be problematic due to
foaming. The quantity of base required to neutralise the acid prior to inoculation, and
the subsequent need for acid as the substrate was consumed during the fermentation
caused a large increase in the salt concentration. Large volumes of antifoam were
required to suppress foaming which caused a significant drop in the gas transfer and did
not allow the biomass to be increased beyond 4 g L"1. The long fermentation time
required the need for automatic antifoam addition which proved to be unreliable. The
foam produced was found to be slow to break down after addition of PPG solution. The
automatic control could not be tuned to deal with this problem and allowed the foam to
either block the off-gas filter or contiued to dose large amounts of antifoam which
suppressed oxygen transfer.
Succinate offered some advantage over cyclohexanol as carbon source with a
much shorter fermentation time, 20 h compared to 50 h, and reduced need for operator
supervision. The requirement for large volumes of flammable solvent and spark proof
facilities are also removed. The advantages of succinate over cyclohexanol are
significant for ease of process operation but negligible in terms of productivity. Further
carbon sources were therefore investigated.
Glutamate was found to be a good carbon source and did not produce excessive
amounts of foam as had other organic acid substrates. The need for pH readjustment
during media make up was reduced compared to succinate with a corresponding
reduction in the amount of pH control required. The growth rate was double that which
had been achieved with succinate which offered significant process advantages. The
growth profile was similar to that of succinate with a similar lag phase of 5 hours.
Fermentations with glutamate as a substrate were found to be more reproducible than
with either cyclohexanol or succinate. This was due to more reproducible growth in the
inoculum shake flasks allowing transfer when the cells were in the optimum condition.
The fermentation proceeded without the need for excessive volumes of antifoam
allowing good oxygen transfer to be maintained throughout. As mentioned previously
the medium allowed the production of up to 14 g L '1 from 30 g L '1 glutamate. This
was the maximum biomass achievable without the fermentation becoming oxygen
140
limited. The dissolved oxygen tension (data not shown) was maintained above 15 %
throughout the fermentation illustrated by figure 4.7.
Throughout the fermentation no CHMO activity could be detected. As expected
cyclohexanone monooxygenase is therefore not constitutively produced by A.
calcoaceticus but is instead only produced when the cells are exposed to a cyclic alcohol
or ketone. Both substrates have been found to induce activity (Sandey 1991) but the
actual induction method is not clear since the alcohol is oxidised to the ketone and vice
versa.
When cyclohexanol was added at the end of the fermentation (section 4.2.4)
induction of CHMO had not been achieved after 5 hours. The most likely explanation is
that, as had been seen previously with cells grown exclusively on cyclohexanol, there is
a significant lag of up to 9 hours before growth occurs. This is attributable to the
switching of metabolism to include the cyclic alcohol degradation pathway. The cells
cannot be maintained routinely on a solid medium containing cyclohexanol so this lag is
inevitable if cultures are stored on plates and shake flask inocula are grown on media
not containing cyclohexanol.
For this reason all further fermentations were inoculated with cells that had been
grown on glutamate and cyclohexanol as co-substrates.
5.1.2 CHMO production
The larger scale 7 LA. calcoaceticus fermentations illustrated in figures 4.9 and
4.11 show distinct evidence of diauxic growth with a very clear switch between
substrates. The change in RQ demonstrates the difference in the oxidation states of the
two substrates with cyclohexanol requiring more oxygen to be fully metabolised.
141
J S I O 1 4 0 0 l U f I
OHH2N COOH
C
Figure 5.1: Carbon sources for A. calcoaceticus
c h 2
c h 2
c/ / \
O OH
Table 5.1 summarises the results of the carbon source investigation to maximise
biomass produced. The advantage of glutamate as a carbon source is very clearly
illustrated producing significantly more biomass in a much more reasonable time. After
addition of cyclohexanol at the end of the fermentation the cells produced CHMO to the
same level that had been found when cyclohexanol had been the sole carbon source.
Carbon source Biomass (g L"1) Growth rate (h 1) CHMO (U gdc -1)
Cyclohexanol 3 0.16 25
Succinate 4 0.22 -
Glutamate 14 0.44 25
Table 5.1: Summary of carbon source investigation.
The fermentation profiles illustrated in Figures 4.9 and 4.11 show good
agreement. In the first fermentation the inducing cyclohexanol (1 g L*1) was added 1.5
hours after the fermentation had become oxygen limited and glutamate had become
exhausted as evident from the rapid decline in cellular respiration. CHMO was induced
142
I S l O k* l \ s f I
to approximately 25 U gdc'1 (Figure 4.10) 90 minutes later and was seen to rapidly
decline once the cyclohexanol was exhausted. The second fermentation (Figure 4.11)
was induced immediately upon the exhaustion of glutamate as indicated by a sudden
drop in the OUR and CER. Twice as much cyclohexanol as the previous fermentation
was added and the CHMO reached a maximum of 20 U gdc'1. The activity is not seen
to fall as rapidly because the cells are metabolising cyclohexanol for longer. As
previously seen in shake flasks the cells rapidly lose activity once the cyclohexanol is
consumed. This effect can be minimised by the addition of cyclohexanol just prior to
harvesting the cells to maximise productivity. Increasing the concentration of the
alcohol has a negative effect on CHMO production most likely due to cellular
membrane damage by the solvent (Sandey, 1991).
For large scale production of the biocatalyst the rapid decline of activity after
induction could dramatically reduce the productivity of the fermentation if the
conditions are not carefully monitored and controlled. The time taken to process large
volumes of cells would make it difficult to maintain high levels of activity.
The use of glutamate and cyclohexanol as growth substrates followed by
induction by cyclohexanol addition has increased the productivity of the fermentation
from 75 to 350 U L '1. The time for the fermentation has also been reduced from 50 to
15 hours. The productivity if defined as units of CHMO produced per litre per hour has
therefore increased from 1.5 U L '1 h '1 to 23 U L '1 h"1. This represents a significant
advantage in both processing time and cost.
143
1-/ frkj W (4JJ
5.2 Biocatalyst production in Escherichia coli
5.2.1 Over expression of CHMO in an E. coli construct
Dr. Sejal Patel (UCL) excised the fragment of DNA containing the CHMO gene
from A. calcoaceticus and inserted it into a high copy number plasmid pQR210 in an E.
coli host (lab strain JM107). The gene was placed under the control of a tac promoter, a
hybrid of lac and trp promoters (de Boer et al., 1983) that has much increased
productivity over the parental promoters (Amann et al., 1983). The construct was
selected for by ampicillin resistance conferred by the presence of the gene encoding for
P-lactamase in the plasmid. The addition of ampicillin to the growth medium could
therefore be used to prevent the accumulation of plasmid free cells. Induction of the
recombinant CHMO could be stimulated by the addition of IPTG to the growth medium.
IPTG, which is an analogue of lactose, is not metabolised by the cells and so its
concentration and inducing effect is maintained.
The over-expression of CHMO from recombinant E. coli cells should allow for
much greater productivity over A. calcoaceticus and due to the much greater
understanding of E. coli fermentations an easier process for biocatalyst production.
The construct was found to produce active CHMO protein with glycerol as the
carbon source (Figure 4.1). Glycerol was chosen as the carbon source because growth
on sugars tends to inhibit the tac promoter. There is also evidence that at high cell
concentrations the production of acetate from incomplete sugar metabolism may reduce
the production of recombinant protein (Lee, 1996). This strain of E. coli has been
successfully grown on glycerol at UCL to 20 g L '1 by Dr. Gordon Hobbs to produce
recombinant transketolase (Hobbs et al., 1996).
144
Lsio% *uaaiuri
5.2.2 Plasmid stability
The production of large scale enzyme biocatalyst requires a progression in the
scale of culture to the final fermenter volume required. It is vital therefore that the cells
are in the best condition possible at each stage to maintain high productivity. As
mentioned previously in section 4.3.3 the loss of plasmid from the cells during any of
these stages will dramatically reduce the production of recombinant CHMO. It was vital
to assess the stability of the plasmid and how prone the cells were to segregational
plasmid instability. Table 4.3 shows that after 22 hours growth in a shake flask there is
some loss of plasmid especially when grown on defined medium. The most likely
explanation for this phenomenon is the well documented process of secretion of the P-
lactamase. p-lactamase, which infers ampicillin resistance, is secreted into the
periplasm where it degrades the ampicillin, reducing the effective concentration with
time (Georgiou et al., 1988). As the concentration decreases so the likelihood of
plasmid loss increases. The plasmid free cells are believed to have a faster growth rate
than those still containing a plasmid since they have a lower metabolic burden.
However, the loss of plasmid containing cells in this recombinant strain has been shown
to be minimal during the likely fermentation time.
5.2.3 IPTG concentration
IPTG which is required to induce the tac promoter and hence production of
CHMO is expensive and the required concentration must therefore be as low as
possible. Figure 4.15 shows that the minimum concentration required for CHMO
induction that was approaching the maximum achieved is 0.25 mM. Further increase to
the concentration had little effect on productivity. This was not unexpected since the
compound is known to be a very strong inducer and, since it is not metabolised, the
concentration required is therefore low. Increasing the concentration has no effect once
the production of recombinant enzyme is at its maximum rate. To insure that expression
was at its maximum a concentration of 0.5 mM was used for subsequent fermentations
to allow for any losses of IPTG due to chemical reactions or thermal instability.
145
Discussion
5.2.4 Growth and production of CHMO on complex media
Initial fermentations used complex medium for growth with glycerol as a carbon
source. The cells grew at a growth rate of 0.7 h’1 and reached a maximum cell
concentration of 6 g L '1 before the oxygen demand became greater than the maximum
the vessel could supply. The components of the complex medium caused significant
amounts of foaming and thus required the addition of significant quantities of antifoam.
A large concentration of antifoam is undesirable for a number of reasons. The
surfactant nature of antifoams means that the act as a barrier to gas transfer and thus
reduce the fermenter’s ability to supply oxygen. The need to remove antifoam during
downstream processing can also be a problem as it can reduce homogeniser efficiency
and make protein purification difficult.
During the fermentation illustrated by figures 4.16 to 4.18 CHMO production
was induced after 3 hours when the cells were in the exponential growth phase. Over
800 U gdc*1 of CHMO were produced. This is an improvement over the shake flask
production where 300 U gdc*1 were produced. The maximum activity was reached
much more quickly in the fermenter and the lag in production which had been seen in
shake flasks was not present. This was most likely due to the increased oxygen transfer
in the fermenter which has been reported to be of great importance when producing
recombinant proteins (Bhattacharya and Dubey, 1997).
A repeat fermentation with increased concentration of glycerol that allowed the
fermentation to become oxygen limited was performed. Figures 4.19 and 4.20 show the
profile of such a fermentation. The cells grew at an exponential rate (0.7 h*1) until 6 hrs
when oxygen became limiting and growth continued, albeit at a continuingly decreasing
growth rate, until the nutrients were exhausted after 9.5 hours. CHMO induction was
attempted after 6 hours when the fermentation was growth limited on oxygen as
indicated by the decline in OUR and CER. Only 250 U gdc'1 of CHMO activity were
induced indicating that cells require a well oxygenated environment for maximum
protein production. The oxygen limitation did not effect the rate of CHMO production
with the maximum activity found after approximately 2 to 2.5 hours after induction in
both cases.
146
Discussion
The problem of foaming when grown on complex medium and the inherent
variation in product specification make clearly defined media the preferred choice for
industrial fermentations.
5.2.5 Initial study of growth and production of CHMO on defined media
As stated earlier the defined medium used was chosen because it was known to
support the growth of strain JM107 to at least 20 gdc L"1 (Hobbs et al., 1996). Initially
batch fermentations were carried out to gain data that would be required for any
subsequent fed batch fermentations.
The complex medium fermentations showed that induction of CHMO must be
achieved while dissolved oxygen is at a sufficient concentration to prevent any
limitation to growth. This information meant that the glycerol concentrations would
have to be kept at a level that would allow OUR to remain below approximately 80
mMole L '1 h’1 since this is the maximum transfer rate achievable by the vessel with the
DOT maintained above 20 %. To achieve this transfer rate the stirrer was operating at
maximum output of 1100 rpm and the air flow rate was 1 v v '1 min'1. Further increases
in the gas flow rate caused excessive foaming and some cavitation around the impeller
which has serious implications for the mixing conditions in the vessel.
Figures 4.21 to 4.23 show a typical profile for a batch fermentation on defined
medium. After a lag period of approximately two hours an exponential growth phase
began. The exponential growth phase continued at 0.43 h-1 until 9.5 hours when the
glycerol became exhausted. This growth rate is significantly slower than when the
complex medium is used (0.7 h '1). This is expected since the cells have to synthesise
many more components from basic chemicals that would be supplied by the complex
medium. The stirrer was increased throughout the fermentation to maintain the DOT
above 10 % at all time and preferably above 20%. From 15 g L '1 glycerol a dry cell
concentration of 7 g L '1 was achieved. Figure 4.21 illustrates clearly that an OUR of 60
is the maximum achievable with a DOT above 20%. At this point the gradient of the
curve shows that after another 30 minutes the DOT would be zero.
147
Discussion
The effect, if any, on the production of CHMO when using defined medium had
to be investigated. Figures 4.18 and 4.20 show the profiles for identical fermentations
where induction of CHMO was initiated by the addition of IPTG during the exponential
growth phase. Due to scheduling difficulties the inocula for these fermentations were
not in the ideal condition. Figures 4.21, 4.24 and 4.27 should show identical growth
profiles. The shake flasks used for inoculation were incubated for too long in the
second two fermentations. This has resulted in a much increased lag phase from 4 hours
in the first fermentation, where the inoculum was in mid exponential growth phase, to 6
and 8 hours respectively, where the inocula had been allowed to grow to stationary
phase. Once the exponential growth phase had been reached the profiles are very
similar. All reached a maximum growth rate of approximately 0.44 h '1 with a maximum
OUR of 65 mmole L '1 h '1 and a cell density of 7 g L*1, with the exception of the
fermentation illustrated by figures 4.20 and 4.21 which reached only 5 g L’1. This loss
of yield can be explained by the increased lag phase where the cells were recovering
from the stationary conditions in the inoculum. When the inocula cultures have reached
the stationary phase the potential for plasmid loss from some cells is increased. This
can lead to a greater proportion of non plasmid bearing cells in the inoculum. The
figures show however that there was little if any loss of plasmid containing cells
throughout the fermentations. The increased lag phase can thus be explained by the
reduced number of viable cells entering the vessel from the seed flask and that the cells
would have been in the stationary phase and nutrient depleted.
The respiratory quotient settled at 0.74 after initial noise. If the glycerol had
been completely oxidised an RQ of 0.86 would be expected since 1 mole of glycerol
produces 3 moles of carbon dioxide from the consumption of 3.5 mole of oxygen.
C3H80 3 + 3.5 0 2 --------► 3 C 0 2 + 4 H20
RQ = 3 / 3 . 5
= 0.86
This shows that some or all of the glycerol is not being fully oxidised. The discrepancy
is due in the main part to the incorporation of carbon in the construction of cell mass
and to a lesser extent the production of organic acids. Organic acids tend to be produced
148
Discussion
when the cells are not supplied with sufficient oxygen and the fermentation becomes
anaerobic. Under the fermentation conditions present there should not have been
anaerobic conditions. Assuming that to be the case the above equation can be replaced
with one taking into account the carbon utilised by cell mass by estimating the elemental
composition of the cells (Atkinson and Mavituna, 1983).
aCH2.670 + bC>2 + CNH3 ---------► CH2O0.5N0.25 + dC 0 2 + eH 20
C: a = 1 + d
H: 2.67a + 3c =: 2 + 2e
O: a + 2b = 0.5 + 2d + e
N: c = 0.25
To solve the simultaneous equations requires a further relationship which can be
taken from the growth yield on glycerol; 0.47 gdc g '1. The yield on glycerol is therefore
equal to formula weight of dry cells divided by the formula weight of cells multiplied by
the exponent a.
Solving the equations gives: a = 1.76, b = 0.99, c = 0.25, d = 0.76 and e = 1.72.
The RQ can be simply calculated from d/b to give 0.77. This value is very close to the
observed value when considering that the formula is based on average cell composition.
When induced by the addition of IPTG the maximum activity was much lower
than had been achieved with complex growth medium. As discussed in section 4.4.1 the
small loss of plasmid does not account for this loss in active protein. The loss of
activity would make a defined medium fermentation very costly since no increase in
productivity would be gained even if the cell density could be increased dramatically by
a fed batch regime.
The loss of activity could be due to this cell strain requiring additional nutrients
to produce CHMO at the desired level. To make an assessment of exactly what this
nutrient or nutrients may be would be very time consuming. The complex medium
fermentations had shown that the CHMO could be produced to 900 U gdc*1 so yeast
extract and tryptone were subsequently added at the time of induction.
149
Discussion
Figures 4.30 to 4.32 show the results of this fermentation. Glycerol at a
concentration of 20 g L '1 was inadvertently added. This combined with the increased
oxygen requirement for the metabolism of the components of the yeast extract and
tryptone increased the demand to greater than that which could be supplied.
Consequently the DOT fell to zero and the OUR reached 100 mMole L '1 h '1. The early
portion of the data was lost due to a problem with the mass spectrometer gas analyser.
The inoculum was in the ideal condition for this fermentation which has minimised the
lag phase. CHMO was produced after induction and reached a maximum of 800 U gdc'1
after approximately 2 hours. The maximum CHMO activity was recorded before the
DOT fell to a level that had previously been shown to reduce the enzyme titre. This is
comparable to cells grown and induced on complex growth medium. Many of the
advantages of a defined medium are still maintained since the majority of the growth
phase is on a defined medium. The problems of foaming and lack of reproducibility that
can occur with complex medium are removed but the productivity of the complex
medium can be maintained.
This information gave the required operating conditions for the fed batch
fermentation development.
5.2.6 Development of fed-batch fermentation
A fed batch fermentation would allow the cell concentration to be increased and
hence increase the productivity of the fermentation. To further increase the biomass in a
batch fermentation would require increased oxygen supply by supplementation of
sparging air with oxygen. A fed batch system allows the growth rate to be controlled
and hence the oxygen demand can be controlled to below that which the fermenter is
capable of supplying. As discussed in section 4.4.3 it has been widely reported that
reducing the growth rate of a recombinant E. coli fermentation reduces the loss of
plasmids from the cells and can enhance the production of recombinant protein.
150
Discussion
5.2.7 Constant growth rate
During batch fermentation the cells grow at the maximum growth rate (pmax) for
that particular medium. Reducing this growth rate by controlled addition of the carbon
source may increase the production of CHMO. A fed batch fermentation was attempted
with the Lab View controlled pumps set to deliver glycerol at a rate that would produce a
growth rate of 0.15 h"1. Figures 4.33 and 4.36 show the gas profiles for two fed batch
fermentations where the initial glycerol concentration in the medium was 1 g L '1 and 5 g
L '1 respectively.
The depletion of the limited supply of glycerol in the batch phase was shown by
a rapid decline in the OUR and CER and a corresponding rise in the DOT. The biomass
concentration was estimated from optical density at this point and the pumps controlling
the glycerol feed turned on to initiate the fed-batch phase of the fermentation.
The gas profile (figure 4.3) is as would be expected until the point of IPTG
addition. There is a sudden rapid increase in the OUR and CER profile and a small
increase in the RQ that then settles to the original level. This could be due to an
explosion of growth due to the addition of the complex medium components at this time
or the change in metabolic pathways to produce the recombinant protein. The values of
OUR and CER are lower than would be expected however when compared to those
obtained from the second fermentation. This indicates that growth was interrupted by
the addition of IPTG and the complex nutrients. There is no evidence of this
phenomenon in subsequent fermentations however. The pressure in the vessel had
increased again due to a partially blocked air filter. It was discovered that the cooling
water for the condensers had inadvertently been connected to the incorrect supply and
was not sufficiently cool to efficiently condense the moisture in the off-gas. The
increased pressure may have damaged some of the cells which may explain the
uncharacteristic gas profile during induction.
The profile for the second fermentation shows that growth was not interrupted
by the addition at 20.5 hours. The cells were induced to produce CHMO before the
maximum biomass achievable with this medium was reached because earlier
experiments had shown that dissolved oxygen was important for good expression of
151
Discussion
active protein. Figures 4.36 to 4.38 illustrate that CHMO activity had reached a
maximum when DOT had fallen to only 50 %.
The RQ appeared very unstable in all fermentations due to small errors in the
readings of relative oxygen and carbon dioxide. This was due to the sparge gas
composition not being measured directly but taken instead from an average value. The
gas analyser reference air pump had been malfunctioning intermittently and had
produced uneven gas flow. For this reason average values from the room were taken as
reference and so did not take into account any changes in the actual composition of the
feed air source throughout the fermentation.
In the second fermentation (Figures 4.36 to 4.38) there was an increase in the
RQ value once the fermentation had been switched to the constant growth rate phase
which then fell slowly to the original value. This increase in RQ due to a relative
increase in CO2 evolution would tend to indicate that the cells were incorporating less
carbon into cell mass and respiring more indicating a higher requirement for
maintenance energy.
The production of CHMO in each case follows a similar profile (figures 4.34 and
4.37) reaching a maximum approximately 2.5 hours after induction. The second
fermentation produced 10% less maximum activity, 388 U gdc*1 compared to 436 U
gdc"1. This is difficult to explain since the fermentations were essentially identical. In
the first fermentation the OUR and CER data are very different to the second after
induction and would tend to indicate a lower growth rate, this was not evident in dry cell
weight determinations over the same period however. In the second fermentation the
RQ is seen to decline steadily during the controlled growth rate phase indicating that
less CO2 was being produced. The production of organic acids or greater incorporation
of carbon into the cells could account for this discrepancy. The production of organic
acids by E. coli is well documented (Luli and Strohl,1990; Pan et al., 1987) but is
usually associated with a oxygen limitation and therefore incomplete oxidation of the
carbon source. This change in metabolism could account for the slight loss in CHMO
activity.
152
Discussion
5.2.8 Constant feed rate
When considering the implications for scaling up such a fermentation, maximum
gassed power must be taken into consideration. The maximum oxygen supply rate of
larger fermenters is lower and can be assumed to be in the region of 50 mmole L '1 h '1
for a 1500 L vessel. An exponentially fed fermentation will still allow the fermentation
to become oxygen limited. To reach the maximum achievable biomass without oxygen
limitation for a given medium would therefore require a constant feed rate of glycerol to
maintain an OUR close to but not exceeding the maximum achievable by the vessel.
Figure 4.39 shows a fed batch fermentation where after the initial batch
phase the pumps were set to deliver sufficient glycerol to allow a growth rate of 0.15
h **. During the batch phase the cells grew as expected from previous fermentations
with a growth rate of 0.44 h '1. When the limited carbon source (5 g L '1) was depleted
the cell concentration was 2.4 gdc L '1 which was a yield of 0.48 gdc g’1. During the
exponential feeding phase a total of 84 mL of feed (700 g L '1) was added corresponding
to 58.8 g glycerol. The DCW had increased by 5.5 g L'1 (22.4 g) indicating a yield of
0.38 g g '1. The RQ fell steadily throughout the period of controlled growth from =0.8 to
0.74 the expected value for batch fermentation. A possible explanation is the
production of organic acid during the batch phase of growth. If at this lower growth rate
the production of acid was reduced and the acid produced during the batch phase were
utilised by the cells, the amount of carbon dioxide produced would be greater. This
would have the combined effect of raising the RQ. As the acid was used by the cells the
amount of carbon dioxide produced would gradually decrease to the level expected.
When the OUR had reached a value of 50 mmole L '1 h '1 the pumps were set to
deliver a constant feed at that rate of addition reached at that point. As the rate of
glycerol added is constant the oxygen requirement to metabolise it should also be
constant and it would be expected that for a constant volume the OUR and CER would
also remain constant. As feed is added there is a increase in volume but this was taken
into consideration when calculating the values by taking data from Lab View and
inputting itno the spreadsheet for OUR and CER calculations. There was a gradual and
linear increase however with a much smaller but steady increase in the RQ. During
linear feeding the cells are growing at constantly decreasing growth rate which is clearly
153
Discussion
indicated in figures 4.40 and 4.41. The increase in OUR and CER is accompanied by a
corresponding decrease in the DOT indicating that the demand for oxygen was
increasing throughout feeding.
The previously mentioned organic acid production and subsequent metabolism
could explain this increase in RQ but the amount of acid produced is unlikely to have
been sufficient to cause an elevated RQ for the length of the period of the linear feeding.
The most likely explanation is an increase in the maintenance energy requirements of
the cell. As the growth rate decreases the proportion of energy that is utilised by the
cells for maintenance becomes more significant until a point is reached where the feed
rate of glycerol is no longer sufficient to support an increase in biomass.
When induced with CHMO after 31.5 hours the production of CHMO was rapid
reaching a maximum of 100 U gdc'1 after 3.5 hours. The time taken to reach maximum
activity was slightly longer than when induction occurred during the period of controlled
growth rate. This is due to the metabolism of the cells being at a generally lower rate
due to the very low growth rate. The addition of complex nutrients at this stage as had
been indicated as a requirement during earlier fermentations produced no noticeable
change in metabolism. Neither OUR, CER or RQ showed any significant change after
induction although towards the end of the induction period (defined as when maximum
CHMO activity had been reached) there was a period when the DOT stopped
decreasing. There is no associated change in the gas analysed however. After 40 hours
the was no measurable increase in dry cell weight although the cells continued to respire
at approximately the same rate.
In the second fermentation illustrated by figures 4.42 to 4.44 constant feed rate
was started immediately after batch phase with no period of constant growth rate. The
OUR and CER were much greater in the batch phase due to the pumps being switched
on after 8 hours of growth thus effectively increasing the amount of glycerol available
for exponential growth. The RQ slowly increased during feeding as in the previous
fermentation around * 0.8. The cells reached a greater concentration than in the
previous fermentation with an average yield of 0.34 gdc g-1 glycerol. After induction
the maximum activity of 120 U gdc'1 was reached after 3 hours
154
Discussion
5.3 Stability of stored catalysts
5.3.1 Whole cells
An important factor when considering which form of biocatalyst to use is the
stability of that catalyst during storage. Both A. calcoaceticus and E. coli showed that
under the storage conditions tested active CHMO can be maintained for many months
(Figures 4.45 and 4.46). The addition of a cryo-protectant such as glycerol while
offering no advantage to the stability of CHMO does allow the cells to be stored in a
viable condition for use in whole cell biotransformations. In the case of E. coli the cells
have retained half of their original activity after some 24 months when stores at -18 °C.
The variability in the data is due to the method of sampling. When material was
prepared for freezing it was dispensed in aliquots so that the bulk was not disrupted by
thawing after each time point and there was likely to have been some variability in the
cell concentration dispensed.
This means that active CHMO can be produced on a large scale and stored for
use in future biotransformations. Samples from the cells removed from storage after
150 days were diluted and plated onto agar and incubated. When examined after 32
hours there was an average of 300 discreet colonies from the cells stored in glycerol and
only ten or twenty from those stored without. A freshly grown culture, of a similar cell
concentration, plated under the same conditions produced confluent growth. Although
this showed that the storage conditions are adequate for maintaining CHMO activity, it
does not necessarily infer that the cells would be useful for whole cell
biotransformation.
When used as a biocatalyst the cell must be metabolising to recycle NADPH and
facilitate the biotransformation. Cells that have been frozen, while viable, are unlikely
to be in an optimum condition and may require a period for recovery before efficient
function.
As discussed earlier the CHMO activity was found to decrease rapidly at the end
of the fermentation once the cyclohexanol was exhausted. When the cells had been
harvested, i.e. removed from the culture medium by centrifugation, the reduction in
CHMO activity with time was greatly reduced. When the cells were resuspended in
155
Discussion
buffered solution the cells maintained CHMO activity for a number of hours at room
temperature typically losing activity after 5 or 6 hours (Figure 4.49). This shows that
the rapid decline in CHMO activity experienced at the end of fermentation was due to
metabolic activity within the cells. Presumably the removal of nutrients from the cells
slows down metabolism and hence the destruction of the enzyme.
5.3.2 Homogenate
A. calcoaceticus homogenate was not tested for stability. If the biocatalyst was
required in a homogenate or purified form, there would be no advantage in producing
enzyme by A. calcoaceticus fermentation. As previously discussed, E. coli is a far more
productive vehicle for producing the catalyst in this form.
Figure 4.47 shows the stability of clarified homogenate under a variety of
conditions. All samples originated from the same batch of cells and were stored under
the same physical conditions. It is very clear that the activity is lost very rapidly when
the homogenate is stored at 4 °C even when sodium azide or ampicillin was added to
prevent contaminating microbial growth. There was a slight improvement in stability
when anti-microbial agents were added indicating that a small proportion of the loss in
activity could have been due to bacteria utilising the enzymes in the homogenate as an
energy source. The remainder of the loss therefore. Is likely to be due to the action of
protease enzymes naturally present in E. coli. The action of these enzymes can be
inhibited by the addition of chemicals but when planning biotransformations the system
should be kept as simple as possible with the minimum amount of potential interfering
chemistry.
It is interesting that when stored with glycerol present the activity appears to be
maintained more effectively than with buffer solution alone (Figure 4.47). The gradual
decline of activity in the homogenate stored in buffer alone would indicate that the
effect is not due to assay interference since the effect should have been observed in the
early samples as well. As the same batch of homogenate was used for all storage
conditions, the protein concentration and hence activity in the samples stored with
glycerol was approximately half that of the buffer only homogenate. It is possible that
156
Discussion
this dilution infers stability to the homogenate or that the reduced water activity due to
the presence of glycerol inhibits the action of degrading enzymes.
5.4 Biotransformation - A. calcoaceticus whole cells
5.4.1 Stability of CHMO activity during biotransformations
The stability of CHMO activity during a reaction was vital to the success of the
reaction and a significant factor to the usefulness of whole cells as a biocatalyst. Figure
4.49 shows the stability of CHMO activity in A. calcoaceticus, during a cyclohexanone
biotransformation. After 300 minutes there was no loss of activity compared to the
control cells without addition of the substrate. Figure 4.48 shows that at this point there
was still a significant concentration of cyclohexanol present in the medium and it must
therefore be this or the presence of its metabolites that infer this stability. The presence
of cyclohexanol, which induces the production of CHMO, must either be continuing to
stimulate the production of new CHMO and balancing the proteolysis or repressing the
proteolysis.
Figure 4.51 shows that the presence of 2-ethylcyclopentanone does not have the
same CHMO activity protecting activity that was present in the cyclohexanone
biotransformation. This cyclic ketone was likely to have been a substrate for CHMO
and the lactonase enzyme since no lactone production was observed.
2-ethylcyclopentanone can however be seen to be a poor substrate for the alcohol
dehydrogenase as there was very little 2-ethylcyclopentanol produced. It is possible
therefore that it is the presence of the alcohol that maintains the CHMO activity.
Studies by earlier workers have shown that cells grown on cyclohexanol or
cyclohexanone exhibit the same pattern of enzyme production and that either substrate
promotes the production of all the enzymes in the pathway (Sandey and Willetts, 1992).
For future whole cell biotransformations, cyclohexanol was added as a co-substrate to
maintain the activity of CHMO.
157
Discussion
5.4.2 Cyclohexanone
For A. calcoaceticus cells to produce biotransfomation products the cells must
have a mechanism that allows the diffusion, facilitated or otherwise, of both simple and
complex cyclic alcohols, ketones and lactones through the cell wall and membrane.
Figure 4.58 shows the results of a typical biotransformation of cyclohexanone. All
species were identified and quantified by their relative retention times when compared
to standards analysed by GC (section 3.1.2). No products of CHMO could be identified
as expected by the over-metabolism of the lactone product by the later enzymes in the
pathway (figure 1.8).
It can be seen that cyclohexanol dehydrogenase is catalysing the reverse reaction
to produce cyclohexanol. This reaction is running at approximately the same speed as
the monooxygenase catalysed lactonisation indicated by the fact that after 300 minutes
the ketone has disappeared and the alcohol has reached a concentration of 10 mM.
From this point on CHMO produces lactone at the same rate that the alcohol
dehydrogenase produces ketone since no further cyclohexanone could be measured.
5.4.3 2-ethyl cyclopentanone
The use of 2-ethyl cyclopentanone as a substrate for CHMO was chosen to
illustrate the chiral resolution potential of the enzyme. It was hoped that the lactone
product might not be a suitable substrate for the lactonase enzyme and hence lactone
products would be identified. Figure 4.50 illustrates a typical profile for a 20 mM
biotransformation. No lactone products could be identified. It was not possible to
purchase a standard substituted alcohol or lactone but the retention times of peaks could
be estimated based on the retention time of cyclohexanol and capralactone relative to
cyclohexanone. Therefore, the unknown peak present in small concentration is most
likely the corresponding substituted alcohol. The reaction proceeds at a much slower
rate than with cyclohexanone and there is very little alcohol produced. The
concentration of 2-ethyl cyclopentanol reaches a maximum of 1.2 mM indicating that
this is not such a good substrate for the dehydrogenase enzyme as cyclohexanone. The
158
Discussion
lactone produced is however a good substrate for the lactonase since no evidence of
further lactones could be found. The reaction appeared to have stopped after
approximately 400 minutes and when the CHMO activity was measured it was found to
be very low.
5.4.4 4-methyl cyclohexanone
4-methyl cyclohexanone was chosen as a substrate because it is a pro-chiral
compound. The structure of the molecule is such that when an oxygen is inserted into
the ring a chiral molecule is formed. Figure 4.52 shows a typical biotransformation
where cyclohexanol has been added as a co-substrate to maintain the CHMO activity.
The data illustrates that the biotransformation of 4-methyl cyclopentanone is very rapid
and the production of the unknown intermediate, which for reasons discussed earlier
was considered to be 4-methyl cyclopentanol, follows a similar pattern to that of the
cyclohexanone biotransformation (Figure 4.58). The alcohol reaches a maximum
concentration of approximately 10 mM after 300 minutes.
The cyclohexanone is initially transformed very rapidly but then reaches a level
of 7 mM and is slowly metabolised. Very little cyclohexanone was measured reaching a
maximum concentration of 5 mM. This is not surprising since the rate of lactonisation
by CHMO is known to be rapid. The production of 4-methylcyclohexanol from the
back reaction of the dehydrogenase has occurred at approximately the same rate as when
cyclohexanone had been added. When comparing the results from 2-ethyl
cyclopentanone it can be seen that the substitution at the two position, or the use of a
cyclopentanone derivative, slows down the reaction rates of both the dehydrogenase and
monooxygenase enzymes.
Previous workers have shown that there is little difference between
cyclohexanone and cyclopentanone (Donoghue et al., 1976) as a substrate. The loss of
activity with the 2 substituted ketone is most likely due to stearic hindrance in the active
site.
The cell contents were checked to ensure that none of the substrates were stored
in the cells. When the reactions were sampled, the supernatant was analysed by GC for
159
Discussion
cyclic components. The cells were washed with buffer twice, resuspended, and
sonicated to release intracellular components. After treatment to remove protein the
supernatant was analysed for cyclic components. The wash solutions were also analysed
by GC and found to contain only unquantifiable traces of alcohol and ketone.
Figure 4.53 shows that initially the concentrations reached as much as 1 mM
when the cell contents were resuspended in 1 mL of buffer. The wet cell weight was
approximately 25 mg, or approximately 25 pL, indicating that the maximum
concentration within the cell was in the region of 40 mM one hour after addition. As a
proportion of the total however, very little of the reactants and products were contained
within the cells. The intracellular concentrations are in a similar ratio to the bulk in the
supernatant with the exception of the sample taken at 240 minutes. The intracellular
concentrations were very close to zero at this point which is difficult to explain. As
previously mentioned, there were no measurable reaction components in the wash
buffer, just an unquantifiable trace in the first wash. The cell disruption buffer was
equivalent in volume to the wash buffer so any significant leakage would have been
observed. A possible explanation is that the rate of reaction has slowed to a point where
it is equal to the rate of diffusion across the cell wall and membrane.
5.5 Biotransformation - E. coli whole cells
The greater productivity of E. coli fermentation makes the use of the
recombinant catalyst an attractive option. The lack of a native lactonase enzyme in the
E. coli host strain should allow the production of lactone without further metabolism.
Figure 4.58 shows a typical whole cell biotransformation of 2-ethyl cyclopentanone.
The biotransformation of 4-methyl cyclohexanone produced very similar results (data
not shown). The results show that E. coli whole cells are a poor catalyst for the
biotransformation of this type of compound.
Lactone product was identified by relative retention time but at less than half of
the concentration of ketone lost. A control to assess losses through evaporation showed
that while this may account for some of the additional loss there was most likely another
cause of ketone or lactone loss. The lactone could have been chemically degraded, i.e.
160
Discussion
the ring opened during the reaction. The disparity appears at the beginning of the
reaction however, in a time scale in which the lactone is known to be stable under these
conditions (Hogan, unpublished data). The other possibility is that E. coli possesses
some other enzyme mechanism for the slow degradation of either the ketone or the
lactone.
The enantiomers of either the lactone or ketone could not be resolved by the
analytical technique available. The low conversion could be due to a number of factors.
It is possible that the cell structure of E. coli does not have the correct properties to
enable these cyclic compounds to diffuse into the cells thus reducing reaction rates. A.
calcoaceticus has evolved to grow on cyclic hydrocarbons as a sole carbon source and
as such must have machinery in place to allow the diffusion of such compounds or their
active transport in and out of the cells. E. coli may not beable to recycle the NADPH
required for the reaction. In this case the reaction would be initially as rapid as diffusion
would allow until the pool of NADPH had been oxidised. In A. calcoaceticus whole
cells the pathway includes reactions that recycle the NADPH without the need for any
other substrate for a second pathway. Should whole cell E. coli require NADPH to be
added this negates any advantage to using the more active recombinant from of the
whole cell catalyst. Since no examples cellular uptake of NADPH could be found in
literature, it is unlikely that the addition of NADPH to the biotransfomation buffer
would be successful.
5.6 Biotransformation - A. calcoaceticus homogenate
From the whole cell biotransformations it was apparent that the both 4-methyl
cyclohexanone and 2-ethyl cyclohexanone were substrates for the lactone degrading
pathway. As expected no lactone products could be detected during the
biotransformation of 4-methyl cyclohexanone as illustrated by Figure 4.54. The
requirement for NADPH addition to the reaction is clearly illustrated by Figure 4.54.
There is an initial drop in the concentration of 4-methyl cyclohexanone as the NADPH
present in the cell homogenate is consumed, but the lack of recycling capacity is clearly
illustrated. When stoichiometric quantities of NADPH were added to the reaction the
reaction proceeded as expected.
161
Discussion
The lack of lactone products implies that the lactonase enzyme is active (Figure
1.8) and the ring has been opened. A later step in the pathway should recycle the
NADPH consumed by the monooxygenase and allow the biotransformation to proceed.
For this recycle to occur NAD is required and this metabolic degradation pathway does
not possess an NAD recycle step. The consequences of this are that NADPH would
have to be added in stoichiometric quantities or an NADPH recycle system would have
to be added to the biotransformation.
As mentioned in section 4.7 the use of isatoic anhydride to inhibit the lactonase
enzyme was attempted. Figure 4.55 shows a typical reaction profile for the
biotransformation of 20 mM 4-methyl cyclohexanone with the addition of 1.5 mM
isatoic anhydride. Isatoic anhydride was found to have a maximum solubility of 1.8
mM under the essentially aqueous biotransformation conditions. No lactone products
could be detected It is apparent however from the low levels of the unknown species
produced, which as mentioned earlier is likely to be 4-methyl cyclohexanol, that the
isatoic anhydride has inhibited the dehydrogenase enzyme. The difference is clearly
illustrated by a comparison to Figure 4.52 where the alcohol reached a concentration of
10 mM. CHMO activity had disappeared after approximately 15 hours which is a large
improvement over the activity in whole cells under similar conditions.
The stability of CHMO was examined using cyclohexanol. Unlike the case of
whole cells no stability was conferred to CHMO by the presence of cyclohexanol. This
is clearly illustrated by Figure 4.56. When homogenate was treated with cyclohexanol
there appeared to be a small increase in CHMO stability although this could be
attributed to the anti-microbial effect of cyclohexanol. The growth of bacteria could be
clearly seen after some 8 hours. While the initial drop in activity is due to the inherent
instability of the protein as the reaction proceeds the effect of contaminating growth
increases.
Once 2-methyl cyclohexanone, a racemic substrate, could be resolved by the GC
column this was used for subsequent biotransformation reactions. Figure 4.57 shows a
typical reaction profile for the biotransformation of 2-methyl cyclohexanone by A.
calcoaceticus homogenate. This reaction required stoichiometric amounts of NADPH
and isatoic anhydride was added. The appearance of alcohol could not be detected,
indicating that the isatoic anhydride effectively inhibited the alcohol dehydrogenase
162
Discussion
back reaction. Due to the expected overmetabolism no lactone products could be
identified. The stereoselectivity of the enzyme can however be measured by the relative
disappearance of the two isomers of the ketone. The kinetic resolution of the isomers is
clearly indicated by the difference in the rates of reaction of the two isomers. The
configuration of the two isomers has not been established thus far.
The enantiomeric excess (e.e.) was calculated as detailed in section 3.9.2. The
e.e. reaches approximately 30 % and this appears to have been maintained throughout
the reaction. This is likely to be a consequence of the low concentration towards the end
of the reaction producing spurious results. The rate of transformation of the most
favoured isomer (believed to be the (S)-ketone, Schwab et al., 1983) can be seen to slow
while that for the less favoured isomer is transformed at essentially the same rate
throughout the reaction. This decrease in the rate of reaction would tend to indicate that
the e.e. should decrease as the concentration of the less favoured isomer increases.
5.7 Biotransformation - E. coli homogenate
The use of E. coli homogenate and 2-methyl cyclohexanone allows the
separation of the two isomers of the lactone for the first time. The enzyme activity for
this reaction was approximately equivalent to that for the A. calcoaceticus homogenate
biotransformation (4.57). There are marked differences however in the profile of the
reactions. In the A. calcoaceticus homogenate reaction, the rate of reaction of the
favoured isomer decreases throughout the reaction whereas that for the E. coli
homogenate maintains essentially the same reaction rate throughout. This led to a more
rapid conversion.
It was expected that the concentration of lactone produced would closely match
the starting concentration of the ketone. Figure 4.59 shows that the combined
concentration of the reactants and products after 350 minutes was approximately 13 mM
from an initial starting concentration of 20 mM. The lactone product was not available
commercially and the response factor was therefore based upon that of capralactone. It
is unlikely however that the difference in response factor could account for discrepancy
in concentration. The discrepancy must therefore be due to either a loss of ketone,
lactone product or the transformation of the ketone to some other species. As discussed
163
Discussion
previously, there is no evidence of instability of the lactone product under the
biotransformation conditions. The ketone substrate is known to be stable under the
reaction conditions and is not subject to significant losses due to evaporation. The most
likely reason for the loss is therefore a competing biotransformation.
As expected the e.e. of the lactone decreases as the yield of lactone produced
increases as would be expected from a kinetic resolution. Up to 50 % completion the
data compares well with that from the A. calcoaceticus homogenate (Figures 4.61 and
4.62). The slowing of reaction rate of the preferred isomer is not observed with the E.
coli homogenate. Likewise the enantiomeric excess continues to rise reaching 60 %
compared to 30 % for the A. calcoaceticus reaction.
The fundamental difference between the two reactions is the lack of lactone
product when A. calcoaceticus is used. This implies that the metabolites of the lactone
are inhibitory to the monooxygenase enzyme.
5.8 Summary
When considering the optimum route for the production of biocatalyst the final
use of the biocatalyst must be considered. The biotransformation system will define
whether the requirement is for whole cells or a crude preparation.
OrganismFermentation
type
DCW
gL '1
Activity
U g 1
Productivity
UL-1
A. calcoaceticus cyclohexanol 3 25 75
glutamate 15 25 375
E. coli batch-no
supplementation
5 50 250
batch 6.5 700 4550
controlled growth 12 400 4800
linear feed 20 120 2400
Table 5.2: Summary of biocatalyst production
164
Discussion
Table 5.2 illustrates very clearly the benefits of the recombinant system when producing
CHMO. The specific activity per g of cells is dramatically increased from 25 to 700
units therefore increasing the productivity per unit volume of fermentation. It must be
noted at this point that the cell concentration achieved during the A. calcoaceticus
fermentation would not be possible on a larger scale without oxygen supplementation of
the sparge gas. The fermentations were allowed to proceed to values of OUR (100
mmole L '1 min'1) that would not be achievable with a larger vessel. The use of E. coli
also reduces the fermentation time from ^ l S h t o ^ l O h which could result in
significant savings in cost when operated at a large scale. The most important
advantage of using the recombinant system is in the stability of the CHMO after
induction. Once the maximum activity has been reached and the inducing cyclohexanol
becomes exhausted the activity is seen to be lost. While this phenomenon can be
reduced by some extent by the continual addition of cyclohexanol the process window is
significantly reduced. As scale is increased this would become more of a significant
problem as the time taken to process large volumes of cells to release the enzyme could
be large. At full scale production, with a vessel capacity of say 1000 L the requirement
for litres of flammable solvent in a process area could cause problems. In E. coli this
phenomenon is not seen and the maximum activity is maintained once achieved.
Table 5.2 also illustrates perhaps surprisingly that the fed batch strategy to
increase the productivity of the E. coli fermentation was not successful. While
controlling the growth rate allowed an increase in dry cell weight that would not have
been achievable with a batch fermentation due to oxygen transfer limitations the
production of CHMO suffered as a result. Increasing the cell density has many
advantages to the biocatalyst production process as a whole; reduced reactor volumes,
reduced effort in upstream and downstream processing, reduced operating costs and
reduced waste water. Despite these factors it is unlikely that a fed batch fermentation
would be economical due to the reduction in productivity.
Many workers have proposed the control of growth rate as a means of increasing
the production of recombinant proteins in E. coli. (Paalme et al.y 1990; Strandberg et
al., 1994). There is often a correlation between growth rate and maximum production
although there is little data available for expression systems that rely on induction by
additional chemicals. The increases in productivity are often attributed to a lack of
165
Discussion
inhibitory by-products that accumulate when cells grow at their maximum growth rates
(Riesenberg et al., 1991) although the use of glycerol as a carbon source does limit this
when compared to glucose. Growing cells at sub maximum rates has also been found to
reduce the likelihood of the cells shedding their plasmid and therefore increasing the
productivity. The plasmid used in this study however has proved to be very stable under
the fermentation procedures used and as such reduced growth rate offers no advantage.
The phenomenon of reduced production with reduced growth rate is not
unknown however. Hellmuth and co-workers (Hellmuth et al., 1994) reported an
optimal growth rate of 0.13 h '1 for their strain of E. coli to produce a recombinant
protein. They report a decline in protein product when the growth rate was lowered to
0.11 h*1 and a 70% loss of production when 0.07 h '1 was used.
When fed batch was attempted at 0.15 h*1 which is approximately a third of the
maximum growth rate on this medium (0.44 h '1) the activity fell from 700 to 400 U g’1
(table 5.2). The overall productivity of the fermentation was increased marginally but
the increase in productivity (due to an almost twofold increase in the dry cell weight)
does not warrant the increased complexity and costs of a fed batch process.
It was possible that the rate of CHMO production could have been slower
because of the reduced growth rate and the maximum activity had not been reached at
the time of harvesting the fermentation. Figures 4.34 and 4.37 show that the activity
had reached a maximum and that the dry cell concentration was still increasing during
this time indicating that there were sufficient nutrients available and the cells were
growing and should have been in a good condition for producing recombinant protein.
When the biomass was further increased without oxygen limitation by linear
feeding the productivity of the fermentation was halved even though the cell
concentration was approaching double that achieved with exponential feeding alone. As
stated previously the data suggesting that sub maximal growth rates increase the
production of recombinant proteins in E. coli has been based on expression systems that
are growth linked (Riesenberg et a l , 1990) and often the productivity passes through a
maximum as a function of growth rate (Riesenberg et al., 1991).
The production of CHMO, in this strain, under the control of a tac promoter
would appear to be dependent on the growth rate at the time of induction. Although a
full range of growth rates have not been tested, to find a growth rate at which production
166
Discussion
of CHMO is at a maximum, the data would tend to suggest that the maximum growth
(0.44 h-1) rate as seen in batch fermentations would produce the greatest activity.
The implication for biocatalyst production cannot be assessed without a detailed
examination of the required use for the biocatalyst. The biotransformation data has
shown that although the recombinant E. coli may be the most useful vector for
producing biocatalyst on a large scale, it must be remembered that the cells produced
were not capable of facilitating the reaction. In this particular case the whole cells o f A.
calcoaceticus were not a suitable biocatalyst because of overmetabolism of the required
product. It is important that each substrate be examined on its own merits. While the
reactants used to demonstrate the reaction in this study were found to be substrates for
the lactonase enzyme it cannot be inferred that this would be true for a potential
substrate for an industrial application.
The need for NADPH in these reactions makes the use of whole cells a more
attractive option as the cost on a large scale would be prohibitive. As has been
demonstrated however there are many problems associated with the use of whole cells.
E. coli, as mentioned previously, is not suitable but there are other potential vectors for
the CHMO gene that may prove to be useful as biocatalyst. Recent work by Stewart et
al. (1998) has demonstrated that yeast may make a successful whole cell catalyst.
The biotransformation of the substrates chosen for this study are representative
of the type of molecule that industry could utilise as chiral synthons. It is desirable to
maximise the productivity of the biotransformation process when considering an
increase in scale. The biotransformations described in this work involve concentrations
of 20 mM (approximately 2 g L '1). The most obvious way of achieving this is to
increase the concentration of the reactants and hence increase the quantity of product
produced per unit volume of reactor volume. The reactants and products have been
found to cause enzyme inhibition at levels approaching 50 mM (Hogan, 1999) and
would therefore not make increasing the productivity a trivial matter.
To overcome this inhibition and increase productivity the substrate would have
to be added at a feed rate similar to the reaction rate and the product would have to be
removed by some form of in situ product removal. The design of an in situ product
167
Discussion
removal process would not be trivial however due to the similarity between the reaction
components.
168
Conclusions and Further Work
6 Conclusions and Further Work
6.1 Conclusion
1 The maximum cell concentration of A. calcoaceticus that was achieved with
cyclohexanol as the sole carbon and energy source was approximately 3 gL'1. This is
unacceptable as viable source of biocatalyst.
2 Monosodium glutamate was found to be a good substrate for production of
biocatalyst from A. calcoaceticus. A concentration of 14 g L '1 dry cells was achieved
from batch fermentation which yielded 20 U g"1 CHMO activity.
3 The successful production of CHMO activity in A. calcoaceticus is dependent on
cyclohexanol being present as a growth substrate from the beginning of the
fermentation. This is most likely due to a long lag in the switch of metabolism.
4 The CHMO activity produced from A. calcoaceticus after induction by addition
of cyclohexanol is rapidly reduced once the cyclohexanol is depleted. This has serious
implications for downstream processing operations if activity is to be maintained.
5 The production of CHMO from recombinant E. coli JM107/pQR210 is closely
associated with the growth rate at the time of induction. The maximum activity after
induction with IPTG was 900 U g '1 when the growth rate was at its maximum for the
defined medium.
169
Conclusions and Further Work
6 JM107/pQR210 required supplementation of the defined medium to maximise
the production of CHMO. Without supplementation the maximum CHMO activity
achieved was 58 U g"1 for a batch fermentation.
7 All forms of the biocatalyst could be stored for many months at -18 °C and be
used as active biocatalysts.
8 E. coli homogenate was the only form of CHMO that proved to be useful
biocatalyst for the production of optically active lactones from the cyclic ketones chosen
for study. Lactone product could not be identified with either form of A. calcoaceticus
and the chemical inhibitor of lactonase enzyme is too toxic for routine use. E. coli
whole cells proved unable to facilitate the reaction due most likely to an inability of the
reactants to pass through the cell wall.
170
Conclusions and Further Work
6.2 Further Work
The recombinant E. coli used in this study required the use of IPTG to induce the
production of CHMO. This form of expression system is not one that could be operated
on an industrial scale due to the vast cost of supplying IPTG. Other expression systems
are available and one that constitutively expressed the protein throughout growth would
be desirable. For ease of downstream processing it would also be advantageous to use
an expression system that secreted the protein into the fermentation medium, removing
the need to for cell disruption and subsequent contamination by other proteins.
Kanamycin would be preferred to ampicillin as the selection pressure applied to
the recombinant E. coli cells. Kanamycin is both more stable during fermentation and
cheaper than ampicillin due to its high efficacy at lower concentrations. Ideally the
fermentation would not require antibiotic at all due to potential for operator sensitivity
and adding to the environmental problems of antibiotic over usage.
Should the enzyme be required for industrial applications the effects of
immobilisation need to be examined. For this to be achieved a procedure for purifying
the protein will be required and the effects of protein purity on immobilisation
investigated. Due to the requirement of a cofactor, the possibility of immobilising the
cofactor or cofactor recycling system alongside the enzyme should be investigated.
E. coli proved to be inadequate as a whole cell catalyst but recent work has
shown that the potential for using other organisms as recombinant whole cell catalysts
exists (Stewart, 1998). The use of a whole cell catalyst for these types of reaction is very
desirable due to the previously mentioned expense and added complication of cofactors
and cofactor recycling. There are numerous micro-organisms that may have potential as
recombinant whole cell catalysts and these should be examined
The use of cofactors such as NADPH is not possible on a large scale due to the
immense cost of such chemicals. Recycle systems are known but tend to require the use
of other expensive chemicals as substrates for the second reaction. Developments in
protein engineering could allow CHMO to be engineered to accept less expensive
cofactors that may be more economically recycled.
171

Conclusions and Further Work
The substrates chosen in this study were found to be substrates for the lactonase
enzyme in A. calcoaceticus. It is possible that many compounds of potential interest
would not be substrates and whole cells could be used as biocatalysts without
degradation of the lactone product. The substrate inhibition problem encountered has
very serious consequences for the operation of a large scale reaction.
As discussed earlier the development of an in situ product removal system could
be vital to the future success of this enzyme as an industrial catalyst.
172
Appendices
7 Appendices
Appendix I
Standard operating procedures were written to insure that the risks of operator
exposure to A. calcoaceticus cells, especially in aerosol form, were reduced to a
minimum. Areas where the greatest operator interaction were identified and procedures
were put into place to cover these aspects of the fermentation and downstream
processing. The following SOP’s cover the inoculation and harvesting of the vessel as
well as procedure to follow in the event of the fermenter failing.
173
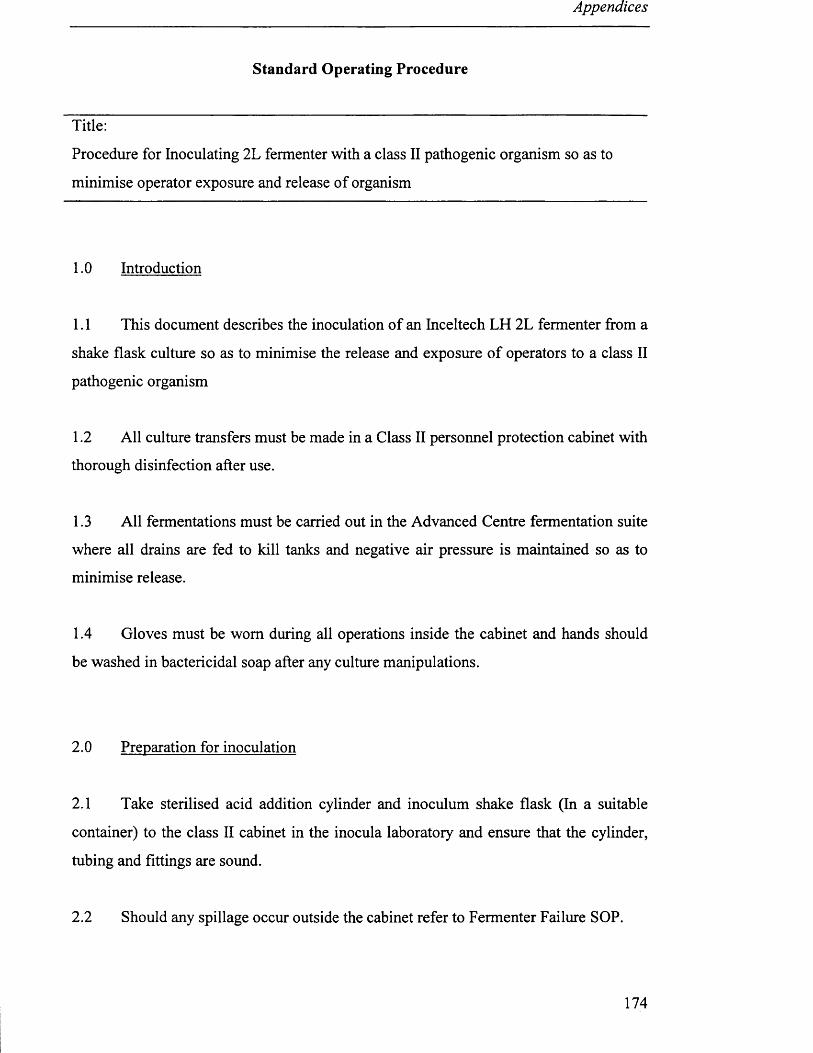
Appendices
Standard Operating Procedure
Title:
Procedure for Inoculating 2L fermenter with a class II pathogenic organism so as to
minimise operator exposure and release of organism
1.0 Introduction
1.1 This document describes the inoculation of an Inceltech LH 2L fermenter from a
shake flask culture so as to minimise the release and exposure of operators to a class II
pathogenic organism
1.2 All culture transfers must be made in a Class II personnel protection cabinet with
thorough disinfection after use.
1.3 All fermentations must be carried out in the Advanced Centre fermentation suite
where all drains are fed to kill tanks and negative air pressure is maintained so as to
minimise release.
1.4 Gloves must be worn during all operations inside the cabinet and hands should
be washed in bactericidal soap after any culture manipulations.
2.0 Preparation for inoculation
2.1 Take sterilised acid addition cylinder and inoculum shake flask (In a suitable
container) to the class II cabinet in the inocula laboratory and ensure that the cylinder,
tubing and fittings are sound.
2.2 Should any spillage occur outside the cabinet refer to Fermenter Failure SOP.
174
Appendices
2.3 Aseptically transfer inoculum from the shake flask to the cylinder taking care to
replace the bungs tightly.
2.4 Should any spillage occur inside the cabinet refer to class II pathogen disinfection
SOP.
2.5 Transfer cylinder to the fermenter in a suitable container.
3.0 Inoculation
3.1 Turn off to air supply to the fermenter to remove any pressure inside the vessel
and connect the cylinder tubing using fittings provided ensuring a firm seal.
3.2 Remove clamp and allow the inoculum to siphon into fermenter by gravity.
3.3 Fill cylinder with acid and replace bung as quickly as possible before restoring
air supply.
3.4 At the end of the fermentation the addition vessels should be chemically
disinfected or autoclaved along with the fermenter vessel.
WRITTEN BY DATE OPERATING HEAD DATE
S. BARCLAY 11.10.96 C. ORSBORN 12.11.96
175
Appendices
Standard Operating Procedure
Title:
Procedure for harvesting 2L fermenter containing a Class II pathogenic organism so as
to minimise operator exposure and organism release
1.0 Introduction
1.1 This document describes the harvesting procedure of an Inceltech 2L fermenter
into centrifuge tubes so as to minimise release and exposure of operators to a class II
pathogenic organism.
1.2 All culture transfers must be made in a Class II personnel protection cabinet with
thorough disinfection after use.
1.3 Gloves must be worn during all operations inside the cabinet and hands should
be washed with bactericidal soap after any culture manipulation.
2.0 Harvesting fermenter
2.1 Disconnect all lines and connections to fermenter making sure to firmly clamp
addition tubes.
2.2 Take the fermenter vessel to the inocula lab (1.6) in a suitable container such as
a stainless steel bucket.
2.3 In case of spillage outside the cabinet refer to Fermenter Failure SOP.
2.4 Fermenter contents can be harvested directly into centrifuge bottles by siphoning
through the harvest port ancillaries.
176
Appendices
2.5 Any spillage inside the cabinet refer to Class II pathogen disinfection SOP.
2.6 All fermenter apertures and ancillary equipment should be firmly closed and
clamped before removal of vessel from cabinet and should be transported to the
autoclave for sterilisation in a suitable container.
3.0 Centrifugation of culture
3.1 The rotor head of the centrifuge should be removed and transported to the Class
II personnel protection cabinet.
3.2 The centrifuge bottles can then be transported to the centrifuge in the sealed
rotor.
3.3 During the centrifugation procedure a sign indicating that biohazardous activities
are taking place should be placed on the door of the laboratory and that only authorised
personnel are permitted entry. The operator must remain in the laboratory throughout
the centrifugation procedure except in the case of a fire alarm or other emergency.
3.4 When centrifugation is complete a check must be made of the bowl for released
culture and the rotor must be transported back to the cabinet before opening in case of
failure of the centrifuge tubes.
3.5 The rotor should be disinfected before replacing in the centrifuge, refer to class
II pathogen disinfection SOP.
3.6 The supernatant and centrifuge tubes should be chemically disinfected (refer to
class II pathogen disinfection SOP).
177
Appendices
3.7 Any further manipulation of the cells should be made in the cabinet and if
samples are to be stored elsewhere they should be transported in sealed bottles within a
suitable container.
WRITTEN BY DATE OPERATING HEAD DATE
S. BARCLAY 11.10.96 C. ORSBORN 12.11.96
178
sipperiuiues
Standard Operating Procedure
Title:
Procedure for disinfection and clean up following Fermenter failure leading to large
scale release
1.0 Introduction
1.1 This document describes the procedure to be followed following the large scale
release of a class II pathogen outside of a Class II personnel protection cabinet.
1.2 This SOP should be used in conjunction with validated experimental data to
show the effectiveness of the chemical sterilant chosen in achieving sterility; in
particular the length of time required for contact of the sterilising agent with the
spillage.
2.0 Large scale disinfection
2.1 A sign indicating biohazardous conditions should be placed near the spill
indicating that personnel should stay clear.
2.2 The operator responsible for the spillage should wear a protective face mask and
gloves before attempting to deal with spillage.
2.3 Any broken glassware should be very carefully placed in a steel bucket and
autoclaved to sterilise.
2.4 The spilled culture should be covered with a suitable sterilising agent such as
Tego® or similar and left for the time necessary to achieve sterility as indicated by
validation experiments.
179
Appendices
2.5 The building manager or person responsible for safety should be informed of the
spillage and the measures taken to deal with it.
2.6 After the specified contact time the spillage and spent culture can be mopped up
and all cloths, paper towels etc. used should be discarded in a contaminated waste bin.
2.7 The spillage area should then be wiped down with a 1% solution of Tego® and
left to dry.
2.8 After autoclaving the broken glassware should be disposed of in a waste glass
bin.
WRITTEN BY DATE OPERATING HEAD DATE
S. BARCLAY 11.10.96 C. ORSBORN 12.11.96
180
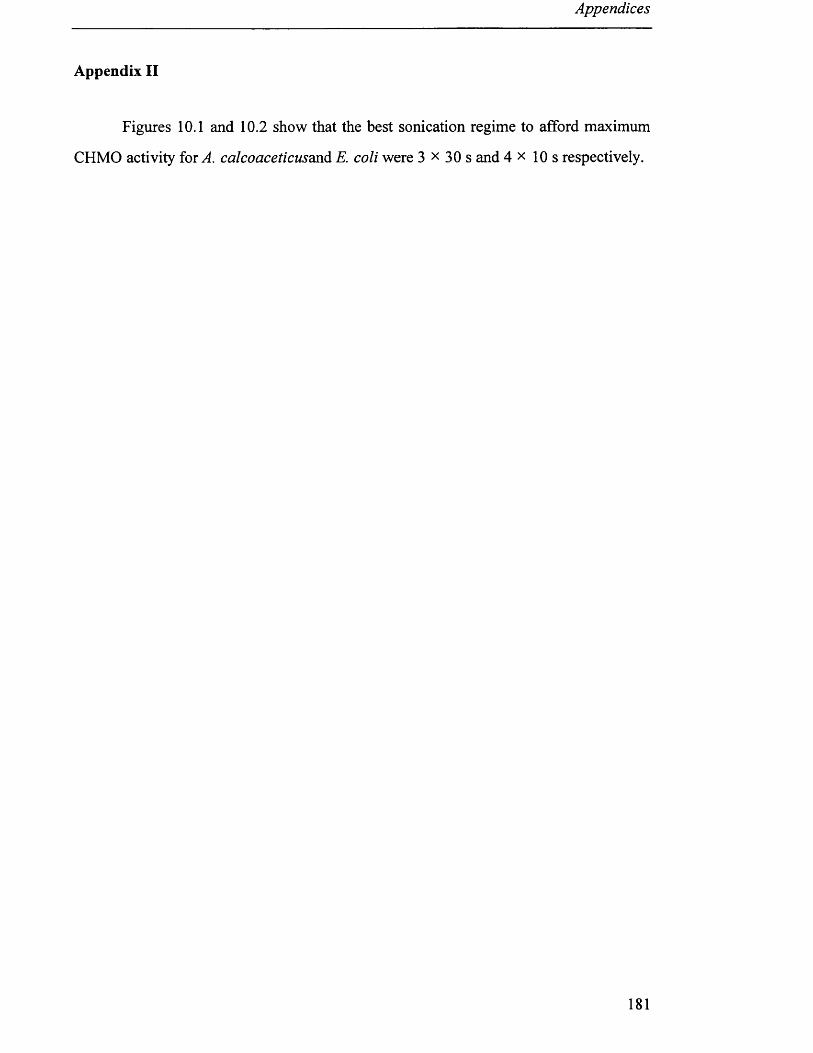
Appendices
Appendix II
Figures 10.1 and 10.2 show that the best sonication regime to afford maximum
CHMO activity for A. calcoaceticusand E. coli were 3 x 30 s and 4 x 10 s respectively.
181
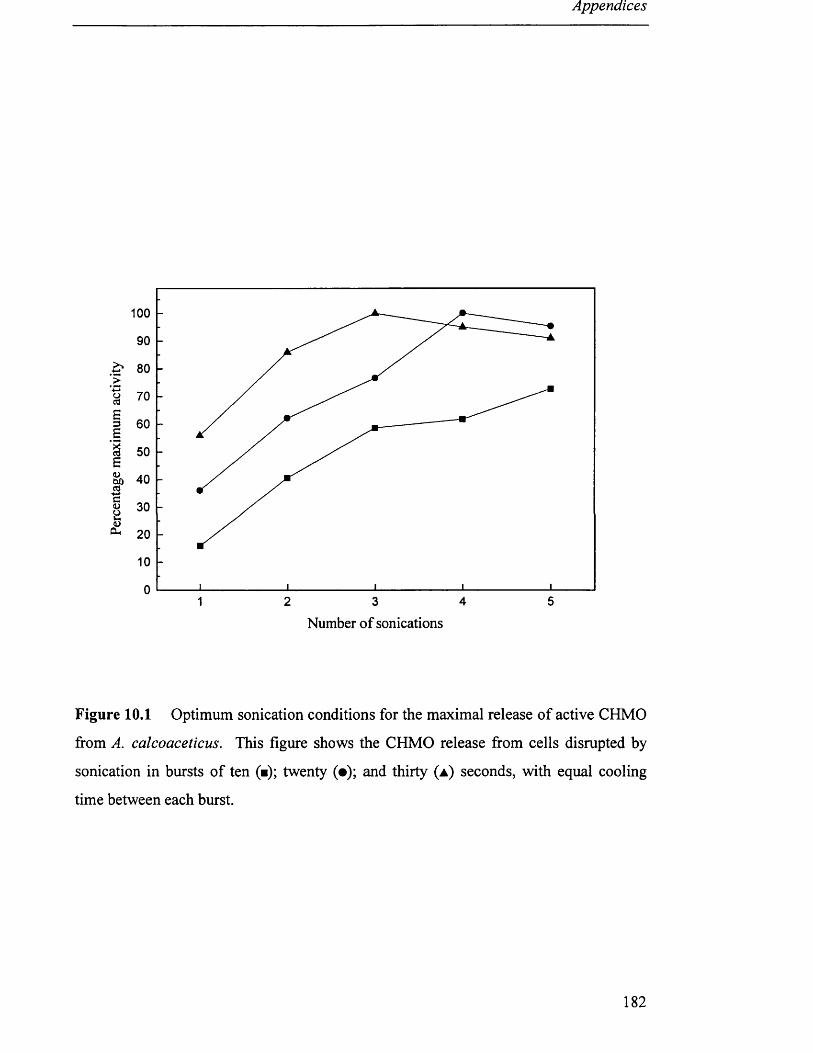
Appendices
100
90
.§■ 80
1 70
I 60B§ 506& 40 &I 30<ocu 20
10
0
Figure 10.1 Optimum sonication conditions for the maximal release of active CHMO
from A. calcoaceticus. This figure shows the CHMO release from cells disrupted by
sonication in bursts of ten (■); twenty (•); and thirty (a ) seconds, with equal cooling
time between each burst.
51 2 3 4
Number of sonications
182
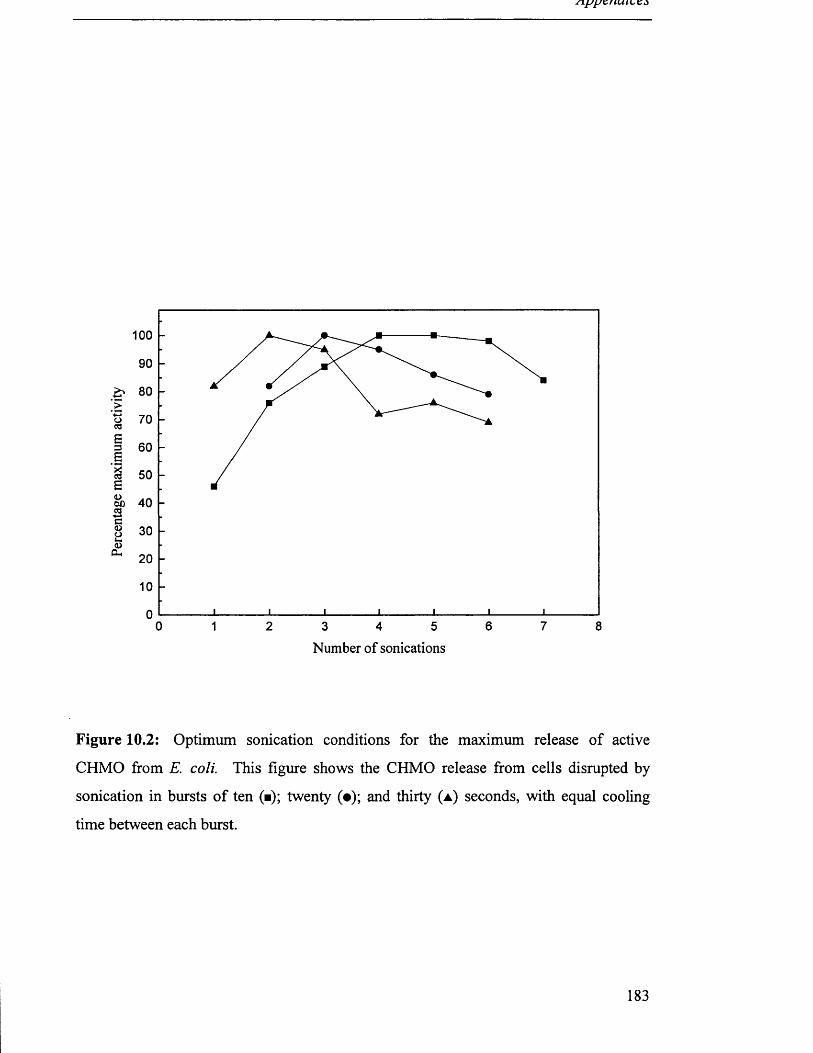
100
90
£» 80
1 70
a 60 BI 50 SSo 40 c§ 30
10
00 1 2 3 4 5 6 7 8
Number of sonications
j _ _ _ _ _ _ _ _ _ _ _ _ i_ _ _ _ _ _ _ _ _ _ _ _ i_ _ _ _ _ _ _ _ _ _ _ _ i_ _ _ _ _ _ _ _ _ _ _ _ i_ _ _ _ _ _ _ _ _ _ _ _ i_ _ _ _ _ _ _ _ _ _ _ _ L
Figure 10.2: Optimum sonication conditions for the maximum release of active
CHMO from E. coll This figure shows the CHMO release from cells disrupted by
sonication in bursts of ten (■); twenty (•); and thirty (a ) seconds, with equal cooling
time between each burst.
183
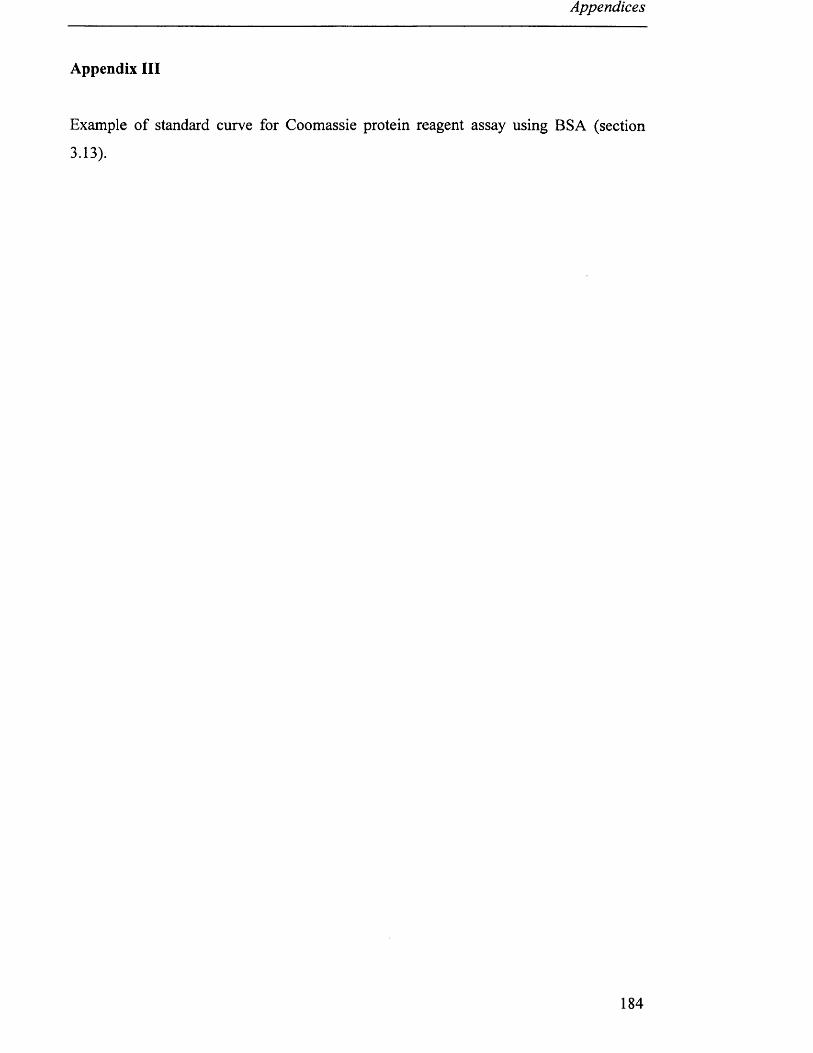
Appendices
Appendix III
Example of standard curve for Coomassie protein reagent assay using BSA (section
3.13).
184
Abs
orba
nce
(595
nm)
Appendices
0.8
0.6
0. 4
0.2
0.01.00.6 0.80.0 0.2 0. 4
Concentration (mg mL"1)
185
i x c j i z r c
8 References
Abril,O., Ryerson,C.C., Walsh,C. and Whitesides,G.M., 1989, Enzymatic Baeyer-
Villiger type oxidations of ketones catalyzed by cyclohexanone oxygenase, Bioorganic
Chemistry, 17,41-52
Adger,B., Bes,M.T., Grogan,G., McCague,R., Pedragosa-Moreau,S.,
Roberts,S.M.,Villa,R.,Wan,P.W.H. and Willetts,A.J., 1995, Application of Enzymic
Baeyer-Villiger oxidations of 2-substituted cycloalkanones to the total synthesis of (R)-
(+)-Lipoic acid, Journal of the Chemical Society: Chemical Communications, 1563-
1564.
Alphand,V., Archelas,A. and Furstoss,R., 1989, Microbial Transformations 16: One
stop synthesis of a pivotal prostaglandin chiral synthon via a highly enantioselective
microbiological Baeyer-Villiger type reaction, Tetrahedron Letters, 30, 3663-3664.
Alphand,V., Archelas,A. and Furstoss,R., 1990, Microbial Transformations 13: A
direct synthesis of both S and R enantiomers of 5-hexadecanolide via an
enantioselective microbiological Baeyer-Villiger reaction, Journal of Organic
Chemistry, 55, 347-350.
Alphand,V., Archelas,A. and Furstoss,R., 1990, Microbiological transformations 15:
The enantioselective microbiological Baeyer-Villiger oxidation of alpha substituted
cycolpentanones, Biocatalysis, 3, 73-83.
Alphand,V. and Furstoss,R., 1992, Microbial transformations 23: A surprising
regioselectivity of microbiological Baeyer-Villiger oxidations of menthone and
dihydrocarvone, Tetrahedron: Asymmetry, 3, 379-382.
Amann,E., Brosius,J. and Ptashne,M., 1983, Vectors bearing a hybrid trp-lac promoter
useful for regulated expression of cloned genes in Escherichia coli, Gene, 25, 167-178.
186
a ejerences
Atkinson,B. and Mavituna,F., in Biochemical Engineering and Biotechnology
Handbook, 1983, Macmillan, Surrey, UK, p i20.
Baeyer,A. and Villiger,V., 1899, Berlin Deutsche Chemie., 32, 3625.
Bhattacharya,S.K. and Dubey,A.K., 1997, Effects of dissolved oxygen and oxygen mass
transfer on overexpression of target gene in recombinant E. coli, Enzyme and Microbial
Technology, 20, 355-360.
Bolm,C., Schlinglhoff,G. and Weickhardt,K., 1994, Optically active lactones from a
Baeyer-Villiger-type metal-catalysed oxidation with molecular oxygen, Angewandte
Chemie-Intemational Edition, 33, 1848-1849.
Bradshaw,W., Conrad,H.,Corey,E. and Gunsalus,I., 1959, Microbiological degradation
of (+)-camphor, Journal of the American Chemical Society, 81, 5507.
Branchaud,B.P. and Walsh,C.T., 1985, Functional group diversity in enzymatic
oxygenation reactions catalyzed by bacterial flavin-containing cyclohexanone
oxygenase, Journal of the American Chemical Society, 107, 2153-2161.
Camell,A.J., Roberts,S.M., Sik,V. and Willetts,A.J., 1990, Enzyme-catalysed Baeyer-
Villiger oxidations of some substituted bicyclo[3.2.0]heptanones, Journal of the
Chemical Society: Chemical Communications, 20, 1438-1439.
Camell,A.J., Roberts,S.M., Sik,V. and Willetts,A.J., 1991, Microbial oxidation of
7endo-methylbicyclo[3.2.0]hept-2-en-6-one, 7,7-dimethylbicyclo[3.2.0]hept-2-en-6-one
and 2-exo-bromo-3-endo-hydroxy-7,7-dimethylbicyclo[3.2.0]heptan-6-one using A.
calcoaceticus NCIMB9871, Journal of the Chemical Society: Perkin Transactions, 1,
2385-2389.
187
isejerences
Camell,A. and Willetts,A., 1990, Biotransformation of cycloalkenones by fungi:
Baeyer-Villiger oxidation of bicycloheptanone by dematiaceous fungi, Biotechnology
Letters, 12, 885-890.
Camell,A. and Willetts,A., 1992, Biotransformations by fungi: Regio- plus
stereoselective Baeyer-Villiger oxidations by dematiaceous fungi, Biotechnology
Letters, 14, 17-21.
Carrea,G., Redigolo,B., Riva,S.,Colonna,S., Gaggero,N., Battistel,E. and Bianchi,D.,
1992, Effects of substrate structure on the enantioselectivity and stereochemical course
of sulfoxidation catalysed by cyclohexanone monooxygenase, Tetrahedron:
Asymmetry, 3, 1063-1068.
Chapman,P.J. and Duggleby,R.G., 1967, Dicarboxylic acid catabolism by bacteria,
Biochemical Journal, 103, 7.
Criegee,R., 1948, Liebigs Ann. Chem., 560,127.
Davies,H.G., Green,R.H., Kelly,D.R. and Roberts,S.M., 1990, Recent advances in the
generation of chiral intermediates using enzymes, Critical Reviews in Biotechnology,
10, 129-153.
De Boer,H.A., Comstock,L.J. and Vasser,M.,1983, The tac promoter: A functional
hydrid derived from the trp and lac promoters, Proceedings of the National Academy for
Science, USA, 80, 21-25.
Donoghue,N.A. and Trudgill,P.W., 1975, The metabolism of cyclohexanol by A.
Calcoaceticus NCIB 9871, European Journal of Biochemistry, 60, 1-7.
Donoghue,N.A., Norris,D.B. and Trudgill, P.W., 1976, The purification and properties
of cyclohexanone oxygenase from Nocardia globerula CL1 and A. calcoaceticus
NCIMB 9871, European Journal of Biochemistry, 63, 175-192.
188
nejerences
Faber,K., 1992, Biotransformations in Organic chemistry, Springer-Verlag, New York,
1-21, 189-194.
Gagnon,R., Grogan,G.,Levitt,M.S., Roberts,S.M., Wan,P.W.H. and Willetts,A.J., 1994,
Biological Baeyer-Villiger oxidation of some monocyclic and bicyclic ketones using
monooxygenases from A. calcoaceticus NCIMB 9871 and Pseudomonas putida NCIMB
10007, Journal of the Chemical Society: Perkin Transactions, 1, 2537-2543.
Georgiou,G., Shuler,M.L. and Wilson,D.B., 1988, Release of periplasmic enzymes and
other physiological effects of p-lactamase overproduction in Escherichia coli,
Biotechnology and Bioengineering, 32, 741-748.
Gregory,M.E. and Turner,C., 1993, Open-loop control of specific growth rate in fed-
batch cultures of recombinant Escherichia coli, Biotechnology Letters, 7, 889-894.
Griffin,M. and Trudgill,P.W., 1972, The metabolism of cyclopentanol by Pseudomonas
NCIB 9872, Journal of Biochemistry, 129, 595-603.
Grogan,G., Roberts,S. and Willetts,A., 1992, Biotransformation by microbial Baeyer-
Villiger monooxygenases: Stereoselective lactone formation in vitro by coupled
enzyme systems, Biotechnology Letters, 14, 1125-1130.
Grogan,G., Roberts,S., Wan,P. and Willetts,A., 1993, Camphor grown Pseudomonas
putida, a multifunctional biocatalyst for undertaking Baeyer-Villiger monooxygenase-
dependent biotransformations, Biotechnology Letters, 15, 913-918.
Hanna,M.H., 1987, in Bungay,H.R. and Belfort,G. eds., Advanced Biochemical
Engineering, John Wiley and Sons Inc, New York, 103-167.
Hellmuth,K., Korz,D. J., Sanders,E. A. and Deckwer,W., D., 1994, Effect of growth rate
on stability and gene expression of recombinant plasmids during continuous and high
cell density cultivation of E. coli TGI, Journal of Biotechnology, 32, 289-298.
189
Hobbs,G.R., Mitra,R.K., Chauhan,R.P., Woodley,J.M. and Lilly,M.D., 1996, Enzyme-
catalysed carbon-carbon bond formation: Large scale production of Escherichia coli
transketolase, Journal of Biotechnology, 45,173-179.
Hogan,M., 1999, PhD thesis, Department of Biochemical Engineering, University
College London, UK.
Itagaki,E., 1986, Studies on steroid monooxygenase from Cylindrocarpon radicicola
ATCC 11011. Purification and characterization, Journal of Biochemistry, 99, 815-824.
Jones,J.B., 1986, Enzymes in organic synthesis, Tetrahedron, 42, 3351-3403.
Jones,K.H., Smith,R.T. and Trudgill,P.W., 1993, Diketocamphane enantiomer-specific
Baeyer-Villiger monooxygenases from camphor grown Pseudomonas putida
ATCC17453, Journal of General Microbiology, 139, 797-805.
Jones,R.,1993, PhD thesis, Department of Chemical and Biochemical Engineering,
University College London, UK.
Konigsberger,K., Braunegg,G., Faber,K. and Griengl,H., 1990, Baeyer-Villiger
oxidation of bicyclic ketones by Cylindrocarpon destructans ATCC 11011,
Biotechnology Letters, 12, 509-514.
Krow,G.R., 1981, Oxygen insertion reactions of bridged bicyclic ketones, Tetrahedron,
37, 2697-2724.
Latham,J.A. and Walsh,C., 1987, Mechanism based inactivation of the flavoenzyme
cyclohexanone oxygenase during oxygenation of cyclic thiol ester substrates, Journal of
the American Chemical Society, 109, 3421-3427.
190
Lautrop,H., 1974, Genus IV. Acinetobacter, in Bachman,R.E. and Gibbons,N.E. eds,
Bergey's manual of determinative bacteriology, Williams and Wilkins, New York, 436-
438.
Lee, S.Y., 1996, High cell-density culture of Escherichia coli, Topics in Biotechnology,
14, 98-105.
Lenn,M.J. and Knowles,C.J., 1994, Production of optically active lactones using
cycloalkanone oxygenases, Enzyme and Microbiology Technology, 16, 964-969.
Levitt,M., Sandey,H. and Willetts,A., 1990, Regiospecific biotransformation of
substituted norbanones by microorganisms, Biotechnology Letters, 12, 197-200.
Lilly,M.D., 1977, A comparison of cells and enzymes as industrial catalysts, in
Bohak,Z. and Sharon,N. eds., Biotechnological approaches, Academic Press Inc, New
York, 127-139.
Luli,G.W. and Strohl,W.R., 1990, Comparison of growth, acetate production and acetate
inhibition of Escherichia coli strains in batch and fed batch fermentations, Applied and
Environmental Microbiology, 56, 1004-1009.
Magor,A.M., Warburton,J., Trower,M.K. and Griffin,M., 1986, Comparative study of
the ability of 3 Xanthobacter species to metabolize cycloalkanes, Applied and
Environmental Microbiology, 52, 665-671.
Ohta,H., Iwabuchi,T. and Tsuchihashi,G., 1986, Stereoselective oxidation of p-methyl-
sec-alcohols and a-methylketones by Corynebacterium equi IFO 3730, Agricultural
Biological Chemistry, 50, 725-731.
Ottolina,G., Pasta,P., Carrea,G., Colonna,S.,Dallavalle,S. and Holland,H.L., 1995, A
predictive active site model for the cyclohexanone monooxygenase catalyzed oxidation
of sulfides to chiral sulfoxides, Tetrahedron: Asymmetry, 6, 1375-1386.
191
Ouazzani-Chahdi,J., Buisson,D. and Azerad,R., 1987, Preparation of both enantiomers
of a chiral lactone through combined microbiological reduction and oxidation,
Tetrahedron Letters, 28, 1109-1112.
Ougham,H.J., Taylor,D.G. and Trudgill,P.W., 1983, Camphor revisited: Involvement
of a unique monooxygenase in metabolism of 2-oxo-A3-4,5,5-
trimethylcyclopentenylacetic acid by Pseudomonas putida, Journal of Bacteriology, 153,
140-152.
Paalme,T., Tiisma,K., Kahru,A., Vanatalu,K. and Vilu,R., 1990, Glucose-limited fed-
batch cultivation of Escherichia coli with computer-controlled fixed growth rate,
Biotechnology and Bioengineering, 35, 312-319.
Pan,J.G., Rhee,J.S. and Lebeault,J.M., 1987, Physiological constraints in increasing
biomass concentration of Escherichia coli B in fed batch culture, Biotechnology Letters,
9, 89-94.
Pasta,P., Carrea,G., Holland,H.L. and Dallavalle,S., 1995, Synthesis of chiral benzyl
alkyl sulfoxides by cyclohexanone monooxygenase from A. calcoaceticus NCIMB
9871, Tetrahedron: Asymmetry, 6, 933-936.
Prentis,S., 1984, Biotechnology. A new industrial revolution, Orbis Publishing Ltd,
London, 36-62
Riesenberg,D., Schulz,V., Knorre,W.A., Pohl,H.D., Kortz,D., Sanders,E.A., Rob,A. and
Deckwer, W.D., 1991, High cell density cultivation of Escherichia coli at controlled
specific growth rate, Journal of Biotechnology, 20, 17-28.
Riesenberg,D., Menzel,K., Schulz,V., Schumann,K., Veith,G., Zuber,G. and
Knorre,W,A., 1990, High cell density fermentation of recombinant Escherichia coli
expressing human interferon alpha 1, Applied Microbiology and Biotechnology, 34, 77-
82.
192
Roberts,S.M. and Turner,N.J., 1992, Some recent developments in the use of enzyme
catalysed reactions in organic synthesis, Journal of Biotechnology, 22, 227-244.
Roberts,S.M. and Willetts,A., 1993, Development of the enzyme catalysed Baeyer-
Villiger reaction as a useful technique in organic synthesis, Chirality, 5, 334-337.
Ryerson,C.C., Ballou,D.P. and Walsh,C., 1982, Mechanistic studies on cyclohexanone
oxygenase, Biochemistry, 21, 2644-2655.
Sandey,H. and Willetts, A., 1989, Biotransformation of cycloalkanones by
microorganisms, Biotechnology Letters, 2, 615-620.
Sandey,H., 1991, Biotransformations of bicyclic ketones to lactones by microorganisms,
PhD thesis, Faculty of Science, University of Exeter.
Sandey,H. and Willetts,A., 1992, Biotransformation of cycloalkanones: controlled
oxidative and reductive bioconversions by an Acinetobacter species, Biotechnology
Letters, 14, 1119-1125.
Schwab,J.M., Li,W. and Thomas,L.P., 1983, Cyclohexanone oxygenase:
Stereochemistry, enantioselectivity, and regioselectivity of an enzyme-catalyzed Baeyer-
Villiger reaction, Journal of the American Chemical Society, 105, 4800-4808
Secundo,F., Carrea,G., Dallavalle,S. and Franzosi,G., 1993, Asymmetric oxidation of
sulfides by cyclohexanone monooxygenase, Tetrahedron: Asymmetry, 4, 1981-1982.
Shipston,N.F, Lenn,M.J. and Knowles,C.J., 1992, Enantioselective whole cell and
isolated enzyme catalysed Baeyer-Villiger oxidation of bicyclo[3.2.0]hept-2-en-6-one,
Journal of Microbiological Methods, 15, 41-52.
193
Stewart,J.D., Reed,K.W., Martinez,C. A., Zhu,J., Chen,G. and Kayser,M.M., 1998,
Recombinant Baker’s yeast as a whole cell catalyst for asymmetric Baeyer-Villiger
oxidations, Journal of the American Chemical Society, 120, 3541-3548.
Strandberg,L., Andersson,L. and Enfors,S., 1994, The use of fed batch cultivation for
achieving high cell densities in the production of a recombinant protein in Escherichia
coli, FEMS Microbiology Reviews, 14, 53-56.
Suzuki,M., Takeda,H. and Nayori.R., 1982, Bis(trimethylsilyl) peroxide for the Baeyer-
Villiger type oxidation, Journal of Organic Chemistry, 47, 902-904.
Taschner,M.J. and Black,D.J., 1988, The enzymatic Baeyer-Villiger oxidation:
Enantioselective synthesis of lactones from mesomeric cyclohexanones, Journal of the
American Chemical Society, 110, 6892-6893.
Taschner,M.J. and Peddada,L., 1992, The enzymatic Baeyer-Villiger oxidation of a
series of bicyclo[2.2.1]hept-2-en-7-ones, Journal of the Chemical Society-Chemical
Communications, 19, 1384-1385.
Taschner,M.J., Peddada,L., Cyr,P., Chen,Q.Z. and Black,D.J.,1992, in Microbial
reagents in organic synthesis, S.Servi Ed., Kluwer Academic Publisher, Dordrecht, 347.
Taschner,M.J., Black,D.J. and Chen,Q., 1993, The enzymatic Baeyer-Villiger
oxidation: A study of 4-substituted cyclohexanones, Tetrahedron-Asymmetry, 4, 1387-
1390.
Taylor,D. and Trudgill,P., 1986, Camphor revisited: Studies of 2,5-diketocamphane-l,2-
monooxygense from Pseudomonas putida ATCC 17453, Journal of Bacteriology, 165,
2, 489-497.
Trudgill,P.W., 1990, Cyclohexanone 1,2-monooxygense from A calcoaceticus NCIMB
9871, Methods in Enzymology, 188, 70-77.
194
Willetts,A.J., Knowles,C.J., Levitt,M.S., Roberts,S.M., Sandey,H. and Shipston,N.F.,
1991, Biotransformation of endo-bicyclo[2.2.1]heptan-2-ols and endo-
bicyclo[3.2.0]hept-2-en-6-ol into the corresponding lactones, Journal of the Chemical
Society: Perkin Transactions, 1, 1608-1610.
Wright,M., Knowles,C., Petit,F. and Furstoss,R., 1994, Enantioselective inhibition
studies of the cyclohexanone monooxygenase from Acinetobacter sp. NCIMB 9871,
Biotechnology Letters, 16, 1287-1292.
Wright,M.A., Taylor,I.A., Lenn,M.J., Kelly,D.R., Mahdi,J.G. and Knowles,C.J., 1994,
Baeyer-Villiger monooxygenases from moicroorganisms, FEMS Microbiology Letters,
116, 67-72.
Yoon, S.K. and Kang, W.K., 1994, Fed-batch operation of recombinant Escherichia coli
containing trp promoter with controlled specific growth rate, Biotechnology and
Bioengineering, 43, 995-999.
195