Embed Size (px)
Citation preview
lable at ScienceDirect
International Journal of Industrial Ergonomics 39 (2009) 771–782
Contents lists avai
International Journal of Industrial Ergonomics
journal homepage: www.elsevier .com/locate/ergon
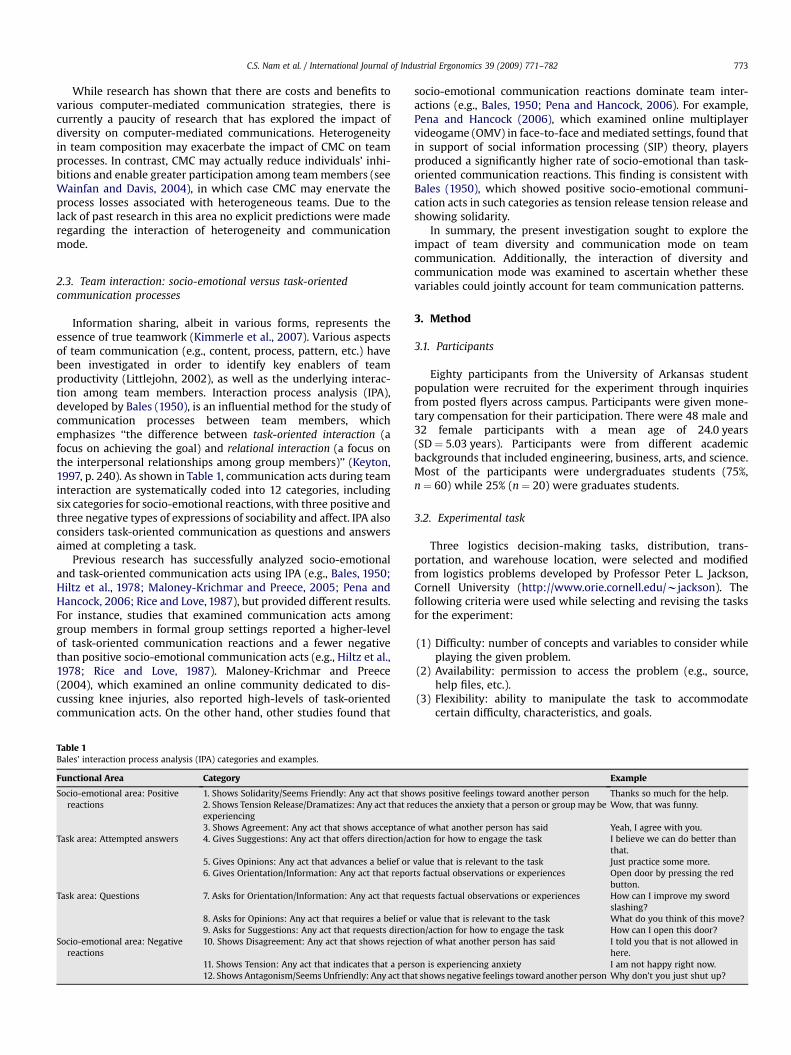
The process of team communication in multi-cultural contexts: An empiricalstudy using Bales’ interaction process analysis (IPA)
Chang S. Nam a,*, Joseph B. Lyons b, Ha-Sung Hwang c, Sukwon Kim d
a Department of Industrial Engineering, University of Arkansas, 4207 Bell Engineering Center, Fayetteville, AR 72701, USAb Air Force Research Laboratory/Logistics Readiness Branch (AFRL/HEAL), 2698 G Street, BLDG 190, Wright Patterson AFB, OH 45433-7604, USAc Department of Communication, Dongguk University, Seoul 100-715, Koread Department of Industrial Engineering and Technology, Texas A&M University-Commerce, P.O. Box 3011, Commerce, TX 75429, USA
a r t i c l e i n f o
Article history:Received 31 March 2008Received in revised form6 February 2009Accepted 14 March 2009Available online 16 April 2009
Keywords:Team communicationBales’ interaction process analysis (IPA)Cultural ergonomicsTeam decision-making
* Corresponding author. Tel.: þ1 479 575 2563; faxE-mail address: [email protected] (C.S. Nam).
0169-8141/$ – see front matter � 2009 Elsevier B.V.doi:10.1016/j.ergon.2009.03.004
a b s t r a c t
The main goal of the present study was to empirically investigate the manner in which cultural diversityand communication mode affect team communication process. Two independent variables weremanipulated in the study: (1) cultural diversity (homogeneous versus heterogeneous); and (2)communication mode (face-to-face versus computer-mediated communication). Team members’communication exchanges were measured by using Bales’ interaction process analysis (IPA) that dividesthe function (as opposed to the topical content) of communication during group discussion into eithertask-related or socio-emotional contributions at two-levels: communication profile and functional area.Results of this study indicated homogeneous teams used more showing agreement, giving opinions, andshowing tension communication patterns compared to heterogeneous teams. Additionally, whenconsidering the higher-level functional areas, teams using face-to-face (FTF) communication strategieswere characterized by greater positive socio-emotional communication, more attempted answers, morequestions, and more frequent negative socio-emotional communications. The results of the present studyalso suggested that the impact of communication mode on team communication varies by the level ofdiversity within the team. The outcomes of this research should have a broad impact on the managementof a multi-cultural team, a task-oriented team consisting of people with different national cultures.Relevance to industry: Results of the present study should provide valuable insights into the ways inwhich cultural diversity and communication mode influence the communication mechanisms whichtake place among members during team interaction.
� 2009 Elsevier B.V. All rights reserved.
1. Introduction
Much of the work in organizations today is completed throughteam-based work structures, aimed at facilitating team memberinteractions in an effort to promote successful task completion(Cannon-Bowers et al., 1993), which has proved to increaseproductivity and expertise as well as minimize workloads forindividuals (Marks et al., 2001; O’Connora et al., 2008). The realityis, however, that many teams tend to fail for any number of reasons(Hackman, 1998). Recent changes in work force cultural composi-tion have also resulted in a practical concern with the managementof the multi-cultural team, a task-oriented team consisting ofpeople with different cultures and nationalities (Marquardt andHorvath, 2001). With increased globalization, diversity in the
: þ1 479 575 8431.
All rights reserved.
national background and culture of a team is common in today’sorganizations. These teams are usually made up of members fromdifferent national backgrounds, who possibly speak differentlanguages and were raised in different countries that may havedifferent value systems. Thus it is of importance that today’sorganizations understand the possible impacts of diversity on teameffectiveness.
Several theories and models have been proposed to explain theeffectiveness of team decision-making, but many aspects of teamdecision-making in multi-cultural contexts still remain unclear. Inparticular, there is still a lack of empirical evidence on factors thatmay facilitate or hinder the effectiveness of multi-cultural teaminteraction process (McLeod et al., 1996; Watson et al., 1993), aswell as characteristics of the underlying interaction process in teamdecision-making (Beck and Fisch, 2000). Because a team’s outcomein a problem solving context depends largely on the nature of theinteraction of the team, communication and its processes areimportant to study in small group settings, which in turn provides
C.S. Nam et al. / International Journal of Industrial Ergonomics 39 (2009) 771–782772
the essence of team productivity (Levi and Slem, 1995; Littlejohn,2002; May and Carter, 2001). Therefore, empirical evidence oncommunication acts and reactions such as verbal or non-verbalmessage (e.g., gestural, expressive, etc.), which take place amongmembers during team interaction, is critical for the growth anddevelopment of decision-making teams (Keyton, 1997; Oetzel,2001), and can provide valuable information about the interactionand performance of the teams (Frey, 1995).
The primary goal of this study was to systematically investigatethe process and outcome of team communication in multi-culturalcontexts. More specifically, an empirical experiment was conductedto quantify the manner in which cultural diversity and communi-cation mode affect team communication process. For this purpose,we have used Bales’ interaction process analysis (IPA, Bales, 1985;Bales and Cohen, 1979), a popular methodology for coding ‘‘thefunction (as opposed to the topical content) of communicationduring group discussion’’ (Keyton, 1997, p. 240). IPA has been usedby a number of small group communication studies as a ‘‘unifiedand well-developed theory of small group interaction’’ (Littlejohn,2002, p. 301) and an effective method to observe team interactiondirectly (McGrath, 1984). In the first part of this study, we give anoverview of how factors such as the cultural diversity andcommunication mode may facilitate or hinder the effectiveness ofteam decision-making. We also focus on IPA, an influential methodfor the study of team communication process between members,such as socio-emotional and task-oriented processes. In the secondpart, we describe how the empirical study was conducted toobserve team interaction and investigate characteristics of teamcommunication process. The study concludes with a discussion ofthe implications of this work for our understanding of teamcommunication processes in multi-cultural contexts.
2. Background
2.1. Cultural diversity and team effectiveness
Cultural differences play very important roles in cooperativework and team decision-making in that team members’ culturalbackground may significantly influence the ways of using infor-mation necessary to make decisions (Triandis, 1994), as well ascommunicating with each other (Kirkman et al., 2001). Culture isdefined as a unique combination of rituals, religious beliefs, ways ofthinking, and ways of behaving that unify a group of people(Pearson et al., 2000). What is interesting to note about this defi-nition, specifically regarding thinking and behavior, is the possi-bility of what happens when different cultures are mixed together.What is the process of communication that determines whichbehavior or way of thinking emerges when different culturescollide in a group context?
Although it is well documented that the team’s composition –cultural diversity – can affect its dynamics and performance,researchers have often reported conflicting findings. For instance,diverse groups have been shown to outperform homogenousgroups (e.g., Bantel, 1994; Daily et al., 1997; Hoffman, 1978; Jackson,1992; Ruhe and Eatman, 1977; Watson et al., 1993). For example,Bantel (1994) found that diversity can improve group performanceby providing group members with a wider range of perspectivesand a broader skills base. Daily et al. (1997) also reported thata higher percent of multi-cultural team members with differentnational background responded more favorably for using a groupdecision support system (GDSS) in some aspects of team decision-making, such as discussion of issues and expressing ideas. On theother hand, studies have demonstrated that homogenous groupsavoid the process loss associated with poor communicationmembers and excessive conflict that often plague diverse groups
(e.g., Ancona and Caldwell, 1992; Loden and Rosener, 1991; Millikenand Martins, 1996; Staples and Zhao, 2006). Staples and Zhao(2006) found that heterogeneous teams were less satisfied andcohesive and had more conflict than the homogeneous teams,although there were no statistical differences in team performancelevel. There was a negative relationship between diversity andperformance, meaning that group performance increased asdiversity decreased (Harrison et al., 1998). Negative aspects of teamdiversity include communication difficulties, misunderstandings,decreased cohesion and increased conflict. These losses may resultin decreased performance and satisfaction (Hambrick et al., 1998;Lau and Murninghan, 1998). Finally, other studies suggested a nullrelationship that diversity has no relationship with group perfor-mance (Smith et al., 1994). For example, (Williams and O’Reilly’s,1998) review of 40 years of diversity research concluded that thereare no consistent main effects of diversity on organizationalperformance. However, when considering process variables, teamdiversity has been shown to have a negative impact on teamcohesiveness (Jackson, 1992; Kozlowski and Bell, 2003). Conse-quently, it is likely that homogeneous teams will exhibit greaterlevels of socially-oriented communication compared to heteroge-neous teams.
2.2. Communication mode in organizations
As national and local computer networks proliferate, computer-mediated communication (CMC) has become an integral compo-nent of organizational communication (Straus and McGrath, 1994),which has spanned spatial and temporal distances in the groupcommunication environment (Kiesler et al., 1984; Kiesler andSproull, 1992). CMC is regarded as a communication mode that isa potentially fast and efficient means of communication, but it isalso criticized as an inefficient communication method because ofthe lack of non-verbal communication cues and the impersonalityof the computer system (Sproull and Kiesler, 1986). According tosocial presence theory, for example, computer-mediated interac-tion is extremely low in the feeling of ‘being together’ in compar-ison with face-to-face interaction because of its ‘‘paucity of non-verbal and back-channeling cues’’ (Walther, 1992, p. 54). Previousresearch shows that CMC can be used for complex communication.The results of problem solving and decision-making with CMCsystems turned out to be qualitatively equal to face-to-facecommunication, but it took more time and was much harder toreach a state of mutual agreement (Adrianson and Hjelmquist,1999). Often, CMC groups do not finish the same tasks in the samelimited time as face-to-face groups (e.g., Hiltz et al., 1986; Hol-lingshead et al., 1993). A General finding in the empirical CMCstudies is that groups are more effective in divergent thinking taskswhen communicating electronically rather than face-to-face,especially if the communication is done anonymously. Resolvingconflict, or reaching agreement, however, is better done face-to-face than electronically (Gallupe et al., 1988; Watson et al., 1988;Valacich and Schwenk, 1995). In other words, CMC may facilitateinformation sharing but can make consensus formation moredifficult in time limited contexts. George et al. (1990) explain thatface-to-face groups can more readily reach understanding andsense-making of information than CMC groups. This implies thatcertain organizational tasks, or types of work, may be more effec-tive when performed in CMC mode than others; in particular,exchanges involving knowledge elicitation or sharing may morereadily lend themselves to the virtual mode than those involvingconsensus formation or conflict resolution. Given the partial loss ofnon-verbal cues and other implicit information, is likely that teamsusing CMC will evidence greater task-oriented communicationcompared to face-to-face teams.
C.S. Nam et al. / International Journal of Industrial Ergonomics 39 (2009) 771–782 773
While research has shown that there are costs and benefits tovarious computer-mediated communication strategies, there iscurrently a paucity of research that has explored the impact ofdiversity on computer-mediated communications. Heterogeneityin team composition may exacerbate the impact of CMC on teamprocesses. In contrast, CMC may actually reduce individuals’ inhi-bitions and enable greater participation among team members (seeWainfan and Davis, 2004), in which case CMC may enervate theprocess losses associated with heterogeneous teams. Due to thelack of past research in this area no explicit predictions were maderegarding the interaction of heterogeneity and communicationmode.
2.3. Team interaction: socio-emotional versus task-orientedcommunication processes
Information sharing, albeit in various forms, represents theessence of true teamwork (Kimmerle et al., 2007). Various aspectsof team communication (e.g., content, process, pattern, etc.) havebeen investigated in order to identify key enablers of teamproductivity (Littlejohn, 2002), as well as the underlying interac-tion among team members. Interaction process analysis (IPA),developed by Bales (1950), is an influential method for the study ofcommunication processes between team members, whichemphasizes ‘‘the difference between task-oriented interaction (afocus on achieving the goal) and relational interaction (a focus onthe interpersonal relationships among group members)’’ (Keyton,1997, p. 240). As shown in Table 1, communication acts during teaminteraction are systematically coded into 12 categories, includingsix categories for socio-emotional reactions, with three positive andthree negative types of expressions of sociability and affect. IPA alsoconsiders task-oriented communication as questions and answersaimed at completing a task.
Previous research has successfully analyzed socio-emotionaland task-oriented communication acts using IPA (e.g., Bales, 1950;Hiltz et al., 1978; Maloney-Krichmar and Preece, 2005; Pena andHancock, 2006; Rice and Love, 1987), but provided different results.For instance, studies that examined communication acts amonggroup members in formal group settings reported a higher-levelof task-oriented communication reactions and a fewer negativethan positive socio-emotional communication acts (e.g., Hiltz et al.,1978; Rice and Love, 1987). Maloney-Krichmar and Preece(2004), which examined an online community dedicated to dis-cussing knee injuries, also reported high-levels of task-orientedcommunication acts. On the other hand, other studies found that
Table 1Bales’ interaction process analysis (IPA) categories and examples.
Functional Area Category
Socio-emotional area: Positivereactions
1. Shows Solidarity/Seems Friendly: Any act that sho2. Shows Tension Release/Dramatizes: Any act that reexperiencing3. Shows Agreement: Any act that shows acceptance
Task area: Attempted answers 4. Gives Suggestions: Any act that offers direction/ac
5. Gives Opinions: Any act that advances a belief or6. Gives Orientation/Information: Any act that repor
Task area: Questions 7. Asks for Orientation/Information: Any act that req
8. Asks for Opinions: Any act that requires a belief o9. Asks for Suggestions: Any act that requests direct
Socio-emotional area: Negativereactions
10. Shows Disagreement: Any act that shows rejecti
11. Shows Tension: Any act that indicates that a per12. Shows Antagonism/Seems Unfriendly: Any act tha
socio-emotional communication reactions dominate team inter-actions (e.g., Bales, 1950; Pena and Hancock, 2006). For example,Pena and Hancock (2006), which examined online multiplayervideogame (OMV) in face-to-face and mediated settings, found thatin support of social information processing (SIP) theory, playersproduced a significantly higher rate of socio-emotional than task-oriented communication reactions. This finding is consistent withBales (1950), which showed positive socio-emotional communi-cation acts in such categories as tension release tension release andshowing solidarity.
In summary, the present investigation sought to explore theimpact of team diversity and communication mode on teamcommunication. Additionally, the interaction of diversity andcommunication mode was examined to ascertain whether thesevariables could jointly account for team communication patterns.
3. Method
3.1. Participants
Eighty participants from the University of Arkansas studentpopulation were recruited for the experiment through inquiriesfrom posted flyers across campus. Participants were given mone-tary compensation for their participation. There were 48 male and32 female participants with a mean age of 24.0 years(SD ¼ 5.03 years). Participants were from different academicbackgrounds that included engineering, business, arts, and science.Most of the participants were undergraduates students (75%,n ¼ 60) while 25% (n ¼ 20) were graduates students.
3.2. Experimental task
Three logistics decision-making tasks, distribution, trans-portation, and warehouse location, were selected and modifiedfrom logistics problems developed by Professor Peter L. Jackson,Cornell University (http://www.orie.cornell.edu/wjackson). Thefollowing criteria were used while selecting and revising the tasksfor the experiment:
(1) Difficulty: number of concepts and variables to consider whileplaying the given problem.
(2) Availability: permission to access the problem (e.g., source,help files, etc.).
(3) Flexibility: ability to manipulate the task to accommodatecertain difficulty, characteristics, and goals.
Example
ws positive feelings toward another person Thanks so much for the help.duces the anxiety that a person or group may be Wow, that was funny.
of what another person has said Yeah, I agree with you.tion for how to engage the task I believe we can do better than
that.value that is relevant to the task Just practice some more.ts factual observations or experiences Open door by pressing the red
button.uests factual observations or experiences How can I improve my sword
slashing?r value that is relevant to the task What do you think of this move?ion/action for how to engage the task How can I open this door?on of what another person has said I told you that is not allowed in
here.son is experiencing anxiety I am not happy right now.t shows negative feelings toward another person Why don’t you just shut up?
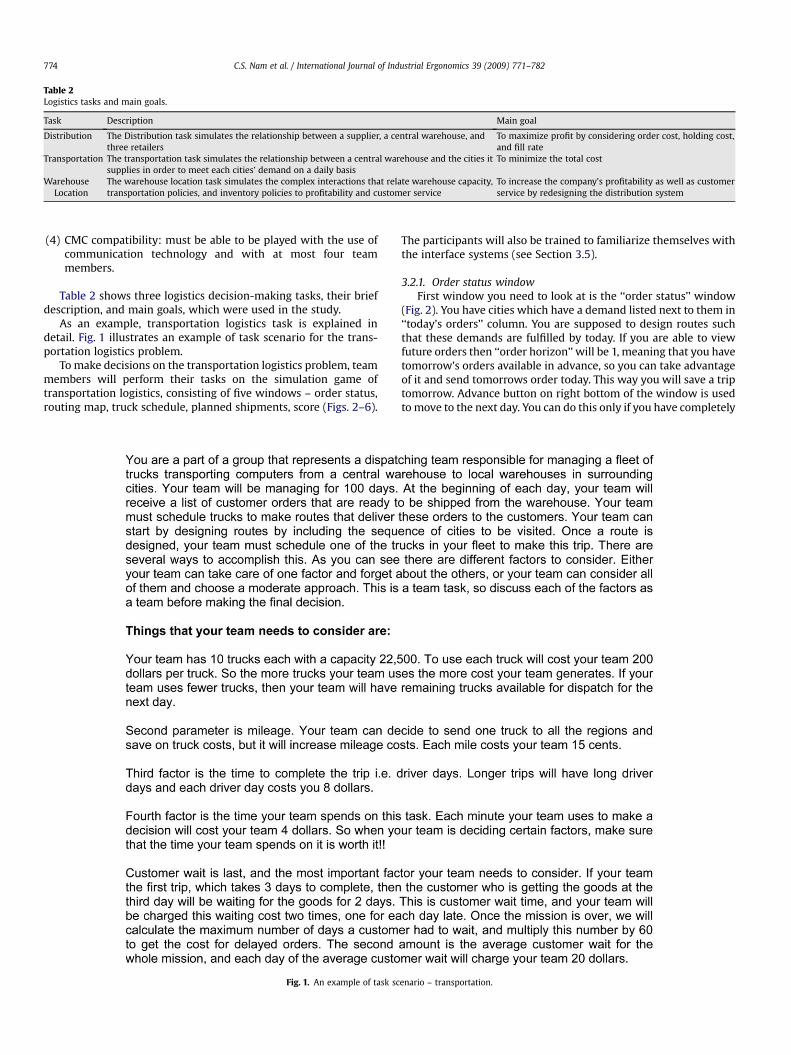
Table 2Logistics tasks and main goals.
Task Description Main goal
Distribution The Distribution task simulates the relationship between a supplier, a central warehouse, andthree retailers
To maximize profit by considering order cost, holding cost,and fill rate
Transportation The transportation task simulates the relationship between a central warehouse and the cities itsupplies in order to meet each cities’ demand on a daily basis
To minimize the total cost
WarehouseLocation
The warehouse location task simulates the complex interactions that relate warehouse capacity,transportation policies, and inventory policies to profitability and customer service
To increase the company’s profitability as well as customerservice by redesigning the distribution system
C.S. Nam et al. / International Journal of Industrial Ergonomics 39 (2009) 771–782774
(4) CMC compatibility: must be able to be played with the use ofcommunication technology and with at most four teammembers.
Table 2 shows three logistics decision-making tasks, their briefdescription, and main goals, which were used in the study.
As an example, transportation logistics task is explained indetail. Fig. 1 illustrates an example of task scenario for the trans-portation logistics problem.
To make decisions on the transportation logistics problem, teammembers will perform their tasks on the simulation game oftransportation logistics, consisting of five windows – order status,routing map, truck schedule, planned shipments, score (Figs. 2–6).
Fig. 1. An example of task sc
The participants will also be trained to familiarize themselves withthe interface systems (see Section 3.5).
3.2.1. Order status windowFirst window you need to look at is the ‘‘order status’’ window
(Fig. 2). You have cities which have a demand listed next to them in‘‘today’s orders’’ column. You are supposed to design routes suchthat these demands are fulfilled by today. If you are able to viewfuture orders then ‘‘order horizon’’ will be 1, meaning that you havetomorrow’s orders available in advance, so you can take advantageof it and send tomorrows order today. This way you will save a triptomorrow. Advance button on right bottom of the window is usedto move to the next day. You can do this only if you have completely
enario – transportation.
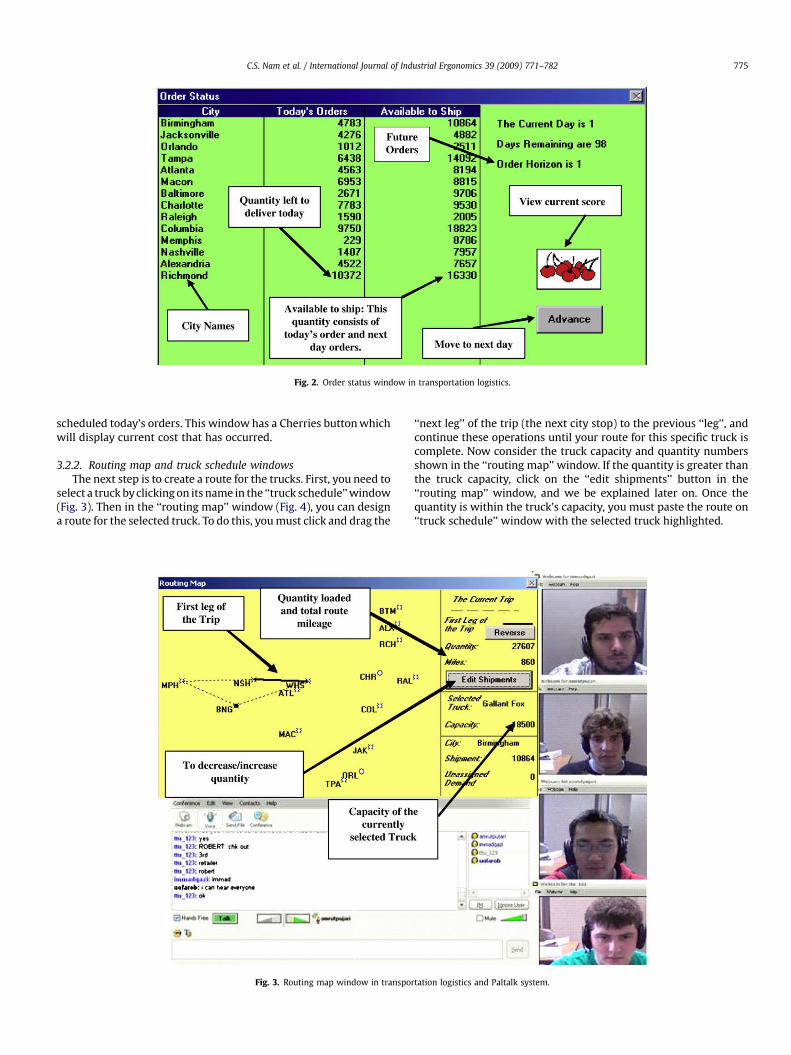
Fig. 2. Order status window in transportation logistics.
C.S. Nam et al. / International Journal of Industrial Ergonomics 39 (2009) 771–782 775
scheduled today’s orders. This window has a Cherries button whichwill display current cost that has occurred.
3.2.2. Routing map and truck schedule windowsThe next step is to create a route for the trucks. First, you need to
select a truck by clicking on its name in the ‘‘truck schedule’’ window(Fig. 3). Then in the ‘‘routing map’’ window (Fig. 4), you can designa route for the selected truck. To do this, you must click and drag the
Fig. 3. Routing map window in transpor
‘‘next leg’’ of the trip (the next city stop) to the previous ‘‘leg’’, andcontinue these operations until your route for this specific truck iscomplete. Now consider the truck capacity and quantity numbersshown in the ‘‘routing map’’ window. If the quantity is greater thanthe truck capacity, click on the ‘‘edit shipments’’ button in the‘‘routing map’’ window, and we be explained later on. Once thequantity is within the truck’s capacity, you must paste the route on‘‘truck schedule’’ window with the selected truck highlighted.
tation logistics and Paltalk system.
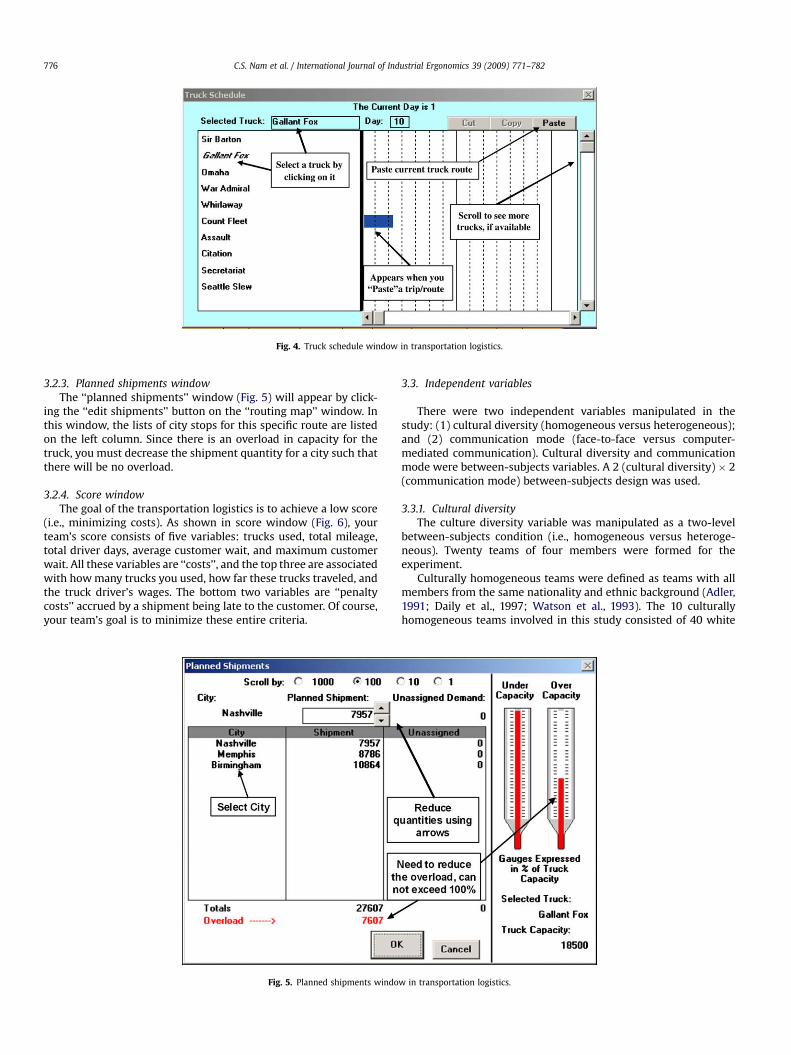
Fig. 4. Truck schedule window in transportation logistics.
C.S. Nam et al. / International Journal of Industrial Ergonomics 39 (2009) 771–782776
3.2.3. Planned shipments windowThe ‘‘planned shipments’’ window (Fig. 5) will appear by click-
ing the ‘‘edit shipments’’ button on the ‘‘routing map’’ window. Inthis window, the lists of city stops for this specific route are listedon the left column. Since there is an overload in capacity for thetruck, you must decrease the shipment quantity for a city such thatthere will be no overload.
3.2.4. Score windowThe goal of the transportation logistics is to achieve a low score
(i.e., minimizing costs). As shown in score window (Fig. 6), yourteam’s score consists of five variables: trucks used, total mileage,total driver days, average customer wait, and maximum customerwait. All these variables are ‘‘costs’’, and the top three are associatedwith how many trucks you used, how far these trucks traveled, andthe truck driver’s wages. The bottom two variables are ‘‘penaltycosts’’ accrued by a shipment being late to the customer. Of course,your team’s goal is to minimize these entire criteria.
Fig. 5. Planned shipments windo
3.3. Independent variables
There were two independent variables manipulated in thestudy: (1) cultural diversity (homogeneous versus heterogeneous);and (2) communication mode (face-to-face versus computer-mediated communication). Cultural diversity and communicationmode were between-subjects variables. A 2 (cultural diversity) � 2(communication mode) between-subjects design was used.
3.3.1. Cultural diversityThe culture diversity variable was manipulated as a two-level
between-subjects condition (i.e., homogeneous versus heteroge-neous). Twenty teams of four members were formed for theexperiment.
Culturally homogeneous teams were defined as teams with allmembers from the same nationality and ethnic background (Adler,1991; Daily et al., 1997; Watson et al., 1993). The 10 culturallyhomogeneous teams involved in this study consisted of 40 white
w in transportation logistics.
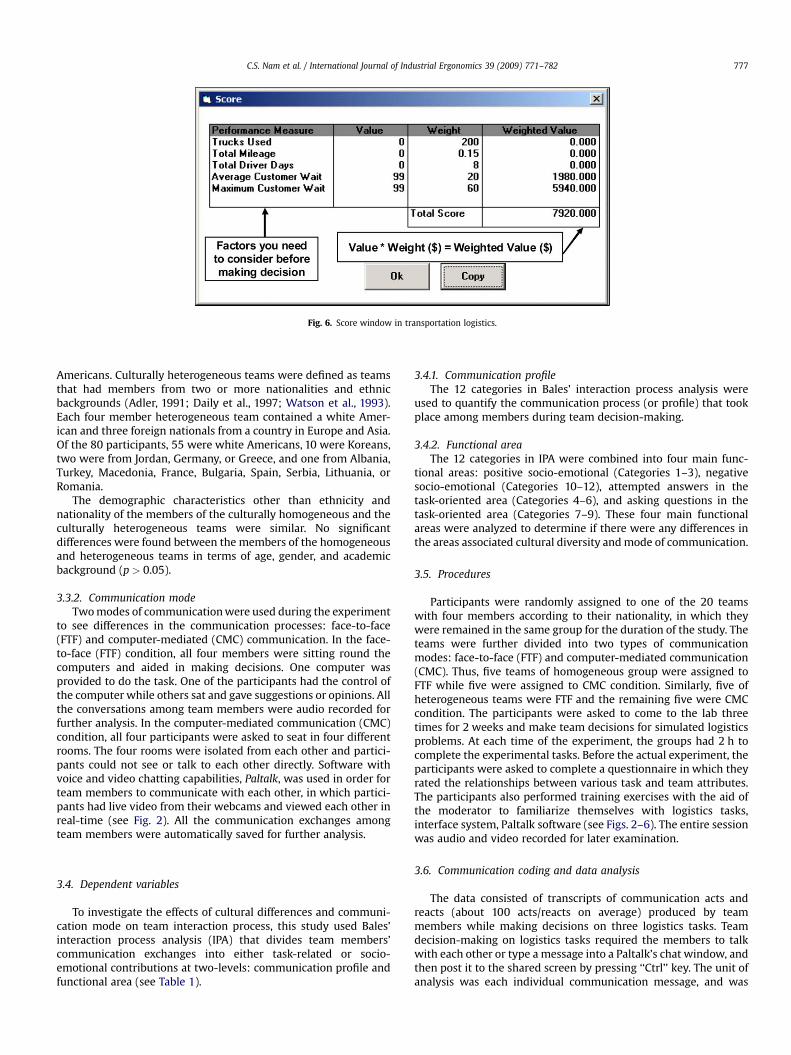
Fig. 6. Score window in transportation logistics.
C.S. Nam et al. / International Journal of Industrial Ergonomics 39 (2009) 771–782 777
Americans. Culturally heterogeneous teams were defined as teamsthat had members from two or more nationalities and ethnicbackgrounds (Adler, 1991; Daily et al., 1997; Watson et al., 1993).Each four member heterogeneous team contained a white Amer-ican and three foreign nationals from a country in Europe and Asia.Of the 80 participants, 55 were white Americans, 10 were Koreans,two were from Jordan, Germany, or Greece, and one from Albania,Turkey, Macedonia, France, Bulgaria, Spain, Serbia, Lithuania, orRomania.
The demographic characteristics other than ethnicity andnationality of the members of the culturally homogeneous and theculturally heterogeneous teams were similar. No significantdifferences were found between the members of the homogeneousand heterogeneous teams in terms of age, gender, and academicbackground (p > 0.05).
3.3.2. Communication modeTwo modes of communication were used during the experiment
to see differences in the communication processes: face-to-face(FTF) and computer-mediated (CMC) communication. In the face-to-face (FTF) condition, all four members were sitting round thecomputers and aided in making decisions. One computer wasprovided to do the task. One of the participants had the control ofthe computer while others sat and gave suggestions or opinions. Allthe conversations among team members were audio recorded forfurther analysis. In the computer-mediated communication (CMC)condition, all four participants were asked to seat in four differentrooms. The four rooms were isolated from each other and partici-pants could not see or talk to each other directly. Software withvoice and video chatting capabilities, Paltalk, was used in order forteam members to communicate with each other, in which partici-pants had live video from their webcams and viewed each other inreal-time (see Fig. 2). All the communication exchanges amongteam members were automatically saved for further analysis.
3.4. Dependent variables
To investigate the effects of cultural differences and communi-cation mode on team interaction process, this study used Bales’interaction process analysis (IPA) that divides team members’communication exchanges into either task-related or socio-emotional contributions at two-levels: communication profile andfunctional area (see Table 1).
3.4.1. Communication profileThe 12 categories in Bales’ interaction process analysis were
used to quantify the communication process (or profile) that tookplace among members during team decision-making.
3.4.2. Functional areaThe 12 categories in IPA were combined into four main func-
tional areas: positive socio-emotional (Categories 1–3), negativesocio-emotional (Categories 10–12), attempted answers in thetask-oriented area (Categories 4–6), and asking questions in thetask-oriented area (Categories 7–9). These four main functionalareas were analyzed to determine if there were any differences inthe areas associated cultural diversity and mode of communication.
3.5. Procedures
Participants were randomly assigned to one of the 20 teamswith four members according to their nationality, in which theywere remained in the same group for the duration of the study. Theteams were further divided into two types of communicationmodes: face-to-face (FTF) and computer-mediated communication(CMC). Thus, five teams of homogeneous group were assigned toFTF while five were assigned to CMC condition. Similarly, five ofheterogeneous teams were FTF and the remaining five were CMCcondition. The participants were asked to come to the lab threetimes for 2 weeks and make team decisions for simulated logisticsproblems. At each time of the experiment, the groups had 2 h tocomplete the experimental tasks. Before the actual experiment, theparticipants were asked to complete a questionnaire in which theyrated the relationships between various task and team attributes.The participants also performed training exercises with the aid ofthe moderator to familiarize themselves with logistics tasks,interface system, Paltalk software (see Figs. 2–6). The entire sessionwas audio and video recorded for later examination.
3.6. Communication coding and data analysis
The data consisted of transcripts of communication acts andreacts (about 100 acts/reacts on average) produced by teammembers while making decisions on three logistics tasks. Teamdecision-making on logistics tasks required the members to talkwith each other or type a message into a Paltalk’s chat window, andthen post it to the shared screen by pressing ‘‘Ctrl’’ key. The unit ofanalysis was each individual communication message, and was
C.S. Nam et al. / International Journal of Industrial Ergonomics 39 (2009) 771–782778
then coded into one of 12 IPA categories by two coders who weretrained in accordance with the method described by Bales (1950).Reliability values of p ¼ 0.68–0.73 were achieved.
4. Results
Two-way ANOVAs were performed to assess the effects ofculture diversity (homogeneous and heterogeneous) and commu-nication mode (FTF and CMC) on team communication process.
4.1. Team communication profile
The communication process (or profile) that took place amongmembers during team decision-making was analyzed using the 12categories in Bales’ Interaction Process Analysis. Table 3 showsa summary of significant effects for team communication profile.
4.1.1. Showing solidarityHeterogeneous teams expressed more solidarity and affection
messages (M ¼ 4.14, SD ¼ 2.17) than homogeneous teams(M ¼ 3.46, SD ¼ 3.81), but the main effect of cultural diversity wasnot significant, p > 0.05. Communication mode was not alsosignificant for showing solidarity, p > 0.05. There was no interac-tion effect of cultural diversity and communication mode onshowing solidarity, p > 0.05.
4.1.2. Showing tension releaseThe main effect of cultural diversity was not significant for
showing tension release, p > 0.05. The analysis revealed a signifi-cant effect for the communication mode condition, F(1,16) ¼ 5.81,p ¼ 0.0284. Contrasts showed that the amount of showing tensionrelease messages in the face-to-face (FTF) condition (M ¼ 6.14,SD ¼ 14.07) was greater than in the computer-mediated commu-nication (CMC) condition (M ¼ 3.49, SD ¼ 1.72). In addition, theinteraction effect of culture and communication mode was signif-icant for showing tension release acts, F(1,16) ¼ 10.54, p ¼ 0.0051.There was a significant difference in the showing tension releasemessages between FTF (M ¼ 8.80, SD ¼ 3.89) and CMC (M ¼ 2.58,SD ¼ 0.94) conditions in the homogeneous teams, while commu-nication mode did not make any difference for the heterogeneousteams.
4.1.3. Showing agreementThe main effect of cultural diversity was significant for showing
agreement acts, F(1,16) ¼ 6.02, p ¼ 0.0260. There was a significantlygreater amount of ‘‘showing agreement’’ in homogeneous teams
Table 3Significant effects for team communication profile.
Parameter Effect F-value p-value
Showing tension release Communication F(1,16) ¼ 5.81 ¼0.0284Culture � communication F(1,16) ¼ 10.54 ¼0.0051
Showing agreement Culture F(1,16) ¼ 6.02 ¼0.0260Communication F(1,16) ¼ 7.66 ¼0.0137Culture � communication F(1,16) ¼ 7.64 ¼0.0135
Giving suggestion Communication F(1,16) ¼ 30.44 <0.0001Giving opinion Culture F(1,16) ¼ 4.87 ¼0.0423
Communication F(1,16) ¼ 5.31 ¼0.0350Culture � communication F(1,16) ¼ 9.36 ¼0.0075
Giving orientation Communication F(1,16) ¼ 28.70 <0.0001Asking for opinion Culture � communication F(1,16) ¼ 7.38 ¼0.0152Asking for suggestion Culture � communication F(1,16) ¼ 5.67 ¼0.0300Showing disagreement Communication F(1,16) ¼ 8.27 ¼0.0110Showing tension Culture F(1,16) ¼ 6.87 ¼0.0185
Communication F(1,16) ¼ 5.80 ¼0.0285Culture � communication F(1,16) ¼ 17.19 ¼0.0008
Showing antagonism Culture � communication F(1,16) ¼ 7.51 ¼0.0145
(M ¼ 40.3, SD ¼ 13.28) than in heterogeneous teams (M ¼ 14.46,SD ¼ 7.57). There was also a significant effect for the communica-tion mode condition, F(1,16) ¼ 7.66, p ¼ 0.0137. Contrasts showedthat the amount of showing agreement messages in FTF teams(M ¼ 41.96, SD ¼ 12.23) was larger than in CMC teams (M ¼ 12.80,SD ¼ 6.76). The interaction effect of culture and communicationmode was significant for showing agreement acts, F(1,16) ¼ 7.66,p ¼ 0.0137. There was a significant difference in showing agree-ment messages between FTF (M ¼ 69.46, SD ¼ 25.5) and CMC(M ¼ 11.14, SD ¼ 4.88) conditions in homogeneous teams, while thecommunication mode condition did not make any difference forheterogeneous teams.
4.1.4. Giving suggestionThe main effect of cultural diversity was not significant for giving
suggestion, p > 0.05. The analysis revealed a significant effect forcommunication mode condition, F(1,16) ¼ 30.44, p < 0.0001,showing that the amount of giving suggestion messages in the face-to-face (FTF) condition (M ¼ 43.27, SD ¼ 23.32) was greater than inthe computer-mediated communication (CMC) condition(M ¼ 35.83, SD ¼ 16.44). There was no interaction effect of culturaldiversity and communication mode on the giving suggestion.
4.1.5. Giving opinionThe main effect of cultural diversity was significant for giving
opinion acts, F(1,16) ¼ 4.87, p ¼ 0.0423. Homogeneous teams(M ¼ 32.56, SD ¼ 19.85) expressed significantly more givingopinion messages than in heterogeneous teams (M ¼ 15.64,SD ¼ 10.79). The analysis also revealed a significant effect for thecommunication mode condition, F(1,16) ¼ 5.31, p ¼ 0.0350.Contrasts showed that the amount of giving opinion messages inFTF teams (M ¼ 32.93, SD ¼ 19.27) was larger than in CMC teams(M ¼ 15.27, SD ¼ 11.40). In addition, the interaction effect of cultureand communication mode was significant for giving opinion acts,F(1,16) ¼ 9.36, p ¼ 0.0075. There was a significant difference ingiving opinion between FTF (M ¼ 53.12, SD ¼ 28.76) and CMC(M ¼ 12.0, SD ¼ 10.36) conditions in homogeneous teams, whilethe communication mode condition did not make any differencefor heterogeneous teams.
4.1.6. Giving orientationThe main effect of cultural diversity was not significant for giving
orientation, p > 0.05. The analysis revealed a significant effect forthe communication mode condition, F(1,16) ¼ 28.70, p < 0.0001,showing that the amount of giving orientation messages in face-to-face (FTF) condition (M ¼ 77.17, SD ¼ 21.65) was greater than incomputer-mediated communication (CMC) condition (M ¼ 30.83,SD ¼ 16.17). There was no interaction effect of cultural diversity andcommunication mode on giving suggestion.
4.1.7. Asking for orientationCultural diversity and communication mode were not signifi-
cant for asking for orientation messages, p > 0.05. There was nointeraction effect of cultural diversity and communication mode onasking for orientation.
4.1.8. Asking for opinionCultural diversity and communication mode were not signifi-
cant for the asking for opinion, p > 0.05. However, the interactioneffect of culture and communication mode was significant forasking for orientation messages, F(1,16) ¼ 7.38, p ¼ 0.0152. Therewas a significant difference in asking for opinion between FTF(M ¼ 18.34, SD ¼ 8.71) and CMC (M ¼ 3.88, SD ¼ 5.07) conditions inhomogeneous teams, while the communication mode conditiondid not make any difference for heterogeneous teams.
C.S. Nam et al. / International Journal of Industrial Ergonomics 39 (2009) 771–782 779
4.1.9. Asking for suggestionCultural diversity and communication mode were not signifi-
cant for asking for suggestion, p > 0.05. However, the interactioneffect of culture and communication mode was significant forasking for suggestion, F(1,16) ¼ 5.67, p ¼ 0.0300. There wasa significant difference in asking for suggestion between FTF(M ¼ 19.80, SD ¼ 10.9) and CMC (M ¼ 6.54, SD ¼ 7.34) conditions inhomogeneous teams, while the communication mode conditiondid not make any difference for heterogeneous teams.
4.1.10. Showing disagreementThe main effect of cultural diversity was not significant for
showing disagreement, p > 0.05. The analysis revealed a significanteffect for the communication mode condition, F(1,16) ¼ 8.27,p ¼ 0.0110. Contrasts showed that the amount of showingdisagreement messages in the face-to-face (FTF) condition(M ¼ 6.67, SD ¼ 5.64) was significantly greater than in thecomputer-mediated communication (CMC) condition (M ¼ 1.56,SD ¼ 1.53). There was no interaction effect of cultural diversity andcommunication mode on showing disagreement messages.
4.1.11. Showing tensionThe main effect of cultural diversity was significant for showing
tension, F(1,16) ¼ 6.87, p ¼ 0.0185. Homogeneous teams (M ¼ 7.80,SD ¼ 5.82) expressed more showing tension messages thanheterogeneous teams (M ¼ 4.12, SD ¼ 2.97). The analysis revealeda significant effect for the communication mode condition,F(1,16) ¼ 5.80, p ¼ 0.0285. Contrasts showed that the amount ofshowing tension messages in FTF teams (M ¼ 7.65, SD ¼ 5.7) waslarger than in CMC teams (M ¼ 4.27, SD ¼ 3.29). In addition, theinteraction effect of culture and communication mode was signif-icant for showing tension acts, F(1,16) ¼ 17.19, p ¼ 0.0008. Therewas a significant difference in showing tension between FTF(M ¼ 12.40, SD ¼ 3.69) and CMC (M ¼ 3.20, SD ¼ 3.09) conditionsin homogeneous teams, while the communication mode conditiondid not make any difference for heterogeneous teams.
4.1.12. Showing antagonismCultural diversity and communication mode were not signifi-
cant for showing antagonism, p > 0.05. But, the interaction effect ofculture and communication mode was significant for showingantagonism, F(1,16) ¼ 7.51, p ¼ 0.0145. There was a significantdifference in showing antagonism between FTF (M ¼ 2.26,SD ¼ 1.2) and CMC (M ¼ 0.12, SD ¼ 0.10) conditions in homoge-neous teams, while the communication mode condition did notmake any difference for heterogeneous teams.
4.2. Functional communication areas: socio-emotional versustask-oriented
The four main functional areas – positive socio-emotional,negative socio-emotional, attempted answers in the task-oriented
Table 4Significant effects for functional communication areas.
Parameter Effect
Positive socio-emotional area CultureCommunicationCulture� communic
Attempted answers in task-oriented area CommunicationQuestions in task-oriented area Communication
Culture� communicNegative socio-emotional area Culture
CommunicationCulture� communic
area, and asking questions in the task-oriented area – wereanalyzed to determine if there were any differences in the areasassociated cultural diversity and mode of communication. Table 4shows a summary of significant effects for functional communica-tion areas.
4.2.1. Positive socio-emotional areaThe main effect of cultural difference on positive socio-
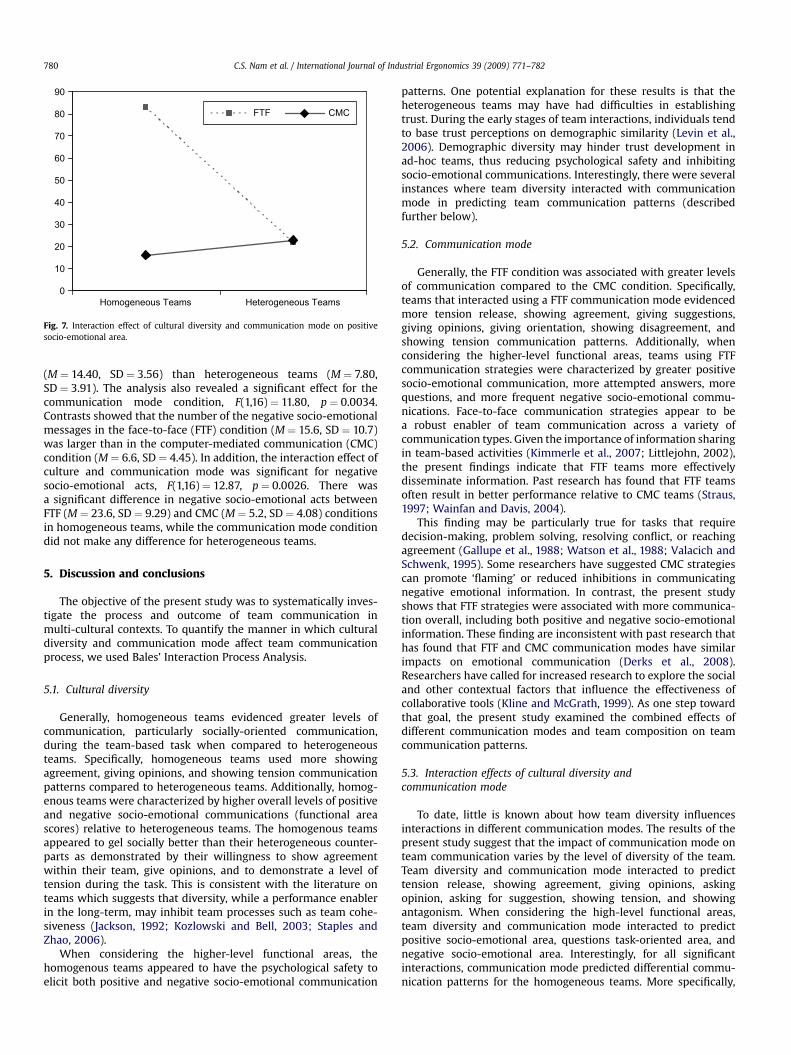
emotional reactions was significant, F(1,16) ¼ 5.48, p ¼ 0.0325.Homogeneous teams expressed significantly more positive socio-emotional messages (M ¼ 49.40, SD ¼ 13.56) than heterogeneousteams (M ¼ 22.40, SD ¼ 8.03). The analysis also revealed a signifi-cant effect for the communication mode condition, F(1,16) ¼ 8.09,p ¼ 0.0117. Contrasts showed that the number of the positive socio-emotional messages in the face-to-face (FTF) condition (M ¼ 52.30,SD ¼ 16.51) was larger than in the computer-mediated communi-cation (CMC) condition (M ¼ 19.50, SD ¼ 8.18). In addition, theinteraction effect of culture and communication mode was signif-icant for positive socio-emotional messages, F(1,16) ¼ 8.69,p ¼ 0.0096. There was a significant difference in positive socio-emotional acts between FTF (M ¼ 82.8, SD ¼ 19.77) and CMC(M ¼ 16.0, SD ¼ 6.23) conditions in homogeneous teams, while thecommunication mode condition did not make any difference forheterogeneous teams (Fig. 7).
4.2.2. Attempted answers in task-oriented areaThe main effect of culture on task-related attempted answers
was not significant, F(1,16) ¼ 4.13, p > 0.05. However, the analysisrevealed a significant effect for the communication mode condi-tion, F(1,16) ¼ 33.38, p < 0.0001. Contrasts showed that FTF teamsexpressed significantly more task-related attempted answers(M ¼ 165.0, SD ¼ 53.85) than CMC teams (M ¼ 70.30, SD ¼ 27.54).No interaction effect of cultural diversity and communication modeon task-related attempted answers was found.
4.2.3. Questions in task-oriented areaThe main effect of communication mode on task-related ques-
tions was significant, F(1,16) ¼ 6.22, p ¼ 0.0240, while culturaldiversity was not significant. Contrasts showed that FTF teamsexpressed significantly more task-related questions (M ¼ 48.4,SD ¼ 29.61) than CMC teams (M ¼ 27.3, SD ¼ 10.99). The interac-tion effect of culture and communication mode was also significantfor task-related questions, F(1,16) ¼ 4.99, p ¼ 0.0401. There wasa significant difference in task-related questions between FTF(M ¼ 66.4, SD ¼ 31.66) and CMC (M ¼ 30.4, SD ¼ 12.68) conditionsin homogeneous teams, while the communication mode conditiondid not make any difference for heterogeneous teams.
4.2.4. Negative socio-emotional areaThe main effect of culture on negative socio-emotional acts was
significant, F(1,16) ¼ 6.35, p ¼ 0.0228. Homogeneous teamsexpressed significantly more negative socio-emotional messages
F-value p-value
F(1,16) ¼ 5.48 ¼0.0325F(1,16) ¼ 8.09 ¼0.0117
ation F(1,16) ¼ 8.69 ¼0.0096F(1,16) ¼ 33.38 <0.0001F(1,16) ¼ 6.22 ¼0.0240
ation F(1,16) ¼ 4.99 ¼0.0401F(1,16) ¼ 6.35 ¼0.0228F(1,16) ¼ 11.80 ¼0.0034
ation F(1,16) ¼ 12.87 ¼0.0026
0
10
20
30
40
50
60
70
80
90
Homogeneous Teams Heterogeneous Teams
FTF CMC
Fig. 7. Interaction effect of cultural diversity and communication mode on positivesocio-emotional area.
C.S. Nam et al. / International Journal of Industrial Ergonomics 39 (2009) 771–782780
(M ¼ 14.40, SD ¼ 3.56) than heterogeneous teams (M ¼ 7.80,SD ¼ 3.91). The analysis also revealed a significant effect for thecommunication mode condition, F(1,16) ¼ 11.80, p ¼ 0.0034.Contrasts showed that the number of the negative socio-emotionalmessages in the face-to-face (FTF) condition (M ¼ 15.6, SD ¼ 10.7)was larger than in the computer-mediated communication (CMC)condition (M ¼ 6.6, SD ¼ 4.45). In addition, the interaction effect ofculture and communication mode was significant for negativesocio-emotional acts, F(1,16) ¼ 12.87, p ¼ 0.0026. There wasa significant difference in negative socio-emotional acts betweenFTF (M ¼ 23.6, SD ¼ 9.29) and CMC (M ¼ 5.2, SD ¼ 4.08) conditionsin homogeneous teams, while the communication mode conditiondid not make any difference for heterogeneous teams.
5. Discussion and conclusions
The objective of the present study was to systematically inves-tigate the process and outcome of team communication inmulti-cultural contexts. To quantify the manner in which culturaldiversity and communication mode affect team communicationprocess, we used Bales’ Interaction Process Analysis.
5.1. Cultural diversity
Generally, homogeneous teams evidenced greater levels ofcommunication, particularly socially-oriented communication,during the team-based task when compared to heterogeneousteams. Specifically, homogeneous teams used more showingagreement, giving opinions, and showing tension communicationpatterns compared to heterogeneous teams. Additionally, homog-enous teams were characterized by higher overall levels of positiveand negative socio-emotional communications (functional areascores) relative to heterogeneous teams. The homogenous teamsappeared to gel socially better than their heterogeneous counter-parts as demonstrated by their willingness to show agreementwithin their team, give opinions, and to demonstrate a level oftension during the task. This is consistent with the literature onteams which suggests that diversity, while a performance enablerin the long-term, may inhibit team processes such as team cohe-siveness (Jackson, 1992; Kozlowski and Bell, 2003; Staples andZhao, 2006).
When considering the higher-level functional areas, thehomogenous teams appeared to have the psychological safety toelicit both positive and negative socio-emotional communication
patterns. One potential explanation for these results is that theheterogeneous teams may have had difficulties in establishingtrust. During the early stages of team interactions, individuals tendto base trust perceptions on demographic similarity (Levin et al.,2006). Demographic diversity may hinder trust development inad-hoc teams, thus reducing psychological safety and inhibitingsocio-emotional communications. Interestingly, there were severalinstances where team diversity interacted with communicationmode in predicting team communication patterns (describedfurther below).
5.2. Communication mode
Generally, the FTF condition was associated with greater levelsof communication compared to the CMC condition. Specifically,teams that interacted using a FTF communication mode evidencedmore tension release, showing agreement, giving suggestions,giving opinions, giving orientation, showing disagreement, andshowing tension communication patterns. Additionally, whenconsidering the higher-level functional areas, teams using FTFcommunication strategies were characterized by greater positivesocio-emotional communication, more attempted answers, morequestions, and more frequent negative socio-emotional commu-nications. Face-to-face communication strategies appear to bea robust enabler of team communication across a variety ofcommunication types. Given the importance of information sharingin team-based activities (Kimmerle et al., 2007; Littlejohn, 2002),the present findings indicate that FTF teams more effectivelydisseminate information. Past research has found that FTF teamsoften result in better performance relative to CMC teams (Straus,1997; Wainfan and Davis, 2004).
This finding may be particularly true for tasks that requiredecision-making, problem solving, resolving conflict, or reachingagreement (Gallupe et al., 1988; Watson et al., 1988; Valacich andSchwenk, 1995). Some researchers have suggested CMC strategiescan promote ‘flaming’ or reduced inhibitions in communicatingnegative emotional information. In contrast, the present studyshows that FTF strategies were associated with more communica-tion overall, including both positive and negative socio-emotionalinformation. These finding are inconsistent with past research thathas found that FTF and CMC communication modes have similarimpacts on emotional communication (Derks et al., 2008).Researchers have called for increased research to explore the socialand other contextual factors that influence the effectiveness ofcollaborative tools (Kline and McGrath, 1999). As one step towardthat goal, the present study examined the combined effects ofdifferent communication modes and team composition on teamcommunication patterns.
5.3. Interaction effects of cultural diversity andcommunication mode
To date, little is known about how team diversity influencesinteractions in different communication modes. The results of thepresent study suggest that the impact of communication mode onteam communication varies by the level of diversity of the team.Team diversity and communication mode interacted to predicttension release, showing agreement, giving opinions, askingopinion, asking for suggestion, showing tension, and showingantagonism. When considering the high-level functional areas,team diversity and communication mode interacted to predictpositive socio-emotional area, questions task-oriented area, andnegative socio-emotional area. Interestingly, for all significantinteractions, communication mode predicted differential commu-nication patterns for the homogeneous teams. More specifically,
C.S. Nam et al. / International Journal of Industrial Ergonomics 39 (2009) 771–782 781
homogeneous teams evidenced more tension release, showingagreement, giving opinions, asking opinions, asking for sugges-tions, showing tension, and showing antagonism when they usedFTF communication strategies versus CMC strategies.
Past research has shown that high performing teams haveeffective communication patterns and are able to recognize andaddress problems within the team (Aubert and Kelsey, 2003). Thepresent study suggests that one-way to help promote a high-performance team, one which is capable of effectively communi-cating positive socio-emotional, negative socio-emotional, andquestioning types of communication patterns is to use a homoge-nous group of people and allow them to interact using FTF styles.These communication styles should facilitate greater team perfor-mance among homogenous teams by allowing these teams toaddress problems within the team, and by promoting the psycho-logical safety to critically evaluate team inputs and options duringFTF interactions. In contrast, heterogeneous teams and teams whoare forced to use CMC strategies appear to experience lower levelsof communication compared to their homogeneous counterparts.Interestingly, heterogeneous teams evidence the same level ofcommunication relative to homogenous teams when thosehomogeneous teams are forced to use CMC strategies. Again, it islikely that since individuals base trust perceptions on demographicsimilarity, particularly early in a team’s lifecycle (see Levin et al.,2006) that the heterogeneous teams had difficulties in establishingtrust. Homogeneous teams could also suffer from a degradation oftrust when forced to interact using CMC. Past research has shownthat virtual team interactions tend to delay the development oftrust and make it more fragile (Jarvenpaa and Leidner, 1999). Trustaside, Bales’ interaction process analysis (IPA, Bales, 1985; Bales andCohen, 1979) appears to be an effective methodology that issensitive to manipulations such as team composition andcommunication mode. Additional research is needed to extend thecurrent findings.
5.4. Future research
Future research should consider exploring different types ofcollaborative tools to examine their costs and/or benefits on teamcommunication. Communication effectiveness may rely, in part, onthe media richness that the tools afford. Past research has foundthat media with higher degrees of richness have been associatedwith more effective communication compared to tools that conveylower media richness (Hanumantharao and Grabowski, 2006).Participants in the present study had the option of using an audio/video-based capability or a text-based chat capability. Futureresearch might explore the costs/benefits of using only one form ofcollaborative tool in isolation.
Future research should also explore different task types toexamine how team diversity and different collaborative toolsinfluence team performance. Team diversity is believed to enhanceteam performance during creative tasks and tasks that requiredecision-making while inhibiting performance on routine ormanufacturing type tasks (Kozlowski and Bell, 2003). Whilediversity in team composition may be better for specific tasks, thereare also certain task types may be better suited for particularcollaborative tools. For instance, complex tasks (e.g., decision-making, negotiation) may be good candidates for synchronouscollaborative tools while more sequential tasks may be betterperformed using asynchronous tools (Bell and Kozlowski, 2002).Additionally, future research should examine how different levelsof diversity in team composition affect team performance andcommunication. For example, past research has shown thatheterogeneity in cognitive ability is beneficial to team performance
while heterogeneity in personality is detrimental to team perfor-mance (Williams and Sternberg, 1988).
5.5. Conclusions
The present study provided empirical evidence that both teamdiversity and communication mode influence the communicationmechanisms through which teams exchange information. Addi-tionally, the impact of team diversity on team communication wasfound to vary by the communication mode that was used duringa team-based task. These findings contribute to the teams literatureby further exploring the impact of team composition on teamprocess. Furthermore, the results of this study have expanded uponthe burgeoning literature on collaboration by evaluating the costs/benefits of FTF versus CMC communication strategies and also byexploring how these effects interact with team diversity. To date,little is known about how contextual, social, and organizationalfactors influence the inextricable success and or failure of variouscollaborative tools. Even in this technology-centric world the vastmajority of new information technology (IT) tools fail to reach theirstrategic objectives due to social, organizational, and othercontextual factors (Clegg et al., 1997), thus suggesting that moreattention be given to the social context within which work occurs.In response to this need, the present studied provided a glimpse ofhow team communications can be enhanced by using a combina-tion of team composition and communication mode options.
Acknowledgements
This research was in part supported by the Air Force ResearchLaboratory (AFRL) via the Center for Engineering Logistics andDistribution (CELDi) under Grant No. EEC-0436687. Any opinions,findings, and conclusions or recommendations expressed in thismaterial are those of the authors and do not necessarily reflect theviews of the AFRL or CELDi.
References
Adler, N. J., 1991. International dimensions of organizational behavior, second ed.Boston: PWS-Kent Publishing Co.
Adrianson, L., Hjelmquist, E., 1999. Group processes in solving two problems: face-to-face communication and computer-mediated communication. Behavior andInformation Technology 18 (3), 179–198.
Ancona, D.G., Caldwell, D.F., 1992. Bridging the boundary: external activity andperformance in organizational coalitions. Administrative Science Quarterly 37,634–665.
Aubert, B.A., Kelsey, B.L., 2003. Further understanding of trust and performance invirtual teams. Small Group Research 34, 575–618.
Bales, R.F., 1950. Interaction Process Analysis: A Method for the Study of SmallGroups. Addison-Wesley, Cambridge, MA.
Bales, R.F., 1985. The new field theory in social psychology. International Journal ofSmall Group Research 1, 1–18.
Bales, R.F., Cohen, S.P., 1979. SYMLOG: A System for the Multiple Level Observationof Groups. The Free Press, New York.
Bantel, K.A., 1994. Strategic planning openness: the role of top team demography.Group & Organization Management 19 (4), 406–424.
Beck, D., Fisch, R., 2000. Argumentation and emotional processes in group decision-making: illustration of a multilevel interaction process analysis approach.Group Processes & Intergroup Relations 3 (2), 183–201.
Bell, B.S., Kozlowski, S.W.J., 2002. A typology of virtual teams: implications foreffective leadership. Group and Organizational Management 27, 14–49.
Cannon-Bowers, J.A., Salas, E., Converse, S.A., 1993. Shared mental models in expertteam decision making. In: Castellan Jr., N.J. (Ed.), Individual and Group DecisionMaking: Current Issues. LEA, Hillsdale, NJ, pp. 221–246.
Clegg, C., Axtell, C., Damodaran, L., Farbey, B., Hull, R., Lloyd-Jones, R., Nicholls, J.,Sells, R., Tomlinson, C., 1997. Information technology: a study of performanceand the role of human and organizational factors. Ergonomics 40 (9), 851–871.
Daily, B. F., Loveland, J., Steiner, R., 1997. A comparative analysis of reactions frommulticultural and culturally homogeneous teams to decision making with andwithout GDSS technology. ACM SIGCPR Computer Personnel, 18(1), 3–14.
Derks, D., Fischer, A.H., Bos, A.E., 2008. The role of emotion in computer-mediatedcommunication: a review. Computers in Human Behavior 24, 766–785.
C.S. Nam et al. / International Journal of Industrial Ergonomics 39 (2009) 771–782782
Frey, L.R., 1995. Applied communication research on group facilitation in naturalsettings. In: Frey, L.R. (Ed.), Innovations in Group Facilitation. Hampton Press,New Jersey, pp. 1–23.
Gallupe, R.B., DeSanctis, G., Dickson, G.W., 1988. Computer-based support for groupproblem finding: an experimental investigation. MIS Quarterly 12 (2), 277–298.
George, J., Easton, G., Nunamaker, J.F., Northcraft, G., 1990. A study of collaborativegroup work with and without computer-based support. Information SystemsResearch 1, 394–415.
Hackman, J.R., 1998. Why teams don’t work. Leader to Leader 7, 24–31.Hambrick, D.C., Davison, S.C., Snell, S.A., Snow, C.C., 1998. When groups consist of
multiple nationalities: towards a new understanding of the implications.Organization Studies 19 (2), 181–205.
Hanumantharao, S., Grabowski, M., 2006. Effects of introducing collaborativetechnology on communications in a distributed safety-critical system. Inter-national Journal of Human-Computer Studies 64, 714–726.
Harrison, D., Price, K., Bell, M., 1998. Beyond relational demography: time andeffects of surface- and deep-level diversity on work group cohesion. Academy ofManagement Journal 41, 96–107.
Hiltz, S.R., Johnson, K., Agle, G. (1978). Replicating Bales’ Problem Solving Experi-ments on a Computerized Conference: a Pilot Study (Research Report No. 8).New Jersey Institute of Technology, Computerized Conferencing and Commu-nications Center, Newark, NJ.
Hiltz, S.R., Johnson, K., Turoff, M. (1986). Experiments in group decision-making:communication process and outcome in face-to-face versus computerizedconferences. Human Communication Research, 13(2), 225–252.
Hoffman, L.R., 1978. The group problem-solving process. In: Berkowitz, L. (Ed.),Group Processes. Academic Press, New York, pp. 101–114.
Hollingshead, A.B., McGrath, J.E., O’Connor, K., 1993. Group task performance andcommunication technology: a longitudinal study of computer-mediated versusface-to-face work groups. Small Group Research 24 (3), 307–333.
Jackson, S., 1992. Team composition in organizations. In: Worchel, S., Wood, W.,Simpson, J. (Eds.), Group Process and Productivity. Sage, London, pp. 1–12.
Jarvenpaa, S.L., Leidner, D.E., 1999. Communication and trust in global virtual teams.Organizational Science 10, 791–815.
Keyton, J., 1997. Coding Communication in Decision Making Groups. ManagingGroup Life: Communication in Decision Making Groups, 236–269.
Kiesler, S., Sproull, L., 1992. Group decision making and communication technology.Organizational Behavior & Human Decision Processes 52, 96–123.
Kiesler, S., Siegel, J., McGuire, W.T., 1984. Social psychological aspects of computer-mediated communication. American Psychologist 39, 1123–1134.
Kimmerle, J., Cress, U., Hesse, F.W., 2007. An interactional perspective on groupawareness: alleviating the information-exchange dilemma (for everybody?).International Journal of Human-Computer Studies 65, 899–910.
Kirkman, B., Gibson, C., Shapiro, D. (2001). Exporting teams: enhancing theimplementation and effectiveness of work teams in global affiliates. Organi-zational Dynamics, Summer, (30), 1.
Kline, T.J.B., McGrath, J., 1999. A review of the groupware literature: theories,methodologies, and a research agenda. Canadian Psychology 40, 265–271.
Kozlowski, S.W.J., Bell, B.S., 2003. Work groups and teams in organizations. In:Borman, W., Illgen, D. (Eds.), Handbook of Psychology: Industrial and Organi-zational Psychology. John Wiley & Sons Inc, New York, NY, pp. 333–375.
Lau, D.C., Murninghan, J.K., 1998. Demographic diversity and faultliness: thecompositional dynamics of organizational groups. Academy of ManagementReview 23 (2), 325–340.
Levi, D., Slem, C., 1995. Team work in research and development organizations: thecharacteristics of successful teams. International Journal of Industrial Ergo-nomics 16 (1), 29–42.
Levin, D.Z., Whitener, E.M., Cross, R., 2006. Perceived trustworthiness of knowledgesources: the moderating impact of relationship length. Journal of AppliedPsychology 91 (5), 1163–1171.
Littlejohn, S., 2002. Theories of Human Communication, eighth ed. WadsworthPublishing Company, California.
Loden, M., Rosener, J.B., 1991. Workforce America: Managing Employee Diversity asa Vital Resource. Irwin Professional Publishing, Burr Ridge, Illinois.
Maloney-Krichmar, D., Preece, J., 2005. A multilevel analysis of sociability, usabilityand community dynamics in an online health community. Transactions onHuman-Computer Interaction (TOCHI) 12 (2), 1–32.
Marks, M.A., Mathieu, J.E., Zaccaro, S.J., 2001. A temporally based framework andtaxonomy of team process. Academy of Management Review 26 (3), 356–376.
Marquardt, M. J., Horvath, L., 2001. Global teams: How top multinationals spanboundaries and cultures with high-speed teamwork. Palo Alto, CA: Davies-Black.
May, A., Carter, C., 2001. A case study of virtual team working in the Europeanautomotive industry. International Journal of Industrial Ergonomics 27 (3),171–186.
McGrath, J.E., 1984. Groups: Interaction and Performance. Prentice Hall, EnglewoodCliffs, New Jersey.
McLeod, P.L., Lobel, S.A., Cox, T.H., 1996. Ethnic diversity and creativity in smallgroups. Small Group Research 27 (2), 248–264.
Milliken, F.J., Martins, L.L., 1996. Searching for common threads: understanding themultiple effects of diversity in organizational groups. Academy of ManagementReview 21, 402–433.
O’Connora, P., O’Deab, A., Flinc, R., Beltond, S., 2008. Identifying the team skillsrequired by nuclear power plant operations personnel. International Journal ofIndustrial Ergonomics 38 (11–12), 1028–1037.
Oetzel, J.G., 2001. Self-constructs, communication processes, and group outcomes inhomogeneous and heterogeneous groups. Small Group Research 32 (1), 19–54.
Pearson, J.C., Nelson, P.E., Titsworth, S., Harter, L., 2000. Introduction to HumanCommunication, eighth ed. McGraw Hill Companies Inc, Boston.
Pena, J., Hancock, J.T., 2006. An analysis of socioemotional and task communicationin online multiplayer video games. Communication Research 33, 92–109.
Rice, R.E., Love, G., 1987. Electronic emotion: socioemotional content in a computer-mediated network. Communication Research 14, 85–108.
Ruhe, J.A., Eatman, J., 1977. Effects of racial composition on small work groups. SmallGroup Behavior 8, 479–486.
Smith, K.G., Smith, K.A., Olian, J.D., Sims, H.P., O’Bannon, D.P., Scully, J.A., 1994. Topmanagement team demography and process: the role of social integration andcommunication. Administrative Science Quarterly 39 (3), 412–438.
Sproull, L., Kiesler, 1986. Reducing social context cues: electronic mail in organi-zational communication. Management Science 32, 1492–1512.
Staples, D.S., Zhao, L., 2006. The effects of cultural diversity in virtual teams versusFace-to-face teams. Group Decision and Negotiation 15, 389–406.
Straus, S.G., 1997. Technology, group process, and group outcomes: testing theconnections in computer-mediated and face-to-face groups. Human-ComputerInteraction 12, 227–266.
Straus, S.G., McGrath, J.E., 1994. Does the medium matter? The interaction of tasktype and technology on group performance and members reactions. Journal ofApplied Psychology 79, 87–97.
Triandis, H.C., 1994. Culture and social behavior. McGraw-Hill, Inc, New York.Valacich, J.S., Schwenk, C., 1995. Devil’s advocacy and dialectical inquiry effects on
face-to-face and computer-mediated group decision making. OrganizationalBehavior and Human Decision Processes 63 (2), 158–173.
Wainfan, L., Davis, P., 2004. Challenges in Virtual Collaboration: Videoconferencing,Audioconferencing, and Computer-Mediated Communications (ResearchReport). RAND Corporation, California.
Walther, J.B., 1992. Interpersonal effects in computer-mediated interaction: a rela-tional perspective. Communication Research 19, 52–90.
Watson, R.T., DeSanctis, G., Poole, M.S., 1988. Using a GDSS to facilitate groupconsensus: some intended and unintended consequences. MIS Quarterly 12 (3),463–477.
Watson, W.E., Kumar, K., Michaelsen, L.K., 1993. Cultural diversity’s impact oninteraction processes and performance: comparing homogeneous and diversetask groups. Academy of Management Journal 36, 590–602.
Williams, K.Y., O’Reilly, C.A., 1998. Demography and diversity in organizations. In:Staw, B.M., Sutton, R.M. (Eds.), Research in Organizational Behavior. JAI Press,Stamford, CT, pp. 77–140.
Williams, W.M., Sternberg, R.J., 1988. Group intelligence: why some groups arebetter than others. Intelligence 12, 351–377.