Embed Size (px)
Citation preview

The Power of Brand Selfies
June 2021
Jochen Hartmann1
Mark Heitmann2
Christina Schamp3
Oded Netzer4
Funding:
This work was funded by the German Research Foundation (DFG) research unit 1452, HE 6703/1-2.
1Jochen Hartmann is Postdoctoral Researcher at the University of Hamburg, Hamburg Business
School, Moorweidenstrasse 18, 20148 Hamburg, Germany. [email protected].
2Mark Heitmann is Professor of Marketing & Customer Insight at the University of Hamburg,
Hamburg Business School, Moorweidenstrasse 18, 20148 Hamburg, Germany. mark.heitmann@uni-
hamburg.de.
3Christina Schamp is Professor of Digital Marketing & Behavioral Insights at the Vienna University
of Economics and Business, Welthandelsplatz 1, 1020 Vienna, Austria. [email protected].
4Oded Netzer is the Arthur J. Samberg Professor of Business, Columbia Business School, 520 Uris
Hall, 3022 Broadway, New York, NY 10027-6902, USA. [email protected].
Electronic copy available at: https://ssrn.com/abstract=3354415

The Power of Brand Selfies
June 2021
Abstract
Smartphones have made sharing images of branded experiences nearly effortless. This
research classifies social media brand imagery and studies user response. Aside from
packshots (standalone product images), two types of brand-related selfie images ap-
pear online: consumer selfies (featuring brands and consumers’ faces) and an emerging
phenomenon we term brand selfies (invisible consumers holding a branded product).
We use convolutional neural networks to identify these archetypes and train language
models to infer social media response to more than a quarter million brand-image
posts (185 brands on Twitter and Instagram). We find consumer-selfie images receive
more sender engagement (i.e., likes and comments), whereas brand selfies result in
more brand engagement, expressed by purchase intentions. These results cast doubt
on whether conventional social media metrics are appropriate indicators of brand en-
gagement. Results for display ads are consistent with this observation, with higher
click-through rates for brand selfies than for consumer selfies. A controlled lab experi-
ment suggests self-reference is driving the differential response to selfie images. Collec-
tively, these results demonstrate how (interpretable) machine learning helps extracting
marketing-relevant information from unstructured multimedia content and that selfie
images are a matter of perspective in terms of actual brand engagement.
Keywords: User-Generated Content; Social Media; Image Analysis; Deep Learning;
Natural Language Processing; Interpretable Machine Learning.
Electronic copy available at: https://ssrn.com/abstract=3354415

Every day more than 6.5 billion images are shared on social media platforms such as Face-
book, Twitter, or Instagram.1 Of particular interest to marketers are images that feature
brands and consumption experiences, namely, brand images. Based on a sample of images
from social media, we estimate that approximately 1% of all social media images contain
branded content. That is, approximately 65 million posts each day feature brand logos. The
diversity of content in this social media brand imagery likely exceeds any traditional ad-
vertising channel and collectively reaches a considerable number of prospective and existing
customers.
In terms of the types of user-generated images, one of the biggest trends introduced by
smartphone cameras and social media are selfies. Selfies have quickly become so popular
that Oxford Dictionaries named selfie the word of the year in 2013. According to estimates,
individual millennial users will take more than 25,000 selfies in their lifetime (Glum 2015),
and more than 450 million images with the hashtag #selfie exist on a single photo-sharing
platform such as Instagram.
The emergence and explosive proliferation of selfies merit the question of how brands
appear in selfie images and how social media observers respond to such images. From the
brand perspective, contemporary marketing practice attempts to capitalize on the selfie phe-
nomenon. For example, companies such as Lay’s potato crisps, Unilever (Axe deodorant),
Budweiser, and Dunkin’ Donuts actively encourage consumers to post selfies of their product
encounters (see Web Appendix A for examples). Coca-Cola even constructed a “Selfie Bot-
tle” to assist consumers in taking pictures of themselves while drinking (Pendlebury 2016).
Lay’s produced a special “Smiles” packaging that motivated consumers to post selfie images
that reportedly resulted in over 30, 000 tweets on Twitter (Adams 2019) and nearly 20, 000
Instagram posts with the hashtag #SmileWithLays (Instagram 2021).
In addition to these actively managed campaigns, brand images are also of interest to
firms when passively listening in to unsolicited social media posts. Among other things,
1Estimate based on Meeker (2016) and social media growth (Statista 2020).
2
Electronic copy available at: https://ssrn.com/abstract=3354415

companies track brand-logo presence on social media to understand social media popularity,
rank consumer-generated images on their social media brand page, or use such images as
part of their own marketing campaigns. Merely counting logo appearances may result in
erroneous conclusions because viewers may respond differently to different types of brand
images. Accordingly, the objective of this research is (a) to create a taxonomy of how brands
appear in consumer-generated images and (b) to examine how different image perspectives
relate to brand engagement.
Academic research provides ample evidence about consumer response to advertising im-
ages (e.g., Xiao and Ding 2014). However, social media posts are different from traditional
advertising because observers are often socially connected with the sender featured on an
image. Although recent studies have explored how taking and sharing photos on social me-
dia affect subsequent sender behavior (e.g., Barasch, Zauberman and Diehl 2018; Grewal,
Stephen and Coleman 2019), little is known about observer response to brand-image posts.
Frequently used indicators of social media engagement typically rely on sender-directed re-
sponses such as the number of likes and comments (e.g., Herhausen et al. 2019; Li and Xie
2020). However, engagement with the post or sender may not translate to engagement with
the brand. In fact, consumer presence in selfie images may stimulate thoughts related to the
sender and communication intent as opposed to brand-related thoughts and purchase intent.
We investigate how social media brand images relate to brand engagement by studying
more than a quarter million images with 185 visible beverages and food brands. Following
recent calls for multimedia research (Colicev 2021; Grewal, Gupta and Hamilton 2020), we
leverage transfer learning and convolutional neural networks (CNN) to classify the different
types of brand images and identify three distinct archetypes that differ in terms of human and
facial presence. Consumers post either images of products in isolation or holding products
themselves (i.e., selfies). We find these brand-related selfies exist in two forms, with consumer
faces either visible or a first-person point of view of the product with the sender face not
visible to observers. We name the former consumer selfies and the latter brand selfies to
3
Electronic copy available at: https://ssrn.com/abstract=3354415
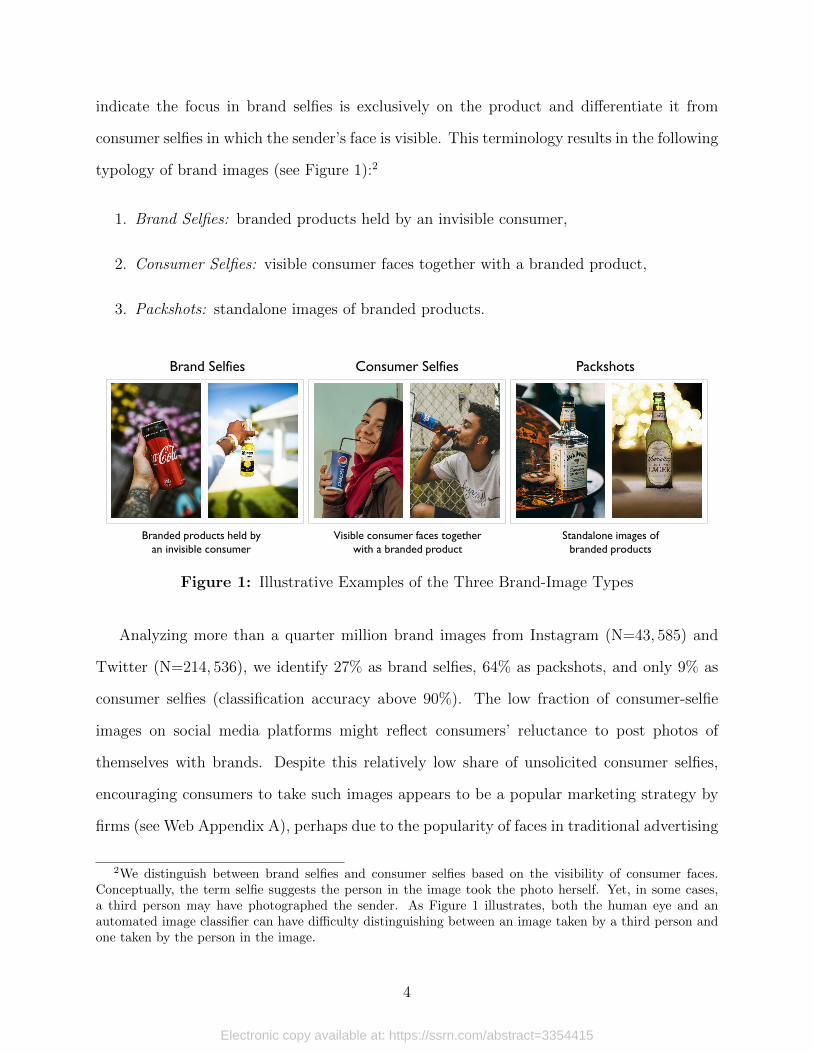
indicate the focus in brand selfies is exclusively on the product and differentiate it from
consumer selfies in which the sender’s face is visible. This terminology results in the following
typology of brand images (see Figure 1):2
1. Brand Selfies: branded products held by an invisible consumer,
2. Consumer Selfies: visible consumer faces together with a branded product,
3. Packshots: standalone images of branded products.
Branded products held by
an invisible consumer
Visible consumer faces together
with a branded product
Standalone images of
branded products
Consumer SelfiesBrand Selfies Packshots
Figure 1: Illustrative Examples of the Three Brand-Image Types
Analyzing more than a quarter million brand images from Instagram (N=43, 585) and
Twitter (N=214, 536), we identify 27% as brand selfies, 64% as packshots, and only 9% as
consumer selfies (classification accuracy above 90%). The low fraction of consumer-selfie
images on social media platforms might reflect consumers’ reluctance to post photos of
themselves with brands. Despite this relatively low share of unsolicited consumer selfies,
encouraging consumers to take such images appears to be a popular marketing strategy by
firms (see Web Appendix A), perhaps due to the popularity of faces in traditional advertising
2We distinguish between brand selfies and consumer selfies based on the visibility of consumer faces.Conceptually, the term selfie suggests the person in the image took the photo herself. Yet, in some cases,a third person may have photographed the sender. As Figure 1 illustrates, both the human eye and anautomated image classifier can have difficulty distinguishing between an image taken by a third person andone taken by the person in the image.
4
Electronic copy available at: https://ssrn.com/abstract=3354415
(To and Patrick 2020; Xiao and Ding 2014) and the prevalence of non-brand-related selfie
images on social media. Whether brand-related consumer selfies generate positive brand
engagement on social media is an open question that we address in this research.
In addition to automated image analysis, we apply text mining using Transformer-based
language models to the comments that observers made in response to image posts. Specif-
ically, we identify comments that express purchase intentions (e.g., “Now I want a Pepsi,
too!”). Across the two social media platforms, we find consistent evidence that whereas
consumer selfies generate the highest level of sender engagement (i.e., likes and comments),
visible consumer faces result in lower levels of brand engagement (i.e., purchase-intent com-
ments) relative to brand selfies. We also investigate whether these effects generalize to display
ads that are typically only at the perimeter of consumers’ attention. Analyzing the response
to over 600 display ads of hand-held consumer technology products, we find brand selfies are
associated with higher click-through rates (CTRs) relative to consumer-selfie images. How-
ever, the differences between image types are less pronounced than for social media content.
We also replicate our results on selfie images under random assignment in two controlled lab
experiments with purchase intent measured on traditional rating scales. Mediation analysis
suggests self-reference is driving the differential response to selfie images.
>
>
Click-Through
Rates
Lab Evidence
BS ~ PS ~ CS
Purchase
Intentions
Brand Engagement
▪ Display Ads
BS > PS ~ CS
Field Evidence
BS > PS > CS
BS > PS > CS
Likes
Sender Engagement
CS > BS ~ PS
CS > BS > PS
No significant differences
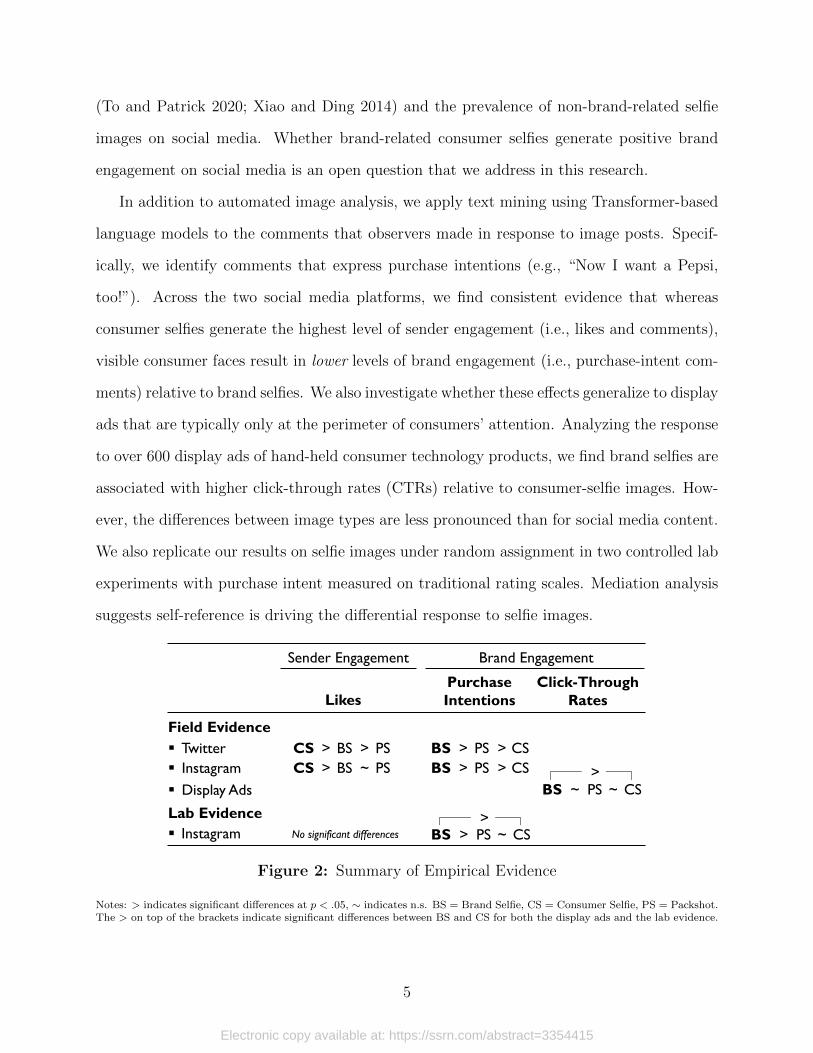
Figure 2: Summary of Empirical Evidence
Notes: > indicates significant differences at p < .05, ∼ indicates n.s. BS = Brand Selfie, CS = Consumer Selfie, PS = Packshot.The > on top of the brackets indicate significant differences between BS and CS for both the display ads and the lab evidence.
5
Electronic copy available at: https://ssrn.com/abstract=3354415

From a marketing perspective, these collective findings clarify brand-related selfie im-
ages are not created equal. Whereas counts of likes are readily available, they measure
sender-related communication and may not reflect brand interest. This observation is evi-
dent from consumer selfies generating more likes but brand selfies generating higher levels
of self-reference and actual brand engagement (see Figure 2). The consistency of results
across social media platforms and consumer- versus firm-generated content, together with
the experimental evidence, suggests images with high potential for self-reference result in
systematically higher levels of brand engagement. Sender engagement, on the other hand,
is driven by visible familiar faces that trigger communication intent. Thus, social media
managers should be mindful of different brand-image perspectives and which engagement
metric they track and optimize. Merely counting likes and comments can result in erroneous
conclusions. Instead, we find that leveraging recent advances in language modelling to con-
struct more informative measures based on what users have to say can be a more useful
approach.
The remainder of this paper is organized as follows: First, we discuss the literature related
to user-generated brand content and consumer response to brand images. We then describe
the analysis of the extensive Twitter and Instagram image datasets and the deep-learning
algorithms we deploy to identify the archetypes of brand images and their impact on sender
engagement and brand engagement. The subsequent section analyzes CTRs of display ads,
followed by controlled lab experiments to understand the causal impact of image types on
consumers’ reactions. We conclude with a discussion, suggestions for future research, and
implications for social media marketing.
6
Electronic copy available at: https://ssrn.com/abstract=3354415

BRAND IMAGES IN SOCIAL MEDIA
The Role of User-Generated Brand Content in Social Media
Numerous studies demonstrate the importance of user-generated content (UGC) as a means
for social listening, that is, understanding customer needs, opinions, and motivations (Chung
et al. 2021; Moe et al. 2017). The majority of this research has relied either on summaries of
text content such as volume and valence (e.g., Chevalier and Mayzlin 2006; Godes and May-
zlin 2004; Liu 2006) or on automatic extraction of consumer perceptions in user-generated
texts (e.g., Netzer et al. 2012; Timoshenko and Hauser 2019; Tirunillai and Tellis 2014).
For example, the amount and valence of aggregate UGC have proven useful as predictors of
demand (Chevalier and Mayzlin 2006; Liu 2006), customer-based brand equity (Schweidel
and Moe 2014), and stock returns (Colicev et al. 2018).
Despite the rapid proliferation of images in social media, academic research on UGC has
focused mainly on textual analysis. Recently, a few studies have made use of advances in
deep learning to move beyond text content (e.g., Dzyabura and Peres 2021; Liu et al. 2020;
Zhang et al. 2018). For example, Li and Xie (2020) shows social media posts with images
obtain more likes than text-only posts. From the sender perspective, Grewal, Stephen and
Coleman (2019) finds sharing photos serves a critical social objective in terms of identity
signaling.
Regarding the effect of UGC on observers, social media research has mainly studied com-
munication directed toward the sender by tracking the number of likes or comments a post
receives (e.g., Herhausen et al. 2019; Li and Xie 2020). Likes have also become an important
performance indicator in applied social media marketing (Colicev 2021). However, in terms
of actual brand impact, focusing on likes alone makes the implicit assumption that sender-
directed engagement translates into brand engagement. One of the objectives of this paper
is to investigate the relationship between the commonly used metrics of the number of likes
and comments and brand-engagement metrics in the context of social media brand imagery.
7
Electronic copy available at: https://ssrn.com/abstract=3354415

Consumer Response to Different Brand-Image Types
The emerging phenomenon of brand selfies raises the question of how observers process this
type of brand imagery. Brand selfies differ from consumer selfies by the absence of a (familiar)
face of a friend or related social media user. They also differ in the ego versus third-person
perspective. These differences suggest that, relative to consumer selfies, brand selfies are (1)
associated with fewer other-related thoughts and (2) cue more self-thoughts related to the
brand.
For traditional advertising, consumers were found to process information by relating it
to themselves and bringing personal experiences and mental images to mind (Burnkrant
and Unnava 1995; Escalas 2007; Meyers-Levy and Peracchio 1996). This mental simulation
of consumption experiences creates positive brand-related outcomes such as higher brand
recall, more positive brand attitudes, and higher purchase intentions (Burnkrant and Unnava
1995; Elder and Krishna 2012, 2021; Escalas 2007; Meyers-Levy and Peracchio 1996; Zhao,
Hoeffler and Zauberman 2011). Accordingly, enhancing self-reference is a relevant objective
for advertisers when managing brand engagement and brand recall.
Although the self-reference literature is rich and wide, to the best of our knowledge, self-
reference has not been studied in the context of social media in general and consumer selfies
in particular. Additionally, tests of self-reference effects in the field are scant. Theoretically,
the facial presence of consumer selfies is likely to shift consumers toward other- as opposed
to self-related thoughts. Indeed, the visibility of other “typical consumers” in advertising
has been observed to inhibit self-referent thinking with viewers considering how they might
relate to the person in the image (Debevec and Romeo 1992; To and Patrick 2020). On
social media, viewers typically know the sender to some degree and may even share similar
experiences, making the effect likely more pronounced than a stranger visible on an ad would.
Conversely, brand selfies, taken from the observer’s point of view, may enhance brand-specific
8
Electronic copy available at: https://ssrn.com/abstract=3354415

self-related thought. According to the self-reference theory, consumers’ ability to relate the
brand more easily to their own personal experiences in brand selfies can generate higher levels
of cognitive elaboration and mental simulation of brand consumption (Bower and Gilligan
1979; Escalas 2007), which has been linked to higher levels of brand engagement (Elder and
Krishna 2012; Symons and Johnson 1997).
Compared with both types of selfie images, we expect packshots to have an intermediate
position with regard to brand engagement. Packshots feature a brand without facial distrac-
tions. They should therefore induce higher levels of self-reference than consumer selfies that
shift viewer focus from self-related to other-related thoughts. Unlike brand selfies, packshots
do not contain an explicit ego perspective, that is, no visible hand as an “execution device”
to drive mental simulation and self-reference (Elder and Krishna 2012). Thus, we can think
of the three brand-image types sitting on a self-reference continuum, with brand selfies lead-
ing to the strongest self-reference effect, consumer selfies to the lowest, and packshots in
between. Accordingly, we would expect the differences in brand engagement between con-
sumer selfies and brand selfies to be more pronounced than the difference between the two
selfies images and packshots.
Although self-reference effects have been observed in the lab, generalization to the field
remains an open empirical question. Besides the familiarity with senders, the ability to
generate self-reference requires reasonable levels of attention and interest in the image at
hand (Burnkrant and Unnava 1995; Meyers-Levy and Peracchio 1996). Such levels of interest
are likely to exist on social media, because user-generated images are a primary reason
users visit social media platforms such as Instagram. However, self-reference theory makes
no predictions about sender engagement such as likes and comments. Mechanisms other
than self-reference are likely to play a role when observers choose to interact with a sender.
Specifically, recent research suggests the type of direct gaze inherent in consumer selfies
drives desire for social interactions and interpersonal communication (To and Patrick 2020).
Accordingly, consumer selfies may well result in more likes and comments than brand-selfie
9
Electronic copy available at: https://ssrn.com/abstract=3354415
images that lack a facial presence. This possibility would make likes and comments a poor
indicator of actual brand engagement (John et al. 2017).
Similar to traditional advertisements, self-reference effects related to online ads are likely
weaker than for UGC, due to banner blindness (Guido, Pichierri and Pino 2018) and the
overall lower level of ad attention and interest (McFerran et al. 2010; Meyers-Levy and
Peracchio 1996). Because advertisements often feature strangers whom consumers cannot
interact with, the visibility of faces in the ads is likely to trigger lower communication desire
and fewer other-related thoughts that may interfere with mental simulation. Consequently,
we expect more extreme differences in self-reference and brand engagement for the different
types of social media images than for different types of advertising images.
Next, we use field data to investigate the relationship between image type, social media
communication, and brand engagement using actual social media posts on Twitter and
Instagram.
EMPIRICAL APPLICATION: BRANDED SOCIAL MEDIA
IMAGES ON TWITTER AND INSTAGRAM
To investigate the role of brand imagery, we analyze two extensive social media datasets of
brand images shared via Twitter and Instagram. We chose Twitter and Instagram due to
their popularity and the prevalence of photos on these platforms. In 2021, Twitter had 350
million monthly active users (Statista 2021) and has, in recent years, continuously transi-
tioned its focus from texts to images (Kane and Pear 2016), with approximately 20% of all
posts including visual content (Vicinitas 2018). Instagram is considered the most popular
image-sharing platform, with more than 1.2 billion monthly active users, and from its incep-
tion, it was more focused on image creation and distribution than most other popular social
media platforms (Statista 2021).
10
Electronic copy available at: https://ssrn.com/abstract=3354415

Data on Branded Hand-Held Consumer Products
As a first step, we set out to collect a comprehensive dataset of user-generated images from
both social media platforms that include brand logos.
Twitter. We collaborated with a U.S.-based vendor with a Twitter firehose access to
a random sample of 10% of all tweets on Twitter. This access allowed automatic track-
ing of logo appearances for 185 brands across 10 categories (i.e., candy, cereals, ice cream,
snacks, beer, energy drinks, juice, liquor, soft drinks, and sports drinks) over three years
(January 2014 to December 2016). All brands in our sample are hand-held consumer prod-
ucts that tend to be consumed in public and are commonly shared via social media images
(see Web Appendices B and C for an overview of the categories and all 185 brands covered
in our analysis). The vendor identifies images that contain brand logos, using a proprietary
machine-learning solution. We exclude all posts from corporate accounts and further train
an algorithm to omit advertising content. The resulting data comprise 214, 563 single-logo
brand images together with their corresponding tweets. In our econometric models, we
further control for user posts classified as containing sponsored content (ad tag). We ob-
tain information on logo position and size using a commercial specialized machine-learning
algorithm (LogoGrab, see Web Appendix D for performance assessments).
In addition to the Twitter image data, we obtain the number of likes and comments
each Twitter post had received, the caption of the post (i.e., the text accompanying the
image post), and all observer comments’ text content, hashtags, and handletags of the post.
We also collect all available information on the senders (their posting frequency, number of
friends, and number of followers). We received this information three months after the last
image was posted. Because most comments and likes on Twitter happen within the first 24
hours, we are confident our dataset contains the vast majority of the relevant responses to
the posts. Additionally, we control for post age in our econometric models. Table 1 provides
variable descriptions. The left panel in Table 2 presents the summary statistics of all vari-
11
Electronic copy available at: https://ssrn.com/abstract=3354415

ables in the Twitter sample.
— Insert Tables 1 & 2 about here —
Instagram. We partnered with another third-party vendor with Instagram access to
collect an additional dataset of 43, 585 social media images with brand logos from Instagram
for the same set of 185 brands used in the Twitter data. The time range covered by these
data spans from June 2011 to October 2019.3 We obtain and create the same set of variables
used in the Twitter analysis. Following the Twitter analysis, we classify the brand logos on
all Instagram images using the LogoGrab algorithm. The right panel of Table 2 reports the
summary statistics of all variables collected for the Instagram dataset. Note engagement
rates for Instagram are higher than for Twitter, which is consistent with industry reports
(Feehan 2021).
Mining Unstructured User-Generated Social Media Images and Texts
To assess the brand engagement of different brand-image types, we develop a unified deep-
learning pipeline that fuses both advanced image-mining and text-mining techniques. Al-
though images and text each pose unique challenges, both sources of unstructured data can
be converted to more structured forms with conceptually similar approaches. At a high level,
our approach consists of five steps. Figure 3 summarizes the core elements of our approach.
In the following two subsections, we briefly summarize our approach to mining image
and text data (see section II in the Web Appendix for further details).
Automated Image Classification
Model training. Recent advances in computer vision have produced remarkable accuracy
levels with superhuman performance in certain domains (e.g., Chung et al. 2017). We build
3The Instagram dataset spans over a longer time horizon than the Twitter dataset to permit a sufficientnumber brand-image posts.
12
Electronic copy available at: https://ssrn.com/abstract=3354415

Image
Posts
(Sender)
Text
Comments
(Observer)
Step 1:
Collection of
Multimedia Data
Need this in my life
Can i have someee
Where can I buy??
Step 2:
Data Annotation &
Augmentation
• Random rotation,
shifting, and
mirroring of brand
images to augment
training data
Step 3:
Model Training
(Transfer Learning)
Step 4:
Model Evaluation &
Interpretation
Step 5:
Prediction &
Econometric Modeling
Prediction:
Brand Selfie vs. Packshot
vs. Cons. Selfie
I need
this, too!
Image Type Classifier
Purchase Intention
Classifier• Selective over-
sampling of
purchase intentions
to address class
imbalance
• Model: VGG-16
• Pretrained on 1.2
million ImageNet
images (103 classes)
• Fine-tuned on
social media images
• Model: RoBERTa
• Pretrained on 160
GB of text (e.g.,
English Wikipedia)
• Fine-tuned on
observer comments
• Interpretation of
visual features via
Grad-CAMs
• Identification of
predictive areas
(faces, hands)
• Interpretation of
linguistic features
via LIME and
variable importance
measures (from
Random Forest)
Prediction:
Purchase
Intent: Yes vs. No
Figure 3: Deep-Learning Pipeline to Mine Unstructured Multimedia Data
on these deep-learning architectures to automatically classify the types of branded user-
generated images we have identified. Specifically, we employ transfer learning to fine-tune
an existing deep neural network pretrained on 1.2 million images on ImageNet (Deng et al.
2009). This approach allows us to leverage the typical image features extracted by the
ImageNet CNN and transfer them to our application. We modify and add layers to the
CNN to enable reliable classification of the three image types. For example, if the features
of a hand or a face are captured by the pretrained ImageNet CNN, these features would
play an important role in the added layer of predicting whether the image is a brand selfie
or a consumer selfie. Transfer learning helps reduce the amount of study-specific human-
annotated training data and to avoid overfitting to limited datasets (e.g., Yosinski et al.
2014; Zhang and Luo 2021).
We chose VGG-16 as the underlying architecture because of its high performance on
related tasks (Simonyan and Zisserman 2014). To appreciate the differences in image char-
acteristics between the two social media platforms, we pursue a two-step training approach.
In the first step, we train a base model using the Twitter data. This approach allows us to
adapt the CNN pretrained on the ImageNet dataset to the particularities of user-generated
social media images. In the second step, we take this model, fine-tuning it even further
with additional Instagram data to obtain a CNN that generalizes well across both social
13
Electronic copy available at: https://ssrn.com/abstract=3354415

media platforms. This process allows us to obtain a generalizable CNN that can classify
brand-image types reliably across Twitter and Instagram.
We manually classified 16, 949 images from the Twitter data and 3, 000 images from
the Instagram data into the three image-type categories. We further expand the training
data using data augmentation. This augmentation includes mirroring images horizontally
to take into account the higher share of right-handedness in the population, creating a more
balanced dataset (see Web Appendix E for further details). The final CNN generalizes well
across both platforms as evidenced by an above 90% accuracy in classifying image types on
a balanced holdout test set of 600 brand images, that is, 200 for each image type, for each
platform (91.17% and 90.67% for Twitter and Instagram, respectively, vs. 33.3% random
chance for the holdout data; see Web Appendix E3 for details).
Model interpretation. Although CNNs are commonly considered black boxes in reference
to understanding how the algorithm decides to classify certain images to certain classes (Rai
2020), we can leverage gradient-weighted class activation mapping (Grad-CAMs; Selvaraju
et al. 2017) to provide post-hoc interpretation for the aspects of the image that play a
pivotal role in the classification task. Figure 4 presents two Grad-CAM examples for each
of the three brand-image types. As expected, the Grad-CAM heatmaps highlight that the
main features for the CNN to distinguish between brand selfies and consumer selfies are the
presence of a hand and a face, respectively. Both are highlighted in warmer colors (yellow
and red) on their superimposed heatmaps, showing that, contingent on these two classes,
the network is highly activated by these regions.
We find most user-generated images on Twitter and Instagram are packshots (excluding
corporate advertising content), contributing a share of 63.35% and 68.80%, respectively (see
Table 2). Additionally, 28.73% (19.63%) are brand selfies and 7.93% (11.57%) are consumer
selfies on Twitter (Instagram). Hence, compared with Twitter, we observe a higher share of
consumer selfies but a lower share of brand selfies on Instagram, which is in line with reports
of Instagram users’ increased interest in self-presentation (Sheldon and Bryant 2016). At
14
Electronic copy available at: https://ssrn.com/abstract=3354415

the same time, consumer selfies are the least prevalent category across both platforms.
Brand Selfies
Consumer Selfies
Packshots
Superimposed Gradient-Weighted Class Activation Mapping
Notes: During image pre-processing, images are rescaled to a standard size of 224 by 224 pixels.
Figure 4: Gradient-Weighted Class Activation Mapping for the Three Brand-Image Types
Automated Text Classification
Model training. Text accompanies each image on social media in at least two ways: (a)
the captions that senders add to images and (b) the comments from observers on the social
media post. We use text analysis to extract information from both sources of textual data.
We measure purchase intentions from observers’ comments on the post as an indicator of
brand engagement. Relative to counts of likes and comments, expressed purchase intentions
such as “I want that Coke so badly!” or “Where can I buy this?” occur relatively rarely
(in about 5% of the posts). Yet, they arguably represent the strongest and most favorable
reaction an observer can express toward a branded product on social media.
Reliably detecting these expressed purchase intentions in the rich yet unstructured ob-
server comments poses a non-trivial challenge because the classifier must grasp subtle se-
mantic signals (Manning et al. 2020). This goal can be accomplished with large-scale natural
language processing models that take into account the context-dependent meaning of indi-
15
Electronic copy available at: https://ssrn.com/abstract=3354415
vidual words. We employ RoBERTa (Liu et al. 2019), a state-of-the-art Transformer-based
language model, to text mine each post’s comments (public responses by observers) and
understand whether observers express interest in the brand (see Web Appendix F for details
of the language-modelling approach). The multi-step purchase-intentions-classifier pipeline
we built achieves a holdout classification accuracy of predicting purchase intentions of 95%
(vs. a 50% random-chance baseline for the balanced holdout data; see Table F3), suggesting
we are able to reliably extract this fairly complex textual feature from post responses.
In addition to the observer comments to a post, we are interested in the sender captions
as important controls. Specifically, we use LIWC (Pennebaker et al. 2015) to obtain the
share of first-person (senders referencing themselves) and second-person (senders referencing
observers) words, the share of words indicating a question, and the share of netspeak (e.g.,
thx, lol) out of all words to control for differences in accompanying caption text between
the image types. Explicit mentions of the brand in the caption and brand tags can also
drive brand engagement. We therefore also control for the number of brand tags (both
hashtags and handletags) as well as occurrences of the full brand name in the caption based
on a custom brand dictionary for the 185 brands in our analysis.4 Additionally, we classify
the sentiment of the caption as positive, neutral, or negative by fine-tuning the RoBERTa
language model on 5, 304 manually annotated posts (86.1% accuracy for the three classes on
1, 327 holdout observations; see Web Appendix F4 for details).5
Model interpretation. To further understand the inner workings of the language-model
classifier, we employ Local Interpretable Model-agnostic Explanations (LIME, Ribeiro, Singh
and Guestrin 2016), an approach similar in spirit to the previous Grad-CAM visualizations
for images. Specifically, using LIME, we can create heatmaps on texts to uncover which text
4A set of 10 brands (e.g., Crush, Extra, Surge) also occur as homonyms as part of natural language.Eliminating these brands results in stable findings. We therefore kept all data on all brands for the subsequentanalyses.
5A model controlling for sentiment based on LIWC lead to similar conclusions regarding our main effectsof interest. Because LIWC often produces relatively low levels of accuracy (Hartmann et al. 2019), we reportall results based on language modelling.
16
Electronic copy available at: https://ssrn.com/abstract=3354415

features are predictive of purchase intentions. Because people use different expressions in
different contexts, we demonstrate LIME based on the open responses from the controlled
lab experiment reported below. In contrast to the unsolicited social media data, the lab
study provides a better understanding of the actual observer objectives. Based on the LIME
results for the comment “That burger looks good. I wonder where she got it? Maybe I
should ask her,” for example, the words got, where, it are the three most predictive features
of purchase intent in this comment. Individually removing these words from this sample sen-
tence would lower the prediction probability of purchase intent from 98.5% by 49, 28, and 24
percentage points, respectively. The above example also demonstrates the language-model-
based classifier is able to correctly classify expressed purchase intentions even if intention
is not explicitly mentioned. This classification accuracy is unlikely to be attainable with
a simple lexicon-based approach (Hartmann et al. 2019), which would likely work only for
comparatively easier purchase intentions with stronger signals such as want, hungry. Web
Appendix G contains exemplary heatmaps and a detailed explanation of LIME.
Relationship between Image Type and Sender and Brand Engagement
Once we extract the image types in the post, the text-based purchase-intent measures from
observers’ comments, and a host of control variables, we can relate image types to sender and
brand engagement to understand the relationships among them. The three observer reac-
tions (likes, comments, expressed purchase intentions) serve as dependent variables and the
brand-image type (brand selfie, consumer selfie, packshot) serves as the primary independent
variable. The three dependent variables are collected as count data and their distributions
indicate overdispersion. We therefore estimate negative binomial regressions (e.g., Akpinar
and Berger 2017; Hughes et al. 2019; Ordenes et al. 2019), which result in higher model fit
than Poisson regressions.
Note image types might differ in terms of the accompanying text, position and size of
logos, or image quality. The large number of posts available to us allows us to control for a
17
Electronic copy available at: https://ssrn.com/abstract=3354415

broad set of potentially confounding variables. These variables include image characteristics,
post characteristics, sender characteristics, and brand-level fixed effects to take into acount
brand-level heterogeneity (see Table 1). Because more than 90% of the senders had posted
only a single image in our Twitter and Instagram sample (see Table 2), we are unable to
statistically control for unobserved sender heterogeneity. However, we account for several
sender-related variables that are directly observable. These variables include whether the
sender posted multiple images to capture potential learning effects by senders, and the
number of friends and followers of senders to account for the fact that more popular senders
may also attract more sender engagement. Variance inflation factors among the independent
variables are well below 3, suggesting multicollinearity does not play a major role in our
models.
Twitter. The left side of Table 3 summarizes the results of the three regressions (with
likes, comments, and purchase intentions as dependent variables) for the Twitter dataset.
— Insert Table 3 about here —
As expected and consistent with other social media research (e.g., Bakhshi, Shamma and
Gilbert 2014; Li and Xie 2020), visible human faces drive sender engagement. Specifically,
we observe the highest number of likes for consumer selfies compared with brand selfies
(−.40, p < .01) and packshots (−.48, p < .01), with brand selfies generating more likes than
packshots (p < .01), see Table 3. Also in terms of comments, consumer selfies outperform
packshots (−.08, p < .01). The latter also result in fewer comments than brand selfies (−.08
versus −.01, p < .01). For consumer selfies and brand selfies, the difference in the number of
comments is directionally consistent, although not statistically significant (−.01, p = .50).
More importantly, we find this pattern of likes and comments does not translate into
brand engagement. Both brand selfies and packshots receive more purchase intentions (.57
for brand selfies and .42 for packshots, both p < .01) relative to consumer selfies. Addition-
ally, brand selfies generate significantly more purchase-intent comments than packshots (.15,
18
Electronic copy available at: https://ssrn.com/abstract=3354415

p < .01). Despite the fact that visual differences between brand selfies and packshots can be
subtle, brand selfies depicting hand-held products from a first-person participant perspective
appear to enjoy an edge over packshots.
Our brand-engagement metric follows a pattern consistent with self-reference theory,
which suggests the highest self-reference for brand selfies, due to the first-person perspec-
tive, the lowest for consumer selfies, due to facial presence, and in between for packshots.
Accordingly, brand selfies enjoy the highest levels of purchase intent and consumer selfies
the lowest. These opposing results for sender engagement and brand engagement highlight
a potential conflict between the objectives of UGC creators and marketers. These results
also put the social media marketing practices of promoting consumer selfie campaigns into
question (see Web Appendix A).
The impact of the control variables with clear theoretical expectations are all in the
expected direction. Specifically, having more followers results in more likes and comments
(.74 and .54, both p < .01). If the sender posts more content, each individual post is less
effective, receiving fewer likes and comments (−.23 and −.02, both p < .01). More central
logo positions are positively associated with purchase intentions (.50, p < .01). Interestingly,
these effects reverse for likes, suggesting salient brand logos are negatively associated with
sender engagement (logo size: −.45, logo centrality: −.12, both p < .01). Similarly, brand
images with larger logos are associated with fewer comments (−.20, p < .01). These results
again highlight the possible opposing effects of sender engagement and brand engagement,
where the sender’s objective to garner popularity and virality may be misaligned with a
firm’s objective to achieve brand engagement.
In line with these observations related to image characteristics, textual brand salience
also appears to undermine sender engagement, because brand tags are undesirable in terms
of likes and comments (−.18, p < .01 and −.15, p < .01, respectively). Intuitively, including
questions in the post’s caption as a means for a sender to solicit a response results in more
likes and comments (1.61, p < .01 and 1.21, p < .01, respectively). Interestingly, negative
19
Electronic copy available at: https://ssrn.com/abstract=3354415

sentiment generates more likes and comments than posts with positive sentiment. This ob-
servation is consistent with findings showcasing that both positively and negatively valenced
text can encourage observers to engage with the sender (Mallipeddi et al. 2021).
Because social media platforms differ in their focus on images (Schweidel and Moe 2014)
and offer different proprietary image-editing technologies, it is useful to examine the robust-
ness of our results in another popular social media platform—Instagram.
Instagram. Similar to the previous analysis using the Twitter dataset, we run the same
models for all three dependent variables on the Instagram dataset. The right side of Table 3
presents the results. The findings largely replicate those of the Twitter analysis. Specifically,
consumer selfies receive more likes than both brand selfies and packshots (.25, p < .01, and
.26, p < .01, respectively). For the number of comments, we also find directionally similar
results across both platforms, with consumer selfies outperforming both brand selfies and
packshots (−.17, p < .01, and −.22, p < .01, respectively). Whereas on Twitter the difference
between consumer selfies and brand selfies is not statistically significant, it is significant on
Instagram.
With regard to brand engagement, consistent with the Twitter analysis, brand selfies
receive more purchase intentions than consumer selfies with visible faces (.53, p < .01).
This difference manifests as well between brand selfies and packshots (.12, p < .01), also
replicating our Twitter findings.
Despite the various differences between Twitter and Instagram, we find consistent results
for both social media platforms. Whereas brand selfies outperform consumer selfies in terms
of brand engagement (expressed purchase intentions) in theoretically meaningful and prac-
tically relevant ways, commonly used and readily available count metrics such as likes and
comments point towards the superiority of consumer selfies in terms of sender engagement.
20
Electronic copy available at: https://ssrn.com/abstract=3354415

Robustness Analyses
In addition to the models reported so far, we estimate various alternative models. First, we
add correlated random effects between the three regressions to account for possible unob-
served relationships between dependent variables we study. Second, we modify our previous
count measures of purchase intent and compute the share of comments that express a pur-
chase intention (for all posts with one or more comments). Both alternative models result
in similar qualitative and statistical conclusions (see Web Appendices H and I for details of
these robustness analyses).
Furthermore, to investigate the robustness of the results across product categories, we
split the brands into two main categories, beverage and food brands, and estimate separate
models for each category. Results are consistent across both categories as well as compared
with the aggregate analysis, suggesting our findings are not driven by category peculiarities
(see Web Appendices J1 and J2).
Posts with a brand image but negative-sentiment caption may be accompanied by sys-
tematically different types of images and might also generate different reactions. Although
our main analysis controls for the caption sentiment (positive, negative, neutral), we inves-
tigate the robustness of our results by estimating all models excluding posts with negative
captions (11.32% and 3.92% of the posts for Twitter and Instagram datasets, respectively).
We find the results are robust to removing these negative posts (see Web Appendix K for
details).
The Role of Self- versus Other-Thoughts
Recall that self-reference, as a driver of brand engagement, builds on (1) the visibility of
the brand and (2) mentally simulated observer actions related to what is visible in the
image. Because consumer selfies feature the face of a (familiar) social media user, they
are likely to inhibit self-thoughts and promote more other-thoughts than brand selfies and
21
Electronic copy available at: https://ssrn.com/abstract=3354415

packshots. To empirically investigate this process, we analyze whether observers write more
about themselves (vs. others) in the comments corresponding to consumer selfies than in
comments corresponding to brand selfies and packshots.
Similar to the analysis of the posts’ captions, we compute the share of self-related words
in a comment (I-words from the LIWC dictionary, Pennebaker et al. 2015) and the share of
other-related words in a comment (you- and she/he-words from the LIWC dictionary). We
use the difference between these two shares as an indicator of relative self-thoughts. Note
this measure does not reflect whether the brand on the image is explicitly mentioned (which
would be highly correlated with our measure of purchase intentions). Consistent with the
purchase-intention analyses, the unit of observation is a sender post. That is, we average over
all observer comments that relate to a sender post. Because the net self-thoughts metric is
continuous, we estimate a linear regression with net self-thoughts as the dependent variable
and the three brand-image types as independent variables (brand selfie and packshot, with
consumer selfie as a reference category), while including the same set of control variables as
in our previous analyses (see Table 4).
— Insert Table 4 about here —
Across both platforms, as expected, brand selfies receive more self-related observer com-
ments than consumer selfies (Instagram: 1.51, p < .01; Twitter: .46, p < .01). Interestingly,
packshots also receive more self-oriented comments than consumer selfies, suggesting the
sender’s face is indeed what shifts self- versus other-thinking (Instagram: 1.53, p < .01;
Twitter: .49, p < .01). Packshots and brand selfies, which both do not contain a visible face,
have similar values of net self-thoughts. Although one may expect higher self-thoughts for
brand selfies than for packshots, due the observer point of view, recall that our text-based
measure of self-thoughts is not related to any brand-specific thoughts. Consequently, it does
not indicate whether brand selfies generate higher levels of self-reference with respect to the
brand. We investigate this issue more directly by employing established self-reference scales
in the lab experiment setting below.
22
Electronic copy available at: https://ssrn.com/abstract=3354415

Before studying the causal impact of selfie images using controlled lab experiments, we
use data on CTRs for display ads to investigate whether our results generalize outside the
social media context.
DISPLAY ADVERTISING CLICK-THROUGH RATES
Social media data are often limited with respect to individual-level lower-funnel actions
(Moe and Schweidel 2017). Although our measure of purchase intents is useful and has
provided interesting insights, it is not based on actual brand-directed actions of observers.
Hence, in this section we investigate whether the brand-engagement patterns for selfie images
generalize to actual CTRs for display advertising. Specifically, we study display ads in a more
utilitarian domain (electronic hand-held products) than the product categories used in the
social media analyses.
We test the relationship between image type and display ad CTRs (i.e., the ratio of all
consumers clicking on an ad divided by the total number of ad impressions) by partnering
with a leading content discovery platform that distributes ads on various publisher sites and
tracks audience behavior. We use CTR as the primary dependent variable because it is
one of the most commonly used and important metrics to track the performance of online
advertising (Aribarg and Schwartz 2020; Johnson, Lewis and Nubbemeyer 2017; Melumad
and Meyer 2020).
The data we obtained include the display ad itself, platform type (desktop, tablet, or
smartphone), an advertiser and country identifier, and the accompanying ad caption. Table
1 contains an overview of all variables and their descriptions, and Table 2 summarizes the
actual data. Our observations are based on 622 ads (unique image-text combinations) of
hand-held consumer electronics products (e.g., USB sticks, wireless headphones) from 141
advertisers published across 58 countries, resulting in 2, 255 ad-platform-country combina-
tions (campaigns).
All ads were manually annotated by a research assistant who coded both (1) the image
23
Electronic copy available at: https://ssrn.com/abstract=3354415
type, namely, brand selfie, consumer selfie, and packshot, and (2) the location, namely, the
bounding box, of the product in the image. The display-ad dataset includes a high share
of brand selfies (72.68%) with 18.80% consumer selfies and 8.51% packshots. Note that
in consumer electronics advertisements with short-term transaction objectives, the product
itself is often more prominent than the brand logo and the brand is obviously mentioned in
the captions of all ads (see Web Appendix L for representative sample ads across the three
brand-image types).
We test the impact of the image archetypes on ad response by estimating a linear re-
gression with logit-transformed CTR as the primary dependent variable to account for CTR
being bound between 0 and 1. To control for advertiser heterogeneity and country-specific
effects, we include crossed random effects for advertiser and country. Additionally, we con-
trol for the platform fixed effects (mobile, tablet, or desktop), the number of impressions
per campaign, and a similar set of controls used in the Twitter and Instagram analyses (see
Table 2).
Table 5 reports the regression results. Consistent with the expressed-purchase-intention
results from the UGC datasets, brand selfies outperform consumer selfies in terms of CTR
(.12, p < .05). A post-estimation analysis reveals this finding translates into a sizable relative
CTR uplift of approximately 13% for brand selfies compared with consumer selfies. Although
brand selfies have higher CTRs than packshots, the difference is not statistically significant,
nor is the difference between consumer selfies and packshots (p-values > .05).
— Insert Table 5 about here —
The insignificant difference between packshots and the two selfie images is consistent with
the intermediate position of packshots in terms of self- and brand-related thoughts as well as
ads featuring unknown faces with lower levels of self-reference inhibition. More importantly,
the statistically significant difference between the two selfie images suggests effect sizes can
vary, but self-reference remains a useful theoretical model beyond social media posts and
(hedonic) fast moving consumer goods. In line with the social media data, brand selfies
24
Electronic copy available at: https://ssrn.com/abstract=3354415

are superior to consumer selfies, also when it comes to actual purchase-oriented behavior
as opposed to verbal expressions in user-generated comments. The field data and analyses
presented thus far are useful because of their external validity, the number of observations,
and the diversity in product categories, brands, and platforms.
However, we cannot rule out that potential selection effects may play a role. For the social
media data, the audience of more popular senders may be more interested in the sender than
in any visible brand. If popular senders are aware of this possibility, they may choose to post
more consumer-selfie images, which in turn are correlated with lower brand engagement due
to the popular sender face distracting from the brand. Similarly, display ads are selected
and optimized based on expected CTRs. We attempt to control for possible selection effects
in our models by including measures of sender popularity (number of followers) and sender
activity (e.g., number of posts, friends), and accounting for advertiser-level heterogeneity in
the display-ad analysis. To control for selection biases and other possible confounds more
comprehensively, we turn to an experimental setting with random assignment of image types
and minimal differentiation between images beyond the image type itself.
EXPERIMENTAL EVIDENCE ON THE CAUSAL EFFECT OF
IMAGE TYPE AND THE UNDERLYING MECHANISMS
In addition to the main objective of establishing causality, the experimental setting allows
us to collect conventional survey measures of self-reference and purchase intent and to study
the self-reference mechanism in more detail. With regard to purchase intent, our language
model-based approach achieved high levels of accuracy relative to human interpretation of
the comments. However, it can still contain measurement error in terms of actual behavioral
intentions. In particular, social media users may decide not to make brand-related comments
for reasons other than a lack of brand interest (e.g., choosing not to comment or respond
at all to other non-brand-related responses). To investigate whether a more direct measure
25
Electronic copy available at: https://ssrn.com/abstract=3354415

of purchase intent leads to different conclusions, we test the impact of image types on both
the text mining of the comments and a traditional direct survey-based measure of purchase
intent and compare the two approaches.
Method
Experimental design. We recruited N = 750 MTurkers (46% female, 53% male, 1% prefer
not to say; mean age: 39.6), who were randomly assigned to one of three between-subject
experimental conditions that we constructed based on Elder and Krishna (2012), adapted to
a social media context, and added the distinction between the two selfie types. Specifically,
we created three artificial stimuli of Instagram social media posts, showing a burger in a
consumer selfie, a brand selfie, or a packshot view, holding constant image size as well as
centrality and size of the burger in the image (see Figure 5). We selected the consumer
selfie based on a pretest (N = 420) of 14 alternative consumer-selfie images to ensure high
burger prominence and average sender attractiveness, to limit the possible effect of sender
prominence or attractiveness.
Consumer SelfieBrand Selfie Packshot
Introduction to Social Media Post: In the following, we will show you an actual social media post that we randomly selectedfor you. You will see a post of Kate. “I am a graphic designer and currently work remote from home. I try to enjoy the smallmoments in life :-)” Please imagine Kate is a good friend of yours and you are also friends on social media.
Figure 5: Controlled Stimuli for Lab Experiment
26
Electronic copy available at: https://ssrn.com/abstract=3354415

To measure brand prominence, we asked subjects to rate the subjective prominence of
the burger (“The burger on the image is very prominent,” 7-point scale). Across conditions,
the burger was perceived as comparable in prominence between the packshot and the brand-
selfie images (MBrand Selfie = 6.15, MPackshot = 5.98, p = .12), but significantly lower for the
consumer selfie (MConsumer Selfie = 5.83, p < .05). In line with theory, the lower product
prominence for the consumer selfie may suggest a face being present diverts attention away
from the brand even when the actual position and size of the product remains identical.
Procedure. Respondents first indicated their level of social media activity in general and
their usage of different social media platforms. To mimic actual behavior on social media,
we created an Instagram online environment and showed participants a short simulation of
unrelated Instagram posts asking them to imagine how they use their social media accounts.
Respondents who failed an attention check asking them about the platform they had just
seen were not permitted to participate. To simulate a minimum level of connection with the
(unknown) sender, we provided personal details about the persona of the post.
Subjects were then randomly assigned to one of the three between-subjects experimental
conditions and were asked an open ended question to write a comment they would make
to this post (see Figure 5). Afterwards, respondents were asked how likely they were to
actually like and respond to the post. They then rated, using a three-item scale (Escalas
2007), their likelihood of purchasing the burger, all on 7-point scales (Cronbach’s alpha =
.96, see Web Appendix M). Next, subjects rated self-reference on a five-item 7-point scale
(Escalas 2007; Meyers-Levy and Peracchio 1996), resulting in a Cronbach’s alpha of .94. We
compute the averages of both the purchase intent and self-reference scales as our measures
of these constructs. The study concluded with control measures on perceived prominence of
and attention to the burger, typical fast food consumption, as well as demographics includ-
ing the dominant hand of the respondent. Web Appendix M contains a full overview of all
questions, operationalizations, and mean values.
27
Electronic copy available at: https://ssrn.com/abstract=3354415

Results
Main effects. Presumably due to the artificial setting and the difficulty of mimicking social
response to an unfamiliar sender in a lab setting (Eckles, Karrer and Ugander 2017), both
the likelihood of liking (ranging from MPackshot = 4.61 to MBrand Selfie = 4.94, p = .16) and
commenting (ranging from MPackshot = 3.68 to MBrand Selfie = 4.03, p = .12) do not differ
significantly between experimental conditions. Thus, we find sender engagement activity
does not replicate what we observe in the field.
More importantly, consistent with the field data, we find stated purchase intent is highest
for the brand-selfie image and significantly different from both the consumer-selfie image
(MBrand Selfie = 5.21, MConsumer Selfie = 4.81, p < .05) and the packshot image (MPackshot =
4.65, p < .05), the latter replicating Elder and Krishna (2012). This finding is in line with the
predictions based on self-reference theory and our previous findings on social media purchase
intent. However, we do not find statistically significant differences in purchase intent between
the packshot and consumer-selfie images (p = .35), possibly because the visible sender in the
experiment was a stranger to experimental subjects.
To investigate the relationship between image type and stated purchase intent, controlling
for category interest and social media familiarity, we run a multiple regression with brand
selfie and packshot as dummy variables (consumer selfie as reference category), controlling for
the amount of fast food consumption, overall social media activity, and the dominant hand of
experimental subjects. Findings are consistent with the mean comparison (βBrand Selfie = .35,
p < .05; βPackshot = −.20, p = .21). The difference between brand selfies and packshot is also
statistically significant (p < .01).
Validation of the purchase-intention classifier. To investigate the validity of the purchase-
intention classifier used in the social media analyses, we apply the same language model to
the comments of the experimental subjects and compare it with the corresponding stated
purchase intention. Out of 163 purchase intents predicted by the language model, only 9
28
Electronic copy available at: https://ssrn.com/abstract=3354415

(5.5%) did not have a purchase intent above the scale midpoint (precision of 94.5%). Sim-
ilarly, the mean purchase likelihood is substantially and significantly higher for comments
that were detected as having purchase intent versus comments that do not contain intent
(MPurchaseIntentY es = 6.17, MPurchaseIntentNo = 4.48, p < .01), suggesting our previous mea-
sure of social media purchase intentions is consistent with conventional self-reported ratings.
Self-reference as an underlying mechanism. We perform a mediation analysis on both
brand-image dummy variables with consumer selfies as the reference category to examine the
psychological mechanism behind the influence of image types on purchase intent. Compared
with the consumer-selfie image, the brand-selfie condition elicits significantly higher degrees
of self-reference (βBrand Selfie = .51, p < .01). Similarly, the brand-selfie condition elicits
significantly higher self-reference than the packshot (p < .01). In line with the purchase-
intent findings, the difference between packshots and consumer selfies is not statistically
significant (p = .84). Again, the fact that subjects were not familiar with the face of the
sender, which resulted in fewer other-related experiences coming to mind, may have played
a role.
Higher self-reference, in turn, leads to a higher likelihood of buying (βSelf Reference = .95,
p < .01). In addition, when controlling for self-reference, the direct effects of both image
types on the likelihood of buying are reduced and are not statistically significant (βBrand Selfie = −.09,
p = .38; βPackshot = −.13, p = .21), suggesting the impact of brand-image perspectives is me-
diated by self-reference (see Web Appendix N for full details of the mediation analysis). The
statistical test based on 1, 000 bootstrapping iterations to obtain standard errors for the (non-
normal) indirect effect of brand selfies (Preacher and Hayes 2008) also indicates mediation
(CI [.22; .75]; p < .01). A Wald test on the path coefficients further confirms the total effects
of brand selfies are also statistically different from the effects of packshots (Chi(1) = 13.8;
p < .01). Adding self-reports of attention to the burger to the regression (βAttention = .09,
p < .05), does not change our results significantly, suggesting self-reference drives purchase
interest over and above mere attention.
29
Electronic copy available at: https://ssrn.com/abstract=3354415

Overall, compared with brand selfies, consumer selfies and packshots appear less effec-
tive in stimulating self-referent thoughts of consuming the product. These lower self-brand
connections result in lower levels of brand engagement in terms of purchase intentions.
Discussion
The findings of the experiment add to the previous field evidence in two important ways.
First, they suggest that the differences in observers’ reactions to brand selfies versus con-
sumer selfies and packshots are not due to selection effects but remain robust under random
assignment. When holding image composition as well as sender characteristics and captions
constant, we still find brand selfies result in higher levels of purchase likelihood than pack-
shots and consumer selfies. Theoretically, communication intent is lower when the sender of
the images is a stranger to respondents. This fact might have inhibited actual social motives
with regard to likes and comments and may also have made the packshot and consumer selfie
more comparable in terms of self-reference and purchase intent in the experimental setting
relative to the field data.
Second, we find evidence of self-reference mediating the impact of selfie images on brand
engagement. This indirect effect is directionally robust to alternative dependent variables
(purchase-intent rating as well as inferred from social media comments). The consistency
between purchase-intent ratings and intentions extracted from comments provide further
evidence that public social media comments are useful to study brand engagement.
To relate to the self-reference literature, the design of this experiment was based on prior
studies of Elder and Krishna (2012) that were unrelated to branding, which resulted in a
presentation of a product without a dominant brand logo and a clean background, which
may be less typical of social media images. We conducted another experiment that allows us
to investigate whether these limitations matter, also testing another product category. More
closely following the actual field data, this experiment involved a bottle with a big logo of
an unknown Aloe Vera drink and a realistic background (see Web Appendix O). The rest
30
Electronic copy available at: https://ssrn.com/abstract=3354415
of the experimental design is identical to the above reported experiment with N=450 exper-
imental subjects being randomly assigned to the three experimental conditions. We again
find purchase intentions are higher for the brand-selfie than for the consumer-selfie condition
(MBrand Selfie = 3.99, MConsumer Selfie = 3.47, p < .05), with self-reference fully mediating the
effect (βSelf Reference = .08, p < .01, CI [.07; .10]). Although the differences with packshots
were directionally similar but insignificant, the pattern for the two selfie images is consistent
regarding both brand engagement and self-reference across the two experiments.
CONCLUSION
Social media activities have become an essential component of the marketing mix, with
investments totaling 90 billion USD per year and likes being considered a “badge of honor”
for social media marketing (Colicev 2021, p. 2). This paper investigates and structures the
wealth of user-generated brand imagery. Employing transfer-learning algorithms for visual
UGC, we identify three types of brand images: consumer selfies, brand selfies, and packshots.
In our discussions with practitioners, this mere taxonomy of splitting social media images
into the two selfie types and packshots was considered valuable, with our identification of a
new branding social media phenomenon—brand selfies, being particularly useful.
Across multiple analyses and data sources involving two different social media platforms,
a display-advertising platform, and controlled lab experiments, we consistently find images
from consumers taking a selfie of the brand itself (brand selfies) are most effective at promot-
ing brand engagement. We measured brand engagement via text mining of user-generated
text comments, CTRs on display ads, and survey-based stated purchase intentions (see Fig-
ure 2 for a summary). Using mediation analysis, we show these findings are consistent with
self-reference theory, that is, image cues triggering mental simulation of brand encounters.
The number of likes that social media marketing often attends to as a measure of engage-
ment paints a different picture. Consistent with previous findings that faces are especially
engaging on social media (Li and Xie 2020), we find consumer selfies generate the highest
31
Electronic copy available at: https://ssrn.com/abstract=3354415

levels of sender engagement in terms of likes. However, because faces trigger interpersonal
communication as opposed to mental simulations of brand consumption (To and Patrick
2020), these sender-directed communications do not translate into actual brand interest.
Specifically, a post-estimation analysis using the models reported in Table 3 reveals con-
sumer selfies obtain 49% (28%) more likes than brand selfies on Twitter (Instagram), but
by contrast, brand selfies receive 78% (70%) more expressed purchase intentions. Hence,
we encourage social media marketers to go beyond the easy-to-collect measures of counting
likes and comments and employ text-analysis methods, similar to the ones we propose in
this paper, to construct measures of actual brand engagement.
Practical Implications
Several firms launched campaigns to encourage consumers to take consumer selfies (e.g., Lay’s
packaging, Coke selfie bottle; see also Web Appendix A), whereas we could not find a single
social media campaign explicitly encouraging brand selfies. Depending on the brand objec-
tives, social media marketing may benefit from revised strategies that stimulate images of
products in use from a first-person perspective. Campaigns such as the marketing challenges
by Starbucks’ #redcupcontest or Corona beer’s #findyourbeach are not directly geared at
brand selfies but did result in various consumer-generated images that center around the
brand as opposed to consumer faces. For example, the #redcupcontest has resulted in more
than 50% more brand-selfie posts on Instagram relative to the proportion of brand selfies in
our sample of 185 brands. Similar to the Lay’s packaging that encourages consumer selfies,
firms could even explore package designs to promote brand selfies and stimulate consumers
to show the product in their hand (see Web Appendix P for examples of such designs).
Descriptively, we found three times more brand-selfie than consumer-selfie images on
Twitter and about twice as many on Instagram (see Table 2). Apparently, consumers are
more inclined to post brand selfies than consumer selfies. This finding suggests brand-selfie
campaigns may achieve both more image posts and higher brand engagement by observers
32
Electronic copy available at: https://ssrn.com/abstract=3354415

for each of these posts. However, we do caution that brand-selfie campaigns may not be in
line with consumers’ own objectives to generate high level of reactions in terms of likes and
comments to their UGC on social media, because our analysis demonstrates that consumer
selfies results in more likes and comments than brand selfies. Thus, the firm objective to
garner brand engagement and the sender objective to generate reach and sender engagement
may not be aligned. Accordingly, social media marketers may have to adequately incentivize
consumers to participate and act in line with firm’s objectives.
To single out the effect of image type on engagement, in all of our analyses, we controlled
for differences in image composition (either with covariates or by means of experimental
manipulation) and found an impact of brand selfies on brand engagement above and beyond
a host of controls for alternative explanations such as logo size and centrality. Hence, the
effect of subjective brand-image perspectives and objective logo salience are additive rather
than substitutive. However, from a managerial perspective, consumer posts of brand selfies
are likely to contain larger brand logos at more central positions simply due to physical
constraints. Thus, brand-selfie images likely generate even higher total effects of brand
engagement than evidenced by our controlled analysis.
Brands are often interested in social media brand tracking (“social listening”; Liu, Dzyabura
and Mizik 2020). Our work belongs to the very limited but rapidly growing interest in au-
tomated image analysis in marketing (Dzyabura and Peres 2021; Liu, Dzyabura and Mizik
2020). Tracking visual brand appearances is a natural complement to text tracking. Un-
like text tracking, image tracking does not suffer from issues such as misspellings, brand
homonyms (e.g., Corona), or missing out on relevant brand-logo appearances. Commercial
services exist that detect logos on images as well as their position. However, we demon-
strate that simply counting logo appearances may not adequately capture what is relevant
to consumers. The context in which a brand appears (e.g., with a face or a hand) matters.
Combinations of deep-learning-based image classification, (interpretable) machine learning,
and language-model-based text mining can help to reliably identify which brand appearances
33
Electronic copy available at: https://ssrn.com/abstract=3354415

matter to consumers and which are most likely to result in valuable brand engagement.
Theoretical Implications
From a theoretical point of view, our multi-method approach provides field evidence based
on large-scale social media data that self-reference has important effects outside of the lab
context. The experimental evidence and net self-thought measure inferred from social media
comments suggest consumer selfies inhibit self-related thoughts. Future research may wish
to study the underlying psychological mechanisms in more detail. Specifically, consumer
selfies have not been the center of attention in self-reference research, due to the focus on
advertising, where predictions related to unknown sender faces are not clear. With the
growing importance of social media, differences between selfie images appear a promising
area for self-reference research to explore (e.g., Babin and Burns 1997).
Of course, this research has limitations. Most importantly, the observational data on
social media and advertising could not fully control for potential selection effects. That
is, senders with different types of audiences may post different mixes of image types. Two
controlled lab experiments suggest selection effects are not the main driver behind the brand-
engagement differences. However, we caution that self-selection may still have played a role
in the observational data. Future research that focuses on senders with a large number of
posts may permit studying self-selection by looking at the variation of image types within a
sender, hence controlling for the sender’s audience. Our dataset included a limited number
of posts per sender and did not permit such within-sender analyses.
Further research might also elaborate on the sender’s perspective, the motivations of
sharing product-related content, and its impact on subsequent sender behavior. For example,
Grewal, Stephen and Coleman (2019) suggests conditions under which posting identity-
relevant content can inhibit subsequent purchase intentions. Additionally, if brand images
are taken during consumption, they might influence the sender’s enjoyment of the experience
itself (e.g., Barasch, Zauberman and Diehl 2018). Because the downstream consequences can
34
Electronic copy available at: https://ssrn.com/abstract=3354415

be noteworthy, an investigation into sender motivations and their choice of brand-image types
appears promising.
In terms of multimedia content, our typology of brand images is conceptually applicable
to video content and augmented reality contexts as well (e.g., Petit, Javornik and Velasco
2021). Conceivably, the difference in perspectives (participant vs. observer) plays an even
stronger role in moving images, because brand-related mental simulation may be stimulated
more effectively. In addition, videos and the types of image carousels that social media
increasingly features allow changing perspectives across (moving) images. Our (static) im-
ages had only a single perspective per post; thus, we could not study potential dynamics of
changing perspectives. Videos or image carousels might attain the best of both worlds, that
is, engage with visible faces while also triggering brand-related self-reference with subsequent
ego perspectives.
Lastly, we focused on 185 brands across 10 hand-held beverage and food product cat-
egories. Selfie effects (brand selfie vs. consumer selfie) were consistent between beverages
and food products and also replicated for display ads in a utilitarian domain (hand-held
consumer electronics), suggesting self-reference is a useful theory with broad applications.
An exploration of whether these findings generalize beyond that domain would be interesting
(e.g., beauty products for which the model’s face is essential to illustrate product benefits
or digital services made tangible by a smartphone display).
In sum, this paper provides a first step toward exploring the plethora of user-generated
brand imagery posted on social media. We demonstrate the value of identifying relevant
brand-image types and their respective impact on consumer behavior. Selfies are here to
stay as a cultural phenomenon and a prevalent component of social media, but they are also
a matter of perspective. We still have much to learn about how seeing brands through the
eyes of others relates to information processing and how self-reference drives brand perception
and brand engagement. We hope our work stimulates further research on the relationships
between brand selfies and brand success.
35
Electronic copy available at: https://ssrn.com/abstract=3354415

References
Adams, Peter (2019), “Lay’s Selfie-Focused ’Smiles’ Campaign Returns, Building on Suc-cess of 1st Run,” (accessed 2021-02-18), https://www.marketingdive.com/news/lays-selfie-focused-smiles-campaign-returns-building-on-success-of-1st/558953/.
Akpinar, Ezgi and Jonah Berger (2017), “Valuable Virality,” Journal of Marketing Research,54 (2), 318–330.
Aribarg, Anocha and Eric M. Schwartz (2020), “Native Advertising in Online News: Trade-offs between Clicks and Brand Recognition,” Journal of Marketing Research, 57 (1), 20–34.
Babin, Laurie A. and Alvin C. Burns (1997), “Effects of Print Ad Pictures and Copy Con-taining Instructions to Imagine on Mental Imagery that Mediates Attitudes,” Journal ofAdvertising, 26 (3), 33–44.
Bakhshi, Saeideh, David A. Shamma and Eric Gilbert (2014), “Faces Engage Us: Photoswith Faces Attract More Likes and Comments on Instagram,” in Proceedings of the ACMConference on Human Factors in Computing Systems, Toronto, Canada: ACM, 965–974.
Barasch, Alixandra, Gal Zauberman and Kristin Diehl (2018), “How the Intention to ShareCan Undermine Enjoyment: Photo-Taking Goals and Evaluation of Experiences,” Journalof Consumer Research, 44 (6), 1220–1237.
Bower, Gordon H. and Stephen G. Gilligan (1979), “Remembering Information Related toOne’s Self,” Journal of Research in Personality, 13 (4), 420–432.
Burnkrant, Robert E. and H. Rao Unnava (1995), “Effects of Self-Referencing on Persua-sion,” Journal of Consumer Research, 22 (1), 17–26.
Chevalier, Judith A. and Dina Mayzlin (2006), “The Effect of Word of Mouth on Sales:Online Book Reviews,” Journal of Marketing Research, 43 (3), 345–354.
Chung, Jaeyean, Gita Johar, Yanyan Li, Oded Netzer and Matthew Pearson (2021), “MiningConsumer Minds: Downstream Consequences of Host Motivations for Home Sharing Plat-forms,” Journal of Consumer Research, forthcoming https://doi.org/10.1093/jcr/ucab034.
Chung, Joon S., Andrew Senior, Oriol Vinyals and Andrew Zisserman (2017), “Lip ReadingSentences in the Wild,” in Proceedings of the IEEE Conference on Computer Vision andPattern Recognition, Honolulu, HI: IEEE, 3444–3453.
Colicev, Anatoli (2021), “The Real Value of Facebook Likes,” (accessed 2021-02-18),https://www.ama.org/2021/01/26/the-real-value-of-facebook-likes/.
Colicev, Anatoli, Ashwin Malshe, Koen Pauwels and Peter O’Connor (2018), “ImprovingConsumer Mindset Metrics and Shareholder Value Through Social Media: The DifferentRoles of Owned and Earned Media,” Journal of Marketing, 82 (1), 37–56.
Debevec, Kathleen and Jean B. Romeo (1992), “Self-Referent Processing in Perceptions ofVerbal and Visual Commercial Information,” Journal of Consumer Psychology, 1 (1), 83–102.
Deng, Jia, Wei Dong, Richard Socher, Li-Jia Li, Kai Li and Li Fei-Fei (2009), “ImageNet:A Large-Scale Hierarchical Image Database,” in Proceedings of the IEEE Conference onComputer Vision and Pattern Recognition, Miami, FL: IEEE, 2–9.
36
Electronic copy available at: https://ssrn.com/abstract=3354415

Dzyabura, Daria and Renana Peres (2021), “Visual Elicitation of Brand Perception,” Journalof Marketing, forthcoming https://doi.org/10.1177/0022242921996661.
Eckles, Dean, Brian Karrer and Johan Ugander (2017), “Design and Analysis of Experimentsin Networks: Reducing Bias from Interference,” Journal of Causal Inference, 5 (1).
Elder, Ryan S. and Aradhna Krishna (2012), “The ’Visual Depiction Effect’ in Advertis-ing: Facilitating Embodied Mental Simulation Through Product Orientation,” Journal ofConsumer Research, 38 (6), 988–1003.
Elder, Ryan S. and Aradhna Krishna (2021), “A Review of Sensory Imageryfor Consumer Psychology,” Journal of Consumer Psychology, forthcominghttps://doi.org/10.1002/jcpy.1242.
Escalas, Jennifer Edson (2007), “Self-Referencing and Persuasion: Narrative TransportationVersus Analytical Elaboration,” Journal of Consumer Research, 33 (4), 421–429.
Feehan, Blair (2021), “2021 Social Media Industry Benchmark Report,” (accessed 2021-02-17), https://www.rivaliq.com/blog/social-media-industry-benchmark-report/title-all-industry.
Glum, Julia (2015), “Millennials Selfies: Young Adults Will Take More Than25,000 Pictures of Themselves During Their Lifetimes: Report,” (accessed 2019-02-06), https://www.ibtimes.com/millennials-selfies-young-adults-will-take-more-25000-pictures-themselves-during-2108417.
Godes, David and Dina Mayzlin (2004), “Using Online Conversations to Study Word-of-Mouth Communication,” Marketing Science, 23 (4), 545–560.
Grewal, Lauren, Andrew T. Stephen and Nicole V. Coleman (2019), “When Posting AboutProducts on Social Media Backfires: The Negative Effects of Consumer Identity Signalingon Product Interest,” Journal of Marketing Research, 56 (2), 197–210.
Grewal, Rajdeep, Sachin Gupta and Rebecca Hamilton (2020), “The Journal of MarketingResearch Today: Spanning the Domains of Marketing Scholarship,” Journal of MarketingResearch, 57 (6), 985–998.
Guido, Gianluigi, Marco Pichierri and Giovanni Pino (2018), “Effects of Face Images andFace Pareidolia on Consumers’ Responses to Print Advertising: An Empirical Investiga-tion,” Journal of Advertising Research, 58 (3), 1–13.
Hartmann, Jochen, Juliana Huppertz, Christina Schamp and Mark Heitmann (2019), “Com-paring Automated Text Classification Methods,” International Journal of Research inMarketing, 36 (1), 20–38.
Herhausen, Dennis, Stephan Ludwig, Dhruv Grewal, Jochen Wulf and Marcus Schoegel(2019), “Detecting, Preventing, and Mitigating Online Firestorms in Brand Communities,”Journal of Marketing, 83 (3), 1–21.
Hughes, Christian, Vanitha Swaminathan and Gillian Brooks (2019), “Driving Brand En-gagement Through Online Social Influencers: An Empirical Investigation of SponsoredBlogging Campaigns,” Journal of Marketing, 83 (5), 78–96.
Instagram (2021), “SmileWithLays,” (accessed 2021-02-18),https://www.instagram.com/explore/tags/smilewithlays/.
37
Electronic copy available at: https://ssrn.com/abstract=3354415

John, Leslie K., Oliver Emrich, Sunil Gupta and Michael I. Norton (2017), “Does ”Lik-ing” Lead to Loving? The Impact of Joining a Brand’s Social Network on MarketingOutcomes,” Journal of Marketing Research, 54 (1), 144–155.
Johnson, Garrett, Randall A. Lewis and Elmar Nubbemeyer (2017), “Ghost Ads: Improvingthe Economics of Measuring Online Ad Effectiveness,” Journal of Marketing Research, 54(6), 867–884.
Kane, Gerald and Alexandra Pear (2016), “The Rise of Visual Content Online,” (accessed2020-06-26), http://sloanreview.mit.edu/article/the-rise-of-visual-content-online/.
Li, Yiyi and Ying Xie (2020), “Is a Picture Worth a Thousand Words? An Empirical Studyof Imagery Content and Social Media Engagement,” Journal of Marketing Research, 57(1), 1–19.
Liu, Liu, Daria Dzyabura and Natalie Mizik (2020), “Visual Listening In: Extracting BrandImage Portrayed on Social Media,” Marketing Science, 39 (4), 669–686.
Liu, Yinhan, Myle Ott, Naman Goyal, Jingfei Du, Mandar Joshi, Danqi Chen, Omer Levy,Mike Lewis, Luke Zettlemoyer and Veselin Stoyanov (2019), “RoBERTa: A RobustlyOptimized BERT Pretraining Approach,” arXiv, https://arxiv.org/abs/1907.11692.
Liu, Yong (2006), “Word of Mouth for Movies: Its Dynamics and Impact on Box OfficeRevenue,” Journal of Marketing, 70 (3), 74–89.
Mallipeddi, Rakesh R., Ramkumar Janakiraman, Subodha Kumar and Seema Gupta (2021),“The Effects of Social Media Content Created by Human Brands on Engagement: Evi-dence from Indian General Election 2014,” Information Systems Research, 32 (1), 212–237.
Manning, Christopher D., Kevin Clark, John Hewitt, Urvashi Khandelwal and Omer Levy(2020), “Emergent Linguistic Structure in Artificial Neural Networks Trained by Self-Supervision,” Proceedings of the National Academy of Sciences, 117 (48), 30046–30054.
McFerran, Brent, Darren W. Dahl, Gerald J. Gorn and Heather Honea (2010), “Motiva-tional Determinants of Transportation into Marketing Narratives,” Journal of ConsumerPsychology, 20 (3), 306–316.
Meeker, Mary (2016), “Internet Trends 2016,” (accessed 2019-01-12),https://www.kleinerperkins.com/perspectives/2016-internet-trends-report.
Melumad, Shiri and Robert Meyer (2020), “Full Disclosure: How Smartphones EnhanceConsumer Self-Disclosure,” Journal of Marketing, 84 (3), 28–45.
Meyers-Levy, Joan and Laura A Peracchio (1996), “Moderators of the Impact of Self-Reference on Persuasion,” Journal of Consumer Research, 22 (4), 408–423.
Moe, Wendy W. and David A. Schweidel (2017), “Opportunities for Innovation in SocialMedia Analytics,” Journal of Product Innovation Management, 34 (5), 697–702.
Moe, Wendy W., Oded Netzer and David A. Schweidel (2017), “Social Media Analytics,”in Handbook of Marketing Decision Models , B.Wierenga, ed. New York, NY: Springer,483–504.
Netzer, Oded, Ronen Feldman, Jacob Goldenberg and Moshe Fresko (2012), “Mine YourOwn Business: Market-Structure Surveillance Through Text Mining,” Marketing Science,31 (3), 521–543.
38
Electronic copy available at: https://ssrn.com/abstract=3354415

Ordenes, Francisco V., Dhruv Grewal, Stephan Ludwig, Ko De Ruyter, Dominik Mahr andMartin Wetzels (2019), “Cutting Through Content Clutter: How Speech and Image ActsDrive Consumer Sharing of Social Media Brand Messages,” Journal of Consumer Research,45 (5), 988–1012.
Pendlebury, Ty (2016), “Coke Invents the ’Selfie Bottle’,” (accessed 2020-06-30),https://www.cnet.com/news/coke-invents-bottle-selfie-camera/.
Pennebaker, James W., Ryan L. Boyd, Kayla Jordan and Kate Blackburn (2015), TheDevelopment and Psychometric Properties of LIWC2015, Austin, TX: University of Texasat Austin.
Petit, Olivia, Ana Javornik and Carlos Velasco (2021), “We Eat First with Our (Digital)Eyes: Enhancing Mental Simulation of Eating Experiences via Visual-Enabling Technolo-gies,” Journal of Retailing, forthcoming https://doi.org/10.1016/j.jretai.2021.04.003.
Preacher, Kristopher J. and Andrew F. Hayes (2008), “Asymptotic and Resampling Strate-gies for Assessing and Comparing Indirect Effects in Multiple Mediator Models,” BehaviorResearch Methods, 40 (3), 879–891.
Rai, Arun (2020), “Explainable AI: From Black Box to Glass Box,” Journal of the Academyof Marketing Science, 48 (1), 137–141.
Ribeiro, Marco Tulio, Sameer Singh and Carlos Guestrin (2016), “”Why Should I TrustYou?” Explaining the Predictions of Any Classifier,” in Proceedings of the ACM SIGKDDInternational Conference on Knowledge Discovery and Data Mining San Francisco, USACM, 1135–1144.
Schweidel, David A. and Wendy W. Moe (2014), “Listening In on Social Media: A JointModel of Sentiment and Venue Format Choice,” Journal of Marketing Research, 51(4), 387–402.
Selvaraju, Ramprasaath R., Michael Cogswell, Abhishek Das, Ramakrishna Vedantam, DeviParikh and Dhruv Batra (2017), “Grad-CAM: Visual Explanations from Deep Networksvia Gradient-Based Localization,” in Proceedings of the IEEE International Conferenceon Computer Vision, Venice, Italy: IEEE, 618–626.
Sheldon, Pavica and Katherine Bryant (2016), “Instagram: Motives for Its Use and Rela-tionship to Narcissism and Contextual Age,” Computers in Human Behavior, 58, 89–97.
Simonyan, Karen and Andrew Zisserman (2014), “Very Deep Convolutional Networks forLarge-Scale Image Recognition,” arXiv, http://arxiv.org/abs/1409.1556.
Statista (2020), “Most Popular Social Networks Worldwide as of April 2020,” (ac-cessed 2020-06-26), https://www.statista.com/statistics/272014/global-social-networks-ranked-by-number-of-users/.
Statista (2021), “Most Popular Social Networks Worldwide as of January 2021,Ranked by Number of Active Users (in Millions),” (accessed 2021-02-17),https://www.statista.com/statistics/272014/global-social-networks-ranked-by-number-of-users/.
Symons, Cynthia S. and Blair T. Johnson (1997), “The Self-Reference Effect in Memory: AMeta-Analysis,” Psychological Bulletin, 121 (3), 371–394.
39
Electronic copy available at: https://ssrn.com/abstract=3354415

Timoshenko, Artem and John R. Hauser (2019), “Identifying Customer Needs from User-Generated Content,” Marketing Science, 38 (1), 1–20.
Tirunillai, Seshadri and Gerard J. Tellis (2014), “Mining Marketing Meaning from OnlineChatter: Strategic Brand Analysis of Big Data Using Latent Dirichlet Allocation,” Journalof Marketing Research, 51 (4), 463–479.
To, Rita Ngoc and Vanessa M Patrick (2020), “How the Eyes Connect to the Heart: TheInfluence of Eye Gaze Direction on Advertising Effectiveness,” Journal of Consumer Re-search, forthcoming https://doi.org/10.1093/jcr/ucaa063.
Vicinitas (2018), “2018 Research on 100 Million Tweets: What It Means for Your Social Me-dia Strategy for Twitter,” (accessed 2019-02-12), https://www.vicinitas.io/blog/twitter-social-media-strategy-2018-research-100-million-tweets.
Xiao, Li and Min Ding (2014), “Just the Faces: Exploring the Effects of Facial Features inPrint Advertising,” Marketing Science, 33 (3), 338–352.
Yosinski, Jason, Jeff Clune, Yoshua Bengio and Hod Lipson (2014), “How Transferable AreFeatures in Deep Neural Networks?” in Proceedings of the International Conference onNeural Information Processing Systems, Montreal, Canada: ACM, 3320–3328.
Zhang, Mengxia and Lan Luo (2021), “Can Consumer-Posted Photos Serve as a Lead-ing Indicator of Restaurant Survival? Evidence from Yelp,” SSRN, (Working Paper,https://dx.doi.org/10.2139/ssrn.3108288).
Zhang, Shunyuan, Dokyun Lee, Param Vir Singh and Kannan Srinivasan (2018), “How MuchIs an Image Worth? Airbnb Property Demand Analytics Leveraging a Scalable Image Clas-sification Algorithm,” SSRN, (Working Paper, https://dx.doi.org/10.2139/ssrn.2976021).
Zhao, Min, Steve Hoeffler and Gal Zauberman (2011), “Mental Simulation and Product Eval-uation: The Affective and Cognitive Dimensions of Process Versus Outcome Simulation,”Journal of Marketing Research, 48 (5), 827–839.
40
Electronic copy available at: https://ssrn.com/abstract=3354415

TABLES
Table 1: Variable Overview for Field Data
Variable Description
Dependent VariablesLikes Number of likes per postComments Number of comments per postPurchase Intentions Number of comments expressing a purchase intention (e.g., “WANT!! Where did you get that?”)Net Self-Thoughts Difference between share of self- (“I”, “myself”) and other-related (“you”, “she”) words (LIWC)Click-Through Rate (CTR) Number of clicks divided by number of impressions per observation
Brand-Image TypeBrand Selfie Branded products held by an invisible consumerConsumer Selfie Visible consumer faces together with a branded productPackshot Standalone image of branded products
Image CharacteristicsLogo Size Percentage share of brand logo area of total image resolution (height × width)Logo Centrality 1 − Euclidean distance between brand logo midpoint and image center, scaled by image diagonalVisual Complexity Image file size (in bytes) divided by image resolution (log-transformed)Visual Complexity2 Quadratic term of Visual Complexity variableBrightness Average value across all image pixels (from HSV color representation model)Brightness Contrast Standard deviation of value across all image pixels
Post CharacteristicsNumber of Words Word count in sender caption (log-transformed)Number of Hashtags Number of hashtags (#) in sender caption (log-transformed)Number of Handletags Number of handletags (@) in sender caption (log-transformed)Branded Caption Sender caption contains brand name (Yes/No)Branded Tag Sender caption contains brand name as a hash- or handletag (Yes/No)Ad Tag Sender caption contains hashtag that includes “ad” or “sponsor” referenceFirst-Person Pronoun Sender caption written in first-person singular (Yes/No, LIWC)Second-Person Pronoun Sender caption written in second-person singular or plural (Yes/No, LIWC)Question Word Share Share of question words in sender caption (LIWC)Netspeak Word Share Share of informal words (esp., Internet abbreviations) in sender caption (LIWC)Caption Sentiment Predicted text valence (positive, negative, neutral) using fine-tuned language model, i.e., RoBERTaPost Age Difference in years between post date and current date
Sender CharacteristicsUnique Sender Sender appears only once in data sample (Yes/No)Number of Posts Number of posts sent by sender (log-transformed)Number of Friends Number of friends (i.e., outbound connections) of sender (log-transformed)Number of Followers Number of followers (i.e., inbound connections) of sender (log-transformed)
Platform CharacteristicsPlatform Device on which display ad is presented (desktop, tablet, or smartphone)Number of Impressions Number of impressions (in million)
41
Electronic copy available at: https://ssrn.com/abstract=3354415

Table 2: Summary Statistics of Field Data
Twitter Instagram Display Ads
Variable Mean SD Mean SD Mean SD
Dependent VariablesLikes 5.06 233.79 255.33 4,380.30 - -Comments .43 7.00 9.85 65.53 - -Purchase Intentions .02 .15 .51 2.72 - -
Brand-Image TypeBrand Selfiea 28.73 - 19.63 - 72.68 -Consumer Selfiea 7.93 - 11.57 - 18.80 -Packshota 63.35 - 68.80 - 8.51 -
Image CharacteristicsLogo Size .12 .14 .07 .10 .33 .21Logo Centrality .63 .23 .63 .19 .81 .14Visual Complexity -1.96 .43 -2.09 .55 -1.40 .94Brightness .51 .15 .56 .13 .60 .13Brightness Contrast .25 .05 .26 .05 .24 .05
Post CharacteristicsNumber of Words 2.20 .55 3.24 .82 2.29 .22Number of Hashtags .39 .59 2.29 .92 - -Number of Handletags .23 .39 .25 .47 - -Branded Captiona 6.23 - 12.10 - - -Branded Taga 13.02 - 61.65 - - -Ad Taga .35 - 2.35 - - -First-Person Pronouna 35.66 - 28.97 - .13 -Second-Person Pronouna 14.59 - 16.79 - 35.25 -Question Word Share .01 .04 .01 .03 .01 .03Netspeak Word Share .02 .06 .01 .03 .00 .01Positive Sentimenta 42.43 - 50.84 - 6.12 -Neutral Sentimenta 46.25 - 45.24 - 92.73 -Negative Sentimenta 11.32 - 3.92 - 1.15 -Post Age 5.04 .64 2.39 1.48 - -
Sender CharacteristicsUnique Sendera,b 90.45 - 90.28 - -Number of Posts 9.00 1.78 6.09 1.41 - -Number of Friends 6.09 1.22 6.18 1.38 - -Number of Followers 6.30 1.62 6.80 1.81 - -
Platform CharacteristicsDesktop Computer - - - - 37.47 -Mobile - - - - 51.49 -Tablet - - - - 11.04 -
N 214,563 43,585 2,255
Notes: a. indicates discrete variables, for which ”Mean” column contains class shares (in %).b. relates to total number of senders: N=187,980 for Twitter and N=35,316 for Instagram.
42
Electronic copy available at: https://ssrn.com/abstract=3354415

Table 3: Regression Results for Twitter and Instagram: Likes, Comments, Purchase Intentions
Twitter Instagram
Likes Comments Purchase Intentions Likes Comments Purchase Intentions
Brand-Image TypeConsumer Selfie (Baseline)Brand Selfie −.40∗∗∗‡ (.02) −.01‡ (.02) .57∗∗∗‡ (.10) −.25∗∗∗ (.01) −.17∗∗∗‡ (.02) .53∗∗∗‡ (.05)Packshot −.48∗∗∗‡ (.02) −.08∗∗∗‡ (.02) .42∗∗∗‡ (.09) −.26∗∗∗ (.01) −.22∗∗∗‡ (.02) .40∗∗∗‡ (.04)
Image CharacteristicsLogo Size −.45∗∗∗ (.03) −.20∗∗∗ (.04) .24 (.15) −.55∗∗∗ (.04) −.34∗∗∗ (.07) .37∗∗∗ (.14)Logo Centrality −.12∗∗∗ (.02) −.01 (.03) .50∗∗∗ (.11) −.11∗∗∗ (.02) −.02 (.03) −.05 (.07)Visual Complexity .22∗∗∗ (.01) .37∗∗∗ (.01) .31∗∗∗ (.07) .08∗∗∗ (.01) .13∗∗∗ (.01) .24∗∗∗ (.03)Visual Complexity2 .08∗∗∗ (.01) .03∗∗ (.02) −1.36∗∗∗ (.12) −.02∗∗∗ (.01) −.05∗∗∗ (.01) −.14∗∗∗ (.02)Brightness .09∗∗∗ (.03) −.34∗∗∗ (.04) −.74∗∗∗ (.15) .07∗∗ (.03) .11∗∗ (.05) .32∗∗∗ (.10)Brightness Contrast .05 (.08) −.82∗∗∗ (.10) −.83∗∗ (.40) −.16∗∗ (.08) −.26∗∗ (.13) .15 (.27)
Post CharacteristicsNumber of Words −.05∗∗∗ (.01) −.005 (.01) −.03 (.04) .16∗∗∗ (.01) .29∗∗∗ (.01) .35∗∗∗ (.02)Number of Hashtags −.53∗∗∗ (.01) −.56∗∗∗ (.01) −.52∗∗∗ (.05) .01 (.01) −.16∗∗∗ (.01) −.25∗∗∗ (.01)Number of Handletags .11∗∗∗ (.01) .58∗∗∗ (.01) .74∗∗∗ (.05) .004 (.01) .11∗∗∗ (.01) .16∗∗∗ (.03)Branded Caption (d) .16∗∗∗ (.02) −.15∗∗∗ (.02) −.14 (.09) .01 (.01) −.09∗∗∗ (.02) .04 (.04)Brand Tag (d) −.18∗∗∗ (.02) −.15∗∗∗ (.02) −.23∗∗∗ (.08) −.03∗∗ (.01) −.06∗∗∗ (.02) .05 (.04)Ad Tag (d) −.09 (.07) −.01 (.10) .16 (.39) .02 (.02) .02 (.04) .16∗∗ (.07)First-Person Pronoun (d) .18∗∗∗ (.01) .19∗∗∗ (.01) .23∗∗∗ (.04) .02∗∗ (.01) .17∗∗∗ (.01) .26∗∗∗ (.03)Second-Person Pronoun (d) .17∗∗∗ (.01) .12∗∗∗ (.01) .09 (.06) −.04∗∗∗ (.01) .13∗∗∗ (.02) .24∗∗∗ (.03)Question Word Share 1.61∗∗∗ (.09) 1.21∗∗∗ (.11) .25 (.43) .13 (.13) 1.37∗∗∗ (.19) 1.71∗∗∗ (.34)Netspeak Word Share −.50∗∗∗ (.07) −.12 (.08) −1.87∗∗∗ (.36) −.43∗∗∗ (.12) .09 (.18) −.28 (.39)Positive Sentiment .02∗∗∗ (.01) −.10∗∗∗ (.01) −.07 (.04) .04∗∗∗ (.01) −.02∗ (.01) .01 (.03)Negative Sentiment .09∗∗∗ (.01) .17∗∗∗ (.02) .03 (.06) .01 (.02) .01 (.03) −.19∗∗∗ (.06)Post Age −.28∗∗∗ (.01) −.01 (.01) .54∗∗∗ (.04) −.08∗∗∗ (.003) .04∗∗∗ (.01) .05∗∗∗ (.01)
Sender CharacteristicsUnique Sender (d) .20∗∗∗ (.01) .02 (.01) −.09∗ (.05) −.05∗∗∗ (.01) .10∗∗∗ (.01) −.04 (.03)Number of Posts −.23∗∗∗ (.003) −.02∗∗∗ (.004) .01 (.02) −.31∗∗∗ (.003) −.21∗∗∗ (.01) −.17∗∗∗ (.01)Number of Friends −.20∗∗∗ (.004) −.17∗∗∗ (.005) −.12∗∗∗ (.02) −.15∗∗∗ (.003) .002 (.005) .001 (.01)Number of Followers .74∗∗∗ (.004) .54∗∗∗ (.004) .46∗∗∗ (.01) .79∗∗∗ (.003) .55∗∗∗ (.004) .59∗∗∗ (.01)
Brand Fixed Effects Y es Y es Y es Y es Y es Y es
AIC 692, 547 293, 098 30, 785 440, 667 231, 330 55, 122N 214, 563 214, 563 214, 563 43, 585 43, 585 43, 585
∗p < .10,∗∗ p < .05,∗∗∗ p < .01. ‡ indicates significant differences between brand selfie and packshot at p < .01.Notes: Standard errors in parentheses. Intercept omitted from table. (d) indicates dichotomous variables. Visual complexity mean-centered.
43
Electronic copy available at: https://ssrn.com
/abstract=3354415

Table 4: Regression Results for Twitter and Instagram: Net Self-Thoughts
Twitter Instagram
Net Self-Thoughts Net Self-Thoughts
Brand-Image TypeConsumer Selfie (Baseline)Brand Selfie .46∗∗∗ (.13) 1.51∗∗∗ (.14)Packshot .49∗∗∗ (.13) 1.53∗∗∗ (.12)
Image CharacteristicsLogo Size .92∗∗∗ (.27) 1.26∗∗∗ (.44)Logo Centrality .23 (.17) .36∗ (.21)Visual Complexity .15∗ (.09) .08 (.09)Visual Complexity2 −.09 (.10) −.04 (.06)Brightness .18 (.24) −.06 (.31)Brightness Contrast −.01 (.68) .29 (.81)
Post CharacteristicsNumber of Words −.11∗ (.07) .10 (.07)Number of Hashtags .03 (.09) −.19∗∗∗ (.05)Number of Handletags −.10 (.08) .12 (.08)Branded Caption (d) .15 (.15) .39∗∗∗ (.13)Brand Tag (d) −.72∗∗∗ (.13) .25∗∗ (.12)Ad Tag (d) 1.83∗∗ (.84) .15 (.24)First-Person Pronoun (d) −.16∗∗ (.07) .35∗∗∗ (.09)Second-Person Pronoun (d) −.08 (.09) .18∗ (.11)Question Word Share .98 (.68) 1.85 (1.19)Netspeak Word Share .16 (.50) .76 (1.11)Positive Sentiment −.35∗∗∗ (.07) .04 (.08)Negative Sentiment −.04 (.10) −.04 (.20)Post Age .24∗∗∗ (.06) .04 (.03)Number of Comments −.001 (.002) −.0001 (.001)
Sender CharacteristicsUnique Sender (d) −.31∗∗∗ (.08) −.25∗∗∗ (.10)Number of Posts .09∗∗∗ (.03) .04 (.04)Number of Friends .06∗ (.03) .04 (.03)Number of Followers .04 (.02) .10∗∗∗ (.03)
Brand Fixed Effects Y es Y es
R2 .01 .02N 45, 892 32, 279
∗p < .10,∗∗ p < .05,∗∗∗ p < .01.Notes: Standard errors in parentheses. Intercept omitted from table.Visual complexity mean-centered. (d) indicates dichotomous variables.Filtered to posts with at least one comment.
44
Electronic copy available at: https://ssrn.com/abstract=3354415
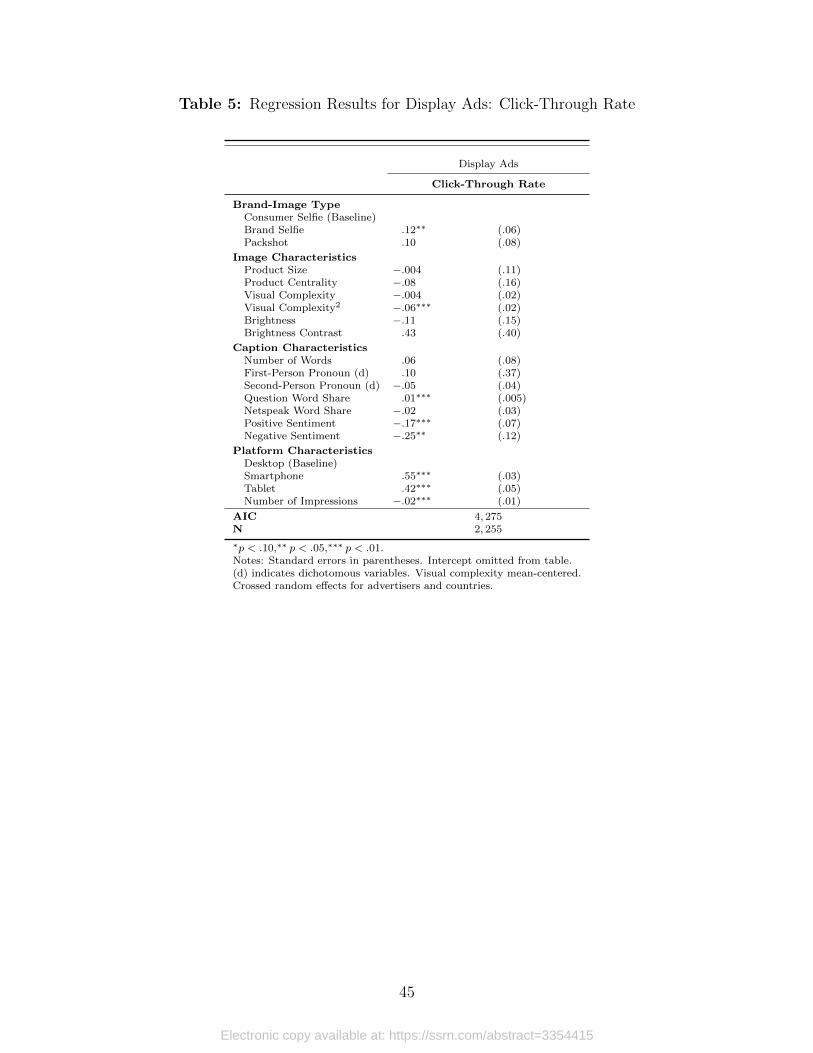
Table 5: Regression Results for Display Ads: Click-Through Rate
Display Ads
Click-Through Rate
Brand-Image TypeConsumer Selfie (Baseline)Brand Selfie .12∗∗ (.06)Packshot .10 (.08)
Image CharacteristicsProduct Size −.004 (.11)Product Centrality −.08 (.16)Visual Complexity −.004 (.02)Visual Complexity2 −.06∗∗∗ (.02)Brightness −.11 (.15)Brightness Contrast .43 (.40)
Caption CharacteristicsNumber of Words .06 (.08)First-Person Pronoun (d) .10 (.37)Second-Person Pronoun (d) −.05 (.04)Question Word Share .01∗∗∗ (.005)Netspeak Word Share −.02 (.03)Positive Sentiment −.17∗∗∗ (.07)Negative Sentiment −.25∗∗ (.12)
Platform CharacteristicsDesktop (Baseline)Smartphone .55∗∗∗ (.03)Tablet .42∗∗∗ (.05)Number of Impressions −.02∗∗∗ (.01)
AIC 4, 275N 2, 255
∗p < .10,∗∗ p < .05,∗∗∗ p < .01.Notes: Standard errors in parentheses. Intercept omitted from table.(d) indicates dichotomous variables. Visual complexity mean-centered.Crossed random effects for advertisers and countries.
45
Electronic copy available at: https://ssrn.com/abstract=3354415