Embed Size (px)
Citation preview

1
The Potential Use of Inexpensive Pervasive Sensors for Managing Traffic-Related Air Quality and Noise Problems
Abstract
This paper describes a novel inexpensive wireless sensor network that allows simultaneous, real-time measurement of traffic using an acoustic sensor, carbon monoxide, nitrogen dioxide, noise, temperature and humidity. The sensors are deployed onto street furniture with spacing of up to about 100m. The sensors have GPS and an accelerometer which will enable them to be deployed also in vehicles, on bicycles and carried by pedestrians so that mobile exposure measurements can be captured within the vicinity of the static sensor array. The data is temporarily logged and processed within the mote before using a licence-free, low power radio technology, known as zigbee, to pass the data from mote to mote (daisy-chaining) and on into a computer that serves as a gateway. This forwards the data, using a messaging service, to a server either by a hard-wired link or GPRS. This data is captured into a UTMC compliant real-time database along with other data from legacy systems including demand responsive control systems, meteorological conditions, roadside pollution monitors and the Automatic Urban Rural Network monitoring systems etc. Following a brief overview of the sensor system, the results of the evaluation of the accuracy of the individual sensors against precision systems will be given. The future role of the pervasive sensor technology in supporting the delivery of good air quality and informing noise action planning will be described. Their use in the evaluation of supporting the delivery of good air quality and informing noise action planning will be described. Their use in the evaluation of the implementation of traffic management measures, in validation of models and assessing trends will be demonstrated as an important contribution to informing policy, enhancing decision making and educating the public to changing life styles and attitudes to travel. This paves the way for addressing the radical changes in the need to travel, especially in single occupancy cars, if a reduction of 60% in carbon dioxide emissions is to be achieved by 2020.
Margaret C. Bell CBEScience City Professor of Transport and EnvironmentTransport operations Research Group (TORG)School of Civil Engineering and GeosciencesCassie BuildingNewcastle UniversityNewcastle upon TyneNE1 7RUTel: +44(0) 191 22 [email protected] Conference 11th December 2008
2
The Potential Use of Inexpensive Pervasive Sensors for Managing
Traffic-Related Air Quality and Noise Problems
Transport Operations Research GroupNewcastle University
Professor Margaret Bell CBEProfessor Margaret Bell CBE
IASPC 11th December 2008

3
Presentation
�Background
�Pervasive mote sensor design
�Mote Calibration
�Gateshead Demonstration: Mobile Sensor Validation�Gateshead Demonstration: Mobile Sensor Validation
� Integration with Legacy Systems
�Newcastle University: Architecture for Data Flow
�Uses of Data
�Leicester Demonstration
�Summary

4
Background
�Policies
�Early decades reduced delay to traffic
�1996 Ambient air quality assessment
�2002 EU Noise Directives
�2006 Eddington Report
�2006 Stern Report�2006 Stern Report
� Intelligent Transport Systems Important Role
�Supplier of data to provide network status, validate
models and enhance technical solutions
�Control & manage traffic and demand to reduce
demand
�Deliver *Information *Education *Change Attitudes

5
MESSAGE Project
�Funded by the EPSRC and DfT
�University Collaboration
�Imperial
�Newcastle�Newcastle
�Cambridge
�Southampton
�Leeds
�3 Years finishing September 2009
�e-Science

6
Pervasive Sensor (MOTE) Design Strategy
�Target cost of <£200 per node for components
�Highly modular approach to design.
�Standard CPU and comms module
�Same design for mobile and fixed nodes�Same design for mobile and fixed nodes
�Add on modules for sensor payload.
�Low power consumption to reduce overhead costs
�Prototype LED 1 year @ 1minute averages
�Several scavenging power supply options to be considered.
7
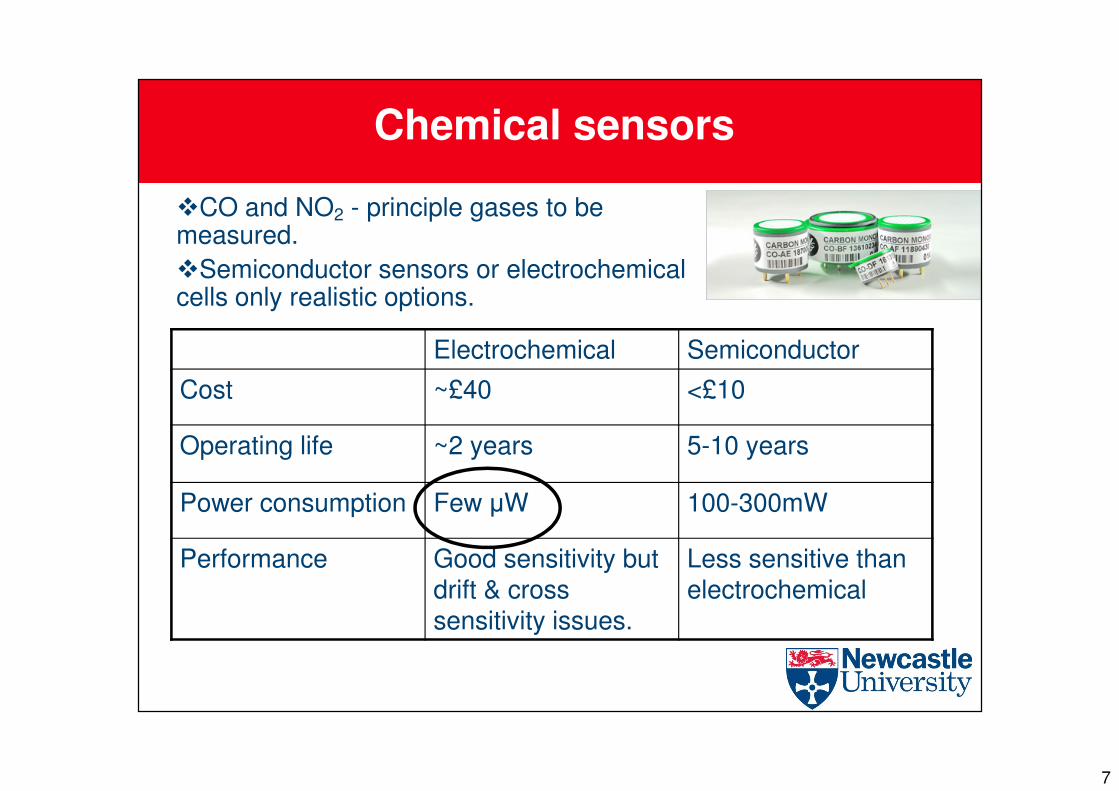
Chemical sensors
�CO and NO2 - principle gases to be measured.
�Semiconductor sensors or electrochemical cells only realistic options.
Electrochemical Semiconductor
Cost ~£40 <£10Cost ~£40 <£10
Operating life ~2 years 5-10 years
Power consumption Few µW 100-300mW
Performance Good sensitivity but drift & cross sensitivity issues.
Less sensitive than electrochemical
8
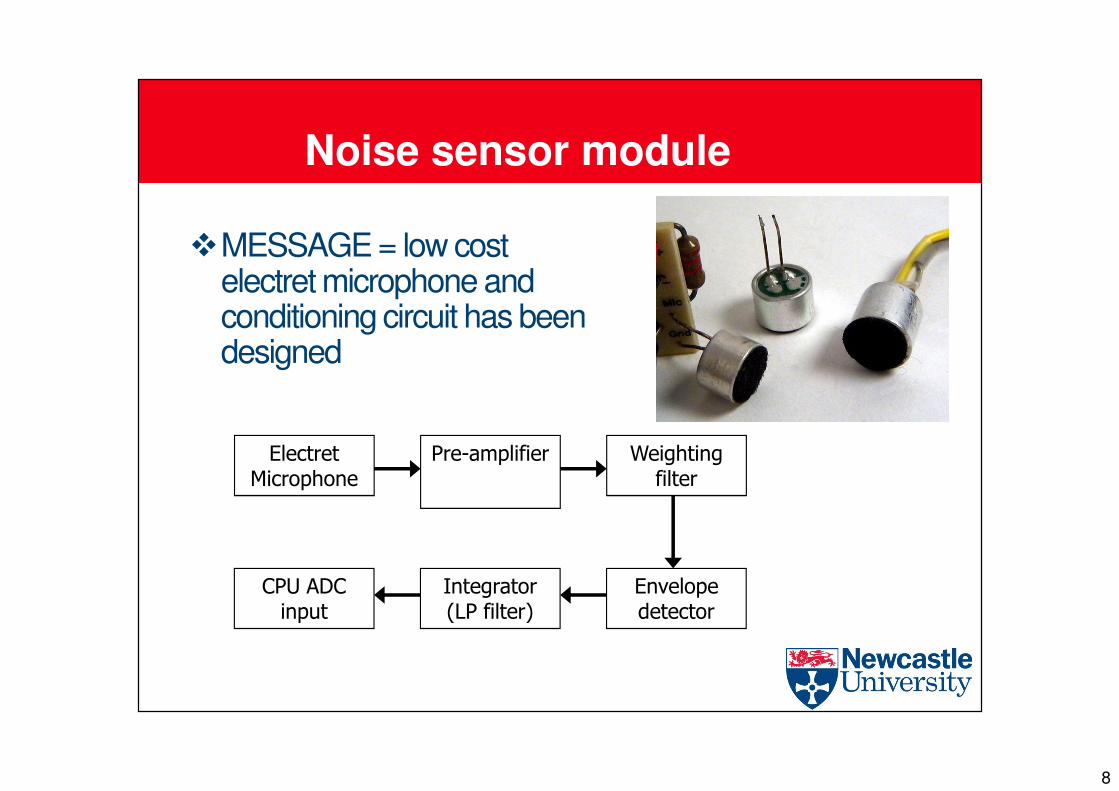
Noise sensor module
�MESSAGE = low cost electret microphone and conditioning circuit has been designed
Electret Microphone
Pre-amplifier Weighting filter
Envelope detector
Integrator (LP filter)
CPU ADC input

9
Traffic sensor module
�40kHz ultrasonic module
developed with range 5-10m
�Low cost (<£10) and low power
�Quickly/easily deployed anywhere
�30°beam width means close queued traffic may not be
discriminated
10
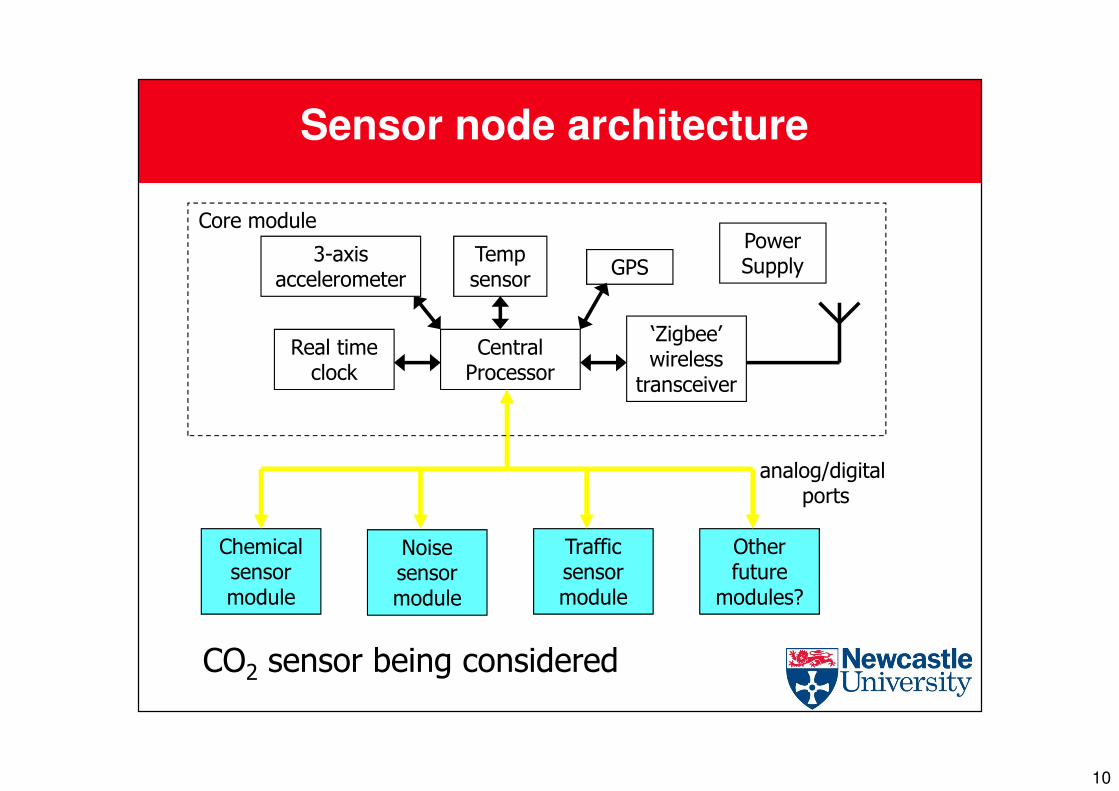
Sensor node architecture
Central Processor
‘Zigbee’ wireless
transceiver
Real time clock
Temp sensor
3-axis accelerometer
GPS
Core modulePower Supply
transceiver
Chemical sensor module
Noise sensor module
Traffic sensor module
Other future
modules?
analog/digitalports
CO2 sensor being considered
11
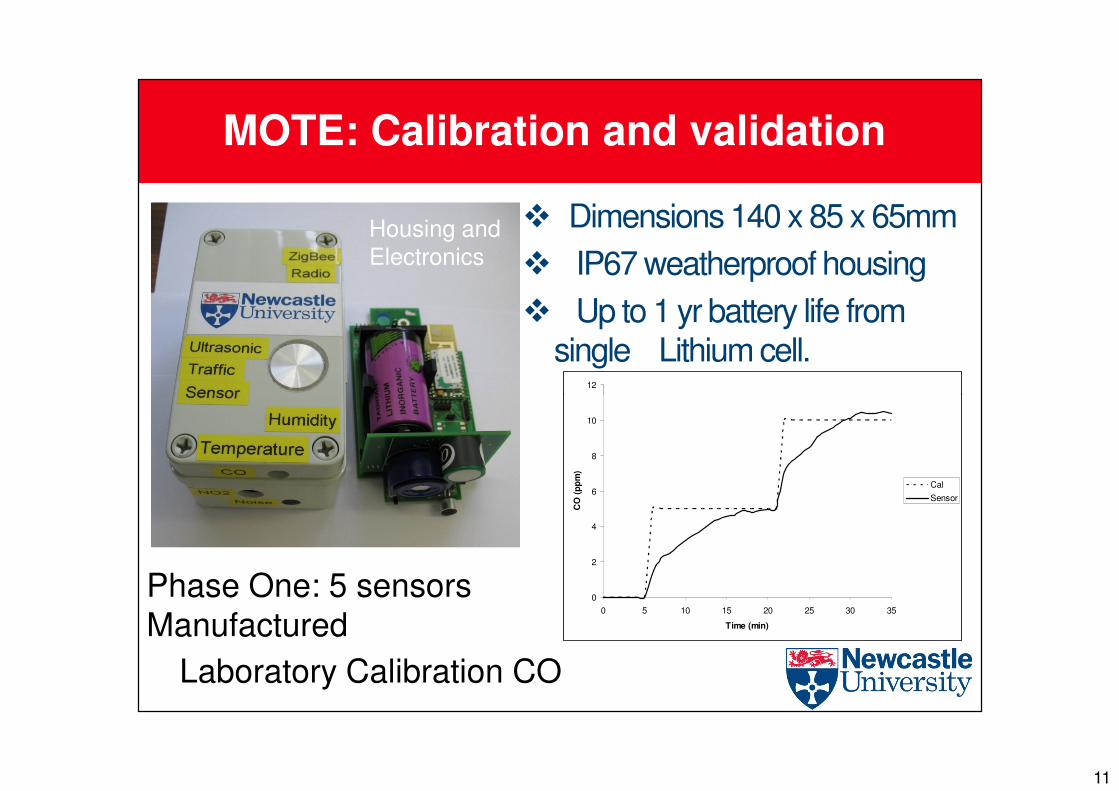
MOTE: Calibration and validation
� Dimensions 140 x 85 x 65mm
� IP67 weatherproof housing
� Up to 1 yr battery life from single Lithium cell.
12
Housing and Electronics
0
2
4
6
8
10
0 5 10 15 20 25 30 35
Time (min)
CO
(p
pm
)
Cal
Sensor
Laboratory Calibration CO
Phase One: 5 sensors
Manufactured
12
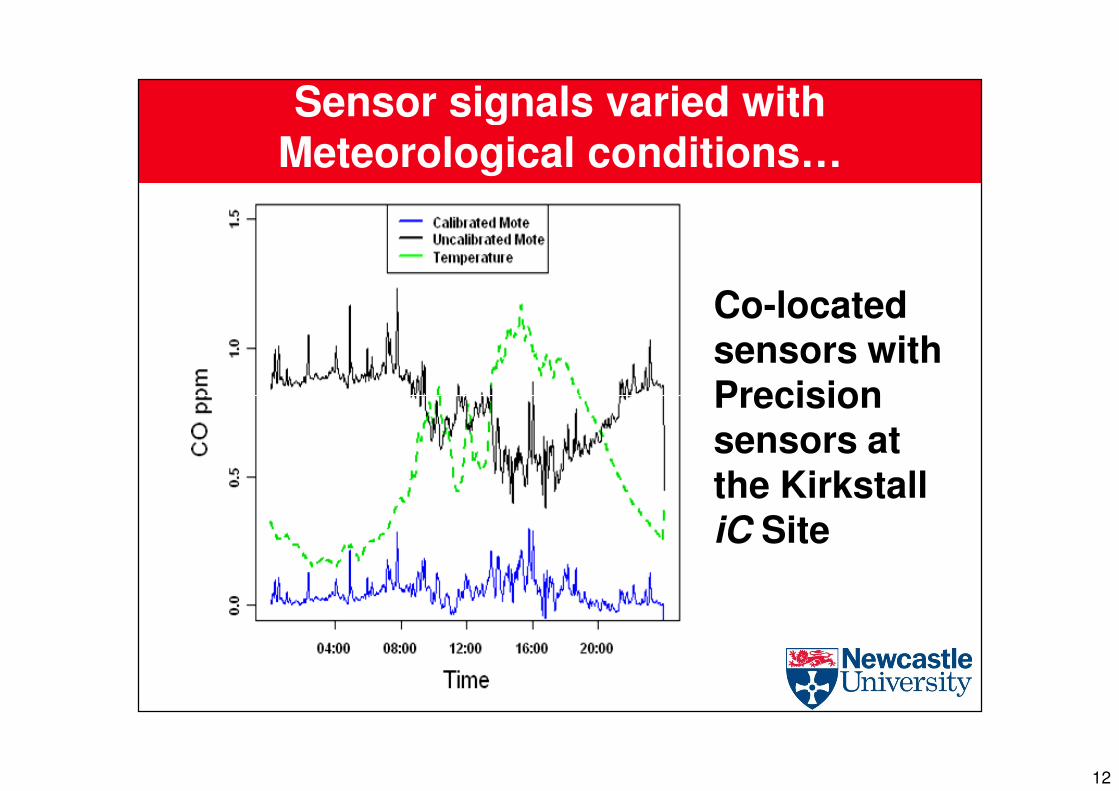
Sensor signals varied with Meteorological conditions…
Co-located sensors with Precision Precision sensors at the Kirkstall iC Site
13
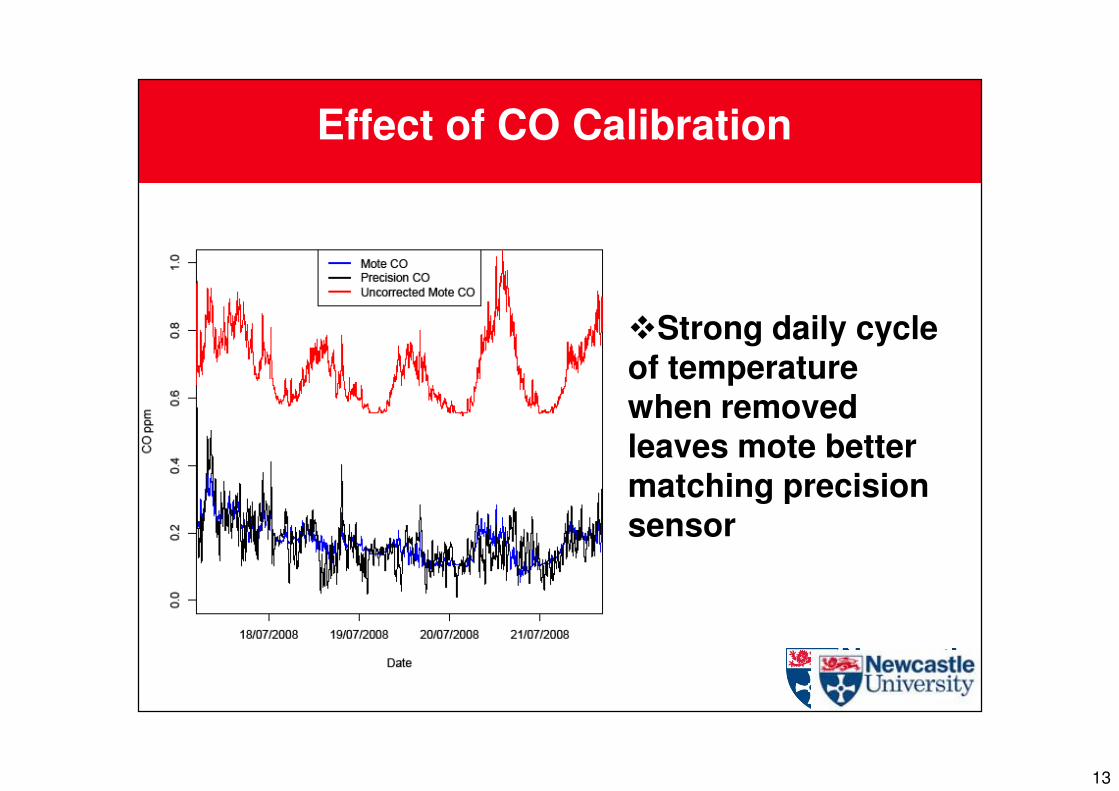
Effect of CO Calibration
�Strong daily cycle of temperature when removed when removed leaves mote better matching precision sensor

14
Uncalibrated and Calibrated Mote Data Correlation with Precision Data

15
Kirkstall Site – For CO precision versus mote data (4 motes)
0
0.5
1
1.5
2
2.5
3
3.5
4
4.5
5
00:00:00 02:00:00 04:00:00 06:00:00 08:00:00 10:00:00 12:00:00 14:00:00 16:00:00 18:00:00 20:00:00 22:00:00 00:00:00
CO
(p
pm
)

16
Kirkstall Site – For NO2 precision versus mote data (4 motes)
0
20
40
60
80
100
120
140
00:00:00 02:00:00 04:00:00 06:00:00 08:00:00 10:00:00 12:00:00 14:00:00 16:00:00 18:00:00 20:00:00 22:00:00 00:00:00
NO
2 (
pp
b)
�Temperature and humidity
�Cross-Sensitive to ozone
�Good correlation mote on mote
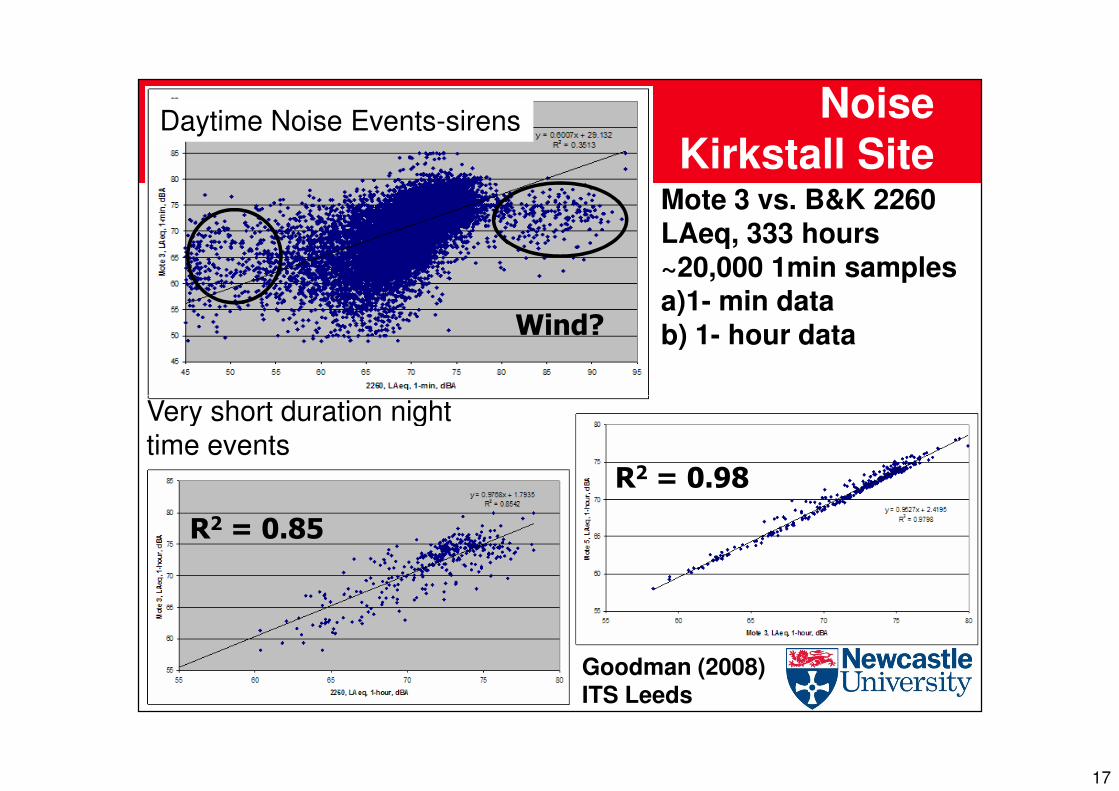
17
Mote 3 vs. B&K 2260 LAeq, 333 hours~20,000 1min samplesa)1- min datab) 1- hour data
Daytime Noise Events-sirens
Very short duration night
Wind?
NoiseKirkstall Site
Very short duration night
time events
R2 = 0.85
R2 = 0.98
Goodman (2008) ITS Leeds

18
On Street Validation - Simple CountNewcastle
�26 more vehicles in a count of 690
�Pedestrian �Pedestrian Interference
�Acoustic sensor not waterproof

19
Off-Site (Car Park) TrialsGosforth
�10mh, 20mph 30mph at a distance 2, 2.5, 3, 3.5 metres form kerb at
�Newcastle Great Park 20º acoustic sensor
3.5 metres form kerb at different heights
�Height of 0.8m
�Shows promise
�Reflection from road surface - noisy signal-software filter

20
Roving Mote - Campus
Campus Walk
0
2000
4000
6000
8000
10000
14:4
3:1
0
14:4
4:3
0
14:4
5:5
0
14:4
7:1
0
14:4
8:3
0
14:4
9:5
0
14:5
1:3
0
14:5
2:5
0
14:5
4:4
0
14:5
6:0
0
14:5
7:2
0
Po
sit
ion
(la
st
4 d
igit
s G
PS
)
Campus Walk
�Walking
�95% of time GPS fix
Roving Mote
0
100
200
300
400
500
600
14:3
6:3
0
14:3
8:1
0
14:4
0:1
0
14:4
2:2
0
14:4
4:3
0
14:4
6:4
0
14:4
8:5
0
14:5
1:0
0
14:5
3:1
0
14:5
5:2
0
14:5
7:3
0
14:5
9:4
0
Time (10second sampling)
Noise
Carbon monoxide
Nitrogen Dioxide
Temperature
Humidity
14:4
3:1
0
14:4
4:3
0
14:4
5:5
0
14:4
7:1
0
14:4
8:3
0
14:4
9:5
0
14:5
1:3
0
14:5
2:5
0
14:5
4:4
0
14:5
6:0
0
14:5
7:2
0
Time seconds
�Noise level mainly from rucksack movement
21
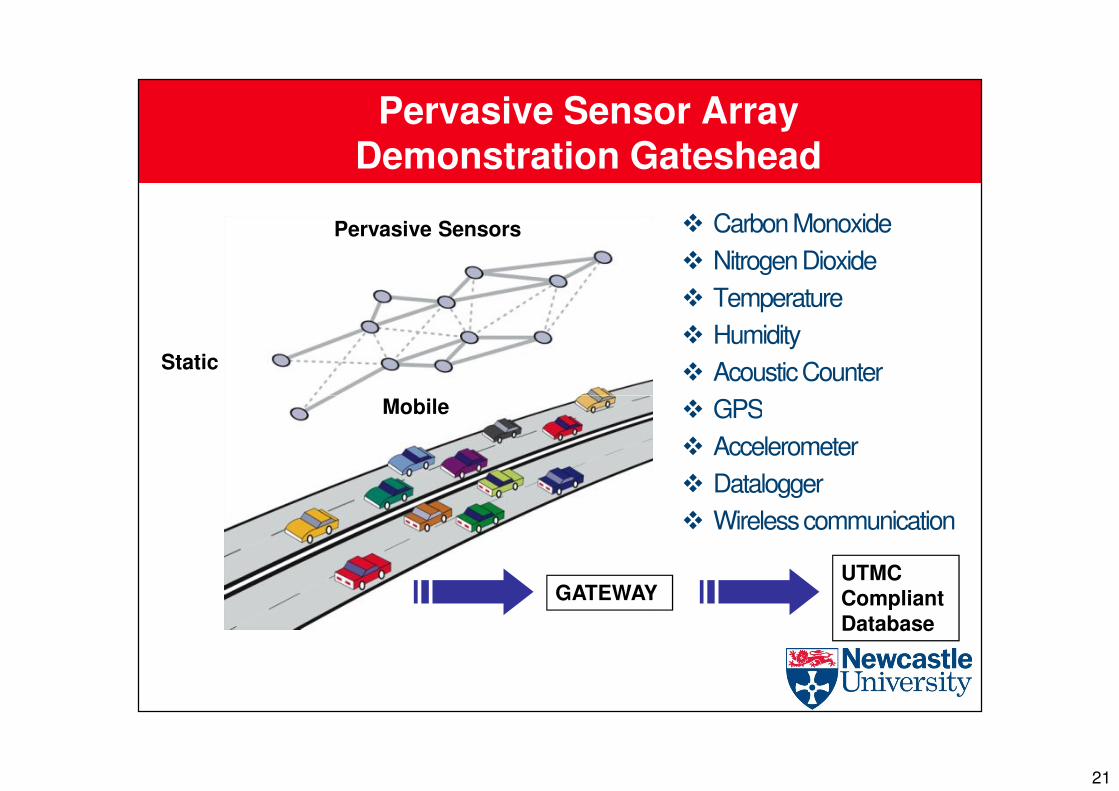
Pervasive Sensor Array Demonstration Gateshead
� Carbon Monoxide
� Nitrogen Dioxide
� Temperature
� Humidity
� Acoustic Counter
� GPS
Pervasive Sensors
Mobile
Static
� GPS
� Accelerometer
� Datalogger
� Wireless communication
Mobile
UTMC Compliant Database
GATEWAY

22
Field Trials of MESSAGE within Gateshead
�Static: Sensor Validation
�Mobile : Sensor Validation and measurement of
environment in- out- vehicleenvironment in- out- vehicle
� Traffic Model validation
�Information Platform
Leicester noise and air quality model validation
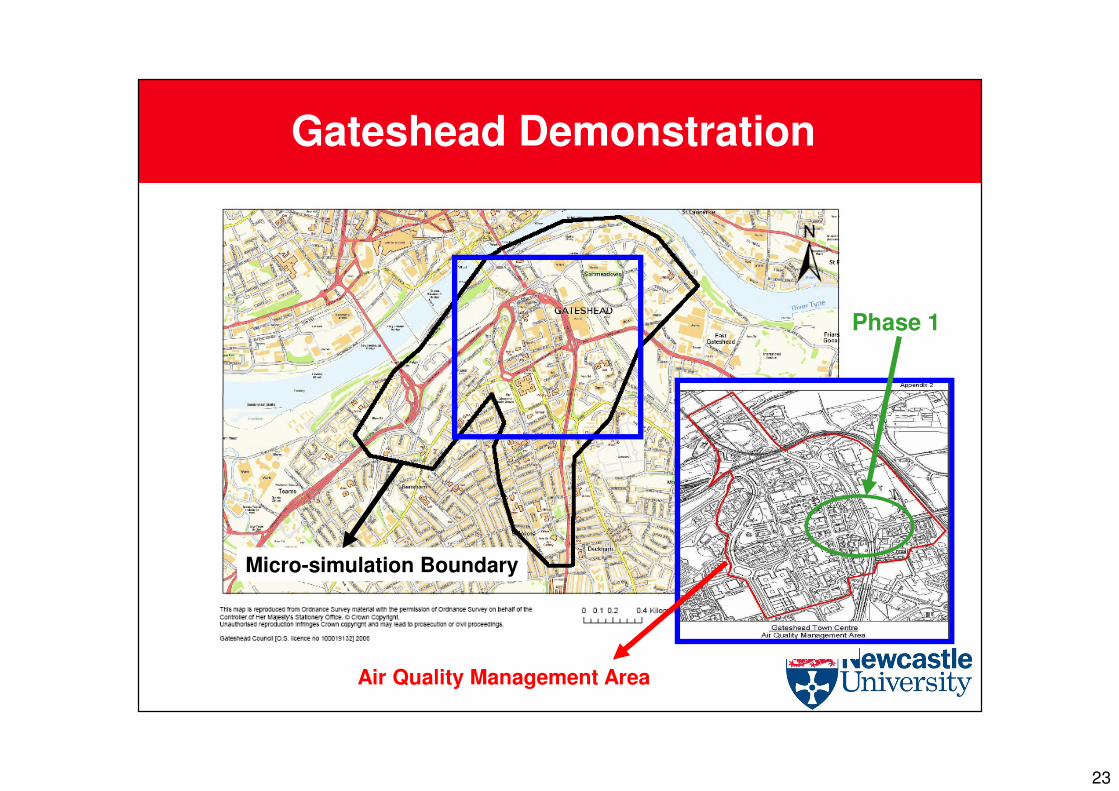
23
Gateshead Demonstration
Phase 1
Air Quality Management Area
Micro-simulation Boundary
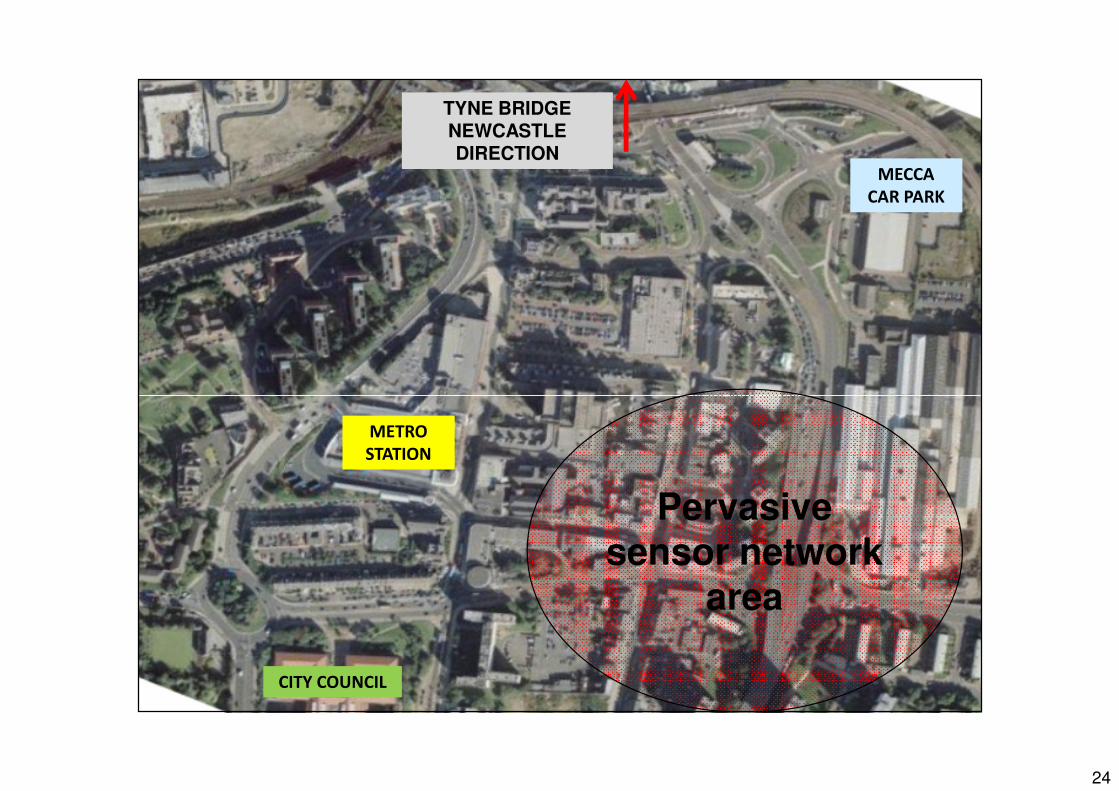
24
MECCA
CAR PARK
TYNE BRIDGE NEWCASTLE DIRECTION
CITY COUNCIL
METRO
STATION
Pervasive sensor network
area

25
�10 Street Boxes �2 NOx &AURN as benchmark
�40 Static motes �10 dynamic (cars and cycles)

26
Motes fixed to street furniture
Mote on Lamp post
Mote co-located with noise meter on a tripod
GatewayHouses computer GPRS link with University Server

27
Line of site problems
Gateway

28
Preliminary Results

29
Sensor Data Calibration
�Manufacturer’s calibration constants specific to each sensor
�Electrochemical sensors - typically sensitive to
Calibration (based on co-location at Kirkstall) is carried out in the database before storage
�Electrochemical sensors - typically sensitive to both humidity and temperature
�Manufacturers initially led us to believe that there would be minimum sensitivity to humidity
�This was not the case…
�NO2 sensor cross sensitive to ozone
Recently received funding from OneNE to purchase an environment chamber

30
NO2 co-located Lychgate AURN
�No CO validation - waiting for ratified data
�AURN at 15 minutes avearging not ratified yet
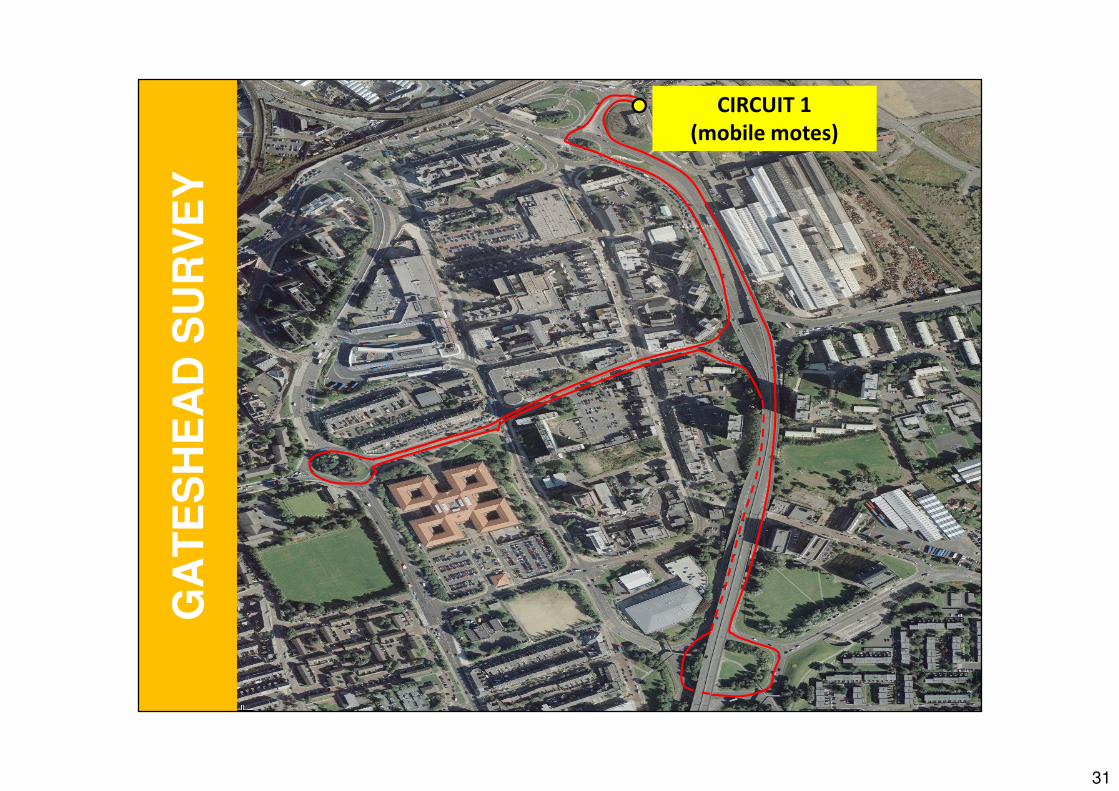
31
GA
TE
SH
EA
D S
UR
VE
Y
CIRCUIT 1
(mobile motes)
GA
TE
SH
EA
D S
UR
VE
Y

32
GA
TE
SH
EA
D S
UR
VE
Y
CIRCUIT 2
(mobile motes)
GA
TE
SH
EA
D S
UR
VE
Y

33
Survey snapshot
CO, NO2, PM and Mote CO, NO2, PM and Mote
measurement inside and outmeasurement inside and out
CO, noise and Mote CO, noise and Mote
measurement inside measurement inside
and outand out
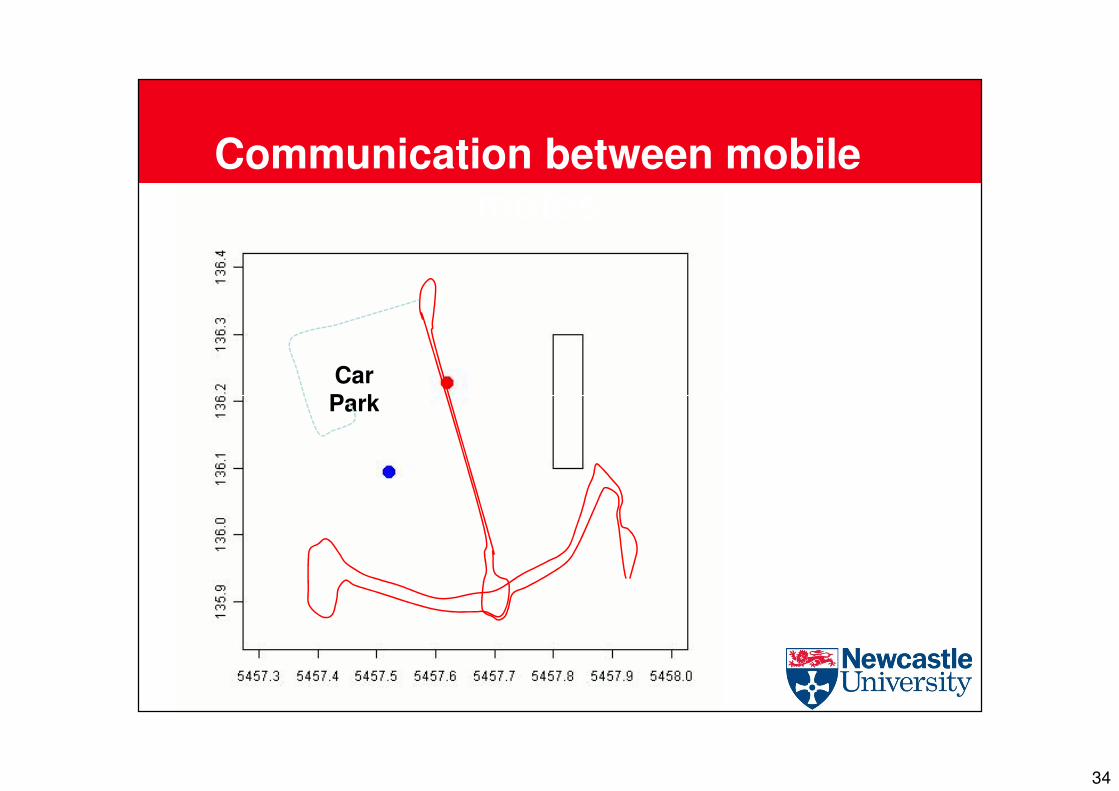
34
Communication between mobile motes
Car ParkPark

35
Validation of GPS on probe vehicle

36
�Passenger noted vehicle in front and any smell, visual fumes etc
�Higher inside the car
�Similar response to those outside but with a smoothed profile and time lag
Old petrol car
Pollution inside and outside vehicle
Bus
�Clipping affect in CO - feature of amplifications of chemical sensor
�Sensors configured to detect background & transient peaks from traffic

37
Technologies
Integration with legacy systems
Pervasive Sensors
MESSAGE
UTMC – Basis of open architecture
Common Database
ProcessingInformation
Platform
Technologies You Do Not See
TRAFFIC, AQ,Noise, Models

38
Uses of Data (1)
� Display Current Situation
� Statistical Analysis to
�Develop typical profiles
�Monitor current network status�Monitor current network status
� Mathematical modelling
�Data Mining
�Data Fusion
�Empirical relationships
�Forecasting

39
Data Mart
Evaluation
DataWarehouseStatistical processingAPPS SCENARIO
MODELS
MONITORED DATA MODELLED DATA
Evaluation
Data Mart
Evaluation
DataWarehouseStatistical processingAPPS SCENARIO
MODELS
MONITORED DATA MODELLED DATA
EvaluationEvaluation
DataWarehouseStatistical processingAPPS SCENARIO
MODELS
MONITORED DATA MODELLED DATA
Evaluation
Newcastle: Architecture for Data FlowStatistical Analysis -Typical Profiles, Data Mining, Reporting
Data interpretation, UTMC compliant
Sensors
SCOOT
Real Time
Database
(UTMC Compliant)
QA
APPSReal Time
Event
Processing
ONLINE
MODELS
Sensors
SCOOT
Real Time
Database
(UTMC Compliant)
QA
APPSReal Time
Event
Processing
ONLINE
MODELS
Sensors
SCOOT
Real Time
Database
(UTMC Compliant)
QA
APPSReal Time
Event
Processing
ONLINE
MODELS
Typical profile compared with real-time data - events
Filter, Verify, Calibrate sensor data, interpolation

40

41
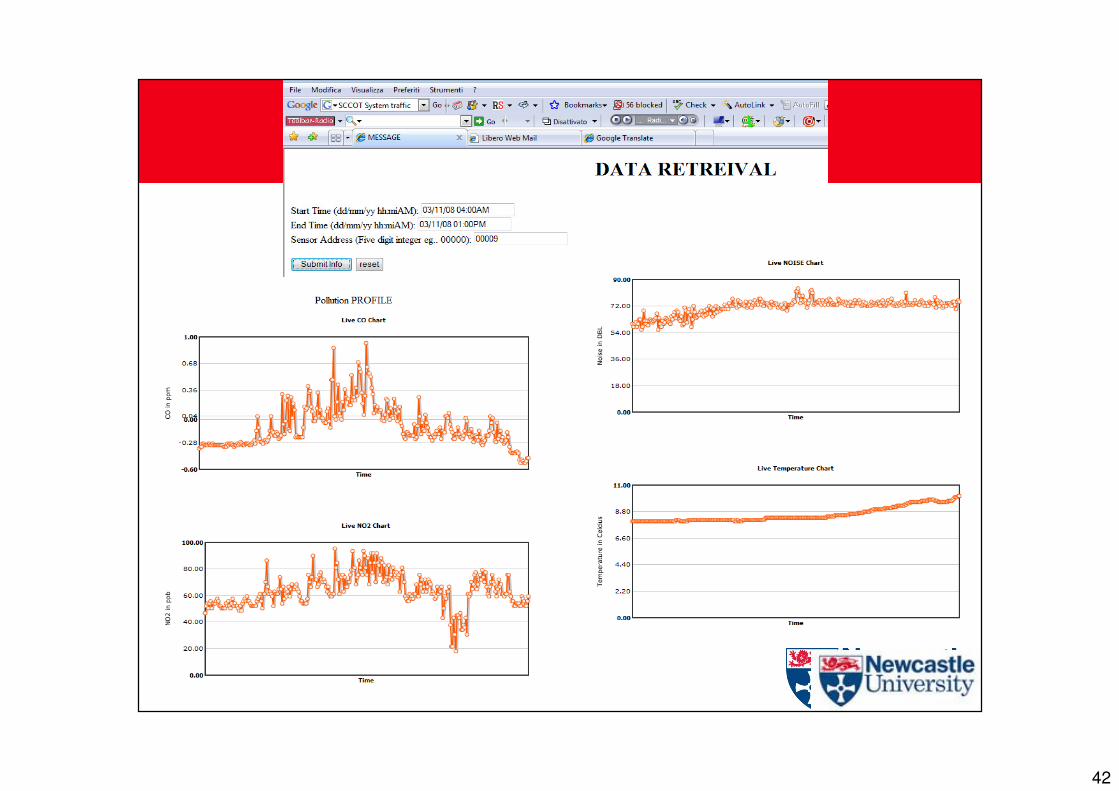
42

43
Data Integration with Legacy Systems: Real Time and Historic
Historic Profile for Congestion Analysis
High smooth free flowE= f(flow ?)
Unstable flowE=f(stop and start?)
Low flowEmissions=f(Speed)?
CongestionE=f(idling)?
Street ActivityE=f(stop and start)?
Data Mining

44
Uses of Data (2)
� Validation of Models
�Traffic
�Air Quality
�Noise
�Carbon Emissions (Future)
Delivers Material for Information Platforms
�Carbon Emissions (Future)
� Evaluation
�Impact of interventions – direct measurement
�Predictive capability of models- how accurate?
�Feedback to enhance decision making
�Benchmark progress of interventions

45
Data Mart
Evaluation
DataWarehouseStatistical processingAPPS SCENARIO
MODELS
MONITORED DATA MODELLED DATA
Evaluation
Data Mart
Evaluation
DataWarehouseStatistical processingAPPS SCENARIO
MODELS
MONITORED DATA MODELLED DATA
EvaluationEvaluation
DataWarehouseStatistical processingAPPS SCENARIO
MODELS
MONITORED DATA MODELLED DATA
Evaluation
Newcastle Architecture for Data Flow
Validation of modelsAuthenticity of models
Sensors
SCOOT
Real Time
Database
(UTMC Compliant)
QA
APPSReal Time
Event
Processing
ONLINE
MODELS
Sensors
SCOOT
Real Time
Database
(UTMC Compliant)
QA
APPSReal Time
Event
Processing
ONLINE
MODELS
Sensors
SCOOT
Real Time
Database
(UTMC Compliant)
QA
APPSReal Time
Event
Processing
ONLINE
MODELS
Modelled Data
Measurement of Change

46
Validation of Simulation Models
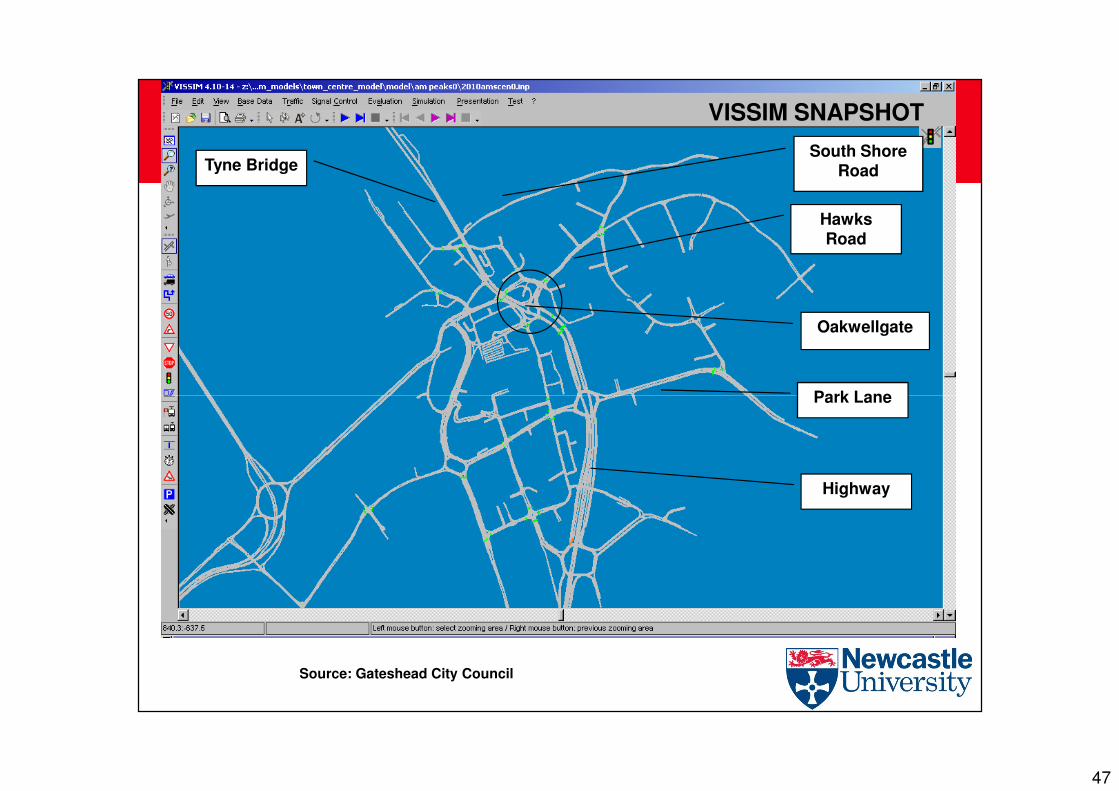
47
Tyne BridgeSouth Shore
Road
Hawks Road
Oakwellgate
Park Lane
VISSIM SNAPSHOT
Park Lane
Highway
Source: Gateshead City Council

48
Validation of Modelled Journey Times - Gateshead

49
Diurnal Variation in Noise Levels
3-D Noise modelling and mapping
� Data Intensive� Speeds, Flows, Compositions� Building, surfaces, Road &
Building surfaces etc
Model Validation Leicester Demonstration
Paul Goodman Leeds University
Anil Namdeo Newcastle University
50
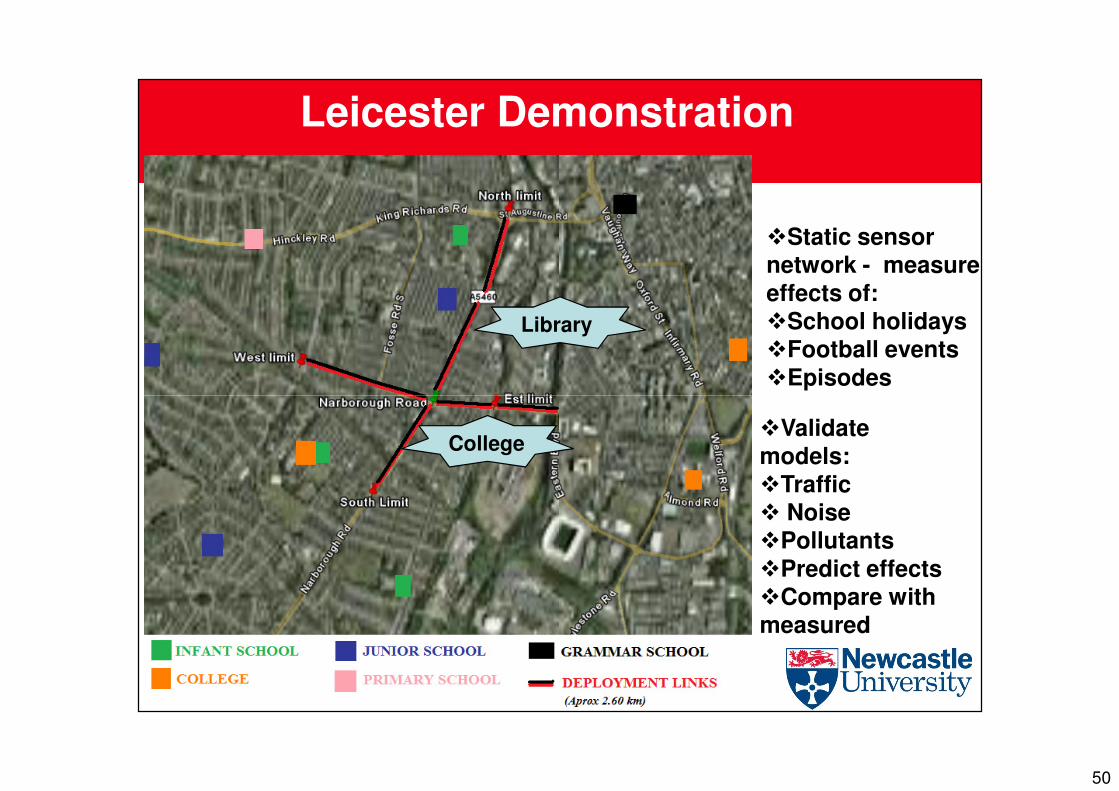
Leicester Demonstration
�Static sensor network - measure effects of:�School holidays�Football events�Episodes
Library
�Validate models:�Traffic� Noise�Pollutants�Predict effects�Compare with measured
College

51
Summary
� Technology and Innovation fundamental to delivery of environmental solutions
� Data management, quality assurance, processing, analysis, forecasting – clever analysis
� Developing Information Platform
� Improve models and Feedback on Change
� Education and Decision Support� Education and Decision Support
� Integration Essential :
� Vehicle – Systems – People
�Monitoring – Modelling - Mapping
� Tough decisions will be needed by Governments
� Success rests with radical change of attitudes and lifestyles
� Villages, Towns, Cities will look different
However
Intelligent Transport Systems have an important role to play

52
Questions?
Margaret C. Bell CBE, PhD, BSc, CMILT, MIHT
Science City Professor of Transport and Environment
Transport Operations Research Group (TORG)
School of Civil Engineering and Geosciences Cassie
Building Newcastle University Newcastle upon Tyne
NE1 7RU

53
Acknowledgement
�EPSRC and Dft UK for funding the research presented.
�Colleagues at
�TORG, Newcastle University
�ITS, University of Leeds �ITS, University of Leeds
� Please take opportunities to reference the research presented here and consult the Reference list on the Personal webpage at Newcastle University
� http://www.ceg.ncl.ac.uk/profiles2/margaret.bell
� or
� Contact Margaret Bell directly.

54
Media Launch Day
The final act of our Gateshead field trial has been to
generate some interest within the media for our work.
This has been done with two local TV news groups
filming some of the motes in action and featuringfilming some of the motes in action and featuring
interviews with some of the lead instigators of this
technology.
MEDIA VIDEO