Embed Size (px)
Citation preview
Crowdsourced Traffic Calming
FINAL RESEARCH REPORT
Bob Iannucci, PI
Ceferino Gabriel Ramirez, PhD Student Ervin Teng, PhD Student
Joao Diogo Falcao, PhD Student Kim Jin, MS Student
Samarth Mathur, MS Student Anand Sankar, MS Student Prajwal Prasan, MS Student
Ashutosh Tadkase, MS Student Nagarjun Srinivasan, MS Student
MAP-21 TSET National (2013-2018)
Grant DTRT-13-GUTC-26 Project No. 14

DISCLAIMER
Thecontentsofthisreportreflecttheviewsoftheauthors,whoareresponsibleforthefactsandtheaccuracyoftheinformationpresentedherein.ThisdocumentisdisseminatedunderthesponsorshipoftheU.S.DepartmentofTransportation’sUniversityTransportationCentersProgram,intheinterestofinformationexchange.TheU.S.Governmentassumesnoliabilityforthecontentsorusethereof.
Crowdsourced Traffic Calming
Abstract
We present our work on creating key elements of a Crowdsourced Traffic Calming system as an enabler for non-specialist citizens to engage in traffic measurement and evaluation in their own communities. We present our designof a roadworthy, low-power, wireless Traffic Sensor; deployment of a low-cost, wide-area sensor network supportingefficient and economical gathering of traffic and other smart city data; a set of browser-based visualization tools foranalyzing acquired traffic data; and a set of related studies to optimize the communication and energy performanceof sensor within the context of this new network. We discuss the challenges uncovered while deploying this systemand hindrances that may be encountered by other city-scale, traffic-related studies.
Keywords: Traffic Calming, Sensor Networks, LoRaWAN
I. Problem
Traffic calming (TC) is an approach to moderating vehicular traffic speeds that relies on the psychological andpractical effects of lane narrowing, speed tables, lane deflection, restricted access and similar interventions. Trafficcalming has been shown to be effective in reducing accidents, reducing effective speeds, reducing noise from roadtraffic and reducing the length of waiting time for pedestrians to cross the roadway [1].
The choice of specific traffic calming measures can be situational and is often approached experimentally. Forexample, some municipalities maintain stores of movable rubber curbs and other devices that can be used to prototypeTC interventions, even offering neighborhood groups the opportunity to conduct these experiments themselves.Such approaches can lead to an effective outcome, but the tools for applying quantitative measures for evaluatingalternatives all too often are only basic–such as time-limited deployments of pneumatic-hose vehicle sensors ora few people with clipboards to count cars. As a result, the information collected is limited, making quantitativeanalysis of traffic flows with and without specific calming interventions difficult.
Significant research into wireless device engineering, mesh networking, energy harvesting over the last 15 yearshas led to the possibility of Smart Cities. Pervasive sensing and wireless networking in the Smart City hold outthe very real possibility of enabling very fine-grained, real-time, and ongoing traffic monitoring and quantification,leading to improved metrics for traffic calming interventions. Pervasive sensors, an infrastructure for collectingdata, and real-time tools for tracking traffic behavior–and comparing data across different TC techniques–could turntoday’s ad-hoc practices into large-scale science. Within the vision of the smart city are sensors for all sorts ofphysical quantities including air quality, pedestrian presence, empty parking spaces, and vehicular traffic. But whilethe sensors themselves may be inexpensive, the wireless infrastructure that connects them may not be so. Currenttrial smart city deployments based on cellular networks incur high cost-per-sensor for operation (monthly charges),as well as devices (radios) themselves that are power-hungry, necessitating costly maintenance of battery-powereddevices. A top-down approach to outfitting a city with pervasive sensing is in general hard to justify without a directtie between investment and payoff (such as reduced costs, increased resident satisfaction, or other such metric) [2].
New wireless technologies are emerging that can reduce or eliminate these barriers. LoRaWAN [3], a relativelynew low power wide area networking (LP-WAN) scheme that uses Semtech’s LoRa [4] modulation technology,shows significant promise in providing the long distance, low-power, and low operating cost wireless interconnectiondemanded by applications such as smart cities where distances and physical obstacles are significant and the needto conserve power on small, battery-powered sensors is extreme. [5], [6]
This project presents our approach to Crowdsourced Traffic Calming–a system of elements that are simple enough touse as to enable non-specialists to engage in traffic science at levels from neighborhoods through cities. We electedto start from prior work in low-power sensing and build a complete system from sensor to network to visualizationand analytics as a system proof-of-concept and to identify gaps in the state-of-the-art that stand between this proof-of-concept and broader deployment. Specifically, we identified the need to explore more sophisticated on-sensorprocessing, leading to our development of an advanced, low-power sensor for capturing and recording traffic flows.We adapted emerging technologies for low-power, wide-area networking to create a low-cost network supportingwide-area data collection for not only traffic data but also broader smart city data. We also identified the opportunityto re-cast smart city sensing as an open, integrative activity that can engage third parties more readily. In supportof this, we created a flexible, adaptable browser-based visualization system for analyzing traffic flows. We presentthe results of this study and offer our perspective on possible future directions.
3
Crowdsourced Traffic Calming
II. Approach
Our approach begins with considerations of the principles to which any satisfactory solution should adhere. We thenexamine the shortcomings of traditional cellular networks as they relate to wide-area traffic sensing and considerthe opportunities that are opened with the advent of low-power, wide-area networking. We further consider thebenefits and challenges of making sensors and their application simple enough that non-specialists could applythem. These considerations motivate the creation of a new kind of smart city traffic sensor, the characteristics ofwhich we outline. These concepts are also discussed in a companion paper published at the ITS World Congressin Montreal [2].
A. Design Principles for the Crowdsourced Smart City
If we assume that it is desirable to make cities smarter through novel applications of sensing, computing andactuating technologies to enable applications such as quantifiable TC, we do so with some tacit assumptions inmind. The kinds of applications we contemplate depend on (a) the ability to place devices anywhere appropriatefor the purpose in the smart city; (b) city-friendly approaches to introducing these devices into a city’s physicalinfrastructure; (c) presentation of smart city resources as an open programming platform that will attract the samemillions of programmers who made the mobile computing revolution what it is today; and (d) a seamless view ofdevices, network and cloud that make programming approachable. We examine each of these in detail.
For the sake of exploring the challenges of smart cities in general, and traffic analysis in particular, we set asideconsideration of in-building environments. This is not to say that smart buildings are not part of the smart city butrather to say that the subject of in-building techniques for sensing and actuating are relatively well-understood [7].Rather, we choose to focus on the less-well-understood out-of-building experience–specifically, traffic and similaroutdoor applications.
PhysicalWorld
Sense
Actuate
Compute
TheTimeLine
CyberWorld
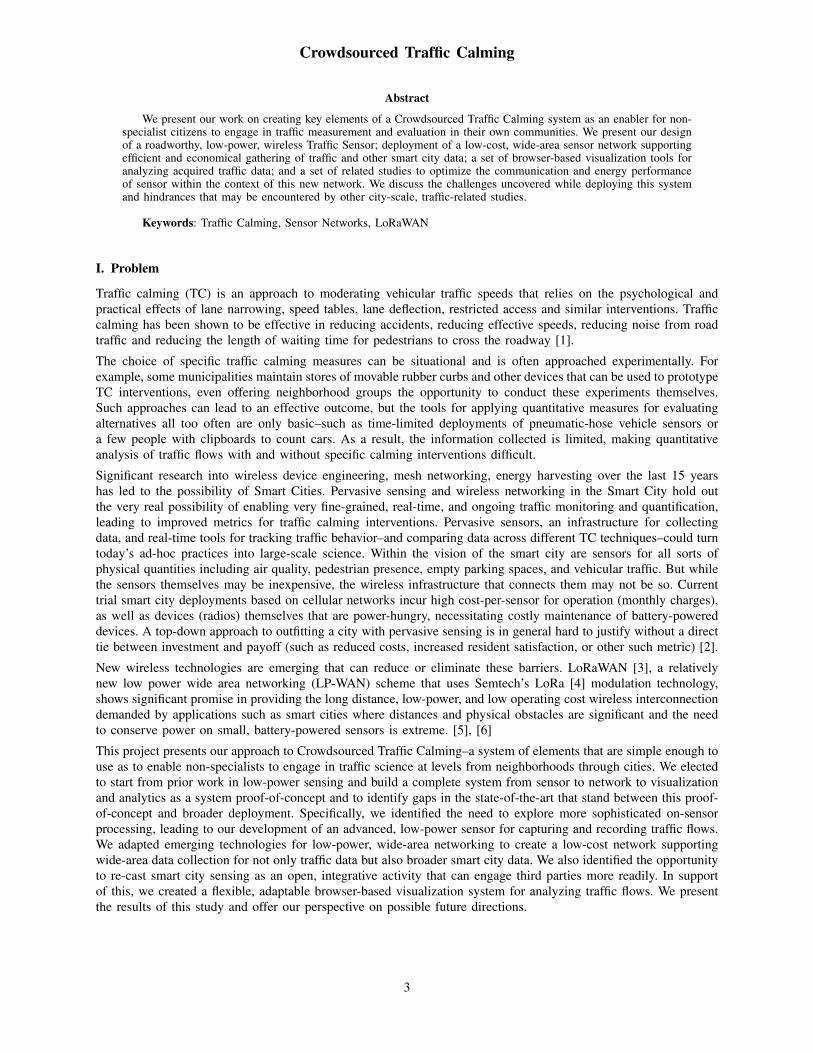
Fig. 1: Simplified representation of information flow in thesmart city. Physical quantities (e.g., passing cars) in thesmart city are sampled by sensor devices. In so doing, theirvalues are associated with the time-of-reading and passedon for processing. Decisions may result in actuation (e.g.,traffic signal changes, application of brakes). In bothcases, information crosses the Time Line from the physicalworld where time has meaning to the cyber world whereit is merely an information tag.
1) Devices Anywhere: Cellular networks have changedthe way we think about network-connectedness. It hasonly been three decades since Nicholas Negropontechallenged our thinking of television (then over-the-air)and telephone (then largely wired) by asserting theywould exchange their delivery modalities (referred toby George Gilder as the Negroponte Switch1). Now,wireless connectivity for phones is presumed, and thispresumption spills forward to the Internet of Things.Filling the world with hundreds of billions of sensordevices can only happen with pervasive wireless net-working. Smart cities inherit this assumption if onlydue to simple economics. The installation cost ofa small sensor that connects wirelessly and harvestsits own energy is dramatically lower than one thatmandates the installation of power or network wires. Ifit takes a crew of four a day to install the power and/ornetwork wires for a fifty-cent sensor, then all notion ofdeploying a dense sensor fleet evaporates. Moreover,if each such device has to be periodically serviced(e.g., having its battery replaced every month, having itsfirmware re-flashed as needed), the per-device per-yearmaintenance costs will likely render the entire solutioninfeasible.
Consequences: We must assume pervasive wireless connectivity and, just as importantly, self-poweredness (eitherharvesting or shipped-with-energy-for-life). Are today’s cellular networks appropriate?
2) City-Friendly Integration: Chief among the considerations in creating a smart city network are minimizationof cost and maximization of alignment with standing city practices. Creating new procedures for city workers,
1https://en.wikipedia.org/wiki/Negroponte_switch
4
Crowdsourced Traffic Calming
educating installers, and designing new maintenance practices at city scale can result in costs that could overwhelmthe perceived benefit.
We consider Pittsburgh, Pennsylvania as a representative mid-sized US city. It owns and maintains 1,031 milesof roads2. For our application, we can imagine a dense array of wirelessly-connected sensors, placed every 100feet or so along these roads to gather high-quality traffic data. This application alone would require installation,recording the position, and optimizing the radio performance of over 500,000 individual devices. We think it unlikelythat Pittsburgh or any similar city would employ a small army of specialists for the purpose of geo-locating andoptimizing the installation of these devices. We can, however, imagine that the city could install the entire fleetover time if the sensing technology could be integrated into road fixtures that already have established installationand maintenance procedures.
Consequences: Integrating with traditional city infrastructure implies a level of hardened packaging quite unlikein-building applications. Unobtrusive placement (e.g., on the pavement) may lead to poor conditions for wirelessantenna performance that will have to be made up by the network. City integration implies that the maintenanceintervals for our sensor devices will have to match those of the host infrastructure. Lacking specialist installation,the burden of performance optimization rests on each sensor device and on the communication network. Do today’snetworks support appropriate geo-location, signal strength reporting, and antenna optimization?
3) Open Development Platform: Broadly-usable smart city infrastructure alone is not valuable unless paired with arapidly-evolving software ecosystem. Recall that it was the million (or so) app developers who turned the phones-as-phones world into the phones-as-mobile-computers world. Smart cities should have, as a primary objective,the desire to attract these same million developers. Stale, purpose-built embedded programs for specific verticalapplications in the smart city are not nearly so appealing as the premise of enabling motivated software engineersto develop city-scale apps that deliver value beyond the initially-imagined purposes for the smart infrastructure. Infact, we would do well to think of the city as a platform on which future apps will be built. And therein are severalmajor problems.
First, we can imagine that such an open ecosystem could and should lead to a sharing economy for sensed data. Thisraises questions of how one might create a marketplace for information, how value-for-data might be formulated,and the extent to which this creates privacy issues. Second, an open ecosystem for programming raises the specterof the city’s smart infrastructure being used improperly or, worse, being used against the city and its residents. Asthis new network becomes integral to daily life, concerns of resilience and the maintaining of network integritybecome first-order considerations. Third, city apps are inherently cyber-physical where mobile phone apps, for themost part, are not. Smart city apps gather data from the real, physical world, process it, and then signal or triggeractions again in the real world. In so doing, signals cross the so-called Time Line (Figure 1) twice. The TimeLine is the separation between the real world, where time has physical consequences and the cyber world, wheretime is simply meta-data. Programming and software engineering as taught and understood today rarely reflect asufficiently deep understanding of the implications of Time-Line-crossings.
Finally, setting aside concerns of information privacy, city-platform abuse and time-programming complexity, thenotion of multiplexing sensing elements in the city across multiple, separately-developed apps raises resourcemanagement challenges. In essence, the city will become a large computing aggregate, and questions of how tofairly share its resources will arise just as in the timesharing days of old.
Consequences: Innovation in the smart city relies on third party developers. They in turn will be attracted by anopen platform. Enabling this requires solving fundamental problems of fairness, network integrity, value exchange,and time-aware programming [8]. Do the old rules and approaches for third party app developers apply?
4) Edgelessness: The power of the smart city is in its cyber-physicality. Timescales involved in detecting andavoiding motorist accidents are measured in milliseconds, and the sensing, computing, and actuating that takeplace in our smart cities must meet these expectations. The scales, costs, spans-of-control, and information sharingexpectations call for synchronization mechanisms and latency management techniques for our traffic sensing systemsthat are a bit beyond the state-of-the-art, particularly with respect to how these are reflected in programs. Latencymanagement by taking advantage of placing computation at the edge of the network is not a new idea–Compaq solda line of commercial “edge of the network” servers in 2001.3 Cisco has updated this concept and positioned it asbringing the cloud closer to the ground–so-called fog computing [9]. Satya and colleagues took a complementaryview of pushing computation from (at the time) compute-impoverished mobile devices into processors that had
2http://pittsburghpa.gov/dpw/street-resurfacing3http://www.serverwatch.com/news/article.php/1400281
5
Crowdsourced Traffic Calming
cloud-like capabilities but that were proximate to the edge [10]–called cloudlets. All of these approaches focus onenabling the placement of computing near the network’s edge.
We believe the bigger problem is enabling programmers to write single programs that can be automatically distributedand migrated in and between the devices, the network and the cloud–but without having to explicitly manage allof this partitioning complexity. In essence, the notion of an “edge” places a substantial burden on the shoulders ofthe programmer to decide how to cut his or her program and how to map it–both today and tomorrow when therelative computing capabilities of the devices, network nodes and cloud change.
We must embrace the realization that, in order to bring about a revolution in IoT and smart city computing forapplications like traffic calming and others, we must reduce rather than increase the complexity of the programmer’stask. We want the same million programmers who made mobile computing what it is today to adopt the smartcity as their new platform. Today, they face a steep learning curve to write code that somehow coordinates andharnesses device, network, and cloud resources–needing to navigate the various edges without getting cut.
Consequences: We put forward the concept of edgeless computing, arguing that the large-scale economically-transformative change of smart cities in particular and the Internet of Things in general will only come when aprogrammer can write one program that harnesses device, network (edge), and cloud as easily as she can write amobile app today, erasing forever the presumption that we must consider the network and device to be on oppositesides of an obtrusive interface (the so-called edge). Can today’s programming environments and languages supportthis?
B. Today’s Networks
An immediate and important question is Do today’s cellular networks meet these design criteria, or if not, couldthey be readily adapted? Certainly, today’s networks provide generally excellent coverage–a result of decades ofcareful network design and optimization. But this was done with the assumption that the terminal devices wouldlargely be phones, held at human height, used for voice calling and data, and recharged every night. Devices inthe smart city are different. Many, if not most, will be mounted on buildings, structures, signs, signals or (worse)the pavement. They will be used for simple telemetry applications (sending a few bytes of data when somethingchanges). And, importantly, they will need to live a city-infrastructure lifetime (significant fraction of a decade),unwired, without being recharged. Any resemblance between these requirements and those of a cellphone is purelycoincidental.
Cellular networks impose an assumption of network-centricity on devices. The requirement, even for the newest3GPP protocols, for the device to stay connected and report in periodically thwarts efforts of IoT device designersto create truly low-power solutions. LTE MTC [11] and subsequent standards including NB-IoT [12] seem alluringto IoT architects looking for pervasive coverage. But the energy tax to simply stay connected to the network isstill too high for devices that must last for five to ten years when operated from a coin-cell battery. And in manycellular markets, the premise of hundreds of thousands of cellular device subscriptions just for sensors is simplycost-prohibitive. Laying wires to solve the power problem also runs afoul of the city-friendly integration principle.
Looking at today’s cellular networks, we must also ask ourselves if openness and edgeless computing can be broughtabout. It is all-too-apparent that today’s cellular networks were not designed to be open development platforms.As an evolution of the venerable public switched telephone network, they were designed first and foremost to behardened, reliable voice networks (it was not until 2009 that more data than voice transited commercial cellularnetworks [13]). Partially of necessity and partially of habit, cellular networks evolve slowly. Measured evolutionwas predicated on the costs and risks associated with vesting network and radio logic in hardware (an assumptionthat is rapidly becoming invalid in the face of software-defined radio). Nevertheless, current standards-setting andoperational practices of cellular networks define a pace that makes rapid adoption of concepts like open networksand edgeless computing unlikely in the short term. The concept of embedding third-party programming in a carrier’snetwork has, historically, been anathema to telecommunications network design–raising concerns about denial-of-service attacks, privacy, and security. While there may be approaches to bound and mitigate such risks (and, infact, commercial IP-based data centers and networks do so every day), the cultural shift from yesterday’s telecomcentral offices to internet practices may be next to impossible for legacy telecommunications providers.
We conclude that while cellular networks are the pervasive network, their shortcomings in terms of being closed,having inadequate support for ultra-low-power city friendly devices, and offering weak to nonexistent support foredgeless computing compel us to consider alternatives so as to accelerate innovation and hasten the arrival of thesmart city.
6
Crowdsourced Traffic Calming
C. Low-Power Wide-Area Networks
Low-Power Wide-Area Networks (LP-WAN) [14] are emerging as a new class of networks that are well-suited to thedesign principles for the smart city. These networks are built on novel, narrow-band communications technologiessuch as Semtech’s LoRa chirp spread spectrum technology [4], Ingenu’s random-phase multiple access technology4,or SigFox’s narrowband binary phase shift keying technology5. In all cases, the radio access network is optimizedfor low data rate transfers (kilobits per second) at very low duty cycles. These networks are being deployed inunlicensed spectrum. For example, in the USA, LoRa uses the 902-928 MHz Industrial, Scientific and Medical(ISM) band.
We examine LP-WANs against cellular networks in terms of device considerations, network considerations, andperformance considerations.
1) Device Considerations for LP-WAN: For the smart city, LP-WANs offer significant advantages, at least at thetechnology level. Unlike cellular networks in which device power is determined by network-side timing and protocolconsiderations, thereby establishing a lower-bound on power consumption, LP-WANs are device-centric, leading tosignificant device power advantages over cellular. The typical modality for an LP-WAN device is to spend mostof its lifetime asleep, waking on a trigger indicating the availability of new data, and only transmitting when thedevice has useful information to convey. For a device that must live for half a decade or more on, essentially, astandard, charged-once, cellphone battery, the ability to spend most of its time asleep is the only practical way tosurvive. LP-WANs are well-matched to this need.
The radio modems for LP-WANs are low in cost relative to cellular modules, operate in unlicensed spectrum, andneed not pass through the lengthy process of testing for compatibility with a particular cellular operator’s network.Because LP-WAN-enabled devices can be energy efficient, they can be small and totally wireless, making them inprinciple city-friendly.
Smart city applications, particularly for LP-WAN devices, raise important concerns for antenna performance.Because of its fundamental relationship to network design and device power, we give antenna performance specialconsideration in the context of a real application in Section II-E.
2) Network Considerations for LP-WAN: Outside of certain countries in Europe, LP-WANs are only sparselydeployed at present. As such, they don’t compare favorably to cellular networks on the basis of pervasive coveragetoday. But to their credit, setting up an LP-WAN network is relatively more straightforward than setting up a cellularnetwork. The network nodes themselves are small (cigar-box sized) and modestly priced (under USD 2000 each).The relatively low cost per gateway (compared to an equivalent-coverage eNodeB in an LTE network) opens thedoor to a middle-out network deployment that can be done incrementally.
While overlapping coverage of cellular sectors must be carefully engineered and controlled, in some LP-WANs suchas LoRa, overlapping coverage is actually an advantage. With the ability for multiple gateways to hear transmissionsfrom low-power devices, a measure of redundancy is introduced. With some care, localization of devices is possiblewhen three or more gateways receive the same LoRa packet, offering a coarse-grained alternative to on-device GPS.
Moreover, because the backhaul bandwidth from an LP-WAN gateway is limited by the low-bandwidth radionetwork itself, these gateways can be connected to the internet via modest-speed cellular connections, in effectmaking LP-WANs an overlay network on top of cellular. These factors enable rapid establishment of LP-WANs forsmart city (and other) applications. An overlay approach allows LP-WAN networks to be built out incrementally,and the cost of the cellular connection can be amortized over thousands of LP-WAN nodes.
The fact that LP-WANs are not established actually has a further advantage. With no standing assumptions aboutnetwork architecture, the creation of an open, programmable network is a real possibility. Integrating commoditycomputers with LP-WAN gateways and open source virtualization tools creates an exciting possibility of a newkind of network that is very well matched to the smart city design criteria.
3) LP-WAN Summary: In The Innovator’s Dilemma, Christensen [15] describes disruptive technologies as
...technologies that result in worse product performance, at least in the near-term... Disruptive tech-nologies bring to a market a very different value proposition than had been available previously. Generally,disruptive technologies underperform established products in mainstream markets. But they have otherfeatures that a few fringe (and generally new) customers value...
4http://www.onrampwireless.com5http://www.sigfox.com
7
Crowdsourced Traffic Calming
We see LP-WANs as a potential disruptor to today’s mainstream cellular networks. They underperform in mainstreammarkets, but they offer low-power operation, inexpensive buildout, and some hope for edgeless computing–especiallyappealing to the emerging market of the smart city (and, more generally, to the IoT). Not all disruptors succeed. Butthose that do often completely overturn existing markets and existing players. We believe LP-WANs are particularlywell-suited for smart cities when they are deployed openly and augmented with core services and edgeless computingcapabilities.
D. Crowdsourcing Information in the Smart City
©2015-2017byBobIannucci
OpenDeviceEcosystem
OpenProgrammingEcosystem
OpenLP-WANandCoreServices
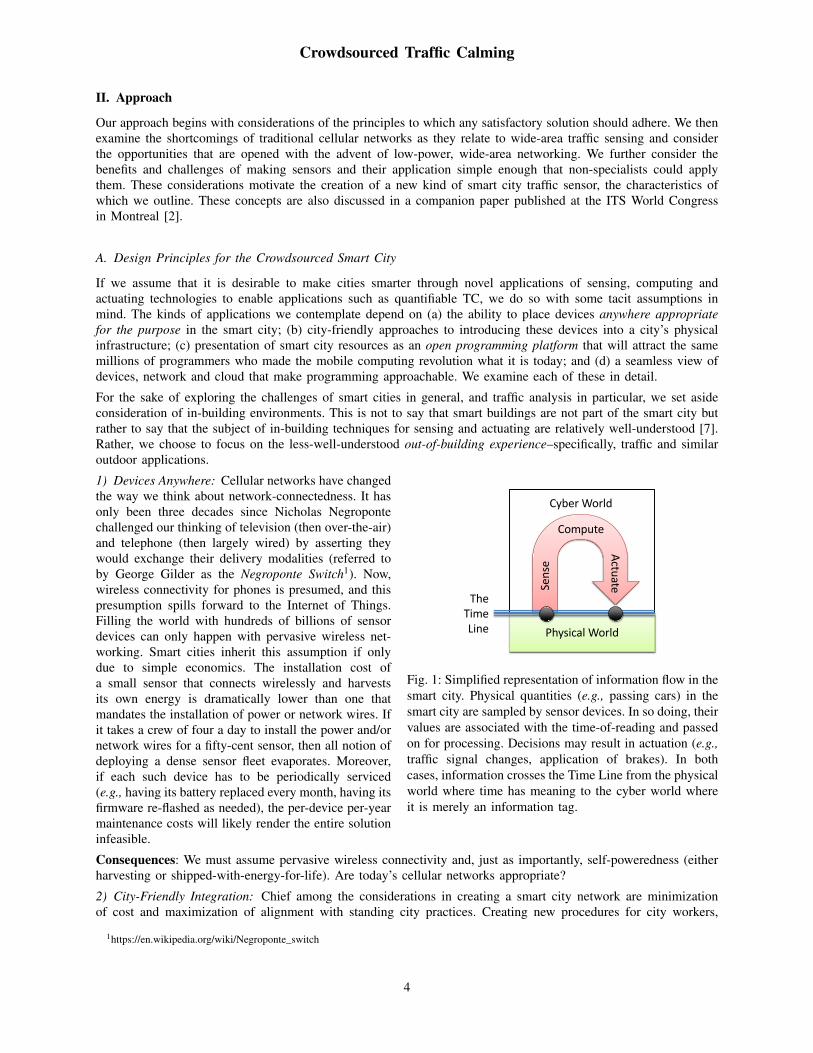
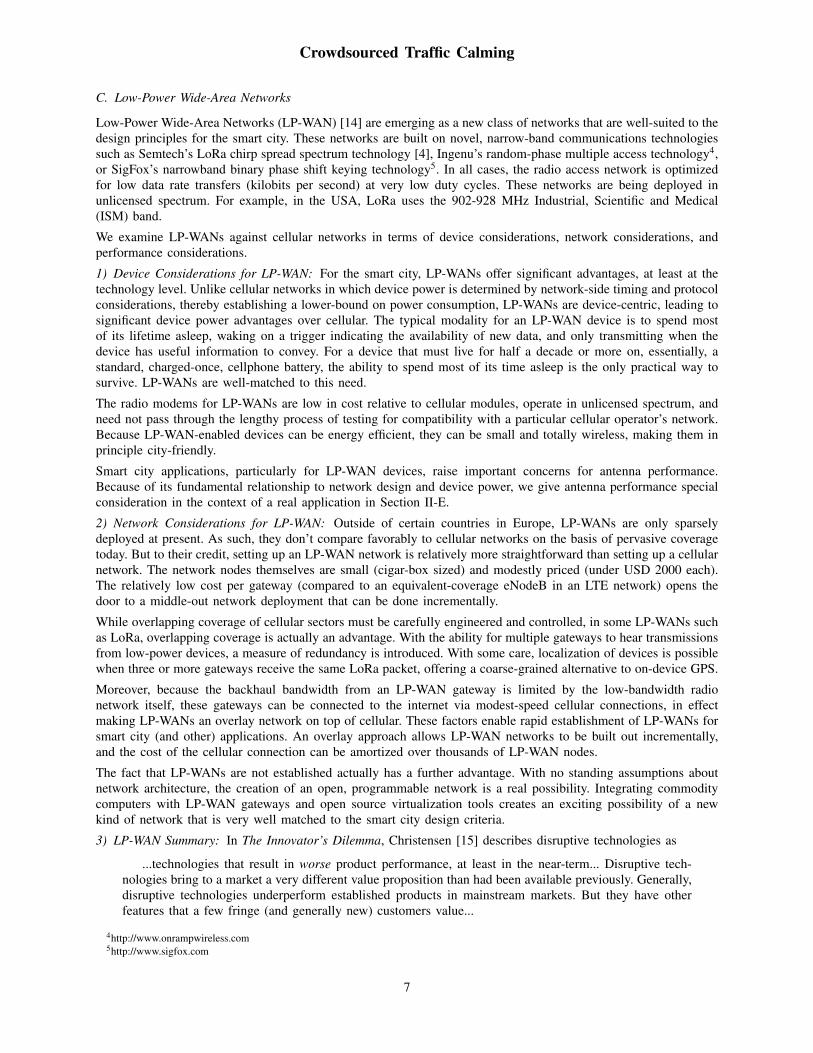
Fig. 2: An open LP-WAN with core services and edgelesscomputing is the essential “middle” of the crowdsourcedsmart city.
In an earlier project aimed at reducing the cost of gath-ering data for early earthquake warning using ordinarymobile phones [16], we were awakened to the powerof the crowd. Motivated by this, and considering the(disruptive) potential of LP-WANs, we are struck withan interesting observation. The traditional smart cityapproach is rather top-down, with a presumption thatsome number of specific vertical applications will beproposed, specified, funded and built out, and possiblyat high (prohibitive?) cost due to networking complex-ities, the need to provide power and/or networking tosensors, and all the issues related to permitting andfinancing such work.
What if we dispensed with the concept of a bespokebuilt infrastructure for smart city functionality and,instead, incrementally built an LP-WAN, augmentedwith computing embedded in the network along withsome basic cloud-side services for device enrollment?This smart city ad-hoc platform could be opened tonon-specialist application developers with the challengeto build novel smart city apps. While at first blush thismay seem outlandish, the possibilities are quite real.
As has been seen in the recent movements toward single-board-computer-enabled projects (e.g., Arduino6, RaspberryPi7), a common hardware platform and suitable example applications enable significant innovation. We see it asbeneficial to consider how smart city infrastructure should be made open to hardware and software developers andto encourage wide participation in an incremental build-out of enablers for novel applications.
©2015-2017byBobIannucci
Programming&Run-timesystem
USING [ e23, e97 ]DO [ b1 ]SYNCHRONIZED TO c19 WITHTOLERANCE x ONERROR [ b2 ]
Visualization
LocalizationDatabase
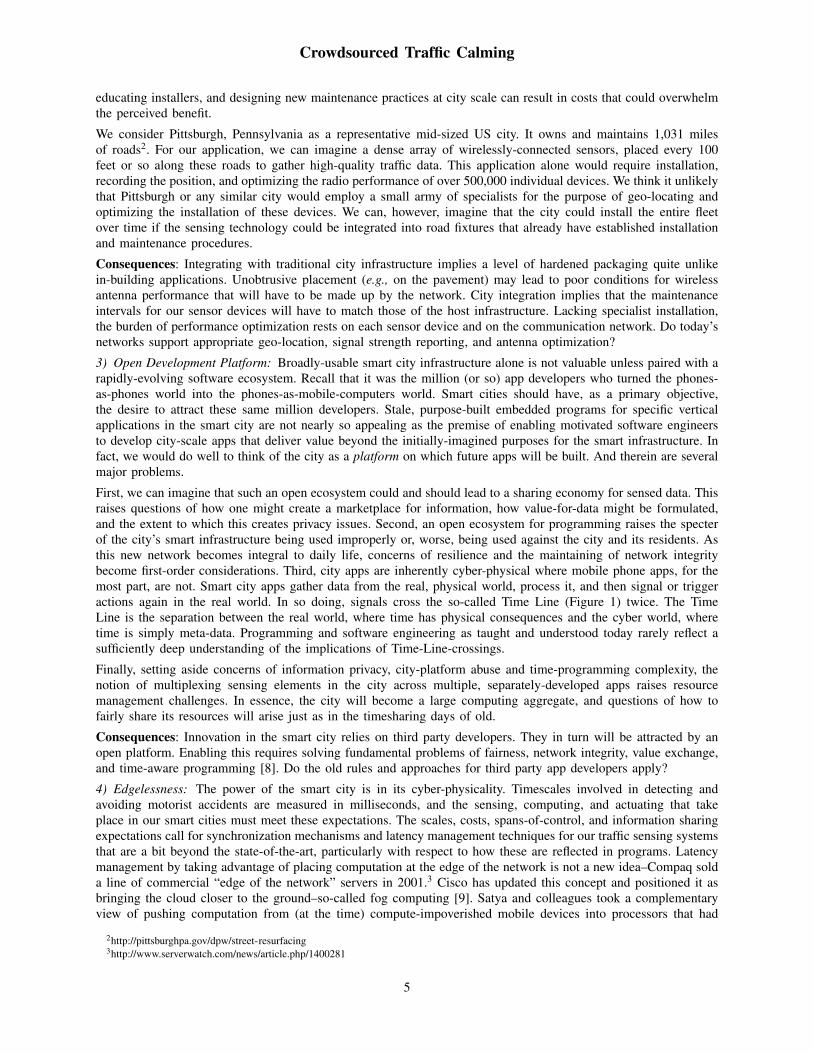
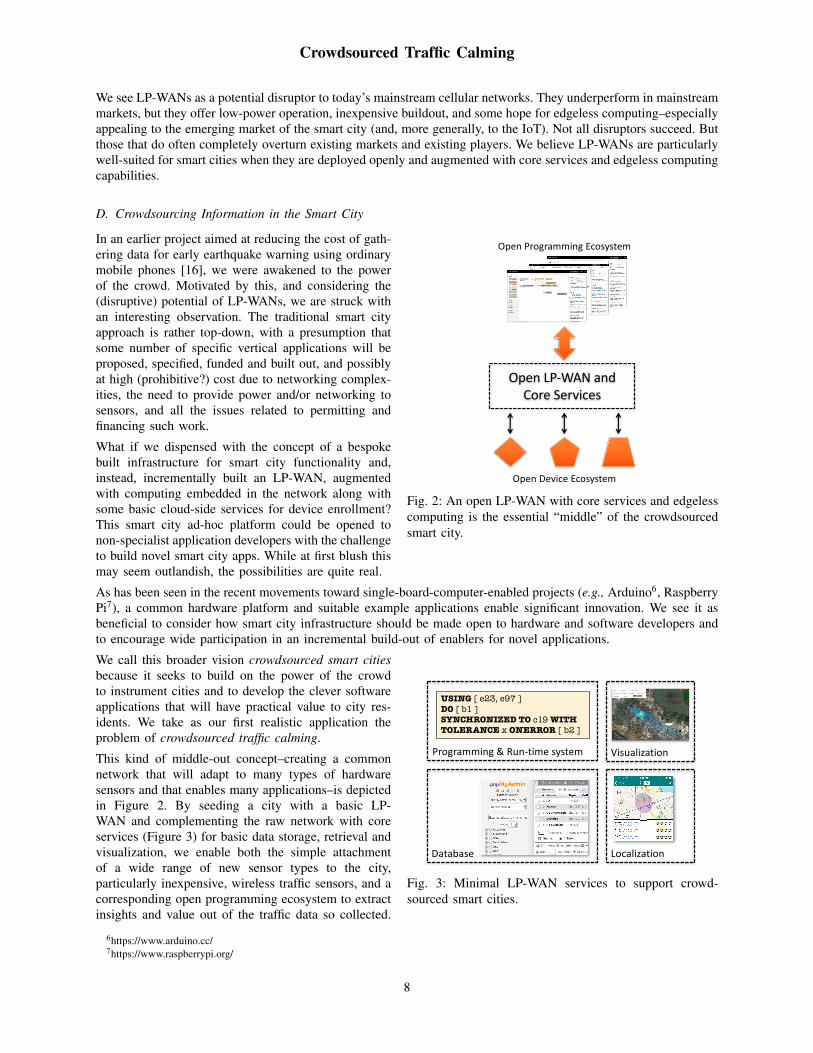
Fig. 3: Minimal LP-WAN services to support crowd-sourced smart cities.
We call this broader vision crowdsourced smart citiesbecause it seeks to build on the power of the crowdto instrument cities and to develop the clever softwareapplications that will have practical value to city res-idents. We take as our first realistic application theproblem of crowdsourced traffic calming.
This kind of middle-out concept–creating a commonnetwork that will adapt to many types of hardwaresensors and that enables many applications–is depictedin Figure 2. By seeding a city with a basic LP-WAN and complementing the raw network with coreservices (Figure 3) for basic data storage, retrieval andvisualization, we enable both the simple attachmentof a wide range of new sensor types to the city,particularly inexpensive, wireless traffic sensors, and acorresponding open programming ecosystem to extractinsights and value out of the traffic data so collected.
6https://www.arduino.cc/7https://www.raspberrypi.org/
8
Crowdsourced Traffic Calming
The common middle is a foundation for sensed-data storage, processing and visualization–elements that wouldotherwise have to be re-created for each smart city project. By sharing these, we accelerate development. Byproviding the means for participants in the crowdsourced smart city, especially non-specialist participants, to makedata available to one another, we potentially open new kinds of applications that no one might have been able toundertake.
The possibilities of such large-scale information sharing must be balanced against privacy and security concernsand the need to maintain resilience of the network itself.
E. Bringing the elements together: Crowdsourced Traffic Calming
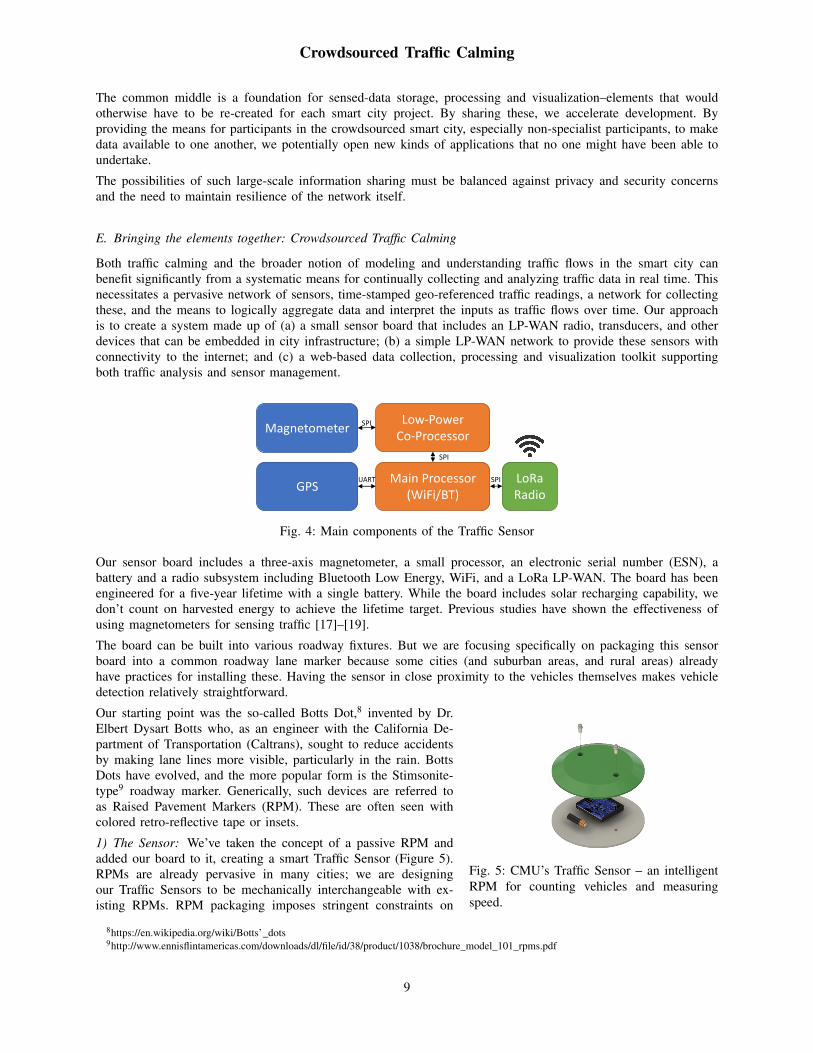
Both traffic calming and the broader notion of modeling and understanding traffic flows in the smart city canbenefit significantly from a systematic means for continually collecting and analyzing traffic data in real time. Thisnecessitates a pervasive network of sensors, time-stamped geo-referenced traffic readings, a network for collectingthese, and the means to logically aggregate data and interpret the inputs as traffic flows over time. Our approachis to create a system made up of (a) a small sensor board that includes an LP-WAN radio, transducers, and otherdevices that can be embedded in city infrastructure; (b) a simple LP-WAN network to provide these sensors withconnectivity to the internet; and (c) a web-based data collection, processing and visualization toolkit supportingboth traffic analysis and sensor management.
Magnetometer
MainProcessor
(WiFi/BT)
Low-Power
Co-Processor
GPSLoRa
Radio
SPI
UART SPI
SPI
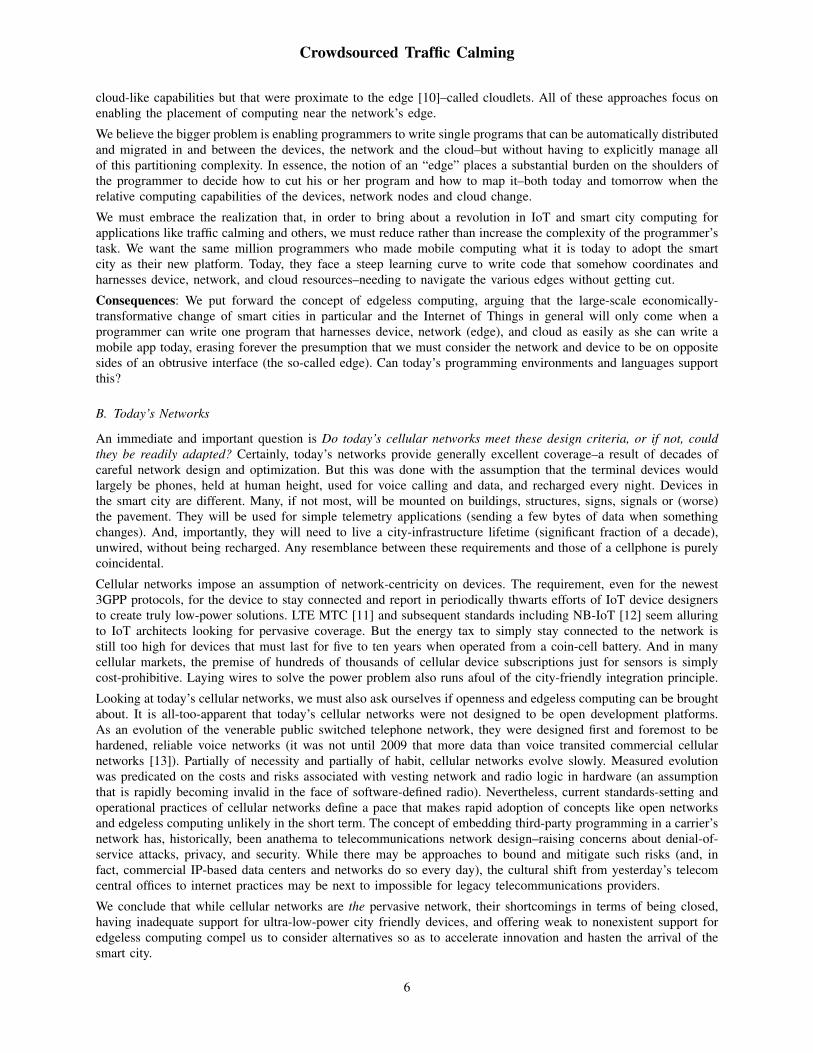
Fig. 4: Main components of the Traffic Sensor
Our sensor board includes a three-axis magnetometer, a small processor, an electronic serial number (ESN), abattery and a radio subsystem including Bluetooth Low Energy, WiFi, and a LoRa LP-WAN. The board has beenengineered for a five-year lifetime with a single battery. While the board includes solar recharging capability, wedon’t count on harvested energy to achieve the lifetime target. Previous studies have shown the effectiveness ofusing magnetometers for sensing traffic [17]–[19].
The board can be built into various roadway fixtures. But we are focusing specifically on packaging this sensorboard into a common roadway lane marker because some cities (and suburban areas, and rural areas) alreadyhave practices for installing these. Having the sensor in close proximity to the vehicles themselves makes vehicledetection relatively straightforward.
Fig. 5: CMU’s Traffic Sensor – an intelligentRPM for counting vehicles and measuringspeed.
Our starting point was the so-called Botts Dot,8 invented by Dr.Elbert Dysart Botts who, as an engineer with the California De-partment of Transportation (Caltrans), sought to reduce accidentsby making lane lines more visible, particularly in the rain. BottsDots have evolved, and the more popular form is the Stimsonite-type9 roadway marker. Generically, such devices are referred toas Raised Pavement Markers (RPM). These are often seen withcolored retro-reflective tape or insets.
1) The Sensor: We’ve taken the concept of a passive RPM andadded our board to it, creating a smart Traffic Sensor (Figure 5).RPMs are already pervasive in many cities; we are designingour Traffic Sensors to be mechanically interchangeable with ex-isting RPMs. RPM packaging imposes stringent constraints on
8https://en.wikipedia.org/wiki/Botts’_dots9http://www.ennisflintamericas.com/downloads/dl/file/id/38/product/1038/brochure_model_101_rpms.pdf
9
Crowdsourced Traffic Calming
size/shape, mechanical loading, water-tightness, inaccessibility post-installation (we call this the OHIO principle–wecan Only Handle It Once), thermal stresses (-20°F to 150°F or worse), and the occasional snowplow. Size and shapeconstrain the dimensions of the all-important LP-WAN antenna which we consider below.
To effectively monitor traffic flows, our Traffic Sensors can be placed judiciously, for example, at points leadinginto and emerging from intersections. Where speed on a long roadway is a concern, a Traffic Sensor can be placedexactly where the measurement would be most meaningful.
In order to correctly geo-reference its readings, the location of each Traffic Sensor must be recorded. This can beaccomplished (a) at installation time by manually recording each Traffic Sensor’s ESN, its latitude and its longitude,(b) post-installation using a drive-by technique with a smartphone app to capture wirelessly-beaconed ESNs andto records the phone’s corresponding GPS position, (c) by the LP-WAN network or (d) by the Traffic Sensor itself(we’ve built in a GPS receiver for this purpose). We are exploring the accuracy by which the network can localizeTraffic Sensors. Network-based localization, if adequately accurate, could make geo-referencing of Traffic Sensorstransparent to city practices and could obviate inclusion of a GPS module.
©2015,2016byBobIannucci
PathLossCable
Cable
Antenna Antenna
EffectivePo
wer(d
Bm)
RxMargin
1
Tx Rx
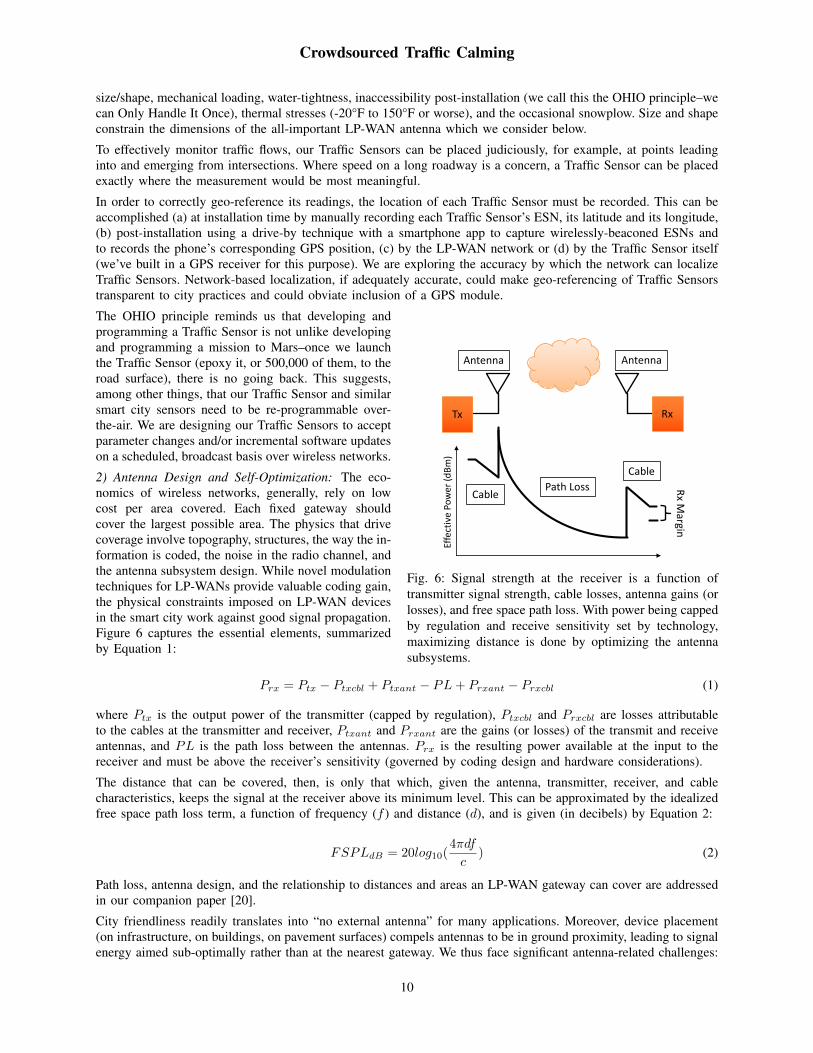
Fig. 6: Signal strength at the receiver is a function oftransmitter signal strength, cable losses, antenna gains (orlosses), and free space path loss. With power being cappedby regulation and receive sensitivity set by technology,maximizing distance is done by optimizing the antennasubsystems.
The OHIO principle reminds us that developing andprogramming a Traffic Sensor is not unlike developingand programming a mission to Mars–once we launchthe Traffic Sensor (epoxy it, or 500,000 of them, to theroad surface), there is no going back. This suggests,among other things, that our Traffic Sensor and similarsmart city sensors need to be re-programmable over-the-air. We are designing our Traffic Sensors to acceptparameter changes and/or incremental software updateson a scheduled, broadcast basis over wireless networks.
2) Antenna Design and Self-Optimization: The eco-nomics of wireless networks, generally, rely on lowcost per area covered. Each fixed gateway shouldcover the largest possible area. The physics that drivecoverage involve topography, structures, the way the in-formation is coded, the noise in the radio channel, andthe antenna subsystem design. While novel modulationtechniques for LP-WANs provide valuable coding gain,the physical constraints imposed on LP-WAN devicesin the smart city work against good signal propagation.Figure 6 captures the essential elements, summarizedby Equation 1:
Prx = Ptx − Ptxcbl + Ptxant − PL+ Prxant − Prxcbl (1)
where Ptx is the output power of the transmitter (capped by regulation), Ptxcbl and Prxcbl are losses attributableto the cables at the transmitter and receiver, Ptxant and Prxant are the gains (or losses) of the transmit and receiveantennas, and PL is the path loss between the antennas. Prx is the resulting power available at the input to thereceiver and must be above the receiver’s sensitivity (governed by coding design and hardware considerations).
The distance that can be covered, then, is only that which, given the antenna, transmitter, receiver, and cablecharacteristics, keeps the signal at the receiver above its minimum level. This can be approximated by the idealizedfree space path loss term, a function of frequency (f ) and distance (d), and is given (in decibels) by Equation 2:
FSPLdB = 20log10(4πdf
c) (2)
Path loss, antenna design, and the relationship to distances and areas an LP-WAN gateway can cover are addressedin our companion paper [20].
City friendliness readily translates into “no external antenna” for many applications. Moreover, device placement(on infrastructure, on buildings, on pavement surfaces) compels antennas to be in ground proximity, leading to signalenergy aimed sub-optimally rather than at the nearest gateway. We thus face significant antenna-related challenges:
10
Crowdsourced Traffic Calming
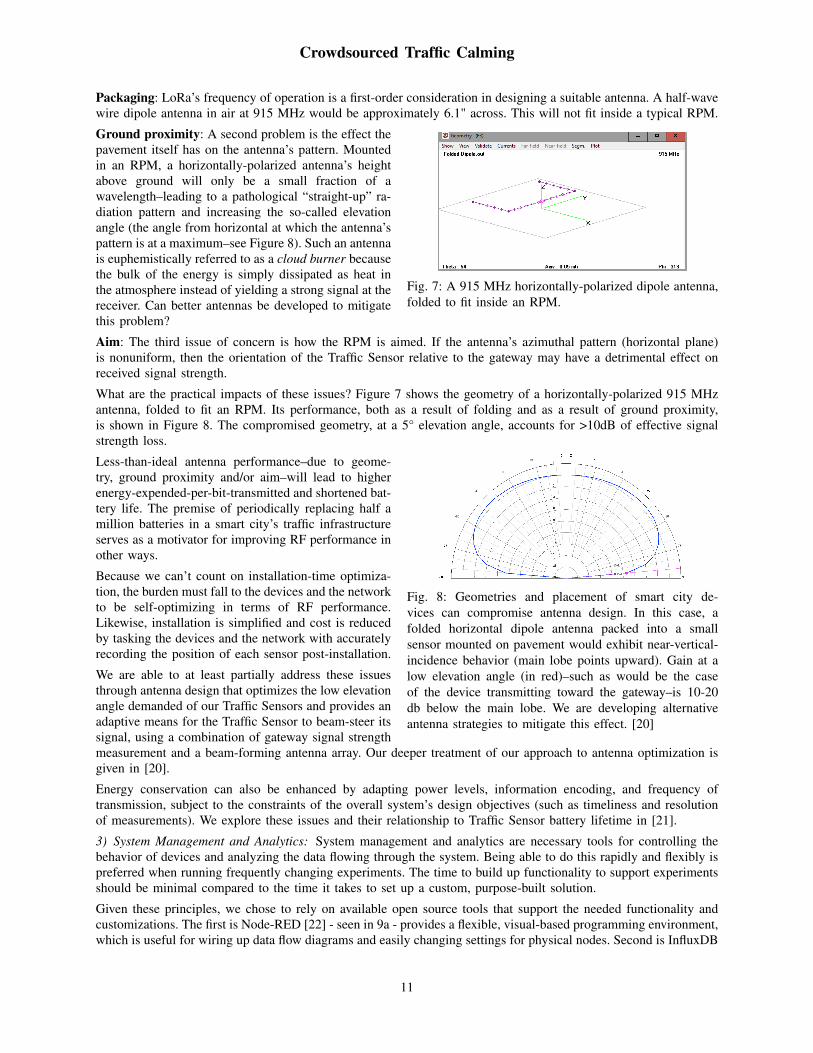
Packaging: LoRa’s frequency of operation is a first-order consideration in designing a suitable antenna. A half-wavewire dipole antenna in air at 915 MHz would be approximately 6.1" across. This will not fit inside a typical RPM.
Fig. 7: A 915 MHz horizontally-polarized dipole antenna,folded to fit inside an RPM.
Ground proximity: A second problem is the effect thepavement itself has on the antenna’s pattern. Mountedin an RPM, a horizontally-polarized antenna’s heightabove ground will only be a small fraction of awavelength–leading to a pathological “straight-up” ra-diation pattern and increasing the so-called elevationangle (the angle from horizontal at which the antenna’spattern is at a maximum–see Figure 8). Such an antennais euphemistically referred to as a cloud burner becausethe bulk of the energy is simply dissipated as heat inthe atmosphere instead of yielding a strong signal at thereceiver. Can better antennas be developed to mitigatethis problem?
Aim: The third issue of concern is how the RPM is aimed. If the antenna’s azimuthal pattern (horizontal plane)is nonuniform, then the orientation of the Traffic Sensor relative to the gateway may have a detrimental effect onreceived signal strength.
What are the practical impacts of these issues? Figure 7 shows the geometry of a horizontally-polarized 915 MHzantenna, folded to fit an RPM. Its performance, both as a result of folding and as a result of ground proximity,is shown in Figure 8. The compromised geometry, at a 5° elevation angle, accounts for >10dB of effective signalstrength loss.
Fig. 8: Geometries and placement of smart city de-vices can compromise antenna design. In this case, afolded horizontal dipole antenna packed into a smallsensor mounted on pavement would exhibit near-vertical-incidence behavior (main lobe points upward). Gain at alow elevation angle (in red)–such as would be the caseof the device transmitting toward the gateway–is 10-20db below the main lobe. We are developing alternativeantenna strategies to mitigate this effect. [20]
Less-than-ideal antenna performance–due to geome-try, ground proximity and/or aim–will lead to higherenergy-expended-per-bit-transmitted and shortened bat-tery life. The premise of periodically replacing half amillion batteries in a smart city’s traffic infrastructureserves as a motivator for improving RF performance inother ways.
Because we can’t count on installation-time optimiza-tion, the burden must fall to the devices and the networkto be self-optimizing in terms of RF performance.Likewise, installation is simplified and cost is reducedby tasking the devices and the network with accuratelyrecording the position of each sensor post-installation.
We are able to at least partially address these issuesthrough antenna design that optimizes the low elevationangle demanded of our Traffic Sensors and provides anadaptive means for the Traffic Sensor to beam-steer itssignal, using a combination of gateway signal strengthmeasurement and a beam-forming antenna array. Our deeper treatment of our approach to antenna optimization isgiven in [20].
Energy conservation can also be enhanced by adapting power levels, information encoding, and frequency oftransmission, subject to the constraints of the overall system’s design objectives (such as timeliness and resolutionof measurements). We explore these issues and their relationship to Traffic Sensor battery lifetime in [21].
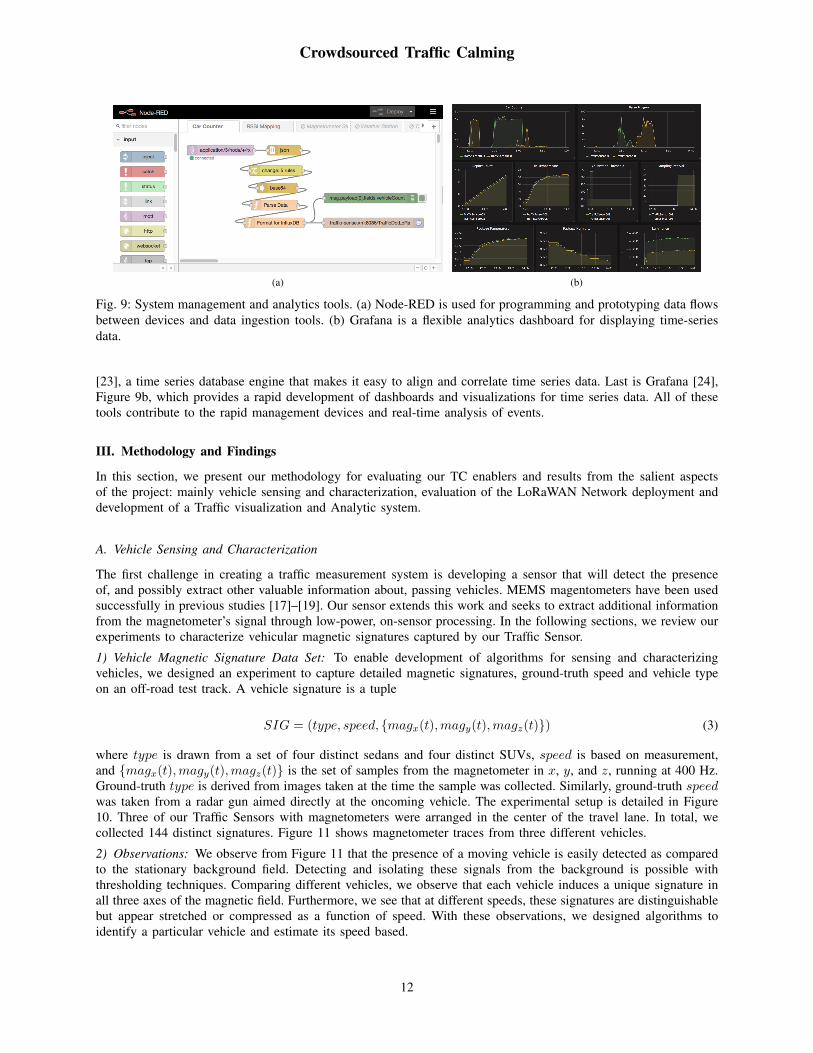
3) System Management and Analytics: System management and analytics are necessary tools for controlling thebehavior of devices and analyzing the data flowing through the system. Being able to do this rapidly and flexibly ispreferred when running frequently changing experiments. The time to build up functionality to support experimentsshould be minimal compared to the time it takes to set up a custom, purpose-built solution.
Given these principles, we chose to rely on available open source tools that support the needed functionality andcustomizations. The first is Node-RED [22] - seen in 9a - provides a flexible, visual-based programming environment,which is useful for wiring up data flow diagrams and easily changing settings for physical nodes. Second is InfluxDB
11
Crowdsourced Traffic Calming
(a) (b)
Fig. 9: System management and analytics tools. (a) Node-RED is used for programming and prototyping data flowsbetween devices and data ingestion tools. (b) Grafana is a flexible analytics dashboard for displaying time-seriesdata.
[23], a time series database engine that makes it easy to align and correlate time series data. Last is Grafana [24],Figure 9b, which provides a rapid development of dashboards and visualizations for time series data. All of thesetools contribute to the rapid management devices and real-time analysis of events.
III. Methodology and Findings
In this section, we present our methodology for evaluating our TC enablers and results from the salient aspectsof the project: mainly vehicle sensing and characterization, evaluation of the LoRaWAN Network deployment anddevelopment of a Traffic visualization and Analytic system.
A. Vehicle Sensing and Characterization
The first challenge in creating a traffic measurement system is developing a sensor that will detect the presenceof, and possibly extract other valuable information about, passing vehicles. MEMS magentometers have been usedsuccessfully in previous studies [17]–[19]. Our sensor extends this work and seeks to extract additional informationfrom the magnetometer’s signal through low-power, on-sensor processing. In the following sections, we review ourexperiments to characterize vehicular magnetic signatures captured by our Traffic Sensor.
1) Vehicle Magnetic Signature Data Set: To enable development of algorithms for sensing and characterizingvehicles, we designed an experiment to capture detailed magnetic signatures, ground-truth speed and vehicle typeon an off-road test track. A vehicle signature is a tuple
SIG = (type, speed, {magx(t),magy(t),magz(t)}) (3)
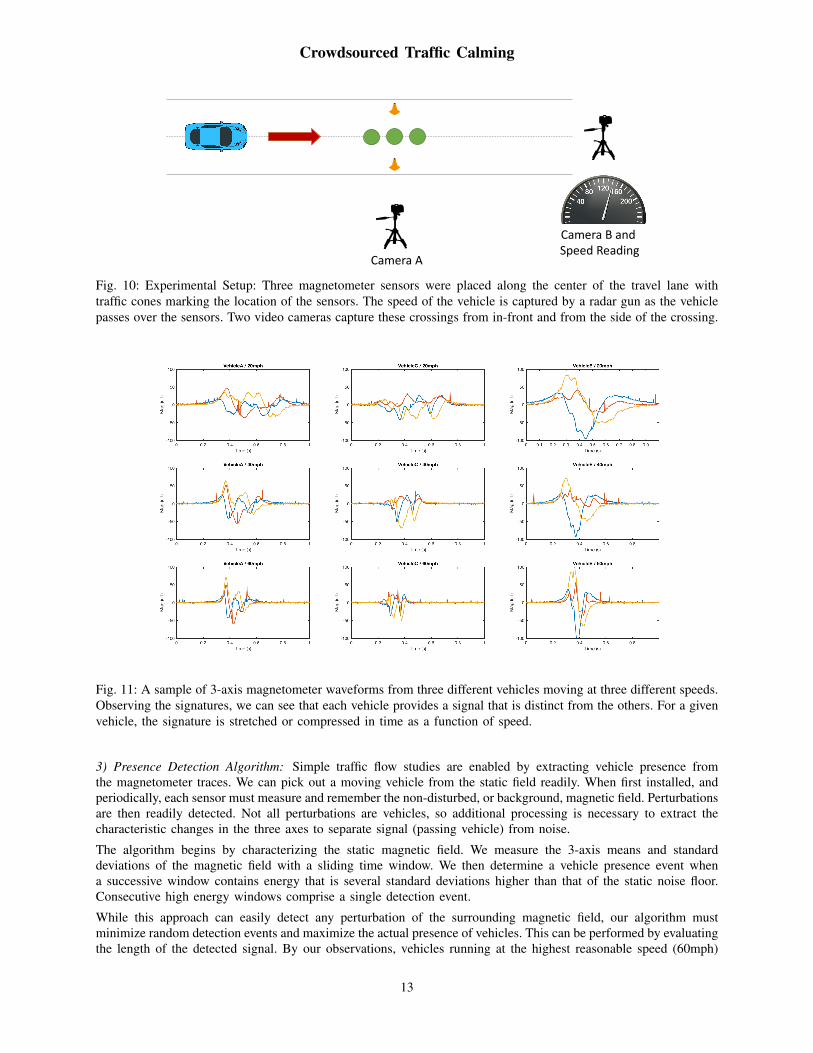
where type is drawn from a set of four distinct sedans and four distinct SUVs, speed is based on measurement,and {magx(t),magy(t),magz(t)} is the set of samples from the magnetometer in x, y, and z, running at 400 Hz.Ground-truth type is derived from images taken at the time the sample was collected. Similarly, ground-truth speedwas taken from a radar gun aimed directly at the oncoming vehicle. The experimental setup is detailed in Figure10. Three of our Traffic Sensors with magnetometers were arranged in the center of the travel lane. In total, wecollected 144 distinct signatures. Figure 11 shows magnetometer traces from three different vehicles.
2) Observations: We observe from Figure 11 that the presence of a moving vehicle is easily detected as comparedto the stationary background field. Detecting and isolating these signals from the background is possible withthresholding techniques. Comparing different vehicles, we observe that each vehicle induces a unique signature inall three axes of the magnetic field. Furthermore, we see that at different speeds, these signatures are distinguishablebut appear stretched or compressed as a function of speed. With these observations, we designed algorithms toidentify a particular vehicle and estimate its speed based.
12
Crowdsourced Traffic Calming
CameraA
CameraBandSpeedReading
Fig. 10: Experimental Setup: Three magnetometer sensors were placed along the center of the travel lane withtraffic cones marking the location of the sensors. The speed of the vehicle is captured by a radar gun as the vehiclepasses over the sensors. Two video cameras capture these crossings from in-front and from the side of the crossing.
Fig. 11: A sample of 3-axis magnetometer waveforms from three different vehicles moving at three different speeds.Observing the signatures, we can see that each vehicle provides a signal that is distinct from the others. For a givenvehicle, the signature is stretched or compressed in time as a function of speed.
3) Presence Detection Algorithm: Simple traffic flow studies are enabled by extracting vehicle presence fromthe magnetometer traces. We can pick out a moving vehicle from the static field readily. When first installed, andperiodically, each sensor must measure and remember the non-disturbed, or background, magnetic field. Perturbationsare then readily detected. Not all perturbations are vehicles, so additional processing is necessary to extract thecharacteristic changes in the three axes to separate signal (passing vehicle) from noise.
The algorithm begins by characterizing the static magnetic field. We measure the 3-axis means and standarddeviations of the magnetic field with a sliding time window. We then determine a vehicle presence event whena successive window contains energy that is several standard deviations higher than that of the static noise floor.Consecutive high energy windows comprise a single detection event.
While this approach can easily detect any perturbation of the surrounding magnetic field, our algorithm mustminimize random detection events and maximize the actual presence of vehicles. This can be performed by evaluatingthe length of the detected signal. By our observations, vehicles running at the highest reasonable speed (60mph)
13
Crowdsourced Traffic Calming
will result into at least 0.2s of magnetic perturbation, given the average length of vehicles.
0 0.1 0.2 0.3 0.4 0.5 0.6 0.7 0.8 0.9 1
Time (s)
-50
0
50
Mag (
uT
)
X-axis
Y-axis
Z-axis
0 0.1 0.2 0.3 0.4 0.5 0.6 0.7 0.8 0.9 1
Time (s)
0
0.2
0.4
0.6
0.8
1
Energ
y
Window Energy
Noise Threshold
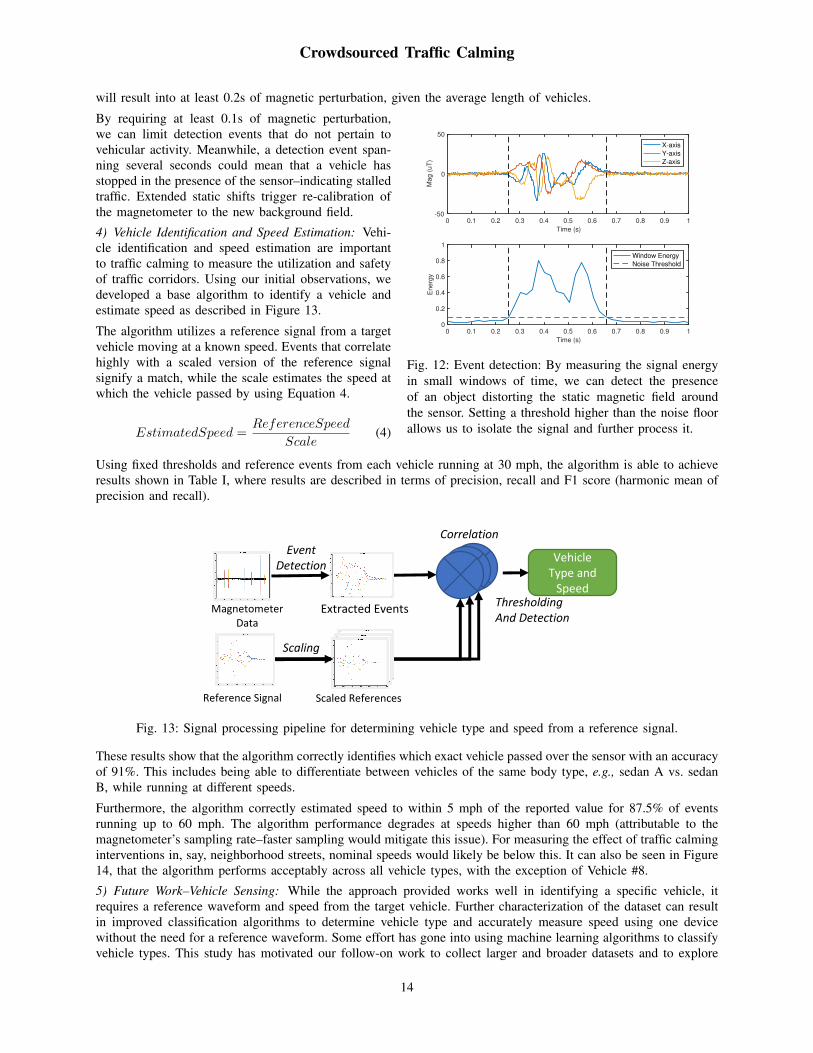
Fig. 12: Event detection: By measuring the signal energyin small windows of time, we can detect the presenceof an object distorting the static magnetic field aroundthe sensor. Setting a threshold higher than the noise floorallows us to isolate the signal and further process it.
By requiring at least 0.1s of magnetic perturbation,we can limit detection events that do not pertain tovehicular activity. Meanwhile, a detection event span-ning several seconds could mean that a vehicle hasstopped in the presence of the sensor–indicating stalledtraffic. Extended static shifts trigger re-calibration ofthe magnetometer to the new background field.
4) Vehicle Identification and Speed Estimation: Vehi-cle identification and speed estimation are importantto traffic calming to measure the utilization and safetyof traffic corridors. Using our initial observations, wedeveloped a base algorithm to identify a vehicle andestimate speed as described in Figure 13.
The algorithm utilizes a reference signal from a targetvehicle moving at a known speed. Events that correlatehighly with a scaled version of the reference signalsignify a match, while the scale estimates the speed atwhich the vehicle passed by using Equation 4.
EstimatedSpeed =ReferenceSpeed
Scale(4)
Using fixed thresholds and reference events from each vehicle running at 30 mph, the algorithm is able to achieveresults shown in Table I, where results are described in terms of precision, recall and F1 score (harmonic mean ofprecision and recall).
EventDetection
MagnetometerData
ExtractedEvents
ReferenceSignal ScaledReferences
Correlation
ThresholdingAndDetection
VehicleTypeandSpeed
Scaling
Fig. 13: Signal processing pipeline for determining vehicle type and speed from a reference signal.
These results show that the algorithm correctly identifies which exact vehicle passed over the sensor with an accuracyof 91%. This includes being able to differentiate between vehicles of the same body type, e.g., sedan A vs. sedanB, while running at different speeds.
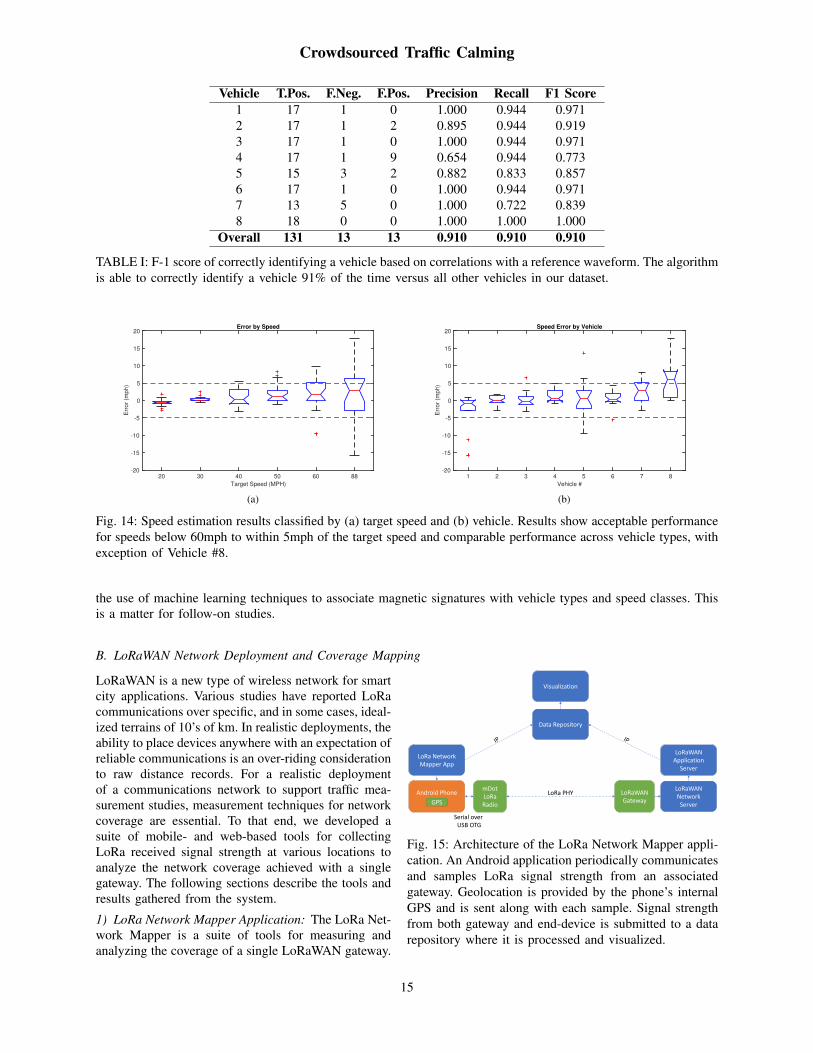
Furthermore, the algorithm correctly estimated speed to within 5 mph of the reported value for 87.5% of eventsrunning up to 60 mph. The algorithm performance degrades at speeds higher than 60 mph (attributable to themagnetometer’s sampling rate–faster sampling would mitigate this issue). For measuring the effect of traffic calminginterventions in, say, neighborhood streets, nominal speeds would likely be below this. It can also be seen in Figure14, that the algorithm performs acceptably across all vehicle types, with the exception of Vehicle #8.
5) Future Work–Vehicle Sensing: While the approach provided works well in identifying a specific vehicle, itrequires a reference waveform and speed from the target vehicle. Further characterization of the dataset can resultin improved classification algorithms to determine vehicle type and accurately measure speed using one devicewithout the need for a reference waveform. Some effort has gone into using machine learning algorithms to classifyvehicle types. This study has motivated our follow-on work to collect larger and broader datasets and to explore
14
Crowdsourced Traffic Calming
Vehicle T.Pos. F.Neg. F.Pos. Precision Recall F1 Score1 17 1 0 1.000 0.944 0.9712 17 1 2 0.895 0.944 0.9193 17 1 0 1.000 0.944 0.9714 17 1 9 0.654 0.944 0.7735 15 3 2 0.882 0.833 0.8576 17 1 0 1.000 0.944 0.9717 13 5 0 1.000 0.722 0.8398 18 0 0 1.000 1.000 1.000
Overall 131 13 13 0.910 0.910 0.910
TABLE I: F-1 score of correctly identifying a vehicle based on correlations with a reference waveform. The algorithmis able to correctly identify a vehicle 91% of the time versus all other vehicles in our dataset.
20 30 40 50 60 88
Target Speed (MPH)
-20
-15
-10
-5
0
5
10
15
20
Err
or
(mp
h)
Error by Speed
(a)
1 2 3 4 5 6 7 8
Vehicle #
-20
-15
-10
-5
0
5
10
15
20
Err
or
(mp
h)
Speed Error by Vehicle
(b)
Fig. 14: Speed estimation results classified by (a) target speed and (b) vehicle. Results show acceptable performancefor speeds below 60mph to within 5mph of the target speed and comparable performance across vehicle types, withexception of Vehicle #8.
the use of machine learning techniques to associate magnetic signatures with vehicle types and speed classes. Thisis a matter for follow-on studies.
B. LoRaWAN Network Deployment and Coverage Mapping
AndroidPhonemDot
LoRa
Radio
LoRa Network
MapperApp
GPS
LoRaWAN
Gateway
LoRaWAN
Network
Server
LoRaWAN
Application
Server
DataRepository
Visualization
LoRa PHY
Serialover
USBOTG
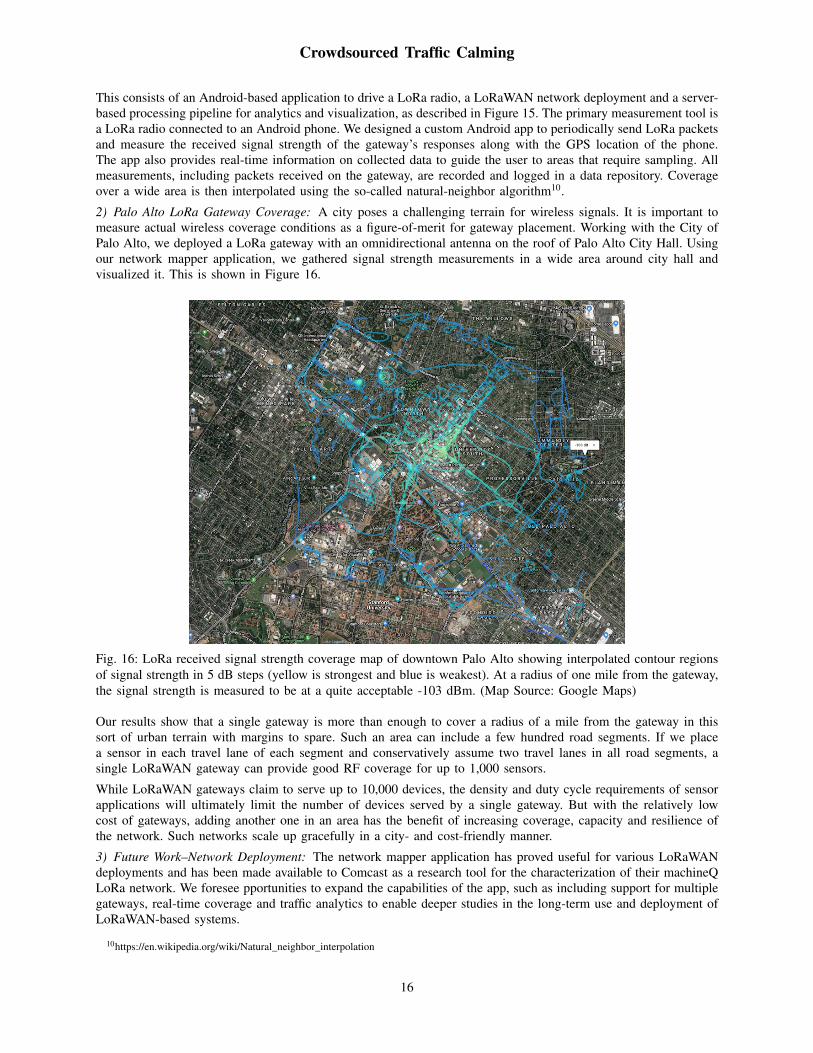
Fig. 15: Architecture of the LoRa Network Mapper appli-cation. An Android application periodically communicatesand samples LoRa signal strength from an associatedgateway. Geolocation is provided by the phone’s internalGPS and is sent along with each sample. Signal strengthfrom both gateway and end-device is submitted to a datarepository where it is processed and visualized.
LoRaWAN is a new type of wireless network for smartcity applications. Various studies have reported LoRacommunications over specific, and in some cases, ideal-ized terrains of 10’s of km. In realistic deployments, theability to place devices anywhere with an expectation ofreliable communications is an over-riding considerationto raw distance records. For a realistic deploymentof a communications network to support traffic mea-surement studies, measurement techniques for networkcoverage are essential. To that end, we developed asuite of mobile- and web-based tools for collectingLoRa received signal strength at various locations toanalyze the network coverage achieved with a singlegateway. The following sections describe the tools andresults gathered from the system.
1) LoRa Network Mapper Application: The LoRa Net-work Mapper is a suite of tools for measuring andanalyzing the coverage of a single LoRaWAN gateway.
15
Crowdsourced Traffic Calming
This consists of an Android-based application to drive a LoRa radio, a LoRaWAN network deployment and a server-based processing pipeline for analytics and visualization, as described in Figure 15. The primary measurement tool isa LoRa radio connected to an Android phone. We designed a custom Android app to periodically send LoRa packetsand measure the received signal strength of the gateway’s responses along with the GPS location of the phone.The app also provides real-time information on collected data to guide the user to areas that require sampling. Allmeasurements, including packets received on the gateway, are recorded and logged in a data repository. Coverageover a wide area is then interpolated using the so-called natural-neighbor algorithm10.
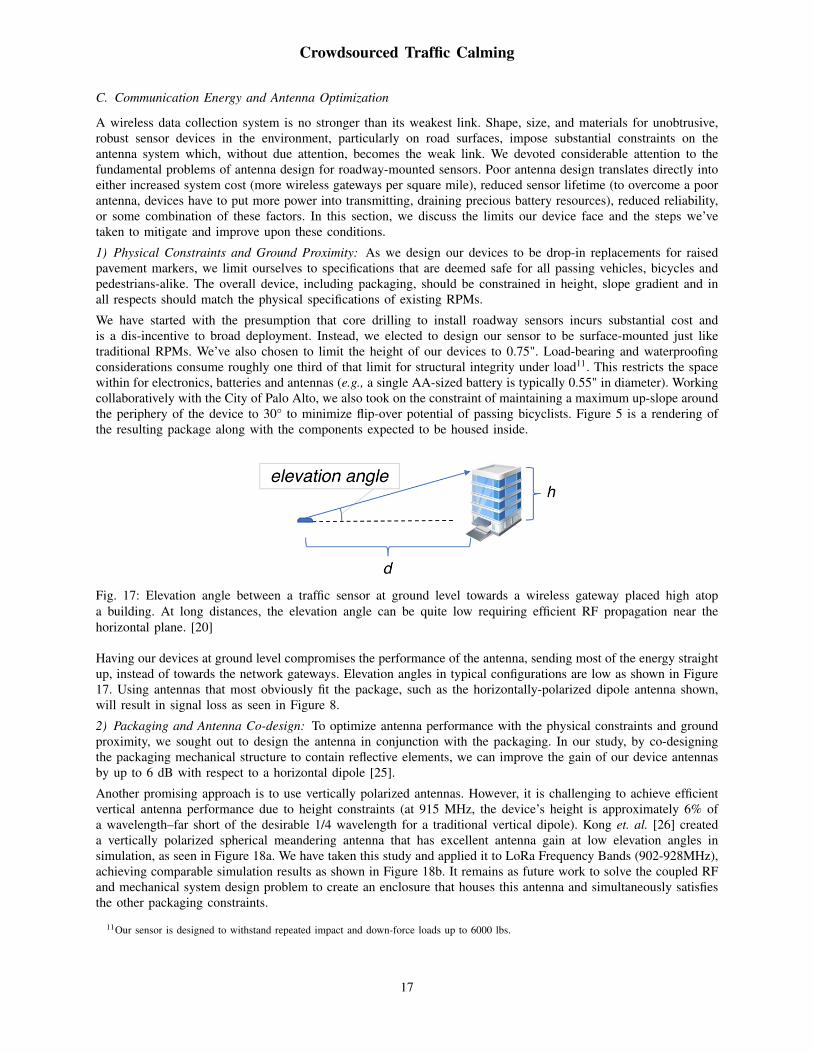
2) Palo Alto LoRa Gateway Coverage: A city poses a challenging terrain for wireless signals. It is important tomeasure actual wireless coverage conditions as a figure-of-merit for gateway placement. Working with the City ofPalo Alto, we deployed a LoRa gateway with an omnidirectional antenna on the roof of Palo Alto City Hall. Usingour network mapper application, we gathered signal strength measurements in a wide area around city hall andvisualized it. This is shown in Figure 16.
Fig. 16: LoRa received signal strength coverage map of downtown Palo Alto showing interpolated contour regionsof signal strength in 5 dB steps (yellow is strongest and blue is weakest). At a radius of one mile from the gateway,the signal strength is measured to be at a quite acceptable -103 dBm. (Map Source: Google Maps)
Our results show that a single gateway is more than enough to cover a radius of a mile from the gateway in thissort of urban terrain with margins to spare. Such an area can include a few hundred road segments. If we placea sensor in each travel lane of each segment and conservatively assume two travel lanes in all road segments, asingle LoRaWAN gateway can provide good RF coverage for up to 1,000 sensors.
While LoRaWAN gateways claim to serve up to 10,000 devices, the density and duty cycle requirements of sensorapplications will ultimately limit the number of devices served by a single gateway. But with the relatively lowcost of gateways, adding another one in an area has the benefit of increasing coverage, capacity and resilience ofthe network. Such networks scale up gracefully in a city- and cost-friendly manner.
3) Future Work–Network Deployment: The network mapper application has proved useful for various LoRaWANdeployments and has been made available to Comcast as a research tool for the characterization of their machineQLoRa network. We foresee pportunities to expand the capabilities of the app, such as including support for multiplegateways, real-time coverage and traffic analytics to enable deeper studies in the long-term use and deployment ofLoRaWAN-based systems.
10https://en.wikipedia.org/wiki/Natural_neighbor_interpolation
16
Crowdsourced Traffic Calming
C. Communication Energy and Antenna Optimization
A wireless data collection system is no stronger than its weakest link. Shape, size, and materials for unobtrusive,robust sensor devices in the environment, particularly on road surfaces, impose substantial constraints on theantenna system which, without due attention, becomes the weak link. We devoted considerable attention to thefundamental problems of antenna design for roadway-mounted sensors. Poor antenna design translates directly intoeither increased system cost (more wireless gateways per square mile), reduced sensor lifetime (to overcome a poorantenna, devices have to put more power into transmitting, draining precious battery resources), reduced reliability,or some combination of these factors. In this section, we discuss the limits our device face and the steps we’vetaken to mitigate and improve upon these conditions.
1) Physical Constraints and Ground Proximity: As we design our devices to be drop-in replacements for raisedpavement markers, we limit ourselves to specifications that are deemed safe for all passing vehicles, bicycles andpedestrians-alike. The overall device, including packaging, should be constrained in height, slope gradient and inall respects should match the physical specifications of existing RPMs.
We have started with the presumption that core drilling to install roadway sensors incurs substantial cost andis a dis-incentive to broad deployment. Instead, we elected to design our sensor to be surface-mounted just liketraditional RPMs. We’ve also chosen to limit the height of our devices to 0.75". Load-bearing and waterproofingconsiderations consume roughly one third of that limit for structural integrity under load11. This restricts the spacewithin for electronics, batteries and antennas (e.g., a single AA-sized battery is typically 0.55" in diameter). Workingcollaboratively with the City of Palo Alto, we also took on the constraint of maintaining a maximum up-slope aroundthe periphery of the device to 30° to minimize flip-over potential of passing bicyclists. Figure 5 is a rendering ofthe resulting package along with the components expected to be housed inside.
Fig. 17: Elevation angle between a traffic sensor at ground level towards a wireless gateway placed high atopa building. At long distances, the elevation angle can be quite low requiring efficient RF propagation near thehorizontal plane. [20]
Having our devices at ground level compromises the performance of the antenna, sending most of the energy straightup, instead of towards the network gateways. Elevation angles in typical configurations are low as shown in Figure17. Using antennas that most obviously fit the package, such as the horizontally-polarized dipole antenna shown,will result in signal loss as seen in Figure 8.
2) Packaging and Antenna Co-design: To optimize antenna performance with the physical constraints and groundproximity, we sought out to design the antenna in conjunction with the packaging. In our study, by co-designingthe packaging mechanical structure to contain reflective elements, we can improve the gain of our device antennasby up to 6 dB with respect to a horizontal dipole [25].
Another promising approach is to use vertically polarized antennas. However, it is challenging to achieve efficientvertical antenna performance due to height constraints (at 915 MHz, the device’s height is approximately 6% ofa wavelength–far short of the desirable 1/4 wavelength for a traditional vertical dipole). Kong et. al. [26] createda vertically polarized spherical meandering antenna that has excellent antenna gain at low elevation angles insimulation, as seen in Figure 18a. We have taken this study and applied it to LoRa Frequency Bands (902-928MHz),achieving comparable simulation results as shown in Figure 18b. It remains as future work to solve the coupled RFand mechanical system design problem to create an enclosure that houses this antenna and simultaneously satisfiesthe other packaging constraints.
11Our sensor is designed to withstand repeated impact and down-force loads up to 6000 lbs.
17

Crowdsourced Traffic Calming
(a) (b)
Fig. 18: Kong’s low height, vertically-polarized antenna in ground proximity with good performance. (a) the originalantenna tuned for 720 MHz [26]; (b) our adapted version of the antenna tuned for 915 MHz, showing a gain of5.02 dB at 5 degree takeoff angle.
3) Future Work–Antenna Optimization: We have studied the limitations and constraints of wireless traffic sensorsdeployed on pavement. Our results show that co-designing a vertically-polarized antenna with the packaging’smechanical structure will yield improvements in communication efficiency over more traditional antenna approaches,yielding important energy savings for the sensor. Further work is indicated to carry these simulations forward toan enclosure design that meets all RF and mechanical requirements.
D. Traffic Visualization and Analytics
Visualization and analytics are the tools necessary for interpreting the conditions of traffic flow in a given area.Enabling fast and real-time access to data makes it easier to make decisions on how to best proceed forward withany traffic calming intervention.
In the following sections, we detail the proposed requirements and need for visualization, discuss our current systemiteration and propose future iterations of the system.
1) Requirements: Through discussions with Traffic Management Officials from the City of Palo Alto, we definedthe metrics seen in Table II as the points of measurement that need to be analyzed. These values can be measuredby counting the number of cars that pass through a segment, measuring their speed and classifying them into avehicle type.
Name Definition
Throughput Number of vehicles passing through a road segment at any given time.
Utilization Percentage of capacity at which the road segment operates.
Travel Speed Distribution of vehicle speed along a road segment.
Vehicle Class Distribution of vehicle types along a road segment.
Traffic Flow Percentage of traffic that flows from one segment into another.
TABLE II: Metrics for Traffic Flow Analysis
The data query interface must be presented on a map to easily select and correlate the performance of one segmentcompared to another. Furthermore, it must be possible to view historical data on a segment as well as comparedifferent time ranges to determine performance changes from one road configuration to the next.
2) Map Visualization and Simulation: With the requirements set above, we have built several tools for visualizingthe defined metrics and displaying them on top of Google Maps. The data used is generated from SUMO [27], anurban mobility simulator in which we can define virtual sensors to act in place of our traffic sensors.
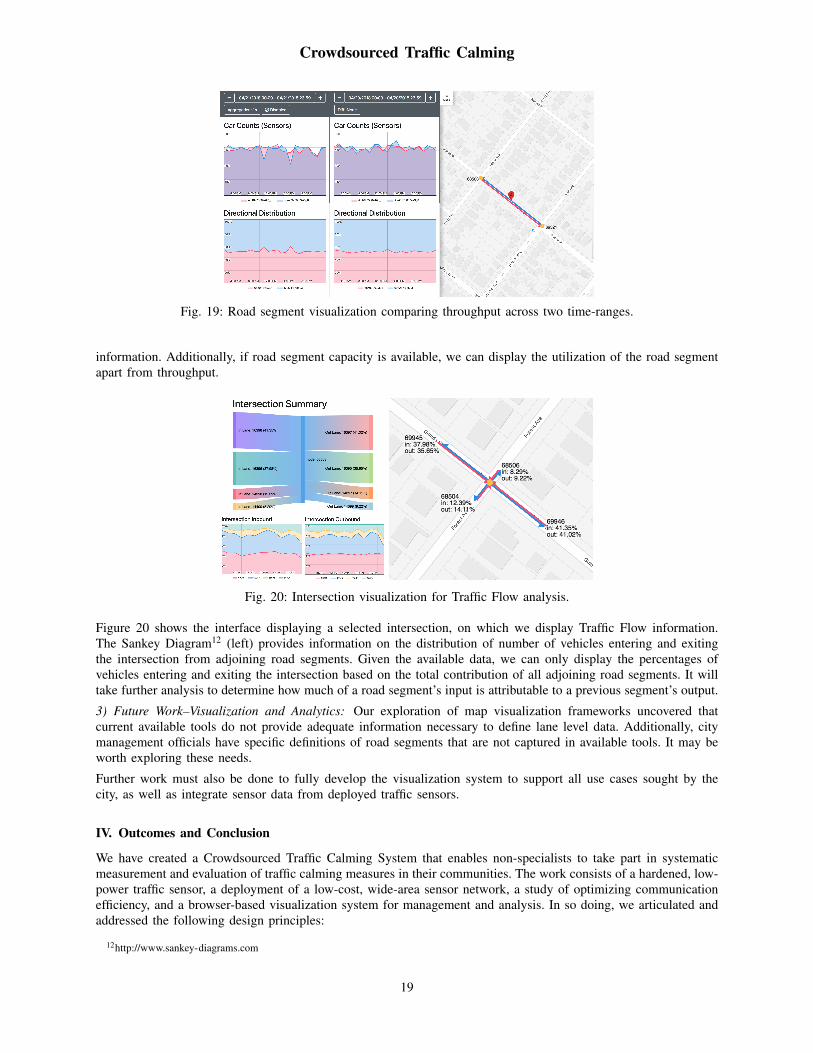
Figure 19 shows the interface displaying a selected road segment and comparing throughput across two timeranges. Data available is separated into two different travel directions, and if available, separated into per lane level
18
Crowdsourced Traffic Calming
Fig. 19: Road segment visualization comparing throughput across two time-ranges.
information. Additionally, if road segment capacity is available, we can display the utilization of the road segmentapart from throughput.
Fig. 20: Intersection visualization for Traffic Flow analysis.
Figure 20 shows the interface displaying a selected intersection, on which we display Traffic Flow information.The Sankey Diagram12 (left) provides information on the distribution of number of vehicles entering and exitingthe intersection from adjoining road segments. Given the available data, we can only display the percentages ofvehicles entering and exiting the intersection based on the total contribution of all adjoining road segments. It willtake further analysis to determine how much of a road segment’s input is attributable to a previous segment’s output.
3) Future Work–Visualization and Analytics: Our exploration of map visualization frameworks uncovered thatcurrent available tools do not provide adequate information necessary to define lane level data. Additionally, citymanagement officials have specific definitions of road segments that are not captured in available tools. It may beworth exploring these needs.
Further work must also be done to fully develop the visualization system to support all use cases sought by thecity, as well as integrate sensor data from deployed traffic sensors.
IV. Outcomes and Conclusion
We have created a Crowdsourced Traffic Calming System that enables non-specialists to take part in systematicmeasurement and evaluation of traffic calming measures in their communities. The work consists of a hardened, low-power traffic sensor, a deployment of a low-cost, wide-area sensor network, a study of optimizing communicationefficiency, and a browser-based visualization system for management and analysis. In so doing, we articulated andaddressed the following design principles:
12http://www.sankey-diagrams.com
19
Crowdsourced Traffic Calming
• Devices anywhere: We designed and deployed a new LP-WAN network supporting sensors anywhere on theroad surface. This network exhibits robust coverage, can scale to large deployments, and is supported bymeasurement and visualization tools for characterizing signal strength.
• City-friendly integration: We designed a new family of pavement-mountable sensors with lifetimes compa-rable to existing, passive RPMs. Installation requires no more expertise than with a traditional RPM. This isaccomplished with means for sensor self-localization and sensor-wireles-signal adaptation. Antenna techniquesfor maximizing signal strength subject to strict packaging considerations were explored in some depth.
• Open development platform: We created a flexible software system that allows devices of many sorts tobe enrolled in and attached to the network and for geo-referenced data to be displayed graphically. Wecreated flexible data pipelines for visualization and analysis of traffic performance, while further exploringnew programming paradigms for creating seamless smart city applications.
• Edgelessness: Our programming model supports intelligence in the endpoint sensor itself, and we opened anexploration into the application of on-sensor neural networks for processing magnetometer signals in real time.
Based on the experience in deploying the wireless network and taking field measurements, we have reasonedthrough the basic challenges and hindrances of deploying traffic sensors in city environments effectively and safelyto meet the community-centric goals of quantifying and understanding traffic flows. Three technical papers havebeen published discussing these issues in some depth.
The study was done in cooperation with the City of Palo Alto’s Transportation department that provided importantdesign constraints and success metrics (such as the ability to gather simple sensor data and produce a real-timetraffic map). In addition to our ongoing discussions with the City of Palo Alto regarding deployment of our sensorson city streets, we have also opened a discussion with San Mateo County for installing sensors there–both toprovide them with real-time data and to support our effort to build a larger dataset of vehicle signatures in supportof machine-learning-based vehicle type and speed detection.
In August of this year, we worked closely with IBM Corporation to design, plan and carry out a hackathon thatwould have included the use of our Traffic Sensors as one of several environmental data feeds. For logistical reasons,IBM chose to cancel the hackathon late in the planning process. As such, the objective of running a hackathonusing our sensors remains open. Nevertheless, over the span of this project, two graduate courses at CMU weretaught that either contributed to the design of our crowdsourced traffic calming system or used the sensor, networkand software in some beneficial way.
V. Recommendations
Our study has yielded a design for city-friendly traffic sensors and tools for management and analytics that evennon-specialists could use. It is our goal to eventually deploy these sensors en masse and gather traffic data over awide area.
A significant challenge to this involves finding safe and legal procedures for laying down sensors on active streets.While the devices themselves are not active participants in the flow of traffic, the installation procedures andliabilities for having devices in such potential danger zones limited our capacity to perform actual measurementsand experiments.
We recommend the development of policies and frameworks to enable such studies to take place, even perhaps anaccessible proving ground for traffic related technologies before continuing to actual city-scale deployments.
Acknowledgements
We wish to thank Josh Mello, former Chief Transportation Official of the City of Palo Alto as well as his teammembers Rafael Rius and Ruchika Aggarwal for their engagement with us in this project. We also wish to thankDr. Ray Buettner, Gerald Scott and the staff of the Naval Postgraduate School and the staff of the California ArmyNational Guard at Camp Roberts, California, for making the Joint Interagency Field Experimentation facilitiesavailable to us for this study.
References[1] G. D. Garrod, R. Scarpa, and K. G. Willis, “Estimating the Benefits of Traffic Calming on A Choice Experiment Approach,” vol. 36, no.
May, pp. 211–231, 2002.
20
Crowdsourced Traffic Calming
[2] B. Iannucci and A. Rowe, “Crowdsourced Smart Cities,” Intelligent Transportation Systems (ITS) World Congress, 2017.[3] LoRa-Alliance, “A technical overview of LoRa and LoRaWAN,” no. November, pp. 1–20, 2015. [Online]. Available: https://www.tuv.
com/media/corporate/products_1/electronic_components_and_lasers/TUeV_Rheinland_Overview_LoRa_and_LoRaWANtmp.pdf[4] Semtech Corporation, “LoRa Modulation Basics,” Tech. Rep. Revision 2, 2015. [Online]. Available: http://www.semtech.com/images/
datasheet/an1200.22.pdf[5] U. Noreen, A. Bounceur, and L. Clavier, “A study of LoRa low power and wide area network technology,” 2017
International Conference on Advanced Technologies for Signal and Image Processing (ATSIP), pp. 1–6, 2017. [Online]. Available:http://ieeexplore.ieee.org/document/8075570/
[6] A. J. Wixted, P. Kinnaird, H. Larijani, A. Tait, A. Ahmadinia, and N. Strachan, “Evaluation of LoRa and LoRaWAN for wireless sensornetworks,” Proceedings of IEEE Sensors, vol. 0, pp. 5–7, 2017.
[7] S. Dawson-Haggerty, A. Krioukov, J. Taneja, S. Karandikar, G. Fierro, N. Kitaev, and D. Culler, “BOSS: Building Operating SystemServices,” Proceedings of the 10th USENIX Conference on Networked Systems Design and Implementation, pp. 1–15, 2013.
[8] M. Weiss, J. Eidson, C. Barry, D. Broman, L. Goldin, B. Iannucci, E. A. Lee, and K. Stanton, “Time-Aware Applications, Computers, andCommunication Systems (TAACCS),” NIST, Tech. Rep., 2015.
[9] F. Bonomi, R. Milito, J. Zhu, and S. Addepalli, “Fog Computing and Its Role in the Internet of Things,” in MCC ’12, Helsinki, Finland,2012, pp. 13–15.
[10] M. Satyanarayanan, Z. Chent, K. Hat, W. Hut, W. Richtert, and P. Pillai, “Cloudlets: at the Leading Edge of Mobile-Cloud Convergence(invited paper),” 2014.
[11] D. Astely, E. Dahlman, G. Fodor, S. Parkvall, and J. Sachs, “LTE Release 12 and Beyond,” IEEE Communications Magazine, vol. 51,no. 7, pp. 154–160, 2013.
[12] J. Gozalvez, “New 3GPP Standard for IoT,” IEEE Vehicular Technology Magazine, vol. 11, no. 1, pp. 14–20, 2016.[13] Akamai, “The State of the Internet,” Tech. Rep. 3, 2013.[14] M. Centenaro, L. Vangelista, A. Zanella, and M. Zorzi, “Long-Range Communications in Unlicensed Bands: the Rising Stars in the IoT
and Smart City Scenarios,” IEEE Wireless Communications, pp. 1–7, 2016. [Online]. Available: http://arxiv.org/abs/1510.00620[15] C. M. Christensen, The Innovator’s Dilemma: When New Technologies Cause Great Firms to Fail. Boston, MA, USA: Harvard Business
School Press, 1997.[16] S. E. Minson, B. A. Brooks, C. L. Glennie, J. R. Murray, J. O. Langbein, S. Owen, T. Heaton, R. A. Iannucci, and
D. Hauser, “Crowdsourced Earthquake Early Warning,” Science Advances, vol. 1, no. 3, pp. 1–7, 2015. [Online]. Available:http://advances.sciencemag.org/content/1/3/e1500036.full-text.pdf+html
[17] S. Cheung, S. Coleri, B. Dundar, S. Ganesh, C.-W. Tan, and P. Varaiya, “Traffic Measurement and Vehicle Classification with SingleMagnetic Sensor,” Transportation Research Record: Journal of the Transportation Research Board, vol. 1917, no. 510, pp. 173–181,2005. [Online]. Available: http://trrjournalonline.trb.org/doi/10.3141/1917-19
[18] S.-y. Cheung, “Traffic Surveillance by Wireless Sensor Networks : Final Report,” California Path Program Institute of TransportationStudies University of California,Berkeley, vol. 1, no. January, p. 161, 2007.
[19] A. Haoui, R. Kavaler, and P. Varaiya, “Wireless magnetic sensors for traffic surveillance,” Transportation Research Part C: EmergingTechnologies, vol. 16, no. 3, pp. 294–306, 2008.
[20] A. Tadkase, N. Srinivasan, and B. Iannucci, “Combating Ground Reflection for Wireless Sensors,” Intelligent Transportation Systems (ITS)World Congress, 2017.
[21] S. Mathur, A. Sankar, P. Prasan, and B. Iannucci, “Energy Analysis of LoRaWAN Technology for Traffic Sensing Applications,” IntelligentTransportation Systems (ITS) World Congress, 2017.
[22] “Node-RED.” [Online]. Available: https://nodered.org[23] “InfluxData.” [Online]. Available: https://www.influxdata.com[24] “Grafana.” [Online]. Available: https://grafana.com[25] A. Tadkase, N. Srinivasan, and B. Iannucci, “Combating Ground Reflection for Wireless Sensors,” in Intelligent Transportation Systems
(ITS) World Congress, Montreal, Quebec, Canada, 2017.[26] M. Kong, G. Shin, S. Lee, and I. J. Yoon, “An electrically small, 3D printed folded spherical meander antenna,” 2017 Asia-Pacific
International Symposium on Electromagnetic Compatibility, APEMC 2017, pp. 102–104, 2017.[27] “SUMO - Simulation of Urban Mobility.” [Online]. Available: http://sumo.dlr.de
21