Embed Size (px)
Citation preview


The Political Culture of Democracy inMexico, Central America and Colombia, 2004
Mitchell A. SeligsonCentennial Professor of Political Science
Vanderbilt University
This publication was made possible through support provided by the USAID Missions in Colombia, El Salvador,Guatemala, Honduras, Mexico, Nicaragua, and Panama. Support was also provided by the Office of RegionalSustainable Development, Democracy and Human Rights Division, Bureau for Latin America and the Caribbean, aswell as the Office of Democracy and Governance, Bureau for Democracy, Conflict and Humanitarian Assistance, U.S.Agency for International Development, under the terms of Task Order Contract No. AEP-I-12-99-00041-00. Theopinions expressed herein are those of the author(s) and do not necessarily reflect the views of the U.S. Agency forInternational Development.


The Political Culture of Democracy in Mexico, Central America, and Colombia, 2004 i
Index
Index................................................................................................................................................ i
Index of Tables and Figures........................................................................................................ iiiIndex of Tables ........................................................................................................................................iiiIndex of Figures.......................................................................................................................................iii
Abbreviations .................................................................................................................................v
Executive Summary.................................................................................................................... vii
Preface......................................................................................................................................... xiv
Prologue ..................................................................................................................................... xviiAcknowledgements ...............................................................................................................................xxi
1.0 The Regional Context ..............................................................................................................11.1 Relationship Among the Socio-Economic and Governance Measures ............................................ 101.2 Conclusions ...................................................................................................................................... 13
2.0 Analysis and Sample Design .................................................................................................152.1 Sample Design.................................................................................................................................. 152.2 Analysis Design................................................................................................................................ 182.3 Conclusions ...................................................................................................................................... 20
3.0 Support for Democracy: Political Community, Political Legitimacy and PoliticalTolerance ..................................................................................................................................213.1 The Existence of Political Community............................................................................................. 213.2 Support for Specific Institutions....................................................................................................... 223.3 System Support................................................................................................................................. 253.4 Measurement of System Support...................................................................................................... 283.5 Political Tolerance............................................................................................................................ 313.6 Measurement of Political Tolerance................................................................................................. 313.7 Tolerance Results ............................................................................................................................. 333.8 Support for Stable Democracy.......................................................................................................... 363.9 Empirical Relationship Between Tolerance and System Support .................................................... 383.10 Conclusions .................................................................................................................................... 41
4.0 Corruption and Democracy ..................................................................................................434.1 Corruption as a Threat to Democracy: Is there a Link?.................................................................... 434.2 The Challenge: Measuring Corruption ............................................................................................. 454.3 Measuring Corruption Victimization................................................................................................ 49
4.3.1 Limitations of the Corruption-Victimization Measure..............................................................................524.4 Results: Corruption Victimization in Eleven Countries ................................................................... 524.5 Corruption Erodes Political Legitimacy ........................................................................................... 574.6 Conclusions ...................................................................................................................................... 60
5.0 Crime, the Rule of Law, and Democracy.............................................................................615.1 The Problem of Crime in Latin America: Is it a Threat to Democracy? .......................................... 61
5.1.1 Crime Rates in Latin America: A Look at the Data ..................................................................................615.1.2 Research on Crime in Latin America ........................................................................................................62

The Political Culture of Democracy in Mexico, Central America, and Colombia, 2004 ii
5.2 The Crime/Democratic Breakdown Link ......................................................................................... 635.3 Conclusions ...................................................................................................................................... 71
6.0 Local Government .................................................................................................................736.1 Level of Participation in Municipal Meetings .................................................................................. 746.2 Local Demand-Making..................................................................................................................... 766.3 Satisfaction with Local Government ................................................................................................ 776.4 Conclusions ...................................................................................................................................... 78
7.0 Social Capital and Democracy..............................................................................................797.1 Interpersonal Trust............................................................................................................................ 807.2 Levels of Participation...................................................................................................................... 817.3 Conclusions ...................................................................................................................................... 84
Appendix: Questionnaire ............................................................................................................85

The Political Culture of Democracy in Mexico, Central America, and Colombia, 2004 iii
Index of Tables and FiguresIndex of TablesTable I.1. Economic-Social and Governance Indicators for the CAM/Colombia Study .............................. 1Table I.2. Correlations Among the Economic-Social Development Indicators.......................................... 11Table I.3. Correlations Among the Governance Indicators ........................................................................ 12Table II.1. Sample Size per Country........................................................................................................... 18Table III.1 Support for Institutions by Country: Mean Scores, 0-100 Basis. ............................................. 23Table III.2. Theoretical Relationship Between Tolerance and System Support in Institutionally
Democratic Polities ............................................................................................................................ 37Table III.3. Relationship of Tolerance and System Support: Eleven-Nation Comparison ......................... 39Table IV.1 Percentage of Respondents Who Were Victimized by Bribery: Nine Countries ..................... 56Table VII.1. Percent of Respondents Participating in Civil Society Organizations ................................... 84
Index of FiguresFigure I.1. Per Capita Income in U.S. Dollars, 2002: GNI and PPP............................................................. 3Figure I.2 Mean Capital Goods per Country, Based on 2004 Survey........................................................... 4Figure I.3 Under-Five Infant Mortality, 2001............................................................................................... 5Figure I.4 Voice and Accountability, 2002................................................................................................... 6Figure I.5 Political Stability, 2002 ................................................................................................................ 7Figure I.6 Government Effectiveness, 2002 ................................................................................................. 8Figure I.7 Rule of Law, 2002........................................................................................................................ 9Figure I.8 Presidential Popularity, 2004 ..................................................................................................... 10Figure II.1. Sample Countries, CAM Region Plus Colombia..................................................................... 16Figure III.1 Pride in Nationality.................................................................................................................. 22Figure III.2 Trust in Institutions: Averages for Pooled Data ...................................................................... 24Figure III.4 System Support on Costa Rica: 1978-1999 ............................................................................. 27Figure III.5 System Support, Ten-Country Comparison: Standardized Results: Controlled vs.
Uncontrolled....................................................................................................................................... 30Figure III.6 System Support, Ten-Country Comparison: Unstandardized Results (0-100 Basis) .............. 31Figure III.7 Political Tolerance: Ten-Country Comparison: Controlled vs. Uncontrolled Standardized
Results ................................................................................................................................................ 34Figure III.8 Political Tolerance: Ten-Nation Comparison: Confidence Intervals of Standardized Results
With Controls ..................................................................................................................................... 35Figure III.9 Political Tolerance: Ten-Nation Comparison: Differential Impact of Control Variables ....... 36Figure III.10 Percent of the Population With Attitudes Conducive to Stable Democracy: Eleven Countries
............................................................................................................................................................ 40Figure III.11 Support for Stable Democracy: Eleven-Country Comparison: Normalized Results,
Controlled........................................................................................................................................... 41Figure IV.1 Transparency International Corruption Perception Index for Latin America, 2002 ............... 48Figure IV.2 World Bank Institute Corruption Control Index, 2001/2002 .................................................. 48Figure IV.3 Transparency CPI vs. Corruption Victimization ..................................................................... 53Figure IV.4 Transparency CPI Index of Corruption ................................................................................... 54Figure IV.5 Residual Scores of Public Employee Bribery ......................................................................... 55Figure IV.6 Corruption Victimization: Nine Countries .............................................................................. 56Figure IV.7 Impact of Corruption Victimization on System Support......................................................... 59Figure IV.8 Impact of Corruption Victimization on System Support: Mexico and Honduras ................... 60Figure V.1 Crime Victimization in Last Year............................................................................................. 65Figure V.2 Crime Victimization: Urban vs. Rural...................................................................................... 66

The Political Culture of Democracy in Mexico, Central America, and Colombia, 2004 iv
Figure V.3 Impact of Crime Victimization on System Support.................................................................. 67Figure V.4 Impact of Crime Victimization on Belief of Getting a Fair Trial ............................................. 68Figure V.5 Trust in the Justice System ....................................................................................................... 69Figure V.6 Impact of Crime Victimization on Trust in the Justice System................................................ 70Figure V.7 Reporting of Crimes Among Victims....................................................................................... 71Figure VI.1 Participation in a Municipal Meeting in the Last Year ........................................................... 74Figure VI.2 Impact of Urbanizaton on Municipal Meeting Participation................................................... 75Figure VI.3 Municipal Participation, Controlled vs. Uncontrolled ............................................................ 76Figure VI.4 Demand-Making on Local Government.................................................................................. 77Figure VI.5 Satisfaction With Local Government Services........................................................................ 78Figure VII.1 Interpersonal Trust ................................................................................................................. 80Figure VII.2 Civil Society Participation: All Countries Except Bolivia and the Dominican Republic ...... 81Figure VII.3 Civil Society Participation by Gender.................................................................................... 82Figure VII.4 Total Index of Civil Society Participation (Coded as “Yes/No”) .......................................... 83

The Political Culture of Democracy in Mexico, Central America, and Colombia, 2004 v
Abbreviations
LAPOP Latin American Public Opinion Project
USAID United Stated Agency for International Development


The Political Culture of Democracy in Central America, Mexico and Colombia, 2004 vii
Executive SummaryThis “regional report” is one in a growing series of studies produced by Latin American PublicOpinion Project (LAPOP), known as OPAL in Spanish. That project, initiated over two decadesago and for many years housed at the University of Pittsburgh, is now hosted by VanderbiltUniversity, and has received generous support in recent years from the United States Agency forInternational Development (USAID). The report compliments eight country-specific studies thatwere carried out by LAPOP in 2004 in Mexico, Guatemala, El Salvador, Honduras, Nicaragua,Costa Rica, Panama and Colombia. An additional LAPOP study was carried out in 2004 inEcuador, and a collaborative project was conducted in the Dominican Republic. A LAPOP studyof Bolivia was also carried out in Bolivia in 2004, but the result were not available at the time ofthe writing of this regional report, so the 2002 Bolivia LAPOP results were used instead. In total,then, this regional report, focuses on eight countries, but makes use of the data from Ecuador, theDominican Republic for 2004 and Bolivia for 2002.
The study was based on a common questionnaire and sample design, although each country wasable to include specialized questions focusing on particular interests of that country. In each ofthe countries from Mexico to Colombia, the sample size was of 1,500 respondents. In Ecuadorand Bolivia, the sample was of 3,000, but for this reported weighted down to match the 1,500 ofthe other countries. Finally, the Dominican Republic sample was of 4,500, but again weighteddown to be the equivalent of only 1,500 respondents. All samples were of multi-stage, stratifiedprobability design, with quotas by age and gender at the level of the household. This regionalreport examines only a subset of the core items used in each country. The design of both thequestionnaire and sample design involved a collective effort, under the overall technicalguidance of LAPOP and administrative guidance of ARD, Inc. The individual collaborators andtheir institutional bases are as follows: for Mexico, Jorge Buendía and Alejandro Moreno,Departamento de Ciencia Política, Instituto Tecnológico Autónomo de México (ITAM); forGuatemala, Dinorah Azpuru and Juan Pablo Pira, Asociación de Investigación y EstudiosSociales (ASIES); for El Salvador and Honduras, Ricardo Córdova, Fundación Dr. GuillermoManuel Ungo (FUNDAUNGO), José Miguel Cruz, Instituto Universitario de Opinión Pública(IUDOP) de la Universidad Centroamericana, UCA, and Siddhartha Baviskar, University ofPittsburgh; for Nicaragua, Luis Serra and Pedro López Ruiz, Universidad Centroamericana(UCA); for Costa Rica, Luis Rosero-Bixby, Universidad de Costa Rica and Jorge Vargas,Programa Estado de la Nación; for Panamá, Marco A. Gandásegui hijo, Centro de EstudiosLatinoamericanos (CELA) and Orlando J. Pérez, Central Michigan University; for Colombia,Carlos Lemoine, Centro Nacional de Consultoría (CNC), and Juan Carlos Rodríguez-Raga,University of Pittsburgh. Polibio Córdova, CEDATOS/Gallup, Ecuador, provided excellentguidance throughout on sample design.
The study was made possible by the generous support of the United States Agency forInternational Development (USAID). Margaret Sarles, Bruce Kay and Eric Kite in the “Office ofDemocracy and Governance” of USAID, supported by Maria Barrón in the Bureau for LatinAmerica and the Caribbean, secured the funding and made possible the entire project thanks totheir unceasing support. All of the participants in the study are grateful to them, as well as toTodd Amani, USAID/Guatemala, who assumed the role of coordinating the project at theUSAID end.

The Political Culture of Democracy in Central America, Mexico and Colombia, 2004 viii
The major conclusions of this regional report are as follows:
The study included a very broad range of countries in terms of both economic anddemocratic development. Indicators from the World Bank and the surveys themselves set thecontext of the study. On the one hand there were, in the regional context, countries likeMexico and Costa Rica with high levels of economic and social development and countrieslike Nicaragua and Bolivia with very low such levels. Costa Rica represents the extreme endof democratic consolidation among these countries by most world-wide measures, while theother countries have a much more varied experience with democracy. Mexico has justemerged as a democratic country, Guatemala, El Salvador and Nicaragua are post civil wardemocracies that now enjoy regular free and fair elections, Honduras. Panama is well beyondits years of dictatorship and the U.S. invasion, and now enjoys a country free of a militaryestablishment. Honduras has avoided civil wars and invasions, but cannot free itself from thegrip of social underdevelopment. Ecuador and Bolivia have experienced serious challenges todemocratic rule in the new millennium, both having seen presidents removed from officewhile experiencing serious economic downturns and both unable to overcome high levels ofpoverty. The Dominican Republic, finally, after many years of stable democratic rule, hasbeen rocked by economic crisis and political scandals, and yet has held democratic electionsonce again.
The analysis in this regional report focuses on the role of political culture after the nationallevels of economic and social development have been controlled for. The intra-countryvariation on democratic values and behaviors was examined in detail in each country report.This regional report comparer inter-country variation, but does so after first placing thecountries on a level playing field in terms of their economic and social development.Technically, what has been done is to calculate the residual values of the political culturevariables after economic and social development, defined by GNP per capita and infantmortality, have been taken into account. That way, when the report notes significant variationamong the countries, it can attribute that variation to political culture rather than variations ineconomic or social development.
A basic variable included in all studies was that of political legitimacy, defined here in termsof a five-item index of “system support.” Costa Rica scored far above the other countries inthe study, even when controlled for economic and social development, being more than one-half a standard deviation higher than the mean. At the other extreme lie Ecuador and Bolivia,with results substantially below the mean for these countries. The Dominican Republicresults, which arrived as this report was being finalized, show very low levels of systemsupport. Political tolerance of minority rights is also another key variable in the study.Panama, Nicaragua and Honduras are found to comprise one group with relatively hightolerance. The remaining countries all group closely except for Ecuador, which issubstantially lower than the others. The major difference from the individual country studiesis that Bolivia’s level of tolerance increases substantially as a result of controls for GNP andinfant mortality. This means that part of the explanation of the low levels of tolerance inBolivia is a function of its economic underdevelopment.

The Political Culture of Democracy in Central America, Mexico and Colombia, 2004 ix
The study combines the measures of system support and tolerance to produce an overall scaleof support for stable democracy. The results, without controls for economic and socialdevelopment are shown in the following figure, where it can be seen that Costa Rica, Mexicoand Panama have the highest proportion of their populations with values supportive of stabledemocracy, while the Dominican Republic, Ecuador and Bolivia have the lowest proportions.
Percent of the population with attitudes
conducive to stable democracy: eleven countries
Sig. < .001
Bolivia 2002
Ecuador
Dominican Republic
Guatemala
Nicaragua
Honduras
Colombia
El Salvador
Panamá
México
Costa Rica
Hig
h S
yste
m S
uppo
rt a
nd h
igh
To
lera
nce
60%
50%
40%
30%
20%
10%
0%
1415
18
21
2830
3232
38
41
48
Once controls for economic and social development are introduced, the pattern changessomewhat, as is shown in the figure below. Costa Rica, Mexico and Panama remain theleaders, and Bolivia remains at the bottom, but now Nicaragua is second lowest. Theseresults do not include the Dominican Republic.
Support for stable democracy: 11-nation comparison
Normalized results, controlled
Controlled for GNP per capita, infant mortality & incumbent performance
Bolivia 2002
Nicaragua
Honduras
Guatemala
Ecuador
El Salvador
Colombia
Panamá
México
Costa Rica
Re
sidu
al o
f GN
P, In
fant
Mor
t an
d M
1R
2.0
1.5
1.0
.5
0.0
-.5
-1.0
-1.5
-2.0
-1.6
-.8-.8
-.5-.4
.5.7
1.31.4

The Political Culture of Democracy in Central America, Mexico and Colombia, 2004 x
Widespread corruption is increasingly seen as one of the most significant threats todeepening democratization in Latin America (and indeed much of the democratizing ThirdWorld). The LAPOP has developed a “corruption victimization” index that measures directpersonal experience with corruption at the level of the daily life of citizens. This measureprovides results that are sometimes at variance with the Corruption Perception Index ofTransparency International. A shown in the future below, the level of corruptionvictimization is extreme in Bolivia, Ecuador, Mexico and the Dominican Republic, but farlower in the other countries in the sample.
Transparency CPI vs. Corruption Vicitmization
Sig, < .001 for victimization measure
(Note: CPI data for Panama m issing for 2003, 2002 used instead
Colombia
Honduras
Costa Rica
Guatemala
Nicaragua
El Salvador
Panamá
Dominican Republic
México
Ecuador
Bolivia 2002
Per
cent
vic
tim
ized
: pu
blic
em
ploy
ee s
olic
iate
d br
ibe
20.0%
10.0%
0.0%
CP
I index
20.0
10.0
0.0
Public employee
soliticited bribe
CPI: 2003
3.7
2.3
4.3
2.42.6
3.73.03.33.6
2.22.32.72.7
3.23.33.4
4.3
6.0
11.6
12.9
14.8
17.1
Control variables have an impact on these results, as is shown below. Bolivia and Mexicostill have high levels of corruption, but Ecuador’s levels decline, while those of Guatemalaincrease. Costa Rica and Colombia are lowest, once economic and social developmentdifferences are removed from the analysis.
Residual scores of public employee bribery
Controled for GNP per capita and infant mortality
Colombia
Costa Rica
Ecuador
Nicaragua
Honduras
Panamá
El Salvador
Dominican Republic
Guatemala
México
Bolivia 2002
Sta
ndar
dize
d P
redi
cted
Res
idua
l of
publ
ic e
mpl
oyee
bri
be
3.0
2.0
1.0
0.0
-1.0
-2.0
-1.4-1.2
-.9-.6-.5
.3.4
1.4
2.0

The Political Culture of Democracy in Central America, Mexico and Colombia, 2004 xi
Corruption victimization takes its toll on political legitimacy. In each of the countries in thestudy, the higher the level of corruption victimization, the lower the level of system supportexpressed by the respondents.
In a similar fashion, the survey found that crime victimization lowers system support in eachof the countries. Crime victimization has an especially strong impact on lowering trust in thejudicial system.
The combination of high corruption and high crime make a potent brew that is helping toerode the legitimacy of the political systems in the countries studied.
Latin America governments have been attempting to decentralize in order to achieve twoobjectives. First, there is the widespread belief that local government is efficient government.Large, distant and impersonal central governments are increasingly seen as highly inefficient,being unable to respond to variations in local needs and demands and also more likely to beimmune to citizen control and accountability. Second, local governments, by placing controlin the hands of the people, may help build democracy from the ground up. The survey datahe results are striking since they differ sharply from the picture of democracy at the nationallevel that we have seen thus far in this report. Countries like Costa Rica and Panama, thathave been shown to have relatively high levels of democratic values, show low levels ofcitizen participation in municipal meetings.
When controls for national level of development are introduced, the findings become clearer.Robust regression techniques demonstrate that infant mortality, as a measure of nationaldevelopment, has a significant impact on municipal participation. The higher the infantmortality rate the higher the municipal participation, indicating that less developed countriesare the ones where local government is more salient to citizens.
A different, probably better, perspective can be obtained from examining demand-making.The results are very illuminating. First, they show that Bolivia, the country with the mostadvanced decentralization program in the region, has the highest level of citizen demand-making. Second, they show that Costa Rica, the region’s most democratic country, also hasvery high levels of demand-making, indicating high levels of personal efficacy among itscitizens, even though they are not likely to attend municipal meetings during the year.Finally, Panama, Ecuador, Honduras and El Salvador are at the low end of demand-makingon local government.
Another question asked respondents to rate municipal services on a scale from very good tovery bad. The results fall into three clear groups. First, there is the group of Colombia,Ecuador and El Salvador, where satisfaction is highest, then Panama and Bolivia where it islowest, and all the others in between. It is of note that even though Bolivia has had the mostextensive decentralization reforms and that the demand-making is the highest, its level ofsatisfaction is the lowest. These results demonstrate rather clearly that structural reforms canbring about unintended consequences. This finding is very important for USAID localgovernment programs, since it shows that focusing exclusively on increasing participation

The Political Culture of Democracy in Central America, Mexico and Colombia, 2004 xii
and demand making, without an equal emphasis on building capacity can be a recipe fordeclining support. In addition, as many of the country reports showed, dissatisfaction withlocal governments has a significant effect on system support and stable democracy values.
1474149715051342158714121449154914571450N =
Satisfaction with local government services
Bolivia 2002
Panamá
México
Nicaragua
Guatemala
Honduras
Costa Rica
El Salvador
Ecuador
Colombia
95%
CI
sati
sfac
tion
wit
h lo
cal
gove
rnm
ent
serv
ices
60
50
40
The final area covered in this study is that of social capital. Sharp differences emerge amongthe countries based on interpersonal trust, seen by many analysts as an important requisitedemocracy. Not surprisingly, Costa Rica come out at the top, Bolivia at the bottom.
Interpersonal trust
Bolivia 2002
Panamá
Nicaragua
Guatemala
Ecuador
México
Honduras
El Salvador
Dominican Republic
Colombia
Costa Rica
Me
an
Inte
rpe
rso
na
l tru
st
80
70
60
50
40
45
53
565757
58
63636364
71
This executive summary, and indeed this regional report, only scratches the surface of the database collected in this project. There are nearly limitless comparisons that can be between withinand across the countries studied. The common methodology assures comparability across all of

The Political Culture of Democracy in Central America, Mexico and Colombia, 2004 xiii
the surveys. All of the researchers involved in the study are hopeful that policy makers will beusing this data to inform their decisions on democracy programming in the years to come. Thestudies have shown that these countries vary considerably in their level of support fordemocracy, and they have also shown that within each country different dimensions ofdemocracy receive greater or lesser support. In addition, the country-based studies have shownimportant differences among respondents based on gender, socio-economic status, region, etc.These findings need to be examined with care and factored into programming decisions made byUSAID, multi-lateral donors and the governments of the countries themselves.

The Political Culture of Democracy in Central America, Mexico and Colombia, 2004 xiv
PrefaceDemocratic governance is increasingly recognized as central to the development process.Applied democratic development is now an emerging field of academic study and developmentassistance. From an academic perspective, the great movement of political regimes towardsdemocracy led to a new focus on the processes of democratization. Recent research hasdemonstrated the centrality of good governance to sustained economic and social progress. Theresult is a ballooning literature on regime change, democratic consolidation, and theinstitutionalization of good governance.
Development agencies have also begun to invest in programs that promote democraticgovernance both to spur growth and poverty reduction as well as an end in itself. The U.S.Agency for International Development (USAID) has been at the forefront of donors inrecognizing democracy and good governance as fundamental characteristics of development.Even a decade before the agency created the Center for Democracy and Governance in 1994,country missions–particularly in Latin America–began to invest heavily in justice reform,electoral assistance, local government, legislative development, civil society strengthening andother programs that have become the bedrock of our current extensive programming in “DG”.Every Administration over the past two decades has supported and expanded these efforts. Atpresent we have democracy programs in over 80 countries, as well as large regional and globalprograms. Our programs in this region (Mexico, Guatemala, El Salvador, Honduras, Nicaragua,Panama and Colombia) are all tailored to the specific country context and managed by a localMission, but share a focus on transparent and accountable governance and strengthened rule oflaw.
Unfortunately, rigorous measurement has lagged behind insight and action, but it is nowunderway with a vengeance. Analysts are developing and refining measures of institutionalstrengthening, political and civil rights, democratic culture, transparency, and other attributes ofdemocracy and governance. At a much slower pace, donors are just beginning to examine closelythe impact and effectiveness of their own work in this sector. In this context, USAID missionshave supported high quality democracy surveys that analyze the beliefs, perceptions, andbehavior of citizens and used the results to develop strategies of support.
Of course, surveys are only one tool in the arsenal of analytic instruments needed for goodprogramming. We also rely on assessments of institutional development in both government andnon-governmental organizations, on analyses of relationships among power contenders, and on alarge range of other factors that affect prospects of democratic development and goodgovernance. Nonetheless, surveys offer information not available from other sources on the stateof democratic culture and, increasingly, on the effectiveness of our programs.
USAID missions have sponsored numerous surveys, many in collaboration with Dr. MitchellSeligson and the local research teams that have carried out the present study. These are nowbeing put on the web and made publicly available for further analysis.
This current study, nonetheless, is pioneering. It is the first time that missions have worked inconcert to develop a common transnational survey in democracy and governance, allowingreliable comparisons of the democratic attributes across all of Central America, Colombia, and

The Political Culture of Democracy in Central America, Mexico and Colombia, 2004 xv
Mexico, as well as with recent studies in Andean countries. For several missions, these surveysare the second or third in a series, offering reliable measures of change for the first time.Moreover, the survey instrument itself was the product of collaboration between survey researchspecialists led by Dr. Seligson and the USAID Democracy Offices in the region. As a result, thedata allow reliable comparisons with the growing body of democracy surveys elsewhere, but alsorespond to specific needs of donors. For example, there are many questions that “drill down” intoaspects of corruption and local government to provide insights into these potentially fruitfulareas of donor support. Potentially even more important, some of the surveys over-samplegeographic areas where USAID DG programming is concentrated, so that we can measure morereliably what changes might be due to specific program interventions–an important step inrigorously measuring the impact and effectiveness of our programs.
USAID missions intent on improving democracy programs and better measuring the impact oftheir work led this initiative. The Office of Democracy and Governance and the Bureau for LatinAmerica and the Caribbean in Washington also strongly supported the work, as an innovativeeffort within the Agency to standardize our measurements and better report on our progress toCongress. However, we also believe these surveys will be an important resource for policymakers and academics, offering the best data available for decision-making and further research.To this end, we are supporting not only publication of the results, but a web-based data baseallowing further analysis of the data. This report, and the country reports that preceded it, areonly the tip of the iceberg in terms of research possibilities.
Undertaking these surveys has had other positive outcomes. For example, previous surveys haveat times been important mobilizing tools for policy reformers in Latin America, with resultspresented to the Bolivian congress, for example, and to cabinet officials in a number of countries.In addition, the national research teams who conducted the surveys increased their owninstitutional capacities that will outlast this particular piece of work. Third, the surveys offer apublic “voice” for citizen concerns about democracy, and the opportunity to see how particularsubgroups–ethnic groups, women, people in specific regions–are faring.
We hope these surveys will be widely used by practitioners and policy-makers and contribute toour understanding of the processes of political change now underway in the hemisphere.
Margaret SarlesDivision Chief, Strategic Planning and ResearchDemocracy and Governance Office, DCHAUS Agency for International Development


The Political Culture of Democracy in Central America, Mexico and Colombia, 2004 xvii
PrologueStudying Democratic Values in Eight Latin American Countries:The Challenge and the Response
The publication you have before you is one in a growing series of studies produced by the LatinAmerican Public Opinion Project (LAPOP), known as OPAL in Spanish. That project, initiatedover two decades ago, and for many years housed at the University of Pittsburgh, is now hostedby Vanderbilt University, and has received generous support in recent years from the UnitedStates Agency for International Development (USAID). It began with the study of democraticvalues in one country, Costa Rica, at a time when much of the rest of Latin America was caughtin the grip of repressive regimes that widely prohibited studies of public opinion (andsystematically violated human rights and civil liberties). Today, fortunately, such studies can becarried out openly and freely in almost all countries in the region.
The present study reflects LAPOP’s most extensive effort to date, incorporating eight countries(Mexico, Guatemala, El Salvador, Honduras, Nicaragua, Costa Rica, Panama and Colombia).The sample and questionnaire designs for all eight studies were uniform, allowing directcomparisons among them, as well as allowing for detailed analysis within each country. The2004 series involves a total of nine publications, one for each of the eight countries, authored bythe country teams, and a summary study, written by the author of this Prologue, who serves asthe Director of the LAPOP, and the overall scientific coordinator of the eight-country project.Fortuitously, many of the questions asked in the surveys administered in these eight countrieswere also included in LAPOP national sample studies carried out in 2004 in Ecuador andBolivia, meaning that for some items it will be possible to compare across ten countries in LatinAmerica. As of this writing, the Bolivia data for 2004 are not available, so in this volume, resultsfor Bolivia 2002 are used. Finally, a collaborative investigation in the Dominican Republic, inwhich a small number of key questions from the LAPOP were included, broadens the countrysample of 2004 to eleven, and gives us at least a limited picture of the Caribbean, adding to oursamples of Central America and the Andes, although those data were not available for analysis atthis writing. The only missing region in Latin America is the Southern Cone, a deficit we hope toremedy in the future. For several of the countries in the current round, LAPOP had previouslycarried surveys using identical batteries of questions. For that reason, in the country-basedreports on Guatemala, El Salvador, Nicaragua and Costa Rica, comparisons with prior results aremade.
Surveys of public opinion in Latin America have become very popular in recent years.Unfortunately, too few of those studies follow the rigorous scientific procedures that havebecome accepted as the norm in academic public opinion research in the United States andEurope. Those studies often suffer from poorly designed questionnaires, unrepresentative andnon-random samples, poor fieldwork supervision, sloppy data entry, and data analysis that rarely

The Political Culture of Democracy in Central America, Mexico and Colombia, 2004 xviii
goes beyond univariate presentation of percentages.1 As a result, such studies are often dismissedby academics and policy-makers alike.
The LAPOP project has attempted, with considerable success I would argue, to deviate from theprevailing Latin American norm to produce quality survey data that matches the higheststandards of academic research in the U.S. and Europe. The surveys on which the present studyrelies, because they were envisioned from the outset to allow for cross-national comparisons,were carried out with special rigor and attention to methodological detail, as is described in thisprologue and in the methodology section of this synthesis report and the individual volumes. Werecognized from the outset that all survey research, by its very nature, contains error (derivedfrom many sources, including errors resulting from probability sampling, respondent inattention,coding mistakes, and data entry failures). Our goal was to reduce to the absolute minimum eachof those errors, and to do so in a cost-effective manner.
We also sought, from the outset, to make our methodology transparent and replicable. Theessence of scientific research is that it can be replicated. Excitement about the prospects for “coldfusion” quickly faded when physicists were unable to replicate the initial “discovery.” All toomany surveys published in Latin America contain no information whatsoever about the sampledesigns, or when such information is provided it is so sketchy that it is impossible to determinewith any degree of detail how the sample was carried out. Equally serious, it is rare for the database itself to be made available to the public; almost without exception the raw data are closelyguarded, making it impossible for social scientists and policy makers alike to reanalyze the datalooking for new insights, or to attempt to replicate the original findings. Publicly fundeddatabases should be available to the public. Failure to do so results in privatization of publicgoods. Of course, in the dissemination of data, all human subjects protection policies, asgoverned by Institutional Review Boards (IRBs) must be followed scrupulously so that the rightsof subjects are respected.
We embarked on the 2004 series in the hope that the results would be of interest and of policyrelevance to citizens, NGOs, academics, governments and the international donor community.Our belief is that the results can not only be used to help advance the democratization agenda,they can also serve the academic community that has been engaged in a quest to determine whichcitizen values are the ones most likely to promote stable democracy, and which ones are mostlikely to undermine it. For that reason, the researchers engaged in this project agreed on acommon core of questions to include in our survey. We agreed on that core in a meeting held inPanama City, in January 2004, hosted by our Panamanian colleague Marco Gandásegui, Jr.. Allof the country teams were represented, as was the donor organization, USAID. It was not easyfor us to agree on a common core, since almost everyone present had their favorite questions,and we knew from the outset that we did not want the interviews to take longer than an averageof 45 minutes each, since to go on much longer than that risked respondent fatigue and reducedreliability of the data. As it turns out, the mean interview time for all 12,401 interviews was 42minutes, a near-perfect “bulls-eye.” The common core of questions allows us to examine, foreach nation and across nations, such fundamental democratization themes as political legitimacy,
1 A detailed recounting of the problems encountered in those surveys can be found in Mitchell A. Seligson,
"Improving the Quality of Survey Research in Democratizing Countries," PS: Political Science and Politics(2004, forthcomming).

The Political Culture of Democracy in Central America, Mexico and Colombia, 2004 xix
political tolerance, support for stable democracy, civil society participation and social capital, therule of law, participation in and evaluations of local government, crime victimization, corruptionvictimization, and voting behavior. Each study contains an analysis of these important areas ofdemocratic values and behaviors. In some cases we find striking and sometimes surprisingsimilarities from country-to-country, whereas in other cases we find sharp contrasts.
When readers examine the findings presented in this synthesis volume, as well as the countrystudies, and find that the results are those that coincide with their expectations, they might wellsay, “That is just what I had expected, so the survey tells me nothing new.” On the other hand,when the results are at variance from expectations, readers might say, “This does not make anysense; the data must be wrong.” These reactions to survey data are common, and for somesurveys emerging from the developing world, the data may in fact be “wrong.” We cannotguarantee that our results are “right,” but we have made every effort, as described below, to tryto minimize error. Given that we are working with a sample of the population of each countryrather than interviews with all voting-aged adults, there is always a one-in-twenty chance thatour results are not within the approximately ± 2.5% sampling error found in each of the nationalsamples. Indeed, as we point out in the methodology section of each country report, theseconfidence intervals can be wider for some variables in some countries as a result of “designeffects,” i.e., we used a stratified and clustered sample, which is standard practice in modernsurvey samples, the impact of which is to affect the precision of our estimates while keepingfieldwork costs within reasonable limits (as a result of clustering). Rarely does anyone doingsurveys today use simple random sampling, and we have not done so either. In short, if readersfind some results inconsistent with expectation, that may be because we are working withprobability samples, and the odds are, from time-to-time, our results will be wide of the mark.But, 95 times out of 100, our results should be reasonably close to what we would have obtainedhad we interviewed the millions of voting-aged adults in the countries included in the study (anobvious impossibility). Moreover, since we have taken special pains to deal with the problem of“non-coverage,” something that we have rarely seen done anywhere in Latin America, webelieve that our results are about as good as they can be.
To help insure comparability, a common sample design was crucial for the success of the effort.Prior to flying to Panama for the start-up meeting, the author of this chapter prepared for eachteam the guidelines for the construction of a multi-stage, stratified area probability sample with atarget N of 1,500. In the Panama meeting each team met with Dr. Polibio Córdova, President ofCEDATOS/Gallup, Ecuador, and region-wide expert in sample design, trained under LeslieKish, the founder of modern survey sampling, at the University of Michigan. Refinements in thesample designs were made at that meeting and later reviewed by Dr. Córdova. Detaileddescriptions of the sample are contained in annexes in each country report.
The Panama meeting was also a time for the teams to agree on a common framework foranalysis. We did not want to impose rigidities on each team, since we recognized from the outsetthat each country had its own unique circumstances, and what was very important for onecountry (e.g., crime, voting abstention) might be largely irrelevant for another. But, we did wanteach of the teams to be able to make direct comparisons to the results in the other countries. Forthat reason, we agreed on a common method for index construction. We used the standard of anAlpha reliability coefficient of greater than .6, with a preference for .7 or higher, as the minimum

The Political Culture of Democracy in Central America, Mexico and Colombia, 2004 xx
level needed for a set of items to be called a scale. The only variation in that rule was when wewere using “count variables,” to construct an index (as opposed to a scale) in which we merelywanted to know, for example, how many times an individual participated in a certain form ofactivity. In fact, most of our reliabilities were above .7, many reaching above .8. We alsoencouraged all teams to use factor analysis to establish the dimensionality of their scales.Another common rule, applied to all of the data sets, was in the treatment of missing data. Inorder to maximize sample N without unreasonably distorting the response patterns, wesubstituted the mean score of the individual respondent’s choice for any scale or index in whichthere were missing data, but only when the missing data comprised less than half of all theresponses for that individual. For a five-item scale, for example, if the respondent answered threeor more of the items, we assigned the mean of those three to that person for that scale. If fewerthan three of the five were responded to, the entire case was treated as missing.
Another agreement we struck in Panama was that each major section of the studies would bemade accessible to the layman reader, meaning that there would be heavy use of bivariate andtri-variate graphs. But we also agreed that those graphs would always follow a multivariateanalysis (either OLS or logistic regression), so that the technically informed reader could beassured that the individual variables in the graphs were indeed significant predictors of thedependent variable being studied. We also agreed on a common graphical format (using charttemplates prepared for SPSS 11.5). Finally, a common “informed consent” form was prepared,and approval for research on human subjects was granted by the University of PittsburghInstitutional Review Board (IRB). The approval document is contained in each country report.
A common concern from the outset was minimization of data entry error and maximization ofthe quality of the database. We did this in several ways. First, we agreed on a common codingscheme for all of the closed-ended questions. Second, we prepared a common set of data entryformats, including careful range checks, using the U.S. Census Bureau’s CSPro2.4 software.Third, all data files were entered in their respective countries, and verified, after which the fileswere sent to a central location for an audit review. At that point, a random list of 100questionnaire identification numbers was sent back to each team, who were then asked to shipthose 100 surveys via express courier to that central location for auditing. This audit consisted oftwo steps. The first involved comparing the responses written on the questionnaire during theinterview with the responses as entered by the coding teams. The second step involvedcomparing the coded responses to the database itself. If a significant number of errors wereencountered through this process, the entire database had to be reentered and the process ofauditing was repeated on the new database. Finally, the data sets were merged into one uniformeight-nation file, and copies were sent to all teams so that they could carry out comparativeanalysis on the entire file.
The next step in our effort to maximize quality was for the teams, once they had written theirdraft reports, to meet again in plenary session, this time in Santo Domingo de Heredia, CostaRica, graciously hosted by our Costa Rica colleagues Luis Rosero-Bixby and Jorge Vargas-Cullell. In preparation for that meeting, held in mid-June 2004, pairs of researchers wereassigned to present themes emerging from the studies. For example, one team made apresentation on corruption and democracy, whereas another discussed the rule of law results.These presentations, delivered in PowerPoint, were then critiqued by a small team of our most

The Political Culture of Democracy in Central America, Mexico and Colombia, 2004 xxi
highly qualified methodologists, and then the entire group of researchers and the USAIDdemocracy staffers discussed the results. That process was repeated over an intense two-dayperiod. It was an exciting time, seeing our findings up there “in black and white,” but it was alsoa time for us to learn more about the close ties between data, theory and method. For example,we spent a lot of time discussing the appropriate modalities of comparing across countries whenwe wanted to control for macro-economic factors such as GDP or GDP growth.
After the Costa Rica meeting ended, the author of this chapter, in his role of scientificcoordinator of the project, read and critiqued each draft study, which was then returned to thecountry teams for correction and editing. In addition, the description of the sample designs wasrefined by including for each study a chart prepared by Luis Rosero of our Costa Rica teamshowing the impact of stratification and clustering on confidence intervals (i.e., the “designeffect”). Those revised reports were then reviewed a second time, appropriate adjustments made,and then passed along to USAID for its comments. Those comments were taken intoconsideration by the teams and the final published version was produced. A version wastranslated into English for the broader international audience. That version is available on theweb site, as is the data base itself (www.usaid.gov/our_work/democracy_and_governance/dsd/).
What you have before you, then, is the product of the intensive labor of scores of highlymotivated researchers, sample design experts, and field supervisors, hundreds of interviewersand data entry clerks, and, of course, the all-important over 12,000 respondents to our survey.Our efforts will not have been in vain if the results presented here are utilized by policy makers,citizens and academics alike to help strengthen democracy in Latin America.
AcknowledgementsThe study was made possible by the generous support of the United States Agency forInternational Development (USAID). Margaret Sarles, Bruce Kay and Eric Kite in the “Office ofDemocracy and Governance” of USAID, supported by Maria Barrón in the Bureau for LatinAmerica and the Caribbean, secured the funding and made possible the entire project thanks totheir unceasing support. All of the participants in the study are grateful to them, as well as toTodd Amani, USAID/Guatemala, who assumed the role of coordinating the project at theUSAID end. ARD of Burlington, Vermont, managed the finances of the project and theformatting of the publications. Critical to the project’s success was the cooperation of the manyindividuals and institutions in the countries studied who worked tirelessly to meet what at timesseemed impossible deadlines. These include, for Mexico, Jorge Buendía and Alejandro Moreno,Departamento de Ciencia Política, Instituto Tecnológico Autónomo de México (ITAM); forGuatemala, Dinorah Azpuru and Juan Pablo Pira, Asociación de Investigación y EstudiosSociales (ASIES); for El Salvador and Honduras, Ricardo Córdova, Fundación Dr. GuillermoManuel Ungo (FUNDAUNGO), José Miguel Cruz, Instituto Universitario de Opinión Pública(IUDOP) de la Universidad Centroamericana, UCA, and Siddhartha Baviskar, University ofPittsburgh; for Nicaragua, Luis Serra and Pedro López Ruiz, Universidad Centroamericana(UCA); for Costa Rica, Luis Rosero-Bixby, Universidad de Costa Rica and Jorge Vargas,Programa Estado de la Nación; for Panamá, Marco A. Gandásegui hijo, Centro de EstudiosLatinoamericanos (CELA) and Orlando J. Pérez, Central Michigan University; for Colombia,Carlos Lemoine, Centro Nacional de Consultoría (CNC), and Juan Carlos Rodríguez-Raga,University of Pittsburgh. Polibio Córdova, CEDATOS/Gallup, Ecuador, provided excellent

The Political Culture of Democracy in Central America, Mexico and Colombia, 2004 xxii
guidance throughout on sample design. The team of graduate assistants at the University ofPittsburgh has worked very hard in numerous aspects of the Latin American Public OpinionProject: Miguel García (Colombia), Daniel Moreno (Bolivia), Sawa Omori (Japan), and RosarioQueirolo (Uruguay). John Booth of the University of North Texas, and Miguel Gómez, formerlyof the Universidad de Costa Rica, provided excellent pro bono advice on the questionnairedesign. Chris Sani performed admirably as undergraduate assistant. Profound gratitude is owedto all of these fine people for their excellent work on this study. Finally, we wish to thank the12,401 individuals in these eight countries who took time away from their busy lives to answerour questions. Without their cooperation, this study would not have been possible.
Nashville, TennesseeOctober, 2004

The Political Culture of Democracy in Mexico, Central America, and Colombia, 2004 1
1.0 The Regional ContextIn each of the country-focused studies that form part of this series, there is an extendeddiscussion of the socio-economic and political context in which the survey was conducted.Readers interested in that specific contextual material should consult the individual countryreports. In this region-wide report, the focus is on comparison of the relative levels ofdevelopment and institutional democracy found among the eight countries in the study. Since theLatin American Public Opinion Project (LAPOP) also has relevant data from Ecuador for 2004and from Bolivia for 2002 (with 2004 Bolivian data to become available some months fromnow), data for those countries will also be included here.
The range of indicators that could be included to measure socio-economic development andinstitutional democracy is staggering. One only need examine the recent literature in the field tosee that if one wants to be comprehensive, the list would contain hundreds of measures. Yet, it isalso the case that researchers have shown that so many of these variables are highly correlatedwith each other, often above .9, and therefore much of the information is redundant. Therefore,this region-wide report opts for a parsimonious approach, looking at a small number of indicatorsthat are not only used repeatedly in studies around the world, but ones that seem to capture bestthe differences and similarities among the countries being studied here.
In the Table I.1 below, the key indicators and their sources are shown:
Table I.1. Economic-Social and Governance Indicators for the CAM/Colombia StudyVariable Name Indicator Source Year
Economic-Social Development IndicatorsGNI2002 Gross National Income World Bank, World
Development Report, 20042002
PPP2002 Purchasing Power ParityGross National Income
World Bank, WorldDevelopment Report, 2004
2002
INFMORT Under-five InfantMortality per 1,000
World Bank, WorldDevelopment Report, 2004
2001
WEALTH Summated index ofmaterial possessions
CAM/Colombia 2004survey
2004
Governance Control IndicatorsVOICE Voice and Accountability World Bank Institute
Governance Indicators(web)
2002
STABLE Political Stability World Bank InstituteGovernance Indicators(web)
2002
LAW Rule of Law World Bank InstituteGovernance Indicators(web)
2002
EFFECT Government Effectiveness World Bank InstituteGovernance Indicators(web)
2002
POPULAR Presidential Popularity CAM/Colombia 2004survey
2004

The Political Culture of Democracy in Mexico, Central America, and Colombia, 2004 2
Ideally, it would have been better if we could show data for 2004, since the surveys were drawnin that year. Alas, there is always a considerable lag in generating world tables of macro-levelphenomenon, and the figures used here are the most recent ones available that were gatheredusing a common methodology. Individual country data are available for 2003, but in the case ofGNP data, this means construction of conversion rates based on current currency exchange,whereas the World Bank “Atlas method” smoothes those conversion rates over a three-yearperiod. Infant mortality figures also lag far behind. So, the table above contains the most recentregionally-available data that we consider to be reliable and comparable across all cases.
All but one of the measures shown above comes from the World Bank, and the World BankInstitute. The first two measures, GNI2002 and PPP2002 are attempts to capture the relativewealth of the countries being studied. GNP per capita is widely accepted as the quintessentialmeasure of wealth across countries. In recent years, however, the International ComparisonsProject (ICP) of the United Nations has attempted to correct distortions in the GNP per capitameasure brought on by variations in exchange rates (exchange rates being the basis for theconversion of international currencies into the standard, the U.S. dollar). The ICP carries outsurveys in many countries that examine purchasing power, hence the measure of GNP per capitabased on those surveys is called Purchasing Power Parity (PPP), or “real” income. Since a majordispute in the development literature rages as to the proper measure to utilize,2 this study usesboth.
Many measures of well-being are available beyond infant mortality, the one selected here. All ofthem have limitations. Beyond questions in the quality of data, there is the issue of physicallimitations that tend to flatten the extremes of these measures. For example, life expectancy isfinite, no matter how advanced a country, and while a number of countries have life expectanciesthat now exceed 80 years, no country has, or can anticipate having, a life expectancy of 200years. The same is true with infant mortality figures. The theoretical lower limit is zero deathsper 1,000, and perhaps some day the world will achieve that level (Sweden is already at about 3per 1,000), but as countries approach the zero level, declines become harder and harder toachieve compared with drops from their previously high levels of over 100.
In order to provide a finer-grained measure of welfare than the macro-level measures givenabove, this study relies on the 2004 CAM/Colombia survey itself. In that study each respondentwas asked to select among 10 possible monthly family income ranges, the numbers for whichwere drawn from the census bureau publications in each country. While it would be possible touse this as a measure of wealth for each country, the difficulty was that since many respondentsdid not report family income (in the case of farm families, such incomes would have to havebeen imputed, based on crop and livestock sales and production costs, a very time consumingtask that would have been impossible to carry out within the confines of a survey that wasfocused on democratic values) there was too much missing data. As a result the survey-basedmeasure of wealth is an index built on summing up the total number of household appliances andother material signs of wealth. Specifically, the survey counted the number of TVs in the house(allowing up to three), and the number of vehicles (again, allowing up to three), and then scoringone point each for ownership of a refrigerator, telephone, clothes washer, microwave, and having 2 Mitchell A. Seligson and John T. Passé-Smith, Development and Underdevelopment: The Political Economy of
Global Inequality (Boulder: Lynne Reinner, 2003).

The Political Culture of Democracy in Mexico, Central America, and Colombia, 2004 3
potable water piped into the dwelling unit. This produced an index that ranged from 0-11, butsince there were very few cases in the upper range, those scoring 11 were collapsed with thosewho scored 10, leaving an index in the 0-10 range.3
Finally, it is important to take note of the governance measures listed above. All are from theWorld Development Institute governance project led by Daniel Kaufmann.4 Of the six measuresin the Kaufmann seriees, four are used here. Two of them, “control of corruption” and“regulatory quality,” are excluded because the first too closely approximates the corruptionmeasures included in the surveys being analyzed here and the second seems to be too obliquelyrelated to democratization for it to be relevant for this study.
We now proceed to compare the ten nations in the study on the various socio-economic andgovernance measures listed above In Figure I.1 below, the two World Bank measures of nationalincome, GNP per capita and PPP GNP per capita are shown. The range is wide, from a high inthe Mexico case, the second highest GNP in Latin America according to the World Bank(exceeded only by Chile), to the low of Nicaragua, the poorest of the countries in the region(excluding Haiti in the Caribbean).
Figure I.1. Per Capita Income in U.S. Dollars, 2002: GNI and PPP
Per capita income in U.S. dollars, 2002: GNI and PPP
Nicaragua
Honduras
Bolivia 2002
Ecuador
Guatemala
Colombia
El Salvador
Panamá
Costa Rica
México
Per
capi
ta in
com
e
$10,000
$8,000
$6,000
$4,000
$2,000
$0
GNI
PPP
247024502300
3130
3880
5870
4570
5870
82608540
710930900
149017601820
2110
40204070
5920
3 Since two of the items, such TV and vehicle ownership allowed for reporting more than one (e.g., two or three
TVs), some of the teams decided to include those numbers to add further refinement to the index.4 Daniel Kaufmann, Arat Kraay, and Pablo Zoido-Lobatón, Governance Matters, vol. 2196, Policy Research
Working Paper (Washington, D. C.: World Bank, 1999).

The Political Culture of Democracy in Mexico, Central America, and Colombia, 2004 4
The wealth measure emerging from the 2004 CAM/Colombia survey is examined next, with theresults shown in Figure I.2. This rendering of national wealth produces some small variationfrom the GNP and GNI figures shown above. In this measure, Nicaragua and Honduras are againthe two poorest countries, but Costa Rica and Mexico switch places at the high end of the scale.Some of this variation can be attributed to the degree to which the sample (and the nationrepresented) has made rural electrification a priority and the extent to which the country hasurbanized. Several of the wealth indictors depend on a regular supply of electric power, andwithout it, even those who could afford the appliance (e.g., TV, clothes washer) would notpurchase one. Controlling for urbanization in the study is an option, but, unfortunately, there isno agreed upon standard for urban/rural, and in sparsely populated Bolivia, an “urban” areamight be classified as “rural” in other, more densely populated countries such as El Salvador.
Figure I.2 Mean Capital Goods per Country, Based on 2004 Survey
Mean capital goods per country, based on 2004 survey
Nicaragua
Honduras
Guatemala
Bolivia 2002
El Salvador
Colombia
Ecuador
Panamá
México
Costa Rica
Mea
n ca
pita
l goo
ds
7.0
6.0
5.0
4.0
3.0
2.0
1.0
2.2
2.72.9
3.13.4
3.94.0
4.4
5.2
6.1
The last of the social and economic development measures is infant mortality, as shown inFigure I.3. Once again, there is great variation among the countries under study, ranging from alow of 9 in Costa Rica to a high of 56 in Bolivia. In the larger world-wide perspective, it is ofnote that the figure for the low income countries (nations located largely in Africa) was 121, thelower middle income countries was 41 and the upper middle income countries 23. The highincome countries average 7, just a bit better than Costa Rica.

The Political Culture of Democracy in Mexico, Central America, and Colombia, 2004 5
Figure I.3 Under-Five Infant Mortality, 2001
Under-five infant mortality, 2001
Bolivia 2002
Guatemala
El Salvador
Nicaragua
Honduras
Ecuador
México
Colombia
Panamá
Costa Rica
mor
talit
y pe
r 1,
000
60
50
40
30
20
10
0
56
36333232
2524
1919
9
Turning now to the governance measures from the World Bank Institute, once again there isgreat variation. The World Bank Institute publishes these figures in percentile rank, so with thesame metric it becomes easy to compare the indicators one to the other.
The first index is “Voice and Accountability,” with the results shown in Figure I.4. Notsurprisingly, Costa Rica ranks at the top of this group, with a score of 85. What is surprising isthat Colombia ranks so low, no doubt because of the protracted violence that has wracked thatcountry for decades. Guatemala also fares poorly in the Voice and Accountability dimension ofgovernance.

The Political Culture of Democracy in Mexico, Central America, and Colombia, 2004 6
Figure I.4 Voice and Accountability, 2002
Voice and Accountability, 2002
Colombia
Guatemala
Honduras
Ecuador
Bolivia 2002
El Salvador
Nicaragua
México
Panamá
Costa Rica
Ran
k
90.0
80.0
70.0
60.0
50.0
40.0
30.0
20.0
30.8
35.4
46.047.5
50.051.552.0
59.6
64.6
84.8
The serious impact of the violence in Colombia can be seen clearly in the “Political Stability”index, which is shown in Figure I.5. Colombia’s extreme position at the bottom of the scale istroubling, however, given the length of time that country has enjoyed regular elections andnormal transitions from one government to another.

The Political Culture of Democracy in Mexico, Central America, and Colombia, 2004 7
Figure I.5 Political Stability, 2002
Political stability, 2002
Colombia
Ecuador
Guatemala
Bolivia 2002
Honduras
Nicaragua
México
El Salvador
Panamá
Costa Rica
Ran
k
100.0
80.0
60.0
40.0
20.0
0.0 4.9
24.3
32.4
36.838.4
47.650.8
56.857.3
86.5
Government effectiveness is shown in Figure I.6. Costa Rica continues to lead the group, but forthis measure, Colombia ranks far higher than it did for stability. These findings are a goodindication that the governance measures are not all basically measuring the same thing(correlations will be shown below). In the case of Colombia, we have a country which thegovernance measures classify as highly unstable yet it has a government that, when compared toothers in the region, is relatively effective.

The Political Culture of Democracy in Mexico, Central America, and Colombia, 2004 8
Figure I.6 Government Effectiveness, 2002
Government effectiveness, 2002
Ecuador
Nicaragua
Honduras
Guatemala
Bolivia 2002
El Salvador
Colombia
Panamá
México
Costa Rica
Ran
k
70.0
60.0
50.0
40.0
30.0
20.0
10.0
0.0
13.4
17.5
27.3
32.034.5
35.6
45.4
53.6
61.9
66.5
The next measure in this series is the Rule of Law, as shown in Figure I.7. Costa Rica, again,scores highest, but Guatemala, probably because of the well-publicized cases of military figuresacting with impunity, scores at the low end.

The Political Culture of Democracy in Mexico, Central America, and Colombia, 2004 9
Figure I.7 Rule of Law, 2002
Rule of law, 2002
Guatemala
Honduras
Colombia
Nicaragua
Bolivia 2002
Ecuador
El Salvador
México
Panamá
Costa Rica
Ran
k
80.0
70.0
60.0
50.0
40.0
30.0
20.0
10.0
21.623.7
26.8
32.032.533.0
39.7
52.1
55.7
72.2
The last of the macro-level variables is Popularity of the Incumbent Administration, with theresults shown in Figure I.8. If a president and his/her government is extremely popular, citizensmight feel optimistic about the future and give more favorable scores to survey questions thanwhen citizens are pessimistic or even worried about the future. While there are many ways tomeasure incumbent popularity, the one that emerges from the surveys themselves are the best forthe purpose of this study since popularity is ephemeral, and by capturing it at the moment of theinterview in which the democratic values questions were asked, allows us to best control for thisimpact. Question M1 in the surveys asked, “Speaking about the current administration, how gooda job is the administration of [fill in President’s name] doing? Very good, good, fair, not so good,poor.” The results, shown in the following table, are consistent with a number of other studies.The President of Colombia, at the time of the survey, was extremely popular, while thePanamanian President was receiving very low rankings in the polls. It needs to be kept in mind,however, that these results are for only the moment of the interview and can shift rather quickly.

The Political Culture of Democracy in Mexico, Central America, and Colombia, 2004 10
Figure I.8 Presidential Popularity, 2004
Presidential popularity, 2004
Panamá
Ecuador
Honduras
Nicaragua
México
Costa Rica
Guatemala
Bolivia 2002
El Salvador
Colombia
Scal
e of
1-5
, wit
h 5
= m
ost
popu
lar
3.0
2.8
2.6
2.4
2.2
2.0
1.8
1.6
1.4
1.6
1.7
1.8
2.0
2.1
2.2
2.32.3
2.4
2.8
1.1 Relationship Among the Socio-Economic and Governance MeasuresThe variables described above are related to each other, but not perfectly so. On average,countries that have higher GNPs, have higher PPP GNPs. Similarly, countries that have higherGNPs and/or higher PPP GNPs have lower levels of infant mortality. Yet, the correlation is farfrom perfect. Governance measures are also related among themselves, although, as has beenshown, countries can perform well on one measure and not well on another. The relationshipsamong the four measures of socio-economic development are shown in Table I.2 below. Theonly measure that is significantly less strongly related to the others is infant mortality.5 Thisfinding no doubt reflects national policy in terms of long-term public expenditures on health. InCosta Rica, for the past half century the government has prioritized the health of the populaceand has made preventive health care expenditures in all areas of the country widely available.Thus, as early as the 1960s rural health workers spread throughout the countryside andinoculated children, while sanitation engineers established potable drinking water systems, andphysicians staffed rural clinics and hospitals.6 Social Security protection was universalized for allcitizens.7 In Honduras, however, public health lags far behind, with the resulting higher levels of
5 Note that the negative sign in the correlation coefficient simply means that higher wealth is correlated with lower
infant mortality.6 Mitchell A. Seligson, Juliana Martínez, and Juan Diego Trejos, Reducción de la pobreza en Costa Rica: El
impacto de las políticas públicas. (San José, Costa Rica and Quito, Ecuador: Serie Divulgación Económica No.51,Instituto de Investigaciones en Ciencias Económicas Universidad de Costa Rica, 1996).
7 Mark Rosenberg, Las luchas por el seguro social en Costa Rica (San José de Costa Rica: Editorial Costa Rica,1983).

The Political Culture of Democracy in Mexico, Central America, and Colombia, 2004 11
infant mortality. These correlations suggest, therefore, that the addition of infant mortality to themeasures based on health alone provides a broader look at development.
Table I.2. Correlations Among the Economic-Social Development Indicators
Indicator
GNI2002 GrossNational Income
(GNI), 2002 (WorldBank)
INFMORTUnder-five
Infantmortality,
2001 (WorldBank)
PPN2002PPP GrossNationalIncome,
2002 (WorldBank)
WEALTH MeanNational Wealth
Measured byCapital Goods
Ownership(r1,3,4,5,6,7,12)
GNI2002 Gross NationalIncome (GNI), 2002(World Bank)
1 -.580(**) .921(**) .838(**)
INFMORT Under-fiveInfant mortality, 2001(World Bank)
-.580(**) 1 -.719(**) -.704(**)
PPN2002 PPP GrossNational Income, 2002(World Bank)
.921(**) -.719(**) 1 .898(**)
WEALTH Mean NationalWealth Measured byCapital Goods Ownership(r1,3,4,5,6,7,12)
.838(**) -.704(**) .898(**) 1
** Correlation is significant at the 0.01 level (2-tailed).
The five governance items are also related to each other, as is shown in Table I.3. While some ofthese variables are closely associated, others are not. Voice and Accountability, for example, isvery closely associated with the Rule of Law indicators and also reasonably associated withGovernment Effectiveness. But, there is a significant and negative association with presidentialpopularity. Again, popularity of an administration can shift sharply and quickly, as anyincumbent administration knows, based upon short-term changes in the economy or significantnational events (including corruption scandals), so this negative association does not havetheoretical significance for this analysis. Political Stability is strongly associated with the Rule ofLaw and more modestly associated with Government Effectiveness and negatively associatedwith Presidential Popularity. Finally, the Rule of Law is strongly associated with Voice, Stabilityand Effectiveness, but negatively associated with presidential popularity.

The Political Culture of Democracy in Mexico, Central America, and Colombia, 2004 12
Table I.3. Correlations Among the Governance Indicators
VOICE Voiceand
Accountability,2002 (World
Bank)
STABLEPolitical
Stability, 2002(World Bank)
EFFECTGovernmentEffectiveness,2002 (World
Bank)
LAW Rule ofLaw, 2002
(World Bank)
POPULARPresidentialpopularity,
based on M1means - 5 (so
that highnumber =
most popular)VOICE Voice andAccountability, 2002(World Bank)
1 .918(**) .596(**) .939(**) -.376(**)
STABLE PoliticalStability, 2002 (WorldBank)
.918(**) 1 .526(**) .823(**) -.286(**)
EFFECT GovernmentEffectiveness, 2002(World Bank)
.596(**) .526(**) 1 .774(**) .193(**)
LAW Rule of Law,2002 (World Bank) .939(**) .823(**) .774(**) 1 -.214(**)
POPULARPresidentialpopularity, based onM1 means - 5 (so thathigh number = mostpopular)
-.376(**) -.286(**) .193(**) -.214(**) 1
** Correlation is significant at the 0.01 level (2-tailed).
In order to get an overall look at these indicators and their relationship one to another, a factoranalysis is shown below. Factor analysis looks for commonalities among the variables andproduces a table that shows “loadings;” the higher the number the more that the indicator isrelated to the dimension. What emerged are two clear factors, or dimensions. The first iscomprised of the Economic-Social Development indicators, while the second is comprised of theGovernance indicators. However, two Governance indicators, Rule of Law, and especially,Effectiveness, are actually far more closely associated with the Economic-Social Developmentindicators than they are with the Governance indicators for this group of ten Latin Americancountries. In effect, this leaves “Voice and Accountability,” “Political Stability” and “PoliticalStability” as the only variables that effectively measure a dimension distinctly different from theEconomic-Social series of indicators.
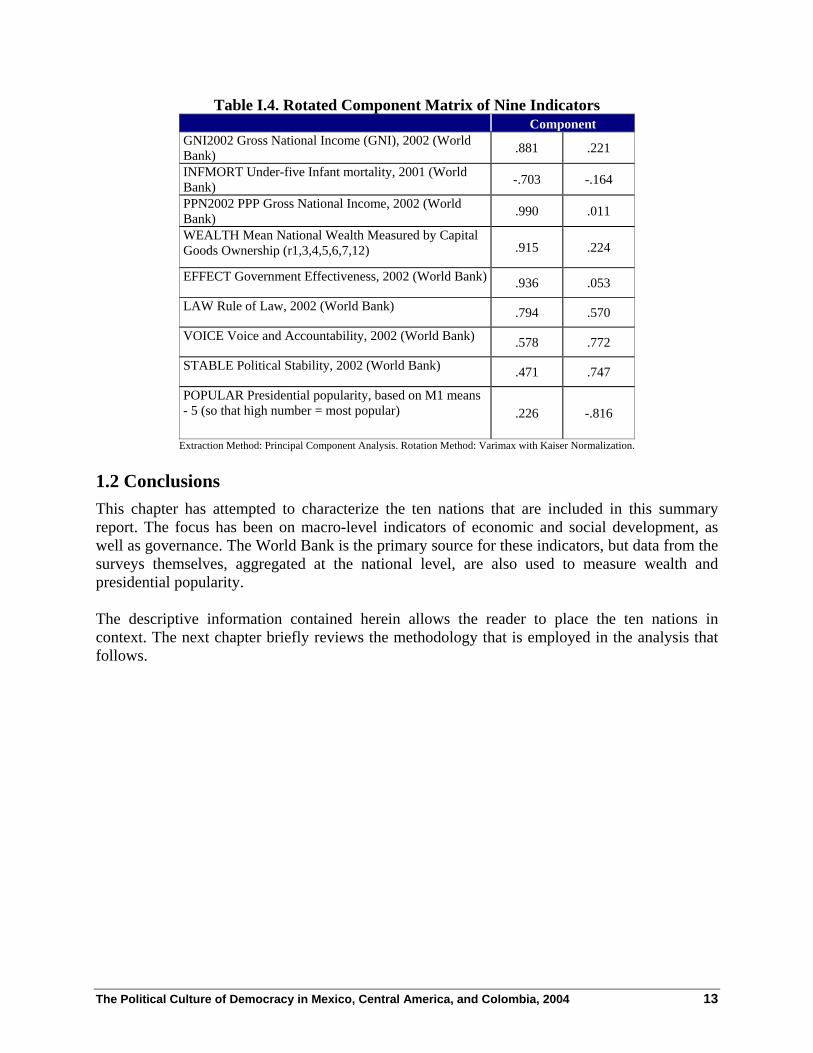
The Political Culture of Democracy in Mexico, Central America, and Colombia, 2004 13
Table I.4. Rotated Component Matrix of Nine IndicatorsComponent
GNI2002 Gross National Income (GNI), 2002 (WorldBank) .881 .221
INFMORT Under-five Infant mortality, 2001 (WorldBank) -.703 -.164
PPN2002 PPP Gross National Income, 2002 (WorldBank) .990 .011
WEALTH Mean National Wealth Measured by CapitalGoods Ownership (r1,3,4,5,6,7,12) .915 .224
EFFECT Government Effectiveness, 2002 (World Bank) .936 .053
LAW Rule of Law, 2002 (World Bank) .794 .570
VOICE Voice and Accountability, 2002 (World Bank) .578 .772
STABLE Political Stability, 2002 (World Bank) .471 .747
POPULAR Presidential popularity, based on M1 means- 5 (so that high number = most popular) .226 -.816
Extraction Method: Principal Component Analysis. Rotation Method: Varimax with Kaiser Normalization.
1.2 ConclusionsThis chapter has attempted to characterize the ten nations that are included in this summaryreport. The focus has been on macro-level indicators of economic and social development, aswell as governance. The World Bank is the primary source for these indicators, but data from thesurveys themselves, aggregated at the national level, are also used to measure wealth andpresidential popularity.
The descriptive information contained herein allows the reader to place the ten nations incontext. The next chapter briefly reviews the methodology that is employed in the analysis thatfollows.


The Political Culture of Democracy in Mexico, Central America, and Colombia, 2004 15
2.0 Analysis and Sample Design2.1 Sample DesignA study of democratic values and behaviors needs to be designed so that it will gather data on thevalues of all citizens, not just the active ones, the politically “important” ones, or those who livein major towns and cities. Indeed, the major advantage of surveys over elections is that inelections many people do not vote, and often it is the poor or the rural voter who is underrepresented in the election.8 Surprisingly, however, many studies carried out in Latin Americathat claim to represent the views of the nation, are often based on samples that systematicallyunder represent certain sectors of the population. Often the biases that crop up in samples emergebecause of cost considerations, which in turn are a function of the dispersion of populations overwide areas, or because the multi-lingual nature of the national population makes it difficult andexpensive to conduct the interviews in all of the languages widely spoken in a given country.But, more often than not, the samples are designed, as one sample design “expert” told me, torepresent the “politically relevant population.”
In the current project, the effort has been to draw samples fully representative of the voting-agepopulation of each of the countries included in the study. The target group of countries was theseven nations in the USAID CAM region, plus Colombia, which joined our project. The mapbelow (Figure II.1) shows these countries. We believe that we have accomplished this goal,within the limitations of the science of sampling and an appropriate consideration for costeffectiveness. That is, in the field of survey research, larger samples are always better, but cost isalways a factor to be considered. Consider the impact of sample size on the precision of theresults. In this study we determined that a sample of 1,500 respondents per country would satisfyour objectives, and still remain feasible from a cost point of view. With a sample of this size,using what is known as “simple random sampling,”9 95 times out of 100, results are accurate towithin ± 2.5% of the result that would have been obtained, had 100% of the voting-aged adultsbeen interviewed. Is that good enough? That depends on the trade-off of greater cost for greaterprecision. If we had doubled the sample to 3,000, the accuracy would have improved to about ±2.2%, or an increase of only .3% for a doubling of the sample size and fieldwork costs. Howdoes the 2.5% figure compare to research in other fields? Quite well. In national elections in theU.S., it is common to see samples of only about 1,000, and in most medical research testing newdrugs and procedures, samples that are far smaller are common. So, we believe that the samplesize selected for this study is appropriate.
8 This point was made forcefully by Sidney Verba in his Presidential address to the American Political Science
Association: Sidney Verba, "The Citizen as Respondent: Sample Surveys and American Democracy," AmericanPolitical Science Review 90, no. 1 (1996):1-7.
9 As will be noted below, the surveys carried out here were actually “stratified, clustered samples,” so the 2.5%figure is not precisely accurate.
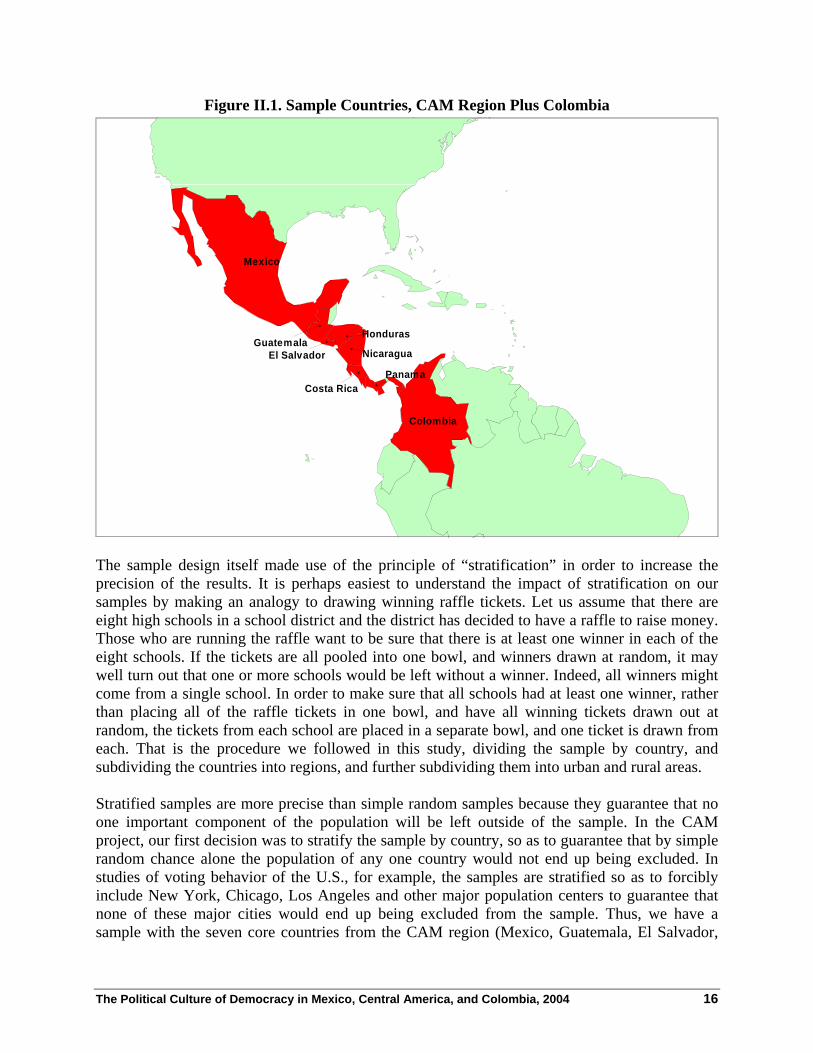
The Political Culture of Democracy in Mexico, Central America, and Colombia, 2004 16
Figure II.1. Sample Countries, CAM Region Plus Colombia
GuatemalaEl Salvador
Panama
Nicaragua
Costa Rica
Honduras
Colombia
Mexico
The sample design itself made use of the principle of “stratification” in order to increase theprecision of the results. It is perhaps easiest to understand the impact of stratification on oursamples by making an analogy to drawing winning raffle tickets. Let us assume that there areeight high schools in a school district and the district has decided to have a raffle to raise money.Those who are running the raffle want to be sure that there is at least one winner in each of theeight schools. If the tickets are all pooled into one bowl, and winners drawn at random, it maywell turn out that one or more schools would be left without a winner. Indeed, all winners mightcome from a single school. In order to make sure that all schools had at least one winner, ratherthan placing all of the raffle tickets in one bowl, and have all winning tickets drawn out atrandom, the tickets from each school are placed in a separate bowl, and one ticket is drawn fromeach. That is the procedure we followed in this study, dividing the sample by country, andsubdividing the countries into regions, and further subdividing them into urban and rural areas.
Stratified samples are more precise than simple random samples because they guarantee that noone important component of the population will be left outside of the sample. In the CAMproject, our first decision was to stratify the sample by country, so as to guarantee that by simplerandom chance alone the population of any one country would not end up being excluded. Instudies of voting behavior of the U.S., for example, the samples are stratified so as to forciblyinclude New York, Chicago, Los Angeles and other major population centers to guarantee thatnone of these major cities would end up being excluded from the sample. Thus, we have asample with the seven core countries from the CAM region (Mexico, Guatemala, El Salvador,

The Political Culture of Democracy in Mexico, Central America, and Colombia, 2004 17
Honduras, Nicaragua, Costa Rica and Panama), plus Colombia, and Ecuador, which was alreadyinvolved via a grant to the University of Pittsburgh (now transferred to Vanderbilt University).We also had a sample of Bolivia from 2002 and one planned for that country for August of 2004.Since the 2004 data would not be available in time for this publication, we used the 2002 Boliviadata. For a few questions, there is also data from a study carried out with USAID support in theDominican Republic in which LAPOP provided some assistance on questionnaire design. Thisgave us a total sample of ten countries, each one comprising its own stratum, although not all ofthe questions are available for all of the samples.
We further stratified the samples within each country to increase their precision even further. Wedivided each country into a minimum of five strata, representing the major geographic divisionsof the countries. In that way, each region of the country would be represented. For the most part,we did not exclude any region unless the cost of access was extreme. For example, in Ecuadorwe excluded the Galapagos Islands. On the other hand, in Honduras, we developed an Englishversion of the questionnaire for use on the Bay Islands so as not to exclude that population fromthe survey. Similarly, we developed translations of the questionnaire in four Mayan languagesfor the case of Guatemala, and used both Aymara and Quecha versions in Bolivia. The sampledesign details of each country explain any such omissions, but they are very minor when theyoccur, and justified by cost considerations.
As a further effort to increase the precision of the samples, we subdivided each of the country-level strata into urban and rural. We know that many other similar samples in Latin Americalargely exclude rural areas because of their inaccessibility, but we did not want to do that. So, werelied upon census definitions of urban and rural, and divided our strata so that each one wouldfaithfully represent the urban/rural breakdowns within them.
The next stage in the sample design involved determining the neighborhoods in which theinterviews would take place. We referred to these as “primary sampling units,” or PSUs. Theteams obtained census maps from their respective census bureaus and, using population datasegments, randomly selected the maps from within each stratum, and then randomly selected thesegments in which the interviews would be carried out. Each stage of selection involved using“Probability Proportional to Size” (PPS) criteria so that the probability of any one unit beingselected was in direct proportion to the most recent population estimates. In that way, voting-aged adults in each country had an equal and known probability of being selected, a fundamentalcriterion for a scientifically valid probability sample. Thus, respondents living in sparselypopulated rural villages had the same probability of being selected as respondents in large cities.
The final stages of selection involved picking the household and selecting the respondent.Selecting the household involved a systematic selection of housing units within a PSU (using thecensus maps and locally updated information). We determined that 6-8 interviews would becarried out in each urban PSU and 10-12 in each rural PSU. We allowed larger clusters in ruralareas than in urban areas because of the far lower housing density in the former, and theincreased travel time smaller clusters would imply. Clusters are commonly used as they providean appropriate trade-off between cost and precision. Since the residents of each PSU are likely tohave more in common with each other than residents living in the country at large (similarincomes, similar levels of education, etc.), the selection of a “cluster” of households in a given

The Political Culture of Democracy in Mexico, Central America, and Colombia, 2004 18
area produces a somewhat reduced level of precision, but at great cost savings. By clusteringrespondents in a neighborhood, and interviewing several of them, the efficiency of aninterviewer is greatly increased. The result is the introduction of what is known as “intra-classcorrelation,” that can widen the confidence intervals. Each of the studies contains a section inwhich these design effects are estimated and reported for key variables in the study.
Once the household was selected, we determined that random selection of the respondent withinthe household was far too costly since it would have required multiple call-backs, since theselected respondent is often not at home when the interviewer arrives at the door. We decided touse a quota sampling methodology at the level of the household. The quotas were established forage and gender, again based on census data for each country.
The sample designs also took into consideration the issue of non-coverage. That is, somerespondents refuse to cooperate, and if we had targeted only 1,500 interviews per country, wecould have ended up with a smaller sample size than we had planned. As a result, in each countryan estimate of non-coverage was included. The final samples are shown in Table II.1 below. Ascan be seen in the table, the total pooled sample N was 15,410.
Table II.1. Sample Size per CountryCountry Sample size Percent of entire
sample1 México 1,556 10.12 Guatemala 1,708 11.13 El Salvador 1,589 10.34 Honduras 1,500 9.75 Nicaragua 1,430 9.36 Costa Rica 1,500 9.77 Panamá 1,639 10.68 Colombia 1,479 9.69 Ecuador 1,500 9.710 Bolivia 2002 1,509 9.8Total 15,410 100.0
Note: The samples for Ecuador and Bolivia were ca. 3,000 each. In order that these samples not skew means computed for the pooled data base,they were weighted down by half.
2.2 Analysis DesignThe individual country-based monographs focus on the key dependent variables in this study.Those are: system support, tolerance, corruption, administration of justice and crime, localgovernment participation and satisfaction, voting, and social capital. In this synthesis volume, thesame variables will be examined, but now at the regional level, whereas in the country-basedstudy, the emphasis was on variation within the countries based on region, gender, age, income,education, etc. This regional report will not include a chapter on voting, since those results wereentirely country-specific.
The first chapter of this volume showed quite clearly that the countries in the study vary sharplyin terms of levels of economic and social development. A great deal of democratic theory tells usthat economic and social development is closely related to the emergence and longevity of

The Political Culture of Democracy in Mexico, Central America, and Colombia, 2004 19
democratic regimes. Ever since Lipset published his landmark study, it has been argued thatcountries with higher GNPs are more likely to be democratic than countries with low GNPs.10
Lipset also demonstrated that social development, defined by various indicators such as literacy,was also common to democracies.11 More recent research, now based on nearly all countries inthe world for the post-World War II period, shows that democracies do not necessarily emerge inmore developed countries, but it confirms that countries that are more developed are more likelyto survive as democracies.12 Other research strongly supports the original view that democracy is“caused” by economic development.13
Our analysis is focused on the democratic (and anti-democratic) values and behaviors of citizens,and it is reasonable to assume that those attitudes are shaped, in part, by the economic and socialconditions of the countries in which they live. For example, Costa Ricans, who have enjoyedstable democracy for over half a century have also enjoyed a higher standard of living than thetheir neighbors to the south, the Nicaraguans.14 One could assume that the higher standard ofliving has both made it more likely for democracy to emerge and to survive in Costa Rica than inNicaragua.
On the other hand, higher levels of economic and social development could well be a product ofdemocracy itself. There is much theorizing about the impact of democracy on economic growth.Many scholars state that in the context of the freedom that democracy provides, the economywill grow more quickly.15 Other scholars maintain, however, that the only positive impact ofdemocracy on growth is that the former slows birth rates and results in higher levels of humancapital formation.16
In this study, we cannot resolve those important questions about the connections betweendevelopment and democracy, but we can present results that control for the variation in oursamples so as to determine what is “left over” once we have done so. That is to say, we want toknow, for example, how much variation among the countries is there on system support once thenation’s level of development has been taken into account. If development has produced citizenswho are supportive of their political system, then once we control for development, there should
10 Seymour Martin Lipset, "Some Social Requisites of Democracy: Economic Development and Political
Legitimacy," American Political Science Review 53 (1959):65-105.11 Ibid; Seymour Martin Lipset, Political Man: The Social Basis of Politics, 1981 (expanded edition) ed. (Baltimore,
MD.: Johns Hopkins University Press, 1961); Seymour Martin Lipset, "The Social Requisites of DemocracyRevisited," American Sociological Review 59 (1994):1-22.
12 Adam Przeworski, José Antonio Cheibub Michael Alvarez, and Fernando Limongi, "What Makes DemocraciesEndure?," Journal of Democracy 7, no. 1 (1996):39-55; Adam Przeworski, Democracy and development : politicalinstitutions and well-being in the world, 1950-1990 (Cambridge: Cambridge University Press, 2000).
13 Robert Barro, "Economic Growth in a Cross-Section of Countries," Quarterly Journal of Economics 106(1991):407-45; Robert J. Barro, Determinants of Economic Growth: A Cross-Country Empirical Study(Cambridge, MA: MIT Press, 1997).
14 Deborah J. Yashar, Demanding Democracy: Reform and Reaction in Costa Rica and Guatemala, 1870s-1950s(Stanford: Stanford University Press, 1997); John A. Booth, Costa Rica: Quest for Democracy (Boulder:Westview Press, 1998).
15 Stephen Knack, ed., Democracy, Goverance and Growth (Ann Arbor: Univrersity of Michigan Press, 2003).16 Adam Przeworski, José Antonio Cheibub Michael E. Alverez, and Fernando Limongi, Democracy and
Development: Political Institutions and Well-Being in the World, 1950-1990 (Cambridge: Cambridge UniversityPress, 2000).

The Political Culture of Democracy in Mexico, Central America, and Colombia, 2004 20
be no significant remaining variation among the countries under study here. On the other hand, ifthere remains variation, we can then more confidently argue that there are indeed differences inpolitical culture independent of development. If variation remains, do the countries highest onsystem support prior to the controls being introduced still remain at the top? Or, does controllingfor development elevate some countries above the leaders?
There is, however, one important precaution we need to take before drawing any conclusionsabout the impact of country-level development on our measures of democracy drawn from publicopinion. We need to know if that impact is statistically significant. Normally, that questionwould be a simple one to answer; we would just enter into a standard Ordinary Least Squares(OLS) equation both the country-level information (e.g., GNP per capita) and the individualinformation (e.g., individual attitudes toward democracy) and if both variables prove todetermine significant variation across the ten countries under study, we would conclude that bothhave an impact. However, following that approach would violate a fundamental requirement ofOLS regression, and that is the “independence” requirement. Since we know that the individualsliving within each country have values and behaviors that are not independent of one another,and therefore the standard errors of the equations are not identical from one country to the next,we need to correct for this. We do so in this study by calculating what are known as “robuststandard errors,” (using STATA’s “cluster” procedure) and examine if both the country-level andindividual-level variables are both significant. If they are, we can proceed to present thecontrolled results.17
In this study, many of the results will be presented in both their original form, and aftercontrolling for key factors that could explain variation in the dependent variables, will bepresented in their controlled form. These results will both be presented using standardizedresults, so the original scores will be transformed into z-scores, and the residuals of theregression equations will be presented in standardized format. That way, comparisons can easilybe made between the two results. In no case, however, will results be presented in the controlledform if the control variables, as determined through the use of robust regression techniques,prove not to be statistically significant. Each chapter in this study explains which variables areused as controls.18
2.3 ConclusionsThis chapter has presented the key methodological issues in the comparative, regional study. Ithas shown that some variables can be used to help distinguish among the countries in the study.Those variables can help determine if cultural/attitudinal variables play a role independent ofthese macro-level variables. In the pages that follow, the study examines key variables that wereincluded in the country-based studies.
17 The point estimates do not change using robust standard errors, just the standard errors (and T values) themselves.
As a result, the residual plots produced by SPSS, and used here, do not distort the results. SPSS does not (yet)calculate robust standard errors in regression equations.
18 The method used for controls is to compute the “residuals” after the control variables are introduced, and tostandardize those results, so that they have a mean of zero and a standard deviation of one. Then the originalresults, also standardized to make them comparable to the controlled results are presented alongside of the newresults, so that comparisons can be easily made, and shifts can be observed.

The Political Culture of Democracy in Mexico, Central America, and Colombia, 2004 21
3.0 Support for Democracy: Political Community, PoliticalLegitimacy and Political ToleranceThis chapter examines citizen support for democracy in Central America, Mexico, Colombia,Ecuador and Bolivia. It does so at three different levels. It first examines support for the politicalcommunity, a basic value measuring pride in one’s nationality, without which it is hard to seehow a nation could hold together. It then shifts the focus from nationalism to support for theinstitutions of government, and measures what is called “system support,” or the belief in thelegitimacy of the political system. Without that support, government’s right to rule is in question.The chapter then moves on to examine a fundamental democratic principle, the belief in the civilliberties of others, including those with whom one disagrees. Without tolerance, there can be noopposition, and without opposition, no democracy. Finally, the paper tests a model in which thecombination of political support and political tolerance are seen as crucial to stable democracy.The results for all ten nations in the model are presented.
3.1 The Existence of Political CommunityA crucial factor in the stability of any nation is that its citizens support it. Support, as hasrecently been pointed out by Pippa Norris of the Harvard Department of Government, ismultidimensional.19 At the most general level, citizens must believe in the existence of, and havesupport for, the “political community.” According to Norris (p. 10), this involves “a basicattachment to the nation.” It is precisely this attachment that appears to be missing in a numberof countries in Africa, where the loyalty is to the clan or tribe and not to the artificiallyconstructed post-colonial national boundaries.20
Our first question, then, is, “is there a political community in the countries under study?” Theanswer is a resounding “yes.” The survey asked a long series of questions in the area of systemsupport, but one of them (B43) focused directly on the pride in the political community, andasked “To what degree are you proud of being a [fill in citizenship name]?” The respondentsreplied with respect to a seven-point scale, which ran from 1 on the low end, indicating no pride,to 7 on the high end, indicating high pride. In this graph, and all others in this report, the 1-7 (andother scales) are converted to a 0-100 range so as to provide a common metric for the reader.21
Unfortunately, this item was not asked in Bolivia, so we limit the comparisons to nine countries.As can be seen in Figure III.1, an overwhelming majority of the respondents in each of thecountries in which the survey was conducted were extremely proud of their nationality. On theseven-point scale, three out of four respondents in the countries selected a score of “7,” which isthe highest possible score, while most of the other respondents selected a score in the positiveend of the continuum (5 or 6). This finding clearly suggests that there is a real sense of politicalcommunity in these countries.
19Pipa Norris, Critical Citizens: Global Support for Democratic Government. Oxford: Oxford University Press,
1999.20 Robert Mattes, "Understanding Identity in Africa: A First Cut," in Afrobarometer Working Paper No. 38 (Cape
Town, South Africa: AfroBarometer, 2004).21 The conversion is accomplished by subtracting 1 from each score, so that they all have a 0-6 range rather than a 1-
7. Then each score is divided by 6, so that they now range from 0-1, and then the scores are multiplied by 100.

The Political Culture of Democracy in Mexico, Central America, and Colombia, 2004 22
Figure III.1 Pride in Nationality
Pride in nationality
México
Ecuador
Honduras
Guatemala
Colombia
Nicaragua
El Salvador
Panamá
Costa Rica
Mea
n Pr
ide
in n
atio
nalit
y
100.0
90.0
80.0
70.0
60.0
50.0
40.0
30.0
20.0
10.0
0.0
89.192.392.593.293.794.995.297.097.0
The analysis was run with two key controls: GNP per capita for 2002 (the most recent dataavailable, as noted in Section 2) and infant mortality for 2001 (again, the most recent dataavailable). The theory we are trying to test is the impact of these key development indicators onthe pride in nationality variable. It turns out, however, that when a robust regression is run onthis data, clustered by country, neither GNP nor infant mortality has any impact on pride innationality.22 This demonstrates that the widely varying levels of development found among thecountries being studied do not affect national pride.
3.2 Support for Specific InstitutionsWhile the results presented above show that the respondents in the countries studiedoverwhelmingly believe that they form part of a political community, this does not necessarily 22 regress b43r gni2002 infmort [pweight=wt2], robust cluster(pais)(sum of wgt is 1.3748e+04)
Regression with robust standard errors Number of obs = 15242 F( 2, 8) = 1.98 Prob > F = 0.2008 R-squared = 0.0056Number of clusters (pais) = 9 Root MSE = 16.92
------------------------------------------------------------------------------ | Robust b43r | Coef. Std. Err. t P>|t| [95% Conf. Interval]-------------+---------------------------------------------------------------- gni2002 | -.000705 .0006424 -1.10 0.304 -.0021863 .0007764 infmort | -.1802081 .0924584 -1.95 0.087 -.3934175 .0330014 _cons | 100.2894 3.641684 27.54 0.000 91.8917 108.6872------------------------------------------------------------------------------

The Political Culture of Democracy in Mexico, Central America, and Colombia, 2004 23
mean that they are confident in the institutions that govern them. In fact, as we shall shortly see,there is a yawning gap between pride in being a citizen of these countries and pride in theirsystems of government. Support for the political system we consider to be a measure of politicallegitimacy, and without legitimacy, no political system can expect to remain stable over longperiods of time. Citizens must have confidence in their government’s right to rule (which is theessence of the definition of legitimacy). In this section we will analyze the degree of politicallegitimacy of the various institutions of government.
The LAPOP has developed a battery of items that measure what we call “system support” thatmeasure a generalized sense of legitimacy of the political system. In addition, another, longerbattery of questions has been developed to measure confidence in the specific institutions of thestate. In this chapter we first compare the high levels of national pride that we have alreadyuncovered, with support for various dimensions of the political system. The questions were allbased on the same format and the same 1-7 response metric that was used to measure nationalpride, so the comparisons can be made directly. To make it easier, however, for the reader tocompare these responses the items are converted into a familiar 0-100 metric (commonly used intest grades or in Centigrade thermometers). In Table III.1 these items are listed by their averagescore, going from highest (i.e., greatest level of citizen confidence) to lowest (i.e., lowest level ofcitizen confidence) for the pooled sample of ten countries. Costa Rica and Panama do not havearmed forces, and the question on the army was not asked there, nor was it included in Bolivia.
Table III.1 Support for Institutions by Country: Mean Scores, 0-100 Basis.
Country
B43RPride in
nationality
B20RCatholic Church
B12RArmed Forces
B11RElectionTribunal
B32RMunici-pality
B18RPolice
B31RSupreme
CourtB13R
CongressB21R
PartiesMéxico 89.1 72.1 67.7 54.7 53.1 42.4 51.9 51.9 41.5Guatemala 93.2 63.8 49.1 49.7 54.9 39.6 43.9 38.3 29.4El Salvador 95.2 68.5 68.6 59.9 62.9 64.6 53.2 52.5 39.9Honduras 92.5 69.6 60.0 47.0 55.5 56.7 47.7 47.3 31.6Nicaragua 94.9 63.1 54.2 47.3 48.7 54.2 43.3 37.1 29.0Costa Rica 97.0 66.6 -- 70.8 56.9 58.4 61.9 53.5 35.3Panamá 97.0 78.7 -- 66.1 47.5 58.4 45.7 36.6 32.9Colombia 93.7 71.1 66.0 47.0 55.2 58.9 53.9 47.3 35.8Ecuador 92.3 69.0 54.9 38.1 51.4 45.9 31.7 25.3 22.3Bolivia 2002 -- 68.6 -- 46.5 28.9 26.0 -- 38.0 28.7Regional mean 93.9 69.2 60.1 53.0 51.7 50.5 48.4 42.7 35.5
Looking first at the pooled mean for the ten countries leads to some important conclusions; thehighest scoring institution in the series is the Catholic Church. At the other extreme, are thelegislature and the political parties. These results are shown graphically in Figure III.2.23
23 Controls for national income and infant mortality do little to change these results. There is no significant impact
on the Church, the Supreme Court, the Election Tribunal, or Congress. Only on parties do both variables make asmall difference, and infant mortality makes a small but significant difference on the trust in the Municipality andthe Police. Given the weakness of these controls, the uncontrolled results are presented here.

The Political Culture of Democracy in Mexico, Central America, and Colombia, 2004 24
Figure III.2 Trust in Institutions: Averages for Pooled Data
Trust in institutions: averages for pooled data
Parties
Congress
Supreme Court
Police
Municipality
Election Court
Armed Forces
Catholic Church
Pride in nationality
Trus
t (0
-100
)
100.0
90.0
80.0
70.0
60.0
50.0
40.0
30.0
20.0
10.0
0.0
35.5
42.7
48.450.551.753.0
60.1
69.2
93.9
A striking finding from this comparison is the high level of trust in the military in most of thesecountries. With the exception of Guatemala, where the score falls slightly below 50, all of thecountries in the region that have armies report trust levels in the positive end of the continuum.No doubt, these results are related in part to the peace processes in the region and to thetransformations of the militaries in several countries. Perhaps more important, with the exceptionof Guatemala where the electoral court and the municipality have a slight and statisticallyinsignificant edge over the armed forces, trust in the armed forces is higher than in any otherstate institution.24 This finding speaks volumes about the role of the military in governance inLatin America. While militaries no longer rule in these countries, they have the respect of theirpopulations and are viewed as legitimate institutions despite (or perhaps because of) their taintedrecord on human rights.
The electoral tribunals are the next most trusted institutions among these ten countries, as awhole. Looking at the individual countries, one finds the electoral court right below the Churchand the military in all countries except in Costa Rica, where the support for the electoral courtexceeds that of the Catholic Church. This is less a statement about the role of the Church inCosta Rica than it is a statement about the image of the Supreme Electoral Tribunal. Support forthe Church falls in the middle of the group of ten countries, not especially high or low. Thesupport for the Electoral Tribunal, however, is higher in Costa Rica than in any other nation in
24 See Ricardo Cordova Macias, “Las relaciones civico-militares en Centroamerica a fin de siglo”. In Ricardo
Cordova Macias, Gunther Maihold y Sabine Kurtenbach, eds., Pasos hacia una nueva convicencia: democracia yparticipación en Centroamerica. San Salvador, FUNDAUNGO, Instituto de Estudios Iberoamericanos deHanburgo e Instituto Ibero-Americano de Berlin, 2001.

The Political Culture of Democracy in Mexico, Central America, and Colombia, 2004 25
the study. Much research has shown that a fundamental element of the stability of Costa Ricandemocracy has been the electoral tribunal. The civil war of 1948 was fought over the integrity ofthe disputed elections of that year. This finding alone is suggestive of the importance of cleanelections as a pillar for stable democracy. Indeed, the overall average for all of the countries inthe study places the electoral tribunal at the top of the political institutions being studied.
In light of this discussion, it is of interest to observe that there is one country, Ecuador, in whichthe electoral court does very badly in the public’s view; Costa Rican levels of support for thisinstitution are nearly double those in Ecuador. This finding has important programmaticimplications for Ecuador, where trust in the key electoral institution is especially low.
A third major finding is that local government scores far higher than national institutions. Localgovernment is seen as far more legitimate than the courts, the legislature or the political parties.In El Salvador, Honduras, Nicaragua, Costa Rica, Panama and Ecuador, the police score higherthan local government.
3.3 System SupportThe Latin American Public Opinion Project is designed to advance our understanding of thefactors that are important for democratic survival and strengthening. In this section we examinewhat we consider to be an embryonic “leading indicator” of democratic strengthening orweakening. In effect, we have been attempting to develop the social science equivalent of the“canary in the coal mine,” something that would on the one hand alert us to shifts in publicopinion that might prove ominous for democratic development, and, indeed, even democraticsurvival. On the other hand, the same indicator, if it were moving in a positive direction, mightpoint the way toward a more stable future.
The social sciences have been struggling to develop indicators of social phenomena for decades.Indeed, entire journals, such as Social Indicators Research have long been dedicated to thiseffort, and the World Bank has been publishing its Social Indicators of Development in bothpaper and electronic formats. In political science, the compilation of handbooks of indicators hasseen some progress.25 In the field of democratization, however, we must admit that little progresshas been made. One reason for this is that the problem is very complex. We know that manyfactors influence the direction of democracy, and several of those are very difficult to measure.For example, international factors, involving foreign support for--or opposition to-- democracyno doubt play an important role in democratic development. In Third Wave coup attempts inLatin America, for example in Guatemala, Ecuador and Venezuela, external factors played amajor role. Elites, of course, play a major role in determining the direction in which democracydevelops or decays.26 But in democracies, the mass public counts for a great deal. At one level,
25 Charles Lewis Taylor and David A. Jodice, World Handbook of Political Social Indicators. 3d ed. (New Haven,
Conn.: Yale University Press., 1983).26 John Higley and Richard Gunther, Elites and Democratic consolidation in Latin America and Southern Europe
(Cambridge ; New York: Cambridge University Press, 1992); Richard Gunther, Nikiforos P. Diamandouros, andHans-Jèurgen Puhle, The politics of democratic consolidation : southern Europe in comparative perspective, Thenew Southern Europe (Baltimore: The Johns Hopkins University Press, 1995); Richard Gunther, Josâe R.Montero, and Juan J. Linz, Political parties :Old concepts and new challenges (Oxford ; New York: OxfordUniversity Press, 2002).

The Political Culture of Democracy in Mexico, Central America, and Colombia, 2004 26
the public votes, and can vote in favor of leaders who promise a democratic future or can vote infavor of those who do not.27 The public can also unsettle and even unseat democracies throughrelentless protest demonstrations as they recently did in Venezuela. Bolivia in the past few yearshas experienced a number of such protest demonstrations, which eventually resulted in thedemocratically elected president having to resign and flee the country. So, it is important toinclude in any leading index of democracy the views of the mass public.
Unfortunately, in our view, the efforts to develop good measures that would help us predict thefuture direction of democracy based on survey research have been hampered by the widespreadtendency to include the word “democracy” in the survey questions themselves. The term isloaded, one that carries with it a great deal of what social scientists refer to as “social desirabilityresponse bias.” In a recent article the author of this monograph co-authored with twocollaborators, it was demonstrated that the use of the word “democracy” in survey questions canlead to serious problems of interpretation.28
The approach perused in this series of studies is to avoid the term “democracy” and attemptinstead to probe the underlying values that presumably are needed to support stable democracy.This has been done by probing the values of system support and political tolerance as isdescribed below. Is there any evidence that the LAPOP approach does provide a glimpse into thefuture? In fact, there is. Costa Rica is Latin America’s oldest and most stable democracy, andnobody is predicting its demise. Yet, in recent years it is clear that the system has beenundergoing a major change. Evidence of that emerged first in 1998 when abstention from thepresidential vote went up by 50% over its historically low levels, and voting for minor parties inthe legislature increased by over 25%. Then, in March and April of 2000 the greatest civil unrestin over 50 years broke out, with protests against the preliminary legislative approval of the“Energy Combo” legislation, a package of three bills designed to modernize the Costa RicanElectricity Institute (ICE) in the areas of energy and telecommunications. ICE has been a highlyregarded state monopoly that has extended electric and telephone service to nearly all areas ofthe country, but has been criticized for inefficiency at a time when such enterprises are beingprivatized around the world. The bill was strongly supported by the country’s two main parties,but opposed by a coalition of ten legislators from minor parties. Initial protests came fromenvironmental groups, but later involved an extremely broad group of civil society organizationsspreading throughout the country, leading to the biggest protests in thirty years. Eventually, thegovernment agreed to table the legislation, setting up a bi-partisan study committee to review itsprovisions. Then, in the 2002 elections, new parties emerged including a right-winganarchist/libertarian party. The result was not only a further increase in abstention, but for thefirst time in Costa Rica’s history the vote count required a second round to decide among the twoleading candidates.
Was any of this predictable by the leading indicators developed by LAPOP? Consider theinformation presented in Figure III.4, which is based on the longest series of surveys in theLAPOP data base. There is shown the index of system support that will be used in this chpater of
27 Amber L. Seligson, "When Democracies Elect Dictators: Motivations for and Impact of the Election of Former
Authoritarians in Argentina and Bolivia" (Doctoral dissertation, Cornell University, 2002b).28 Damarys Canache, Jeffrey Mondak, and Mitchell A. Seligson, "Measurement and Meaning in Cross-National
Research on Satisfaction with Democracy," Public Opinion Quarterly (2001).

The Political Culture of Democracy in Mexico, Central America, and Colombia, 2004 27
the regional report to compare the countries in the study. There we see that support in the 1970swas high, and remained high even though in the period 1980-82 the country suffered its worsteconomic crisis of the century. Yet, by the late 1980s it became apparent that system support wasdeclining and the elections of 1998, the protests of 2000 and the elections of 2002 could all beanticipated by the trend in sharply declining system support. This is not the place to discuss theseresults further, but the interested reader can peruse the articles on the subject.29 The importantpoint is that the system support measure showed important and systematic declines before theshifts in the electoral system. The level of support in Costa Rica, even after these declines, is stillhigher than in any other Latin American country for which we have data at LAPOP, so it is notthe case that the indicator is predicting a breakdown of democracy. But it did appear to predict amajor electoral realignment and unprecedented civil disobedience. For countries that are farlower in system support, as will be shown in this chapter, political stability will be much harderto ensure.
Figure III.4 System Support on Costa Rica: 1978-1999
System Support in Costa Rica: 1978-1999
Samples: National, 1987 and 1999, others, Metropolitan Area
19991995199019871985198319801978
Mea
n su
ppor
t (r
ange
1-7
)
7.0
6.5
6.0
5.5
5.0
4.5
4.0
3.5
Pride
Support
Institutions
Rights protected
Fair trial
Carazo Monge Arias Calderón Figueres Rodgríguez
The Bolivian case provides additional evidence that the leading indicators are meaningful. In1998 when the first measure was taken, most political scientists were arguing that Bolivia wasadvancing very rapidly in democratic development. While true in many ways, it was also thecase that the Bolivian public had serious reservations about their system, evidence of whichemerged in the large-scale protests that followed beginning in 2000. Even stronger evidenceemerged more recently as mass protests forced a sitting president to resign.
29 Mitchell A. Seligson, "Trouble in Paradise: The Impact of the Erosion of System Support in Costa Rica, 1978-
1999," Latin America Research Review 37, no. 1 (2002a):160-85., pp. 165-180.

The Political Culture of Democracy in Mexico, Central America, and Colombia, 2004 28
3.4 Measurement of System SupportThe Latin American Public Opinion Project has developed a battery of items that measure whatwe call “system support,” or a generalized sense of legitimacy of the political system. Inaddition, another, longer battery of questions has been developed measuring confidence in thespecific institutions of the state. The questions were all based on a 1-7 response metric that hasbeen used in many other countries. To make it easier, however, for the reader to compare theseresponses, the items are converted into a familiar 0-100 metric (commonly used in test grades orin Centigrade thermometers).
The series measuring system support contained a core of five items that attempt to get ageneralized feeling of legitimacy in the system. These read as follows:
A lot 7
6
5
4
3
2
Not at all 1
B1.To what extent do you believe that the courts in [country] guarantee a fair trial?B2. To what extent do you have respect for the political institutions of [country]?B3. To what extent do you think that the basic rights of citizens are well protected by the[country] political system?B4. To what extent do you feel proud to live under the political system of [country]?B6. To what extent do you feel that one ought to support the political system of [country]?30
The comparative results are presented in two ways. First, the results are presented uncontrolledby any other variables. Second, the results are presented controlled for respondent evaluation ofthe performance of the incumbent government.31 Controls were also introduced for level ofdevelopment (GNP per capita and infant mortality), but these variables played no significant rolein determining overall levels of system support.32 This is an important finding. It suggests that 30There is no question ‘B5’ in this study. Earlier versions of the PSA series included additional items, including B5,
but that item (and others) were dropped as they were shown to be less essential to measuring the basic concept. Inorder to retain consistency of comparisons with prior work, the original numbering system was retained in thisstudy for this series and all others presented in these pages.
31 The specific question asked M1. “Speaking in general about the current government, would you say that the jobthat President X is doing is (1) very good (2)good (3) neither good nor bad (4) bad (5) very bad? The controlvariable reversed the coding (M1R) so as to parallel the PSA5, which was coded from low system support to high.
32 The robust regression results are as follows:Regression with robust standard errors Number of obs = 17270

The Political Culture of Democracy in Mexico, Central America, and Colombia, 2004 29
overall levels of national wealth and development are not significant determinants of nationallevels of political legitimacy. The evaluation of incumbent performance, on the other hand, canbe considered to be a measure of “specific support,” as compared to the five-item series thatattempts to measure “diffuse support.” Prior research has shown that over time, low levels ofspecific support, brought on by popular satisfaction or dissatisfaction with governmentperformance, will influence diffuse support.33
The results are shown in Figure III.5. The y-axis measures system support, but now with a meanof zero and a standard deviation of 1. As can be seen, Costa Rica is far above the other countriesin the study, being more than one-half a standard deviation higher than the mean. At the otherextreme lie Ecuador and Bolivia, with results substantially below the mean for these tencountries. The control for incumbent evaluation, as we see, while it has a statistically significantimpact on system support, it does not change the basic patterns that we find, with very sharpdifferences among the countries.
F( 3, 9) = 21.19 Prob > F = 0.0002 R-squared = 0.0990Number of clusters (pais) = 10 Root MSE = 20.856
------------------------------------------------------------------------------ | Robust psa5 | Coef. Std. Err. t P>|t| [95% Conf. Interval]-------------+---------------------------------------------------------------- gni2002 | .0022069 .0010338 2.13 0.062 -.0001317 .0045455 infmort | -.1052443 .1245549 -0.84 0.420 -.387007 .1765184 m1 | -6.012008 .7643067 -7.87 0.000 -7.74099 -4.283026 _cons | 68.23269 7.210619 9.46 0.000 51.92114 84.54425------------------------------------------------------------------------------33 Mitchell A. Seligson and Edward N. Muller, "Democratic Stability and Economic Crisis: Costa Rica 1978-1983,"
International Studies Quarterly 31 (1987):301-26; Steven Finkel, Edward Muller, and Mitchell A. Seligson,"Economic Crisis, Incumbent Performance and Regime Support: A Comparison of Longitudinal Data from WestGermany and Costa Rica," British Journal of Political Science 19 (1989):329-51.

The Political Culture of Democracy in Mexico, Central America, and Colombia, 2004 30
Figure III.5 System Support, Ten-Country Comparison: Standardized Results: Controlledvs. Uncontrolled
System Support,ten-country comparison:
Standardized results: controlled vs. uncontrolled
Ecuador
Bolivia 2002
Guatemala
Nicaragua
Honduras
Panamá
Colombia
México
El Salvador
Costa Rica
Mea
n sy
stem
sup
port
, sta
ndar
dize
d.8
.6
.4
.2
-.0
-.2
-.4
-.6
Uncontrolled
Controlled
Another way of looking at these same data is to return to the 0-100 scale used throughout thisreport, while examining closely the confidence intervals of the results. That is, by looking atconfidence intervals we can determine if there are groups of countries that have similar levels ofsystem support. As shown in Figure III.6, four groups do indeed emerge. First there is CostaRica, which is in a group of its own at the extreme high end of system support. Second, there isthe group comprised of El Salvador, Mexico and Colombia, with a mid-range level of support.The third group, comprised of Panama, Honduras, Nicaragua and Guatemala, show relativelylow levels of support, with Bolivia and Ecuador being at the extreme low end. Ecuador, actuallyforms a group of its own at the extreme low end.

The Political Culture of Democracy in Mexico, Central America, and Colombia, 2004 31
Figure III.6 System Support, Ten-Country Comparison: Unstandardized Results (0-100Basis)
System Support, ten-country comparison:
Unstandardized results (0-100 basis)
Ecuador
Bolivia 2002
Guatemala
Nicaragua
Honduras
Panamá
Colombia
México
El Salvador
Costa Rica
95%
CI
Sys
tem
sup
port
80.0
70.0
60.0
50.0
40.0
30.0
3.5 Political TolerancePolitical tolerance, defined in these studies as the willingness to respect civil liberties of allcitizens, even those with whom you disagree, has been problematical in much of Latin America.In most of the countries in the LAPOP series, majorities of respondents are found to beintolerant. These findings have been reported upon in prior studies in this series.
3.6 Measurement of Political TolerancePolitical systems may be politically stable for long periods of time, undergirded by high levels ofsystem support, as discussed above in the section on system support.34 But such systems are notnecessarily democratic. In order for a political system to be both stable and democratic, itscitizens ought not only believe in the legitimacy of the regime, but also be tolerant of thepolitical rights of others, especially those with whom they disagree. When majorities of citizensare intolerant of the rights of others, the prospects for minority rights are dim, indeed.Concretely, it is difficult if not impossible for those who hold minority points of view to aspire topersuade others to accept those views, if the majority will not allow them to express themselvespublicly. Majorities, as Przeworski has argued, must agree to “subject their values and interest tothe interplay of democratic institutions and comply with (as yet unknown) outcomes of thedemocratic process.”35
34 The section of the theory of political tolerance and its link to stable democracy is drawn from earlier discussion of
this topic in prior reports on other countries in the University of Pittsburgh Latin American Public Opinion Project.35 Adam Przeworski, Democracy and the Market (New York: Cambridge University Press, 1991), p. 51.

The Political Culture of Democracy in Mexico, Central America, and Colombia, 2004 32
The measurement of tolerance has a long history. One method of measuring tolerance is to ask aset of questions that refer to the same group or groups. This method was pioneered many yearsago in the United States, where the focus was on tolerance towards communism.36 This approachworked well, so long as communists were perceived as a threat in the United States, but once thethreat of communism receded, it was impossible to assume that lowered levels of intolerancetoward communists were an indication of a general decline of intolerance. It became evident thata more general approach was needed so that comparisons could be made across time and acrosscountries. Another approach has been to use the “least-liked group” question, where therespondent selects the group that he/she dislikes the most and then is asked a series of questionsabout tolerating that group.37 Unfortunately, many Latin Americans refuse to name a group,leaving the level of tolerance for those people unknowable. The approach taken by the LatinAmerican Public Opinion Project avoids both of these pitfalls.38 The four-item series ontolerance that we developed reads as follows:
This card has a scale from 1 to 10 steps, with 1 indicating that you disapprove a lot and 10indicating that you approve a lot. The questions that follow are to find out your opinion aboutdifferent ideas that people who live in [country] have.
Approve 1098765432
Disapprove 1
D1. There are people who only say bad things about the governments of[country], not only the current government, but the system of [country i.e.Bolivian] government. How strongly (on the scale of 1-10), would youapprove or disapprove the right to vote of these people? Please read methe number.
36 Samuel C. Stouffer, Communism, Conformity and Civil Liberties (New York: Doubleday, 1955).37 John L. Sullivan, James E. Pierson, and George E. Marcus, Political Tolerance and American Democracy
(Chicago: University of Chicago Press, 1982).38 Even though different measures have been utilized in the study of tolerance, it turns out that they all seem to
capture the same underlying dimension. For evidence of this, see James L. Gibson, “Alternative Measures ofPolitical Tolerance: Must Tolerance Be 'Least-Liked?',” American Journal of Political Science 36 May (1992):560-77.

The Political Culture of Democracy in Mexico, Central America, and Colombia, 2004 33
D2. Thinking still of those people who only say bad things about the [country]system of government, how strongly do you approve or disapprove that thosepeople can carry out peaceful demonstrations with the purpose of expressing theirpoints of view?
D3. How strongly do you approve or disapprove that the people who only say badthings about the [country] system of government be allowed to run for publicoffice?
D4. Thinking still about those people who only say bad things about the [country]system of government, how strongly do you approve or disapprove of themappearing on television to make a speech?
3.7 Tolerance ResultsIn the course of writing this summary report, data from the Dominican Republic becameavailable as part of the LAPOP collaboration with the Pontificia Universidad Católica Madre yMaestra (PUCMM). In this section, therefore, it is possible to include some of that data.
Before looking at the results for tolerance, it is important to consider the role of control factors.Since tolerance is positively associated with education, countries with higher levels of socialdevelopment should be more tolerant, or at least so goes the theory. For this reason, we introducethe standard two control variables used in this study: GNP and infant mortality. But, there isanother factor, which is that since the battery of questions refers to those who “only say badthings about our system of government,” those respondents who are highly critical of theirgovernments might favor the civil liberties of those who might express their criticism more thanthose who support the system of government. To deal with this potential source of bias, the dataalso need to be controlled for by individual evaluations of the incumbent regime (M1 in thequestionnaire).39 It turns out that both infant mortality, as a measure of national development(one closely associated with national levels of education) and evaluations of the incumbentgovernment are both significant predictors of tolerance.40 This suggests that there is some truthto the argument that countries with higher levels of social development would have more tolerantcitizens, and there is also some truth to the argument that the tolerance scale picks up onindividual evaluations of the regime in power. The results, both controlled and uncontrolled areshown in Figure III.7.
39 A control for national-level popularity was also attempted, but the variable was not significant.40 Regression with robust standard errors Number of obs = 17267 F( 3, 9) = 12.87 Prob > F = 0.0013 R-squared = 0.0472Number of clusters (pais) = 10 Root MSE = 25.796
------------------------------------------------------------------------------ | Robust tol | Coef. Std. Err. t P>|t| [95% Conf. Interval]-------------+---------------------------------------------------------------- gni2002 | .0017035 .0010775 1.58 0.148 -.000734 .0041409 infmort | -.2399709 .0952627 -2.52 0.033 -.45547 -.0244717 m1 | 2.078553 .6908083 3.01 0.015 .5158358 3.64127 _cons | 48.87361 5.505707 8.88 0.000 36.41883 61.32838------------------------------------------------------------------------------

The Political Culture of Democracy in Mexico, Central America, and Colombia, 2004 34
Several findings need to be commented upon. First, the countries seem to divide into two maingroups, those with tolerance above the average for the ten countries and those below.Specifically, Panama (with the highest uncontrolled level of political tolerance), Nicaragua,Honduras, Costa Rica and Mexico score as more tolerant than the mean, while El Salvador,Colombia, Ecuador, Guatemala and Bolivia are below the mean. Second, when the controlledscores are examined, important differences emerge for some countries. The unpopularity of theincumbent administration in Panama sharply decreases political tolerance in that country (i.e.,tolerance for the right of people to say bad things about the political system). When we correctfor presidential popularity, Panama has about the same level of tolerance as does Nicaragua andHonduras. Surprisingly, correcting for the popularity effect, along with development, alsosharply reduces the high level of political tolerance in Costa Rica and Mexico. At the otherextreme, Bolivia’s low level of tolerance is mitigated by the controls, leaving Ecuador as themost intolerant of the countries.
Figure III.7 Political Tolerance: Eleven-Country Comparison: Controlled vs. UncontrolledStandardized Results
Political tolerance: ten-nation comparison
Controlled vs.uncontrolled
Dominican republic controlled only for GNP/per capita and Infant Mort.
Dominican Republic
Ecuador
Guatemala
Colombia
Bolivia 2002
Costa Rica
México
El Salvador
Honduras
Nicaragua
Panamá
.6
.4
.2
-.0
-.2
-.4
-.6
Uncontrolled
Controlled
-.2
-.1-.1-.1
.2.2.2
-.2
-.2
-.2
-.4
.2.2.1
.1
.5
These findings need to be examined more carefully to look for significant differences in thecontrolled results. These results are presented in Figure III.8. This is a clearer picture (exludingthe Dominican Republic). It shows that Panama, Nicaragua and Honduras comprise one groupwith relatively high tolerance, although note that the increase over the mean for all ten countriesis only about .2 of a standard deviation, which is rather small. The remaining countries all groupclosely except for Ecuador, which is substantially lower than the others.

The Political Culture of Democracy in Mexico, Central America, and Colombia, 2004 35
Figure III.8 Political Tolerance: Ten-Nation Comparison: Confidence Intervals ofStandardized Results With Controls
1436139514441455144914831515131512871600N =
Political tolerance: ten-nation comparison
Confidence intervals of standardized results with controls
Ecuador
Guatemala
Colombia
Costa Rica
Bolivia 2002
México
El Salvador
Honduras
Nicaragua
Panamá
95%
CI S
tand
ardi
zed
Res
idua
l.4
.3
.2
.1
0.0
-.1
-.2
-.3
-.4
The most dramatic change occurs in Bolivia, which shifts from a very intolerant nation to one inabout the middle of the group, when the controls are included. Recall, that the results of thetolerance measure were controlled by GNP per capita, infant mortality and approval/disapprovalof the incumbent administration. The robust regression analysis determined that only the last twomake a significant impact on tolerance scores, so the question that now arises is which of the tworemaining variables has the largest effect on explaining the dramatic shift in Bolivia’s tolerancelevel? This can be determined by removing GNP as a control, and including the two remainingvariables in separate equations. The results are shown in Figure III.9. When controlled forincumbent approval alone, Bolivia’s tolerance levels remain far below the others in the series.When controlled for infant mortality, however, tolerance increases dramatically, nearly reachingthe overall mean of zero for the eleven countries. (Note that the chart needs to be read carefullysince the incumbent approval measure is not used in the regressions for the DominicanRepublic.) The conclusion is clear: one major reason why tolerance scores in Bolivia are so lowis because of the low national level of social development in that country. Specifically, the veryhigh levels of infant mortality, which has been used in this report as a summary index of socialdevelopment, are also associated with low levels of education. The difficulty is that measures ofeducation are unreliable because it is not possible to equate a year of education in one countrywith a year in any other because of very large differences in quality of education. This meansthat in a country like Costa Rica, it is possible that someone with 12 years of education might befar better educated than someone with the same number of years of education in Bolivia. Sincewe just don’t know, the more objective infant mortality data are used in this study. The country

The Political Culture of Democracy in Mexico, Central America, and Colombia, 2004 36
reports that have been written on Bolivia have found that this is the only country in the LAPOPin which higher levels of education do not correlate with higher levels of tolerance.41 Thisfinding suggests that the quality of education does matter for the democracy variables beingstudied in this series.
Figure III.9 Political Tolerance: Ten-Nation Comparison: Differential Impact of ControlVariables
Political tolerance: ten-nation comparison
Differential impact of control variables
Note: Incumbent approval not available for the D.R.
Dominican Republic
Bolivia 2002
Ecuador
Colombia
Panamá
Costa Rica
Nicaragua
Honduras
El Salvador
Guatemala
México
.6
.4
.2
-.0
-.2
-.4
-.6
Infant mortality
Incumbent approval
-.4
-.2
.4
.2
.1.1
-.2
.2
-.2-.2-.2
.3
-.1
.2.2
-.1
.1
3.8 Support for Stable DemocracyThe two variables being examined in this chapter, system support and tolerance, have now beenexamined in some detail. The interested reader can probe the relationships at the country level byreviewing the results contained in the eight country-level studies that accompany this synthesisvolume. The theory with which we are working at LAPOP is that both attitudes are needed forlong-term democratic stability. Citizens must both believe in the legitimacy of their politicalinstitutions and also be willing to tolerate the political rights of others. In such a system, therecan be majority rule accompanying minority rights, a combination of attributes often viewed asthe quintessential definition of democracy.
41 Mitchell A. Seligson, La cultura política de la democracia boliviana, Así piensan los bolivianos, # 60. (La Paz,
Bolivia: Encuestas y Estudios, 1999); Mitchell A. Seligson, "El reto de la tolerancia política en Bolivia," Reto,Revista especializada de análisis político 8, no. Mayo (2001):5-15; Mitchell A. Seligson, Auditoria de lademocracia: Bolivia, 2002 (La Paz, Bolivia: Universidad Católica Boliviana, 2003).

The Political Culture of Democracy in Mexico, Central America, and Colombia, 2004 37
In prior studies emerging from the LAPOP, the relationship between system support andtolerance has been explored in an effort to develop a predictive model of democratic stability.11
The framework shown in Table III.2 below represents all of the theoretically possiblecombinations of system support and tolerance when the two variables are divided between highand low.12
Table III.2. Theoretical Relationship Between Tolerance and System Support inInstitutionally Democratic Polities
ToleranceSystem support High LowHigh Stable
DemocracyAuthoritarianStability
Low UnstableDemocracy
DemocraticBreakdown
Let us review each cell, one-by-one. Political systems populated largely by citizens who havehigh system support and high political tolerance are those political systems that would bepredicted to be the most stable. This prediction is based on the logic that high support is neededin non-coercive environments for the system to be stable. If citizens do not support their politicalsystem, and they have the freedom to act, system change would appear to be the eventualinevitable outcome. Systems that are stable, however, will not necessarily be democratic unlessminority rights are assured. Such assurance could, of course, come from constitutionalguarantees, but unless citizens are willing to tolerate the civil liberties of minorities, there will belittle opportunity for those minorities to run for and win elected office. Under those conditions,of course, majorities can always suppress the rights of minorities. Systems that are bothpolitically legitimate, as demonstrated by positive system support and that have citizens who arereasonably tolerant of minority rights, are likely to enjoy stable democracy.13
When system support remains high, but tolerance is low, then the system should remain stable(because of the high support), but democratic rule ultimately might be placed in jeopardy. Suchsystems would tend to move toward authoritarian (oligarchic) rule in which democratic rightswould be restricted.
Low system support is the situation characterized by the lower two cells in the table, and shouldbe directly linked to unstable situations. Instability, however, does not necessarily translate intothe ultimate reduction of civil liberties, since the instability could serve to force the system todeepen its democracy, especially when the values tend toward political tolerance. Hence, in thesituation of low support and high tolerance, it is difficult to predict if the instability will result ingreater democratization or a protracted period of instability characterized perhaps by
11This framework was presented in Mitchell A. Seligson, "Toward A Model of Democratic Stability: Political
Culture in Central America," Estudios interdisciplinarios de América Latina y el Caribe 11, no. 2 July-December(2000): 5-29. See also Mitchell A. Seligson and Ricardo Córdoba Macías, El Salvador: De la guerra a la paz,una cúltura política en transición (San Salvador: IDELA y FUNDANGO, 1995).
12The scale ranges from 0-100, so the most natural cut-point is 50. In actuality, since the zero also counts as a validvalue in the scale, there are 101 points to the scale, and the arithmetic division would be 50.5. In this and otherstudies we have used 50 because it is more intuitive.
13Robert Dahl, Polyarchy: Participation and Opposition. New Haven: Yale University Press, 1971.

The Political Culture of Democracy in Mexico, Central America, and Colombia, 2004 38
considerable violence. On the other hand, in situations of low support and low tolerance,democratic breakdown seems to be the direction of the eventual outcome. One cannot, of course,on the basis of public opinion data alone, predict a breakdown, since so many other factors,including the role of elites, the position of the military and the support/opposition of internationalplayers, are crucial to this process. But, systems in which the mass public neither support thebasic institutions of the nation, nor support the rights of minorities, are vulnerable to democraticbreakdown.
It is important to keep in mind two caveats that apply to this scheme. First, note that therelationships discussed here only apply to systems that are already institutionally democratic.That is, they are systems in which competitive, regular elections are held and widespreadparticipation is allowed. These same attitudes in authoritarian systems would have entirelydifferent implications. For example, low system support and high tolerance might produce thebreakdown of an authoritarian regime and its replacement by a democracy. Second, theassumption being made is that over the long run, attitudes of both elites and the mass publicmake a difference in regime type. Attitudes and system type may remain incongruent for manyyears. Indeed, Seligson and Booth have shown for the case of Nicaragua that incongruence mighthave eventually helped to bring about the overthrow of the Somoza government. But theNicaraguan case was one in which the extant system was authoritarian and repression had longbeen used to maintain an authoritarian regime, perhaps in spite of the tolerant attitudes of itscitizens.14
3.9 Empirical Relationship Between Tolerance and System SupportIt is now time to put together the two variables that have been the focus of this chapter byexamining the joint distribution of the two variables. To do this, both variables are dichotomizedinto “high” and “low.”15 The overall index of tolerance was utilized, but the scale was dividedinto high and low at the 50-point. System support is scaled in a similar way, and split at the 50-point to distinguish between high and low. The results are shown in Table III.3.
14Mitchell A. Seligson and John A. Booth, “Political Culture and Regime Type: Evidence from Nicaragua and Costa
Rica,” Journal of Politics, Vol. 55, No. 3, August, 1993, pp. 777-792. A different version appears as “Culturapolítica y democratización: vías alternas en Nicaragua y Costa Rica.” In Carlos Barba Solano, José Luis BarrosHorcasitas y Javier Hurtado, Transiciones a la democracia en Europa y América Latina. México: FLACSO yUniversidad de Guadalajara, 1991, pp. 628-681. Also appears as “Paths to Democracy and the Political Culture ofCosta Rica, Mexico and Nicaragua,” Larry Diamond, ed., Political Culture and Democracy in DevelopingCountries. Boulder: Lynne Reinner Publishers, 1994, pp. 99-130.
15If the variables were left in their original 0-100 format, the table would potentially have 100 cells in each direction,making it impossible to read and interpret.

The Political Culture of Democracy in Mexico, Central America, and Colombia, 2004 39
Table III.3. Relationship of Tolerance and System Support: Eleven-Nation ComparisonTOLR Political Tolerance
Recoded
Country 1.00 High 2.00 Low1 México PSA5R System Support Recoded 1.00 High 41.3% 23.2%
2.00 Low 21.1% 14.4%2 Guatemala PSA5R System Support Recoded 1.00 High 21.2% 23.8%
2.00 Low 19.3% 35.7%3 El Salvador PSA5R System Support Recoded 1.00 High 32.3% 34.8%
2.00 Low 17.1% 15.8%4 Honduras PSA5R System Support Recoded 1.00 High 29.9% 21.8%
2.00 Low 22.6% 25.7%5 Nicaragua PSA5R System Support Recoded 1.00 High 28.3% 20.0%
2.00 Low 26.8% 24.8%6 Costa Rica PSA5R System Support Recoded 1.00 High 48.5% 33.0%
2.00 Low 10.7% 7.7%7 Panamá PSA5R System Support Recoded 1.00 High 37.9% 16.1%
2.00 Low 30.3% 15.7%8 Colombia PSA5R System Support Recoded 1.00 High 31.6% 30.1%
2.00 Low 16.6% 21.8%9 Ecuador PSA5R System Support Recoded 1.00 High 14.9% 18.1%
2.00 Low 26.9% 40.2%10 Bolivia 2002 PSA5R System Support Recoded 1.00 High 13.5% 28.1%
2.00 Low 14.6% 43.7%15 Dominican Republic PSA5R System Support Recoded 1.00 High 18.1% 20.8%
2.00 Low 21.9% 39.3%
In order to simplify the presentation, and focus on the crucial stable democracy cell, the resultsare presented in graphical form for that cell alone in Figure III.10. These results show thedramatic differences in the percentage of the populations in the stable democracy “cell” in theabove tables, ranging from the high end in Costa Rica to the low end in Bolivia (2002). It comesas no surprise that Costa Rica is so high compared to the other countries. Indeed, the only reasonCosta Rica is not higher is that political tolerance in that country is not nearly as high as onewould hope, given its many years of democratic rule. Some researchers have suggested thattolerance has declined in recent years as a result of the waves of immigration from Nicaragua,which has raised prejudices against those who are seen as weakening the Costa Rican model.This is a subject dealt with in the country report from Costa Rica, and the interested readershould consult that report. The low levels of support for stable democracy in Ecuador andBolivia also do not surprise, given the extreme difficulties those two countries have faced inrecent years. The ephemeral coup in Ecuador, and the later election of its leader to thepresidency, and the mass protests in Bolivia, which drove out of office a sitting president, aremanifestations of the combination of low levels of national legitimacy and low levels of politicaltolerance. More surprising, perhaps, is the higher level of support for stable democracy inColombia, a country wracked by civil war and guerrilla violence. As will be shown in the nextgraph, the very high level of presidential popularity in Colombia at the moment of the survey isnot responsible for this mid-range ranking. Therefore, we would need to conclude, as does the

The Political Culture of Democracy in Mexico, Central America, and Colombia, 2004 40
country-level report on Colombia, that there are much stronger routes to democratic stability inColombia than the violence suggests.
Figure III.10 Percent of the Population With Attitudes Conducive to Stable Democracy:Eleven Countries
Percent of the population with attitudes
conducive to stable democracy: eleven countries
Sig. < .001
Bolivia 2002
Ecuador
Dominican Republic
Guatemala
Nicaragua
Honduras
Colombia
El Salvador
Panamá
México
Costa Rica
Hig
h Sy
stem
Sup
port
and
hig
h To
lera
nce
60%
50%
40%
30%
20%
10%
0%
1415
18
21
2830
3232
38
41
48
The results from the above figure are presented again, but this time controlled for GNP percapita, infant mortality and incumbent performance.42 Of the three control variables, only infantmortality is not significant in the robust regressions reported below. The results are shown inFigure III.11. Employing these controls, one finds that Costa Rica, Mexico and Panama are stillat the high end of the series, and Bolivia at the low end. But, Ecuador, once these controllers areintroduced, moves substantially higher. Nicaragua and Honduras fall substantially. TheDominican Republic is excluded from the analysis as the data set does not have the sameincumbent performance variable as found in the others.
42 Regression with robust standard errors Number of obs = 16904 F( 3, 9) = 25.63 Prob > F = 0.0001 R-squared = 0.0490Number of clusters (pais) = 10 Root MSE = 43.708
------------------------------------------------------------------------------ | Robust bar2x2 | Coef. Std. Err. t P>|t| [95% Conf. Interval]-------------+---------------------------------------------------------------- gni2002 | .0040205 .001593 2.52 0.033 .0004168 .0076241 infmort | -.299252 .1611331 -1.86 0.096 -.6637603 .0652563 m1r | 4.325574 .8442906 5.12 0.001 2.415656 6.235492 _cons | 14.429 11.3319 1.27 0.235 -11.20554 40.06354------------------------------------------------------------------------------

The Political Culture of Democracy in Mexico, Central America, and Colombia, 2004 41
Figure III.11 Support for Stable Democracy: Eleven-Country Comparison: NormalizedResults, Controlled
Support for stable democracy: 11-nation comparison
Normalized results, controlled
Controlled for GNP per capita, infant mortality & incumbent performance
Bolivia 2002
Nicaragua
Honduras
Guatemala
Ecuador
El Salvador
Colombia
Panamá
México
Costa Rica
Res
idua
l of G
NP,
Infa
nt M
ort
and
M1R
2.0
1.5
1.0
.5
0.0
-.5
-1.0
-1.5
-2.0
-1.6
-.8-.8
-.5-.4
.5.7
1.31.4
3.10 ConclusionsThis chapter has examined system support, political tolerance, and the relationship among thetwo variables. The study has found sharp differences among the countries in the series. A portionof these differences is a function of the macro-economic and social conditions that vary fromcountry-to-country, while an important part of the difference can be attributed to genuinedifferences in political culture.


The Political Culture of Democracy in Mexico, Central America, and Colombia, 2004 43
4.0 Corruption and Democracy4.1 Corruption as a Threat to Democracy: Is there a Link?Widespread corruption is increasingly seen as one of the most significant threats to deepeningdemocratization in Latin America (and indeed much of the democratizing Third World). In arecent study, Kurt Weyland argues forcefully that corruption has increased a great deal underdemocracy in Latin America, and points to several factors that are responsible for the increase.43
First, he argues that the dispersion of power in the hands of many (as has occurred asdictatorships have been replaced by democracies) has widened the opportunity for bribery. Ineffect, there are many more “veto players” today than those under the military, and thereforethere has been an increase in the number of palms that require greasing. Second, neoliberalreforms have involved opening many areas of the economy to bribery, especially those involvingsales of public corporations. Third, the increasing numbers of neopopulist leaders, who winelections based on personal appeals through television, are driving aspiring politicians to corruptpractices in order to collect the funds needed to pay for TV time.
In recent years foreign donors has expended considerable resources worldwide in the effort tomitigate corruption.44 New initiatives in the international assistance area, including theMillennium Challenge Account, require the recipients to be making important progress instemming corruption as a condition for aid. Although there is much concern over the negativeimpact that corruption is having on democracy, the proponents of this view have not often madeexplicit precisely how it is that democracy is weakened by corruption.
How might corruption threaten democratization? The argument is that corruption weakensdemocracy by undermining citizen trust in the regime, in effect, deligitimizing it. If Weyland isright, and corruption is on the rise, one can expect that the nascent democracies in LatinAmerica, and by extension the democratizing world, will have an even greater difficulty inestablishing and retaining their right to govern. One of the major limitations that authoritarianregimes have in establishing their own legitimacy is that more often than not they operate ascleptocracies, in which the state is corrupt to its core, and citizens know it. In a similar fashion,democracies, based as they are on expectations of accountability, may weaken their ownlegitimacy when corruption is rampant.
Is there evidence for this linkage between corruption and the erosion of legitimacy? In fact, theclassic research in the field, widely respected for many years, argued persuasively for preciselythe reverse relationship. From that point of view, corruption serves a very constructive purposein developing countries by establishing functional clientelistic ties that bind constituents topublic officials, allowing relatively low-cost circumvention of dysfunctional bureaucracies. Inthat way, corruption was seen as having a positive impact on political systems. As SamuelHuntington put it most succinctly in this classic statement: “the only thing worse than a societywith a rigid, over-centralized, dishonest bureaucracy is one with a rigid, over-centralized honestbureaucracy.”45 The view that corruption helps “grease the wheels” of dysfunctional 43 Kurt Weyland, "The Politics of Corruption in Latin America," Journal of Democracy, no. 2 (1998):108-21.44 USAID Agency Objectives, “Good Governance” from http://www.usaid.gov/democracy/gov.html and also
http://www.usaid.gov/democracy/anticorruption/usaidprogs.html.45 Samuel P. Huntington, Political Order in Changing Societies (New Haven: Yale University Press, 1968).

The Political Culture of Democracy in Mexico, Central America, and Colombia, 2004 44
bureaucracies is prominent not only in the work of Huntington and classic works such as V.O.Key’s Southern Politics published in 1949, but also in more contemporary studies.46 In short,according to this view, corruption is just what the doctor ordered for the Third World.
Is this argument accurate and does corruption help “grease the wheels” of the publicbureaucracy, thus making it more agile, functional, and most importantly more responsive topublic demands? If it does, then one would expect that more corruption would lead to greateraccountability and a public that is more satisfied with the political system.
More recent research, empirically based, takes the opposite approach, one that is consistent withinternational donor concerns that corruption is not only unhelpful, but it can do serious damageto both economic growth and democratic development.47 Unfortunately, there are fewempirically-based studies of the subject, and the ones that do exist do not test corruption itself,but only perceptions of corruption. One study on ten Central and Eastern European countries andRussia supports the linkage, finding that greater perceived corruption relates to lower trust indemocratic institutions.48 A more recent study, based on 16 countries, including the U.S., Japan,New Zealand, and countries in Western and Eastern Europe, concludes that “corruptionundermines citizens’ faith in their governments.”49 In the present paper these findings will besupported, but with a direct measure of corruption experienced by individuals who live in thecountries being studied rather than with an index of perception of the degree of corruptionconstructed by external observers.
In order to establish the linkage between corruption and the erosion of support for democracy,the paper dwells on the issue of the measurement of corruption. Early on in the effort to increasetransparency to fight corruption, it became evident to USAID that in order to know preciselywhere to expend its resources and how to measure the degree of success of its program, it wasgoing to be very important to be able to measure the magnitude of corruption in each of thecountries in which it might invest anti-corruption resources. However, unlike programs in otherareas—for example health, where there are universally accepted objective indicators like infantmortality rates and life expectancy—there is not yet any universally accepted standard formeasuring corruption.
Unless it is known how much corruption there is, and whether it is increasing or declining, littlecan be done to target efforts to reduce it. In the absence of reliable data on corruption, USAIDfaces difficulties in targeting its anti-corruption spending. More important, perhaps, is thatwithout reliable and specific information on corruption, USAID cannot determine what impact, ifany, anti-corruption efforts are having, which is, after all, “the bottom line.”
46 Arnold J. Heidenheimer, Michael Johnston, and Victor T. LeVine, Political Corruption: A User's Manual (New
Brunswick: Transaction, 1989).47 Susan Rose-Ackerman, Corruption and Government: Causes, Consequences, and Reform (Cambridge:
Cambridge University Press, 1999).48 William Mishler and Richard Rose, "What Are the Origins of Political Trust? Testing Institutional and Cultural
Theories in Post-Communist Societies," Comparative Political Studies 34, no. 1 (2001):30-62.49 Christopher J. Anderson and Yuliya V. Tverdova, "Corruption, Political Allegiances, and Attitudes Toward
Government in Contemporary Democracies," American Journal of Political Science 47, no. 1 (2003):91-109. Thequotation is from p. 105.

The Political Culture of Democracy in Mexico, Central America, and Colombia, 2004 45
Although constrained by the limited space available in the format dictated by these short researchnotes, this paper will respond to the challenge of developing better measures of corruption in thefollowing six sections:
1) a brief examination of the widespread use of corruption perception measure;2) a discussion of an alternative measure of corruption experience;3) an exploration into the level of corruption detected by the corruption-victimization
series, using data from several countries drawn from the Latin American PublicOpinion Project;
4) an examination of the data to find out who the victims of corruption are;5) a discussion of the research that hypothesizes about the positive and negative effects
of corruption on governance, providing evidence that shows just how dangerouscorruption is for democratic consolidation, i.e., that corruption matters;
6) and finally, the paper will show how corruption levels vary substantially withinnations being assisted by USAID.
4.2 The Challenge: Measuring Corruption50
It is not surprising that until recently corruption research has been largely descriptive rather thanempirical. Given its sub rosa nature, corruption is inherently an extremely difficult phenomenonto measure—thus presenting a large obstacle for those researchers attempting to study it. In otherareas of development, it is easy to have participants or outsiders list accomplishments. Forexample, health workers can report on the number of vaccines administered or healthy babiesdelivered. We cannot ask, however, for police officers to report on the number of bribes theytake in a given week or for customs officials to report on how much duty goes uncollected. Theneed to get some handle on the level of corruption has led, over the years, to pursuing differentapproaches to solving this problem, but each approach has suffered from its own limitations.
The early efforts were based on official police and court records. One simply counted the numberof arrests and convictions for corruption in a given country. The main difficulty with thatapproach, of course, was the spuriousness of the measure; the more vigilant the authorities, themore arrests and convictions, producing a corruption index that was almost completelyindependent of the corruption level itself. For example, in highly corrupt governments there maybe virtually no enforcement, and therefore very little corruption is reported, while in “squeakyclean” governments there may be frequent arrests and convictions for even minor infractions. Forthe most part, this approach has been abandoned.
In order to overcome the measurement problem inherent in using official records two newerapproaches have been taken—each with its own limitations, however. The first is that carried outby Berlin-based Transparency International (TI) with its annual highly respected and widely usedCorruption-Perception Index (CPI). TI is dedicated to generating public support for anti-corruption programs and enhancing transparency and accountability in government, and USAIDhas provided important financial and technical support for their programs worldwide. In recentyears the index has been greatly strengthened due to the use of multiple sources of data and
50 This section draws on Mitchell A. Seligson, "The Impact of Corruption on Regime Legitimacy: A Comparative
Study of Four Latin American Countries," Journal of Politics 64 (2002c):408-33.

The Political Culture of Democracy in Mexico, Central America, and Colombia, 2004 46
multi-year averages, thus increasing the reliability of the measure.51 The CPI remains the mostwidely used measure of corruption, akin to the Freedom House measure of democracy. Mosteconomists rely upon the CPI when they examine the impact of corruption on growth andinvestment.
The results of the TI index for Latin America in 2002 are shown in Figure IV.1. The indexranges from a high of 10, in which the country is considered to be “highly clean” to a 0, forcountries that are considered to be “highly corrupt.” The 2002 report ranks 102 countries, andfinds seventy countries—including many of the world's most poverty stricken—that score lessthan 5 out of a possible 10. For comparison, it is important to note that the countries with a scoreof higher than 9 are Finland, Denmark, New Zealand, Iceland, Singapore, and Sweden. As seenin Figure IV.1, no Latin American country scores that high, with Chile scoring the highest, 7.5.Only one other country scores above 5, Uruguay (at 5.1), while all other Latin Americancountries do worse, placing them among the bottom 70 countries. It is obvious from thisinformation that corruption in Latin America, at least as measured by the TI perception index, isa serious problem.
As illuminating as these results may seem to be, we need to consider their limitations. The scoresare based upon a series of surveys conducted by different organizations and include a measurefrom the Economist Intelligence Unit, the Pricewaterhouse Cooper’s Opacity Index, and datafrom Freedom House. These data sources rely heavily upon the impressions of internationalbusiness people, which are reasonably good, albeit limited, sources of data. The great strength ofthese data sources is also a weakness—they tap into the perceptions of individuals engaged ininternational business and thus are good at evaluating business transactions, but they are weak attapping into the whole range of activities pursued by the citizens of the countries beingevaluated. These activities are not business related and thus require a different kind of data.Moreover, a problem with data from such sources is that it is difficult to separate stereotypingfrom reality. These indexes do not attempt to report on how frequently bribery actually occurs inthe countries being studied but on how corrupt the respondents perceive the countries to be. Ofcourse, this may be based on their own experience or on what they happened to have heard abouta specific country. Consider Paraguay—long considered by most experts on Latin America to bean endemically corrupt country. It is also a country with very little foreign investment and veryfew international business arrangements. According to the World Bank, for example, net privatecapital inflows for Paraguay in 2000 was a negative $16 million and total foreign directinvestment was only $82 million in an economy with a GDP of $6.9 billion. Foreign directinvestment in Paraguay amounts to only about 1% of the GDP, a level only one-sixth of that ofits neighbor Brazil. How many of the respondents in the surveys of business people used by thedata sources whose perceptions were incorporated into the CPI had actually conducted businessin Paraguay? The chances are, not many. Rather it is likely that the ratings of Paraguay are basedlargely upon a stereotype, which may or may not be closely linked to reality. Furthermore, whileTI draws on fifteen different sources for its data, Paraguay’s results emerge from consulting onlythree sources because so few data sources have a large enough sampling of businessmen and -women to enable Paraguay to be given a score. Finland, on the other hand, with a populationnearly identical to that of Paraguay, was rated by eight sources. Indeed, an inspection of the 51 These efforts are explained in detail in the TI website. The specific document that presents the methodological
issues is www.transparency.de/documents/cpi/cpi_framework.html.

The Political Culture of Democracy in Mexico, Central America, and Colombia, 2004 47
number of sources used for Latin American countries as a whole reveals that with the exceptionof the largest and richest, most were rated by only a handful of sources, raising doubts about thereliability of the information.
A further complication with the CPI is that it may suffer from an “endogeneity problem.” That is,the results of the CPI may be strongly influenced by factors other than direct observation byparticipants. Consider the case of Argentina. In 1995, when Argentina was the darling of thedevelopment community, having progressed rapidly in its privatization programs, it was scoredat 5.2 on a 0-to-10 scale by TI. By 2002, however, the Argentine economy was in ruins, and itsscore had plummeted to 2.8. If Argentina had retained its 1995 corruption score, it would havebeen ranked second in all of Latin America and near the top of the developing world. But by2002, it had fallen into the bottom half in Latin America. Was that precipitous fall in the index,reflecting a putative increase in corruption, a function of a sudden real increase in corruption ordid those who responded to the CPI surveys begin to note a discrepancy between low economicperformance and the TI score of reasonably low levels of corruption? If so, it may well be thatcorruption levels were, in reality, not much different in 2002 than they had been in 1995 but thatrespondents to the TI surveys felt the need to adjust their corruption scores to match the level ofArgentina’s economic performance. In other words, it is likely that the TI corruption measure onArgentina declined not because corruption increased, but because the poor performance of theeconomy told observers that corruption must be higher than they thought it had been. On theother hand, if we assume that the TI index for Argentina was actually picking up on a suddenincrease in corruption over the period 1995-2002, then this would imply that slowed growthactually increased corruption. However, the logic of the research from the World Bank andothers has been just the opposite; namely, that high levels of corruption slow growth. If pooreconomic performance is the cause of corruption rather than the other way around, then anti-corruption programs would be irrelevant since the “fix” for corruption would be to spureconomic growth.
In recent years, a very widely used alternative to the TI measure has emerged from the WorldBank Institute, which has been releasing a series of “governance indicators” that include ameasure of “control of corruption.”52 These indicators are widely cited as the best availablemeasures of national governance. The results for Latin America are shown in Figure IV.2. Do welearn something new from these data that we did not know from the TI measure? It is obviousfrom comparison with the TI results shown in Figure IV.2 that the two scores correspond veryclosely. Indeed, the rank-order correlation (Spearman’s rho) between the two measures is analmost perfect 0.96. Rarely do the social sciences produce such consistent results in indexesbased on perception, and we are left with the impression of great precision of measurement inthese two apparently independent sources. Careful examination of the two data sources reveals,however, that they rely on most of the very same sources from which they derive their indexes,explaining why they arrive at similar conclusions. The problems noted with the CPI, then, arealso to be found in the World Bank Institute “control of corruption” measure.
52 These data are easily available at http://www.worldbank.org/wbi/governance/govdata200.htm. The original data
are listed as a 0–100 percentile rank and have been converted here to a 0–10 score to correspond to the CPI 0–10format.

The Political Culture of Democracy in Mexico, Central America, and Colombia, 2004 48
Figure IV.1 Transparency International Corruption Perception Index for Latin America,2002
0.00 2.00 4.00 6.00
Score 10 = highly clean; 0= highly corrupt
ParaguayBolivia
EcuadorHaiti
GuatemalaNicaraguaVenezuelaHondurasArgentina
Panam aEl Salvador
Dominican RepublicColombia
MexicoBrazil
PeruCosta Rica
UruguayChile
coun
try
1.702.202.202.20
2.502.502.50
2.702.80
3.003.403.503.603.60
4.004.00
4.505.10
7.50
Transparency International Corruption Perception IndexFor Latin America, 2002
Figure IV.2 World Bank Institute Corruption Control Index, 2001/2002
2.00 4.00 6.00 8.00
EcuadorParaguay
HaitiNicaragua
BoliviaGuatemala
HondurasVenezuela
Panam aColombiaArgentina
El SalvadorMexico
Dominican RepublicPeru
Brazi lUruguay
Costa RicaChile
coun
try
1.261.32
2.082.392.582.77
3.083.33
4.154.474.534.65
4.915.03
5.535.66
7.748.05
8.99
World Bank Institute Corruption Control Index, 2001/2002
The lesson from this examination of TI’s CPI and the World Bank Institute’s Corruption-ControlIndex is that one ought to interpret their results with care, while recognizing that they areprobably the best measures currently available for a worldwide ranking. If a general notion of thelevel of corruption in a country is needed, these measures are, at least for the moment, the bestsource. They allow international agencies to target the countries with the highest levels ofcorruption and, of course, can provide an important tool for investors who want to know whatthey are likely to confront if they invest in a specific country. Unfortunately, however, themeasures are of limited utility for much of what USAID is trying to accomplish in itstransparency and anti-corruption programs because they provide only a national aggregatemeasure, with no breakdowns by type or locus of corruption. These measures do not reveal, for

The Political Culture of Democracy in Mexico, Central America, and Colombia, 2004 49
any of the countries, those who are most likely to be affected by corruption—making it verydifficult to design a cost-effective anti-corruption strategy. Similarly, an aggregate measure for acountry does not allow development practitioners to measure the impact of specific anti-corruption programs. Equally frustrating, the TI and WBI measures are limited in that they arepresented as relative scores (i.e., ranks and percentiles).53 Consider the situation where theworldwide trend is toward improvement, and an individual country has done better from oneyear to the next; if others have also improved, the impression will be given that the country inquestion has stagnated. Moreover, the aggregate, nation-wide measures make it impossible toknow if corruption does in fact erode confidence in the political system, as the World Bankargues, or if it has the positive impacts that Huntington claimed for it. Moreover, nationalaggregate measures of corruption do not allow for an examination of regions or groupings withina country. It is risky to assume that corruption is uniform throughout a country, and the datapresented in this paper will show that it is in fact not. If USAID wants to target certaingeographic hot spots of corruption, for example, then national aggregate measures like the CPIare not helpful. If USAID wants to target certain groups demographically, socio-economically,or occupationally, the CPI cannot help.
How to solve the problem of finding a measure of corruption that is both valid and subnational?A new approach has been taken by Harvard’s Susan Pharr, who constructs an index based onnewspaper reports of corruption.54 One advantage of this method is that the newspaper articlesreport where the corruption occurred and who was involved. Unfortunately, this measure alonecannot overcome the problem of validity. The accusations reported in the articles may be entirelythe invention of the newspaper staff, whose motivations for making the accusation may varyfrom a desire to increase circulation to an effort to weaken one party or candidate and strengthenanother. Indeed, the newspaper may publish stories on alleged acts of corruption because thepaper is “on the take” from some political or business group that wants to make its opponentslook bad. The classic example of this comes from Mexico, where Excelsior, for decades regardedas the “newspaper of record” in that country, was subsequently found to have been on the payrollof the PRI (the ruling party) for decades.
4.3 Measuring Corruption VictimizationRecently, a more promising method has been developed that largely overcomes both of thelimitations of the previously mentioned methods. The new approach has been inspired by crime-victimization surveys, which have become the mainstay of sociological investigation into crime.Criminologists have long recognized that official reports of crime are highly unreliable becauseof the likelihood that the data have been manipulated. Police chiefs who want new patrol carsfrom their local governments have a strong incentive to help justify the request by providing“evidence” that a crime wave has hit the town. To develop this evidence, the police chief maytell his/her officers to become especially aggressive when enforcing the law, or it may be that the
53 The WB web site (http://www.worldbank.org/wbi/governance/govdata2001.html) states: “As discussed in detail
in the accompanying papers, countries' relative positions on these indicators are subject to margins of error that areclearly indicated in the data files and graphs downloadable below.” These measures should not be confused withthe WB studies of corruption experience.
54 Susan J. Pharr, "Officials' Misconduct and Public Distrust: Japan and the Trilateral Democracies," in DisaffectedDemocracies: What's Troubling the Trilateral Countries?, ed. Susan J. Pharr and Robert D. Putnam (Princeton:Princeton University Press, 2000).

The Political Culture of Democracy in Mexico, Central America, and Colombia, 2004 50
figures themselves have been cooked. Alternatively, politicians who want to take credit forsuccesses in fighting crime have the incentive to make it appear that crime is on the wane, andsalary raises for the police force might subtly be made contingent upon less aggressive policing.
In order to overcome these intractable problems, criminologists have increasingly come to relyupon victimization surveys, which are widely regarded as providing a more accurate tally ofcrime rates.55 That approach is the inspiration for the current movement to use surveys ofnational populations to estimate corruption levels. Internationally, this approach has beenspearheaded by the United Nations Center for International Crime Prevention. Implemented in1987, the International Crime Victim Survey (ICVS) now includes 55 countries, with samples ofbetween 1,000 and 2,000 respondents per country. In 1996, for the first time, a question wasincluded in the surveys on bribe victimization.
The UN approach represented a good start, but a broader series of questions is preferable sinceanti-corruption projects need much more detailed information about the nature and level ofcorruption than a single question could provide. That is precisely the reason behind the approachthat the Vanderbilt University Latin American Public Opinion Project began applying in 1996and the World Bank began using in 1998. These efforts, which may also incidentally ask aboutperception of corruption, focus on actual citizen experience (i.e., victimization) with publicsector corruption. The World Bank studies have been carried out in Nicaragua, Honduras, and,more recently, Ecuador, and, by 2003, had been carried out in many other countries around theworld.56 The World Bank surveys generally include samples of the national public, but alsoinclude specialized samples of “service users” and of government officials. In that way they areable to get at corruption from a variety of angles. Moreover, the World Bank has made efforts tocalculate the cost of corruption by asking respondents to indicate the value of the bribe solicitedor paid. The World Bank surveys, however, do not include questions on attitudes towarddemocracy, thus making it impossible to see how corruption might affect democracy.
At Vanderbilt, the effort has been to measure corruption and its impact. Corruption is measuredby direct personal experience with it. In the course of a public opinion survey of democraticvalues and behaviors, which is generally applied to a probability sample (i.e., “random sample”)of the nation being studied, a module of questions on corruption experience has been developedand refined since its first application in 1996.57 In this approach, respondents are asked a seriesof questions recording their experience with corruption over the year immediately prior to the 55 Homicide rates, however, are used as reliable indicators of one form of extreme crime. Only in places like South
Africa under apartheid, where the murder of blacks was often not reported by the police, or in countriesundergoing civil wars where record-keeping functions often break down entirely, are these rates unreliable.
56 See Comité Nacional de Integridad and World Bank-CIET International. 1998. Encuesta nacional sobreintegridad y corrupción en la administración pública: Encuesta de hogares. Managua. See also World BankInstitute, "Ecuador: Governance and Anticorruption Empirical Diagnostic Study; Evidence from Surveys ofHouseholds, Enterprises, and Public Officials," (Washington, D. C.: World Bank, 2000).
57 The surveys reported on in this project are all national probability samples carried out at various times from 1998through 2002 in El Salvador, Honduras, Nicaragua, Ecuador, Paraguay, and Bolivia. A web site is currently beingconstructed where this data can be easily accessed. The samples each have between 2,500 and 3,000 respondents,except for Paraguay, which included only 1,463. The first survey, conducted in Nicaragua, was developed withCasals and Associates. I would like to thank Dr. Sergio Dias Briquets of Casals and Dr. Andrew Stein, now of theU.S. Department of State, for assistance in that early work. Dr. Orlando Pérez of Central Michigan University hasassisted in more recent studies in Honduras and Ecuador.

The Political Culture of Democracy in Mexico, Central America, and Colombia, 2004 51
survey. A study of longer time frames can be attempted, but not only is the reliability of memoryover long periods problematic, if USAID is attempting to reduce corruption via a specificproject, it is especially important to limit the time frame so that the impact of the project can bepicked up in subsequent measurements. These surveys, then, include both the key “independentvariable” (i.e., corruption victimization) and the key “dependent variable” (i.e., trust in thesystem of government) so that the impact of the former on the latter can be measured, controllingfor other factors (e.g., respondent income, education, gender, region, party affiliation, etc.)
The forms of corruption measured were decided upon based on focus groups and were ones thatwere found to be most commonly experienced in Latin America. The items have varied fromquestionnaire to questionnaire, but the following questions are common to a number of them:
being stopped by a police officer for a trumped-up infraction of the law; being asked to pay a bribe58 to a police officer; being asked to pay a bribe to a public official; being asked to pay an illegal fee to expedite a transaction at the municipal government; being asked to pay a bribe at work; being asked to pay a bribe for public health/medical service; being asked to pay a bribe in the school system;
An observation about the series of questions relates to corruption in the schools and in publichealth. Focus-group research demonstrated that users of these services tend to be very well awareof the rules of the game. If, for example, primary education is supposed to be free, many citizensconsider it corrupt behavior if fees are demanded by the teachers, even if the purpose of the fee isto purchase books or supplies that ought to come from the state. For that reason, the originalquestionnaire series referred to “improper payments” in the schools or health clinics. However,some critics of these questions suggested that these payments were not really signs of corruptionbut merely a reflection of the poor state of public financing of human services. In order to focusdirectly on corruption itself, these items have been altered in the most recent administrations ofthe questionnaire, and the term “improper payments” was dropped and “bribes” substituted. Thischange resulted in a small decline in reported acts of corruption in the health service and asomewhat larger decline of reported acts of corruption in the school system. Yet, even with theseadjustments the levels remain distressingly high, as will be shown below.
The analysis of the corruption victimization data has been carried out in two ways. First, whenthe particular form of corruption is the focus (in order, perhaps, to develop an anti-corruptioncampaign targeted to each specific form of corruption), individual items are chosen to beanalyzed so that the particular form of corruption can be highlighted. The second approach is toform an overall scale of corruption so that the total experiences can be examined and linked totheir impact on individual variables, such as political legitimacy. When formed as a scale, theitems have been found to be reliable (Cronbach Alphas of around 0.75, depending on thecountry).
58 The word for “bribe” in Spanish differs among the countries sampled. In Central America, the survey generally
used “mordida” while in South America the word “coima” was utilized. In both areas, however, the additionalterm “soborno” was utilized.

The Political Culture of Democracy in Mexico, Central America, and Colombia, 2004 52
In the Vanderbilt University approach to corruption victimization, national samples have beenused. The World Bank, however, which has also carried out national samples of corruptionvictimization, has included specialized samples of individuals in various sectors, such as thebusiness world or various sectors of the state. The advantage of the World Bank approach is thatit allows an even finer-grained targeting of anti-corruption efforts; the disadvantage, of course, iscost.
4.3.1 Limitations of the Corruption-Victimization MeasureNo system of measuring attitudes or behaviors is without limitations, and the corruption-victimization measure suffers from two of them, which will be pointed out here.
Are all survey respondents who report having paid a bribe really “victims”? Perhaps somebribe payers are not victims at all but in fact are willing participants in the transaction,deliberately seeking to circumvent rules and regulations in order to advance their ownobjectives. Such individuals, then, may not be “victims” but willing “clients” in apatron/client relationship with the bribe taker. On the other hand, if the system were both fairand efficient, there would be little reason for citizens to become clients. If the police did notregularly stop motorists in Latin America who have done nothing wrong, then there would beno reason to offer to pay a bribe. Similarly, in instances when the motorist actually commits atraffic infraction and seeks to avoid a ticket and the corresponding fine, an honest policeofficer would not demand or accept a bribe. If the public sector were both fair and efficient,individuals could easily obtain the service they are seeking (e.g., a permit from the localgovernment) and there would be no need to pay a bribe. Additionally, if one sought to avoidpaying a large, legally established fee for a service and the public officials were honest, nobribe would be accepted. In short, while it is always possible to view corruption “victims” ascorruption “partners,” bribery would be largely futile if not for the inefficiency andcomplicity of a corrupt public sector.
The survey approach is constrained in its coverage because it measures only low-levelcorruption, but is incapable of measuring much high-level corruption. This critique is valid,but only to a limited degree. It is true that surveys of the public do not measure—nor do theyattempt to measure—high-level corruption (e.g., bribes paid to ministers or legislators). But,it would be a serious error to assume that low-level corruption is not strongly correlated withthe degree of corruption at the top. It is simply not reasonable to imagine that a politicalsystem that is very corrupt at the level of day-to-day transactions (police, local government,schools, banks, etc.) would be squeaky clean at the top. Similarly, it is difficult to imaginethe reverse situation with a highly corrupt senior administration combined with an absence ofcorruption down on the street. Since there seems to be no reasonable way to directly measurehigh-level corruption (rather, only the perception of that corruption), the victimizationapproach used by Vanderbilt University may be the best instrument currently available.
4.4 Results: Corruption Victimization in Eleven CountriesOne item that was standard across the CAM series, as well as Ecuador, Bolivia and theDominican Republic was the following:

The Political Culture of Democracy in Mexico, Central America, and Colombia, 2004 53
EXC6. Has a public employee requested a bribe in the last year?
This item, while generic in its focus, does avoid problems of country-specific variation insources of bribery. The results for corruption victimization, as measured by EXC6 compared tothe CPI index for the eleven countries under study here are presented in Figure IV.3 below. Theresults give us a great deal of information. First, examine the CPI index, which is shown as a redbar in the graph. Since the index ranges from 1 on the low end and 10 on the high end, the rangeof variation is not great. Among the countries being studied, the range is quite narrow. OnlyBolivia and Ecuador fall below an index score of 3, while only one country, Costa Rica, risesabove a 4. Second, in marked contrast to the CPI, there is a vast chasm that separates countrieson the corruption victimization measure. At the low end, “only” less than 3% of the respondentshad been victimized in the year prior to the survey. This was the case in Honduras and Colombia.We say “only” because even these low numbers are far higher than the European levels of lessthan 1% as measured by the UN research program discussed above.
Figure IV.3 Transparency CPI vs. Corruption Victimization
Transparency CPI vs. Corruption Vicitmization
Sig, < .001 for victimization measure
(Note: CPI data for Panama missing for 2003, 2002 used instead
Colombia
Honduras
Costa Rica
Guatemala
Nicaragua
El Salvador
Panamá
Dominican Republic
México
Ecuador
Bolivia 2002
Per
cent
vic
tim
ized
: pu
blic
em
ploy
ee s
olic
iate
d br
ibe
20.0%
10.0%
0.0%
CP
I index
20.0
10.0
0.0
Public employee
soliticited bribe
CPI: 2003
3.7
2.3
4.3
2.42.6
3.73.03.33.6
2.22.32.72.7
3.23.33.4
4.3
6.0
11.6
12.9
14.8
17.1
Third, the CPI provides a very different view of corruption in Mexico and the DominicanRepublic from the one obtained from the LAPOP surveys, as shown in Figure IV.4 below. TheCPI scores place Mexico among the best four countries in this eleven-country series, whereas theLAPOP data place Mexico among the three countries with the highest levels of corruption, anddramatically higher than most of the remaining countries in the study. Similarly, the levels ofcorruption in the Dominican Republic seem understated in the CPI compared to the LAPOP.

The Political Culture of Democracy in Mexico, Central America, and Colombia, 2004 54
Figure IV.4 Transparency CPI Index of Corruption
Transparency CPI index of corruption
(Note: CPI data for Panama missing for 2003, 2002 used instead
Ecuador
Honduras
Bolivia
Guatemala
Nicaragua
Panamá
Dominican Republic
México
El Salvador
Colombia
Costa Rica
Mea
n C
PI
4.5
4.0
3.5
3.0
2.5
2.0
1.5
2.22.32.3
2.4
2.6
3.0
3.3
3.63.73.7
4.3
One final look at these results is shown in Figure IV.5, where controls are introduced for GNPper capita and infant morality, as has been done before in this study. Once again, Bolivia,Mexico and the Dominican Republic are found to have high levels of corruption, but whatchanges is that Ecuador declines substantially, joining the least corrupt nations. Thisdemonstrates that in the case of Ecuador, its level of wealth and development strongly affects itslevels of corruption. However, the regression results with robust standard errors show that onlyinfant mortality is a significant predictor of bribe requests by public officials.59
The CAM/Colombia survey included an entire battery of items, as noted above. Those itemswere standard for the CAM/Colombia and Ecuador, but not for Bolivia and the DominicanRepublic, so the remainder of the analysis concentrates only on the CAM/Colombia series plusEcuador.
59 Regression with robust standard errors Number of obs = 22723 F( 2, 10) = 4.94 Prob > F = 0.0322 R-squared = 0.0114Number of clusters (pais) = 11 Root MSE = 27.139
------------------------------------------------------------------------------ | Robust exc6r | Coef. Std. Err. t P>|t| [95% Conf. Interval]-------------+---------------------------------------------------------------- gni2002 | .0013963 .000992 1.41 0.190 -.000814 .0036066 infmort | .2983921 .1169233 2.55 0.029 .0378707 .5589135 _cons | -4.18431 6.554647 -0.64 0.538 -18.78898 10.42035------------------------------------------------------------------------------

The Political Culture of Democracy in Mexico, Central America, and Colombia, 2004 55
Figure IV.5 Residual Scores of Public Employee Bribery
Residual scores of public employee bribery
Controled for GNP per capita and infant mortality
Colombia
Costa Rica
Ecuador
Nicaragua
Honduras
Panamá
El Salvador
Dominican Republic
Guatemala
México
Bolivia 2002
Sta
ndar
dize
d P
redi
cted
Res
idua
l of
publ
ic e
mpl
oyee
bri
be
3.0
2.0
1.0
0.0
-1.0
-2.0
-1.4-1.2
-.9-.6-.5
.3.4
1.4
2.0
The results of the comparison across the nine countries in the series are shown graphically inFigure IV.6.

The Political Culture of Democracy in Mexico, Central America, and Colombia, 2004 56
Figure IV.6 Corruption Victimization: Nine Countries
Corruption victimization: nine countries
Ecuador
Colombia
Panamá
Costa Rica
Nicaragua
Honduras
El Salvador
Guatemala
México
% v
icti
ms
30%
20%
10%
0%
Accused by police
Police demand bribe
Public employee
Municipal bribe
Bribe at work
Courts
Health service bribe
School bribe
As these results are difficult to compare in any detail in the above chart, Table IV.1 is shown sothat the actual percentages in each country can be read. The items EXC1R through EXC6R arefor the entire population, while the remaining questions are only for the users of the services. Thehigh scores for Mexico and Ecuador stand out, but it is also of note to see the wide variationacross the countries in variables such as municipal bribery and the courts. For example,Nicaragua stands out as having an especially corrupt municipal government and court system,while at the other extreme, bribery in the Costa Rican courts system is the lowest in the series.
Table IV.1 Percentage of Respondents Who Were Victimized by Bribery: Nine Countries
Country
EXC1RAccused by
police
EXC2RPolice
demandbribe
EXC6RPublic
employeebribe
EXC11RMunici-pal bribe
EXC13RBribe at
workEXC14RCourts
EXC15RHealthservicebribe
EXC16RSchoolbribe
1 México 9.4 18.0 12.9 20.7 10.3 13.5 9.5 12.72 Guatemala 4.2 6.9 3.3 8.2 6.5 5.0 6.7 8.73 El Salvador 4.7 5.5 4.3 5.3 5.4 4.0 6.6 7.34 Honduras 3.7 5.3 2.7 10.2 9.9 6.6 7.2 11.35 Nicaragua 3.5 3.7 3.4 12.9 12.6 15.5 10.7 9.56 Costa Rica 3.1 3.5 3.2 5.6 4.2 2.7 3.8 8.67 Panamá 4.5 6.9 6.0 9.3 6.2 6.5 5.7 6.78 Colombia 4.8 3.8 2.7 5.3 5.6 5.1 7.7 5.59 Ecuador 4.6 9.7 14.8 15.0 11.3 20.5 12.8 23.8

The Political Culture of Democracy in Mexico, Central America, and Colombia, 2004 57
4.5 Corruption Erodes Political LegitimacyOne of the most frequently heard comments is that corruption erodes trust and confidence in thepolitical system. Typical of those who decry the negative effects of corruption, the World Bankfrequently argues the thesis, “Corruption violates the public trust and corrodes social capital. . . .Unchecked, the creeping accumulation of seemingly minor infractions can slowly erode politicallegitimacy.”60 Unfortunately, although the Bank presented substantial evidence that corruptionnegatively affects the economy, it provided no support for the claims that minor corruption (oreven major corruption) erodes political legitimacy. While the Bank has presented a great deal ofevidence on the level of the independent variable (corruption), it has presented no correspondingevidence on the dependent variable (political legitimacy). The more recent World Bank Institutestudies, as reported above, use a multi-index measure of governance, including perceptions ofcorruption worldwide, and have found that per capita incomes are lower and infant mortality andadult illiteracy are higher when governance is poor.61 Yet once again, there is no effort to linkcorruption on one hand and political legitimacy on the other.
Corruption surveys, though embryonic, appear to be the most promising of the efforts undertakento date to test the corruption/erosion of legitimacy thesis. As discussed in this study, thesesurveys obtain corruption experience data at the level of the individual while simultaneouslyobtaining information from those same individuals about their belief in the legitimacy of theirgovernment. The analytical task, then, becomes searching for the connections betweencorruption experience and legitimacy beliefs after appropriate control variables are introduced.
Latin America, where currently there is extensive attention focused on corruption, is a goodplace to test the hypothesized relationship between corruption and legitimacy for two reasons.62
First, as shown above, this is a region of the world frequently found to have high levels ofcorruption. Second, Latin America has long had problems of political stability, suffering aseemingly endless succession of coups through much of its history.63 If, as Easton64 and alsoLipset65 have argued, legitimacy is a fundamental requisite for democratic stability, then it isplausible that legitimacy is questionable in many Latin American countries. From an empiricalpoint of view, considerable evidence exists to show that legitimacy levels remain low in manycountries in the region despite ten or more years of democratic rule.66
60 World Bank, World Development Report, 1997 (Washington, D. C.: Oxford University Press, 1997) pp. 102-04.61 Kaufmann, Kraay, and Zoido-Lobatón, Governance Matters.62 Joseph S Tulchin and Ralph H. Espach., in Combating Corruption in Latin America (Washington, D. C:
Woodrow Wilson Center Press, 2000).63 Mitchell A. Seligson and Julio Carrión, "Political Support, Political Skepticism and Political Stability in New
Democracies: An Empirical Examination of Mass Support for Coups D'Etat in Peru," Comparative PoliticalStudies 35, no. 1 (2002):58-82.
64 David Easton, "A Re-Assessment of the Concept of Political Support," British Journal of Political Science 5(1975):435-57.
65 Lipset, "The Social Requisites of Democracy Revisited."; Seymour Martin Lipset and Gabriel Salman Lenz,"Corruption, Culture and Markets," in Culture Matters: How Values Shape Human Progress, ed. Lawrence J.Harrison, Huntington, Samuel P. (New York: Basic Books, 2000).
66 Mitchell A. Seligson, "Toward A Model of Democratic Stability: Political Culture in Central America," Estudiosinterdisciplinarios de América Latina y el Caribe 11, no. 2 (2000).

The Political Culture of Democracy in Mexico, Central America, and Colombia, 2004 58
Legitimacy is measured in the Vanderbilt surveys by a scale of system support reported on theprevious chapter. The first task is to determine if corruption has a negative or positive impact onlegitimacy. When a citizen pays a bribe to either receive a public service or to avoid sanctionsfrom an accused violation of law, two reactions could emerge depending upon how the bribery isperceived. On one hand, the bribe could be viewed as a “user fee,” much like the fee one wouldwillingly pay to use a toll road or a campground. Those who pay such fees might view theassessment and payment as an entirely legitimate transaction, implying no negative evaluation ofthe political system. Indeed, an individual who pays a “processing fee” in order to facilitate thegranting of a driver’s license, for example, might be pleased with a system that allows thegranting of such licenses even when the requisite requirements (vision test, driving skills test,etc.) have not been met. Or the individual may feel that the salaries paid to public officials areproperly kept low so that overall taxes remain low, but those who use the service ought tolegitimately pay these user fees so as to supplement the salaries of public officials.
Those asked to pay bribes may have an entirely different reaction to the experience, viewing thebribe not as an appropriate user fee, but as what economists call a “DUP,” a directlyunproductive profit-seeking activity, otherwise known as rent-seeking. When a municipal clerkasks for a payment above and beyond the officially established fee to process a birth certificate,the payment represents a surplus value above that of the established price, and hence can beconsidered rent-seeking behavior. Rent-seeking is possible only because those demanding therent (in the form of a bribe) have been given state license (unofficially) to do so. We can predict,therefore, that individuals who view such fees as rent seeking are likely to form negative viewsabout the state.
The empirical results from the CAM/Colombia survey are shown in Figure IV.7. As can be seen,there is a uniform pattern of erosion of system support as corruption victimization, measured bya combined index, increases.

The Political Culture of Democracy in Mexico, Central America, and Colombia, 2004 59
Figure IV.7 Impact of Corruption Victimization on System Support
Impact of corruption victimization on system support
Total number times victimized by corruption in last year
4.003.002.001.00.00
Mea
n Sy
stem
sup
port
80.0
70.0
60.0
50.0
40.0
30.0
20.0
Guatemala
El Salvador
Nicaragua
Costa Rica
Panamá
Colombia
There are two countries in the series for which this relationship is not as clear and as strong:Mexico and Honduras. Those patterns are shown below in Figure IV.8. Mexico, it will berecalled was a high corruption country in the series. Perhaps citizens there are so accustomed tocorruption that they accept it as the norm. Another possibility is that the unusual situation inMexico with the long dominance of the PRI and the recent move toward liberalization of thesystem might be having an effect. The Mexican data are discussed in detail in the country report.The Honduras pattern is the only one in which there is no real impact of corruption victimizationon system support. Again, the reader needs to refer to that country report for more details.

The Political Culture of Democracy in Mexico, Central America, and Colombia, 2004 60
Figure IV.8 Impact of Corruption Victimization on System Support: Mexico and Honduras
Impact of corruption victimization on system support:
Mexico and Honduras
Total number times victimized by corruption in last year
4.003.002.001.00.00
Mea
n Sy
stem
sup
port
62.0
60.0
58.0
56.0
54.0
52.0
50.0
48.0
46.0
44.0
México
Honduras
4.6 ConclusionsCorruption matters. This chapter has shown that corruption levels, at the level of personalexperience with everyday forms of it, vary strongly among the countries being studied here. Inaddition, the study has shown that corruption erodes confidence in the legitimacy of the politicalsystem.
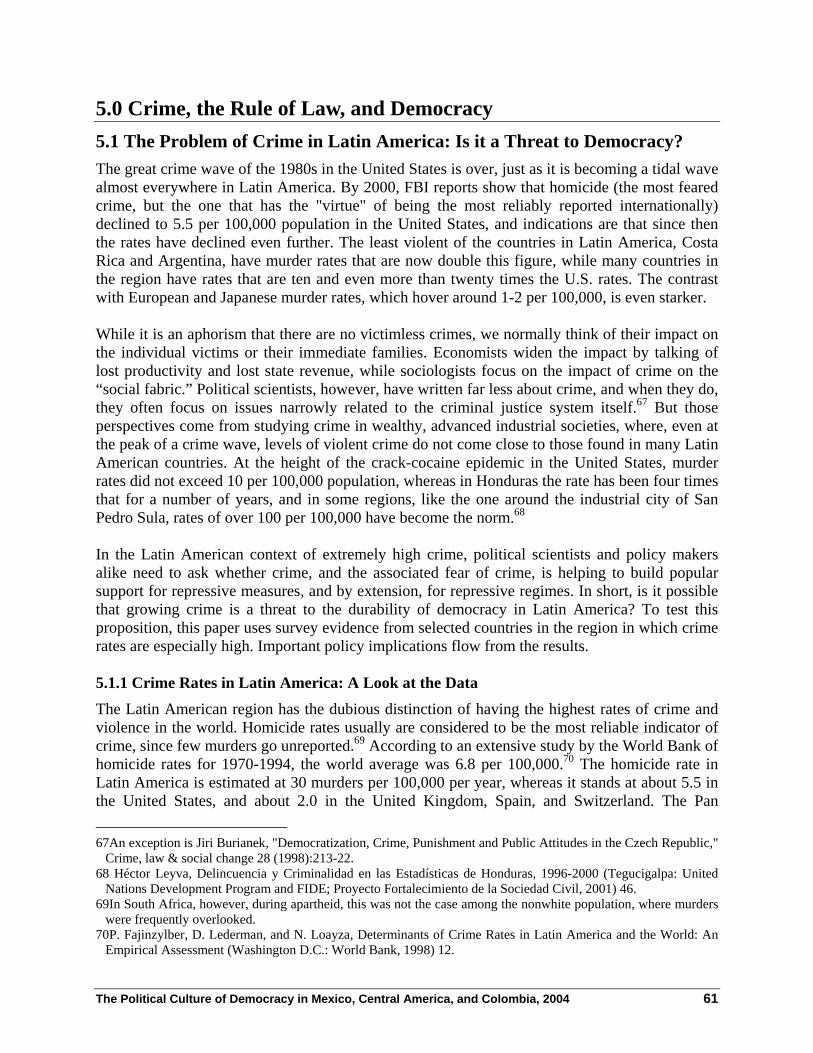
The Political Culture of Democracy in Mexico, Central America, and Colombia, 2004 61
5.0 Crime, the Rule of Law, and Democracy5.1 The Problem of Crime in Latin America: Is it a Threat to Democracy?The great crime wave of the 1980s in the United States is over, just as it is becoming a tidal wavealmost everywhere in Latin America. By 2000, FBI reports show that homicide (the most fearedcrime, but the one that has the "virtue" of being the most reliably reported internationally)declined to 5.5 per 100,000 population in the United States, and indications are that since thenthe rates have declined even further. The least violent of the countries in Latin America, CostaRica and Argentina, have murder rates that are now double this figure, while many countries inthe region have rates that are ten and even more than twenty times the U.S. rates. The contrastwith European and Japanese murder rates, which hover around 1-2 per 100,000, is even starker.
While it is an aphorism that there are no victimless crimes, we normally think of their impact onthe individual victims or their immediate families. Economists widen the impact by talking oflost productivity and lost state revenue, while sociologists focus on the impact of crime on the“social fabric.” Political scientists, however, have written far less about crime, and when they do,they often focus on issues narrowly related to the criminal justice system itself.67 But thoseperspectives come from studying crime in wealthy, advanced industrial societies, where, even atthe peak of a crime wave, levels of violent crime do not come close to those found in many LatinAmerican countries. At the height of the crack-cocaine epidemic in the United States, murderrates did not exceed 10 per 100,000 population, whereas in Honduras the rate has been four timesthat for a number of years, and in some regions, like the one around the industrial city of SanPedro Sula, rates of over 100 per 100,000 have become the norm.68
In the Latin American context of extremely high crime, political scientists and policy makersalike need to ask whether crime, and the associated fear of crime, is helping to build popularsupport for repressive measures, and by extension, for repressive regimes. In short, is it possiblethat growing crime is a threat to the durability of democracy in Latin America? To test thisproposition, this paper uses survey evidence from selected countries in the region in which crimerates are especially high. Important policy implications flow from the results.
5.1.1 Crime Rates in Latin America: A Look at the DataThe Latin American region has the dubious distinction of having the highest rates of crime andviolence in the world. Homicide rates usually are considered to be the most reliable indicator ofcrime, since few murders go unreported.69 According to an extensive study by the World Bank ofhomicide rates for 1970-1994, the world average was 6.8 per 100,000.70 The homicide rate inLatin America is estimated at 30 murders per 100,000 per year, whereas it stands at about 5.5 inthe United States, and about 2.0 in the United Kingdom, Spain, and Switzerland. The Pan 67An exception is Jiri Burianek, "Democratization, Crime, Punishment and Public Attitudes in the Czech Republic,"
Crime, law & social change 28 (1998):213-22.68 Héctor Leyva, Delincuencia y Criminalidad en las Estadísticas de Honduras, 1996-2000 (Tegucigalpa: United
Nations Development Program and FIDE; Proyecto Fortalecimiento de la Sociedad Civil, 2001) 46.69In South Africa, however, during apartheid, this was not the case among the nonwhite population, where murders
were frequently overlooked.70P. Fajinzylber, D. Lederman, and N. Loayza, Determinants of Crime Rates in Latin America and the World: An
Empirical Assessment (Washington D.C.: World Bank, 1998) 12.

The Political Culture of Democracy in Mexico, Central America, and Colombia, 2004 62
American Health Organization, which reports a lower average for Latin America as a whole of20 per 100,000 people,71 says that “violence is one of the main causes of death in theHemisphere. . . . In some countries, violence is the main cause of death and in others it is theleading cause of injuries and disability.”72 In the region there are 140,000 homicides each year.73
According to this and other indicators, violence in Latin America is five times higher than inmost other places in the world.74 Moreover, according to Gaviria and Pagés, the homicide ratesare not only consistently higher in Latin America, but also the differences with the rest of theworld are growing larger.75 Consistent with the above data, using 1970-1994 data from theUnited Nations World Crime Surveys, Fajnzylber et al. found that Latin America and theCaribbean have the highest homicide rates, followed by sub-Saharan African countries.76
5.1.2 Research on Crime in Latin AmericaIt was not until the second half of the 1990s that the problem of crime in Latin America began tobe addressed seriously as one of the most acute problems for the new democracies in the region.According to the World Bank, this was part of a larger concern throughout the democratizingworld with the impact of crime and violence on achievement of development objectives.77 Thus,crime began to be addressed as a major problem with pernicious effects on economic activity andon citizens' quality of life. In the United States, the problem of crime had been long addressed asa national problem, but academic research on the subject has been either focused on theindividual determinants of criminal behavior (within the framework of psychology or criminallaw) or focused on the socioeconomic determinants and impact of criminal behavior (within theframework of economics). Researchers have not suggested that crime in the United States orother consolidated democracies presents a threat to stability. However, in the fragile democracies 71According to the United Nations Global Report on Crime, health statistics as a basis for measuring homicide
significantly under-report the total homicide level. Health statistics data are based on the classification of deathsmade by physicians rather than by the police. According to the UN comparison, health-based homicide ratesaverage about half those of Interpol or UN statistics. See Graeme Newman, ed., Global Report on Crime andJustice (New York: Oxford University Press, 1999) 12-13.
72Daron Acemoglu and James A. Robinson, "A Theory of Political Transitions," American Economic Review 91, no.4 (2001):938-63.
73Nevertheless, not all of the countries in this region face the same magnitude and type of violence. In the nineties,Colombia, faced with epidemic problems of drug trafficking and guerrilla violence, had one of the highesthomicide rates anywhere – around 90 homicides per 100,000 inhabitants. In contrast, Chile, despite a history ofpolitical conflict, displayed homicide rates no greater than 5 deaths per 100,000 inhabitants. See OrganizaciónPanamericana de la Salud, "Actitudes y normas culturales sobre la violencia en ciudades seleccionadas de laregión de las Américas. Proyecto ACTIVA," (Washington D.C.: World Bank: Division of Health and HumanDevelopment, 1996).
74See Centro de Investigaciones Económicas Nacionales CIEN, "Carta Económica," (CIEN, 1998); P. Fajinzylber,D. Lederman, and N. Loayza, Determinants of Crime Rates in Latin America and the World; Diagnóstico de laViolencia en Guatemala (Guatemala: CIEN, 1999).
75Alejandro Gaviria and Carmen Pagés, "Patterns of Crime Victimization in Latin America," Inter-American BankConference on Economic and Social Progress in Latin America," (Washington D.C.: 1999).
76The countries of Latin America and the Caribbean that were included in this calculation are Mexico, Colombia,Brazil, Venezuela, Ecuador, Uruguay, Argentina, Chile, Peru, Bahamas, Jamaica, Nicaragua, Barbados, CostaRica, Trinidad and Tobago, Bermuda, Suriname, Honduras, Antigua, Dominica, Belize, Panama, Guyana, Cuba,and El Salvador.
77Fajinzylber, Lederman, and Loayza, Determinants of Crime Rates in Latin America and the World: An EmpiricalAssessment; Mitchell Seligson and Dinorah Azpuru, "Las Dimensiones y el Impacto Político de la Delincuencia enla Población Guatemalteca," in Población del Istmo 2000: Familia, Migración, Violencia y Medio Ambiente, ed.Luis Rosero (San José: Universidad de Costa Rica, 2001).

The Political Culture of Democracy in Mexico, Central America, and Colombia, 2004 63
that have been consolidating in the 1980s and 1990s, both in Latin America and in EasternEurope, concerns are growing that crime might threaten the viability of these regimes.78
Some social scientists recently have begun to pay attention to the issue of crime as a politicalproblem. Michael Shifter asserts that partially because of more open political systems, theproblems of crime, drugs, and corruption are beginning to find a place on the Latin Americanregion’s political agenda.79 In spite of the successes of democracy in the region in achievingrelative economic stabilization, in sharply reducing political violence, and in expanding the arenafor political participation and civil liberties, Shifter argues that democracy has not been capableof dealing effectively with other problems that citizens care a great deal about, especially crime.
The World Bank explored a series of explanatory variables for the variation in crime rates acrosscountries.80 The central finding of that study is that homicide is directly connected to incomeinequality; the greater the inequality of income within nations, the higher the homicide rate,ceteris paribus. Since Latin America is the region of the world with the highest levels of incomeinequality, these results are not surprising.
Given the dramatic increases in homicide rates, it is no wonder that common crime is becomingone of the major issues of concern for Latin Americans. Even in Chile, where violent crime ratesare among the lowest in Latin America, the main concern of the population, as measured bydifferent surveys, has become the rise in street crime, as well as the increase in drug traffickingand consumption.81
This chapter presents results from the CAM/Colombia data set regarding the linkage of crime todemocratic stability in the region.
5.2 The Crime/Democratic Breakdown LinkPerhaps the clearest historical evidence that we have of the impact of crime on democraticbreakdown comes from the interwar period in Europe. As Nancy Bermeo writes, “In 1920,twenty-six out of twenty-eight European states were parliamentary democracies. By 1938,thirteen of these democracies had become dictatorships.”82 Many theories explaining thesebreakdowns, which eventually plunged the world into World War II, taking with it not onlydemocracy, but also over 50 million lives,83 have focused on economic crisis. The familiarargument is that Germany’s democracy broke down because of the extreme inflation sufferedprior to the election of Hitler. Nancy Bermeo shows, however, that this explanation simply does 78See, for instance, Banco Interamericano de Desarrollo, La Violencia en El Salvador en los años noventa.
Magnitud, costos y factores posibilitadores (San Salvador: Universidad Centroamericana Simeón Cañas, 1998).79Michael Schifter, "Tensions and Dilemmas of Democratic Politics in Latin America" (paper presented at the Sol
M. Linowitz Forum, Washington D.C., 1996).80Fajinzylber, Lederman, and Loayza, Determinants of Crime Rates in Latin America and the World: An Empirical
Assessment.81Felipe Agüero and Jeffrey Starks, eds., Fault Lines of Democracy in Post-transition Latin America (Miami:
University of Miami Press, 1999) 243.82Nancy Bermeo, Getting Mad or Going Mad: Citizen, Scarcity and the Breakdown of Democracy in Interwar
Europe, Center for the Study of Democracy Working Papers (Irvine: University of California at Irvine, 1999), p.1.83Martin Gilbert, The Second World War: A Complete History, rev. ed. (New York: Henry Holt and Company,
1991), p. 746. Other estimates go as high as 60 million.

The Political Culture of Democracy in Mexico, Central America, and Colombia, 2004 64
not work because the democracies that survived in Europe in the 1930s suffered economically noless than those that broke down. Bermeo’s important insight is that it was crime rates, noteconomic crisis, that most clearly distinguish the surviving democracies from those thatcollapsed. Her data show that in the cases of breakdown, homicide rates averaged three timesthose of the surviving cases. Confirming this view are those who have studied the German caseand have argued persuasively that voters were supporting a “law-and-order” candidate.84
If Bermeo is correct, and social disorder in the form of crime is a significant factor driving votersto support authoritarian solutions and the ultimate breakdown of democracy, then Latin Americais a good place to test the thesis. In Bermeo’s interwar data set, the homicide rate for thecountries in which democracy broke down averaged 7 per 100,000 population. Compare thoserates with data from Latin America.
Let us now examine the data from the CAM/Colombia survey of 2004. The survey wasconstrained in the area of crime victimization as there was only space in the questionnaire forfive items. In standard crime victimization studies, hundreds of questions are asked, but since oursurvey focused on many aspects of democratic values and behaviors, there was only a limitedamount of space for any one component.
The respondents were asked:
VIC1. Have you been a victim of a criminal act in the last 12 months?1. Yes [continue] 2. No [Skip] 8. Don’t know.
VIC2. What kind of criminal act did you experience? (Do not read list).
The remaining items in the series dealt with reporting of the crime. The focus in this chapter ison the crime itself. Two countries in the study did not use the same question wording and aredeleted from this analysis.85 The results of the first question, VIC1, are shown in Figure V.1below. The overall pattern is that crime victimization does not vary much among these countries,with Guatemala and Honduras being somewhat lower than the other countries and Ecuador beingsomewhat higher.
84This point is argued by Bob Altemeyer, The Authoritarian Specter (Cambridge: Harvard University Press, 1996),
p. 91. For a brilliant review of the various explanations of the Hitler phenomenon, see Ron Rosenbaum,Explaining Hitler (New York: Random House, 1998).
85 In Bolivia, the question used was: Durante los últimos 12 meses ha sido Ud. víctima de robos o agresiones?, whilein the Dominican Republic, the question was: ¿Ha sido víctima de una agresión física o de algún acto dedelincuencia en los últimos 12 meses? While these items are similar to the one used in the CAM/Colombia, theydiffer in that the Bolivian item asks about robbery and aggressive acts, without refering to “actos de delincuencia”and in the Dominican Republic there is mention of “agresión física.”

The Political Culture of Democracy in Mexico, Central America, and Colombia, 2004 65
Figure V.1 Crime Victimization in Last Year
149914791636150014291499158917081545N =
Crime victimization in last year
Ecuador
Colombia
Panamá
Costa Rica
Nicaragua
Honduras
El Salvador
Guatemala
México
95%
CI R
espo
nden
t vi
ctim
ized
by
crim
e
25%
20%
15%
10%
5%
These results come as somewhat of a surprise, given the reports of very high murder rates incountries like El Salvador and Colombia. However, this assumes that murder rates are reliableand that overall crime rates are tightly connected, when in fact they are not. In an extensive studyof the subject, an Inter-American Development Bank team found no reliable relationshipbetween the two kinds of crime.86 A study of murder rates comparing UN data and those fromINTERPOL vary by more than 50%.87 Moreover, in the widely cited United Nations world-widecrime study, the only countries in the sample that are included in the UN study are Costa Rica,Panama, Colombia, Ecuador and Bolivia.88 Since crime victimization studies cannot obtain directdata from homicide victims, for obvious reasons, such surveys do not report on that form ofcrime. What the survey evidence suggests is that there is a rather high level of crime in thesecountries, with an average of 15% of their residents experiencing a crime during the course of ayear. Compared to the U.S., where the data are not for voting-aged citizens but for those 12 andover, we find that in 2003, the U.S. Department of Justice reports a rate of 10.1%. In both thesurvey data in this chapter, as well as the U.S. data, murders are excluded.
There is far greater variation in crime rates within countries than across countries, as Figure V.2shows. Not surprisingly, in every country, urban crime rates are far higher than rural.
86 Pablo Fajinzylber, Daniel Lederman, and Norman Loayza, Determinants of Crime Rates in Latin America and the
World: An Empirical Assessment (Washington, D. C.: The World Bank, 1998).87 United Nations, Global Report on Crime and Justice, ed. Graeme Newman (New York: Oxford University Press,
1999) 12.88 Ibid.
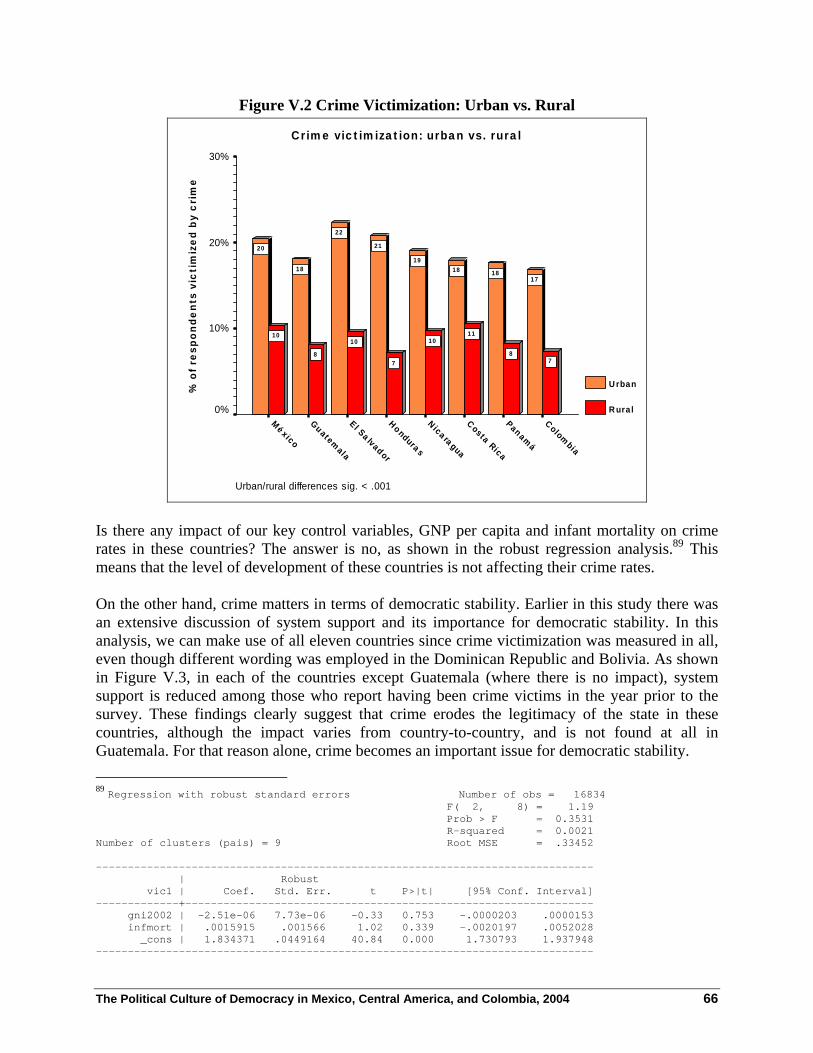
The Political Culture of Democracy in Mexico, Central America, and Colombia, 2004 66
Figure V.2 Crime Victimization: Urban vs. Rural
Crime victimization: urban vs. rural
Urban/rural differences sig. < .001
Colombia
Panamá
Costa Rica
Nicaragua
Honduras
El Salvador
Guatemala
México
% o
f res
pond
ents
vic
tim
ized
by
crim
e
30%
20%
10%
0%
Urban
Rural
78
1110
7
10
8
10
171818
19
21
22
18
20
Is there any impact of our key control variables, GNP per capita and infant mortality on crimerates in these countries? The answer is no, as shown in the robust regression analysis.89 Thismeans that the level of development of these countries is not affecting their crime rates.
On the other hand, crime matters in terms of democratic stability. Earlier in this study there wasan extensive discussion of system support and its importance for democratic stability. In thisanalysis, we can make use of all eleven countries since crime victimization was measured in all,even though different wording was employed in the Dominican Republic and Bolivia. As shownin Figure V.3, in each of the countries except Guatemala (where there is no impact), systemsupport is reduced among those who report having been crime victims in the year prior to thesurvey. These findings clearly suggest that crime erodes the legitimacy of the state in thesecountries, although the impact varies from country-to-country, and is not found at all inGuatemala. For that reason alone, crime becomes an important issue for democratic stability. 89 Regression with robust standard errors Number of obs = 16834 F( 2, 8) = 1.19 Prob > F = 0.3531 R-squared = 0.0021Number of clusters (pais) = 9 Root MSE = .33452
------------------------------------------------------------------------------ | Robust vic1 | Coef. Std. Err. t P>|t| [95% Conf. Interval]-------------+---------------------------------------------------------------- gni2002 | -2.51e-06 7.73e-06 -0.33 0.753 -.0000203 .0000153 infmort | .0015915 .001566 1.02 0.339 -.0020197 .0052028 _cons | 1.834371 .0449164 40.84 0.000 1.730793 1.937948------------------------------------------------------------------------------

The Political Culture of Democracy in Mexico, Central America, and Colombia, 2004 67
Figure V.3 Impact of Crime Victimization on System Support
Impact of crime victimization on system support
Dominican Republic
Bolivia 2002
Ecuador
Colombia
Panamá
Costa Rica
Nicaragua
Honduras
El Salvador
Guatemala
México
Syst
em s
uppo
rt70
60
50
40
30
Not a victim
Victim
40
45
41
53
46
64
47
45
55
50
54
45
48
42
58
54
68
51
53
61
49
59
Even clearer evidence of the impact of crime victimization on political legitimacy is shown whenthe focus is on the judicial system, as it is in Figure V.4. In each of the eleven countries, thosewho have been victimized by crime are less likely to believe that one can get a fair trail in thatcountry. In other words, crime victimization shakes confidence in the judiciary.
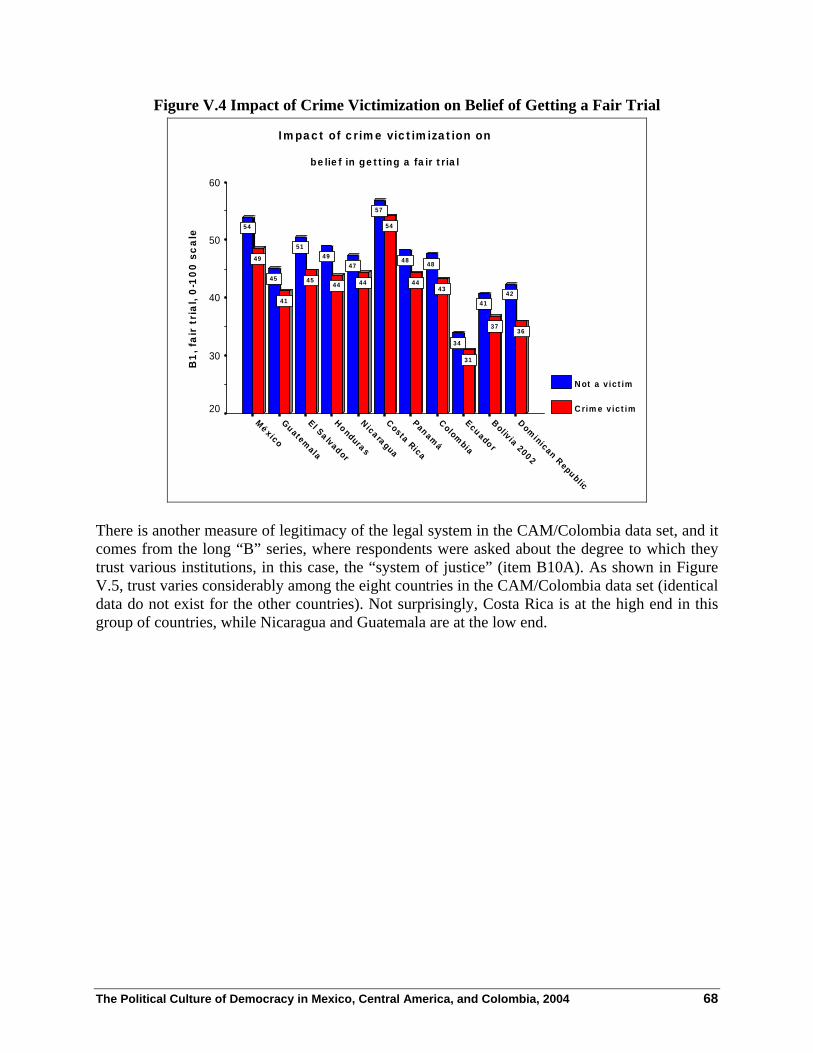
The Political Culture of Democracy in Mexico, Central America, and Colombia, 2004 68
Figure V.4 Impact of Crime Victimization on Belief of Getting a Fair Trial
Impact of crime victimization on
belief in getting a fair trial
Dominican Republic
Bolivia 2002
Ecuador
Colombia
Panamá
Costa Rica
Nicaragua
Honduras
El Salvador
Guatemala
México
B1,
fair
tri
al, 0
-100
sca
le60
50
40
30
20
Not a victim
Crime victim
3637
31
4344
54
444445
41
49
4241
34
4848
57
4749
51
45
54
There is another measure of legitimacy of the legal system in the CAM/Colombia data set, and itcomes from the long “B” series, where respondents were asked about the degree to which theytrust various institutions, in this case, the “system of justice” (item B10A). As shown in FigureV.5, trust varies considerably among the eight countries in the CAM/Colombia data set (identicaldata do not exist for the other countries). Not surprisingly, Costa Rica is at the high end in thisgroup of countries, while Nicaragua and Guatemala are at the low end.

The Political Culture of Democracy in Mexico, Central America, and Colombia, 2004 69
Figure V.5 Trust in the Justice System
Trust in the justice system
Sig. < .001
Guatemala
Nicaragua
Panamá
México
Honduras
Colombia
El Salvador
Costa Rica
Mea
n Tr
ust
in t
he ju
stic
e sy
stem
70
60
50
40
4445
48
505152
53
61
Examining the impact of crime victimization on this measure of trust in the judicial systemshows a similar pattern, as shown in Figure V.6. In every country in the series, crime victimshave less trust in the justice system than non-victims.

The Political Culture of Democracy in Mexico, Central America, and Colombia, 2004 70
Figure V.6 Impact of Crime Victimization on Trust in the Justice System
Impact of crime victimization on
Trust in the justice system
Colombia
Panamá
Costa Rica
Nicaragua
Honduras
El Salvador
Guatemala
México
Mea
n Tr
ust
in t
he ju
stic
e sy
stem
70
60
50
40
30
Not a victim
Crime victim
47
43
58
4344
46
37
44
52
49
62
45
5354
45
51
One of the explanations as to the linkage between crime and low support for the system ingeneral and the judicial system in particularly is that most citizens do not report crimes, largelybecause they feel that it would not do any good. The results in Figure V.7 show that only in onecountry, Panama, did a majority of crime victims report the crime to the authorities. In Ecuador,fewer than one-third of victims reported the crime (comparable data not available for Bolivia).When we asked why the crimes were not reported, over half of the pooled sample responded thatdoing so would do no good.
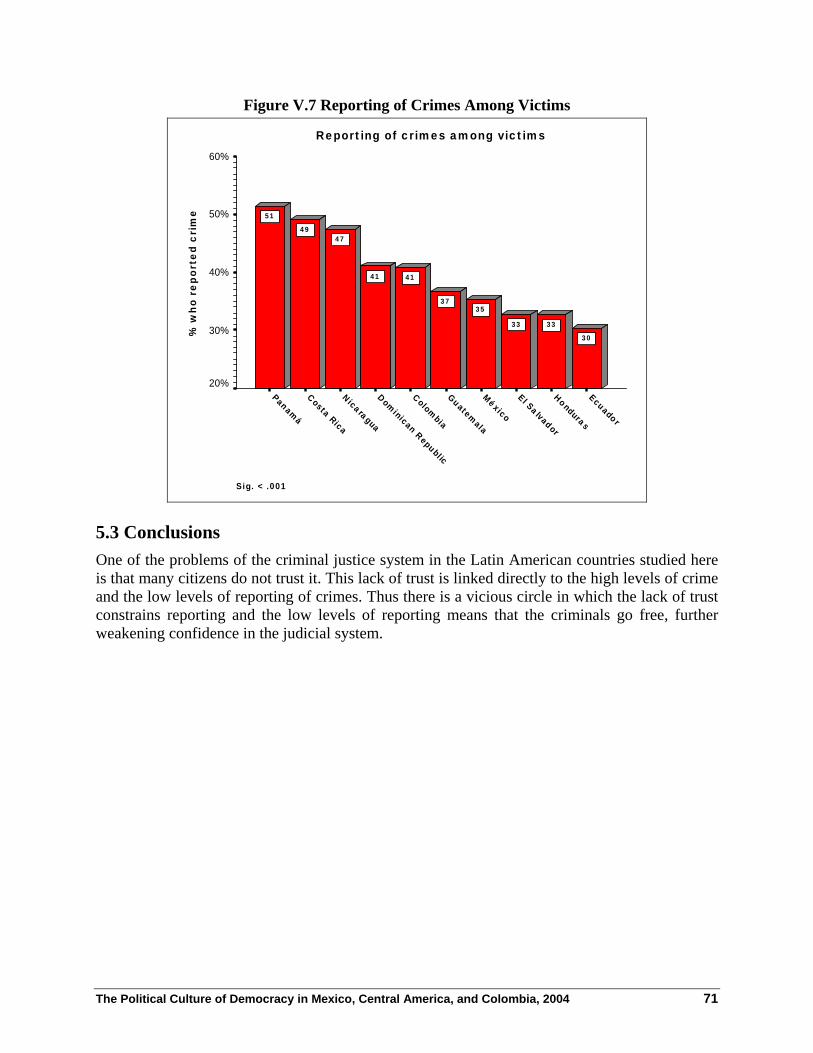
The Political Culture of Democracy in Mexico, Central America, and Colombia, 2004 71
Figure V.7 Reporting of Crimes Among Victims
Reporting of crimes among victims
Sig. < .001
Ecuador
Honduras
El Salvador
México
Guatemala
Colombia
Dominican Republic
Nicaragua
Costa Rica
Panamá
% w
ho r
epor
ted
crim
e
60%
50%
40%
30%
20%
30
3333
3537
4141
4749
51
5.3 ConclusionsOne of the problems of the criminal justice system in the Latin American countries studied hereis that many citizens do not trust it. This lack of trust is linked directly to the high levels of crimeand the low levels of reporting of crimes. Thus there is a vicious circle in which the lack of trustconstrains reporting and the low levels of reporting means that the criminals go free, furtherweakening confidence in the judicial system.


The Political Culture of Democracy in Mexico, Central America, and Colombia, 2004 73
6.0 Local GovernmentThroughout Latin America governments have been attempting to decentralize in order to achievetwo objectives. First, there is the widespread belief that local government is efficientgovernment. Large, distant and impersonal central governments are increasingly seen as highlyinefficient, being unable to respond to variations in local needs and demands and also morelikely to be immune to citizen control and accountability. Second, local governments, by placingcontrol in the hands of the people, may help build democracy from the ground up. The implicitmodel, of course, is democracy in the United States, which DeToqueville argued was strong inpart because of the widespread proliferation of many local units. The downside, of course, is thatlocal governments may prevent effective implementation of national policies. One only needthink of the extreme difficulties Argentina has had in recent years in exercising national fiscalcontrol over provincial governments to recognize that macro-economic policy-making canbecome complicated when local governments are strong. Moreover, there is widespread concernthat with more funding channeled to the local levels, where auditing becomes more difficult, thatcorruption will increase.
Many governments in the region have recently implemented political reforms designed totransfer greater power to subnational levels of government and provide a more substantialpolicymaking and oversight role to citizens at the local level.90 Advocates of decentralizationargue that it holds “great potential to stimulate the growth of civil society organizations . . . ;prevent widespread disillusionment with new policies from turning into a rejection of the entiredemocratic process . . . ; [and] boost legitimacy by making government more responsive tocitizen needs.”91. Implicit in this proposition is that local institutions, if made relevant to thedaily lives of citizens, will have a positive effect on how those citizens view their larger politicalsystem.
For most of their histories, the countries included in this study have been highly centralized.Their local governments have been and continue to be highly dependent upon centralgovernment transfers, with little capacity to generate their own revenue. Moreover, even thoughrecent laws have raised the allocation of national revenues to local governments in a number ofthe countries given the precarious state of the national economy, it would be wrong to assumethat this will, in the short run, imply a significant expansion of local government revenues.
The LAPOP survey contains a battery of items allowing us to measure attitudes toward andparticipation in local government. The reader should consult the questionnaire, beginning withquestions NP1 and ending with question SGL1 to see the entire series. Not all of the items willbe examined in this report, but are, of course, available for analysis in the full data base, and canbe compared with future studies, or studies carried out in specific regions or municipalities in theregion. The database presented here presents a true picture at the national level.
90 This paragraph is drawn from Jon Hiskey and Mitchell A. Seligson, "Pitfalls of Power to the People:
Decentralization, Local Government Performance, and System Support in Bolivia," Studies in ComparativeInternational Development 37, no. 4 (2003):64-88.
91 Larry Diamond, Developing Democracy: Toward Consolidation (Baltimore: Johns Hopkins University Press,1999).

The Political Culture of Democracy in Mexico, Central America, and Colombia, 2004 74
6.1 Level of Participation in Municipal MeetingsA basic measure of citizen involvement in local government is participation in municipalmeetings. The survey asked respondents (NP1) if they had attended a “cabildo abierto” or anyother kind of meeting convened by the municipality during the year prior to the survey.92 Theresults are presented in Figure VI.1 below. The results are striking since they differ sharply fromthe picture of democracy at the national level that we have seen thus far in this report. Countrieslike Costa Rica and Panama, that have been shown to have relatively high levels of democraticvalues show low levels of citizen participation in municipal meetings. Is this an indication of abreak between national and local level democracy, or is it a reflection of other factors related todevelopment? We attempt to answer this question below.
Figure VI.1 Participation in a Municipal Meeting in the Last Year
Participation in a municipal meeting in the last year
Sig. < .001
Panamá
Costa Rica
Ecuador
El Salvador
México
Honduras
Nicaragua
Guatemala
Bolivia 2002
Colombia
% p
arti
ciap
ted
in m
unic
ipal
mee
ting
30%
20%
10%
0%
67
8
1313
1516
1718
21
One thing we have found in the LAPOP surveys is that participation in local government ishighly related to urbanization; the more urban the sample, the lower the level of participation inmunicipal meetings. This is not a surprising finding; in rural areas, local government may be oneof the few “games in town,” whereas in urban areas, citizen have countless distractions and farmore money to spend on them. Thus, in rural areas, citizens are not likely to have DVD playersand the funds to rent DVDs, while in urban Latin America, such entertainment is morewidespread. The results in Figure VI.2 show that rural participation in all countries except CostaRica is higher in rural areas than in urban. Yet, even if we compare rural participation alone, it isclear that Costa Rica and Panama fare poorly versus the other countries.
92 In Colombia, item NP1 was not used, but item NP1A was used instead, which referrd only to the municipal
meeting and not to the “cabildo abierto.”

The Political Culture of Democracy in Mexico, Central America, and Colombia, 2004 75
Figure VI.2 Impact of Urbanizaton on Municipal Meeting Participation
Impact of urbanization on municipal meeting participation
Bolivia 2002
Colombia
Panamá
Costa Rica
Nicaragua
Honduras
El Salvador
Guatemala
México
% p
arti
ciap
tion
in m
unic
ipal
mee
ting
s
40%
30%
20%
10%
0%
Urban
Rural
Semi-remote
Remote
When controls for national level of development are introduced, the findings become clearer.Robust regression techniques demonstrate that infant mortality, as a measure of nationaldevelopment, has a significant impact on municipal participation.93 The higher the infantmortality rate the higher the municipal participation, indicating that less developed countries arethe ones where local government is more salient to citizens.
The results of the analysis, now controlled for development, are presented in Figure VI.3. Theresults show that once controlled for the impact of development, participation in Costa Rica andPanama are even lower than they were without those controls. This suggests that the level ofdevelopment explanation does not account for the low levels of participation in those countries.It is also the case that Mexico’s participation declines sharply when the controls are introduced,but Bolivia’s increases markedly. In the case of Panama, the low level of participation anddemand-making can be attributed to the fact that municipal governments are extremely weak vis- 93 Regression with robust standard errors Number of obs = 16477 F( 2, 8) = 36.95 Prob > F = 0.0001 R-squared = 0.0163Number of clusters (pais) = 9 Root MSE = .33685
------------------------------------------------------------------------------ | Robust np1r | Coef. Std. Err. t P>|t| [95% Conf. Interval]-------------+---------------------------------------------------------------- gni2002 | 4.74e-07 5.46e-06 0.09 0.933 .0000131 .0000121 infmort | .0032286 .0005269 6.13 0.000 .0044436 .0020136 _cons | 1.97026 .0295605 66.65 0.000 1.902093 2.038426------------------------------------------------------------------------------

The Political Culture of Democracy in Mexico, Central America, and Colombia, 2004 76
à-vis the central authorities, and that little efforts, beyond mayoral elections, have been made toincrease the capacity or authority of local governments.
Figure VI.3 Municipal Participation, Controlled vs. Uncontrolled
Municipal participation, controlled vs. uncontrolled
Bolivia 2002
Ecuador
Colombia
Panamá
Costa Rica
Nicaragua
Honduras
El Salvador
Guatemala
México
devi
atio
n fr
om m
ean
3.0
2.0
1.0
0.0
-1.0
-2.0
Uncontrolled
Controlled
1.9
-.3
-1.0
-1.5
.7.6
.3
.6
-1.3
6.2 Local Demand-MakingOne of the weaknesses of the participation measure just analyzed is that participants at municipalmeetings may be there for many purposes, including entertainment. In Central America, forexample, a cabilido abierto is often an event that includes performances in dance and song oflocal groups. Thus, it is not clear what the meaning is of attending one of these events in terms ofdemocratic political culture. A different, probably better, perspective can be obtained fromexamining demand-making. Item NP2 asks respondents if they have made a demand for help orpresented a petition to the municipality or its representatives during the year prior to theinterview. The results are shown in Figure VI.4. These results are very illuminating. First, theyshow that Bolivia, the country with the most advanced decentralization program in the region,has the highest level of citizen demand-making. Second, they show that Costa Rica, the region’smost democratic country, also has very high levels of demand-making, indicating high levels ofpersonal efficacy among its citizens, even though they are not likely to attend municipalmeetings during the year. Finally, Panama, Ecuador, Honduras and El Salvador are at the lowend.

The Political Culture of Democracy in Mexico, Central America, and Colombia, 2004 77
Figure VI.4 Demand-Making on Local Government
Demand-making on local government
Sig. < .001
El Salvador
Honduras
Ecuador
Panamá
Colombia
Guatemala
Nicaragua
México
Costa Rica
Bolivia 2002
% m
akin
g a
deam
nd
22.0%
20.0%
18.0%
16.0%
14.0%
12.0%
10.0%
12.212.312.5
12.9
14.4
17.5
18.318.4
19.7
21.1
6.3 Satisfaction With Local GovernmentThe final area of local government to be examined in this synthesis paper is satisfaction withlocal government services. The individual country studies showed how satisfaction variedinternally based on region and urbanization. Here we merely show the cross-national differences.
The question (SGL1), asked respondents to rate municipal services on a scale from very good tovery bad. Converting this to a 0-100 range, the results are shown in Figure VI.5 below. Theresults fall into three clear groups. First, there is Colombia, Ecuador and El Salvador, wheresatisfaction is highest, then Panama and Bolivia where it is lowest, and all the others in between.It is of note that even though Bolivia has had the most extensive decentralization reforms andthat the demand-making is the highest, its level of satisfaction is the lowest. These resultsdemonstrate rather clearly that structural reforms can bring about unintended consequences. Thisis very important for USAID local government programs, since it shows that focusingexclusively on increasing participation and demand making, without an equal emphasis onbuilding capacity can be a recipe for declining support. In addition, as many of the countryreports showed, dissatisfaction with local governments has a significant effect on system supportand stable democracy values.

The Political Culture of Democracy in Mexico, Central America, and Colombia, 2004 78
Figure VI.5 Satisfaction With Local Government Services
1474149715051342158714121449154914571450N =
Satisfaction with local government services
Bolivia 2002
Panamá
México
Nicaragua
Guatemala
Honduras
Costa Rica
El Salvador
Ecuador
Colombia
95%
CI
sati
sfac
tion
wit
h lo
cal
gove
rnm
ent
serv
ices
60
50
40
6.4 ConclusionsThe field of local government in Latin America is undergoing major transformations. The datashown here reveal wide variation in participation among the countries being studied, and alsoconsiderable variation in levels of satisfaction. The two do not always coincide. In fact, demand-making and satisfaction, for the pooled sample, are significantly and negatively correlated witheach other. This suggests that programs that increase actions that lead to greater accountability,do not necessarily produce, at least in the short run, high levels of satisfaction. Whendevelopment agencies embark on supporting such reforms, they must anticipate thatempowerment brought on by institutional reform can lead to more demands, more complaints,while the limited resources that define the economic conditions of Latin America today may notenable governments, even with the best of intentions, to satisfy those demands.

The Political Culture of Democracy in Mexico, Central America, and Colombia, 2004 79
7.0 Social Capital and DemocracyWe now turn to the very important issue of social capital. Recent events in Venezuela, Bolivia,Ecuador and elsewhere have highlighted the powerful impact that such participation can have onthe political system. Citizens can and have organized to press for their demands, and thatactivism can have a positive effect on making governments accountable. World-wide, the rapidand dramatic transitions to democracy that have occurred throughout the world since the 1980shave led many researchers to focus on civil society as a potentially vital element in thedemocracy puzzle.94 In Eastern Europe, the role that Solidarity played in bringing down the oldauthoritarian communist order has been studied in detail, and many argue that it was vital to theoverthrow of that system. In Latin America, many have pointed to the role of civil society inorganizing the “No” vote in Chile, which resulted in the replacement of Pinochet’s dictatorshipwith a competitive and economically dynamic democracy. In Argentina, Brazil, Guatemala andelsewhere, human rights NGOs have played a key role in the democratization process.
Dictatorships have long been infamous for suppressing and/or co-opting civil societyorganization. Citizens in such systems are deprived of their ability to provide collectiveexpression of their demands. Democracy, on the other hand, cultivates civil society organizationsas a key element in the articulation of citizen demands.
In recent years political scientists, stimulated by Robert Putnam’s classic work, MakingDemocracy Work, have begun to take a more systematic look at the role of civil society indemocracy.95 Putnam and others have argued that the key to building democracies is through thedevelopment of “social capital.” Countries with high levels of social capital are countries inwhich citizens trust each other and trust their governments. This trust largely emerges from theiractive participation in civil society organizations.96 Putnam believes that the process of buildingsocial capital is a long one, but cannot prosper without an active civil society. It is for this reasonthat building stable democracies in former dictatorships does not occur overnight. On the otherhand, recent studies have suggested that the generation of negative social capital can emerge aswell.97 In a number of cases, citizens have organized not to support democracy, but to supportthe overthrow of democratically elected presidents, as happened in 2003 in Bolivia or earlier inVenezuela. Similarly, citizens organizing to “lynch” mayors for supposed malfeasance hasemerged as a new tactic in the region.
How active is civil society participation in the countries being studied? How much social trust isthere? The data in the present study allow us to answer that question with some precision.
94See Juan J. Linz and Alfred Stepan, Problems of Democratic Transition and Consolidation: Southern Europe,
South America and Post-Communist Europe (Baltimore, Md., Johns Hopkins University Press, 1996). Thisintroductory section draws on prior reports in the University of Pittsburgh Latin American Public Opinion Project.
95 Robert D. Putnam, Making Democracy Work: Civic Traditions in Modern Italy (Princeton, NJ: PrincetonUniversity Press, 1993).
96 Jeffery J. Mondak, "Psychological Approaches to Social Capital, Special Issue," Political Psychology 19 (1998).;Bob Edwards and Michael W. Foley, "Social Capital, Civil Society, and Contemporary Democracy," AmericanBehavioral Scientist 40 (March/April) (1997).; Partha Dasgupta and Ismail Serageldin, eds., Social Capital: AMultifaceted Perspective (Washington, D. C.: The World Bank, 2000).
97 Armony and Ariel, The Dubious link : Civic Engagement and Democratization (Palo Alto: Satnford UniversityPress, 2004).

The Political Culture of Democracy in Mexico, Central America, and Colombia, 2004 80
Numerous other studies of civil society merely count the number of organizations that exist in agiven country or region, and presume that those counts reflect the level of activity of citizens.The democratic values survey conducted for this study allows a far more direct measure; therespondents were asked about their participation in nine distinct forms of civil societyorganizations. The survey makes it possible not only to examine the levels of participation, but todetermine who participates more and who less.
7.1 Interpersonal TrustThe classic question on measuring trust is to ask, as we have, (IT1), “Now talking about thepeople from around here, would you say that the people of your community are very trustworthy,somewhat trustworthy, little trustworthy or not at all trustworthy.” The wording we have usedvaries from that used in some other surveys as we have introduced the word “community.” Thus,we are not asking about people in general, but people from the community.98 The result is thatthe trust levels we find in this survey are higher than those found in other surveys of LatinAmerica. This becomes clear from the results in Bolivia, where the question wording differedfrom the CAM/Colombia. As shown in Figure VII.1, Bolivia is far lower than the othercountries, but the question asked about “people in general” rather than people from thecommunity. It is of note that Costa Ricans, who enjoy the most well established democracy inLatin America also express the highest interpersonal trust levels.
Figure VII.1 Interpersonal Trust
Interpersonal trust
Bolivia 2002
Panamá
Nicaragua
Guatemala
Ecuador
México
Honduras
El Salvador
Dominican Republic
Colombia
Costa Rica
Mea
n In
terp
erso
nal t
rust
80
70
60
50
40
45
53
565757
58
63636364
71
98 Jr. Joseph Nye, "The Decline of Confidence in Government," in Why People Don't Trust Government, ed. Jr.
Joseph Nye (Cambridge: Harvard University Press, 1997); Marc J. Hetherington, "The Political Relevance ofPolitical Trust," American Political Science Review 92, no. 4 (1998):791-808.

The Political Culture of Democracy in Mexico, Central America, and Colombia, 2004 81
7.2 Levels of ParticipationThe survey contains a block of items to measure participation in civil society. In the survey wemeasured this participation in eight distinct types of organizations. We asked respondents if theyparticipated weekly, once or twice a month, once or twice a year or never. This format differsfrom those used in prior series of the LAPOP, where we used terms such as, “frequently,” “oncein a while,” “almost never” and “never” so the results are not directly comparable. The resultsshown in Figure VII.2 are for the entire sample, except Bolivia (which did not include thepolitical party question) and the Dominican Republic, which did not include the series. Theseresults show a familiar pattern, with the Church being by far the organization with the highestlevel of participation, and political parties and professional associations at the low end.
Figure VII.2 Civil Society Participation: All Countries Except Bolivia and the DominicanRepublic
Civil society participation:
all countries except Bolivia and the Dominican Republic
Political party
Professional Associa
Comm
unity developmen
School
Church
Mea
n
50
40
30
20
10
0
88
18
28
46
Gender roles help determine levels of participation in these countries, as is shown in FigureVII.3. Females are more active in church and school organizations, while males are more activein professional associations and political parties. These findings reflect the gender roles commonin Latin America. These patterns, however, vary from country-to-country, as is shown in theindividual reports produced as part of this study.

The Political Culture of Democracy in Mexico, Central America, and Colombia, 2004 82
Figure VII.3 Civil Society Participation by Gender
Civil society participation by gender
Political party
Professional Assoc.
Comm
unity develop.
School
Church
60%
50%
40%
30%
20%
10%
0%
Male
Female7
6
16
33
50
1010
2023
43
Another way to examine these same data is to recode them into those who participate at least tosome extent, and those who do not and then to aggregate these across all five organizations. Thisproduces the results shown in Figure VII.4. Guatemala and Honduras are far higher than theother countries in their levels of civil society participation. What can account for this?
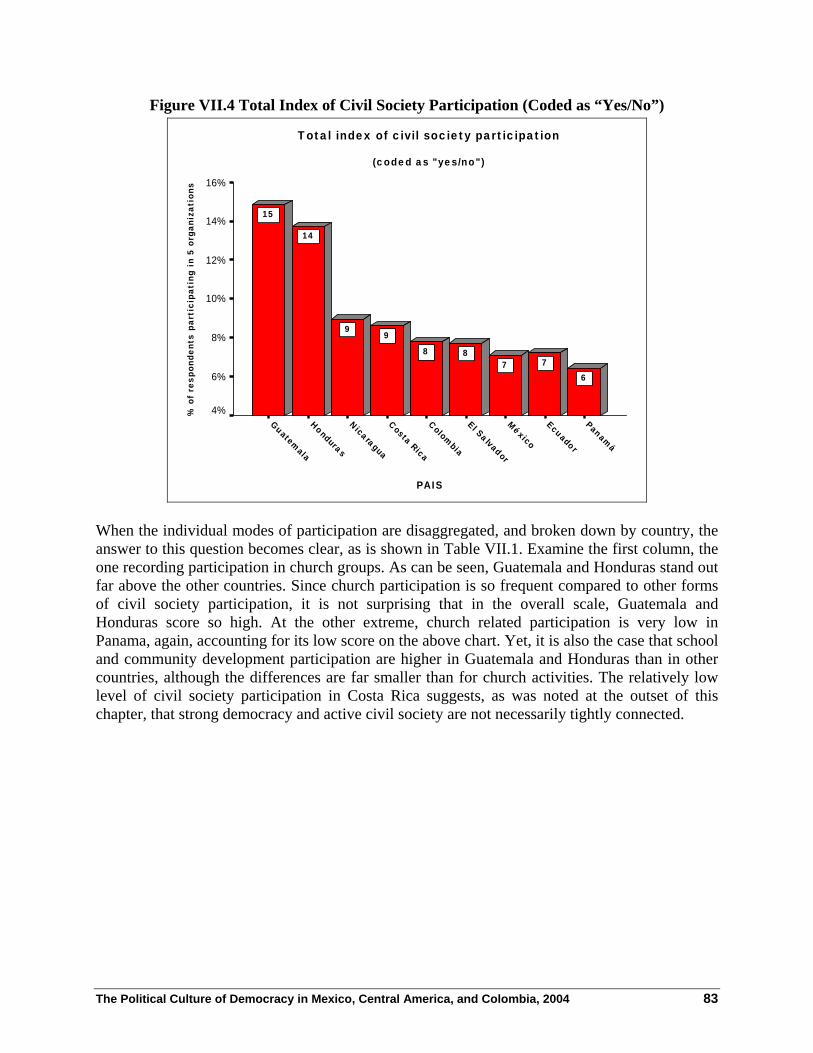
The Political Culture of Democracy in Mexico, Central America, and Colombia, 2004 83
Figure VII.4 Total Index of Civil Society Participation (Coded as “Yes/No”)
Total index of civil society participation
(coded as "yes/no")
PAIS
Panamá
Ecuador
México
El Salvador
Colombia
Costa Rica
Nicaragua
Honduras
Guatemala
% o
f re
spon
dent
s pa
rtic
ipat
ing
in 5
org
aniz
atio
ns16%
14%
12%
10%
8%
6%
4%
677
88
99
14
15
When the individual modes of participation are disaggregated, and broken down by country, theanswer to this question becomes clear, as is shown in Table VII.1. Examine the first column, theone recording participation in church groups. As can be seen, Guatemala and Honduras stand outfar above the other countries. Since church participation is so frequent compared to other formsof civil society participation, it is not surprising that in the overall scale, Guatemala andHonduras score so high. At the other extreme, church related participation is very low inPanama, again, accounting for its low score on the above chart. Yet, it is also the case that schooland community development participation are higher in Guatemala and Honduras than in othercountries, although the differences are far smaller than for church activities. The relatively lowlevel of civil society participation in Costa Rica suggests, as was noted at the outset of thischapter, that strong democracy and active civil society are not necessarily tightly connected.

The Political Culture of Democracy in Mexico, Central America, and Colombia, 2004 84
Table VII.1. Percent of Respondents Participating in Civil Society Organizations
CountryCP6RRRChurch
CP7RRRSchool
CP8RRRCommunityDevelopment
CP9RRRProfessionalAssociations
CP13RRRPolitical party
1 México 23 4 4 2 22 Guatemala 52 8 8 3 33 El Salvador 31 1 3 2 14 Honduras 53 7 6 2 25 Nicaragua 32 4 4 2 36 Costa Rica 36 3 3 2 17 Panamá 16 2 5 3 68 Colombia 32 2 2 2 19 Ecuador 26 4 4 3 1
7.3 ConclusionsThe study of social capital has grown into a major industry among social scientists. In thischapter, a comparative look has been take of social capital in the form of trust and civil societyparticipation. Notable differences among the countries emerge.

The Political Culture of Democracy in Mexico, Central America, and Colombia, 2004 85
Appendix: Questionnaire
Version # 7.3Lunes, 09 de Febrero de 2004 ; IRB approval # 040103, University of Pittsburgh
[Grey questions were optional for individual countries; for specialized items in individual countries seecountry reports]
Democracy Audit: Central American, Mexico and Colombia 2004
© Vanderbilt University, 2004. Derechos reservados. All rights reserved.Country: 1. México 2. Guatemala 3. El Salvador 4. Honduras 5. Nicaragua 6. CostaRica 7. Panamá 8. Colombia
PAIS
Interview number [assigned in office, not in field:______________ IDNUMProvincia: ____________________________________________________ PROVCantón: ____________________________________________________ CANTParroquia: ___________________________________________________ PAROQZona________________________________________________________ ZONASector_______________________________________________________ SECManzana (o Segmento) ___________________________________________ MANZEstrato: 1.Designed for each country ESTRATSize of place: 1. National capital (metropolitan area) 2. Large city3. Medium city 4. Small city 5. Rural area
TAMANO
UR: Zone 1. Urban 2. Rural URLanguage of questionnaire (1) Spanish (2) varies by country IDIOMAQ
Time begun: ______ : ______
Q1. Q1 Gender (1) Male (2) Female Q1
A4. In your opinion, what is the most serious problem facing the country.(01) Economic problems (02) Inflation, high prices(03)Unemployment (04)Poverty(05) Delinquency, crime, violence (06) Massive protests (strikes, road closing, etc.)(07) Lack of land for cultivation (08) Lack of credit(09) Enviromental problems (10) Drug addiction(11) Drug traffic (12) Corruption(13) Gangs (14) Lousy government(15) Migration (16) Anti-terrorism war
A4

The Political Culture of Democracy in Mexico, Central America, and Colombia, 2004 86
With what frequency do you Every day Once or twicea week Rarely Never DK
A1. Listen to news on theradio? (1) (2) (3) (4) (8) A1
A2. Watch news on TV? (1) (2) (3) (4) (8) A2A3. Read news in periodicals (1) (2) (3) (4) (8) A3A4. Via Internet (1) (2) (3) (4) (8) A4
SOCT1. In general how would you categorize the economic situation of the country?Would you say it is very good, good, average, bad, very bad or don’t know?(1) Very good (2) Good (3) Average (4) Bad (5) Very bad (6) Don’t know
SOCT1
SOCT3. Do you think that in the next 12 months the economic situation of the country will be better,the same or worse than it is now?(1) Better (2) Same (3) Worse (4) Don’t know
SOCT3
IDIO1. In general how would you categorize your own economic situation? Wouldyou say it is very good, good, average, bad, very bad or don’t know?(1) Very good (2) Good (3) Average (4) Bad (5) Very Bad (6) Don’t know
IDIO1
Now I am going to read some questions about the community and some problemsthat it faces.CP5 Have you ever worked or tried to resolve some community or neighborhoodproblem?(1) Yes [Continue with CP5A] (2) No [Go on to CP6] (3) Don’t know [Go on to CP6]
CP5
CP5A. Have you ever donated money or materials to help address a problem orhelp with an improvement?
(1)Yes
(2)No
(8)DK CP5A
CP5B. Have you given your own work or manual labor? (1)Yes
(2)No
(8)DK CP5B
CP5C. Have you been attending community meetings about any problemor some improvement?
(1)Yes
(2)No
(8)DK CP5C
CP5D. Have you tried to help organize any new group to solve a local problem or tofind a solution?
(1)Yes
(2)No
(8)DK CP5D
CP5E. Have you ever tried to organize a group to fight crime in your neighborhood? (1)Yes
(2)No
(8)DK CP5E
Now I am going to read to you a list of groups and organizations. Please tell me if you attend their meetings at leastonce a week, once or two times a month, once or twice a year or never.
Once aweek
Once or twice amonth
Once or twicea year
Never DK
CP6. Of any committee or association ofyour church or temple?
(1) (2) (3) (4) (8) CP6
CP7 Of a parent's group at school? (1) (2) (3) (4) (8) CP7CP8. Of a committee or group forcommunity improvement?
(1) (2) (3) (4) (8) CP8
CP9. Of an association of business ormanufacturing professionals?
(1) (2) (3) (4) (8) CP9
CP10. Of a union? (1) (2) (3) (4) (8) CP10
CP11. Of a cooperative? (1) (2) (3) (4) (8) CP11
CP12. Of any civic association? (1) (2) (3) (4) (8) CP12
CP13. Of a political party? (1) (2) (3) (4) (8) CP13

The Political Culture of Democracy in Mexico, Central America, and Colombia, 2004 87
PROT1. Have you ever participated in a public demonstration orprotest? Do you do it often, rarely or never?
(1)
Sometimes
(2)
Rarely
(3)
Never
(8)
DK
PROT1
Now, to change the subject, sometimes people and communities have problems that they can’t resolve on their ownand so they have to ask for the help of a government official or a government agency.Have you ever asked for help or cooperation to resolve a problem? (1) Yes [continuewith CP1] (2) No [go to LS3] (3) Don’t know [go to LS3 Yes No DK/DR
CP1. To the President of your country (1) (2) (8) CP1CP2. To a member of congress (1) (2) (8) CP2CP4. To a ministry, public office or government agency (1) (2) (8) CP4CP4A. To a local authority (Mayor, Municipality, or corregimiento in Panama’scase) (1) (2) (8) CP4A
LS3. To what extent are you satisfied with your life? Would you say you are(1)Very satisfied (2) somewhat satisfied (3) somewhat dissatisfied or (4)very dissatisfied(8) DK
LS3
IT1. Now, speaking in general terms of the people from here, would you say thatpeople in this neighborhood are generally(1) very trustworthy (2) somewhat trustworthy (3) not very trustworthy (4) untrustworthy (8) DK
IT1
IT2. Do you believe that in most instances people are only worried aboutthemselves or do you believe that in the most instance people try to helpothers?(1) They worry about themselves (2) They try to help others (3) Don’t know
IT2
IT3. Do you believe that the majority of people would try to take advantage ofyou if they had the opportunity, or do you believe they wouldn't take advantage?1) Yes, they would take advantage (2) No, they wouldn’t take advantage (3) Don’t know
IT3
Now let’s talk about your local municipality…
NP1. Within the past 12 months have you had the opportunity to attend aneighborhood meeting, a town council meeting or other meeting convened by themunicipality/mayor?(1)Yes (2) No (3) Don’t know/ don’t remember
NP1
NP1A. Have you attended a municipal session in the last 12 months?(1) Yes (2) No (3) Don’t know/ don’t remember
NP1A
NP1B. . To what point you think municipal officers listen to what is said in these meetings? Theylisten
(1) Very much (2) Average (3) A little (4) Nothing (5) Don’t know
NP1B
NP1C. If you had a complaint about a local problem and were to take it to a municipalityofficer, how much do you think he would listen to you(1) Very much (2) Average (3) A little (4) Nothing (5) Don’t know
NP1C
NP2. Have you sought help or presented a request to any office, official orcouncilman of the municipality within the past 12 months?(1) Yes (2) No (3) Don’t know/ don’t remember
NP2

The Political Culture of Democracy in Mexico, Central America, and Colombia, 2004 88
SGL1. Would you say that the services the Municipality is providing are(1) excellent (2) good (3) average (4) poor (5)awful (8) DK
SGL1
MUNI6. How much confidence do you have that the Mayor's office manages fundswell?(1) A lot of confidence (2) Some confidence (3) Little confidence (4) No confidence (5)Don’t know/ don’t remember
MUNI6
Some people say that, in certain circumstances, the military is justified in taking power. In your opinion, in whichof the following situations is it justified for the military to take power
JC1. When there is high unemployment (1) Justified (2) Unjustified (8)DK
JC1
JC4. When there are large social protests (1) Justified (2) Unjustified (8)DK
JC4
JC10 When there is high crime (1) Justified (2) Unjustified (8)DK
JC10
JC12. When there is high inflation with excessive priceincreases
(1) Justified (2) Unjustified (8)DK
JC12
JC13. When there is great corruption (1) Justified (2) Unjustified (8)DK
JC13
JC13A. Do you believe that there can be reason enoughfor a coup or that no reason is enough to justify that?
(1) There couldbe a reason
(2) There’s noreason enough
(8)DK JC13A
GBMIL1. Some people say that we would be better off ifthe country were governedin a different form. Some say that the military shouldgovern, while otherssay that only a civil government should rule. What do youthink?
(1) Military (2) Civilgovernment
(8)DK
GBMIL1
VIC1. Have you been a victim of physical violence or of some crime in the past12 months?(1) Yes [continue with VIC2] (2) No [go to ST1] (3) DK
VIC1
VIC2. What type of crime did you experience? [don’t read the alternatives](1) Robbery without physical threat or aggression (2) Robbery with physical threat or aggression(3) Physical aggression without robbery(4) Rape or sexual assault (5) Kidnapping (6) Damage to property (7) House robberySomething else (Specify) ___________________________________________________
VIC2
AOJ1. If you've been a crime victim, did you report it to any authority?(1) Yes [continue to AOJ1] (2) No [go to AOJ1B] (3) Don’t know/ don’t remember(4) Inappropriate
AOJ1
AOJ1A. To what agency or institution did you report the crime?1) Public prosecutor (2) Police (3) Courts (6) Press or other: ______________________(7) Don’t know (9) Inappropriate
AOJ1A
AOJ1B. Why didn't you report the crime?(1) It makes no difference (2) Danger or fear of retaliation (3) Lack of evidence(4) It wasn’t serious (5) Didn’t know where to report it (6) Don’t know (7) Inappropriate
AOJ1B
Alter using their services of the following institutions, are you very satisfied, somewhat satisfied, somewhatunsatisfied or very unsatisfied?(Repeat the alternatives in every question)
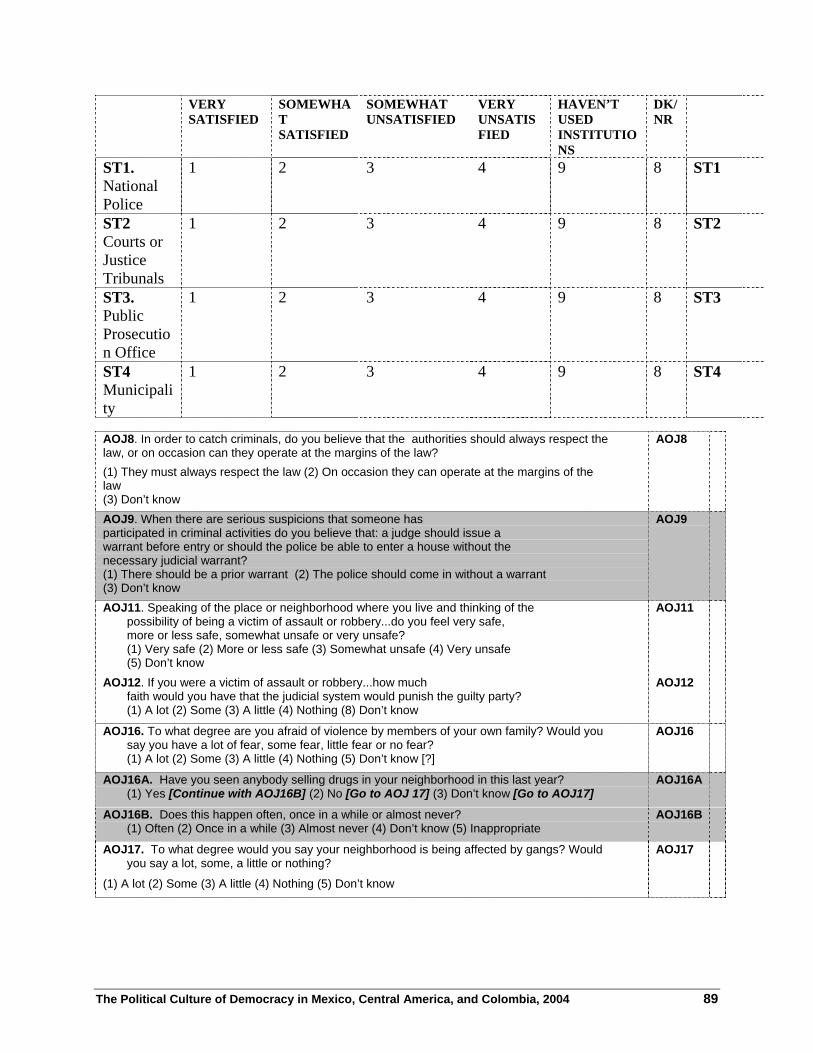
The Political Culture of Democracy in Mexico, Central America, and Colombia, 2004 89
VERYSATISFIED
SOMEWHATSATISFIED
SOMEWHATUNSATISFIED
VERYUNSATISFIED
HAVEN’TUSEDINSTITUTIONS
DK/NR
ST1.NationalPolice
1 2 3 4 9 8 ST1
ST2Courts orJusticeTribunals
1 2 3 4 9 8 ST2
ST3.PublicProsecution Office
1 2 3 4 9 8 ST3
ST4Municipality
1 2 3 4 9 8 ST4
AOJ8. In order to catch criminals, do you believe that the authorities should always respect thelaw, or on occasion can they operate at the margins of the law?(1) They must always respect the law (2) On occasion they can operate at the margins of thelaw(3) Don’t know
AOJ8
AOJ9. When there are serious suspicions that someone hasparticipated in criminal activities do you believe that: a judge should issue awarrant before entry or should the police be able to enter a house without thenecessary judicial warrant?(1) There should be a prior warrant (2) The police should come in without a warrant(3) Don’t know
AOJ9
AOJ11. Speaking of the place or neighborhood where you live and thinking of thepossibility of being a victim of assault or robbery...do you feel very safe,more or less safe, somewhat unsafe or very unsafe?(1) Very safe (2) More or less safe (3) Somewhat unsafe (4) Very unsafe(5) Don’t know
AOJ11
AOJ12. If you were a victim of assault or robbery...how muchfaith would you have that the judicial system would punish the guilty party?(1) A lot (2) Some (3) A little (4) Nothing (8) Don’t know
AOJ12
AOJ16. To what degree are you afraid of violence by members of your own family? Would yousay you have a lot of fear, some fear, little fear or no fear?(1) A lot (2) Some (3) A little (4) Nothing (5) Don’t know [?]
AOJ16
AOJ16A. Have you seen anybody selling drugs in your neighborhood in this last year?(1) Yes [Continue with AOJ16B] (2) No [Go to AOJ 17] (3) Don’t know [Go to AOJ17]
AOJ16A
AOJ16B. Does this happen often, once in a while or almost never?(1) Often (2) Once in a while (3) Almost never (4) Don’t know (5) Inappropriate
AOJ16B
AOJ17. To what degree would you say your neighborhood is being affected by gangs? Wouldyou say a lot, some, a little or nothing?
(1) A lot (2) Some (3) A little (4) Nothing (5) Don’t know
AOJ17
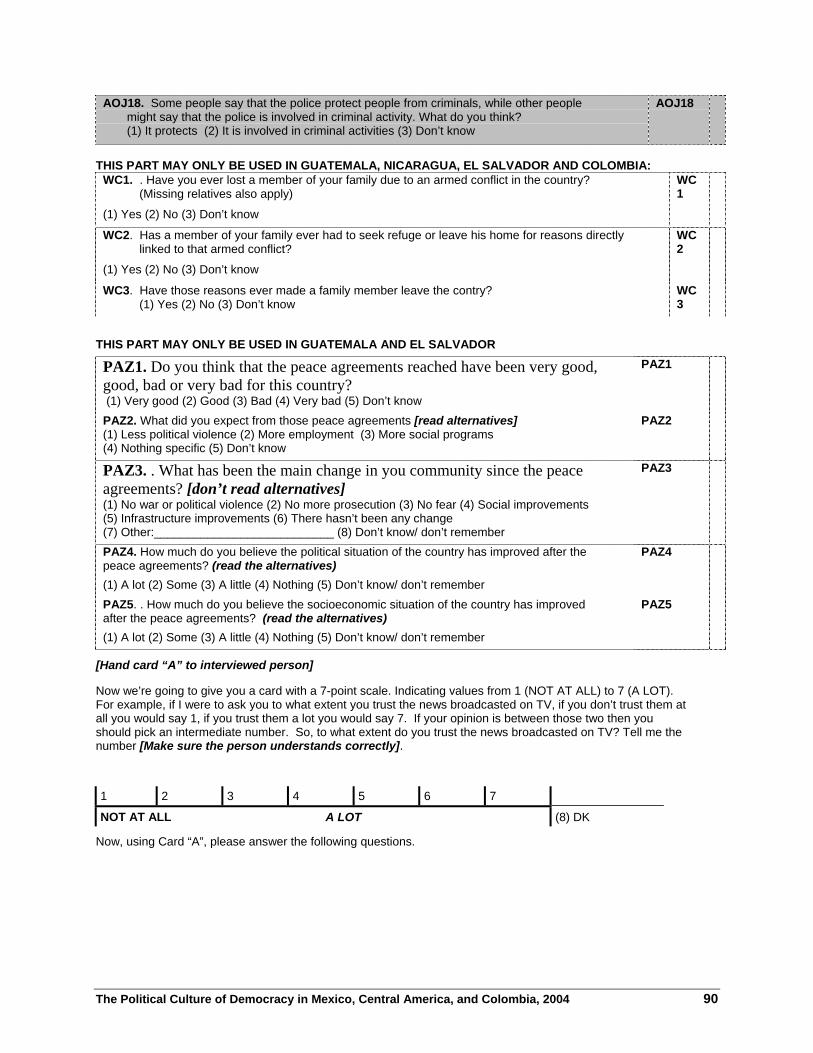
The Political Culture of Democracy in Mexico, Central America, and Colombia, 2004 90
AOJ18. Some people say that the police protect people from criminals, while other peoplemight say that the police is involved in criminal activity. What do you think?(1) It protects (2) It is involved in criminal activities (3) Don’t know
AOJ18
THIS PART MAY ONLY BE USED IN GUATEMALA, NICARAGUA, EL SALVADOR AND COLOMBIA:WC1. . Have you ever lost a member of your family due to an armed conflict in the country?
(Missing relatives also apply)
(1) Yes (2) No (3) Don’t know
WC1
WC2. Has a member of your family ever had to seek refuge or leave his home for reasons directlylinked to that armed conflict?
(1) Yes (2) No (3) Don’t know
WC2
WC3. Have those reasons ever made a family member leave the contry?(1) Yes (2) No (3) Don’t know
WC3
THIS PART MAY ONLY BE USED IN GUATEMALA AND EL SALVADOR
PAZ1. Do you think that the peace agreements reached have been very good,good, bad or very bad for this country? (1) Very good (2) Good (3) Bad (4) Very bad (5) Don’t know
PAZ1
PAZ2. What did you expect from those peace agreements [read alternatives](1) Less political violence (2) More employment (3) More social programs(4) Nothing specific (5) Don’t know
PAZ2
PAZ3. . What has been the main change in you community since the peaceagreements? [don’t read alternatives](1) No war or political violence (2) No more prosecution (3) No fear (4) Social improvements(5) Infrastructure improvements (6) There hasn’t been any change(7) Other:___________________________ (8) Don’t know/ don’t remember
PAZ3
PAZ4. How much do you believe the political situation of the country has improved after thepeace agreements? (read the alternatives)(1) A lot (2) Some (3) A little (4) Nothing (5) Don’t know/ don’t remember
PAZ4
PAZ5. . How much do you believe the socioeconomic situation of the country has improvedafter the peace agreements? (read the alternatives)(1) A lot (2) Some (3) A little (4) Nothing (5) Don’t know/ don’t remember
PAZ5
[Hand card “A” to interviewed person]
Now we’re going to give you a card with a 7-point scale. Indicating values from 1 (NOT AT ALL) to 7 (A LOT).For example, if I were to ask you to what extent you trust the news broadcasted on TV, if you don’t trust them atall you would say 1, if you trust them a lot you would say 7. If your opinion is between those two then youshould pick an intermediate number. So, to what extent do you trust the news broadcasted on TV? Tell me thenumber [Make sure the person understands correctly].
1 2 3 4 5 6 7
NOT AT ALL A LOT (8) DK
Now, using Card “A”, please answer the following questions.

The Political Culture of Democracy in Mexico, Central America, and Colombia, 2004 91
B1. To what extent do you believe the courts of justice in Guatemala guarantee afair trial? If you believe that courts guarantee no justice, pick number1; if you believethat courts do guarantee justice pick number 7 or a number in between.
B1
B2. To what extent do you respect the political institutions in Guatemala? B2
B3. To what extent do you believe that basic citizen rights are well protectedby the Guatemalan political system? B3
B4. To what extent are you proud to live under the Salvadoran political system? B4
B6. To what extent do you think one should support the Guatemalan politicalsystem? B6
B10A. To what extent do you trust the justice system? B10A
B11. To what extent do you trust the Supreme Electoral Tribunal? B11
B12. To what extent do you trust the Armed Forces? [Eliminate for Panama and CostaRica] B12
B13. To what extent do you trust the National Congress? B13
B14. To what extent do you trust the Central Government? B14
B15. To what extent do you trust the Budget Office of the Republic? B15
B16. To what extent do you trust the Attorney General of the Republic? B16
B17. To what extent do you have trust in the Defenders General? B17
B18. To what extent do you trust the Police? B18
B19. To what extent do you trust the Audit Office? B19
B20. To what extent do you trust the Catholic Church? B20
B21. To what extent do you trust the political parties? B21
B31. To what extent do you trust the Supreme Court? B31
B32. To what extent do you trust the Mayor's office of your municipality? B32
B37. To what extent do you trust the media? B37
B40. To what extent do you trust indigenous movements? B40
B43. To what extent are you proud to be Guatemalan? [change identity with everycountry]? B43
B44. To what extent do you trust the Constitutional Tribunal? B44
B45. To what extent do you trust the Anti-corruption Commission? B45
B46. To what extent do you trust the Anti-corruption National Council? B46
B47. To what extent do you trust elections? B47
B48. To what extent do you believe Free Trade Agreements will help to improve nationaleconomy?” B48

The Political Culture of Democracy in Mexico, Central America, and Colombia, 2004 92
[DO NOT GATHER CARD “A”]
1 2 3 4 5 6 7
NOT AT ALL A LOT (8) DKNow, using in this same scale, to what extent would you say that the currentgovernment [CADA PAIS INSERTAR EL NOMBRE DEL PRESIDENTE]
N1. Combats poverty
Write
1-7,8 =DK
N1
N3. Promotes and protects democratic principles N3N9. Combats government corruption N9 [Gather Card "A"]
[Hand interviewed card "B"]
Now we’re going to use a similar card where one represents “strongly disagree” and seven represents “stronglyagree”. I will read you several statements and I want you to tell me to what extent you agree or disagree withthem.
1 2 3 4 5 6 7Strongly disagree Strongly agree
(8) DK
Write1-7,DK=8
ING2. In democratic countries there is always conflict and it is difficult tomake decisions. To what extent do you agree or disagree?
ING2
ING4. Democracy may have its problems, but it is better than any other form ofgovernment. To what extent do you agree or disagree?
ING4
PN2. Despite our differences, as Guatemalans we have many values that unite us. To what extent do you agree or disagree?
PN2
PN2A. Politicians seek power for their own benefit and don’t worry about helping people.To what extent do you agree or disagree?
PN2A
[GATHER CARD B]
[Hand interviewed Card "C"]
Now I’m going to read you a list of some actions individuals can do to achieve their political goals and objectives.I’d like you to tell me how firmly you approve or disapprove of the following scenarios:
(01) (02) (03) (04) (05) (06) (07) (08) (09) (10) (88)Firmly Disapprove Firmly Approve DK
Write1-10,88 DK
E5. E5 That people participate in legal demonstrations? E5
E8. That people participate in an organization or group to try to solvecommunity problems. E8

The Political Culture of Democracy in Mexico, Central America, and Colombia, 2004 93
E11. That people work on electoral campaigns for a political party or candidate. E11
E15. That people participate in the blocking or closing of roads. E15
E14. That people trespass on private property. E14
E2. That people take control of factories, offices, and other buildings. E2
E3. That people participate in a group wanting to remove an elected governmentby violent means. E3
E16. That people take justice into their own hands when the state doesn’t punishcriminals. E16
[Do not gather card "C"]
Now we are going to discuss actions that the government can take. We will continue using the scale from 1 to ten,where 1 indicates strongly disapproval and 10 indicates strongly approval.
(01) (02) (03) (04) (05) (06) (07) (08) (09) (10) (88)Strongly disapproves Strongly approves DK
Write
1-10,88=DK
D32. What would you think of a law prohibiting public protest? D32
D33. What would you think of a law prohibiting meetings of any group critical ofthe Guatemalan political system?
D33
D34. What would you think if the government censured television programming D34
D36. What would you think if the government censured library books from thepublic schools?
D36
D37. What would you think if the government censured the propaganda of thosepeople critical of our country?
D37
The following questions are meant to find out your opinion about the ideas of the Guatemalan people. We willcontinue to use the scale from 1 to 10.
(01) (02) (03) (04) (05) (06) (07) (08) (09) (10) (88)Strongly disapproves Strongly approves DK
Write
1-10,
DK=88
D1. There are people who speak negatively of the Guatemalan form of government.How strongly do you approve or disapprove of these people’s right to vote? D1
D2. How strongly do you approve or disapprove that these people be allowed toconduct peaceful demonstrations in order to express their points of view? Please read thenumber to me.
D2
D3. How strongly do you approve or disapprove that people who never agree withthe Guatemalan government be permitted to seek public office? D3

The Political Culture of Democracy in Mexico, Central America, and Colombia, 2004 94
Write
1-10,
DK=88
D4. How strongly do you approve or disapprove of these people going ontelevision to make speeches? D4
D5. Now, thinking about homosexuals, how strongly do you approve or disapprovethat they be allowed to seek public office? D5
D6. How strongly do you approve or disapprove of homosexuals going on televisionto make speeches? D6
[Gather card “c”]
Do you think this country has: (1) Too little (2) Enough (3) Too much
LIB1. . Freedom of Press (1) Too little (2) Enough (3) Too much (4) Don’t know LIB1LIB2. Freedom of opinion (1) Too Little (2) Enough (3) Too much (4) Don’t know LIB2LIB3. Political participation (1) Too little (2) Enough (3) Too much (4) Don’t know LIB3LIB4. . Human rights protection (1) Too little (2) Enough (3) Too much(4) Don’t know LIB4
ACR1. Now I'm going to read you three phrases. Please tell me which of the threebest describes your opinion:1) The way in which our society is organized should be completely and radically changed byrevolutionary means.2) Our society should be gradually perfected or improved through reform.3) Our society should be courageously defended from revolutionary movements.8) DK
ACR1
PN4. In general, would you say you are very satisfied, satisfied, unsatisfied or very unsatisfied with the waydemocracy works in Guatemala?(1) Very satisfied (2) Satisfied (3) Unsatisfied (4) Very unsatisfied (5) Don’t know
PN4
PN5. . In your opinion, is Guatemala very democratic, somewhat democratic, a little democratic orundemocratic?(1) Very democratic (2) Somewhat democratic (3) A little democratic (4) Undemocratic (5) Don’t know
PN5
PN6. Based on your experience from the last few years. Has Guatemala become more democratic,has it stayed the same or is it less democratic?(1) Very democratic (2) The same (3) Less democratic (4) Don’t know
PN6
DEM13. What does democracy mean for you, in a few words? [Don’t read alternatives][Write just one answer](1) Freedom (2) Equality (3) Well-being and economic progress (4) Capitalism(5) Non-military government (6) Free Trade, Free Market (7) Elections, voting rights (8) Right tochoose our leaders (9) Corruption (10) Participation (11) Rule of the people (12) Obeying the law(13) Other: ___________________________________________________(14) Don’t know
DEM13

The Political Culture of Democracy in Mexico, Central America, and Colombia, 2004 95
DEM2. With which of the following phrases are you in most agreement:1) For people like me, it doesn’t matter whether a regime is democratic or non-democratic.2) Democracy is preferable to any other type of government.3)Under some circumstances an authoritarian government can be preferable to a democraticone.8) Don’t know
DEM2
DEM6. With which of the following phrases do you most agree:[1] In general, despite its problems, democracy is the best form of government.[2] There are other forms of government that can be just as good or even better than democracy. [3] don’t know
DEM6
DEM11. Do you believe that our country needs a government with a firm hand, orthat problems can be resolved with everyone's participation?(1) Firm hand (2) Everyone’s participation (8) don’t know
DEM11
AUT1On some occasions, democracy doesn't work. When that happens there arepeople that say we need a strong leader who doesn't have to be elected throughvoting. Others say that even if things don't function, democracy is always thebest. What do you think?(1) We need a strong leader that doesn’t have to be elected(2) Democracy is always the best way(8) Don’t know
AUT1
[OPTIONAL, EXCEPTO EN GUATEMALA, EL SALVADOR, HONDURAS]AUT2 Our present system of government isn't the only one our country has had. Some people
think that it would be better for us if our country was governed in a different way. In youropinion, what type of government should we have?(1) Return of a military government (2) What we have now (8) Don’t know
AUT2
PP1 During elections, some people try to convince others to vote for one partyor candidate. How often have you tried to convince others on which party tovote?(1) Frequently (2) Once in a while (3) Rarely (4) Never (5) Don’t know
PP1
PP2. There are people who work for a party or candidate during electoralcampaigns. Did you work for any candidate or party in the last presidentialelections of March, 1998?(1) Yes (2) No (5) Don’t know
PP2
ABS5. Do you think that voting can lead to improvement in the future or do youbelieve that no matter how one votes, things never change?(1) Vote can change things (2) Things are not going to get better (3) Don’t know
ABS5
M1. Speaking generally of the current government would you say that the job thecurrent president is doing is very good, good, average, bad, very bad.(1) Very good (2) Good (3) Average (4) Bad (5) Very bad (6) Don’t know
M1

The Political Culture of Democracy in Mexico, Central America, and Colombia, 2004 96
Do you think the following actions are:(1) Corrupted and must be punished (2) Corrupted but justifiable under the circumstances (3) Not corrupted DC1. For example: A congressman takes a 10,000 dollar bribe from a company, that action is:(1) corrupted and must be punished(2) corrupted but justifiable(3) Not corrupted(4) Don’t know
DC1
DC10. A mother with several children has to get a birth certificate for one of them. To save some time,she pays 20 extra Quetzales to an employee. What the lady did was:(1)Corrupted and must be punished(2) Corrupted but justifiable (3) Not corrupted(4) Don’t know
DC10
DC13. An unemployed person’s brother in law is an important politician and he uses his position to getthe man a job. Do you think this is:1) Corrupted and must be punished2) Corrupted but justifiable3) Not corrupted(4) Don’t know
DC13
Now we want to talk about your personal experiences on things that happen inlife. No Yes NS INAPEXC1. Have you been accused within the past two years by a police officer forany infraction which you did not commit? (0) (1) (8) EXC1
EXC2. Did any agent of the police ask you for a bribe during the last year? (0) (1) (8) EXC2
EXC4. Have you seen anyone paying a bribe to a policeman during the pastyear? (0) (1) (8) EXC4
EXC5. Have you seen anyone paying a bribe to a public employee during the lastyear? (0) (1) (8) EXC5
EXC6. Has any public employee asked you for a bribe during the past year? (0) (1) (8) EXC6
EXC11. Have you conducted any diligences in the municipality this last year? [Ifno, put 9 if yes ask next question]To conduct business in the municipality (such as to get a license, for instance)during the past year, have you had to pay additional money above what isrequired by the law?
(0) (1) (8) (9) EXC11
EXC13. Do you work? [If no put 9, if yes ask the next question]In your work, have you been asked for an inappropriate payment within the pastyear?
(0) (1) (8)(9)
EXC13
EXC14. In the last year have you had dealings with the court system? [If no put9, if yes ask the next question]Have you had to pay a bribe in the courts during the past year?
(0) (1) (8)(9)
EXC14
EXC15. Have you used public medical services in the last year? To be attendedin a hospital or other health facility have you had to pay fees above what isstipulated by law? [If no put 9, if yes ask the next question]?
(0) (1) (8) (9) EXC15
EXC16. Have you had children enrolled in school during the last year? [If no put9, if yes ask the next question] At school have you been asked for a paymentabove that required by law.
(0) (1) (8)(9)
EXC16
EXC17. Has anyone asked you for a bribe to avoid paying your electric bill? (0) (1) (8) EXC17
EXC19. Do you believe that it is justifiable to pay bribes because of the badquality of administrative services in our countries? (0) (1) (8) EXC18

The Political Culture of Democracy in Mexico, Central America, and Colombia, 2004 97
EXC7. Taking into account your experience or what you have heard, is corruptionamong public officials very common, common, not very common, or uncommon?(1) Very common (2) Common (3) Not very common (4) Uncommon (5) Don’t know
EXC7
[Now we’ll use Card “D”] Hand interviewed card “D”
I am going to name various public and private institutions. I am interested to know the degree to which you thinkthat the representatives of these institutions are honest or corrupt. I will ask you to grade each one from 1 to 10.1 being corrupted and 10 being honest.
Degree of corruptionINSTITUTIONS Very Corrupt Very Honest DK
PC1. Delegates (1) (2) (3) (4) (5) (6) (7) (8) (9) (10) (88) PC1
PC2. Ministers (1) (2) (3) (4) (5) (6) (7) (8) (9) (10) (88) PC2
PC3. Mayors (1) (2) (3) (4) (5) (6) (7) (8) (9) (10) (88) PC3
PC4. Municipal Councilmen (1) (2) (3) (4) (5) (6) (7) (8) (9) (10) (88) PC4
PC5. Policemen (1) (2) (3) (4) (5) (6) (7) (8) (9) (10) (88) PC5
PC8. University Professors (1) (2) (3) (4) (5) (6) (7) (8) (9) (10) (88) PC8
PC9. Priests, clerics or pastors (1) (2) (3) (4) (5) (6) (7) (8) (9) (10) (88) PC9
PC12. Judges (1) (2) (3) (4) (5) (6) (7) (8) (9) (10) (88) PC12
PC13. Military (1) (2) (3) (4) (5) (6) (7) (8) (9) (10) (88) PC14
PC14. Political party leaders (1) (2) (3) (4) (5) (6) (7) (8) (9) (10) (88) PC14
PC15. NGO’s leaders (1) (2) (3) (4) (5) (6) (7) (8) (9) (10) (88) PC15
PC19. Media (1) (2) (3) (4) (5) (6) (7) (8) (9) (10) (88) PC19
PC21. Presidents (1) (2) (3) (4) (5) (6) (7) (8) (9) (10) (88) PC21
Gather Card D
Now can you tell meGI1 Do you remember the name of the current President of the United States?
(George Bush) [Don’t read, George W. Bush; accept “Bush” or “George Bush”](1) Right (2) Wrong (don’t know)
GI1
GI3. Do you remember how many provinces Guatemala has? (22) [Don’t read, 22](1) Right (2) Wrong (Don’t know)
GI3
GI4. How long is the Presidential term in Guatemala? (four years) [do not read 4 years](1) Right (2) Wrong (Don’t know)
GI4
GI5. Do you remember the name of Brazil’s President? (Lula Da Silva) [do not read,Luis Ignacio Lula da Silva; accept “Lula” ]
(1) Right (2) Wrong (don’t know)
GI5
L1. Show Card “E”: Now, for a subject change. In this card there’s a one to ten scale that goes from left toright. Today, when people talk about politics they mention left wingers and right wingers, referring to peoplethat sympathize with the left or the right. According to your sense of “left” and “right” in politics, where wouldyou place yourself in this scale?

The Political Culture of Democracy in Mexico, Central America, and Colombia, 2004 98
1 2 3 4 5 6 7 8 9 10Left Right
L1
(DK=8)
If you decided to participate in one of the activities I’m going to mention, wouldyou do it with no fear, some fear or a lot of fear? [READ THE LIST, ANDREPEAT THE QUESTION IF NECESARY]
NOFEAR
SOMEFEAR
A LOTOF FEAR DK
DER1. Participate to resolve problems in your community? 1 2 3 8DER1
DER2. Voting in a national election? 1 2 3 8 DER2DER3. . Participate in a peaceful demonstration? 1 2 3 8 DER3DER4. Run for a public office? 1 2 3 8 DER4
VB1. Are you registered?
(1) Yes (2) No (3) In process (4) Don’t know
VB1
VB2. Did you vote in the last Presidential elections of 2002?
(1) Yes [continue] (2) No [go to VB4] (3) Don’t know
VB2
VB3. For which party did you vote on the first round of the 2003 Presidential Elections? [If not, goon to GVB4, if yes continue]
(1)list candidates (2)Other:___________________________________(3) Null vote/blank vote
(5)DK
VB3
VB4. If you didn’t vote, why didn’t you? [write down only one answer](01) Lack of transport (02) Sickness (03) Lack of interest (04) Didn’t like any of the candidates (05)Don’t believe in the system (06) Lack of ID document (07) Didn’t find self in Register (10) Not inrequired ages (11) I was late/ it was closed (12) Had to work(13) Other: __________________________________________________
VB4
VB5. Did you vote on the last elections for mayor and congress?(1) Yes [continue] (2) No [go to VB6] (3) Don’t know
VB5
VB6. For which party did you vote in the 2003 elections for city mayor?(1) Other: ______________________________(2) Null vote/ blank vote(3) Don’t know 99. Inap (No vote)
VB6
VB7. . Which party did you vote for in the 2003 elections for Provincial and National Delegatesto Congress?
(1)
(2) Other: ______________________________
(3) Various candidates _____________________________
(4) Null vote/ blank vote
(5) Don’t know
VB7

The Political Culture of Democracy in Mexico, Central America, and Colombia, 2004 99
I would like to know your opinion on the next electoral reforms, which is a very common topic these days. We’lluse Card “c” again for this one. [Hand interviewed card “C”].
(01) (02) (03) (04) (05) (06) (07) (08) (09) (10) (88)Firmly disapproves Firmly approves DK
EREF1. To what extent do you approve or disapprove a raise of the minimum quota ofwomen in congress? [read the number]]
EREF1
EREF2. To what extent do you approve or disapprove the reconfiguration of electoraldistricts so that you can elect one delegate per district and not a bunch of delegatesfrom a party?
EREF2
EREF3. Giving delegates the right to finance public works and other public services intheir districts. To what extent would you approve or disapprove?
EREF3
Before we finish I’m going to ask you some questions for statistical purposes.
ED. What was the last year of school you completed?[Interviewer Fill in:] ___________________ (grade school, high school, college) = ________ total years [Use chartbelow to write the corresponding code]
None= 00 First yearof….
Second yearof...
Third yearof…
Fourth yearof.. .
Fifth yearof…
Sixth year…
GradeSchool (01) (02) (03) (04) (05) (06)
HighSchool (07) (08) (09) (10) (11) (12)
College (13) (14) (15) (16) (17) (18) ormore
DK (88)
ED|____|____|
Q2. What is your age in completed years? _____ yearsQ2 |___|___|
Q3. What is your religion?(1) Catholic (2) Christian not catholic (3) Another not Christian (4) None (5) Don’tknow
Q3
Q4 How many times have you been to church (temple) in the last month?(1)Every week (2) Once in a while (3) Rarely (4) NeverQ10 Into which of the following ranges does your monthly income fall?
Q4
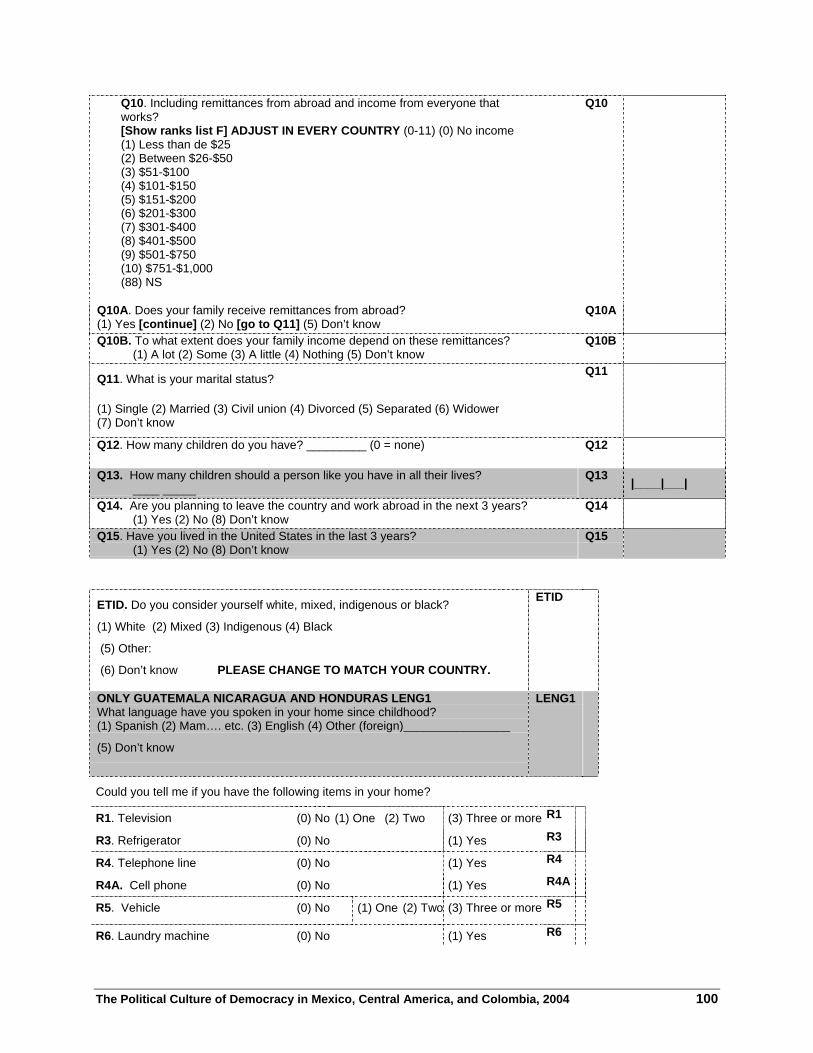
The Political Culture of Democracy in Mexico, Central America, and Colombia, 2004 100
Q10. Including remittances from abroad and income from everyone thatworks?[Show ranks list F] ADJUST IN EVERY COUNTRY (0-11) (0) No income(1) Less than de $25(2) Between $26-$50(3) $51-$100(4) $101-$150(5) $151-$200(6) $201-$300(7) $301-$400(8) $401-$500(9) $501-$750(10) $751-$1,000(88) NS
Q10
Q10A. Does your family receive remittances from abroad?(1) Yes [continue] (2) No [go to Q11] (5) Don’t know
Q10A
Q10B. To what extent does your family income depend on these remittances?(1) A lot (2) Some (3) A little (4) Nothing (5) Don’t know
Q10B
Q11. What is your marital status?
(1) Single (2) Married (3) Civil union (4) Divorced (5) Separated (6) Widower(7) Don’t know
Q11
Q12. How many children do you have? _________ (0 = none) Q12
Q13. How many children should a person like you have in all their lives?____ _____
Q13 |____|___|
Q14. Are you planning to leave the country and work abroad in the next 3 years?(1) Yes (2) No (8) Don’t know
Q14
Q15. Have you lived in the United States in the last 3 years?(1) Yes (2) No (8) Don’t know
Q15
ETID. Do you consider yourself white, mixed, indigenous or black?
(1) White (2) Mixed (3) Indigenous (4) Black
(5) Other:
(6) Don’t know PLEASE CHANGE TO MATCH YOUR COUNTRY.
ETID
ONLY GUATEMALA NICARAGUA AND HONDURAS LENG1What language have you spoken in your home since childhood?(1) Spanish (2) Mam…. etc. (3) English (4) Other (foreign)________________
(5) Don’t know
LENG1
Could you tell me if you have the following items in your home?
R1. Television (0) No (1) One (2) Two (3) Three or more R1
R3. Refrigerator (0) No (1) Yes R3
R4. Telephone line (0) No (1) Yes R4
R4A. Cell phone (0) No (1) Yes R4A
R5. Vehicle (0) No (1) One (2) Two (3) Three or more R5
R6. Laundry machine (0) No (1) Yes R6

The Political Culture of Democracy in Mexico, Central America, and Colombia, 2004 101
R7. Microwave (0) No (1) Yes R7
R12. Running water inside the house (0) No (1) Yes R12
R14. Bathroom inside the house (0) No (1) Yes R14
R15. Computer (0) No (1) Yes R15
OCUP1What is your occupation?1. Professional, executive2. Office work3. Salesman4. Peasant5. Agriculture rural worker6. Domestic Service7. Other services10. Specialized Laborer11. Non specialized laborer12. Student13. House wife14. Retired15. Don’t know
OCUP1
OCUP1A In this position you are:1. Paid by the government?2. Paid by the private sector?3.Employer or partner in a company with less than 5 employees?4.Employer or partner in a company with 5 or more employees?5.Self employed?6. Work without payment8. Don’t know
OCUP1A
DESOC1. DESOC1 Have you been unemployed during the last year?(1)Yes (2) No [go to T1] (3) Currently unemployed/ retired
DESOC1
Time of interview’s end ___ : ______
TI. Interview’s length [minutes, see page # 1] _____________
TI
These are all the questions I have. Thank you very much for your cooperation.
I swear this survey was conducted on an appropriate person.
Interviewers Signature________________ Date_ /_____ /04 Field supervisor’s signature_________________
Codifier’s signature____________________
Comments:_________________________________________________________________________________________________________________________________________________________________________________________
Signature of the person who input the data_________________________________
Signature of the person who verified the data_____________________________

The Political Culture of Democracy in Mexico, Central America, and Colombia, 2004 102
Card “A”
A Lot 7
6
5
4
3
2
Not at all 1

The Political Culture of Democracy in Mexico, Central America, and Colombia, 2004 103
Card “B”
StronglyAgree 7
6
5
4
3
2
StronglyDisagree
1

The Political Culture of Democracy in Mexico, Central America, and Colombia, 2004 104
Card “C”
Firmly Approves10
9
8
7
6
5
4
3
2Firmly
Disapproves 1

The Political Culture of Democracy in Mexico, Central America, and Colombia, 2004 105
Card “D”
Very honest 10
9
8
7
6
5
4
3
2
Very corrupt 1
The Political Culture of Democracy in Mexico, Central America, and Colombia, 2004 106
Card “E”
1 2 3 4 5 6 7 8 9 10Left Right

The Political Culture of Democracy in Mexico, Central America, and Colombia, 2004 107
Card “F” (card changes for each country)
This family’s monthly income:
(00) No income(01) Less than $25(02) Between $26- $50(03) $51-$100(04) $101-$150(05) $151-$200(06) $201-$300(07) $301-$400(08) $401-500(09) $501-$750(10) $751-$1,000


![ANTHONY GALLUP, O.P. I]](https://img.pdfslide.us/doc/110x75/61b021bdd2fb0a7d1723e8f4/anthony-gallup-op-i.jpg)