Embed Size (px)
Citation preview
This is a brief overview of some interesting aspects of the WESM
A separate paper is available covering additional issues
1

The Philippine WESM
• Competitive wholesale spot market / over 5 years of operating history (since June 2006)
• Over 70% of assets and dispatch rights privatised
• Historical power purchase agreements honoured
• Energy-only market -- no formal capacity payments
• Independent regulation through ERC
• Retail competition scheduled to evolve from December 2011
• Recent expansion of WESM to include the Visayas (Dec 2010)
• And more is planned
– Ancillary services market
– Independent Market Operator
• And more is needed
2

Oil
Natural Gas
Coal
Geothermal
Hydro
• Local hydro and geothermal
• Locally developed, internationally priced
natural gas
• Some indigenous coal, but mostly imported
• Fuel is essentially at global market prices
– Maybe LNG in the future
– Coal is the currently growing generation source
• Renewables feed-in tariff
– But impact on total quantity unclear
3
Luzon fuel mix

Private sector, no industry subsidies
Power Plant
Rated
Capacity
(MW)
Winning Bidder Winning Price
(US$ million)
US$M/
MW
Pantabangan-Masiway 112.0 First Gen Hydropower 129.0 1.15
Magat Hydroelectric 360.0 SN Aboitiz Power 530.0 1.47
Masinloc 600.0 Masinloc Power Partners
Co. Ltd. 930.0 1.55
Ambuklao-Binga 175.0 SN Aboitiz Power 325.0 1.86
Tiwi-MakBan Geothermal 747.5 AP Renewables. 446.9 0.60
Batangas (Calaca) 600.0 DMCI Holdings,. 361.7 0.60
Palinpinon-Tongonan 305.0 Green Core Geothermal 220.0 0.72
Angat Hydro Electric * 218.0 Korea Water Resources
Development 440.9 2.02
Total 4,320.3 3,467.5
[*] Sale pending a dispute
4

Innovative Approach to Competition: IPPA
IPPA Opportunity
Contracted
Capacity
(MW)
Winning
Bidder
Winning Price
(USD MM)
USD
MM/MW
Pagbilao Coal Fired 700 Therma Luzon Inc. 691 0.98
Sual Coal Fired 1,000 San Miguel Corporation 1,107 1.11
San Roque Hydro 345 San Miguel Corporation 450 1.30
Bakun-Benguet Hydros * 100.75 Amlan Power Holdings 145 1.43
Ilijan Combined Cycle 1,200 San Miguel Corporation 870 0.73
Total 3,345 3,263
[*] Benguet IPPA subject to a dispute
5

IPPA Process puts merchant players in the WESM to while honoring existing
agreements
6
PSALM IPPA IPP
PPA, ECA, etc. New
Administration Agreement

7
Each IPPA structure deals with different underlying issues
• FOAK for Philippine WESM
• Coal procurement
• Excess capacity (plant output > PPA)
• Various market interface and metering
issues reduced value and added risks to
the structure
Sual and Pagbilao
• Hydrological uncertainty and poor data
complicated valuation
• Used generation payment approach to
reduce risk to bidders to achieve better
outcomes for PSALM
Hydro’s
• Long term fixed gas contract
• Unprofitable operation in the WESM
• Risk sharing agreement developed
Ilijan
• Peaking plant but significant fuel-related
constraints
• Must-run status and compensation
uncertainties
• Ultimately not sold
Malaya

8
0
1,000
2,000
3,000
4,000
5,000
6,000
7,000
8,000
9,000
Jan-
07
Mar
-07
May
-07
Jul-0
7
Sep-0
7
Nov
-07
Jan-
08
Mar
-08
May
-08
Jul-0
8
Sep-0
8
Nov
-08
Jan-
09
Mar
-09
May
-09
Jul-0
9
Sep-0
9
Nov
-09
Jan-
10
Mar
-10
May
-10
Jul-1
0
Sep-1
0
Nov
-10
Jan-
11
Mar
-11
De
ma
nd
(M
W)
Creating steady opportunities
• 300-800 MW of new capacity
needed each year
• Stake sales and industry
consolidation/reconfiguration
• Renewables feed-in tariff (new)
Growth with periodic surges and evident seasonality
8
El Nino
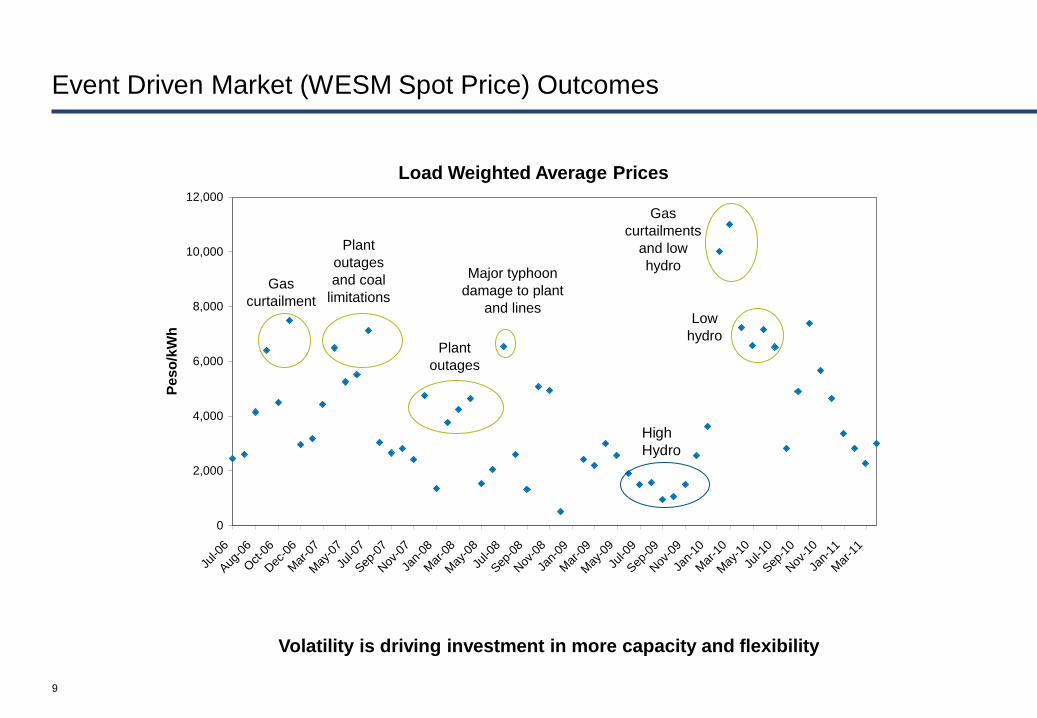
Event Driven Market (WESM Spot Price) Outcomes
Monthly Average Ex-Post LWAP
0
2,000
4,000
6,000
8,000
10,000
12,000
Jul-0
6
Aug
-06
Oct-0
6
Dec
-06
Mar
-07
May
-07
Jul-0
7
Sep
-07
Nov
-07
Jan-
08
Mar
-08
May
-08
Jul-0
8
Sep
-08
Nov
-08
Jan-
09
Mar
-09
May
-09
Jul-0
9
Sep
-09
Nov
-09
Jan-
10
Mar
-10
May
-10
Jul-1
0
Sep
-10
Nov
-10
Jan-
11
Mar
-11
Pe
so
/kW
h
Gas
curtailment
s
Plant
outages
and coal
limitations
Plant
outages
Major typhoon
damage to plant
and lines
Gas
curtailments
and low
hydro
Low
hydro
9
High
Hydro
Load Weighted Average Prices
Volatility is driving investment in more capacity and flexibility
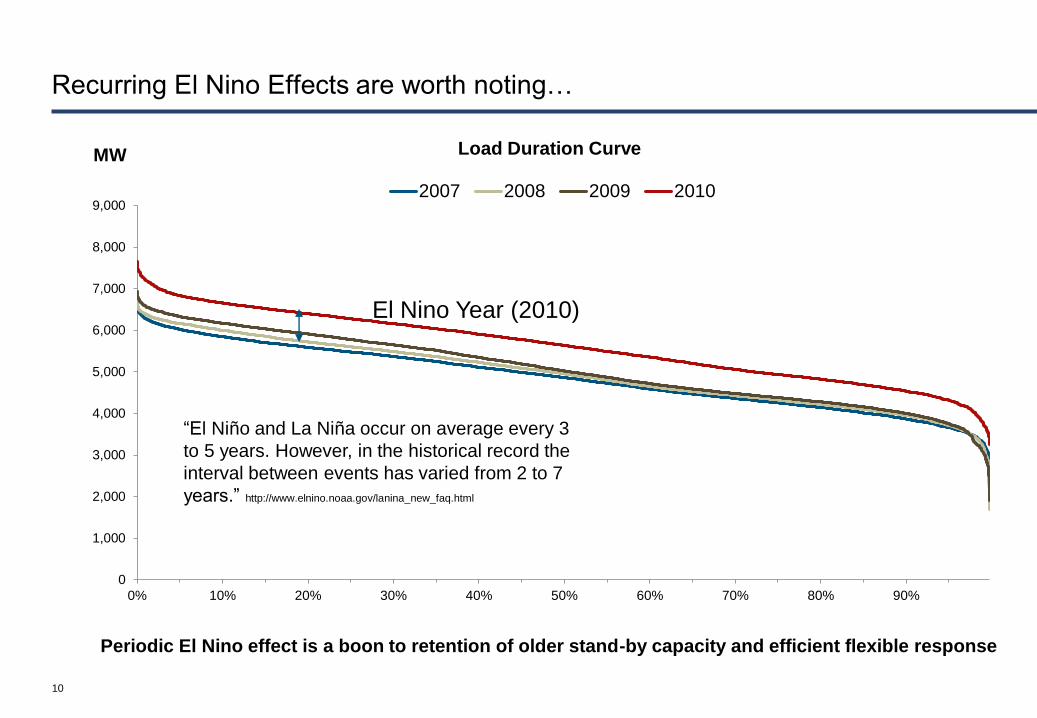
Recurring El Nino Effects are worth noting…
10
0
1,000
2,000
3,000
4,000
5,000
6,000
7,000
8,000
9,000
0% 10% 20% 30% 40% 50% 60% 70% 80% 90%
2007 2008 2009 2010
El Nino Year (2010)
MW Load Duration Curve
“El Niño and La Niña occur on average every 3
to 5 years. However, in the historical record the
interval between events has varied from 2 to 7
years.” http://www.elnino.noaa.gov/lanina_new_faq.html
Periodic El Nino effect is a boon to retention of older stand-by capacity and efficient flexible response

Until demand grows further, the plant mix puts dispatch pressure on coal
11
0
1,000
2,000
3,000
4,000
5,000
6,000
7,000
8,000
9,000
0% 10% 20% 30% 40% 50% 60% 70% 80% 90%
2007 2008 2009 2010
El Nino Year (2010)
Take or pay gas 2700 MW
Hydro+Geothermal about 4000 MW
Total 6,700 MW of “non-coal”
MW Load Duration Curve
5000
Main problem is to “digest” the surplus of “must take” generation, which displaces coal
12
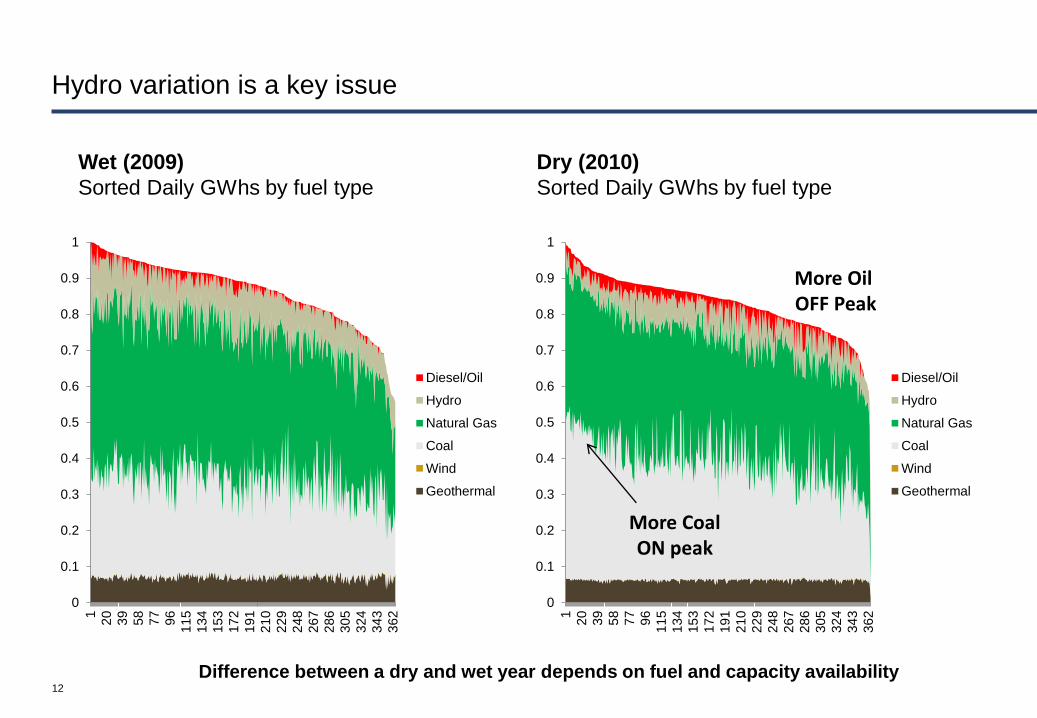
Hydro variation is a key issue
Wet (2009)
Sorted Daily GWhs by fuel type
Dry (2010)
Sorted Daily GWhs by fuel type
0
0.1
0.2
0.3
0.4
0.5
0.6
0.7
0.8
0.9
1
1
20
39
58
77
96
11
5
13
4
15
3
17
2
19
1
21
0
22
9
24
8
26
7
28
6
30
5
32
4
34
3
36
2Diesel/Oil
Hydro
Natural Gas
Coal
Wind
Geothermal
0
0.1
0.2
0.3
0.4
0.5
0.6
0.7
0.8
0.9
1
1
20
39
58
77
96
11
5
13
4
15
3
17
2
19
1
21
0
22
9
24
8
26
7
28
6
30
5
32
4
34
3
36
2
Diesel/Oil
Hydro
Natural Gas
Coal
Wind
Geothermal
More Coal ON peak
More Oil OFF Peak
Difference between a dry and wet year depends on fuel and capacity availability

0%
10%
20%
30%
40%
50%
60%
70%
80%
90%
100%
Luzon Baseload
0%
10%
20%
30%
40%
50%
60%
70%
80%
90%
100%
Luzon Baseload
Luzon managed El Nino 2010 by calling upon its underutilised coal capacity
Much spare energy in 2009
at least relative to “theoretical” utilisation levels
Much less spare energy in 2010
due to El Nino, mainly
13
Unused coal capacity earned its reward in 2010 during higher temperatures and lower water availability

14
The ratio of price to “full-availability” SRMC varies with supply and demand
2009 2008
-4
-2
0
2
4
6
8
10
0.4 0.5 0.6 0.7 0.8
-4
-2
0
2
4
6
8
10
0.4 0.5 0.6 0.7 0.8
Relatively Wet Year San Jose Transformer Fault
Demand / “Capacity”
Price / “SRMC”
Demand / “Capacity”
Market prices in the WESM are highly responsive to conditions – very strong signals for investment
and responsiveness

Opportunity for “spare” capacity (Malaya Example)
Analysis of Malaya Must Run since August 2008
0
20,000
40,000
60,000
80,000
100,000
120,000
140,000
Aug-
08
Sep-
08
Oct-
08
Nov-
08
Dec-
08
Jan-
09
Feb-
09
Mar-
09
Apr-
09
May-
09
Jun-
09
Jul-
09
Aug-
09
Sep-
09
Oct-
09
Nov-
09
Dec-
09
Jan-
10
Feb-
10
Mar-
10
Apr-
10
May-
10
Mu
st
Ru
n E
ne
rgy
(M
Wh
)
Performance and Emissions Tests Outages and problems with other Gencos Low hydro/Malampya Outages
San Jose Transformer issues Transmission Problems (exc San Jose)
15
Older steam (oil) capacity proved essential during El Nino period

Profitable management of older capacity can depend heavily on the “must run”
compensation regime or on the future ancillary services market
0
50
100
150
200
250
300
0.0 0.5 1.0 1.5 2.0 2.5
Avg Peak Price to Dispatch Cost Ratio
Avg
Ho
url
y G
en
era
tio
n (
MW
)
Forced Generation
Economic Generation
"No" Generation
Breakeven Peak Price Ratio
SHOULD RUN SHOULD NOT RUN
“Forced Generation” is unprofitable generation that is required to meet ancillary services requirements
Compensation regime is crucial

Summary
• Sophisticated energy-only wholesale spot market in a developing country
• Over 5 years old, recently expanded to cover the Visayas region
• WESM has now operated during two presidential administrations
• Substantially privatized (more than Australia)
• Progressing to implement Ancillary Services Market
• Evaluating introduction of Independent Market Operator
• Survived El Nino 2010
• Incentivizing rehabilitation and plant improvement investment
• Reasonably competitive structure
• Independent regulation
• All fuel types represented (coal, gas, hydro, geothermal, renewables, oil)
• Mix of domestic and international investors
17

Thank you
18