Embed Size (px)
Citation preview
Ithaca CollegeDigital Commons @ IC
Ithaca College Theses
2003
The perception of indoor and outdoor exerciseenvironments and their effect on mood states, heartrate, and running timeSarah E. HooperIthaca College
Follow this and additional works at: http://digitalcommons.ithaca.edu/ic_theses
Part of the Exercise Science Commons
This Thesis is brought to you for free and open access by Digital Commons @ IC. It has been accepted for inclusion in Ithaca College Theses by anauthorized administrator of Digital Commons @ IC.
Recommended CitationHooper, Sarah E., "The perception of indoor and outdoor exercise environments and their effect on mood states, heart rate, andrunning time" (2003). Ithaca College Theses. Paper 134.
THE PERCEPTION OFINDOOR AND OUTDOOR EXERCISE
ENVIRONMENTS AND TI‐ IEIR EFFECT ON
MOOD STATES,HEART RATE,AND RUNNING TIME
A Thesis Presented to the Faculty of the
Graduate Prograrn in Exercise and Sport Sciences at
Ithaca College
In Partial Fulfllhnent
ofthe lRequirements for the Degree of
Master of Science
By
Sarah E.Hooper
May 2003
Ithaca College
Graduate Program in Exercise and Sport Sciences
Ithaca, New York
CERTIFICATE OF APPROVAL
MASTER OF SCIENCE THESIS
This is to certiff that the Master of Science Thesis of
Sarah E. Hooper
submitted in partial fulfillment of the requirements for the degree of Master of Science inExercise and Sport Sciences at Ithaca College has been approved.
Thesis Advisor:
Committee Member:
Candidate:
Chair, Graduate Program inExercise and Sport Sciences:
Dean of Graduate Studies:
Date:
ABSTRACT
It has been shou.n that aerobic exercise increases positive mood states. Evidence
also indicates that various factors surrounding the exercise environment can influence
mood states depending on the exerciser's perception of the surroundings. There is scarce
information, though, on how the two most basic environments - indoor and outdoor -influence exercise mood states. This study investigated indoor and outdoor exercise
environments and their effect on mood states, heart rate, and running time. Male (n:7)
and female (g:8) college students capable of running 3.4 miles were recruited for the
study. Subjects ran two times indoors on a fitness center teadmill and two times outdoors
on a predetermined route arounC the college campus. Weather conditions were recorded
from National Weather Service data. Treadmill and outdoor distance were standardized at
3.4 miles and subjects ran each of the four trials at the same time on each day. Subjects
were familiarrznd with both environments prior to all testing. The order of sessions uas
balanced to contol for potential carry-over effects. Physiological measures were average
heart rate and running time recorded by a heart rate monitor and timer worn by the
subjects during exercise. Psychological measures were mood states and environmental
perceptions. Mood states were measured by the short version of the Profile of Mood
States Total Mood Disturbance Score (POMS TMDS). Perception of the surrounding
environment was assessed by an Environmental Perception Questionnaire that consisted
of a five-point Likert-type scale. All psychological tests were administered pre and post
exercise session. A three way analysis of variance was used to assess differences in mood
states and in environmental perceptions, and a two-way analysis of variance was used to
assess heart rate and running time. Both mood states and environmental perceptions were
significantly more positive outdoors than indoors, that is, the exercisers preferred
exercising outdoors. This was reflected in a more positive mood states when exercising
outdoors. There were no significant changes in mood states or environmental perceptions
from pre-exercise to post-exercise. Participants had faster run times outdoors than
indoors, but surprisingly, average heart rates were not significantly different between
indoors and outdoors. These findings suggest that when an exercise environment is
perceived positively, mood states will be affected more positively than when an exercise
environment is perceived less favorably. These data also suggest that an exerciser's
performance may be influenced by their perception of the environment, though additional
study is needed to rule out potentially confounding factors.
lV
ACKNOWLEDGEMENTS
The investigator would like to express appreciation to the following people for their
contributions to this effort:
Dr. Jeffrey Ives, thesis advisor, for your patience. Your energy for my topic and
dedication as an advisor was appreciated. I learned a temendous amount about myself,
and the topic with your careful guidance.
Dr. Greg Shelley, second reader, for your knowledge and time. All of your advice and
direction was very helpful.
Dr. Janet Wigglesworth, for your knowledge of statistics. Without you, statistics would
still be a blur. Thank you for making it comprehensible.
To the rest of the deparfrnent, each of you contibuted to this and guided me in some
aspect. Thank you for all your constructive criticism.
To all the subjects that participated in this study, thank you for volunteering your time
and energy.
V
DEDICATION
To my grandmother, Philomenea and the rest of my family, Mom, Dad, Alison, Aunt
Fay, Morgan, and Ben. Thank you for all your love and support. I could not have done
this without you. I love you very much.
To the friends I made along the way. You made it worthwhile.
Vl
TABLE OF CONTENTS
ABSTRACT
Page
iii
v
vi
ACKNOWLEDGEMENTS
DEDICATION
LIST OF TABLES X .mLIST OF FIGURES
Chapter
I. INTRODUCTION I
Scope of the Problem 2
Statement of Purpose 3
Hypotheses................ 3
Definition of Terms... 3
Delimitations.............. 4
Limitations 5
2. REVIEW OF LITERATI.]RE....... 6
What is Stress and Why is it Detrimental to the Body? 6
Physiological Factors Regulating the Stress Response 9
The Environment and Stess. 10
Mood States and Exercise ............... ................... l1
Interactions Among Environment, Mood, and Exercise............. l5
Summary.. 18
Vll
TABLE OF CONTENTS(continued)
Chapter
3. METHODS AND PROCEDURES .............. 19
Participants............... 19
Psychological Measures............. 20
Physiological Measures.............. 22
Testing Procedures 23
Statistics and Criterion Meastues................ 26
4. RESULTS 27
Descriptive Data of the Environmental Conditions and Participants ..... 27
Analysis of Mood States and Environmental Perceptions 3l
Analysis of Physical Performance Measures 38
Summary.. 38
5. DISCUSSION............ 4l
6. SI.JMMARY, CONCLUSIONS, AND RECOMMENDATIONS 45
Summary.. 45
Conclusions............... 45
Recommendations for Further Study .................. 46
APPENDICES
RECRIIITMENT FLYER.… ……………………………………………………… 48
THE PHYSICAL ACTIVITY READINESS
QUESTIONNAIRE… PAR‐Q.………………………………………………… 49
A
B
Vlll
TABLE OF CONTENTS(continued)
Co PROFILE OF MOOD STATES QUESiΠ ONNAIRE一 POMS.50
D. ENVIRONMENTAL PERCEPTIONS QUESTIONNAIRE.… …̈ 51
E. INFORMED CONSENT FORM.… ……………………………………… 55
F. TEMPERA呻 ,IIUMIDITY,AND WIND DATA.… …………・ 57
G. POMSTMDS DATA.… ………………………………………………………… 58
H. POMS TENSION‐ ANXIETY DATA.…………………………………・ 59
1. POMS DEPRESSION‐DEJECT10N DATA.………………………… 60
J. POMS ANGER‐ HOSTILITY DATA.… ………………………………… 61
K. POMS VIGOR‐ ACTIVITY DATA.… …………………………………… 62
L. POMSFA■ GIIE¨INERTIA DATA.… …………………………………・ 63
M.POMS CONFUSION‐BEWILDERMENT DATA.… ………………・ 64
N. ENVIRONMENTAL PERCEP′ ΠONS DATA.…………………………… 65
0. AVERAGE HEART RATE DATA.………̈ ……・・………¨̈ ・̈・…………・・̈・ 66
Po RIINMG■ ME DATA.…………………………………………………… 67
REFERENCES.… …………̈ …̈………………………………………………………………………………………………………… 68
lX
LIST OF TABLES
Table Page
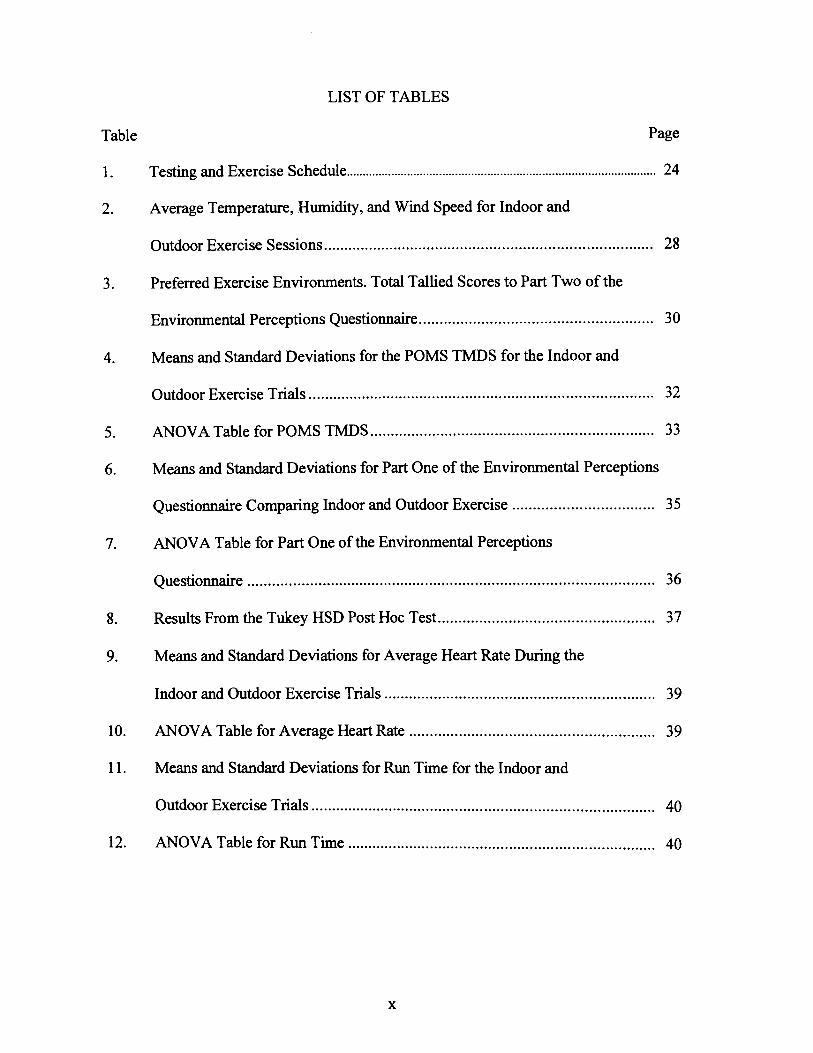
1. Testing and Exercise Schedu1e.................... ........... 24
2. Average Temperature, Humidity, and Wind Speed for Indoor and
Outdoor Exercise Sessions... 28
3. Preferred Exercise Environments. Total Tallied Scores to Part Two of the
Environmental Perceptions Questionnaire....... 30
4. Means and Standard Deviations for the POMS TMDS for the Indoor and
Outdoor Exercise Trials
ANOVA Table for POMS TMDS
Means and Standard Deviations for Part One of the Environmental Perceptions
Questionnaire Comparing Indoor and Outdoor Exercise
A}IOVA Table for Part One of the Environmental Perceptions
Questionnaire ..............
Results From the Tukey HSD Post Hoc Test...
Means and Standard Deviations for Average Heart Rate During the
Indoor and Outdoor Exercise Trials
ANOVA Table for Average Heart Rate .........
Means and Standard Deviations for Run Time for the Indoor and
Outdoor Exercise Trials
12. AI{OVA Table for Run Time ........
2
3
3
3
7.
5
6
8
9
0
1
35
6
7
3
3
9
9
3
3
0
0
4
4

LIST OF FIGURES
Figure Page
l. Cloud Coverage for the 30 0utdoor Exercise Trials.Data is金 oln the
National Weather SeⅣice.… ¨̈ …………………………………………………̈ …………………・・……………………・ 28
・刈
Chapter I
INTRODUCTION
Negative mood states have been associated with stess and the negative effect
stress has on the body (Brod, Fencl, Hejl, & Jirka, 1959). Specifically, negative mood
states have been associated with an increase in the incidence of high blood pressure, heart
disease, depressed immune function, and other illnesses @lix, Stromme, & Ursin, 1974;
Brod et a1., 1959;Henry & Ely, 1979; Kasl & Cobb, 1970). Learning to manage mood
states is an essentid part in managing stress, and therefore, physical well being. Exercise
is one way to manage mood states.
Many researchers have examined the exercise effects on mood states. Intensity,
type of activity, self-effrcacy, and training have been taken into consideration when '
attempting to assess the impact physical activity has on mood @erger & Owen, 1998;
Dyer & Crouch, 1988; Kauvussanu & McAuley,1995; McGown, Talton, & Thompson,
1996; Williams, Krahenbuhl, & Morgan, l99l). Abundant psychological evidence has
been presented to demonstate that exercise can increase positive mood states and
decrease negative mood states (tlenry & Ely, 1979; McGown, Pierce, Easfinan, Tripathi,
Dewey, & Olson, 1993; Rudolph & McAuley, 1995). Exercise has also been shown to be
effective in the treatment of depression in conjunction with medication and
psychotherapy (futal & Sherman, 1998).
The type, or mode, of exercise that has been shoum to be most beneficial for
increasing positive mood states is aerobic exercises (o'connor, Morgan, Raglin,
Barksdale, & Kalin, 1989; Rudolph & McAuley, 1995). The duration and intensity of
exercise are also important factors related to gaining mood state benefits (O'Connor et
2
a1., 1989; Rudolph & McAuley, 1995). Indeed, the longer a person exercises in each
exercise session, without over-training, the more psychological benefits are acquired
(O'Connor et al., 1989; Rudolph & McAuley, 1995). These findings are useful in
prescribing exercise, particularly for people who exercise to reduce depression, anxiety,
and stress. Although mode, intensity, and duration are considered the th,ree key factors to
be manipulated when prescribing exercise, there are other factors that could also affect
the psychological benefits of an exercise session, namely, various environmental factors.
Environmental surroundings affect mood states (Canter, 1961; Shibata & Suzuki,
2OO2). Feeling uneasy or self-conscious in a certain setting can lead to higher stress
levels and negative mood states (McAuley, Mihalko, & Bane, 1996), and even the
presence of foliage in office settings influences mood (Shibata & Suzuki, 2002). Because
exercise can be completed in various environmental settings, it is important to understand
the combined effects of exercise and environment on mood states.
Scope of the Problem
Although exercise has been shown to have positive effects on mood states, there
is evidence that some environments may have negative psychological effects. For
example, a person may have negative feelings about exercising in a health club due to a
constrained and crowded atnosphere. Those perceptions may negate any positive effects
of exercise. Thus, how individuals perceive their environment may have an impact on
exercise effects and may be an imFortant factor to consider when prescribing exercise.
Unfortunately, minimal data exist on the effects of exercise as related to perceived
positive and negative environmental surroundings.
4
bewilderment. Each subscale was scored separately and combined for a total mood
disturbance score (TMDS: McNair, Lorr, & Droppleman, 1992).
3. Environmental perceptions: One's assessment of his or her environment is based on
individuat personality variables, roles, status, as well as other factors that arouse
emotion (Henry &Ely,1979). A custom questionnaire, the Environmental
Perceptions Questionnaire, used a Likert-scale to determine if a person perceived his
or her exercise environment as positive or negative. Part two of the Environmental
Questionnaire tallied subjects' responses to determine their preferred exercise
environment.
Delimitations
The following delimitations were noted:
l. Exercise intensity was set at75Yo of the individual's manimum heart rate, and heart
rate was measured from a telemetered heart rate unit.
2. The Profile of Mood States Total Mood Disturbance Score (POMS TMDS) test was
used as an indicator of mood states.
3. Exercise mode was limited to running.
4. Environments were limited to indoor treadmill running in a college fitress center and
an outdoor running route that included typical college campus features and some
trails in the woods. Outside exercise only took place in the Spring when the
temperature was above freezing and there was no precipitation, that is, no extremes in
temperature.
5. Participants were male and female college-age students at Ithaca College.
5
6. Participants were able to complete a 3.4-mile run without difficulty and were in good
health as determined by the Physical Activity Readiness Questionnaire (PAR-Q
form).
Limitations
The following limitations were noted:
l. These results may not apply to exercise intensities below or greater thanT5Yo of the
exerciser's heart rate maximum.
2. Mood states may be influenced by a person's eagerness or excitement to participate in
the study. Similarly, a person's stess level and mood may have changed randomly
day to day, as some life events could not be controlled.
3. These results may not apply to exercise modes other than running, including other
aerobic activities, strength training, and flexibility training.
4. These results may not apply to indoor and outdoor environments other than those
used in the study, nor may they apply to environments with temperature extemes.
5. These results may be limited to college-aged persons.
6. These results may be limited to persons of relatively good health and aerobic fitness.
Chapter 2
REVIEW OF LITERATURE
Negative mood states have been associated with physical diseases of the body
(Lovallo, 1997). States of depression, anger, confusion, and fatigue can stress the mind
and body to the point of dysfunction, such as contributing to diseases like hypertension
and heart disease (Ader & Cohen, 1993). Exercise has been shown to manage mood
states by increasing positive mood states and decreasing physiological stress responses
(Dyer & Crouch, 1987;Morgan, 1984). Many components of an exercise program can
impact these findings. Intensity, duration, and exercise setting all play a role in the
benefits that may result from exercise. It is well accepted that aerobic exercise can
increase positive mood states in all levels of exercisers from beginners to elite (Morgan,
1984). What is not well understood is how a person's surroundings during an exercise
session impact the benefits of exercise.
To better understand why or how exercise environments impact mood states
management, this section discusses (a) what stress is and why it is detrimental to the
body, (b) physiological factors regulating the stess response, (c) the environment and
stress, (d) mood states and exercise, and (e) interactions among environment, mood, and
exercise.
What is Stress and Why is it Detimental to the Body?
Stress is a physical or mental tension resulting from factors that tend to alter an
existing equilibrium (Lovallo, 1997). Stess can be physical or psychological. Physical
stress (e.g., cold, heat) is generally a direct threat to the body. Psychological stess results
in an emotional response, which then typically results in a physical response. For
7
example, if the dark is perceived as scary then being in the dark will cause fear and the
heart will begin to beat faster. Modern day lifestyles such as office or computer work
generally impact one's psychological stress more than physical stress. Often there are
feelings of emotional stress from jobs and rarely feelings of physical stress, such as being
chased by predators (Canter, 1961).
Gould and Weinberg (1999) described the stress process in four stages. The first
stage is an environmental demand on an individual; this can be physical (e.9., a fitness
test) or psychological (e.g., a math test). The second stage is how an individual perceives
this environmental demand. Stage three is the psychological and/or physical response to
the demand, such as decreased attention or increased heart rate. The fourth stage is the
behavioral consequences, or outcomes, to the demand (Gould & Weinberg, 1999). For
example, sleeping in a completely dark room could be psychologically demanding for a
young child (stage one). The child could perceive darkness as a threat to their safety
(stage two). The child could then become anxious, afraid, and begin to cry (stage three).
In the funre the child may wish to have a night-light on in the bedroom before he goes to
sleep (stage four).
There are many physiological factors that can indicate emotional stress. Heart
rate, blood pressure, rate of fatigue, and hormone levels in the blood, plasma, and urine
have all been found to be good indicators of stess levels in the body. Heart rate has been
shown to increase during trmes of emotional stress @rod et al., 1959; Raikkonen,
Mathews, Flory, & Owens, 1999). For example, in a study of seven aircraft pilots' heart
rates and blood pressures during flight, researchers found that the pilots' blood pressures
rose from 130/80 mmHg to 170/100 mmHg @lix et a1.,1974). Further, the pilots' heart
8
rates surpassed what was needed for the level of oxygen they were consuming.
Essentially, the pilots' cardiovascular responses were more than what was needed for that
physical activity, indicating psychological stress was influencing physiological systems
(Blix et a1.,1974).
Blood pressure increases were reported in a study that examined men who dealt
with a stressful situation like losing ajob (Kasl & Cobb, 1970). Authors followed 150
men over a two-year period and found that blood pressure levels were higher during
anticipation ofjob loss and probationary re-employment than during stabilization on new
jobs.
Turner & Carroll (1985) compared stress levels in 20 subjects completing mental
arithmetic, a video game, and a graded exercise test. The authors measured heart rate,
oxygen consumption, and respiration. The results indicated that subjects participating in
the exercise test had physiological changes to match their workload, yet the subjects
engaging in psychological work (mental arithmetic and video game) had physiological
changes that exceeded their workload. These findings confirm that psychological stress
impacts physiological performance. This fact, though, does not necessarily mean that
stress is negative or harmful to the body.
Stress becomes hamful when it comes in large amounts or is long lasting. At
these times the body's regulation of hormones becomes dysfunctional, and systems and
organs like the heart may become taxed to the point of harm. For instance, constantly
activating the sympathetic nervous system has been shown to lower immune firnction
(McClelland, Floor, Davidson, & Saron, 1980).
9
McClelland, Ross, and Patel (1985) found that persons with higher levels of stress
had depressed immune functions. Researchers collected saliva samples from 46 college
students just after taking an exam, one hour and 45 minutes latter, and several days later.
Researchers found that lower salivary immunoglobulin A were present just after, and at
one hour and 45 minutes after the exam. This result indicated depressed immune function
(McClelland, Ross, & Patel, 1985).
Stress is even more of a concern for people already in a diseased state. For
instance, people with hypertension may develop greater cardiovascular activity in
response to psychological stess than they do to physical stress (Gliner, Bedi, & Horvath,
1979). These authors measured blood pressure in l0 subjects under three different
conditions; psychological stress, mild exercise, and control (no stress conditions). Results
indicated increases in blood pressure for both psychological sEess and exercise
conditions in all subjects. Two of these subjects were categorized as hypertensive prior to
testing, and both had a gteater increase in blood pressure during the psychological stress
than during the physical stress. This indicates that subjects in a diseased state are at
greater risk for psychological stess than healthy subjects.
Physiological Factors Regrrlating the Stress Response
The main regulator of homeostasis in the body is the autonomic nervous system
(McClelland et al., 1980), particularly under stressful conditions (Scarpace & Lowenthal,
1994). The autonomic nervous system is divided into two branches, the sympathetic
division and parasympathetic division. The sympathetic division is activated when a
person is experiencing anger or fear, causing a release of norepinephrine, epinephrine,
10
cortisol, and adrenaline (Henry &F;ly,1979). These hormones play a critical role in the
sfiess response, such as the fight-flight response.
The fight-flight response enables the body to get up and go when it is in danger.
When the secretion of epinephrine is increased, the sympathetic nervous system is
strongly activated causing pupil dilation, bronchial dilation, increased heart rate, and
decreased secretion and peristalsis in the gut (Lovallo,1997). The parasympathetic
nervous system complements the sympathetic. For example, the parasympathetic division
causes pupillary constriction, bronchial constriction, decreased heart rate, and increased
secretion and peristalsis in the gut (Lovallo,1997)-
Examples of the autonomic nervous system being activated during times of stress
include sport competitions, public speeches, and test taking. During a sport competition
salivary cortisol levels rise in athletes that feel unsure about their ability @ooth, Shelley,
Mazur, Tharp, & Kiuok, 1989). When completing mental arithmetic and performing
public speeches, Dimsdale (1984) found that the blood plasma catecholamine level rose
in his test subjects, and this rise correlated with an increase in the subjects' anxiety.
Similar results have been found when examining salivary catecholamine samples
(McClelland et al., 1985).
The Environment and Stess
Interpretation of stressful situations varies from person to person. Just as Gould
and Weinberg (1999) explained in stage nvo of the stress process, individuals will have
different perceptions to the same environmental demand. Not everyone views the same
events in the szrme way; therefore emotional stess is unique to a person as is their
environmental perception (Kiritz & Moos, 1974). Different environments can be a source
1l
of emotional stress to one person, and neutral, or beneficial to another (Canter & Canter,
1979).
The interpretation made by an individual regarding a particular stressor depends
on the total context within which the event occurs (Evans, 1982). The context includes
aspects of the physical, social, and psychological environment and the interaction that
occurs among these three elements (Evans, 1982). These factors are often taken into
consideration when building hospitals, offices, therapy rooms, schools, and other places
where stessful situations often arise (Canter & Canter, 1979). For example, some people
find hospitals to be stressful, while others may find this environment to be unthreatening.
To some people being indoors is inhibiting, while to others it can be a positive stimulus
(Canter, 1961).
An exarnple of environmental conditions causing physical and psychological
stess can be found in a study by Maw, Boutcher, and Taylor (1993). These authors
examined male cyclists exercising under different indoor temperature conditions (8,24,
and 40 degrees Celsius at 50o/o humidity). Warm temperatures caused an increased
physical stess and an increased therrral sensation. The subjects also reported that at a
given workload they perceived the exercise to be more difficult when exercising in the
wafin environment, suggesting that the warm environment had a psychological influence
as well as a physical influence on the subjects.
Mood States and Exercise
There is a connection between negative mood states and measures of physical
health, such as high blood pressure (Raikkonen et al., 1999). Not only has it been shown
that exercise can help with problems such as high blood pressure and cardiovascular
t2
disease, but studies have also shown that exercise increases positive mood states
(McGowan et al., 1996; Morgan, 1984; Morgan, O'Connor, Ellickson, & Bradley, 1988).
Under normal circumstances people usually report that they feel better after
exercise (Morgan, 1984). When comparing anaerobic to aerobic exercise, aerobic
exercise generally elicits greater increases in positive mood than anaerobic exercise. Dyer
and Crouch (1988) placed subjects into four $oups that exercised over an entire
semester; running, aerobic dancing, weight lifting, and a control group that did no
exercise. A POMS questionnaire was administered at various times throughout the
semester. The results showed that the runners and aerobic dancers had similar increases
in positive mood states arid greater positive mood increases than the weightlifters by the
end of the semester. It was also found that runners had a more positive mood profile than
the control ofnonexercisers. These researchers also reported that the control group and
weightlifters had increases in anger, confusion, and tension on the POMS test, whereas
the runners and aerobic dancers had decreases in those areas (Dyer & Crouch, 1988).
All levels of runners, from beginners to elite, can experience the benefit of
running to increase mood states. In another study done by Dyer and Crouch (1987),59
subjects were divided by running ability into three groups, a non-running control group,
beginning runners, and tained nmners. It was found that the beginning runners and
trained mnners had comparable increases in positive mood states after an exercise
session. During the same time frame, the nonexercising controls did not change their
positive mood states. These findings suggest that the benefits of exercise to increase
positive mood states can be experienced by the beginning exerciser, not just the well-
trained exerciser (Dyer & Crouch, 1987). A person can be a marathon mnner or a
l3
recreational jogger and reap the exercise benefits of increased mood states (Wilson,
Morely, & Bird, 1980).
Mode, duration, and intensity are three basic components of exercise
progrilnming. Intensity of exercise is commonly measured by using a percent of
marimum heart rate. Higher heart rates have been correlated with an increase in positive
mood states in some studies (Ken & Van-Den-Wollenberg, 1997; McGowan et al.,
1996), but in other studies the relationship between intensity level and mood states is
unclear (Berger & Owen, 1998; Steptoe & Cox, 1988).
For example, McGowan et al. (1996) examined 28 subjects in a study measuring
heart rate and mood states. It was found that subjects achieving higher hearts rate during
aerobic exercise had a greater increase in positive mood on a POMS test. Similar results
were also found in a study that examined runners (Kerr et al., 1997). Kerr et al. (1997)
found that runners that ran at a higher intensity had greater increases in positive mood
states than those running at a low intensity.
Data reported by others do not fully support these dose-response data. Berger and
Owen (1998) found no difference in POMS scores for persons exercising at a low
intensity level compared to persons exercising at a moderate intensity level. Subjects
jogged at either a low intensity (50-59% of ma:r heart rate) or a moderate intensity (60-
79Yo of max heart rate) for 20 minutes. Increases in positive mood on the POMS test
were found to be equal in the low and moderate groups. None of the subjects were able to
maintain a heart rate above 80% of their maximum, therefore high intensity exercise
could not be compared. Similar results were found by Dunn and McAuley (2000), who
found that over the time course of a single exercise bout there were increases in positive
t4
feeling states and decreases in negative feeling states. These responses were the same
whether the subjects ran at low intensi$ $0% of ma:<imal intensity) or at high intensity
(80% of maximal intensity).
Another study comparing low and high running intensity firther clouds the
relationship between intensity and mood states. Steptoe and Cox (1988) found that
subjects who ran at a higher heart rate had increases in tension and anxiety on the POMS
and subjects that ran at a low heart rate had increases in vigor and exhilaration. In sum, it
is clear that low to moderate intensity exercise provides positive mood state benefits,
whereas the relationship between high intensrty exercise and positive mood states
remains unsettled.
Regardless of mode, dtuation, or intensity, simply participating in exercise has
been shown to increase positive mood states (Kavussanu & McAuley, 1995). Kavussanu
and McAuley (1995) surveyed 188 subjects, l9 to 7l years of age, on their level of
physical activity, optimism and pessimism, physical self-efficacy, and tait anxiety.
Results suggested that moderately active and higNy active subjects were more optimistic
than inactive subjects. Results also showed that subjects that exercised and felt that they
had completed the workout successfully had a greater increase in positive mood states.
The feeling of mastery that the participants felt from the workout gave them a feeling of
control over their environment, and therefore invoked optimism (Kavussanu & McAuley,
r99s).
Aerobic exercise has been shown to be just as beneficial for managing mood and
sfiess when compared to relaxation training @erger, Friedmann, & Eaton, 1988).
Authors placed subjects into different sfress management groups; jogging, relaxation,
15
group interactioq and contol groups. For twelve weeks the subjects participated in their
assigned program. All groups except the control group had a short-term reduction in
stress, but the jogging group and relaxation group had the greatest increase in positive
mood states on a POMS test. This study suggested that even though jogging is a vigorous
activity it could bring about the same results as a relaxation exercise (Berger et al., 1988)
Interactions Among Environment. Mood. and Exercise
If a person does not feel comfortable in an environment, work productivity suffers
(Canter, 196l). Comfort level and other environmental factors such as accessibility and
pleasantness of surroundings can influence exercise behavior in much the same way
(Sallis, Johnson, Calfas, Caparos4 & Nicholas,1997). For example, a common factor
that may influence exercise behavior is crowdiness, such as may occur in a fitness center.
Several studies have found that subjects exercising in a setting where they felt they were
being judged or evaluated received less benefit from the exercise as those perceiving the
setting to be non-threatening (Harte & Eifert, 1995; Katula & McAuley,200l; Katuala,
McAuley, Mihalko, & Bane, 1998; Spink, t992). Six studies examining exercise
environments are discussed below, and each of these studies supports the notion that
environment influences mood states.
Spink (1992) found that a person's anxiety about their physique kept them from
participating in a progmm where they were surrounded by people that they felt judged
them. The researcher asked 37 subjects to fill out a questionnaire about the location of the
exercise they cunently participated in. Subjects also filled out a social physique anxiety
scale. After dividing the subjects into either high anxiety or low anxiety groups their
exercise locations were compared. People with a high level of anxiety about their body
l6
chose to exercise in a private setting instead of an exercise setting in a public facility
(Spink, 1992).
A similar study found that a miror placed in front of an individual during
exercise may affect performance (Katula et al., 1998). Thirty-four male and female
subjects participated, and those subjects with low self-efficacy had a less positive
experience when the mirror was placed in front of them. Self-efficacy was defined as the
feeling of self-assurance or self-esteem when participating in a certain task (Katulaet al.,
1998). Women were more negatively affected by the mirrors than were men. In confrast,
these authors found in a follow-up study that female exercisers improved in self-efficacy
following acute exercise in front of a miror (Katula & McAuley, 2001). Why these data
are so conflicting remains unknown. Nevertheless, mirrors are an environmental factor in
many workout facilities and these data suggest that they can affect many people's
exercise experiences.
One study examined the emotional environment of exercisers (McAuley, Talbot,
& Martinez,1999). College females in this study were assigned to a low or high self-
efficacy condition, where subjects' self-efficacy was manipulate by bogus feedback and
graphical displays. Subjects in the high self-efficacy group were given positive feedback
about their performance and shown bogus computer feedback that was positive compared
to normative data. Subjects in the low self-effrcacy group were given negative feedback
about their performance as well as bogus negative computer data. When both groups
returned for the next exercise session they were given similarsame bogus information.
Researchers found that subjects in the low self-efficacy group reported more
psychological distess and more fatigue than those in the high self-effrcacy group.
t7
McAuley et al. (1996) exarnined state anxiety among a non-exercising control
group, persons exercising in a laboratory, and persons exercising in a natural environment
of their choosing. At the end of a single exercise session, both exercise groups scored
lower on state anxiety than the control Broup, but there were no statistically significant
differences between the laboratory and natural environment exercise goups. These
results suggest that the environment may not have a measurable effect on anxiety.
However, the single day of exercise testing employed in this study limits the applicability
of these findings.
A feature of the environment shown to affect mood states is attention. That is,
what features in the environment draw attention? Harte and Eifert (1995) compared
physiological and psychological responses during three different types of exercise
environments. The environments were outdoors, indoors with a teadmill and external
stimuli, and indoors with a teadmill and internal stimuli. The external stimuli were
sounds typically heard in outdoor environments (wind, cats, and birds). The internal
stimuli were the subjects' own breathing sounds. Sounds were delivered via a portable
cassette player and headphones. All subjects exercised (ran) in all three environments.
Mood states were evaluated by the POMS test. Physiological stress was evaluated by
blood pressure, adrenaline, nonadrenaline, and cortisol urine samples. Cortisol hormones
are indicative of stress when they are present in excess in the blood or urine. The results
suggested that the environment causing the most intemal focus of attention (listening to
breathing) resulted in higher negative mood states and higher levels of hormones in the
urine samples. These authors concluded that setting, attentional focus, and cognitive
appraisal demands might alter the emotional experiences associated with exercise.
18
Fitlingim and Fine (1936) also manipulated focus of attention during exercise.
These authors found that subjects who were asked to focus only on their breathing during
exercise had a more negative experience than those subjects that were allowed to listen to
a portable music player. When the focus of attention was only on the body the subjects
fatigued more quickly. Taken collectively, these results suggest that exercise alone may
not decrease negative mood states, but that factors in the exercise environment can
influence mood states and must be considered when examining the relationship betrveen
exercise and mood.
Summary
When a person is put under too much psychological stress it can lead to physical
illness. One way to manage stress and its negative consequences is by increasing positive
mood states. One way to increase positive mood states is with aerobic exercise (Berger et
al., 1988; Dyer & Crouch, 1987, 1988; Kavussana & McAuley,1995; McGowan etal.,
1993,1996;Morgan, 1984; O'Connor et al., 1989; Williams et a1., l99l).
The environment, including the exercise environment, can play an important role
in a person's overall mood. Currently, there is minimal research showing what
environmental factors impact exercise, or how environmental factors and exercise
interact with respect to affecting one's emotional response to exercise. Indoor and
outdoor exercise environments are important environmental considerations, yet only one
study has compared these environments when exercise has been used to contol mood
(Harte & Eifert, 1995). Because indoor and outdoor environments differ markedly, and
factor into one's exercise adherence (Sallis et al., 1997), more information about the
effects of these exercise environments on mood states is warranted.
Chapter 3
METHODS AI{D PROCEDURES
Many aspects of exercise have been examined to determine what type of exercise
program will be most beneficial for increasing positive mood states. One aspect of
exercise that has not been fully explored is the environmental setting where the exercise
takes place. Indoor and outdoor environments are among the most basic environmental
choices and offer unique experiences for the exercise participant. Yet, only minimal
research exists comparing the experiences in these two settings. The methods described
herein were designed to l) assess mood states in persons exercising indoors and outdoors,
and 2) compare these findings to physiological indicators and exercise performance.
Participants
Eight female and seven male volunteer participants were recruited from the Ithaca
College campus by word of mouth and a recruitnent flyer placed around the campus
(Appendix A). Average age of participants was2l.2 + 2.1 years. One female subject
dropped out of the study before the fust exercise session due to a knee injury. All
subjects stated that they were experienced runners of five or more yeaxs. Subjects
currently exercised and ran either to maintain their physical fitness or as part of an
athletic team. All of the subjects felt confident that they could run 3.4 miles without
difficulty, and stated that they currenfly ran at least 3.4 miles during their workouts. All
participants were in good health, as established by the Physical Activity Readiness
Questionnaire (Appendix B) (PAR-Q; Thomas, Reading, & Shephard,1992). Based on
these data the participant pool can be classified as young adults and experienced in
running.
19
20
Psychological Measures
The POMS short form questionnaire (Appendix C) was used to measure
psychological mood states (McNair et al., 1992). The POMS test is a valid and sensitive
measure of mood states for nonpsychiatric populations (McNair et a1., 1992). Subjects
completed the POMS test in about three to five minutes without interference from others
(see testing procedures later in this chapter). For the outdoor trials, subjects filled out the
POMS questionnaires outside just before and after their run. For the indoor trials,
subjects filled out the POMS questionnaire in the Ithaca College fitness center just before
and after exercising.
The POMS test consists of six subscales: tension-anxiety, depression-dejection,
anger-hostility, vigor-activity, fatigue-inertia, and confusion-bewilderment. The POMS
short form is a 30 word questionnaire that assesses feelings people have. All six
subscales are located on one page in random order. Each "question" is a single word in
which respondents provide an answer about how they feel on a 0-4 scale. Zero = not at
all; one : littlei two : moderate; three = quite a bit; and four : extremely. Subjects are to
fill in the circle that they feel best matches the intensity of the words listed. Examples of
words for each subscale are: tension-anxiety, tense; depression-dejection, unworthy;
anger-hostility, angry; vigor-activity, fulIof pep; fatigue-inertia, sluggish; and confusion-
bewilderment, forgetful. The POMS TMDS was compiled by adding all the subscales
scores together, except the vigor factor, which is subtracted from the whole' A lower
score represents a more positive mood state. The POMS test was administered pre and
post exercise.
2t
A two-part Environmental Perceptions Questionnaire was created by the
researcher to assess perceptions of exercise environments. The subjects, without
interference, filled out the questionnaire in about two minutes (see testing procedures
later in this chapter). Similar to the POMS questionnaire, the Environmental Perceptions
Questionnaire was also administered in the environment where the subject exercised.
Pan One of the Environmental Perceptions Questionnaire was Likert-type
questions given pre and post exercise to determine subjects' perceptions of the exercise
environment (Appendix D for Part One and Part Two; Indoor and Outdoor). Separate
questionnaires were given for outdoor exercise and indoor exercise tials, but the
questions on each differed only in specific features of exercise. For instance, question one
(Part One) on the outdoor questionnaire asked, "How would you rate your degree of
comfort exercising on the college campus and tack"? In contrast, question one (Part
One) on the indoor questionnaire asked, "How would you rate your degree of comfort
exercising in the fitness center on a treadmill"? Each of the seven questions was scored
on a scale from one ("good") to five ("poor"), thus a more favorable perception was
scored lower. The total score for indoor perceptions and outdoor perceptions were
compared. The questionnaire was given pre and post exercise.
All seven questions were located on one page. The good to poor responses to each
question differed depending on the adjective used in the question. For example, responses
to the first question (Part One; Indoor), "How would you rate your degree of comfort
exercising in the fitness center on a teadmill?" were: one : very comfortable; two :
comfortable; three: neutral; four: somewhat comfortable; and five = not comfortable.
The second question on the environmental questionnaire @art One; Indoor), "How would
22
you describe your motivation exercising in the fitness center on a treadmill?" had the
following answer: one: very motivated; two: motivated; three: neutral; four:
somewhat motivated; and five: not motivated.
Part Two of the Environmental Perceptions Questionnaire was a checklist type
questionnairc, designed to inquire about the participants' preferred exercise
environments. The purpose of Part Two was to gain a better understanding and
description of the subject pool in terms of what types of exercise they preferred and
typically participated in.
An example of a question on Part Two of the Environmental Perceptions
Questionnaire for both indoors and outdoors asked participants to describe their ideal
exercise environment.They were given choices ranging from warm and sunny to
temperature-controlled. Another question asked subjects where they usually exercise and
provided choices ranging from an indoor gym to a structured class. This part of the
questionnaire was administered to ttre participants at the same time as the POMS test and
part one of the environmental questionnaire, that is, before and after each of the four
exercise sessions. For the purpose of this investigation, only the results of the first test
administration (i.e., pre-exercise test), were used. The reason for only using the pre-test
scores was to get a sense of the preferred exercise environment prior to "contamination"
from the exercise sessions. Mean scores from the 15 subjects were used to determine the
preferred environment.
Ph],siological Meastues
Heart rate was monitored for each participant during exercise using a Polar heart
rate monitor (Protrainer XT Cycle, Polar Electo Inc., 370 Crossways Park Drive,
23
Woodbury, NY I1797-2050.) The monitors were strapped around each participant's rib
cage and a wristband receiver recorded heart rate. An average heart rate during each
exercise session was recorded. Participants were educated on appropriate heart rate
ranges to control their intensity level throughout the exercise. Run time was also recorded
on the urist band receiver for all trials. Subjects started the wristband timer when they
began running and stopped the clock when they finished.
Testing Procedures
The testing and exercise schedule is summarizedinTable l. Participants came to
the researcher's office prior to the fust exercise session and were given an informed
consent form (Appendix E) and the PAR-Q to read and sign. There were no other people
in the office at the time each participant and researcher met. The participants were also
asked about their ability to complete the 3.4-mile exercise run. If by verbal self-report a
participant indicated that 3.4 miles would or could be difficult, then they were excluded
from the study. All participants' data were recorded and scored using a letter and number
in place of their name to ensure confidentiality.
Alt participants were familiarized with the indoor and outdoor exercise
environments and testing equipment (e.g., heart rate monitor, treadmill confrols) prior to
testing. The researcher walked with each participant to familiarize eachto the route that
the he or she would run for the outdoor trials. Each participant had the oppornrnity to ask
questions about the route at that time. AII participants had used the Ithaca College fitness
center and were familiar with the facility. Participants were also shown how to use the
Polar heart rate monitor and wristband receiver and were allowed to try them on.
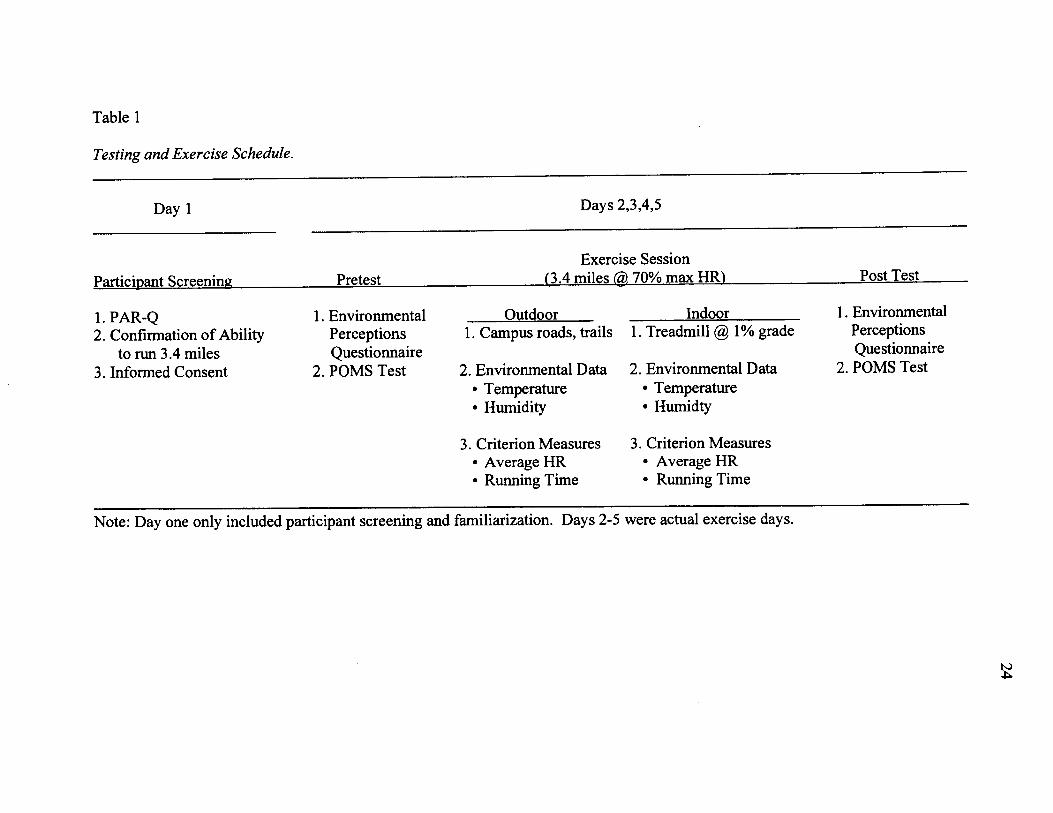
Table 1
Testing and Exercise Schedule.
Day I Days2,3,4,5
Exercise Session
l. PAR-Q2. Confirmation of Ability
to run 3.4 miles3. Informed Consent
l. EnvironmentalPerceptions
Questionnaire2. POMS Test
Outdoorr@irc2. Environmental Data
' Temperature. Humidity
3. Criterion Measures. Average HR. Running Time
Indoorl. Treadmill@ l% grade
2. Environmental Data. Temperature. Humidty
3. Criterion Measures. Average HR. Running Time
1. EnvironmentalPerceptions
Questionnaire2. POMS Test
Note: Day one only included participant screening and familiarization. Days 2-5 werc actual exercise days.
いヽ
25
Each participant exercised two times (nvo trials) indoors and two times (t'wo
trials) outdoors for a total of four exercise sessions (treafinent trials). The order of
exercise (indoor versus outdoor) was balanced over participants and across days to
control for potential order effects. Participants were given the option of performing the
four trials on a Monday, Wednesday, Friday, Monday schedule, or a Tuesday, Thursday,
Tuesday, Thursday schedule. Participants also picked the time of day they wished to
exercise, but were not allowed to pick the order of the trials (i.e., nmning indoors verses
outdoors) to control for bias of one environment over another.
On each exercise day participants were administered the Environmental
Perceptions Questionnaire and the POMS test pre exercise. On the hour the exercise
session began, the local temperature, hutnidity level, wind speed, and cloud coverage
were recorded from the National Weather Service (2001) website. The indoor
environment temperature and humidity levels were also recorded at the start of the indoor
exercise sessions. The indoor temperature was recorded using a themtometer located on
the wall of the fitness center and a barometer was brought to the facility each exercise
day to record humidity. The barometer was placed near the treadmill that each subject
used.
participants ran 3.4 miles indoors onalYograde treadmill, or outdoors on the
predetermined route on cnmpus roads and trails. Research has shown that a l%o grade
accurately reflects the energy cost of running outdoors with the added factor of wind
(Jones & Doust, 1996). Participants were instructed to maintain an average intensity level
of at least 70% of their maximal heart rate and use the heart rate monitor as heart rate
26
feedback. Morimum heart rate was determinedas220 minus age. Participants regulated
their own exercise intensity by voluntarily modiffing running speed over ground or by
changing treadmill speed.
The time it took to complete the 3.4 miles was recorded and an average heart rate
for the entire exercise bout was recorded from the heart rate monitor. After each exercise
session the Environmental Perceptions Questionnaire and POMS test were again
administered.
Statistics and Criterion Measures
Descriptive statistics for the participants and environmental conditions were
calculated. A}x2x2repeated measures analysis of variance (ANOVA) was used to
compare the POMS TMDS and Environmental Perceptions Questionnaire scores across
condition (indoors vs. outdoors), trial (exercise session I vs. exercise session 2 for each
treatnent condition), and time (pre exercise versus post exercise). A 2 x2 repeated
measures ANOVA was used to analyze the physiological dependent mea-sures (average
heart rate and run time) across condition and trial. Tukey's HSD post hoc tests were used
to locate the source of confounding interactions. All hypotheses were tested at cr = .05.
Chapter 4
RESULTS
The purpose of this investigation was to compare indoor and outdoor exercise
environments to assess if individuals responded differently with respect to mood states,
heart rates, and running times. The relationship between preferred environment and mood
states was also examined. This chapter is divided into the following sections: (a)
descriptive data of environmental conditions and participants, (b) analysis of mood states
and environmental perceptions, and (c) analysis of physical performance measures.
Descriptive Data of Environmental Conditions and Participants
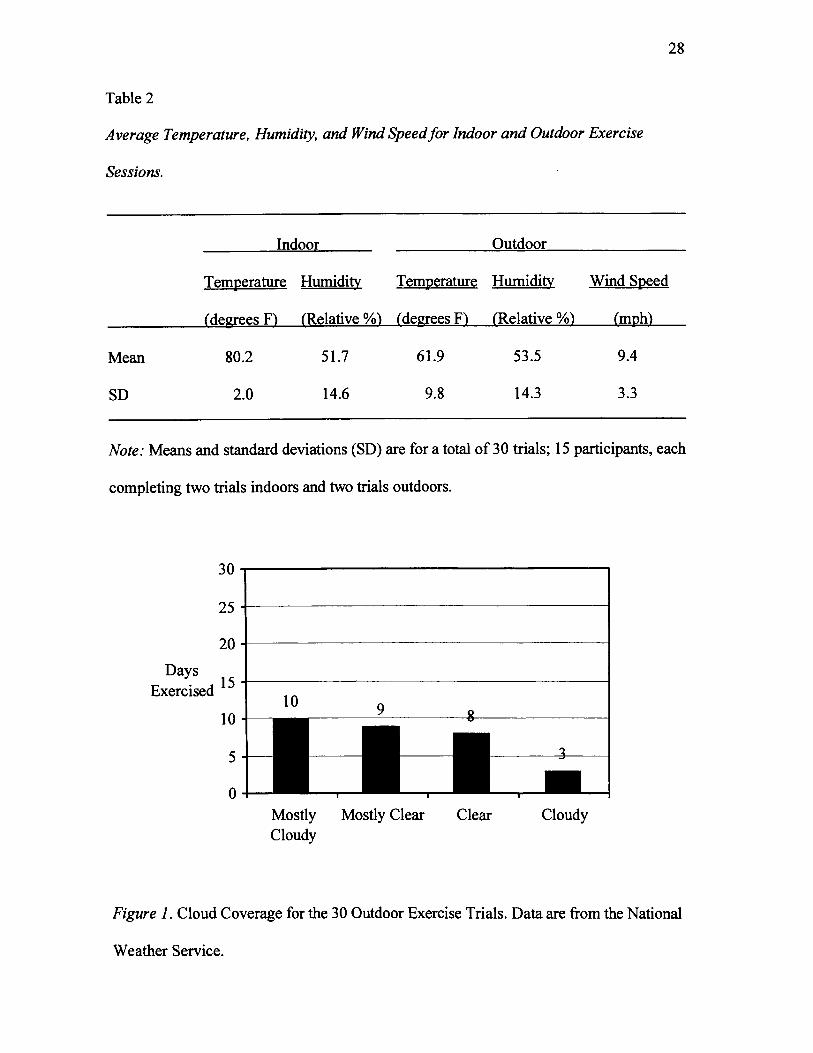
Weather statistics for the outdoor trials are presented in Table 2 aad Figure l.
Raw data for temperatwe, humidity, and wind is located in Appendix F. These data were
collected for the hour each participant began exercising, and were obtained from the
National Weather Service (2001) website. As indicated in Table 2,the average outdoor
temperature of 61.9" F was 18.3'F colder than the average indoor temperature of 80.2"
F. The outdoor conditions also had an average windspeed of 9.4 mph. On the other hand,
the humidity only differed by 2 percentage points between indoors (51.7%) and outdoors
(s3.s%).
According to the National Weather Service dat4 only three days of the total 30
exercise days were classified as cloudy (see Figure l). The rest of the days were
somewhat equally divided zrmong mostly cloudy, mostly clear, and clear. In general, the
outdoor exercise conditions had moderate to chilly temperatures and were somewhat
cloudy, compared to a warmer indoor environment.
27
28
Table 2
Average Temperature, Humidity, and Wind Speedfor Indoor and Outdoor Exercise
Sessions.
Indoor Outdoor
Temperature Humidity Temperature Humidity Wind Speed
(degrees F) (Relative %) (degrees F) (Relative %) (mph)
Mean 80.2 51.7 61.9 53.5 9.4
SD 2.0 14.6 9.8 14.3 3.3
Note: Means and standard deviations (SD) are for a total of 30 trials; 15 participants, each
completing two trials indoors and two trials outdoors.
30
25
20
Davs,15
trxercrseo
l0
5
0
Mostly Mostly Clear Clear CloudyCloudy
Figure 1. Cloud Coverage for the 30 Outdoor Exercise Trials. Data are from the National
Weather Service.
109 0
‐ 2
■ ‐
29
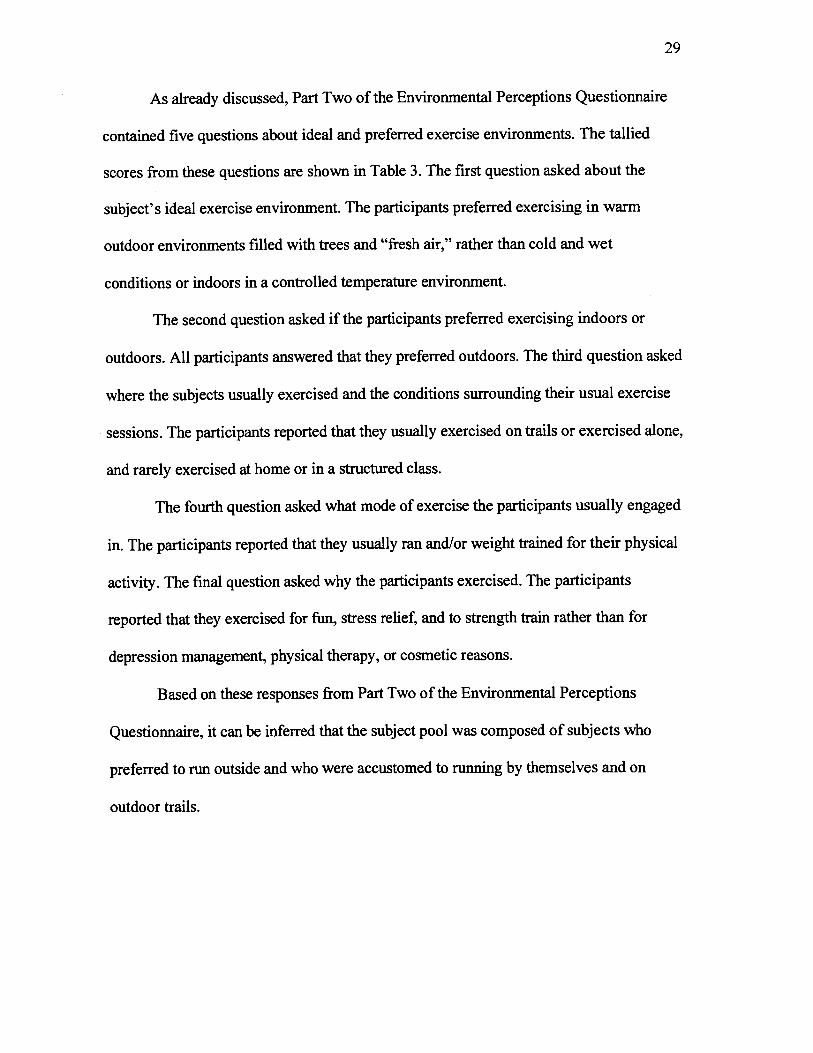
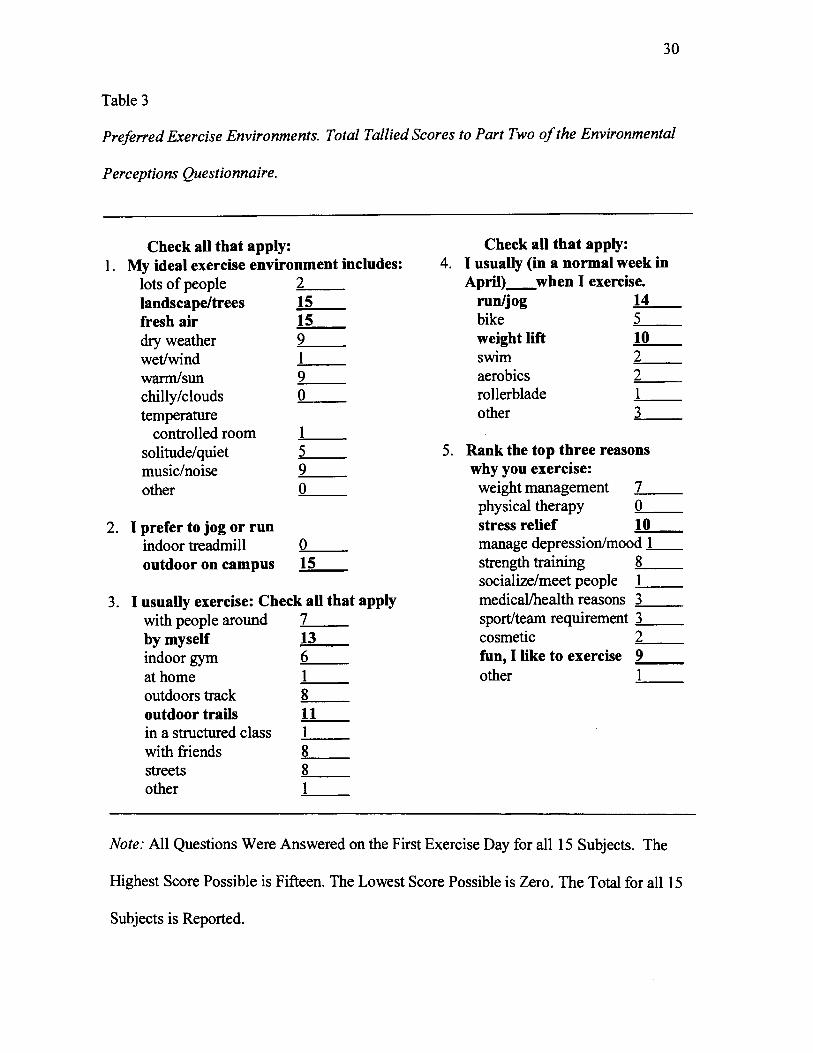
As already discussed, Part Two of the Environmental Perceptions Questionnaire
contained five questions about ideal and preferred exercise environments. The tallied
scores from these questions are shown in Table 3. The first question asked about the
subject's ideal exercise environment. The participants preferred exercising in warm
outdoor environments filled with trees and "fresh air," rather than cold and wet
conditions or indoors in a controlled temperatrue environment.
The second question asked if the participants preferred exercising indoors or
outdoors. All participants answered that they preferred outdoors. The third question asked
where the subjects usually exercised and the conditions surrounding their usual exercise
sessions. The participants reported that they usually exercised on trails or exercised alone,
and rarely exercised at home or in a structured class.
The fourth question asked what mode of exercise the participants usually engaged
in. The participants reported that they usually ran and/or weight trained for their physical
activity. The final question asked why the participants exercised. The participants
reported that they exercised for furU stress relief, and to strength train rather than for
depression management, physical therapy, or cosmetic reasons.
Based on these responses from Part Two of the Environmental Perceptions
Questionnaire, it can be inferred that the subject pool was composed of subjects who
preferred to run outside and who were accustomed to running by themselves and on
outdoor trails.
30
Table 3
Prefene d Exercise Environments.
P erc eptions Que stionnaire.
Total Tallied Scores to Part Two of the Environmental
Check all that apply:l. My ideal exercise environment includes:
Check all that apply:4. I usually (in a nomal week in
April)-when I exercise.lots of peoplelandscape/treesfresh airdry weatherwet/windwarm/sunchilly/clouds
by myselfindoor gymat homeoutdoors trackoutdoor trails
with friendsstreetsother
2l5159I90
136I8
11
8
8
I
run/jogbikeweight liftswimaerobicsrollerbladeother
l45
l02
21
Jtemperafurecontrolled room I
solitude/quiet 5
music/noise 9
other 0
I prefer to jog or runindoor treadmill 0
outdoor on campus 15
I usually exercise: Check all that applywith people around 7
Rank the top three reasonswhy you exercise:
weisht manasement 7
ohvsical theraov 0
stress relief 10manage depression/mood Isffensth trainine 8
socialize/meetpeople 1
medicalhealthreasons 3
sport/team requirement 3
cosmetic 2
funr l like to exercise 9
other I
5。
3.
in a smcttd class l
Note: All Questions Were Answered on the First Exercise Day for all 15 Subjects. The
Highest Score Possible is Fifteen. The Lowest Score Possible is Zero. The Total for all 15
Subjects is Reported.
3l
Analysis of Mood States and Environmental Perceptions
Psychological measures were calculated by summing the scores (total score) from
the POMS test and Part One of the Environmental Perceptions Questionnaire. Raw data
for TMDS are located in Appendix G. The TMDS is calculated by adding the six
subscales together with the exception of vigor which is subtracted from the whole. The
six subscales are: tension-anxiety, Appendix H; depression-dejection, Appendix I; anger-
hostility, Appendix J; vigor-activity, Appendix K; fatigue-inertia, Appendix L, and
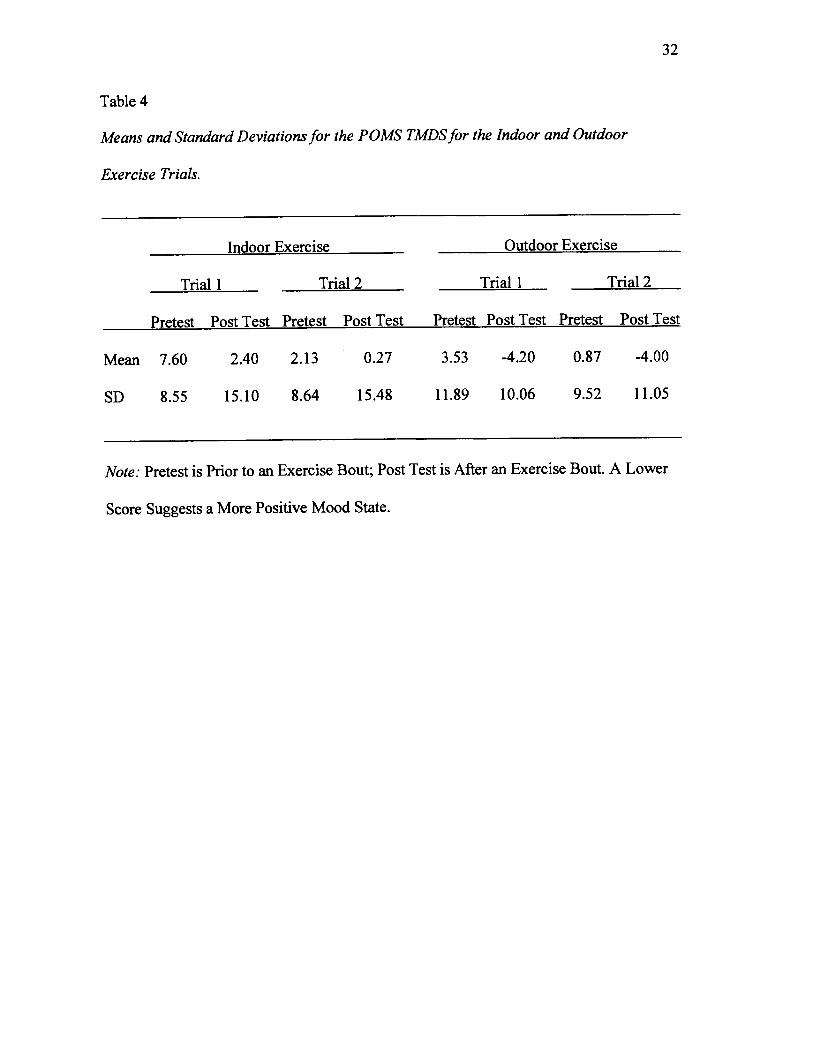
confusion-bewildermen! Appendix M. Means and standard deviation for the POMS
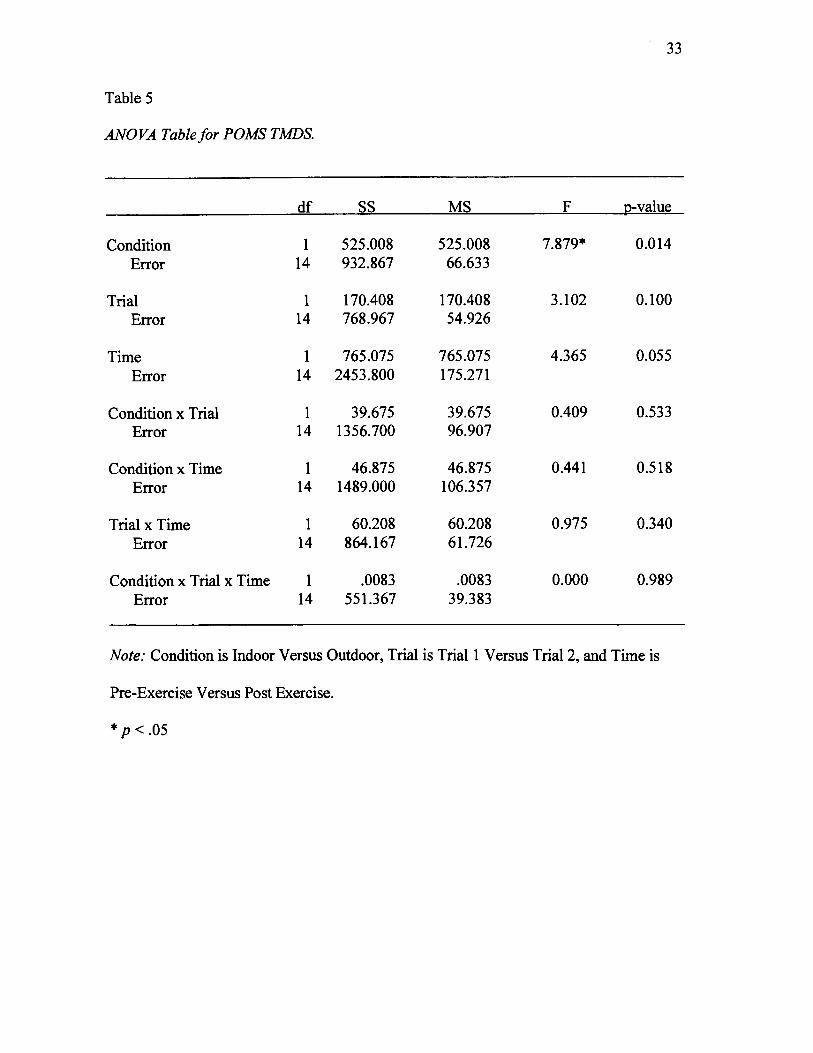
TMDS are presented in Table 4 and the analysis of variance results in Table 5. Three way
analysis of variance results for the POMS TMDS test for the main effect of condition
indicated that the total mood disturbance score was significantly lower outdoors (M:
-.95, SD = 10.9) than indoors (M: 3.1, SD :2.4), F(1,14):7.88; p: .014. The main
effect of trial was not statistically significant, F(l,14) :3.10, p: .10, although the mean
data revealed a tendency for participants to report a lower POMS TMDS on the second
exercise session. Similarly, the main effect for time approached but did not reach
statistical significance, F(I,14) :4.37,p: .055, suggesting atendency for better moods
to be reported after exercise than before exercise. None of these findings were
confounded by significant interactions. That is, the main effect condition showed no
significant difference for Condition x Trial, Condition x Time, Trial x Time, or Condition
x Trial x Time.
32
Table 4
Means and Standard Deviations for the POMS TMDSfor the Indoor and Outdoor
Exercise Trials.
Indoor Exercise Outdoor Exercise
Trial I Trial2 Trial I Tial2
Pretest Post Test Pretest Post Test Pretest Post Test Pretest Post Test
Mean 7.60 2.40 2.13 0.27
SD 8.55 15。 10 8.64 15。 48
3.53 ‐4。20 0。 87 -4.00
11.89 10.06 9.52 11.05
Note: Pretest is Prior to an Exercise Bout; Post Test is After an Exercise Bout. A Lower
Score Suggests a More Positive Mood State.
33
Table 5
ИNO〃 ■7b′θ/ar PO豚 肋 S
Condition 1 525.008 525.008 7.879* 0.014Error 14 932.867 66.633
Tria1 1 170.408 170.408 3.102 0.100Error 14 768。 967 54.926
Time 1 765.075 765.075 4.365 0.055Error 14 2453.800 175。 271
Condition x l「 五al 1 39。 675 39.675 0.409 0.533
Error 14 1356。 700 96。 907
Condition x Time 1 46.875 46.875 0.441 0.518Error 14 1489.000 106。 357
Trial x Time 1 60。 208 60。 208 0。 975 0.340
Error 14 864。 167 61.726
Condition x T五 al x Time l .0083 .0083 0.000 0.989Error 14 551.367 39.383
df SS MS F D― Value
Note: Condition is Indoor Versus Outdoor, Trial is Trial I Versus TialZ, and Time is
Pre-Exercise Versus Post Exercise.
* p' .05
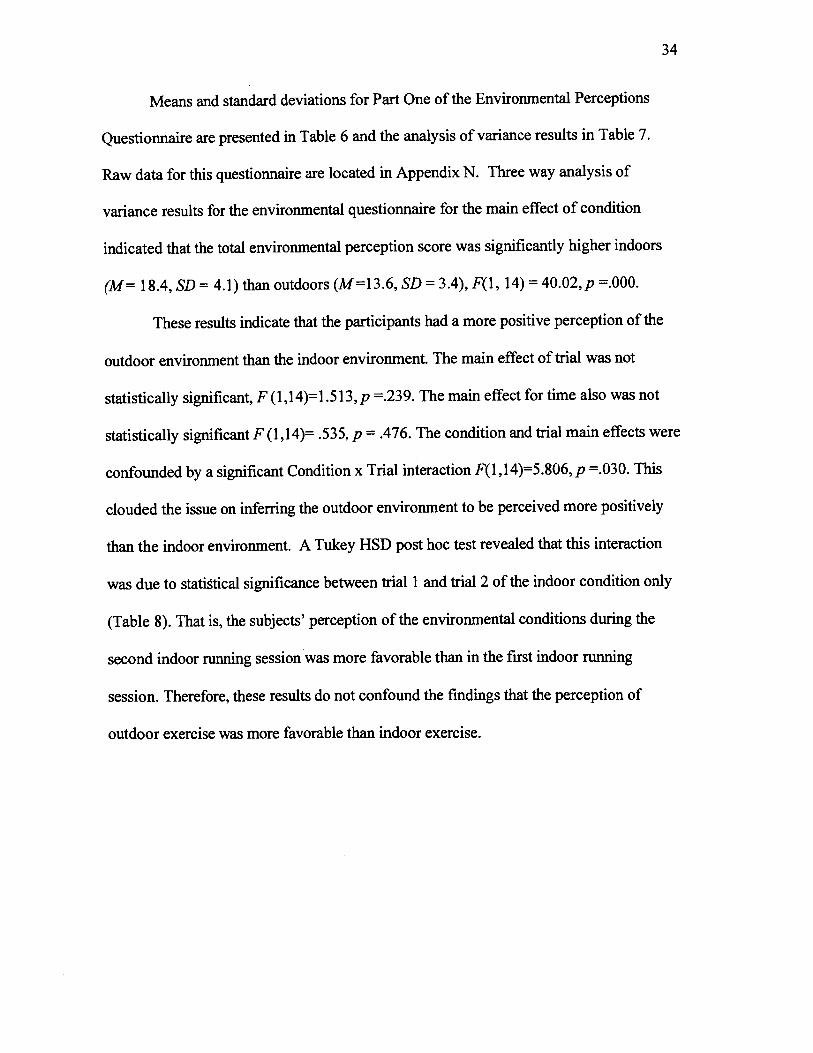
34
Means and standard deviations for Part One of the Environmental Perceptions
Questionnaire are presented in Table 6 and the analysis of variance results in Table 7.
Raw data for this questionnaire are located in Appendix N. Three way analysis of
variance results for the environmental questionnaire for the main effect of condition
indicated that the total environmental perception score was significantly higher indoors
(M: l8.4,SD: 4.1) than outdoors(M=13.6, SD:3.4), F(1, 14):40.02'p:.000.
These results indicate that the participants had a more positive perception of the
outdoor environment than the indoor environment. The main effect of trial was not
statistically significant, F (1,14)=1.513, p =.239. The main effect for time also was not
statistically significant F (1,14): .535, p = .476. The condition and tial main effects were
confounded by a significant Condition x Trial interaction F(1,14)=5.806,p:.030. This
clouded the issue on inferring the outdoor environment to be perceived more positively
than the indoor environment. A Tukey HSD post hoc test revealed that this interaction
was due to statistical significance between trial 1 and trial 2 of the indoor condition only
(Table 8). That is, the subjects' perception of the environmental conditions during the
second indoor running session was more favorable than in the frst indoor running
session. Therefore, these results do not confound the findings that the perception of
outdoor exercise was more favorable than indoor exercise.
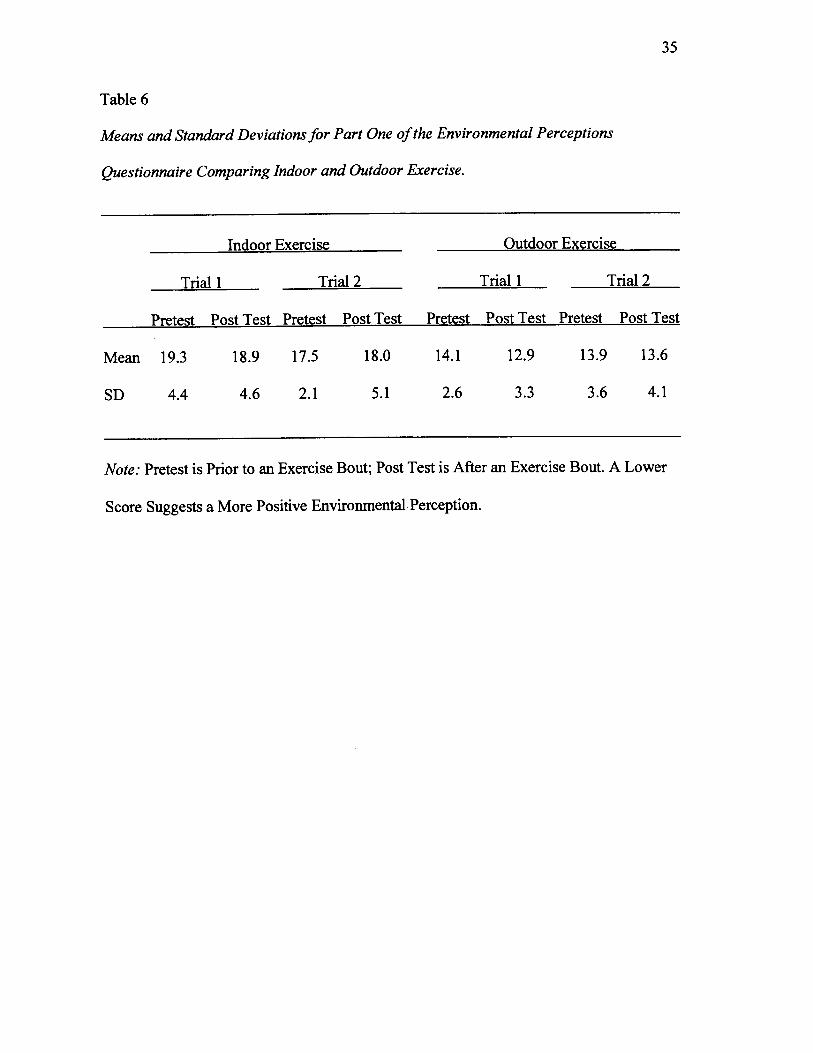
35
Table 6
Means and Standard Deviations for Part One of the Environmental Perceptions
Questionnaire Comparing Indoor and Outdoor Exercise-
Indoor Exercise Outdoor Exercise
Triat I Tnal2 Trial I Tial2
Pretest Post Test Pretest Post Test Pretest Post Test Pretest Post Test
Mean 19.3 18.9 17.5 18.0 14.1 12.9 13.9 13.6
SD 4.4 4.6 2.1 5。 1 2.6 3.3 3.6 4.1
Note: Pretest is Prior to an Exercise Bout; Post Test is After an Exercise Bout. A Lower
Score Suggests a More Positive Environmental Perception.
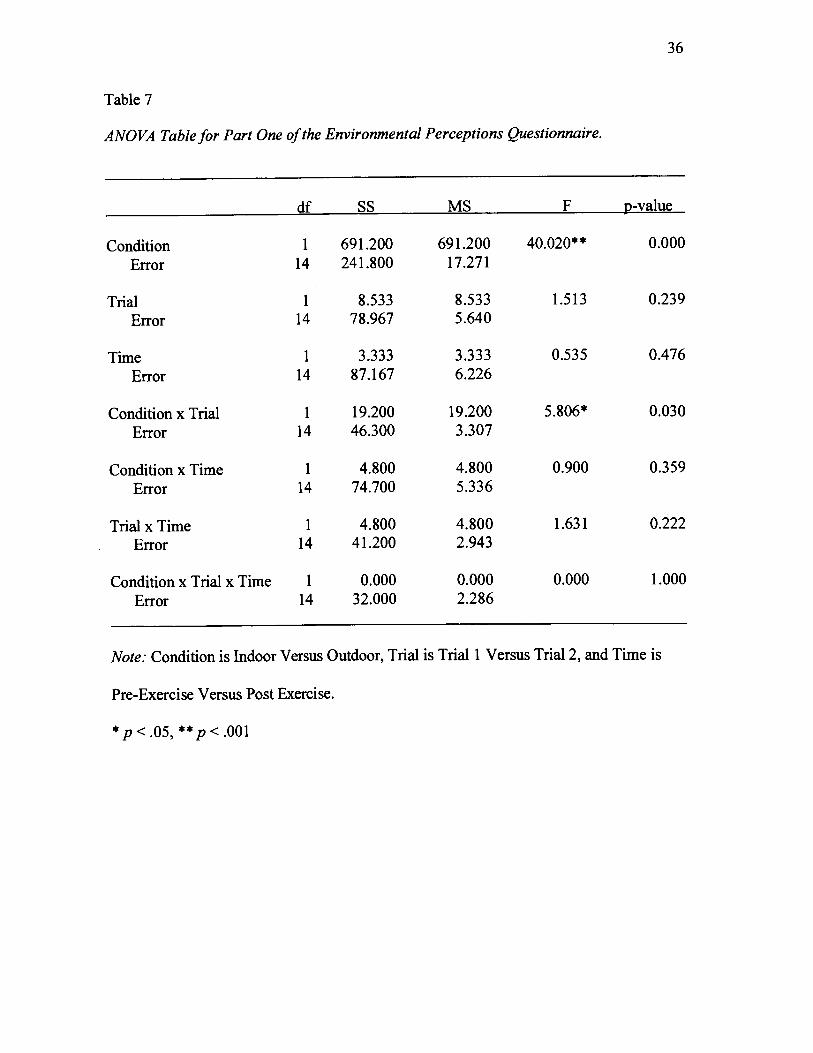
36
Table 7
ANOVA Tablefor Part One of the Environmental Perceptions Questionnaire.
Condition 1 691.200 691.200 40.020** 0.000
Error 14 241.800 17 -271
Trial 1 8.533 8.533 1.513 0.239Error 14 78.967 5-640
Time I 3.333 3.333 0.535 0.476
Error 14 87.167 6.226
Condition x Trial I 19.200 19.200 5.806* 0.030
Error 14 46.300 3.307
Condition x Time I 4.800 4.800 0.900 0.359
Error 14 74.700 5-336
Trial x Time I 4.800 4.800 1.631 0.222
Error 14 41.200 2-943
Condition x Trial x Time I 0.000 0.000 0.000 1.000
Error 14 32.000 2.286
df SS MIS F D… Value_
Note: Condition is Indoor Versus Outdoor, Trial is Trial 1 Versus Tialz, and Time is
Pre-Exercise Versus Post Exercise.
*p<.05,**p<.001
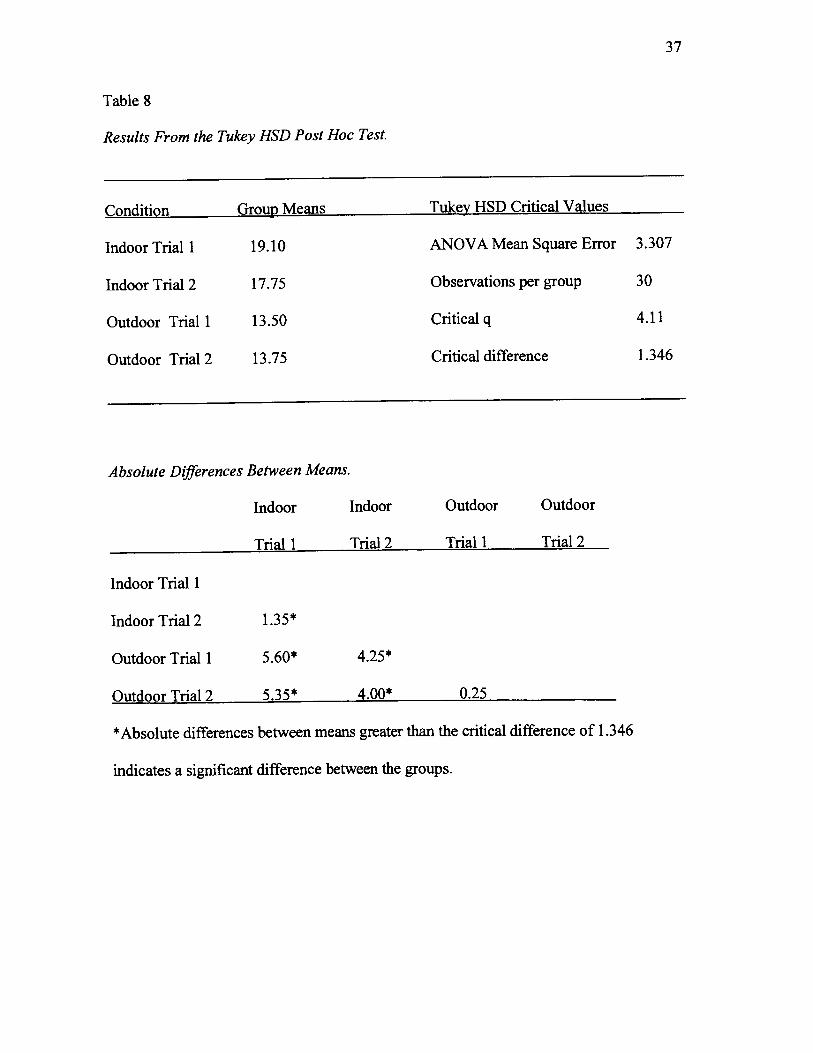
37
Table 8
Rθs“Jrs Frο″″θr″んり IsD Pο s′ 〃bε ■ sム
Indoor Trial l
lndoor T五 a12
0utdoor Trial l
Outdoor T五a12
19。 10
17.75
13。50
13.75
ANOVA Mean Square Error 3.307
Observations per group 30
Critical q 4.11
Critical difference 1.346
Absolute Dffirences Between Means.
Indoor Indoor Outdoor Outdoor
Trial l Tria1 2 Trial l T五 a12_
Indoor Tria1 1
1ndoor Tria1 2
0utdoor THa1 1
1.35ホ
5.60* 4。25*
中Absolute difFerences between means greater than the c五 tical dinbrence of l.346
indicates a signiflcant difference between the groups.
38
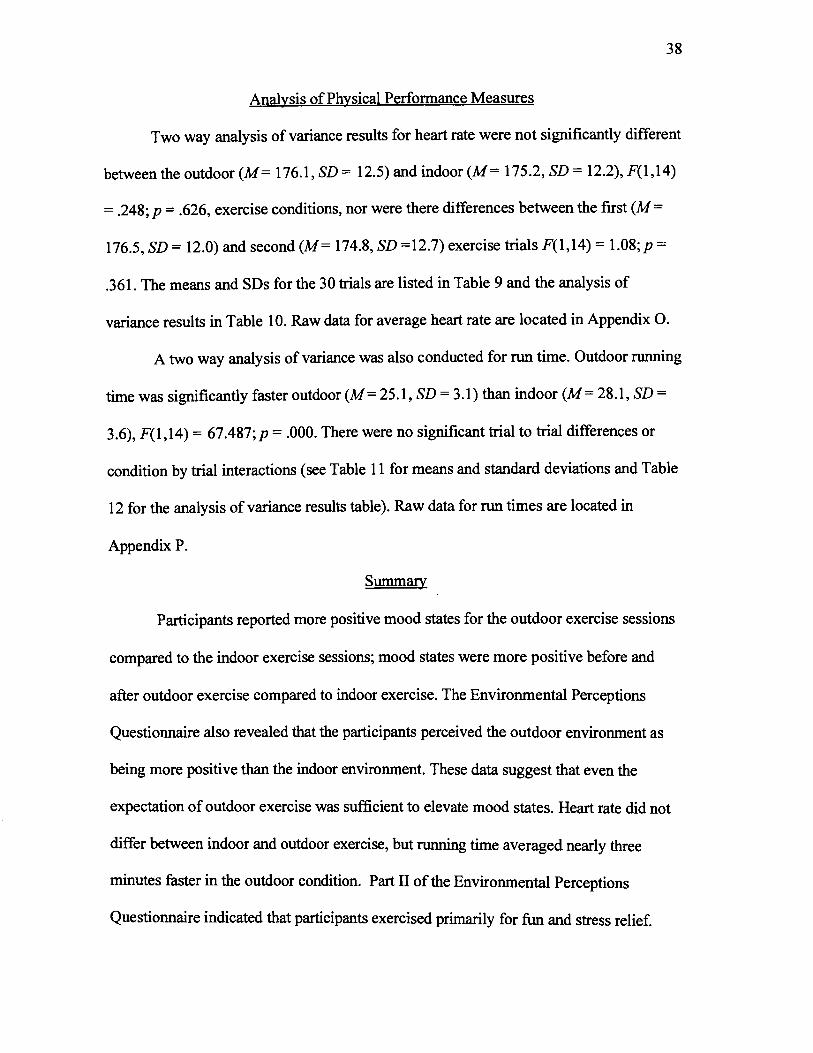
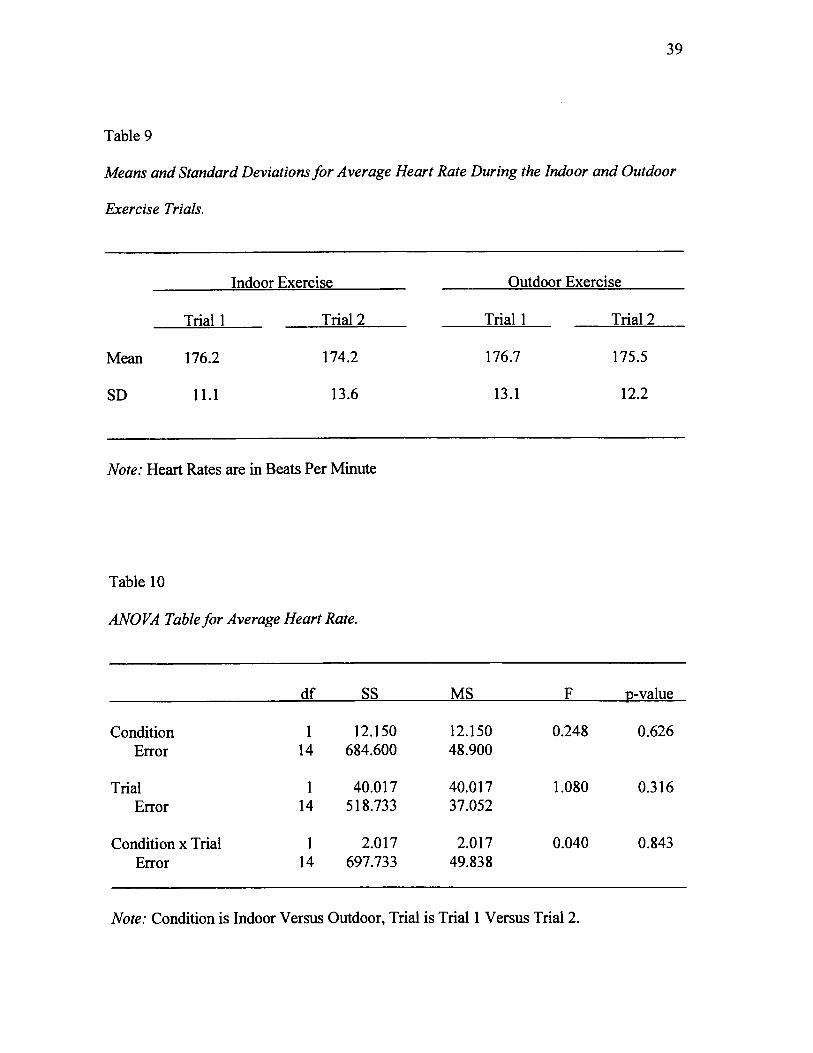
Anal]rsis of Physical Performance Measures
Two way analysis of variance results for heart rate were not significantly different
between the outdoor (M: 176.l,SD: 12.5) and indoor (M: 175.2, SD: 12.2), F(|,14)
= .248; p = .626, exercise conditions, nor were there differences between the first (M:
176.5,SD: 12.0) and second (M= 174.8, SD:12.7) exercise trials F(I,14) : 1.08;p:
.361. The means and SDs for the 30 nials are listed in Table 9 and the analysis of
variance results in Table 10. Raw data for average heart rate are located in Appendix O.
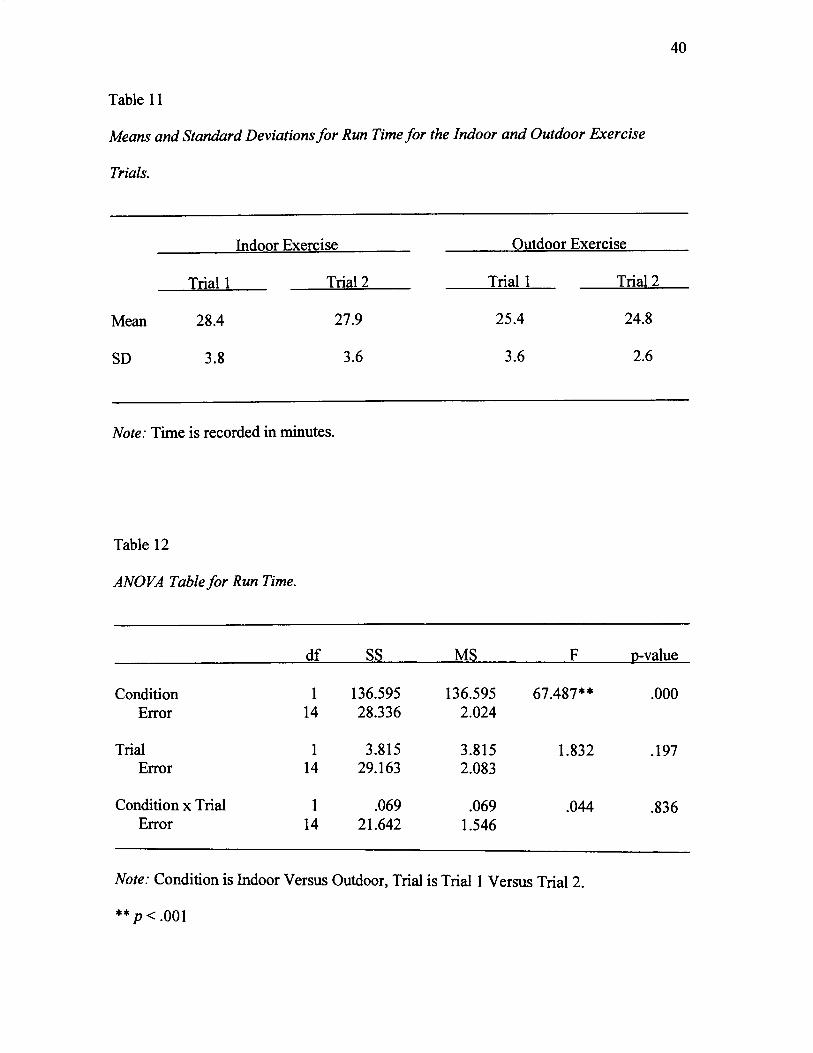
A two way analysis of variance was also conducted for nrn time. Outdoor running
time was significantly faster outdoor (M:25.t, SD:3.1) than indoor (M:28.1, SD:
3.6), F(1,14): 67.487;p = .000. There were no significant trial to trial differences or
condition by trial interactions (see Table 1l for means and standard deviations and Table
12 for the analysis of variance results table). Raw data for run times are located in
Appendix P.
Summary
Participants reported more positive mood states for the outdoor exercise sessions
compared to the indoor exercise sessions; mood states were more positive before and
after outdoor exercise compared to indoor exercise. The Environmental Perceptions
Questionnaire also revealed that the participants perceived the outdoor environment as
being more positive than the indoor environment. These data suggest that even the
expectation of outdoor exercise was sufficient to elevate mood states. Heart rate did not
difter between indoor and outdoor exercise, but running time averaged nearly three
minutes faster in the outdoor condition. Part II of the Environmental Perceptions
Questionnaire indicated that participants exercised primarily for fun and stress relief.
39
Table 9
Means and Standard Deviationsfor Average Heart Rate During the Indoor and Outdoor
Exercise Trials.
Indoor Exercise Outdoor Exercise
T五al l THa1 2 THal l THa1 2
Mean 176.2 174。 2 176.7 175.5
SE) 11。 1 13.6 13.1 12.2
Note: Heart Rates are in Beats Per Minute
Table 10
ИNO″ rabJθ /ar Иソθrarルarr R確 .
df SS MS F D‐ Value
Condition l 12。 150 12.150 0。 248 0.626
Error 14 684.600 48。 900
THal 1 40.017 40.017 1.080 0。 316
Error 14 518.733 37.052
Condition x THal 1 2.017 2.017 0.040 0.843Error 14 697.733 49.838
助 た「Conduon is lndoor Verslls Outdoor,Trialis Tria1 l Versus T五 a12.
40
Table ll
滋 αパ α″′Sra″盪7グ DθソJα′:0“s/o/R“″η″θ/or ttθ ルαοο″α′グ0“rJOο/Eじθκおθ
ルねJs.
Indoor Exercise Outdoor Exercise
Trial l Tria1 2 THal l THa1 2
Mean 28.4 27.9 25。 4 24.8
SE) 3.8 3.6 3.6 2.6
Nore: Time is recorded in minutes.
Table 12
ИⅣO″ 物b々 /o″ R“″ri″θ.
df SS MS ___ _ F D‐ValuC
Condition l 136.595 136.595 67.487** .000Error 14 28.336 2.024
T五a1 1 3.815 3.815 1.832 .197Error 14 29。 163 2.083
Condition x T五 a1 1 .069 .069 .044 .836Error 14 21.642 1.546
焔 たr Condition is lndoor Versus Outdoor,T五 al is Trial l Verslls T五 a12.
**′ <・001
Chapter 5
DISCUSSION
It has been shown that aerobic exercise increases positive mood states (McGowan
et al., 1993;' Morgan, 1984; Rudolph & McAuley, 1995) and that the exercise
environment can affect mood states by either inhibiting positive mood states or
encouraging them (Canter, l96l; Fillingim & Fine, 1986; Katula et al., 1998). Results
from the current study support these data as exercisers had a more positive mood states
when exercising outdoors compared to indoors.
Participants reported more positive mood states on the POMS TMDS both before
and after outdoor exercise as compared to indoor exercise. Thus, it appears that even the
expectation of outdoor exercise was sufficient to raise mood states and create a positive
exercise experience. This finding supports the hypothesis that positive exercise
environments increase positive mood states, and adds new information about the value of
environmental expectations on mood state. For example, Harte & Eifert (1995) reported
more positive mood states after exercise in outdoor trials compared to indoor exercise
trials, but did not report on mood states at the start of the exercise sessions. Katula et al.
(1998) also reported that subjects had greater increases in self-efficacy in an exercise
environment of their choice but did not report feelings of self-effrcacy prior to the
exercise session.
In the current study, it appears that subjects' mood states were more positive
before exercising when it occurred in the subjects' preferred environment. This suggests
that the environment strongly impacted mood state, not just the exercise alone.
41
42
The more positive mood states reported for outdoor exercise could be due to the
participants' reports that they usually exercised outdoors rather than at home or in a
stnrctured class, and that they preferred the outdoor environment rather than a
temperature controlled indoor environment. Thus, it is difficult to determine if the more
positive mood states were a result of outdoor exercise pe r se ) or simply that the
participants exercised in their preferred environment. However, the participants also
described their ideal exercise environment as one that was wann. This is in contrast to the
average outdoor temperature during the outdoor trials of 61.9 degrees Fatrenheit (this is
best described as chilly). The subjects, thus, preferred the outdoor environment even
though the temperature was not as warn as they would have liked. From these data it can
be inferred that moderate differences in temperature (i.e., the difference between wann
and chilly) may have little influence on environmental perceptions or exercise mood
states.
On the other hand, previous research has shown that wide differences or extremes
in temperature may markedly alter one's environmental perception. Maw et al. (1993)
manipulated environmental temperatures in a contolled laboratory setting, and found that
their subjects felt worse and worked harder in a hot environment compared to a cool
environment. In the current study, although subjects stated in the questionnaire that they
preferred a warn environment, they actually had a greater increase in positive mood
states in the cooler of the two environments. Clearly, further research is needed to
examine indoor and outdoor temperatures ranges and their effect on mood states. This
current study was not designed to look at temperature specifically but rather the overall
surroundings.
43
Mood states generally became more positive after exercise for both indoor and
outdoor exercise, but this effect was not statistically significant (p: .055). A larger
sample size may have resulted in a statistically significant effect, as many other studies
have shown an increase in mood states following moderate intensity exercise (McGowan
et al., 1993; Morgan, 1984; Rudolph & McAuley, 1995). Examples of studies with larger
sample sizes that did have a significant increase in positive mood states after exercise
were Berger et al. (1988) with 387 subjects, Berger and Owen (1998) with 9l subjects,
and McGowan et al. (1996) with 28 subjects.
Following outdoor exercise, positive mood states were enhanced when compared
to indoor exercise, suggesting that exercise alone was not able to compensate for a less
preferred environment. Current data also indicate that a non-preferred exercise
environment need not promote a negative exercise experience. This finding is in contrast
to earlier studies showing a decrease in positive mood states during exercise in
unfavorable environments. A reason for these differences probably lies in the specific
nature of the environments. In the current study, the indoor environment was not
necessarily unfavorable, it was simply not preferred. In confrast Spink (1992) and Katula
et al. (1998) found that participants with a low self-image did not like exercising in public
or in front of mirrors. In addition, studies in which the environment has forced an internal
focus of attention, such as attending to breathing sounds, reported less positive mood
states during exercise (Filingim & Fine, 1986; Harte & Eifert, 1995). It appears that
these data indicate is that specific featr.ues of the environment that influence mood states
are dependent on individual preferences.
44
Average heart rate for the 3.4 mile run did not differ between the indoor and
outdoor exercise. This is surprising considering that participants completed the outdoor
course nearly three minutes faster than the indoor course. This could be due to a few
factors. Firs! courses may not have been equivalent. For example, downhill sections of
the outdoor run may have enabled the runners to speed up the time without an increase in
heart rate. The overall change in elevation for the outdoor trail, though, was zero. Second,
some runners might have cut corners outdoors, effectively decreasing the distance. Both
of these explanations seem insuffrcient to fully explain a three minute differential. Third,
it may be that the more positive experience outdoors had a psychophysiological effect on
the runners, enabling them to run faster without a concommitant increase in heart rate (or
just the opposite for the indoor environment). Indeed, many of the participants admitted
to slowing the teadmills down during their run as they did not enjoy their time on the
treadmill. Last, the warn indoor temperatue could have also been a factor in the slower
running speed indoors. Maw et al. (1993) reported that subjects felt they worked harder in
a hot environment, which is consistent with thermoregulatory stress. If subjects felt they
were becoming overheated or working harder, they may have slowed the feadmills
down. This is speculation because this study was not designed determine why subjects
slowed the treadmill, or if they felt the 80.2 average indoor temperature was too warm.
In sum, with this participant group, the outdoor environment created a more
positive exercise experience than the indoor environment in relation to mood states and
running time. Whether these results would hold true for less fit persons or persons of a
different age category, is yet to be determined.
Chapter 6
SUMMARY, CONCLUSIONS, AND RECOMMENDATIONS
Summa{v
Overall, the participants in this study perceived outdoor environments more
positively than indoor environments. In accord, participants had more positive mood
states both before and after running outdoors than indoors. The average heart rates were
the same outdoor and indoor but running performance was faster outdoor.
Conclusions
When individuals perceive their exercise environment positively they generally
will have more positive mood states than when they perceive the environment less
favorably. In the curent study participants had more positive mood states when running
outside than when running indoors on a treatnill. Participants may perform better in an
environment they perceive more positive. Indoor and outdoor running environments,
especially treadmill versus trail running, are perceived differently. The act of running or
performing aerobic activity is not the only component in exercise prescription for
managing mood states. The location where exercise takes place can influence the benefits
of aerobic exercise for managing mood states.
When writing an exercise prescription for the purpose of managing a client's
mood states, it is important to consider the client's preferred exercise environment. When
exercising, it is important to feel positive about the surroundings. Exercising in an
environment that is perceived negatively could result in decreased mood states and,
ultimately, poor performance.
45
46
Recommendations For Further Study
Several questions were left unanswered by the current study. First, what was it
about the outdoor exercise that led to faster run times? Whether this was a
psychophysiological consequence of an increased mood state, or a methodological
problem, is worth examining more closety. In conjunction with this suggestion, it would
be important to assess the running of persons whose most preferred exercise environment
is indoors. That is, would the running times be faster for persons running indoors on a
treadmill (i.e., compared to outside) if their preferred environment were indoors?
Second, would the current findings differ if the exercise mode and other
environmental factors were changed? For instance, would bicycling outdoors versus
ergometer cycling indoors change these results? Would exercising outdoors only on
wann and sunny days enhance positive mood states to an even greater degree? Third, it
would be useful to examine different populations such as elders versus youth, or persons
with depression or anxiety. For example, would elders have the same preferred exercise
environments as young adults, and would this make a difference in mood states benefit of
exercise?
Last, Gould and Weinberg (1999) stated that the perception of an environmental
demand is different from person to person. One child may perceive the dark as scary,
another child may perceive the dark to be non-threatening. This is also the case for
exercise environments. One person may perceive an indoor fitness center negatively
while another may perceive it positively. For futwe Sdy, rather than changing the
environment to please the individual, it would be of interest to change the individual's

47
perception of the environment. That is, instead of finding the ideal exercise environment
for an individual, could individuals be taught to see every exercise environment as ideal?
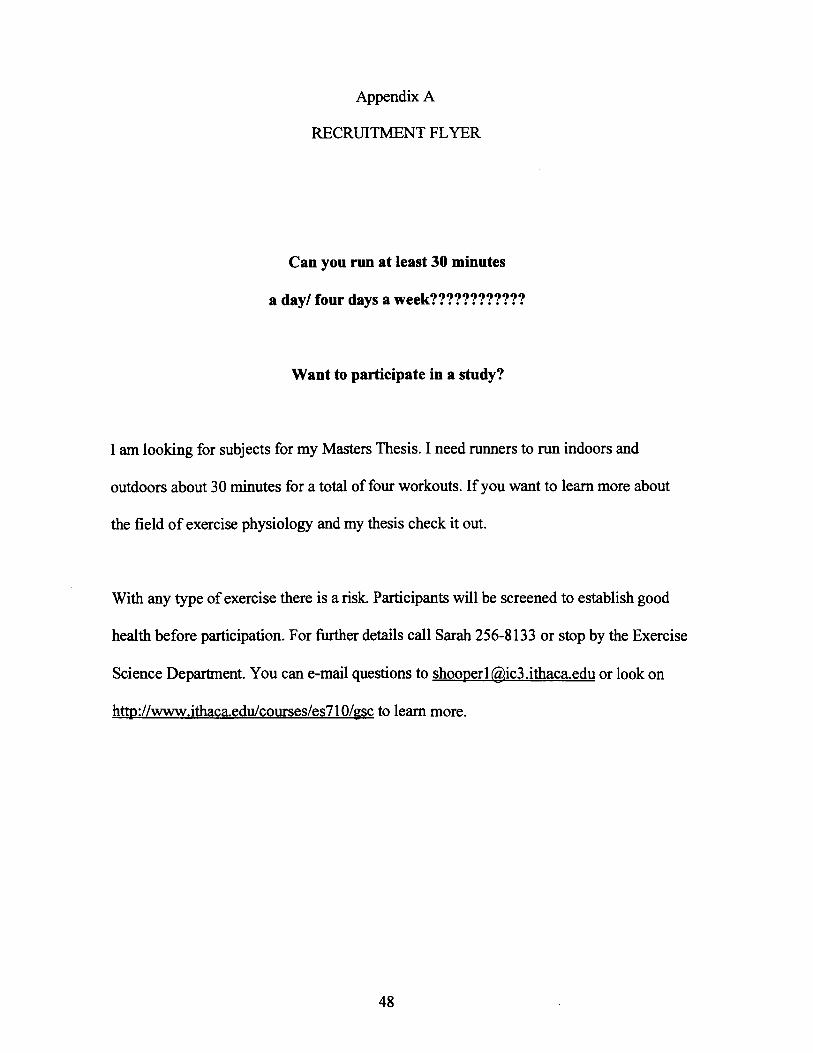
Appendix A
RECRLII¶MENT FLYER
Can you run at least 30 minutes
a dtyl four days a week????????????
Want to participate in a study?
I am looking for subjects for my Masters Thesis. I need runners to run indoors and
outdoors about 30 minutes for a total of four workouts. If you want to leam more about
the field of exercise physiology and my thesis check it out.
With any type ofexercise there is a risk.Participants will be screened to establish good
health before participation.For fuJher details call Sarah 256-8133 or stop by the Exercise
Science Deparmento You can e‐ Inall questiolls to [email protected] or look on
httD:〃…
.ithacaoedu/collrses/es710/Qsc to learn more.
48
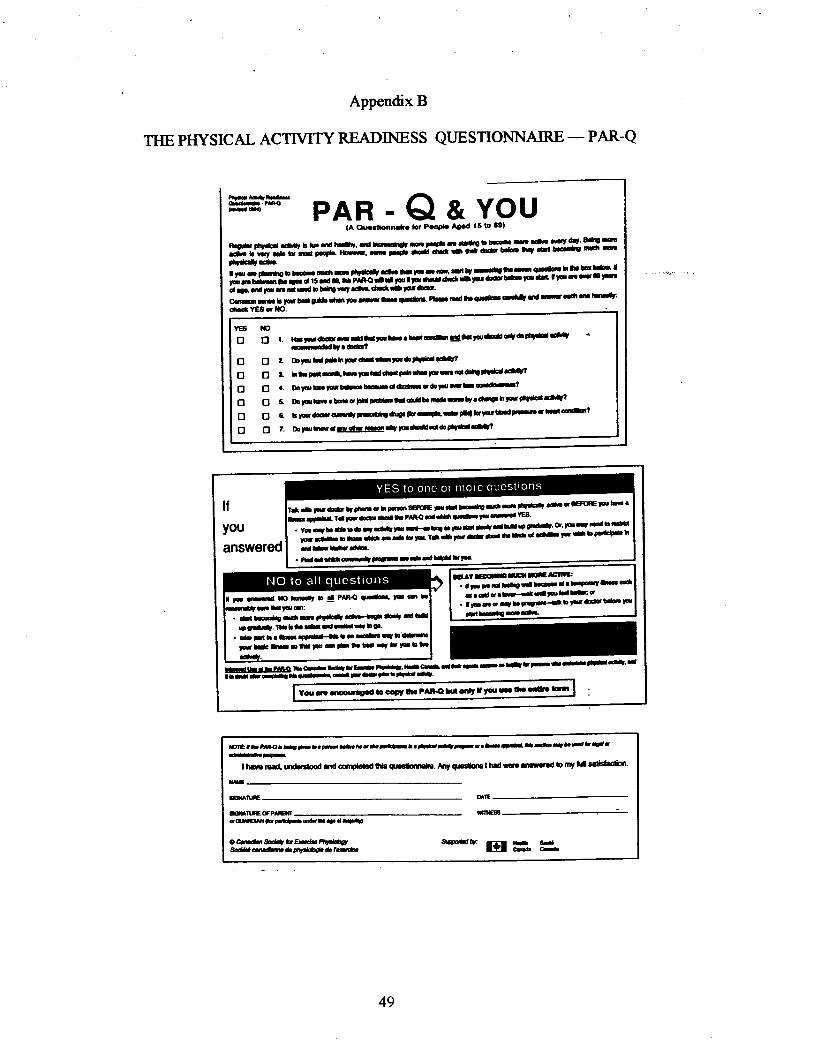
Appendix B
THE PTrySICAL ACTTVITY READINESS QI]ESTIONNAIRE - PAR-Q
Efftr PAR, O&You(A Clr.rdonilt tot PoP" Ae'd 15 to 3e'
nfr- F, d, a l, d tltt- r5 rll E Fd r-'rtt I d E a fr' q A't ts!
df, h n!, * b !d4. ffi- E @ E E -
r@D nt E:E E m
ffidf,.IFr np.rtlb E-ild,-mffi -.EF,-!C. -!t3!ffiEfhsgH.:riintiiti.Ird rs t!tr rrPAno-IFrrrqtlEl'ld-Fr! Ia, E rE n E d D Ee q d0il* F,r'Cqmr-Il turb-l eubrtnr! mtt-edr PbldfrC-tt'c"d tr'dlolrn*麒 VES● 7Ю
Ю
ロ
瑯
ロ t. lsFr(Ert-xFhrEEttEliFrd'f o#ldtrud!YrtEl
tr O 2 tbFrSr-htuicEra-Fro#d!?O O t hfr0dtEathFrE(l.r-J-F'nc'ddfd#df,1O O a. OorqrbtqrEDh-dffi,&Prbdr?tr D It tbFrln.tst qprrffrrd/5br-cttrdrIrhF'#drtt
tr O a bF @ontrt-tlG{!{tr*,-frtsrutdFr'Er6tt?tr E 7. bFrlEc4!!-!!!grtF|-Id.b#di?
tf
you
answered
- F, (6 !t dE t h Fa Effi F' li ""-I
rd 6 fffi d' a ICFE'q' h"
irrrf r a< il&Oditic-F'EtlYEL. Y-qbrbbrbttdlpHE'rlta-, dt,fioet-*'o'F'r'r-b-tlFi * 5 tE *t -.* af.-tlE p'c &om c ff F *-'rEh
rl&H!-tb.. fr-ffrG.tEEr-drf.Lrr
…. aFrtd*dEJtFrtD-rrarl**5aF'IlI:q
. tpirrt-Fqr-l{ロー
mO―"J ttЮ ―
口 ‐
rr.{[.tlFrq:. tlt boldt -dr m ffi drt-qfr q d|.rr-t rfbbt td-rt!c!
. -F5.-r#-aalrdtlqt{
- tr-f P a rr lr lr rt ! tr n
utrj, h Dm I 4 th 5. F fr b o - S* r. # Q;- a.d *, - A q-d' E t*-I hrrt maA uxL.tlood rrd cond.bd!i.q.*r*E. ArVqldG I Hrsifrsdbmyill#,aclb'L
ccrtts.r,,b*WWdt*naWttfr
~け|□ 鵠 口 :■
49
YES lo orrc or lllole questions
NO to all questiolls
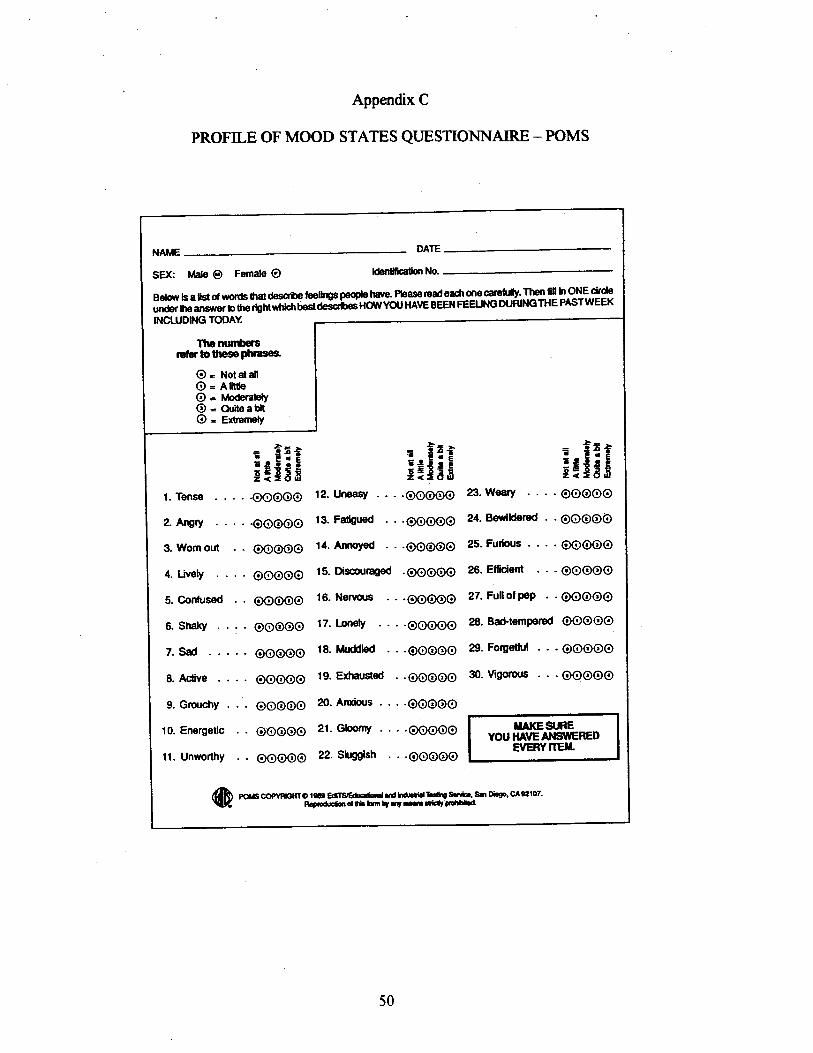
Appendix C
PROFILE OF MOOD STATES QI.JESTIONNAIRE - POMS
SEX: Uale @ fenrate @ 国bttnαnbn No.
Bolow b alstdu,ordsthat@sqbo bolhgs peofle hare. Please rodeadlqte carefrIy.Then f[ h oNE drds
tnrderheans,orosleAem*fr-b;-A;tidHOVi,YO.,HAVEBEENFEEIJNGDURINGTHEPASTWEEK,r"der h"-"r,*,or b sro rlght wfildl besi descfies HOlt, YO.' HAVE BEEN FEEIJI'|G DUHING
INCLUDING TOOAY.
Thenurtors Ir€ftrtothesePhras6.
IO = xotaatt IO= Anue I@ = meraEly IO = ot,iteaut I@ = exrernetv I
;*EiF ==EEH
E=E;;1. Tense . . . . .OOOOO 12. Uneasy''''OOOO@ 23' Weary'''' OOOOO
2. Angty . . . . .OO@OO 13. Faligued'''OOOOO 24' B€wltserod'' OOOOO
3. Womout . . OOOOO 14. ArrrYoyed'''OOOOO 25' Furbus'''' OOOOO
4. Lively . . . . OOOOO 15. Discourru€d 'OOOOO 26' Elficient ' ' 'OOOOO
5. Contused . . OOOOO 16. No.r'ous ' ' 'OOOOO 27' Fullolpep ' 'OOOO@
6.Shaky ..:.@O@O@ 17. lonely ....OO@OO 28'Ba+t€mporcd OO@OO
7. Sad OOOOO 18.1*rddl€d ' . 'OO@OO 29' Forgedul ' ' 'OOOOO
8. Aclive . . . . OOOOO 19. Etduusled . .OOOOO 3()' Mgototts''' OOOOO
9. Grorchy . . . OOOOO 20. Anrious''''OOOOO
io. Enersetic . . ooooo 21. Gbomv . . . .ooooo M11. Unworrhy . . ooooo 22. Shrgpish . . .ooooo I evenvmL
MAKEaJREYOU IIAVE… RED
EVERYrrm
,f,ht rors *o trt E IIs,ErtuaH rd rrdrrhr brg srtr. sr Di.go, c utoT'\Z R+GdE&odritiltlrrrmdrFctd
50
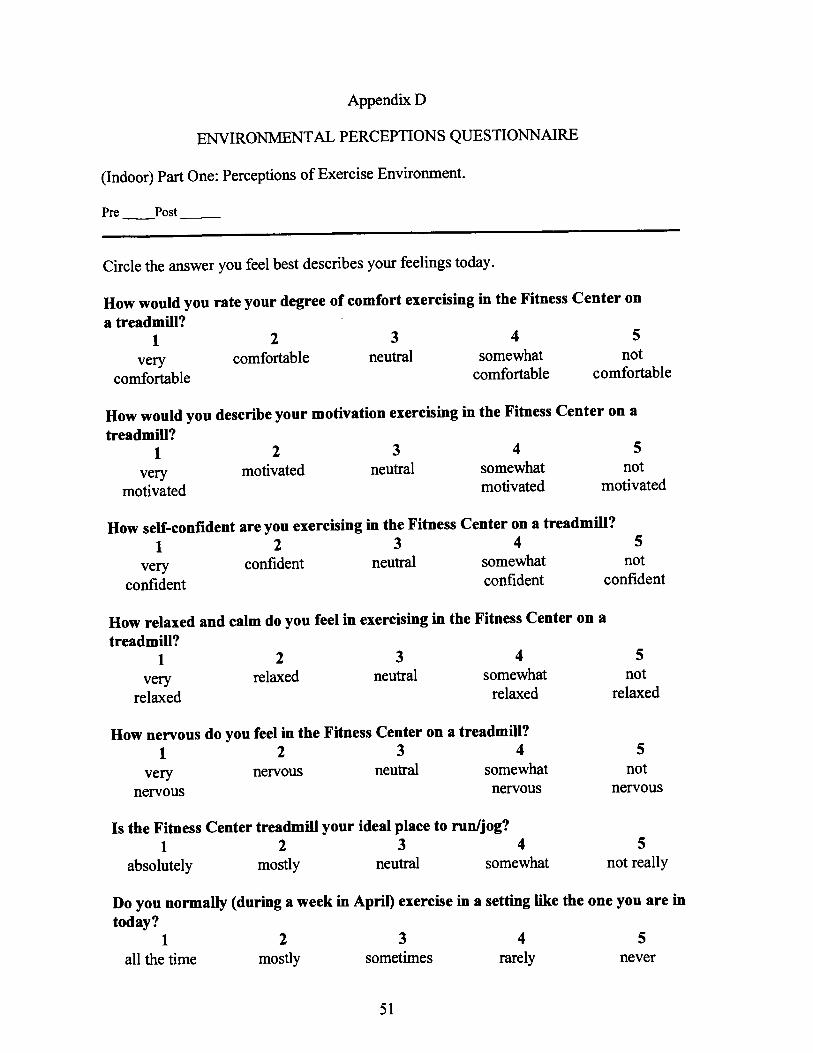
Appendix D
ENVIRONMENTAL PERCEPTIONS QUESTIONNAIRE
(Indoor) Part One: Perceptions of Exercise Environment'
Pre Post
Circle the answer you feel best describes your feelings today.
How would you rate your degree of comfort exercising in the Fitness Center on
a treadmill?12345
How would you describe your motivation exercising in the f itness Center on a
treadmill?12345
very comfortable neutral
comfortable
very motivated neutral
motivated
23relared neutral
somewhat notcomfortable comfortable
somewhat notmotivated motivated
How self-confident are you exercising in the Fitness Center on a treadmill?1234s
vory confident neutral somewhat not
confident confident confident
How relaxed and calm do you feel in exercising in the Fitness Center on a
treadmill?I
veryrelaxed
HoⅥr nervous dO you feelin the Fitness Center on a treadmill?
1 2 3 4very neⅣ olls
neⅣous
4
somewhatrelaxed
neutral somewhatnervous
4
rarely
Su
5面¨
5
notrelaxed
5
never
Is the Fitness Center treadmill your ideal place to run/jog?1234 5
not reallyabsolutely mostly neutral somewhat
Do you normally (during a week in April) exercise in a setting like the one you are intoday?
1
allthc dme Se
3血me
5‐
0S
2
mos■y

52
Appendix D (Continued)
ENVIRONMENTAL PERCEPTIONS QI.JESTIONNAIRE
(Indoor) Part Two: Exercise Preferences.
Check all that apply: Check all that apply:l. My ideal exercise environment includes: 4. I usually (in a normal week in
lots of people
landscape/teesfresh airdry weatherweUwindwarm/sunchilly/cloudstemperature
controlled roomsolitude/quietmusic/noiseother
2. I prefer to jog or runindoor treadmilloutdoor on campus
April) when I exercise.
劇 Ogbike
5. Rank the top three reasonswhy you exercise:
weight managementohvsical theraov/rehabstress reliefmanage depression/moodstrength trainingsocialize/meet people
・ 3.I usually exerciset Check au that apply medica1/health reasons
weight liftswimaerobicsrollerbladeother
sport/team requirementcosmeticfun,I like to exerciseother
with people aroundby myselfindoor gym
at homeoutdoors trackoutdoor trailsin a structured classwith friendsstreets
other

53
Append破 D(Continued)
ENVIRONMENTAL PERCEP′ ΠONS QUESTIONNAIRE
(Outd00う Part One:Perceptions ofExercise Environlnent.
Pre Post
Circle the answer you feel best describes your feelings today.
How would you rate your degree of comfort exercising on the college campus
and track?12345
very comfortable neutralcomfortable
very confidentconfident
somewhcrt notcomfortab,le comfortable
How would you describe your motivation exercising on the colle,ge campus andtrack?
12345very
motivatedmotivated neutral somewhart not
motivate,C motivated
How self-confident are you exercising on the college campus and track?12345
neutral somewhert notconfident confident
How relaxed and calm do you feel in exercising on the college etmpus and
track?
1
very relaxedrelaxed
How nervous do you feel exercising on the college campus and track?1234
34neutal somewhat
relaxed
neutral somewhatnervous
very neⅣ ous
nervous
2
mostly
tnot
relaxed
5not
nervous
Inot really
5
never
Is the college campus and track your ideal place to run/jog ?
1234absolutely mostlY neutral somewhttt
Do you normally (during a week in April) exercise in a setting like the one you are intoday?
4
rarely鵬
l
e■d
3sometimes

54
Appendix D (Continued)
ENVIRONMENTAL PERCEPTIONS QUESTIONNAIRE
(Outdoor) Part Two: Exercise Preferences.
Check all that apply: Check all that apply:l. My ideal exercise sayil6nmGnt includes: 4. I usually (in a normal week in
April) when I exercise.lots of peoplelandscape/treesfresh airdry weatherwet/windwarm/sunchilly/cloudstemperature
controlled roomsolitude/quietmusic/noiseother
2. I prefer to jog or runindoor teadmilloutdoor on campus
with people around
by myselfindoor gymat homeoutdoors trackoutdoor trailsin a structured class
with friends
5. Rank the top three reasonswhy you exercise:
weight managementphysical therapy/rehabstress reliefmanage depression/moodstength trainingsocialize/meet people
3. I usually exercise: Check all that apply medicalhealth reasons
rur/jogbikeweight liftswimaerobicsrollerbladeother
sport/team requirementcosmeticfun,I like to exerciseother
streets
other
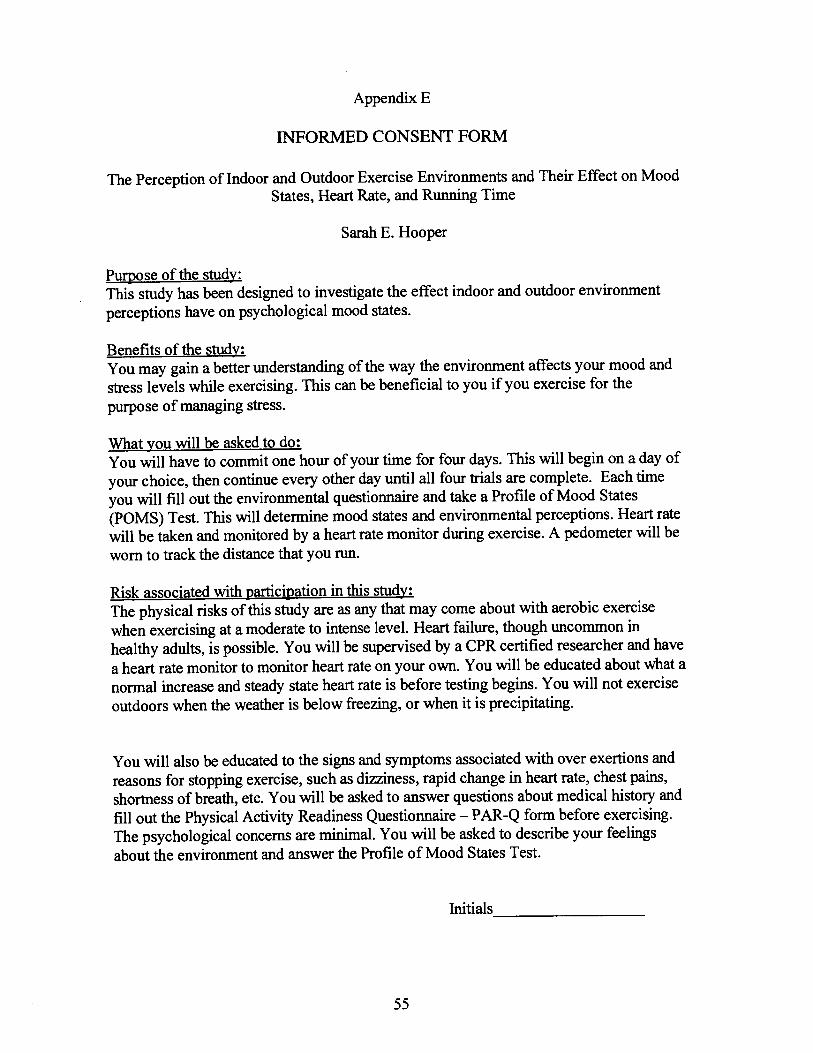
Appendix E
INFORMED CONSENT FORM
The Perception of Indoor and Outdoor Exercise Environments and Their Effect on MoodStates, Heart Rate, and Running Time
Sarah E. Hooper
Purpose of the stud]r:
This study has been designed to investigate the effect indoor and outdoor environment
perceptions have on psychological mood states.
Benefits of the stud),:
You may gain a better understanding of the way the environment affects your mood and
stress levels while exercising. This can be beneficial to you if you exercise for the
purpose of managing stress.
What you will be asked to do:You will have to commit one hour of your time for four days. This will begin on a day ofyour choice, then continue every other day until all four trials are complete. Each time
you will fill out the environmental questionnaire and take a Profile of Mood States
(POMS) Test. This will determine mood states and environmental perceptions. Heart rate
will be taken and monitored by a heart rate monitor during exercise. A pedometer will be
worn to track the distance that you run.
Risk associated with participation in this study:
The physical risks of this study are as any that may come about with aerobic exercise
when exercising at a moderate to intense level. Heart failure, though uncommon in
healthy adults, is possible. You will be supervised by a CPR certified researcher and have
a heart rate monitor to monitor heart rate on your own. You will be educated about what a
normal increase and steady state heart rate is before testing begins. You will not exercise
outdoors when the weather is below freszing, or when it is precipitating.
You will also be educated to the signs and symptoms associated with over exertions and
reasons for stopping exercise, such as dizziness, rapid change in heart rate, chest pains,
shorftress of breath, etc. You will be asked to answer questions about medical history and
fill out the Physical Activity Readiness Questionnaire - PAR-Q form before exercising.
The psychotogical concens are minimal. You will be asked to describe your feelings
about the environment and answer the Profile of Mood States Test.
55
Initials
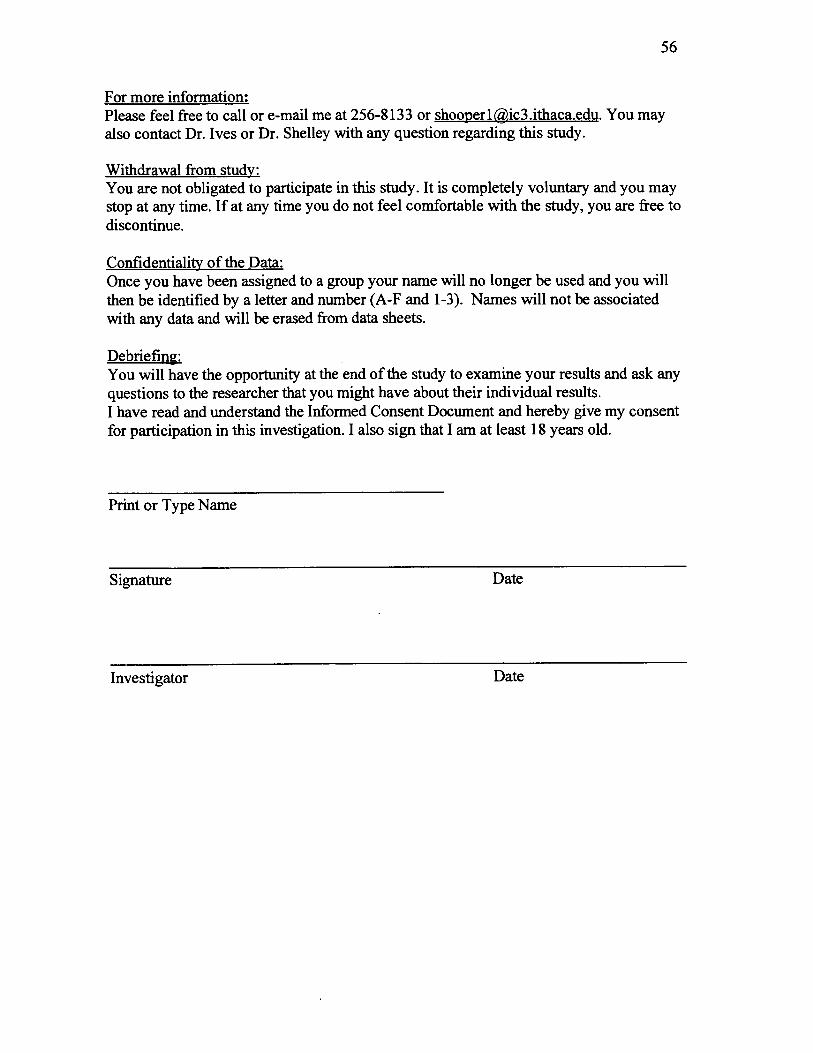
56
For more infol...ation:
Please feel free to ca1l or e‐ mail me at 256-8133 or shoopettCL■ 量堅ユ遼L・ You mayalso contact Dr.Ives or Dro Shelley wlth any quesuon regarding this study.
Withdrawal tton■ studv:
You are not obligated to participate in this study.Itis completely voluno and yOu may
stop at any time.If at any time you do not feel cor」 brtable宙 th the study,you are free to
discontinue.
Confldentialitv ofthe Data:
Once you have been assigned to a group yollr name vnli no longer be used and you w111
then be identifled by a letter and nunber(A‐ F and l-3)。 Names will not be associated
宙 th any data and will be erased ttom data sheets.
DebHeflngl
You宙1l have the oppoJШity atthe end ofthe study to exttlme yollr results and ask any
questions to the researcher that you rnight have about their individual results.
I have read and understand the lnfo.11led Consent Doclllnent and hereby give Fny cOnsent
for participation in this investigation.I also sign thatl am atleast 18 years old.
Print or Type Name
Signature Date
Investigator Date
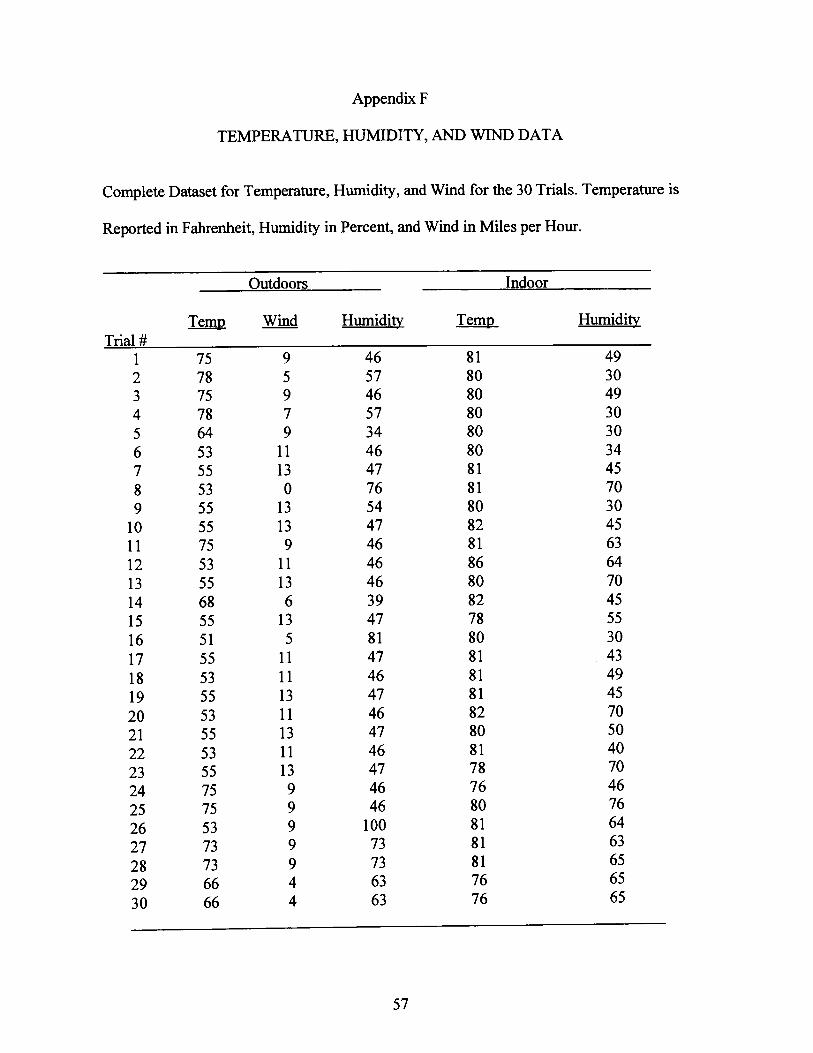
Appendlx F
TEMPERATURE,HU鴨任DITY,AND WIND DATA
Complete Dataset for Temperature,Hunndity,and Wind for the 30 Trials.Temperatre is
Reported in Fabrenheit,HuIIlidity in Percent,and Wind in Miles per Hollr.
Outdoors Indoor
Te:馴ュ Wind Humiditv TemoIHal#
75 9 46 81 49304930
30
34
45
70
30
45
63
64
70
45
55
30
43
4945
70
504070
4676
64
63
65
65
65
78 5 57 80
64 9 34 8053 11 46 80
75 978 7
55 13
53 0
47
75 9 4653 11 4655 13 46
68 6 39
46 8057 80
81
81
8680
82
47 7881 80
81
81
81
82
46 8147 7846 7646 80
9
10
11
12
13
14
15
16
17
18
19
2021
2223
2425
262728
2930
81
81
81
76 8155 13 54 8055 13 47 82
55 1351 5
55 11 4753 11 46
4755 13
53 11 4655 13 47 8053 11
55 1375 975 953 9 100
73 9 73
73 9 7366 4 63 7666 4 63 76
57
H― id量
2
3
4
5
6
7
8
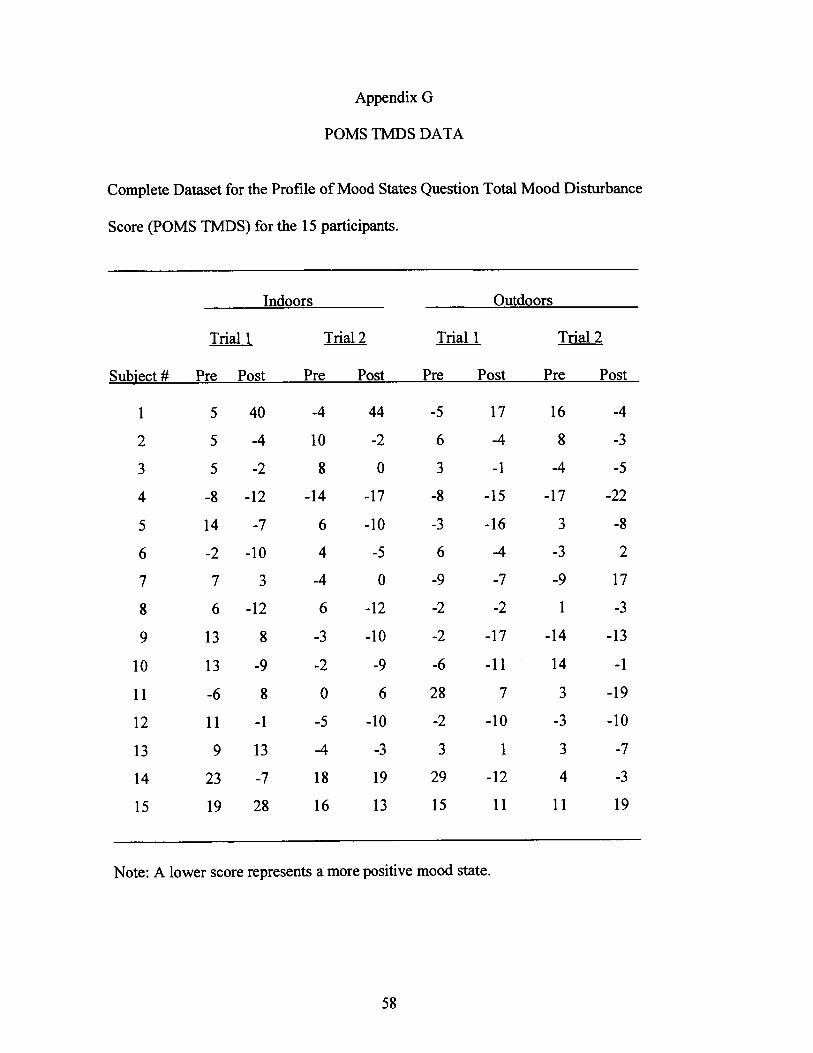
Appendix G
POMSTMDS DATA
Complete Dataset forthe PЮ flle ofMood States QuestiOn TOtal Mood Disubance
Score(POMS TMDS)for the 15 participants.
Indoors Outdoors
Trial I Tial2T五 al l T五a12
Subject # Pre Post Pre Post Pre Post Pre Post
1
2
3
4
5
6
7
8
9
10
11
12
13
14
15
5
5
5
-8
14
-2
7
6
13
13
-6
11
9
23
19
‐7
-10
3 ‐4
-12 6
40 ‐4 44 …5
…4 10 ‐2 6
-2 8
‐12 -14 ‐17
17 16
-4 8
3 …1 -4
‐8 ‐15 ‐17
…3 ‐16 3
-9 -7 ‐9
‐2 ‐2 1
-2 ‐17 ‐14
-6 -11 14
7 3
-10 -3
3 1 3
29 -12 4
15 11 11
6 ‐10
4 -5 6 -4 -3
-4
… 3
-5
-22
… 8
2
17
¨3
-13
‐1
-19
‐10
‐7
‐3
19
8 ‐3 ‐10
-9 ‐2 ‐9
8 0
‐1 -5
0
‐12
6 28
‐10 -2
13 -4 ‐3
…7 18 19
28 16 13
Note: A lower score represents a more positive mood state.
58
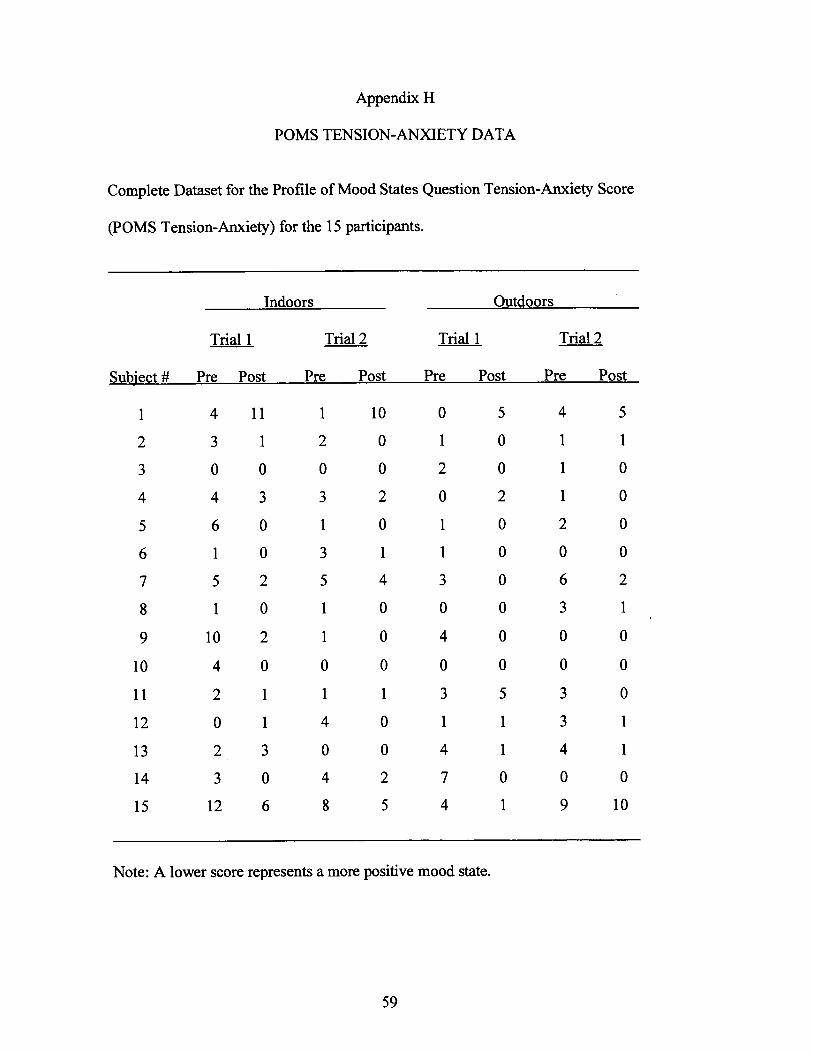
Append破 H
POMS TENSION― ANXIETY DATA
Complete Dataset for the Proflle ofMood States QuestiOn Tension―AⅨiety Score
COMS TensiOn‐ Anxiety)for the 15 participants.
Indoors Outdoors
T五a1l T五 a12THal l
Subject # Pre Post Pre Post Pre Post Pre Post
4 11
3 1
0 0
4 3
6 0
1 0
5 2
1 0
10 2
4 0
2 1
0 1
2 3
3 0
12 6
T五a12
1 10
2 0
0 0
3 2
1 0
3 1
5 4
1 0
1 0
0 0
1 1
4 0
0 0
4 2
8 5
1
2
3
4
5
6
7
8
9
10
11
12
13
14
15
0
1
2
0
1
1
3
0
4
0
3
1
4
7
4
5
0
0
2
0
0
0
0
0
0
5
1
1
0
1
4
1
1
1
2
0
6
3
0
0
3
3
4
0
9
5
1
0
0
0
0
2
1
0
0
0
1
1
0
10
Note: A lower score represents a more positive mood state.
59
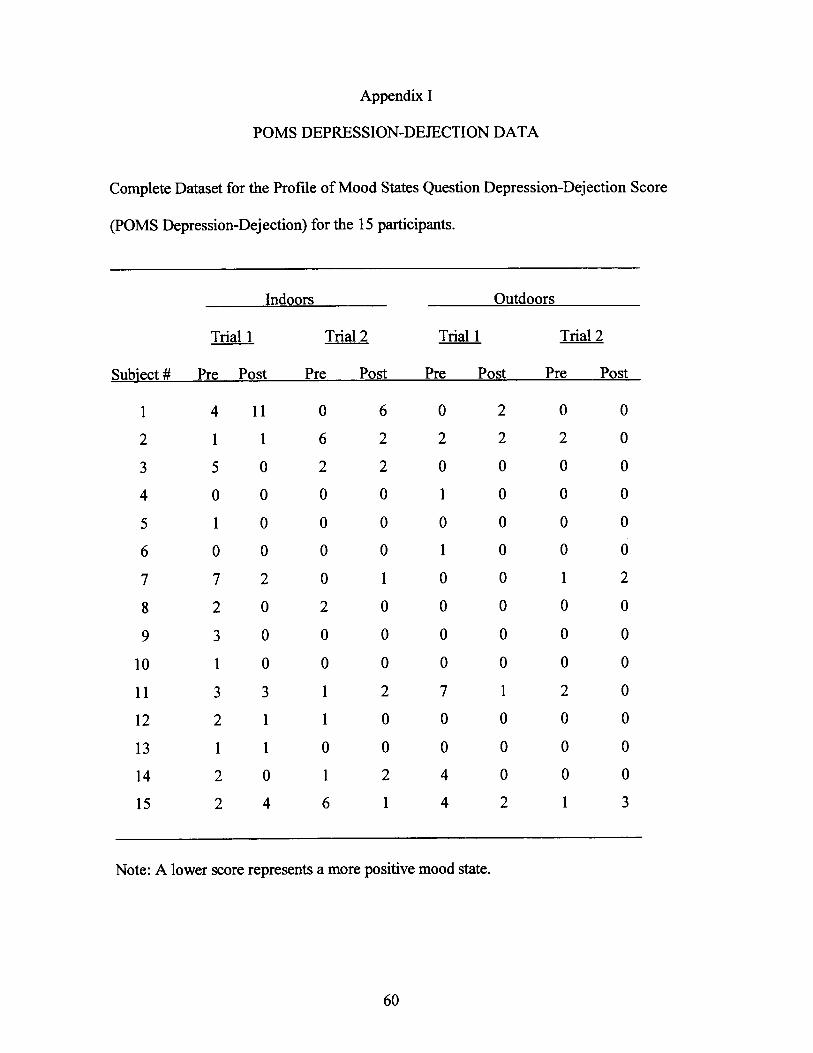
Append破 I
POMS DEPRESS10N‐ DEJECTION DATA
Complete Dataset for thc Proflle ofMood States QuestiOn Depression―Daection score
(POMS Depression‐ DttectiO→ fOr the 15 participants.
Indoors Outdoors
T五al l T五a12THal l THa1 2
Subject # Pre Post Pre Post Pre Post Pre Post
1
2
3
4
5
6
7
8
9
10
11
12
13
14
15
4
1
5
0
1
0
7
2
3
1
3
2
1
2
2
11
1
0
0
0
0
2
0
0
0
3
1
1
0
4
0
6
2
0
0
0
0
2
0
0
1
1
0
1
6
6
2
2
0
0
0
1
0
0
0
2
0
0
2
1
0
2
0
1
0
1
0
0
0
0
7
0
0
4
4
2
2
0
0
0
0
0
0
0
0
1
0
0
0
2
0
2
0
0
0
0
0
0
0
0
0 0
1 2
0 0
0 0
0
2
0
0
0
1
0
0
0
0
0
3
Note: A lower score represents a more positive mood state.
60
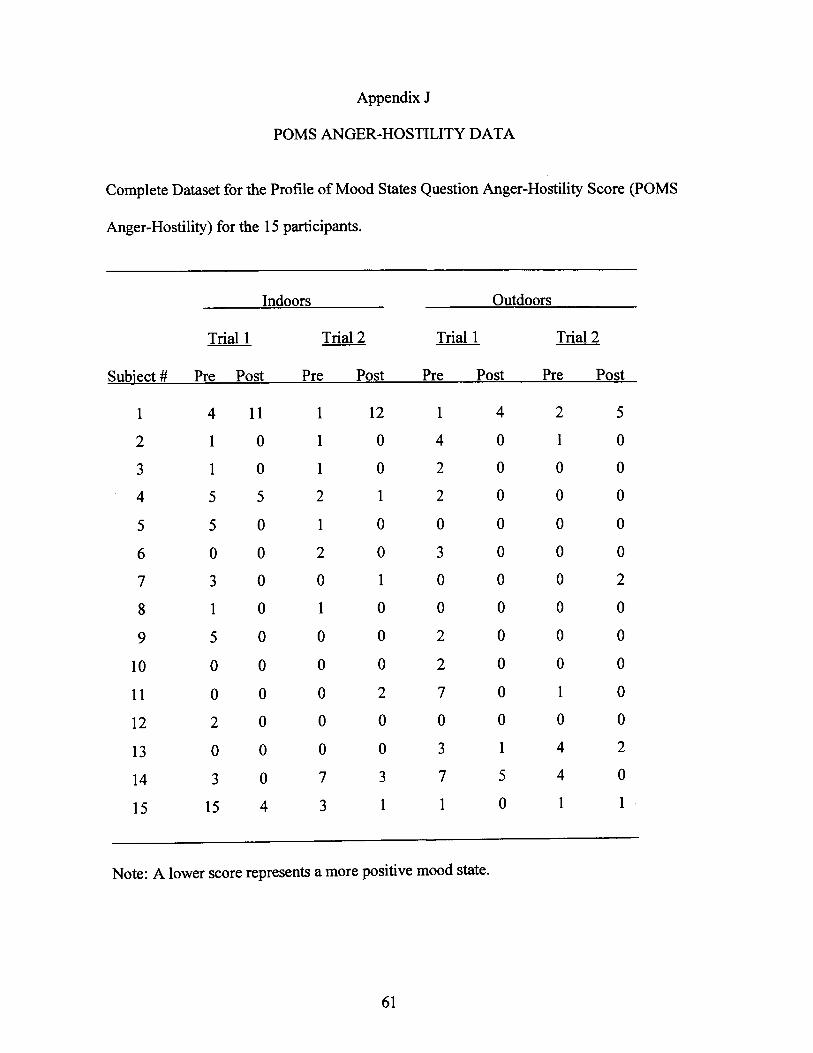
Appendix J
POMS ANGER‐HOSTILITY DATA
Complete Dataset for the PЮ flle ofMood States QuestiOn Anger― Hostility Score(POMS
Anger‐Ho並ility)fOr the 15 participants。
Indoors Outdoors
Trial l T五 a12T五al l Tria1 2
Subject # Pre Post Pre Post Pre Post Pre Post
1
2
3
4
5
6
7
8
9
10
11
12
13
14
15
4
1
1
5
5
0
3
1
5
0
0
2
0
3
15
11
0
0
5
0
0
0
0
0
0
0
0
0
0
4
1
1
1
2
1
2
0
1
0
0
0
0
0
7
3
12
0
0
1
0
0
1
0
0
0
2
0
0
3
1
1
4
2
2
0
3
0
0
2
2
7
0
3
7
1
0
0
0
0
0
1
0
4
4
1
0 1 0
0 0 0
0 0 0
0 0 0
0
2
0
0
0
0
0
2
0
1
0
0
0
0
0
0
0
1
5
0
Note: A lower score represents a more positive mood state'
61
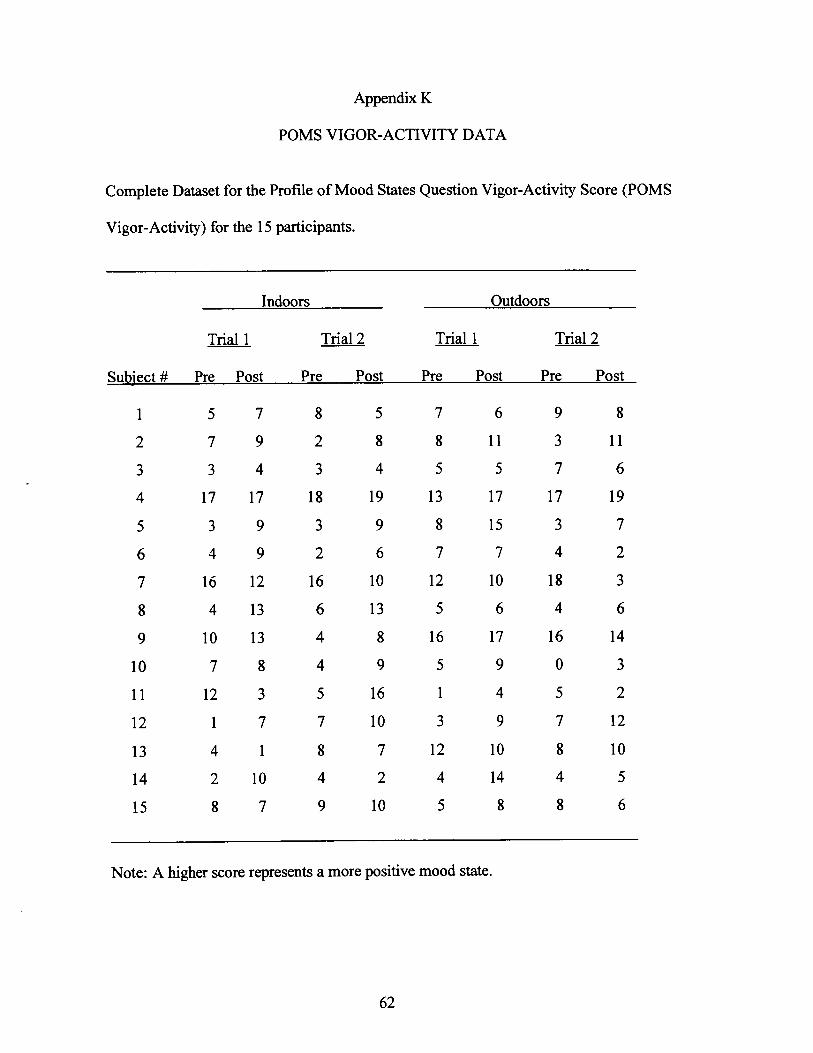
Append破 K
POMS VIGOR‐ACTIVITY DATA
Completc Dataset for the PЮ flle ofMood States QuestiOn vigor… Activity Score(POMS
Vigor―Act市ity)for dle 15 participants.
Indoors Outdoors
T五al l THa1 2
Subiect# Prc Post Pre Post Pre Post Pre Post
1
2
3
4
5
6
7
8
9
10
11
12
13
14
15
5 7 8 5
7 9 2 8
3 9 3 9
4 9 2 6
10 13 4
7 8 4
7 6 9
8 11 3
8
11
34345576
17 17 18 19 13 17 17 19
16 12 16 10 12 10 18 3
4 13 6 13 5 6 4 6
8 15 3 7
7742
8 16 17 16 14
9 5 9 0 3
5 2
7 12
12 3 5 16 1 4
1 7 7 10 3 9
4 1
2 10
8 7 12 10 8 10
4 2 4 14 4 5
8 7 9 10 5 8
Note: A higher score represents a more positive mood state.
62
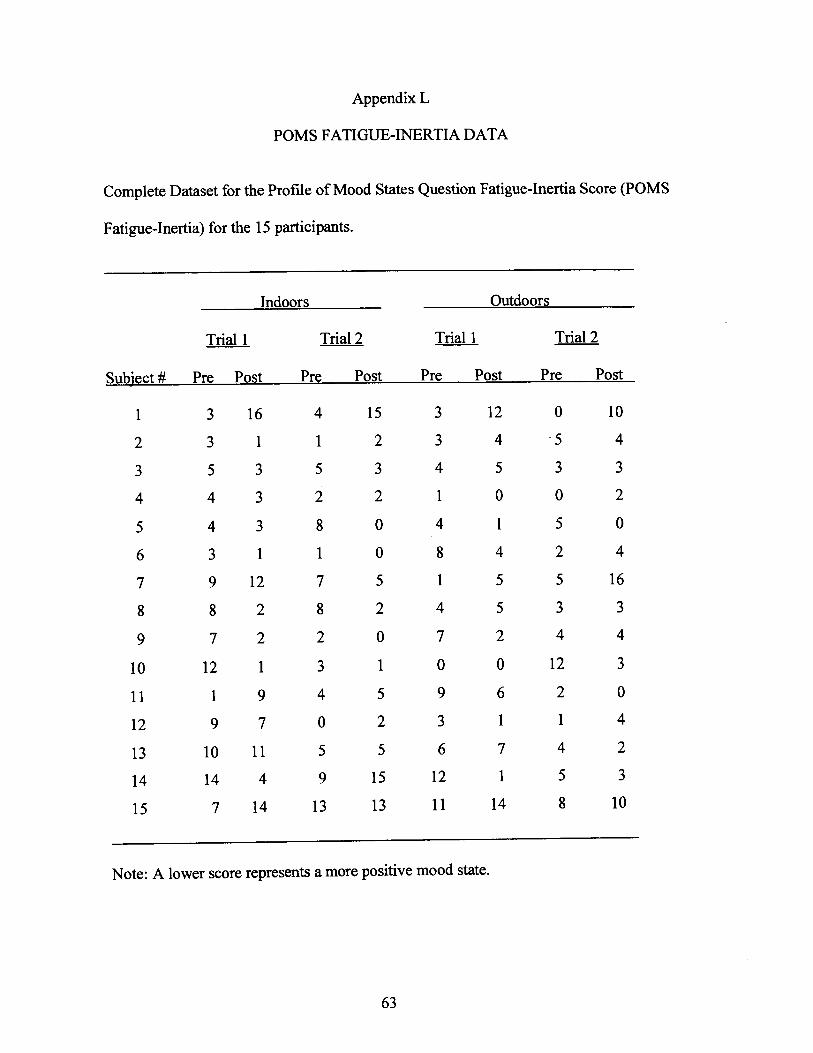
Append破 L
POMSFA■ G駆 ―INERTIA DATA
Complete Dataset for the Proflle ofMood States QuestiOn Fatiguc‐ Inertia Score(POMS
Fatiguc‐ Inerti→ fOr the 15 participants.
Indoors Outdoors
THal l Tria1 2
Subiect# Pre Post PК POSt Prc Pott Pre Po飢
1 3 16 4 15 3 12 0 10
2
3
4
5
6
7
8
9
10
11
12
13
14
15
3
4
1
4
4
3
2
0
1
3
3
3
5
4
4
5
0
1
3 1
9 12
8 2
7 2
12 1
1 9
9 7
10 11
14 4
7 14
08424
5 1 5 5 16
24533
207244
3 1 0 0 12 3
459620
023114
556742
9 15 12 1 5 3
13 13 11 14 8 10
Note: A lower score represents a more positive mood state'
63
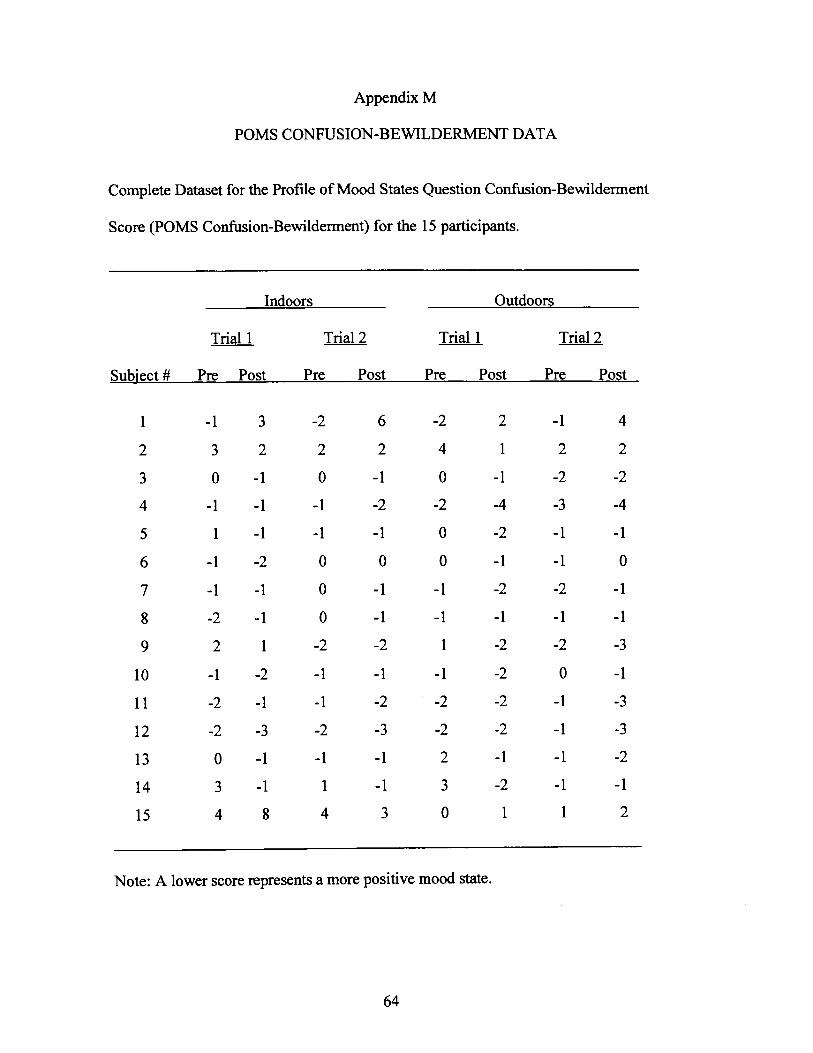
Appendix M
POMS CONFUS10N‐BEWILDERMENT DATA
Complete Dataset for the PЮ ■le ofMood States Question Corば bsion―Bewlldc...lent
Score(POMS COぜusion_Be宙 ldeニ ュ.lent)for the 15 participants.
Indoors
THal l Tria1 2
Outdoors
Trial l T五a12
Subiect # Pre Post Pre Post Pre Post Pre Post
1
2
3
4
5
6
7
8
9
10
11
12
13
14
15
3
2
-1
‐1
-1
‐2
-1
い1
1
-2
-1
-3
-1
-1
8
6
2
… 1
‐2
-1
0
¨1
‐1
-2
‐1
-2
-3
‐1
‐1
3
2
1
-1
-4
‐2
-1
-2
-1
‐2
-2
-2
-2
‐1
… 2
1
‐1
2
-2
‐3
-1
‐1
‐2
-1
‐2
0
-1
-1
-1
-1
1
4
2
-2
‐4
‐1
0
‐1
-1
-3
‐1
‐3
‐3
-2
-1
2
[2
4
0
・2
0
0
・1
・1
1
1
2
2
2
3
0
・2
2
0
・1
・1
0
0
0
・2
¨1
・1
・2
・1
1
4
・1
3
0
・1
1
・1
・1
¨2
2
・1
・2
・2
0
3
4
Note: A lower score represents a more positive mood state.
64
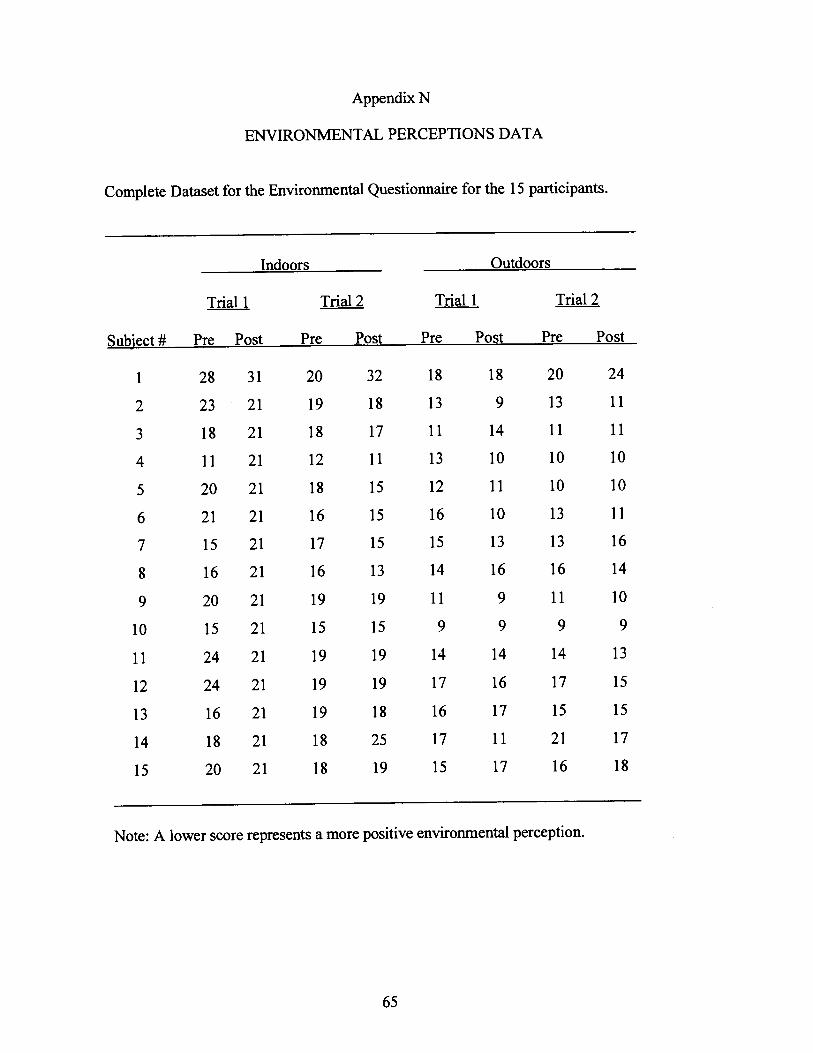
Appendix N
ENVIRONMENTAL PERCEP「 ΠONS DATA
Complete Dataset for the Envttollmental QueStiOnnaire for the 15 participants。
Indoors Outdoors
Trial l Tria1 2
Subiect# PК Pott Pre_Post_Pre Post P“ PO並
1
2
3
4
5
6
7
8
9
10
11
12
13
14
15
28
23
18
11
20
21
15
16
20
15
24
24
16
18
20
31
21
21
21
21
21
21
21
21
21
21
21
21
21
21
20
19
18
12
18
16
17
16
19
15
19
19
19
18
18
32
18
17
11
15
15
15
13
19
15
19
19
18
25
19
18
13
11
13
12
16
15
14
11
9
14
17
16
17
15
18
9
14
10
11
10
13
16
9
9
14
16
17
11
17
20
13
11
10
10
13
13
16
11
9
14
17
15
21
16
24
11
11
10
10
11
16
14
10
9
13
15
15
17
18
Note: A lower score represents a more positive environmental perception.
65
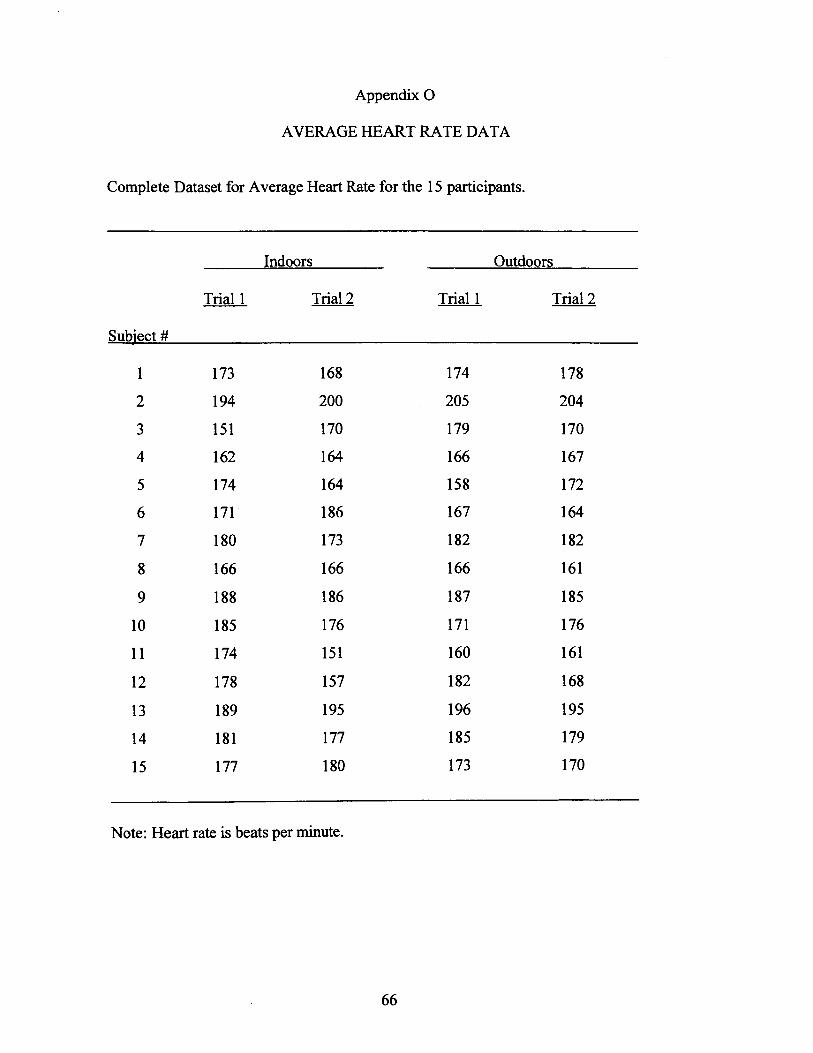
Append破 0
AVERAGE HEART RATE DATA
Complete Dataset for Average Hcart Rate for the 15 participants.
Indoors Outdoors
Trial I Tnal2T五al l T五a12
Subiect#
1
2
3
4
5
6
7
8
9
10
11
12
13
14
15
173
194
151
162
174
171
180
166
188
185
174
178
189
181
177
168
200
170
164
164
186
173
166
186
176
151
157
195
177
180
174
205
179
166
158
167
182
166
187
171
160
182
196
185
173
178
204
170
167
172
164
182
161
185
176
161
168
195
179
170
Note: Heart rate is beats per minute.
66
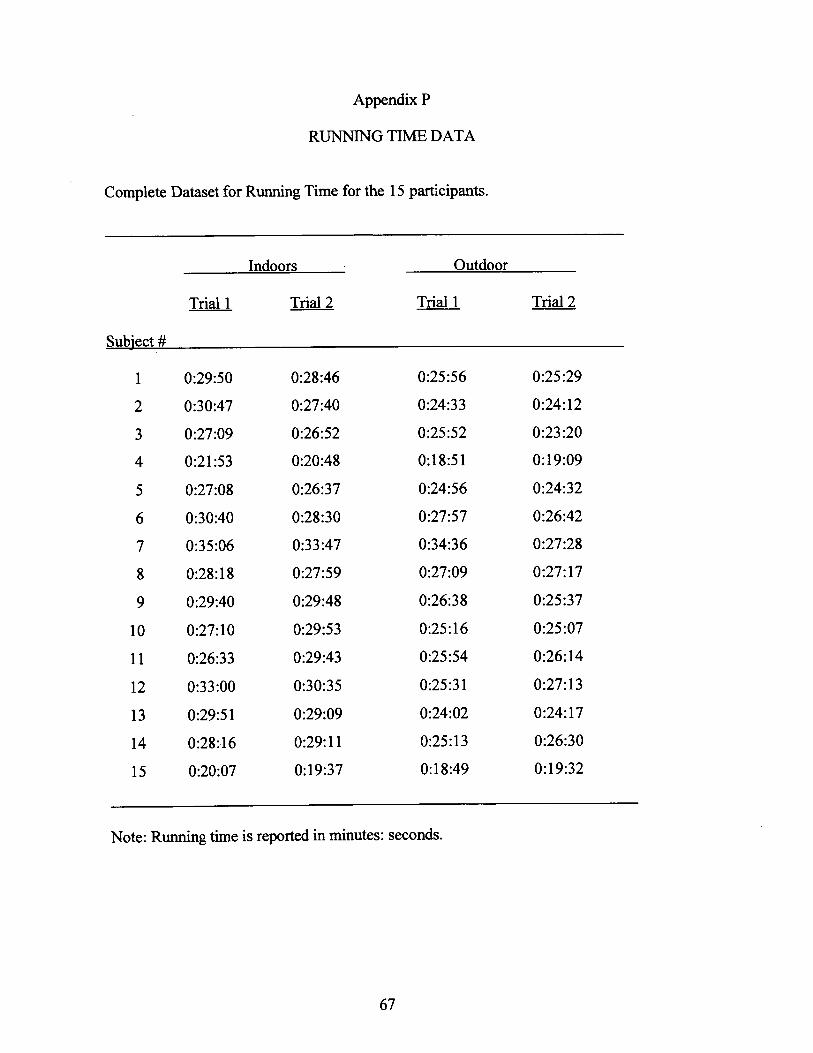
Append破 P
RUNMGl■ ME DATA
Complete Dataset for R―ing Time forthe 15 part‐ icipants.
Indoors
Trial l Tria1 2
Outdoor
Trial I Tnalz
1
2
3
4
5
6
7
8
9
10
11
12
13
14
15
0:29:50
0:30:47
0:27:09
0:21:53
0:27:08
0:30:40
0:35:06
0:28:18
0:29:40
0:27:10
0:26:33
0:33:00
0:29:51
0:28:16
0:20:07
0:28:46
0:27:40
0:26:52
0:20:48
0:26:37
0:28:30
0:33:47
0:27:59
0:29:48
0:29:53
0:29:43
0:30:35
0:29:09
0:29:11
0:19:37
0:25:56
0:24:33
0:25:52
0:18:51
0:24:56
0:27:57
0:34:36
0:27:09
0:26:38
0:25:16
0:25:54
0:25:31
0:24:02
0:25:13
0:18:49
0:25:29
0:24:12
0:23:20
0:19:09
0:24:32
0:26:42
0:27:28
0:27:17
0:25:37
0:25:07
0:26:14
0:27:13
0:24:17
0:26:30
0:19:32
Note: Running time is reported in minutes: seconds.
67
REFERENCES
Ader,R。 ,&Cohen,N.(1993)。 PsyChOneuroi― unology:Conditionlng and stress.
Amual Review ofPsvcholo,v.44.53… 85.
仙 1,M。 ,&She....an,C。 (1998)。 Exercisc against depression.The Phvsician and
s,Ormedicineへ 26.55‐70.
Berger,B.,Friedmann,E。 ,&Eaton,M。 (1988)。 CompansOn ofjogging,the relaxation
response,and group mteraction for stress reduction.Jollmal of S,ort and Exercisc
Psvcholo四 .10_431‐447.
Berger,B。 ,&Owen,D。 (1998)。 Relation oflow and moderate mtensity exercise wi■
acute mood change h collegejoggerso Perceptt and Motor Skills.87.611‐ 621.
Blix,A.,StromIIle,S。 ,&Ursin,H。 (1974)。 Addi■ onal heart rate― An indicator of
psychological act市 ation.AcЮ space Medicine.45、 1219‐ 1222.
Booth,A.,Shelley,G。 ,Mazur,A.,Tharp,G。 ,&Kittok,R。 (1989).TeStOSterone,and
wiming and losing in hman competitiono Hoニ ュュニoneS and Bchavior、 23.556-571.
Brod,J。 ,Fencl,V。 ,Heil,Z.,&Jirka9 J。 (1959)。 CirCulatory changes llnderlying blood
pressllre elevation dllmg acute emotional stress(mental anttmedc)in
nol...atens市 e and hypenens市e sutteCtS.Clinical Science。 18.260‐ 279。
Canter,D。 (1961)。 Atitudes and perception in architecme.Architcme Associttion
Ouarterlv。 1.24… 31.
Canter,D.&Canter,S.oEds.).(1979)。 Desiqmng for therapeutic envirorlments.A review
ofresearch.New York:John Wiley&Solls,Ltd.
Dimsdale,J.(1984)。 Generalizatiolls fbm laboratory studies to■ eld studies ofhunan
stress physiology.Psvchosomttic Medicine.46.463-469.
68
69
Dllm,EoC。 ,&McAuley,E。 (2000)。 Attect市 e responses to exercise bouts ofvarying
intensities.Joumal of Social Bchavior&Personalitv.15.201-214.
Dyer,J.,&Crouch,J。 (1987)。 Ettcts ofrl―g on moods:A tlne series study.
PerCeDn■■and Motor Skills.64_783-798.
Dyer,J。 ,&Crouch,J。 (1988)。 Ettcts ofrl―g and other acivities on mood.PerceDtual
and Motor Skills.67.43‐ 50。
Evans,G.(Ed)。 (1982)。 Environmental stress.New York:Calnb五 dge University Press.
Fillingim,R。 ,&Fine,M。 (1986).The efFects ofintemal versus extemalinfo.11lation
processmg m symptom perception in an exercise se■ mg.Hcalth Psvc雨圏 Ъヽ、
115¨ 123.
Gliner,J.,Bedi,J。 ,&Horvath,M。 (1979)。 Somatic and llon‐ somatic imuences on the
heart:hemodyllamc changes.PsvchoohvSioloⅣ .16.358-362
Gould,D。,&Weinberg,R.S.1999.Fomdations of s,o■ and exercise psvcholoⅣ .2J
Editiono Champaign,IL:Hlllnall Kinetics Publishers,Inc.
Harte,J。 ,&Eifet G。 (1995)。 The e量〕Ct of―mg,erlvirolllment,and attentional focus
on adietes'catecholarrune and cortisol levels and lnood.Psvchophvsiologv.32.
49‐54.
Hemy,J.,&Ely,D。 (1979).PhySi01ogy ofemotional stress:Speciflc responseo Journal of
The South Carolina Medical Association.75.501-509.
Jones,A.,&Dollst,J。 (1996).Al%treadmill grade mott accurately renects the energetic
cost ofoutdoor― go JOllmal ofS,orts Sciences.14.321‐ 327.
Kasl,S。 ,&Cobb,S.(1970).B100d pressllre changes in men llndergoingjob loss:A
preliminary reporto Psvchosomatic Medicinen 32. 19-38.
70
Kavussanu, M., & McAuley, E. (1995). Exercise and optimism. Are highly active
individuals more optimistic? Journal of Sport and Exercise Psychology. 17. 246-
258.
Katula, J., & McAuley, E. (2001). The mirror does not lie: Acute exercise and self-
efficacy. International Journal of Behavioral Medicine. 8. 319-326.
Katula, J., McAuley, E., Mihalko, S., & Bane, S. (1998). Mirror mirror on the
wall...exercise environment inlluences on self-efficacy. Journal of Social
Behavior and Personali8. 13. 319-332.
Kiritz, S., & Moos, R. (1974). Physiological effects of social environment.
Psychosomatic Medicine. 36. 96-l 13.
Kerr, J., & Van-Den-Wollenberg, A. (1997). High and low intensity exercise and
psychological mood states. Psychologv and Health. 12. 603-618.
Lovallo, W. (1997). Stess and health. Thousand Oaks, CA: Sage Publication Inc.
,z/ Maw, G., Boutcher, S., & Taylor, N. (1993). Rating of perceived exertion and affect in
hot and cool environments. European Journal of Applied Physiolog.v. 67. 174-
179.
McAuley, E., Talbot, H., & Martinez, S. (1999). Manipulating self efficacy in the
exercise environment in women: influences on affective responses. Health
Psychology. 1 8. 288-294.
McAuley, E., Mihalko, S., & Bane, S. (1996). Acute exercise and anxiety reduction:
Does environment matter? Journal of Sport and Exercise Psychology. 18. 408-
419.
7l
McClelland, D., Floor, E., Davidson, R., & Saron, C. (1980). Stressed power motivation,
sympathetic activation, immune function and illness. Journal of Human Stress.
I l-19.
McClelland, D., Ross, G., & Patel, V. (1985). The effects of an academic examination on
salivary norepinephrine and imnunoglobulin levels. Journal of Human Stress. 52-
57.
McGowan, R., Pierce, 8., Eastnan, N., Tripathi, H., DeweY,T., & Olson, K. (1993).
Beta-endorphins and mood state during resistance exercise. Perceptual and Motor
Skills.76. 376-378.
McGowan, R., Talton, 8., & Thompson, M. (1996). Changes in scores on the Profiie of
Mood States following a single bout of physical activity: Heart rates and changes
in affect. Perceptual and Motor Skills. 83. 859-866.
McNair, D., Lorr, M., & Droppleman,L. (1992). Profile of Mood States. Educational
and Indusnial Testing Services. San Diego, CA.
Morgan, W. (1984). Affective beneficence of vigorous physical activity. Medicine and
Science in Sport and Exercise. 17.94-100.
Morgan, W., O'Connor, P., Ellickson, K., & Bradley, P. (1988). Personality structure,
mood states, and performance in elite male distance nrnners. International Joumal
of Sport Psychology. 19.247-263.
National Weather Service. (2001). Telecommunication Operations Center. Current
Weather Conditions: Ithaca / Tompkins County. NY. United States. Retrieved
Spring, 200 1, from http://weather.noaa.gov/weather/current/KlTH.htrnl
72
O'Connor, J.P., Morgan, W., Raglin, J., Barksdale, C., & Kalin, H. (1989). Mood state
and salivary cortisol levels following overtraining in female swimmers.
Ps),choendocrinolog.v. 14. 303-3 I 0.
Raikkonen, K., Mathews, K., Flory,J., & Owens, J. (1999). Effects of hostility on
ambulatory blood pressure and mood during daily living activities in healthy
adults. Health Psychologv. 18. 228.
Rudolph, D., & McAuley, E. (1995). Self-efficacy and salivary cortisol responses to
acute exercise in physically active and less active adults. Journal of Sport and
Exercise Pslrchology. 17. 206-21.
Sallis, J., Johnson, M., Calfas, K., Caparosa, S., & Nicholas, J. (1997). Assessing
perceived physical environments variables that may influence physical activity.
Research Ouarterly for Exercise and Sport. 68. 345-51.
Scarpace, N., & Lowenthal, D. (1994). Sympathetic nervous system; aging and exercise.
Southern Medical Journal. 87. S42.
Shibata, S., & Suzuki, N. (2002). Effects of the foliage plant on task performance and
mood. Joumal of Environmental Psychologv.22. 265-272.
Spink, K. (1992). Relation of anxiety about social physique to location of participation in
physical activity. Perceptual and Motor Skills. 74. 1075-1078.
Steptoe, A., & Cox, S. (1988). Acute effects of aerobic exercise on mood. Health
Psychology. 7. 329-340.
Thomas, S., Reading , J., & Shepard, R. (1 992). Revisions of the Physical Activity
Readiness Questionnaire (PAR-Q). Canadian Journal of Sport Science. 17. 338-
345.
73
Turner, R., & Ca:roll, D. (1985). Heart rate and oxygen consumption during mental
arithmetic, a video gzlme, and graded exercise; further evidence of metabolically-
exaggerated cardiac adjusfinents. Psychoph]'siology. 22. 261 -267 .
Williams, T., Kratrenbuhl, G., & Morgan, D. (1991). Mood state and running economy in
moderately trained male runners. Medicine and Science Sport and Exercise. 23.
721-731.
Wilson, V., Morley, N., & Bird, E. (1980). Mood profiles of marathon runners, joggers,
and nonexercisers. Perceptual and Motor Skills. 50. I l7-118.