Embed Size (px)
Citation preview
ANNUAL FINANCIAL REPORT
2013
THE OFFICEOF
THE GOVERNOR
RICK PERRYGOVERNOR OF TEXAS
THE OFFICE OF THE GOVERNOR
ANNUAL FINANCIAL REPORT
For The Year Ended August 31, 2013 (UNAUDITED)
Rick Perry Governor of Texas

RICK PERRY
GOVERNOR
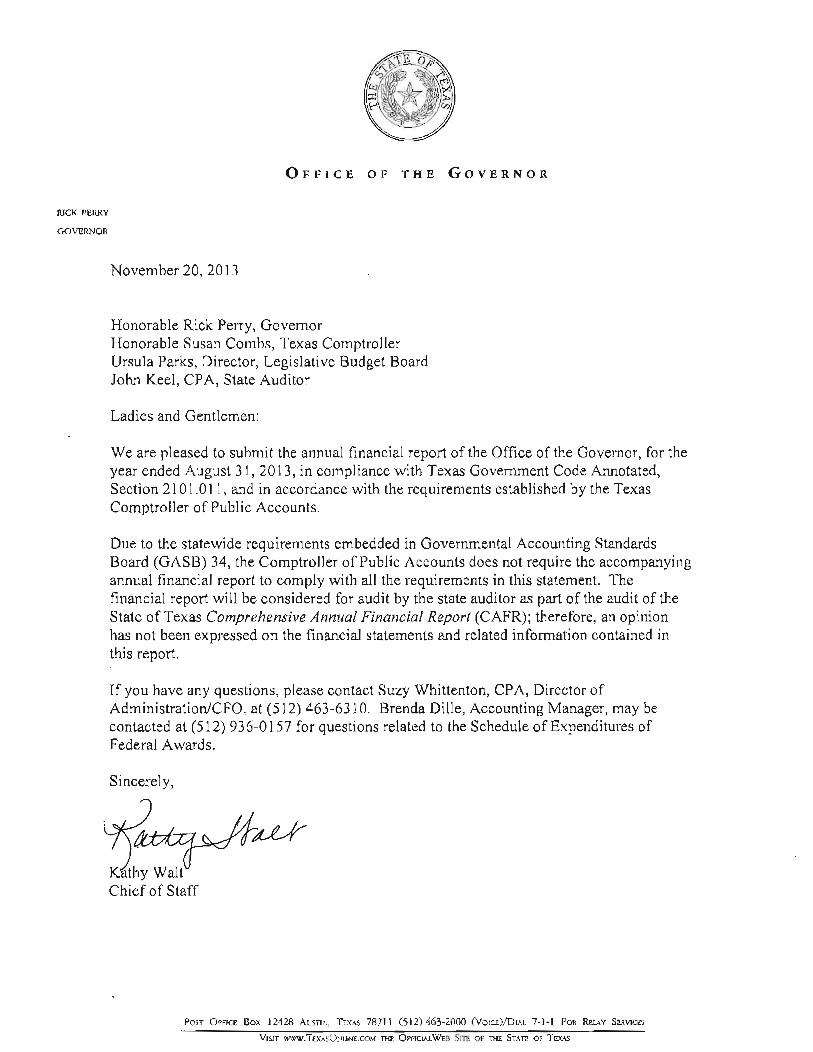
Orrrcr oF THE GovERNoR
November 20,2013
Honorable Rick Perry, GovernorHonorable Susan Combs, Texas ComptrollerUrsula Pa¡ks, Director, Legislative Budget Board
John Keel, CPA, State Auditor
Ladies and Gentlemen
We are pleased to submit the annual financial report of the OfÍice of the Governor, for the
year ended August 31,2013, in compliance with Texas Government Code Annotated,
Section 2101 ,01 1, and in accordance with the requirements established by the Texas
Comptroller of Public Accounts.
Due to the statewide requirements embedded in Governmental Accounting Standards
Board (GASB) 34, the Comptroller of Public Accounts does not require the accompanying
annual financial report to comply with all the requirements in this statement. The
financial report will be considered for audit by the state auditor as part of the audit of the
State of Texas Comprehensive Annuql Financial Report (CAFR); therefore, an opinion
has not been expressed on the financial statements and related information contained in
this report.
If you have any questions, please contact Suzy V/hittenton, CPA, Director ofAáministration/CFO, at (512) 463-6310, Brenda Dille, Accounting Manager, may be
contacted at (512) 936-01 57 lor questions related to the Schedule of Expenditures ofFederal Awards.
Sincerely
WaltChief of Staff
Posr Op¡lc¡ Box 12428 Ausnr.¡, T¡ns 78711 (512)463-2000 (Vorc¡)/Dr¡r 7-1-1 Fon RrlAY SERVTCES
Vlsrr rv vw.Tex¡sOM.lNE,coM THE OrercrerVrs SITE oF 'Itß Srn'm or Te<¡s
i
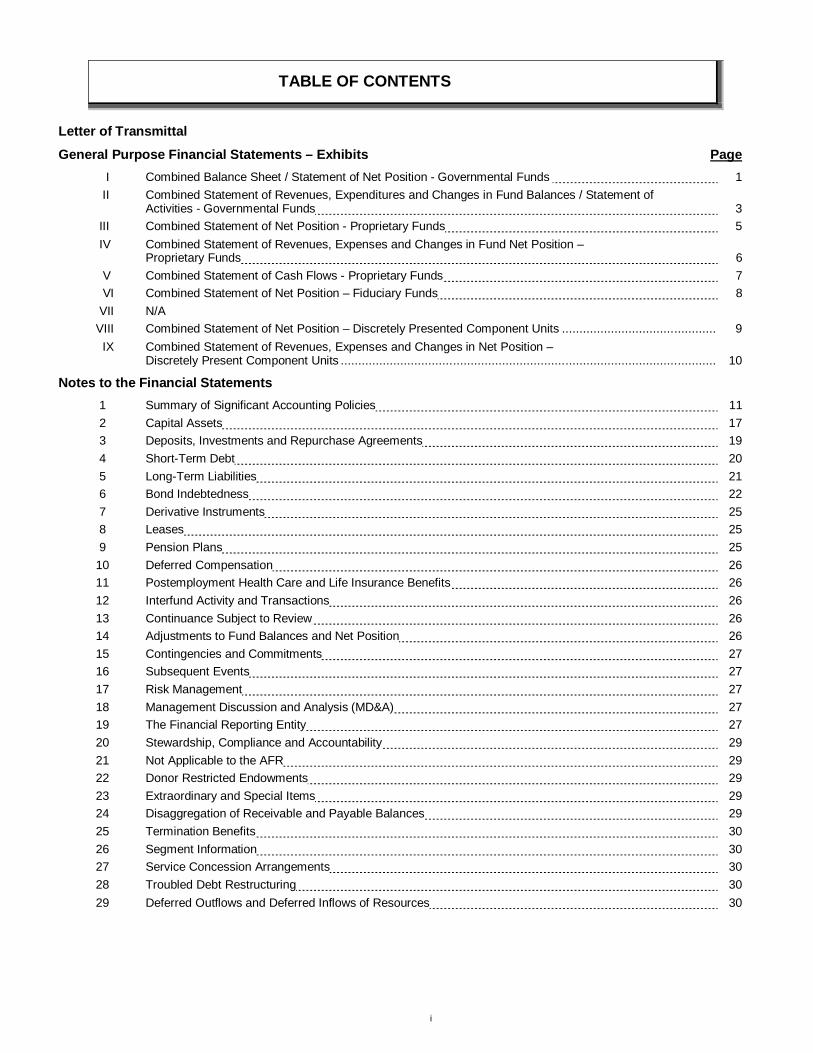
TABLE OF CONTENTS
Letter of Transmittal
General Purpose Financial Statements – Exhibits Page I Combined Balance Sheet / Statement of Net Position - Governmental Funds 1 II Combined Statement of Revenues, Expenditures and Changes in Fund Balances / Statement of Activities - Governmental Funds 3 III Combined Statement of Net Position - Proprietary Funds 5 IV Combined Statement of Revenues, Expenses and Changes in Fund Net Position – Proprietary Funds 6 V Combined Statement of Cash Flows - Proprietary Funds 7 VI Combined Statement of Net Position – Fiduciary Funds 8 VII N/A VIII Combined Statement of Net Position – Discretely Presented Component Units ............................................ 9 IX Combined Statement of Revenues, Expenses and Changes in Net Position – Discretely Present Component Units ........................................................................................................... 10
Notes to the Financial Statements 1 Summary of Significant Accounting Policies 11 2 Capital Assets 17 3 Deposits, Investments and Repurchase Agreements 19 4 Short-Term Debt 20 5 Long-Term Liabilities 21 6 Bond Indebtedness 22 7 Derivative Instruments 25 8 Leases 25 9 Pension Plans 25 10 Deferred Compensation 26 11 Postemployment Health Care and Life Insurance Benefits 26 12 Interfund Activity and Transactions 26 13 Continuance Subject to Review 26 14 Adjustments to Fund Balances and Net Position 26 15 Contingencies and Commitments 27 16 Subsequent Events 27 17 Risk Management 27 18 Management Discussion and Analysis (MD&A) 27 19 The Financial Reporting Entity 27 20 Stewardship, Compliance and Accountability 29 21 Not Applicable to the AFR 29 22 Donor Restricted Endowments 29 23 Extraordinary and Special Items 29 24 Disaggregation of Receivable and Payable Balances 29 25 Termination Benefits 30 26 Segment Information 30 27 Service Concession Arrangements 30 28 Troubled Debt Restructuring 30 29 Deferred Outflows and Deferred Inflows of Resources 30
ii
TABLE OF CONTENTS
Combining Statements – Exhibits and Schedules Page
A–1 Combining Balance Sheet - All General and Consolidated Funds 33 A–2 Combining Statement of Revenues, Expenditures and Changes in Fund Balances – All General and Consolidated Funds 37 J –1 Combining Statement of Changes in Assets and Liabilities - Agency Funds 41 1 A Schedule of Expenditures of Federal Awards 43 1 B Schedule of State Pass Throughs From/To State Agencies/Universities 48 2 A Miscellaneous Bond Information 49 2 B Changes in Bonded Indebtedness 50 2 C Debt Service Requirements 51 2 D Analysis of Funds Available for Debt Service 53 2 E Defeased Bonds Outstanding 53 2 F Early Extinguishment and Refunding of Debt 54
Supporting Exhibits by Agency
Office of the Governor - Core Operations (Agency 301) – Exhibits I (301) Combined Balance Sheet / Statement of Net Position - Governmental Funds 58 II (301) Combined Statement of Revenues, Expenditures and Changes in Fund Balances / Statement of Activities - Governmental Funds 59
A-1 (301) Combining Balance Sheet - All General and Consolidated Funds 61 A-2 (301) Combining Statement of Revenues, Expenditures and Changes in Fund Balances –
All General and Consolidated Funds 62 J-1 (301) Combining Statement of Change in Assets and Liabilities - Agency Funds 63
Office of the Governor Trusteed Programs (Agency 300) – Exhibits I (300) Combined Balance Sheet/Statement of Net Position - Governmental Funds ............................................. 65 II (300) Combined Statement of Revenues, Expenditures and Changes in Fund Balances/ Statement of Activities - Governmental Funds .......................................................................................... 67
III (300) Combined Statement of Net Position - Proprietary Funds ......................................................................... 69 IV (300) Combined Statement of Revenues, Expenses and Changes in Fund Net Position - Proprietary Funds ................................................................................................................................... 70 V (300) Combined Statement of Cash Flows - Proprietary Funds .......................................................................... 71 VIII (300) Combined Statement of Net Position - Discretely Presented Component Units .......................................... 73 IX (300) Combined Statement of Revenues, Expenses and Changes in Net Position - Discretely Present Component Units ........................................................................................................ 74 A-1 (300) Combining Balance Sheet - All General and Consolidated Funds ............................................................. 75 A-2 (300) Combining Statement of Revenues, Expenditures and Changes in Fund Balances - All General and Consolidated Funds ........................................................................................................ 79 B-1 (300) Combining Balance Sheet - Special Revenue Funds ................................................................................ 83 B-2 (300) Combining Statement of Revenues, Expenditures and Changes in Fund Balances -
Special Revenue Funds .......................................................................................................................... 84 C-1 (300) Combining Balance Sheet - Debt Service Funds ...................................................................................... 85 C-2 (300) Combining Statement of Revenues, Expenditures and Changes in Fund Balances -
Debt Service Funds ................................................................................................................................. 87 F-1 (300) Combining Statement of Net Position - Enterprise Funds 89 F-2 (300) Combining Statement of Revenues, Expenses and Changes in Fund Net Position -
Enterprise Funds 90 F-3 (300) Combining Statement of Cash Flows - Enterprise Funds 91 J-1 (300) Combining Statement of Change in Assets and Liabilities - Agency Funds 92 K-1 (300) Combining Statement of Net Position - Discretely Presented Component Units 93 K-2 (300) Combining Statement of Revenues, Expenses and Changes in Net Position - Discretely Presented Component Units 95

UNAUDITED
OFFICE OF THE GOVERNOR - Core Operations (301) and Trusteed Programs (300)Exhibit I - Combined Balance Sheet/Statement of Net Position - Governmental FundsFor the Fiscal Year Ended August 31, 2013
General FundsSpecial Revenue
Funds Debt Service Funds(Exhibit A-1) (Exhibit B-1 300) (Exhibit C-1 300)
ASSETSCurrent Assets:
Cash and Cash Equivalents: Cash In Bank (Note 3) -$ 35,864.87$ -$ Cash in State Treasury 435,067,291.87 36,798,031.78 253.28
Restricted Cash and Cash Equivalents: Cash in State Treasury - 4,725,000.00 -
Legislative Appropriations 133,810,526.09 - - Receivables from:
Federal 4,651,698.16 - - Interest and Dividends 1,299,365.07 21,991.66 - Accounts Receivable 36,515.56 - -
Due From Other Agencies 6,590,068.57 - - Consumable Inventories 42,114.45 - - Prepaid Items 75,000.00 4,525.00 - Loans and Contracts, net of allowance 11,030,000.00 1,401,669.76 -
Total Current Assets 592,602,579.77 42,987,083.07 253.28
Non-Current Assets: Loans and Contracts 163,701,893.83 3,658,398.27 - Capital Assets (Note 2):
Depreciable:Furniture and Equipment - - -
Less Accumulated Depreciation - - - Equity Holdings for Economic Development 166,951,186.85 - -
Total Non-Current Assets 330,653,080.68 3,658,398.27 -
Total Assets 923,255,660.45$ 46,645,481.34$ 253.28$
LIABILITIES AND FUND BALANCESLiabilities
Current Liabilities:Payables from:
Accounts 15,089,337.59$ 15,375.00$ -$ Payroll 1,729,506.45 - -
Due To Other Agencies 1,816,179.61 - - Deferred Revenue 31,463,365.91 - - General Obligation Bonds Payable (Note 6) - - - Employees' Compensable Leave (Note 5) - - -
Total Current Liabilities 50,098,389.56 15,375.00 -
Non-Current Liabilities:General Obligation Bonds Payable (Note 6) - - - Employees' Compensable Leave (Note 5) - - -
Total Non-Current Liabilities - - -
Total Liabilities 50,098,389.56 15,375.00 -
Fund Financial StatementFund Balances (Deficits):
Nonspendable 1,117,114.45 4,525.00 - Restricted 48,663,081.65 46,589,716.47 253.28 Committed 693,866,642.08 35,864.87 - Assigned 3,200,000.00 - - Unassigned 126,310,432.71 - -
Total Fund Balances 873,157,270.89 46,630,106.34 253.28
Total Liabilities, Deferred Inflows & Fund Balances 923,255,660.45$ 46,645,481.34$ 253.28$
Government-Wide Statement of Net PositionNet Position
Invested in Capital Assets, net of Related DebtRestricted For:
OtherUnrestricted
Total Net Position
The accompanying notes to the financial statements are an integral part of this statement.
Governmental Fund Types
1
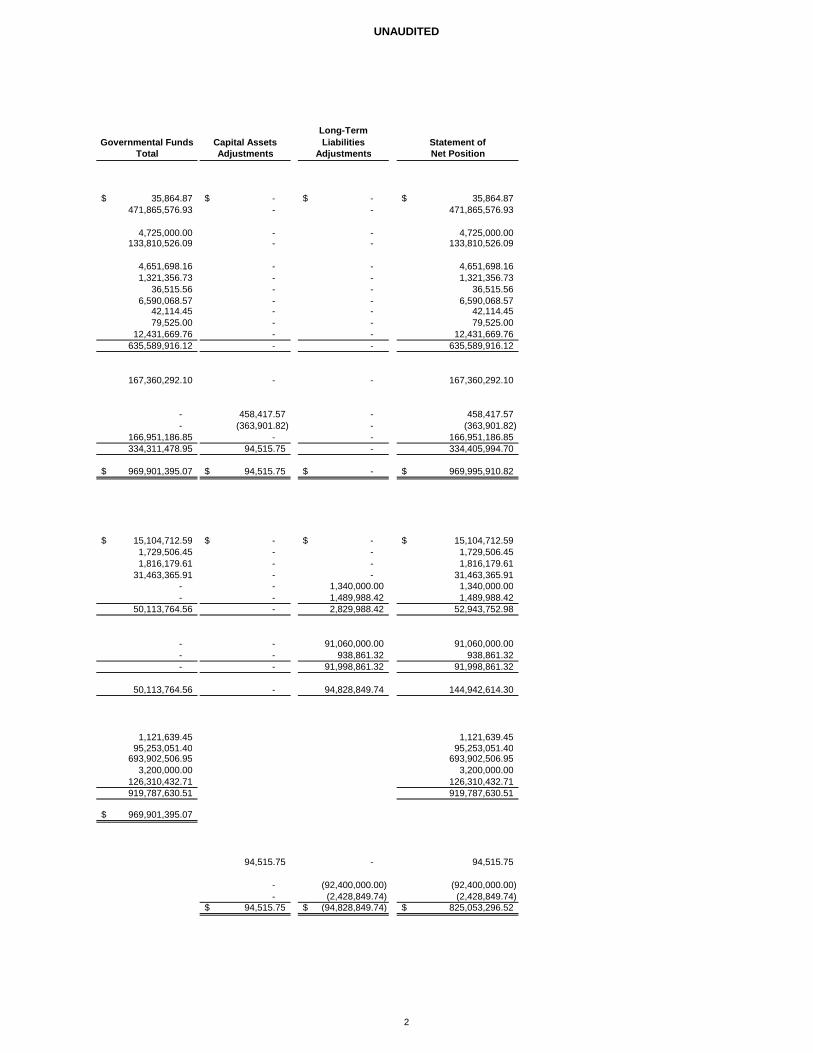
UNAUDITED
Governmental Funds Capital AssetsLong-Term Liabilities Statement of
Total Adjustments Adjustments Net Position
35,864.87$ -$ -$ 35,864.87$ 471,865,576.93 - - 471,865,576.93
4,725,000.00 - - 4,725,000.00
133,810,526.09 - - 133,810,526.09
4,651,698.16 - - 4,651,698.16 1,321,356.73 - - 1,321,356.73
36,515.56 - - 36,515.56 6,590,068.57 - - 6,590,068.57
42,114.45 - - 42,114.45 79,525.00 - - 79,525.00
12,431,669.76 - - 12,431,669.76 635,589,916.12 - - 635,589,916.12
167,360,292.10 - - 167,360,292.10
- 458,417.57 - 458,417.57 - (363,901.82) - (363,901.82)
166,951,186.85 - - 166,951,186.85 334,311,478.95 94,515.75 - 334,405,994.70
969,901,395.07$ 94,515.75$ -$ 969,995,910.82$
15,104,712.59$ -$ -$ 15,104,712.59$ 1,729,506.45 - - 1,729,506.45 1,816,179.61 - - 1,816,179.61
31,463,365.91 - - 31,463,365.91 - - 1,340,000.00 1,340,000.00 - - 1,489,988.42 1,489,988.42
50,113,764.56 - 2,829,988.42 52,943,752.98
- - 91,060,000.00 91,060,000.00 - - 938,861.32 938,861.32 - - 91,998,861.32 91,998,861.32
50,113,764.56 - 94,828,849.74 144,942,614.30
1,121,639.45 1,121,639.45 95,253,051.40 95,253,051.40
693,902,506.95 693,902,506.95 3,200,000.00 3,200,000.00
126,310,432.71 126,310,432.71 919,787,630.51 919,787,630.51
969,901,395.07$
94,515.75 - 94,515.75
- (92,400,000.00) (92,400,000.00) - (2,428,849.74) (2,428,849.74)
94,515.75$ (94,828,849.74)$ 825,053,296.52$
2
UNAUDITED
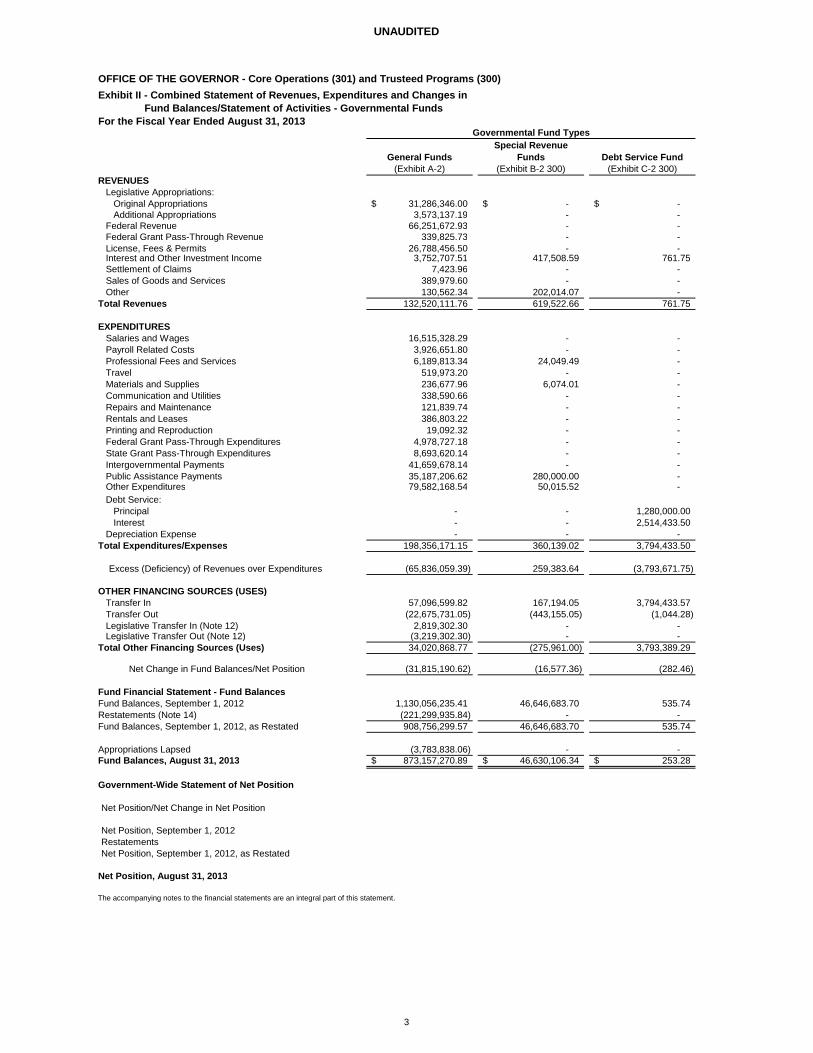
OFFICE OF THE GOVERNOR - Core Operations (301) and Trusteed Programs (300)
For the Fiscal Year Ended August 31, 2013
General FundsSpecial Revenue
Funds Debt Service Fund(Exhibit A-2) (Exhibit B-2 300) (Exhibit C-2 300)
REVENUESLegislative Appropriations:
Original Appropriations 31,286,346.00$ -$ -$ Additional Appropriations 3,573,137.19 - -
Federal Revenue 66,251,672.93 - - Federal Grant Pass-Through Revenue 339,825.73 - - License, Fees & Permits 26,788,456.50 - - Interest and Other Investment Income 3,752,707.51 417,508.59 761.75 Settlement of Claims 7,423.96 - - Sales of Goods and Services 389,979.60 - - Other 130,562.34 202,014.07 -
Total Revenues 132,520,111.76 619,522.66 761.75
EXPENDITURESSalaries and Wages 16,515,328.29 - - Payroll Related Costs 3,926,651.80 - - Professional Fees and Services 6,189,813.34 24,049.49 - Travel 519,973.20 - - Materials and Supplies 236,677.96 6,074.01 - Communication and Utilities 338,590.66 - - Repairs and Maintenance 121,839.74 - - Rentals and Leases 386,803.22 - - Printing and Reproduction 19,092.32 - - Federal Grant Pass-Through Expenditures 4,978,727.18 - - State Grant Pass-Through Expenditures 8,693,620.14 - - Intergovernmental Payments 41,659,678.14 - - Public Assistance Payments 35,187,206.62 280,000.00 - Other Expenditures 79,582,168.54 50,015.52 - Debt Service:
Principal - - 1,280,000.00 Interest - - 2,514,433.50
Depreciation Expense - - - Total Expenditures/Expenses 198,356,171.15 360,139.02 3,794,433.50
Excess (Deficiency) of Revenues over Expenditures (65,836,059.39) 259,383.64 (3,793,671.75)
OTHER FINANCING SOURCES (USES)Transfer In 57,096,599.82 167,194.05 3,794,433.57 Transfer Out (22,675,731.05) (443,155.05) (1,044.28) Legislative Transfer In (Note 12) 2,819,302.30 - - Legislative Transfer Out (Note 12) (3,219,302.30) - -
Total Other Financing Sources (Uses) 34,020,868.77 (275,961.00) 3,793,389.29
Net Change in Fund Balances/Net Position (31,815,190.62) (16,577.36) (282.46)
Fund Financial Statement - Fund BalancesFund Balances, September 1, 2012 1,130,056,235.41 46,646,683.70 535.74 Restatements (Note 14) (221,299,935.84) - - Fund Balances, September 1, 2012, as Restated 908,756,299.57 46,646,683.70 535.74
Appropriations Lapsed (3,783,838.06) - - Fund Balances, August 31, 2013 873,157,270.89$ 46,630,106.34$ 253.28$
Government-Wide Statement of Net Position
Net Position/Net Change in Net Position
Net Position, September 1, 2012RestatementsNet Position, September 1, 2012, as Restated
Net Position, August 31, 2013
The accompanying notes to the financial statements are an integral part of this statement.
Exhibit II - Combined Statement of Revenues, Expenditures and Changes in Fund Balances/Statement of Activities - Governmental Funds
Governmental Fund Types
3
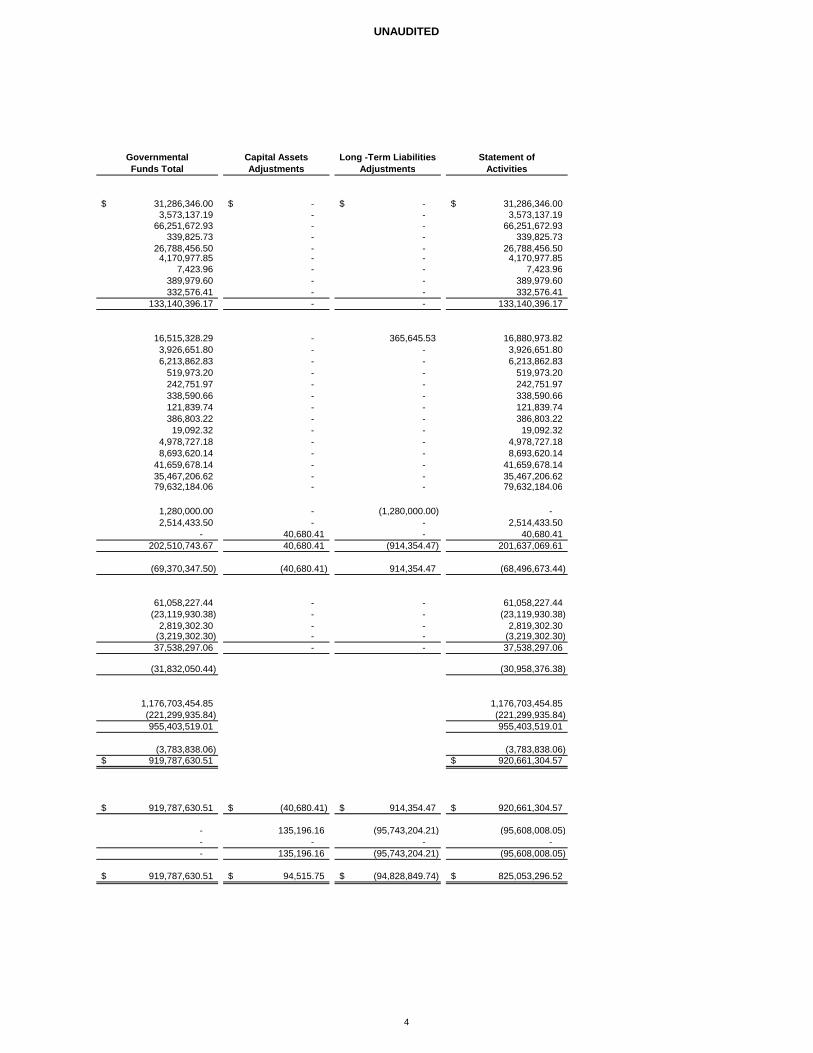
UNAUDITED
Governmental Capital Assets Long -Term Liabilities Statement of Funds Total Adjustments Adjustments Activities
31,286,346.00$ -$ -$ 31,286,346.00$ 3,573,137.19 - - 3,573,137.19
66,251,672.93 - - 66,251,672.93 339,825.73 - - 339,825.73
26,788,456.50 - - 26,788,456.50 4,170,977.85 - - 4,170,977.85
7,423.96 - - 7,423.96 389,979.60 - - 389,979.60 332,576.41 - - 332,576.41
133,140,396.17 - - 133,140,396.17
16,515,328.29 - 365,645.53 16,880,973.82 3,926,651.80 - - 3,926,651.80 6,213,862.83 - - 6,213,862.83
519,973.20 - - 519,973.20 242,751.97 - - 242,751.97 338,590.66 - - 338,590.66 121,839.74 - - 121,839.74 386,803.22 - - 386,803.22 19,092.32 - - 19,092.32
4,978,727.18 - - 4,978,727.18 8,693,620.14 - - 8,693,620.14
41,659,678.14 - - 41,659,678.14 35,467,206.62 - - 35,467,206.62 79,632,184.06 - - 79,632,184.06
1,280,000.00 - (1,280,000.00) - 2,514,433.50 - - 2,514,433.50
- 40,680.41 - 40,680.41 202,510,743.67 40,680.41 (914,354.47) 201,637,069.61
(69,370,347.50) (40,680.41) 914,354.47 (68,496,673.44)
61,058,227.44 - - 61,058,227.44 (23,119,930.38) - - (23,119,930.38)
2,819,302.30 - - 2,819,302.30 (3,219,302.30) - - (3,219,302.30) 37,538,297.06 - - 37,538,297.06
(31,832,050.44) (30,958,376.38)
1,176,703,454.85 1,176,703,454.85 (221,299,935.84) (221,299,935.84) 955,403,519.01 955,403,519.01
(3,783,838.06) (3,783,838.06) 919,787,630.51$ 920,661,304.57$
919,787,630.51$ (40,680.41)$ 914,354.47$ 920,661,304.57$
- 135,196.16 (95,743,204.21) (95,608,008.05) - - - - - 135,196.16 (95,743,204.21) (95,608,008.05)
919,787,630.51$ 94,515.75$ (94,828,849.74)$ 825,053,296.52$
4
UNAUDITED
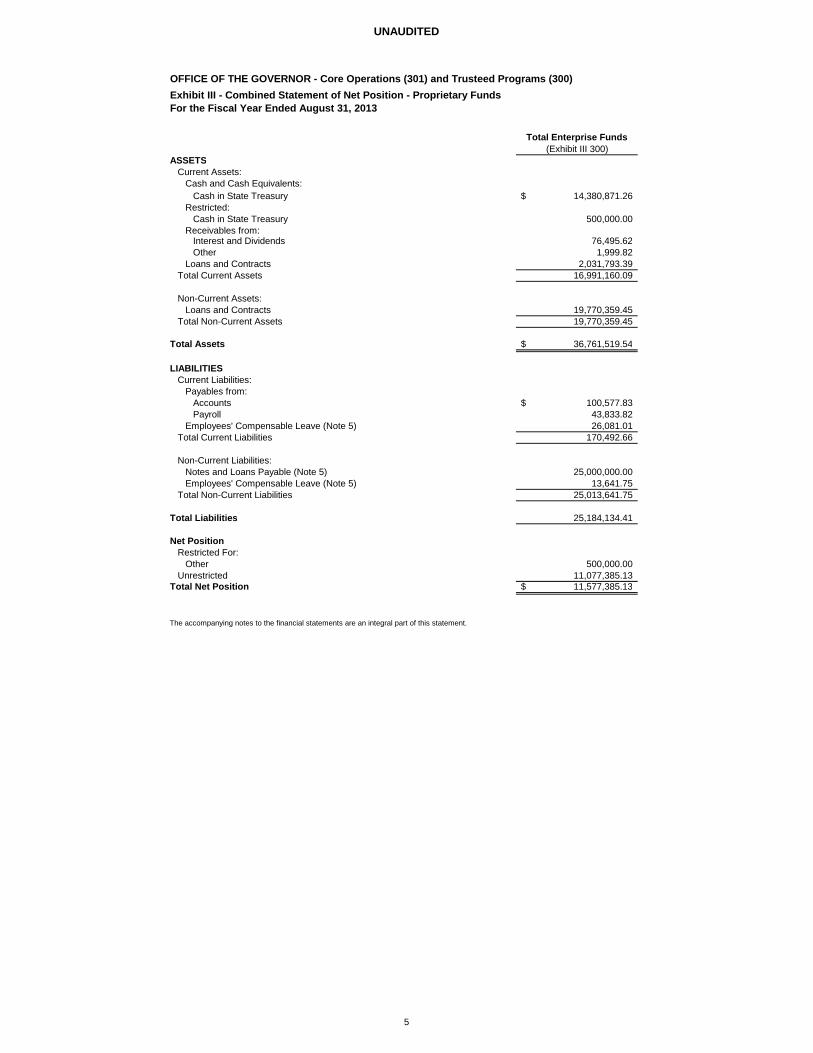
OFFICE OF THE GOVERNOR - Core Operations (301) and Trusteed Programs (300)Exhibit III - Combined Statement of Net Position - Proprietary FundsFor the Fiscal Year Ended August 31, 2013
Total Enterprise Funds(Exhibit III 300)
ASSETSCurrent Assets:
Cash and Cash Equivalents:Cash in State Treasury 14,380,871.26$
Restricted: Cash in State Treasury 500,000.00
Receivables from: Interest and Dividends 76,495.62 Other 1,999.82
Loans and Contracts 2,031,793.39 Total Current Assets 16,991,160.09
Non-Current Assets:Loans and Contracts 19,770,359.45
Total Non-Current Assets 19,770,359.45
Total Assets 36,761,519.54$
LIABILITIESCurrent Liabilities:
Payables from:Accounts 100,577.83$ Payroll 43,833.82
Employees' Compensable Leave (Note 5) 26,081.01 Total Current Liabilities 170,492.66
Non-Current Liabilities:Notes and Loans Payable (Note 5) 25,000,000.00 Employees' Compensable Leave (Note 5) 13,641.75
Total Non-Current Liabilities 25,013,641.75
Total Liabilities 25,184,134.41
Net PositionRestricted For:
Other 500,000.00 Unrestricted 11,077,385.13
Total Net Position 11,577,385.13$
The accompanying notes to the financial statements are an integral part of this statement.
5
UNAUDITED
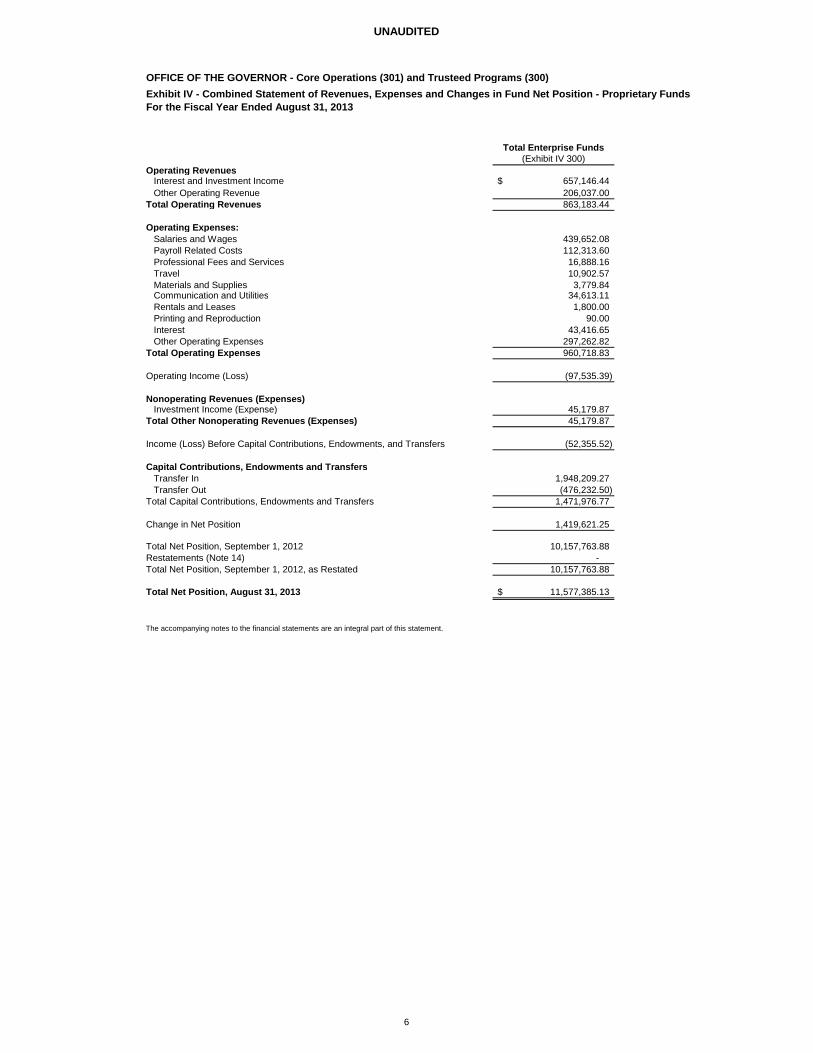
OFFICE OF THE GOVERNOR - Core Operations (301) and Trusteed Programs (300)Exhibit IV - Combined Statement of Revenues, Expenses and Changes in Fund Net Position - Proprietary FundsFor the Fiscal Year Ended August 31, 2013
Total Enterprise Funds(Exhibit IV 300)
Operating RevenuesInterest and Investment Income 657,146.44$ Other Operating Revenue 206,037.00
Total Operating Revenues 863,183.44
Operating Expenses:Salaries and Wages 439,652.08 Payroll Related Costs 112,313.60 Professional Fees and Services 16,888.16 Travel 10,902.57 Materials and Supplies 3,779.84 Communication and Utilities 34,613.11 Rentals and Leases 1,800.00 Printing and Reproduction 90.00 Interest 43,416.65 Other Operating Expenses 297,262.82
Total Operating Expenses 960,718.83 Operating Income (Loss) (97,535.39)
Nonoperating Revenues (Expenses) Investment Income (Expense) 45,179.87
Total Other Nonoperating Revenues (Expenses) 45,179.87
Income (Loss) Before Capital Contributions, Endowments, and Transfers (52,355.52)
Capital Contributions, Endowments and TransfersTransfer In 1,948,209.27 Transfer Out (476,232.50)
Total Capital Contributions, Endowments and Transfers 1,471,976.77
Change in Net Position 1,419,621.25
Total Net Position, September 1, 2012 10,157,763.88 Restatements (Note 14) - Total Net Position, September 1, 2012, as Restated 10,157,763.88
Total Net Position, August 31, 2013 11,577,385.13$
The accompanying notes to the financial statements are an integral part of this statement.
6
UNAUDITED
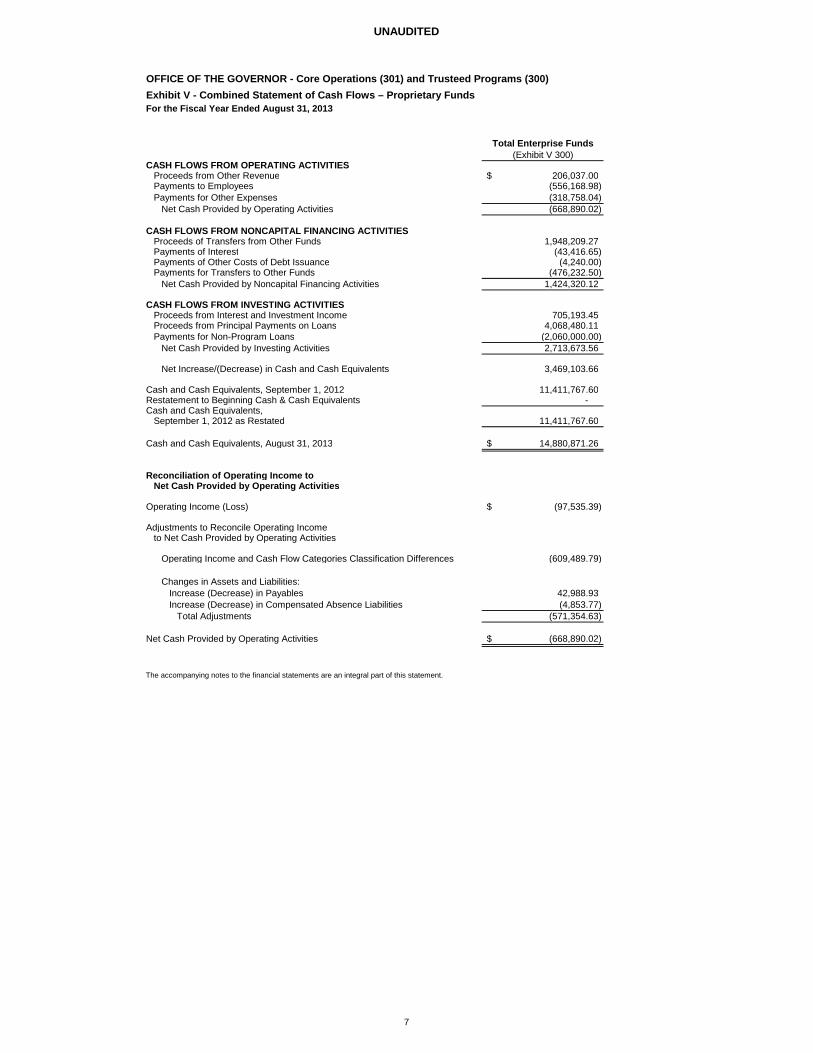
OFFICE OF THE GOVERNOR - Core Operations (301) and Trusteed Programs (300)Exhibit V - Combined Statement of Cash Flows – Proprietary FundsFor the Fiscal Year Ended August 31, 2013
Total Enterprise Funds(Exhibit V 300)
CASH FLOWS FROM OPERATING ACTIVITIESProceeds from Other Revenue 206,037.00$ Payments to Employees (556,168.98) Payments for Other Expenses (318,758.04)
Net Cash Provided by Operating Activities (668,890.02)
CASH FLOWS FROM NONCAPITAL FINANCING ACTIVITIESProceeds of Transfers from Other Funds 1,948,209.27 Payments of Interest (43,416.65) Payments of Other Costs of Debt Issuance (4,240.00) Payments for Transfers to Other Funds (476,232.50)
Net Cash Provided by Noncapital Financing Activities 1,424,320.12
CASH FLOWS FROM INVESTING ACTIVITIESProceeds from Interest and Investment Income 705,193.45 Proceeds from Principal Payments on Loans 4,068,480.11 Payments for Non-Program Loans (2,060,000.00)
Net Cash Provided by Investing Activities 2,713,673.56
Net Increase/(Decrease) in Cash and Cash Equivalents 3,469,103.66
Cash and Cash Equivalents, September 1, 2012 11,411,767.60 Restatement to Beginning Cash & Cash Equivalents - Cash and Cash Equivalents,
September 1, 2012 as Restated 11,411,767.60
Cash and Cash Equivalents, August 31, 2013 14,880,871.26$
Reconciliation of Operating Income to Net Cash Provided by Operating Activities
Operating Income (Loss) (97,535.39)$
Adjustments to Reconcile Operating Income to Net Cash Provided by Operating Activities
Operating Income and Cash Flow Categories Classification Differences (609,489.79)
Changes in Assets and Liabilities: Increase (Decrease) in Payables 42,988.93 Increase (Decrease) in Compensated Absence Liabilities (4,853.77)
Total Adjustments (571,354.63)
Net Cash Provided by Operating Activities (668,890.02)$
The accompanying notes to the financial statements are an integral part of this statement.
7
UNAUDITED
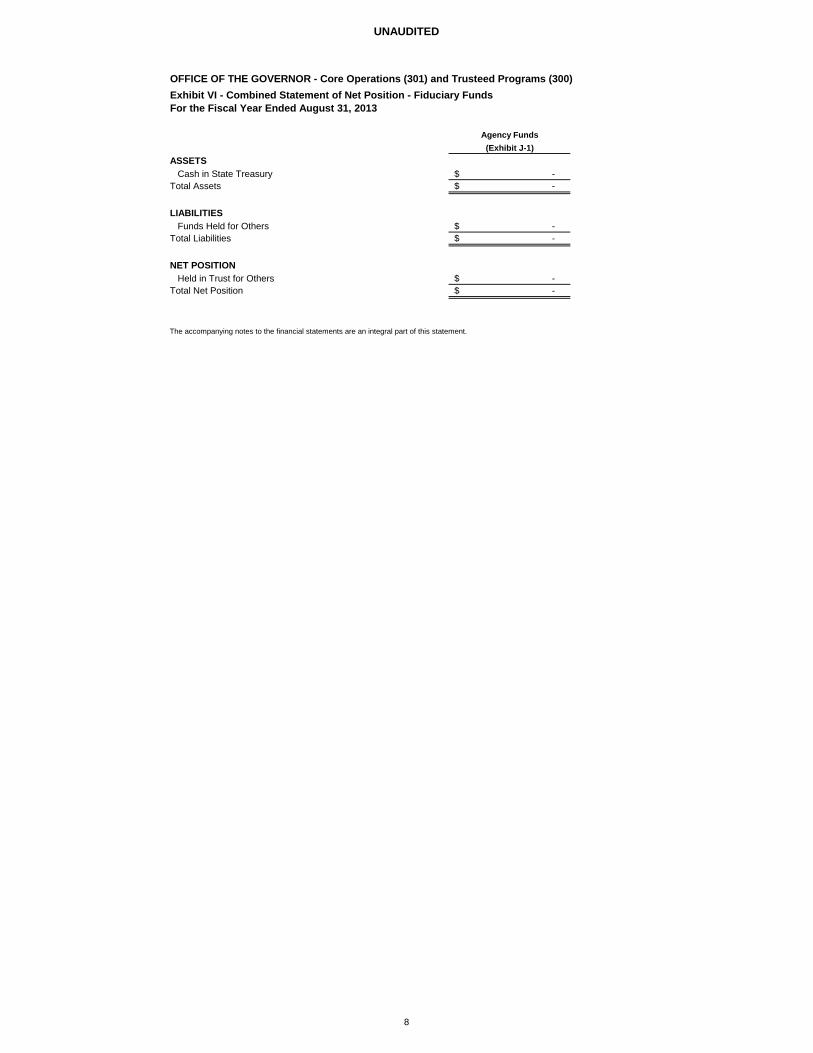
OFFICE OF THE GOVERNOR - Core Operations (301) and Trusteed Programs (300)Exhibit VI - Combined Statement of Net Position - Fiduciary FundsFor the Fiscal Year Ended August 31, 2013
Agency Funds(Exhibit J-1)
ASSETSCash in State Treasury -$
Total Assets -$
LIABILITIESFunds Held for Others -$
Total Liabilities -$
NET POSITIONHeld in Trust for Others -$
Total Net Position -$
The accompanying notes to the financial statements are an integral part of this statement.
8
UNAUDITED
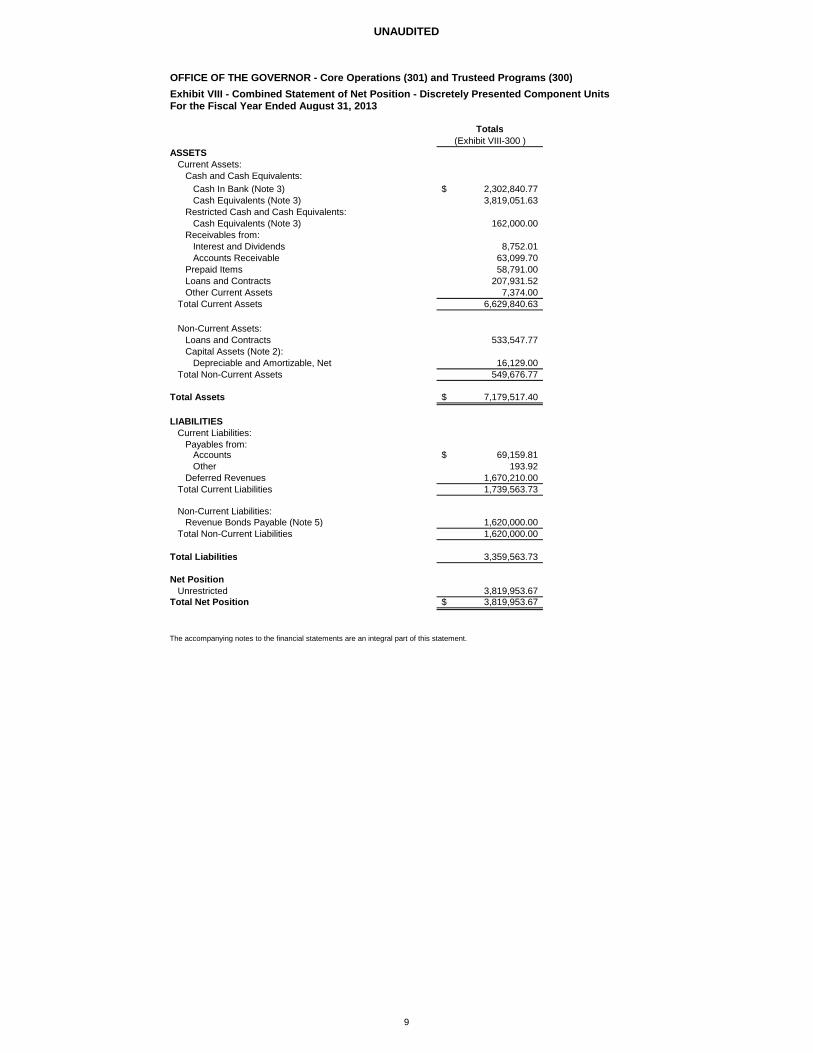
OFFICE OF THE GOVERNOR - Core Operations (301) and Trusteed Programs (300)Exhibit VIII - Combined Statement of Net Position - Discretely Presented Component UnitsFor the Fiscal Year Ended August 31, 2013
Totals(Exhibit VIII-300 )
ASSETSCurrent Assets:
Cash and Cash Equivalents:Cash In Bank (Note 3) 2,302,840.77$ Cash Equivalents (Note 3) 3,819,051.63
Restricted Cash and Cash Equivalents: Cash Equivalents (Note 3) 162,000.00
Receivables from: Interest and Dividends 8,752.01 Accounts Receivable 63,099.70
Prepaid Items 58,791.00 Loans and Contracts 207,931.52 Other Current Assets 7,374.00
Total Current Assets 6,629,840.63
Non-Current Assets:Loans and Contracts 533,547.77 Capital Assets (Note 2):
Depreciable and Amortizable, Net 16,129.00 Total Non-Current Assets 549,676.77
Total Assets 7,179,517.40$
LIABILITIESCurrent Liabilities:
Payables from:Accounts 69,159.81$ Other 193.92
Deferred Revenues 1,670,210.00 Total Current Liabilities 1,739,563.73
Non-Current Liabilities:Revenue Bonds Payable (Note 5) 1,620,000.00
Total Non-Current Liabilities 1,620,000.00
Total Liabilities 3,359,563.73
Net PositionUnrestricted 3,819,953.67
Total Net Position 3,819,953.67$
The accompanying notes to the financial statements are an integral part of this statement.
9
UNAUDITED
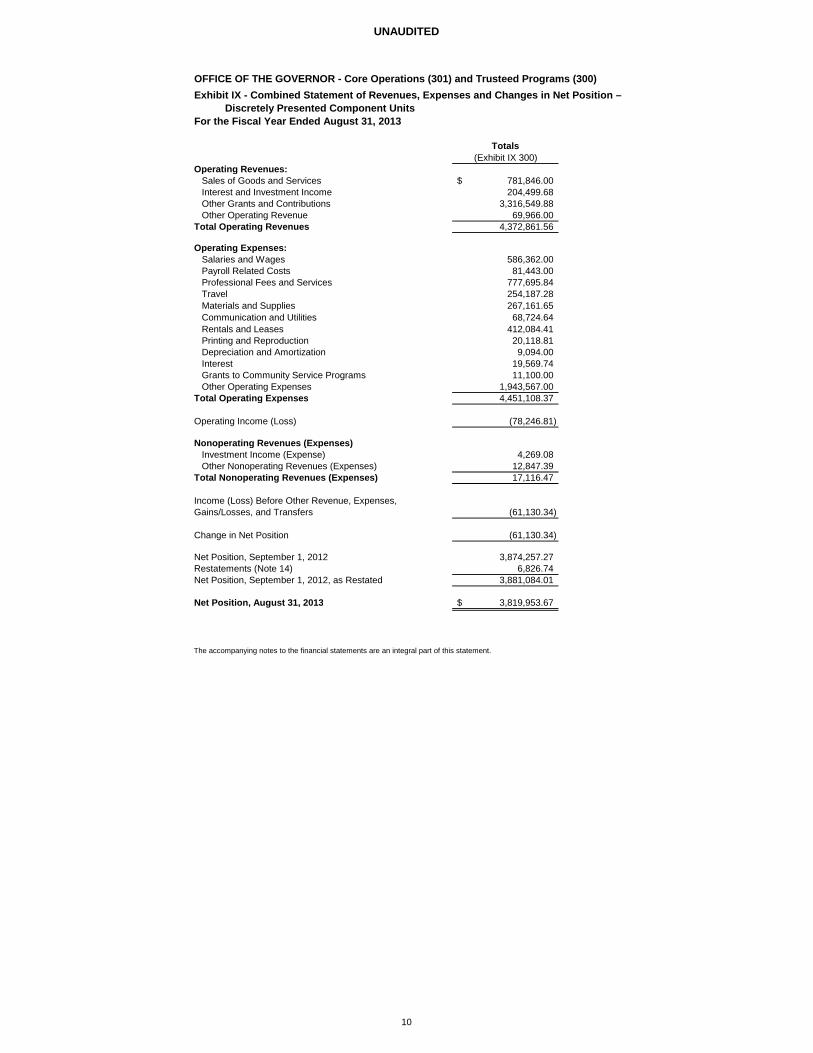
OFFICE OF THE GOVERNOR - Core Operations (301) and Trusteed Programs (300)Exhibit IX - Combined Statement of Revenues, Expenses and Changes in Net Position –
Discretely Presented Component UnitsFor the Fiscal Year Ended August 31, 2013
Totals(Exhibit IX 300)
Operating Revenues:Sales of Goods and Services 781,846.00$ Interest and Investment Income 204,499.68 Other Grants and Contributions 3,316,549.88 Other Operating Revenue 69,966.00
Total Operating Revenues 4,372,861.56
Operating Expenses:Salaries and Wages 586,362.00 Payroll Related Costs 81,443.00 Professional Fees and Services 777,695.84 Travel 254,187.28 Materials and Supplies 267,161.65 Communication and Utilities 68,724.64 Rentals and Leases 412,084.41 Printing and Reproduction 20,118.81 Depreciation and Amortization 9,094.00 Interest 19,569.74 Grants to Community Service Programs 11,100.00 Other Operating Expenses 1,943,567.00
Total Operating Expenses 4,451,108.37
Operating Income (Loss) (78,246.81)
Nonoperating Revenues (Expenses)Investment Income (Expense) 4,269.08 Other Nonoperating Revenues (Expenses) 12,847.39
Total Nonoperating Revenues (Expenses) 17,116.47
Income (Loss) Before Other Revenue, Expenses,Gains/Losses, and Transfers (61,130.34)
Change in Net Position (61,130.34)
Net Position, September 1, 2012 3,874,257.27 Restatements (Note 14) 6,826.74 Net Position, September 1, 2012, as Restated 3,881,084.01
Net Position, August 31, 2013 3,819,953.67$
The accompanying notes to the financial statements are an integral part of this statement.
10
UNAUDITED
Office of the Governor (Agencies 301 and 300)
11
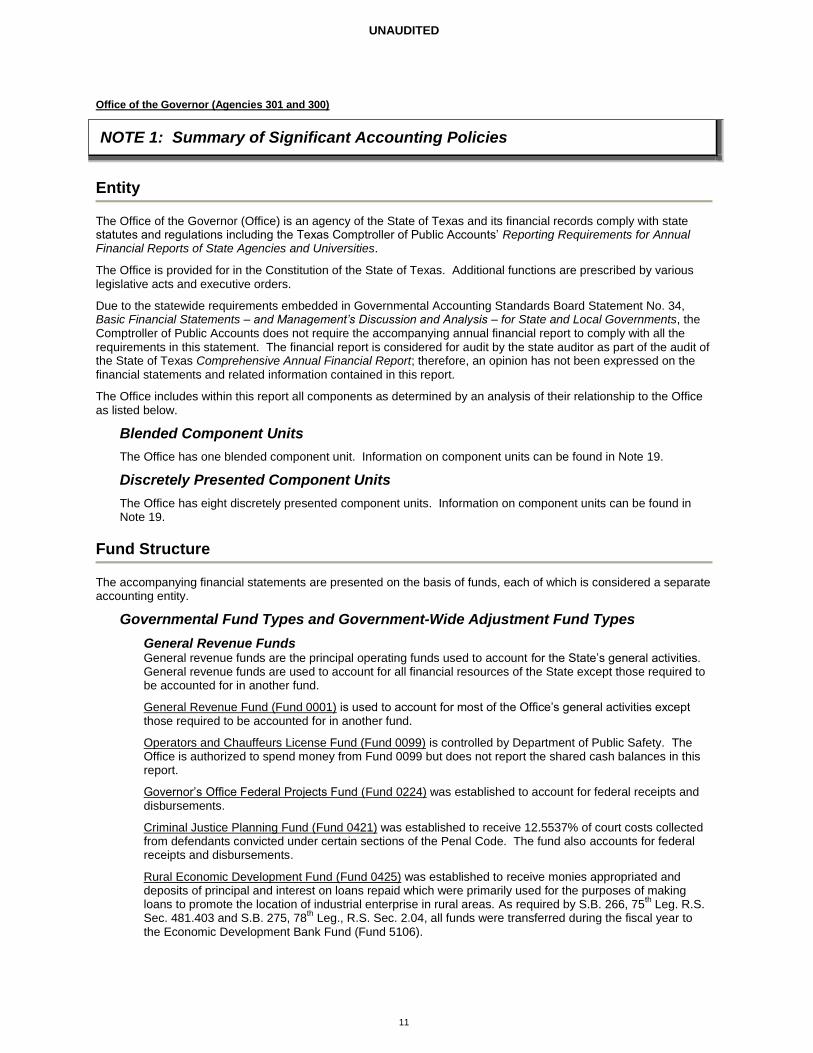
NOTE 1: Summary of Significant Accounting Policies
Entity
The Office of the Governor (Office) is an agency of the State of Texas and its financial records comply with state statutes and regulations including the Texas Comptroller of Public Accounts’ Reporting Requirements for Annual Financial Reports of State Agencies and Universities.
The Office is provided for in the Constitution of the State of Texas. Additional functions are prescribed by various legislative acts and executive orders.
Due to the statewide requirements embedded in Governmental Accounting Standards Board Statement No. 34, Basic Financial Statements – and Management’s Discussion and Analysis – for State and Local Governments, the Comptroller of Public Accounts does not require the accompanying annual financial report to comply with all the requirements in this statement. The financial report is considered for audit by the state auditor as part of the audit of the State of Texas Comprehensive Annual Financial Report; therefore, an opinion has not been expressed on the financial statements and related information contained in this report.
The Office includes within this report all components as determined by an analysis of their relationship to the Office as listed below.
Blended Component Units
The Office has one blended component unit. Information on component units can be found in Note 19.
Discretely Presented Component Units
The Office has eight discretely presented component units. Information on component units can be found in Note 19.
Fund Structure
The accompanying financial statements are presented on the basis of funds, each of which is considered a separate accounting entity.
Governmental Fund Types and Government-Wide Adjustment Fund Types
General Revenue Funds General revenue funds are the principal operating funds used to account for the State’s general activities. General revenue funds are used to account for all financial resources of the State except those required to be accounted for in another fund.
General Revenue Fund (Fund 0001) is used to account for most of the Office’s general activities except those required to be accounted for in another fund.
Operators and Chauffeurs License Fund (Fund 0099) is controlled by Department of Public Safety. The Office is authorized to spend money from Fund 0099 but does not report the shared cash balances in this report.
Governor’s Office Federal Projects Fund (Fund 0224) was established to account for federal receipts and disbursements.
Criminal Justice Planning Fund (Fund 0421) was established to receive 12.5537% of court costs collected from defendants convicted under certain sections of the Penal Code. The fund also accounts for federal receipts and disbursements.
Rural Economic Development Fund (Fund 0425) was established to receive monies appropriated and deposits of principal and interest on loans repaid which were primarily used for the purposes of making loans to promote the location of industrial enterprise in rural areas. As required by S.B. 266, 75
th Leg. R.S.
Sec. 481.403 and S.B. 275, 78th
Leg., R.S. Sec. 2.04, all funds were transferred during the fiscal year to the Economic Development Bank Fund (Fund 5106).
UNAUDITED
Office of the Governor (Agencies 301 and 300)
12
Summary of Significant Accounting Policies (continued)
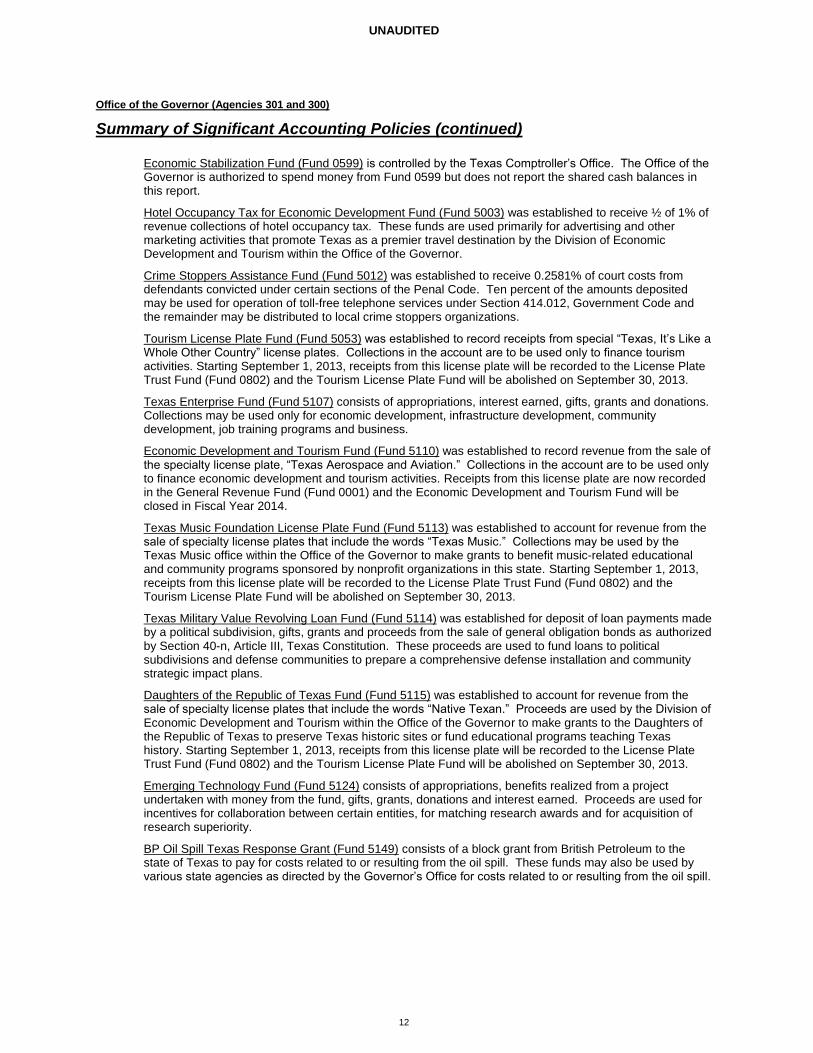
Economic Stabilization Fund (Fund 0599) is controlled by the Texas Comptroller’s Office. The Office of the Governor is authorized to spend money from Fund 0599 but does not report the shared cash balances in this report.
Hotel Occupancy Tax for Economic Development Fund (Fund 5003) was established to receive ½ of 1% of revenue collections of hotel occupancy tax. These funds are used primarily for advertising and other marketing activities that promote Texas as a premier travel destination by the Division of Economic Development and Tourism within the Office of the Governor.
Crime Stoppers Assistance Fund (Fund 5012) was established to receive 0.2581% of court costs from defendants convicted under certain sections of the Penal Code. Ten percent of the amounts deposited may be used for operation of toll-free telephone services under Section 414.012, Government Code and the remainder may be distributed to local crime stoppers organizations.
Tourism License Plate Fund (Fund 5053) was established to record receipts from special “Texas, It’s Like a Whole Other Country” license plates. Collections in the account are to be used only to finance tourism activities. Starting September 1, 2013, receipts from this license plate will be recorded to the License Plate Trust Fund (Fund 0802) and the Tourism License Plate Fund will be abolished on September 30, 2013.
Texas Enterprise Fund (Fund 5107) consists of appropriations, interest earned, gifts, grants and donations. Collections may be used only for economic development, infrastructure development, community development, job training programs and business.
Economic Development and Tourism Fund (Fund 5110) was established to record revenue from the sale of the specialty license plate, “Texas Aerospace and Aviation.” Collections in the account are to be used only to finance economic development and tourism activities. Receipts from this license plate are now recorded in the General Revenue Fund (Fund 0001) and the Economic Development and Tourism Fund will be closed in Fiscal Year 2014.
Texas Music Foundation License Plate Fund (Fund 5113) was established to account for revenue from the sale of specialty license plates that include the words “Texas Music.” Collections may be used by the Texas Music office within the Office of the Governor to make grants to benefit music-related educational and community programs sponsored by nonprofit organizations in this state. Starting September 1, 2013, receipts from this license plate will be recorded to the License Plate Trust Fund (Fund 0802) and the Tourism License Plate Fund will be abolished on September 30, 2013.
Texas Military Value Revolving Loan Fund (Fund 5114) was established for deposit of loan payments made by a political subdivision, gifts, grants and proceeds from the sale of general obligation bonds as authorized by Section 40-n, Article III, Texas Constitution. These proceeds are used to fund loans to political subdivisions and defense communities to prepare a comprehensive defense installation and community strategic impact plans.
Daughters of the Republic of Texas Fund (Fund 5115) was established to account for revenue from the sale of specialty license plates that include the words “Native Texan.” Proceeds are used by the Division of Economic Development and Tourism within the Office of the Governor to make grants to the Daughters of the Republic of Texas to preserve Texas historic sites or fund educational programs teaching Texas history. Starting September 1, 2013, receipts from this license plate will be recorded to the License Plate Trust Fund (Fund 0802) and the Tourism License Plate Fund will be abolished on September 30, 2013.
Emerging Technology Fund (Fund 5124) consists of appropriations, benefits realized from a project undertaken with money from the fund, gifts, grants, donations and interest earned. Proceeds are used for incentives for collaboration between certain entities, for matching research awards and for acquisition of research superiority.
BP Oil Spill Texas Response Grant (Fund 5149) consists of a block grant from British Petroleum to the state of Texas to pay for costs related to or resulting from the oil spill. These funds may also be used by various state agencies as directed by the Governor’s Office for costs related to or resulting from the oil spill.
UNAUDITED
Office of the Governor (Agencies 301 and 300)
13
Summary of Significant Accounting Policies (continued)
Special Revenue Funds Special revenue funds are used to account for the proceeds of specific revenue sources that are restricted or committed to expenditure for specified purposes other than debt service or capital projects.
Small Business Incubator Fund (Fund 0588) was established as a revolving fund to record bond proceeds, application fees, loan repayments, guarantee fees, royalties, dividend income, appropriations, federal grants and any other sources authorized by Section 71, Article XVI, Texas Constitution. Proceeds may be used to provide financing to foster and stimulate development of small business in this state and for fund administration.
Texas Product Development Fund (Fund 0589) was established as a revolving fund to record bond proceeds, application fees, loan repayments, guarantee fees, royalties, dividend income, appropriations, federal grants and any other sources authorized by Section 71, Article XVI, Texas Constitution. Proceeds may be used to provide financing to aid in the development and production of new or improved products in this state and to provide funding for administration.
Debt Service Funds Debt Service funds are used to account for the accumulation of financial resources that are restricted, committed or assigned to expenditures for general long-term debt principal and interest.
Small Business Incubator Fund (Fund 0588) was established as a revolving fund to record loan repayments in order to pay bond debt service.
Texas Product Development Fund (Fund 0589) was established as a revolving fund to record loan repayments in order to pay bond debt service.
Texas Military Value Revolving Loan Funds (Funds 7022, 7026, and 7027) were established to receive deposits of loan repayments in order to pay bond debt service.
Capital Assets Adjustment Fund Type The capital asset adjustment fund (Fund 9998) is used to convert governmental fund types’ capital assets from modified accrual to full accrual.
Long-Term Liabilities Adjustment Fund Type The long-term liabilities adjustment fund (Fund 9997) is used to convert governmental fund types’ debt from modified accrual to full accrual.
Proprietary Fund Types
Enterprise Funds Enterprise funds are used to account for any activity for which a fee is charged to external users for goods or services. Activities must be reported as enterprise funds if any one of the following criteria is met:
1. The activity is financed with debt that is secured solely by a pledge of the net revenue from fees and charges of the activity.
2. Laws or regulations require that the activity’s costs of providing services including capital costs (such as depreciation or debt service), be recovered with fees and charges, rather than with taxes or similar revenue.
3. The pricing policies of the activity establish fees and charges designed to recover its costs, including capital costs.
Economic Development Bank Fund (Fund 5106) consists of appropriations, fees and investment earnings under Government Code, Chapter 481, Subchapter BB, fees under Government Code, Chapter 489, and interest and other amounts received by the state under Government Code, Chapter 489. Proceeds are used only to carry out the purposes of Government Code, Chapter 489.
Capital Access Loan Loss Reserve Account (Fund 9999) was used to record assets, liabilities and transactions in accounts established in participating financial institutions to serve as a source of additional revenue to reimburse the financial institution for losses on loans enrolled in the capital access program. The fund consisted of appropriations and contributions made by the lenders and borrowers participating in the capital access program. As required by Government Code, Chapter 481, Subchapter BB, Section 481.410, all funds were transferred during the fiscal year to the Economic Development Bank Fund (Fund 5106).
UNAUDITED
Office of the Governor (Agencies 301 and 300)
14
Summary of Significant Accounting Policies (continued)
Fiduciary Fund Types
Fiduciary funds account for assets held by the State in a trustee capacity or as an agent for individuals, private organizations, other governmental units and/or other funds.
Agency Funds Agency funds are used to account for assets the government holds on behalf of others in a purely custodial capacity. Agency funds involve only the receipt, temporary investment and remittance of fiduciary resources to individuals, private organizations or other governments.
Component Units
The financial data of the individual component units are available from the component units’ separately issued financial statements. Additional information about component units is disclosed in Note 19.
Basis of Accounting
The basis of accounting determines when revenue and expenditures or expenses are recognized in the accounts reported in the financial statements. The accounting and financial reporting treatment applied to a fund is determined by its measurement focus.
Governmental fund types that build the fund financial statements are accounted for using the modified accrual basis of accounting. Under the modified accrual basis, revenue is recognized in the period in which it becomes both measurable and available to finance operations of the fiscal year or liquidate liabilities existing at fiscal year-end. The State of Texas considers receivables collected within sixty days after year-end to be available and recognizes them as revenue of the current year for fund financial statements prepared on the modified accrual basis. Expenditures and other uses of financial resources are recognized when the related liability is incurred.
Governmental adjustment fund types that will build the government-wide financial statements are accounted for using the full accrual basis of accounting. The following activities are recognized in these fund types: capital assets, accumulated depreciation, unpaid employee compensable leave, unmatured debt service on general long-term liabilities, long-term capital leases, long-term claims and judgments, and full accrual revenue and expenses.
Proprietary funds are accounted for on the full accrual basis of accounting. Under the full accrual basis of accounting, revenue is recognized when earned and expenses are recognized at the time liabilities are incurred. Proprietary funds distinguish operating from non-operating items. Operating revenue and expenses result from providing services or producing and delivering goods in connection with the proprietary funds’ principal ongoing operations. Operating expenses for proprietary funds include the cost of sales and services, administrative expenses and depreciation on capital assets.
Budget and Budgetary Accounting
The budget is prepared biennially and represents appropriations authorized by the Legislature and approved by the Governor (the General Appropriations Act). Unencumbered appropriations are generally subject to lapse 60 days after the end of the fiscal year for which they were appropriated.
Assets, Liabilities, and Fund Balance / Net Position
Assets
Cash and Cash Equivalents Short-term highly liquid investments with an original maturity of three months or less are considered cash equivalents.
Restricted Assets Restricted assets include monies or other resources restricted by legal or contractual requirements. These assets include proceeds of enterprise fund general obligation and revenue bonds and revenues set aside for statutory or contractual requirements.
UNAUDITED
Office of the Governor (Agencies 301 and 300)
15
Summary of Significant Accounting Policies (continued)
Inventories and Prepaid Items Inventories include both merchandise inventories on hand for sale and consumable inventories. Inventories are valued at cost, generally using the last-in, first-out method. The consumption method of accounting is used to account for inventories and prepaid items that appear in the governmental and proprietary fund types. The cost of these items is expensed when the items are consumed.
Loans and Contracts Receivable Loans receivable reflects the outstanding amount of loans to outside entities which have been entered into by the Office as loans or as grant advances. Per GASB 33 requirements, loans receivable also reflects grant payments given in advance of requirements being met. The grant advances will be reclassified as grant expenditures as requirements of the grant are met or when it has been determined that the grant requirements will not be met.
Losses related to troubled debt restructuring are estimated as set out in GASB 62 and reflected in the period of restructuring. Loans and contracts receivable are shown net of any allowance for doubtful loans and contracts. The allowance for doubtful loans and contracts includes the outstanding principal amount of loans that are in the process of collection but have not been determined to be uncollectible. The allowance for doubtful loans and contracts was $500,000 as of fiscal year end.
Loan origination and non-refundable application fees and direct loan origination costs are not recognized as an adjustment to yield nor as part of the loan balances as these adjustments are immaterial.
Equity Holdings for Economic Development Equity holdings held within the Texas Emerging Technology Fund (TEFT) are acquired as consideration for awards made to private companies primarily for the purpose of economic development within Texas. Therefore, these holdings are recorded at cost less impairment. Losses related to impairment are recorded as grant expense. The Emerging Technology Fund’s annual report to the legislature will include not only the cost basis as defined by GASB but also the fair value of these holdings.
Capital Assets Assets with an initial, individual cost of more than $5,000 and an estimated useful life in excess of one year are capitalized. These assets are capitalized at cost or, if not purchased, at fair value as of the date of acquisition. Purchases of assets with governmental funds are reported as expenditures. Depreciation is reported on all “exhaustible” assets. Assets are depreciated over the estimated useful life of the asset using the straight-line method.
Liabilities
Accounts Payable Accounts payable represents the liability for the value of assets or services received at the balance sheet date for which payment is pending.
Deferred Revenue Deferred revenue is revenue received but not yet earned at the end of the fiscal year.
Employees’ Compensable Leave Balances Employees’ compensable leave balances represents the liability that occurs due to relevant events such as resignations, retirements and uses of leave balances by covered employees. Liabilities are reported separately as either current or non-current in the statement of net assets. These obligations are normally paid from the same funding source from which each employee’s salary or wage compensation was paid.
Bonds Payable – General Obligation Bonds The unmatured principal of general obligation bonds is accounted for in the long-term liabilities adjustment column for governmental activities and in proprietary funds for business-type activities. These payables are reported as current long-term liabilities for amounts due within one year and noncurrent long-term liabilities for amounts due thereafter in the statement of net assets. The bonds are reported at par, net of unamortized premiums, discounts, issuance costs and gains/(losses) on bond refunding activities.
For governmental activities, bond proceeds are accounted for when received as an “other financing source” in the governmental fund receiving the proceeds. Payment of principal and interest is an expenditure recorded in the debt service fund. All bond transactions and balances for business-type activities are reported in proprietary funds.
UNAUDITED
Office of the Governor (Agencies 301 and 300)
16
Summary of Significant Accounting Policies (continued)
Bonds Payable – Revenue Bonds Revenue bonds are accounted for in proprietary funds for business-type activities and in the long-term liabilities adjustment column for governmental activities. These payables are reported as current long-term liabilities for amounts due within one year and noncurrent long-term liabilities for amounts due thereafter in the statement of net assets. The bonds are reported at par, net of unamortized premiums, discounts, issuance costs and gains/(losses) on bond refunding activities.
Fund Balance / Net Position
The difference between fund assets plus deferred outflows of resources and liabilities plus deferred inflows of resources is ”net position” on the government-wide, proprietary and fiduciary fund statements, and the ”fund balance” is the difference between fund assets plus deferred outflows of resources and liabilities plus deferred inflows of resources on the governmental fund statements.
Fund Balance Components Fund balances for governmental funds are classified as nonspendable, restricted, committed, assigned or unassigned in the fund financial statements.
1) Nonspendable fund balance includes amounts not available to be spent because they are either (1) not in spendable form or (2) legally or contractually required to be maintained intact.
2) Restricted fund balance includes those resources that have constraints placed on their use through external parties or by law through constitutional provisions. Fund balances of the following funds not classified as nonspendable have been classified as restricted: o Federal fund balances which are accounted for in the Governor’s Office Federal Projects
Fund 0224, the American Recovery & Reinvest Act fund within Fund 0001 and the Criminal Justice Planning Fund 0421 have been classified as restricted.
o Fund balances of the Small Business Incubator Fund 0588, the Texas Product Development Fund 0589 and the Texas Military Revolving Loan Fund 5114 have been classified as restricted since these funds were established in the Texas Constitution. The Small Business Incubator Fund and the Texas Product Development Fund were established in Article XVI and the Texas Military Revolving Loan Fund was established in Article III.
o In addition, fund balances of the debt service funds of Texas Military Value Revolving Loan Funds 7022, 7026 and 7273 and a portion of the fund balance of the enterprise fund of Economic Development Bank Fund 5106 have been classified as restricted due to the restrictions of the debt covenants.
3) Committed fund balance can be used only for specific purposes pursuant to constraints imposed
by a formal action of the Texas Legislature, the state’s highest level of decision making authority. Fund balances of the general revenue dedicated funds and the blended component units which are not classified as nonspendable or restricted have been classified as committed.
4) Assigned fund balance includes amounts constrained by the state’s intent to be used for specific purposes, but are neither restricted nor committed. Intent is expressed by (1) the Texas Legislature or (2) a body (for example, a budget or finance committee) or official to which the governing body has delegated the authority to assign amounts to be used for specific purposes.
5) Unassigned fund balance is the residual classification for the general fund. This classification represents fund balance that was not assigned to other funds and was not restricted, committed or assigned to specific purposes within the general fund.
Invested In Capital Assets, Net Of Related Debt Invested in capital assets, net of related debt consists of capital assets, net of accumulated depreciation and reduced by outstanding balances for bond, notes and other debt that are attributed to the acquisition, construction or improvement of those assets.
Restricted Net Position Restricted net position results when constraints placed on net resources are either externally imposed by creditors, grantors, contributors and the like or imposed by law through constitutional provisions or enabling legislation.
Unrestricted Net Position Unrestricted net position consists of net resources that do not meet the definition of the two preceding categories. Unrestricted net position often has constraints on resources that are imposed by management but can be removed or modified.
UNAUDITED
Office of the Governor (Agencies 301 and 300)
17
Summary of Significant Accounting Policies (continued)
Interfund Activities and Balances
The Office has the following type of transactions between funds and/or agencies:
1) Transfers: Legally required transfers that are reported when incurred as “transfers in” by the recipient fund and as “transfers out” by the disbursing fund.
2) Reimbursements: Reimbursements are repayments from funds responsible for expenditures or expenses to funds that made the actual payment. Reimbursements of expenditures made by one fund for another are recorded as expenditures in the reimbursing fund and as a reduction of expenditures in the reimbursed fund. Reimbursements are not displayed in the financial statements.
3) Interfund receivables and payables: Interfund loans are reported as interfund receivables and payables. If repayment is due during the current year or soon thereafter, the balance is classified as “current.” Balances for repayment due in two (or more) years are classified as “noncurrent.”
The composition of the Office’s interfund receivables and payables are presented in Note 12.
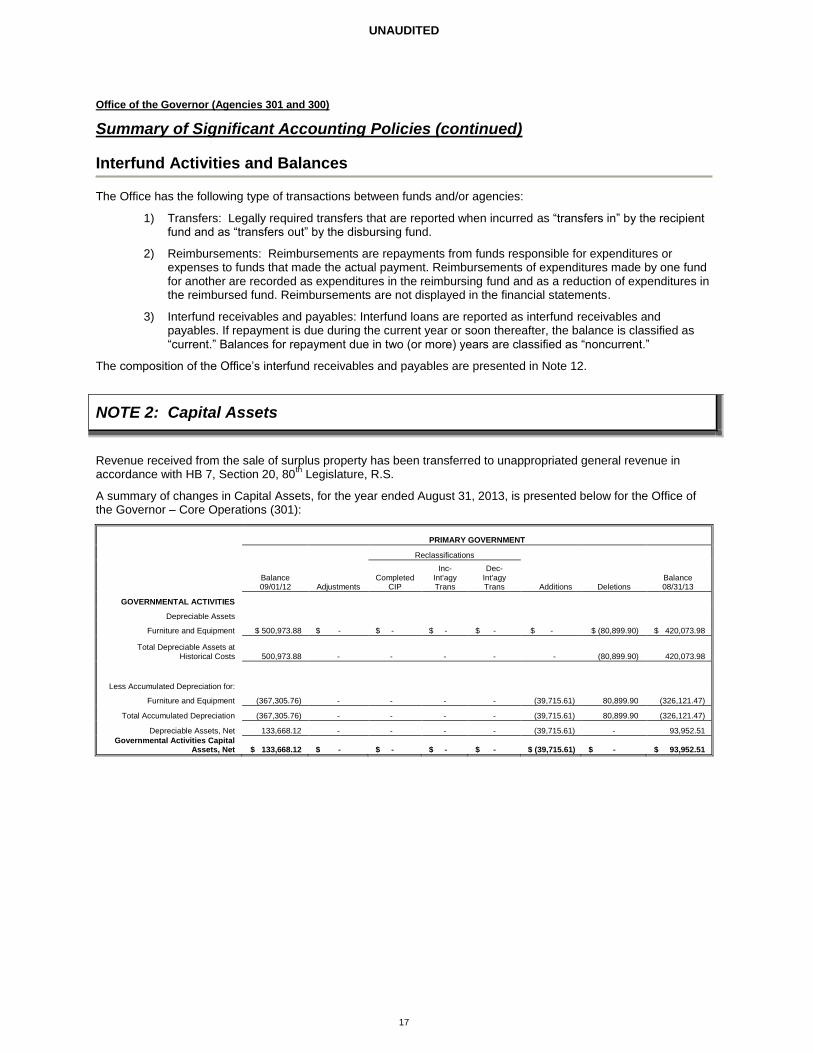
NOTE 2: Capital Assets
Revenue received from the sale of surplus property has been transferred to unappropriated general revenue in accordance with HB 7, Section 20, 80
th Legislature, R.S.
A summary of changes in Capital Assets, for the year ended August 31, 2013, is presented below for the Office of the Governor – Core Operations (301):
PRIMARY GOVERNMENT
Reclassifications
Balance 09/01/12 Adjustments
Completed CIP
Inc- Int'agy Trans
Dec-Int'agy Trans Additions Deletions
Balance 08/31/13
GOVERNMENTAL ACTIVITIES
Depreciable Assets
Furniture and Equipment $ 500,973.88 $ - $ - $ - $ - $ - $ (80,899.90) $ 420,073.98
Total Depreciable Assets at Historical Costs 500,973.88 - - - - - (80,899.90) 420,073.98
Less Accumulated Depreciation for:
Furniture and Equipment (367,305.76) - - - - (39,715.61) 80,899.90 (326,121.47)
Total Accumulated Depreciation (367,305.76) - - - - (39,715.61) 80,899.90 (326,121.47)
Depreciable Assets, Net 133,668.12 - - - - (39,715.61) - 93,952.51
Governmental Activities Capital Assets, Net $ 133,668.12 $ - $ - $ - $ - $ (39,715.61) $ - $ 93,952.51
UNAUDITED
Office of the Governor (Agencies 301 and 300)
18
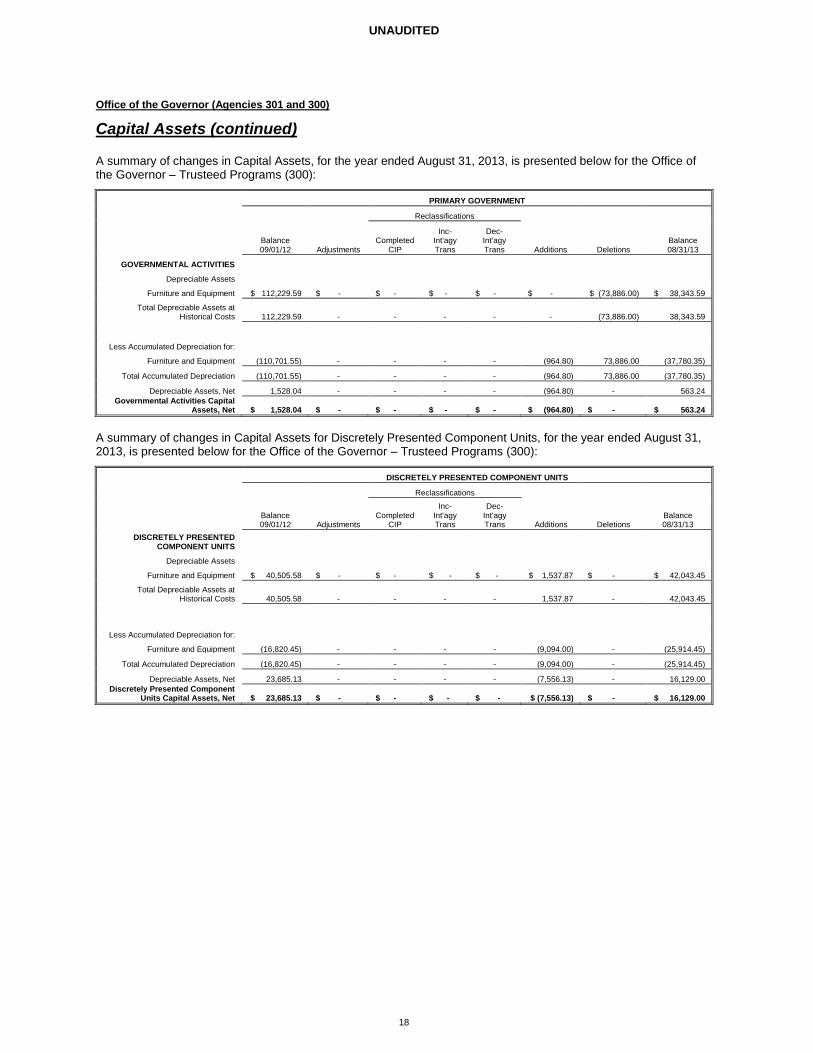
Capital Assets (continued)
A summary of changes in Capital Assets, for the year ended August 31, 2013, is presented below for the Office of the Governor – Trusteed Programs (300):
PRIMARY GOVERNMENT
Reclassifications
Balance 09/01/12 Adjustments
Completed CIP
Inc- Int'agy Trans
Dec-Int'agy Trans Additions Deletions
Balance 08/31/13
GOVERNMENTAL ACTIVITIES
Depreciable Assets
Furniture and Equipment $ 112,229.59 $ - $ - $ - $ - $ - $ (73,886.00) $ 38,343.59
Total Depreciable Assets at Historical Costs 112,229.59 - - - - -
(73,886.00) 38,343.59
Less Accumulated Depreciation for:
Furniture and Equipment (110,701.55) - - - - (964.80) 73,886.00 (37,780.35)
Total Accumulated Depreciation (110,701.55) - - - - (964.80) 73,886.00 (37,780.35)
Depreciable Assets, Net 1,528.04 - - - - (964.80) - 563.24
Governmental Activities Capital Assets, Net $ 1,528.04 $ - $ - $ - $ - $ (964.80) $ - $ 563.24
A summary of changes in Capital Assets for Discretely Presented Component Units, for the year ended August 31, 2013, is presented below for the Office of the Governor – Trusteed Programs (300):
DISCRETELY PRESENTED COMPONENT UNITS
Reclassifications
Balance 09/01/12 Adjustments
Completed CIP
Inc- Int'agy Trans
Dec-Int'agy Trans Additions Deletions
Balance 08/31/13
DISCRETELY PRESENTED COMPONENT UNITS
Depreciable Assets
Furniture and Equipment $ 40,505.58 $ - $ - $ - $ - $ 1,537.87 $ - $ 42,043.45
Total Depreciable Assets at Historical Costs 40,505.58 - - - - 1,537.87 - 42,043.45
Less Accumulated Depreciation for:
Furniture and Equipment (16,820.45) - - - - (9,094.00) - (25,914.45)
Total Accumulated Depreciation (16,820.45) - - - - (9,094.00) - (25,914.45)
Depreciable Assets, Net 23,685.13 - - - - (7,556.13) - 16,129.00
Discretely Presented Component Units Capital Assets, Net $ 23,685.13 $ - $ - $ - $ - $ (7,556.13) $ - $ 16,129.00
UNAUDITED
Office of the Governor (Agencies 301 and 300)
19
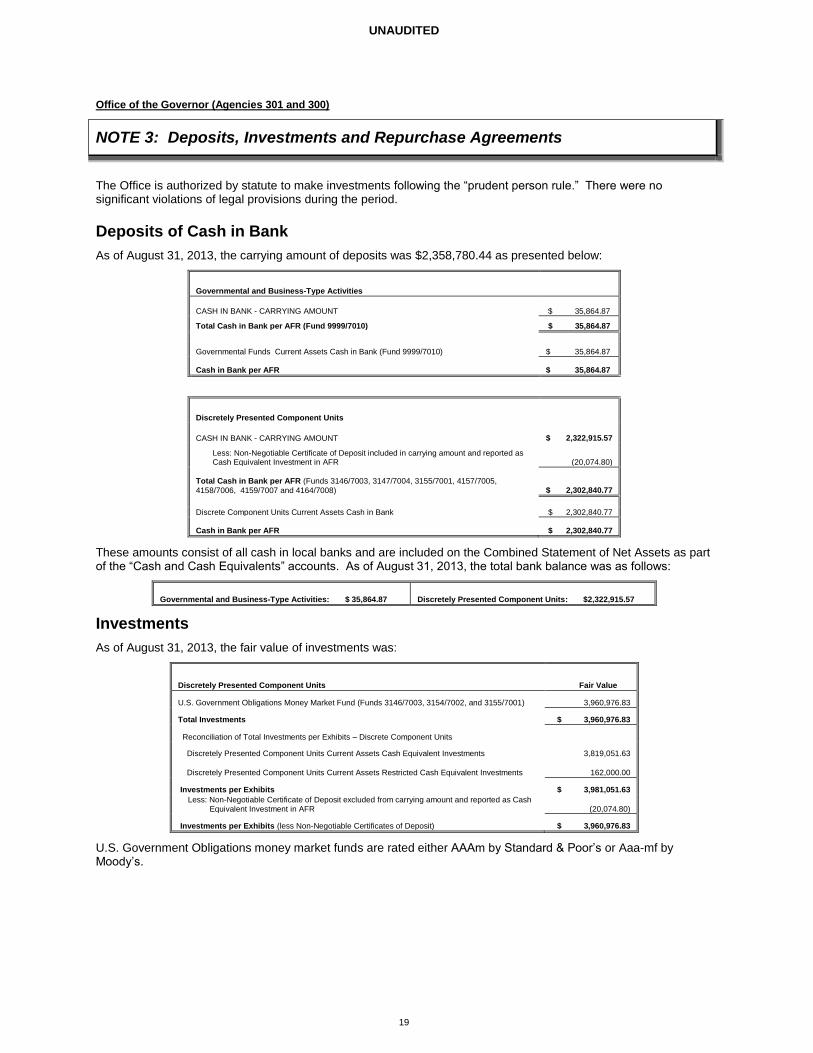
NOTE 3: Deposits, Investments and Repurchase Agreements
The Office is authorized by statute to make investments following the “prudent person rule.” There were no significant violations of legal provisions during the period.
Deposits of Cash in Bank
As of August 31, 2013, the carrying amount of deposits was $2,358,780.44 as presented below:
Governmental and Business-Type Activities
CASH IN BANK - CARRYING AMOUNT $ 35,864.87
Total Cash in Bank per AFR (Fund 9999/7010) $ 35,864.87
Governmental Funds Current Assets Cash in Bank (Fund 9999/7010) $ 35,864.87
Cash in Bank per AFR $ 35,864.87
Discretely Presented Component Units
CASH IN BANK - CARRYING AMOUNT $ 2,322,915.57
Less: Non-Negotiable Certificate of Deposit included in carrying amount and reported as Cash Equivalent Investment in AFR (20,074.80)
Total Cash in Bank per AFR (Funds 3146/7003, 3147/7004, 3155/7001, 4157/7005,
4158/7006, 4159/7007 and 4164/7008) $ 2,302,840.77
$ 2,302,840.77 Discrete Component Units Current Assets Cash in Bank
Cash in Bank per AFR $ 2,302,840.77
These amounts consist of all cash in local banks and are included on the Combined Statement of Net Assets as part of the “Cash and Cash Equivalents” accounts. As of August 31, 2013, the total bank balance was as follows:
Governmental and Business-Type Activities: $ 35,864.87 Discretely Presented Component Units: $2,322,915.57
Investments
As of August 31, 2013, the fair value of investments was:
Discretely Presented Component Units Fair Value
U.S. Government Obligations Money Market Fund (Funds 3146/7003, 3154/7002, and 3155/7001) 3,960,976.83
Total Investments $ 3,960,976.83
Reconciliation of Total Investments per Exhibits – Discrete Component Units
Discretely Presented Component Units Current Assets Cash Equivalent Investments 3,819,051.63
Discretely Presented Component Units Current Assets Restricted Cash Equivalent Investments 162,000.00
Investments per Exhibits $ 3,981,051.63
Less: Non-Negotiable Certificate of Deposit excluded from carrying amount and reported as Cash Equivalent Investment in AFR (20,074.80)
Investments per Exhibits (less Non-Negotiable Certificates of Deposit) $ 3,960,976.83
U.S. Government Obligations money market funds are rated either AAAm by Standard & Poor’s or Aaa-mf by Moody’s.
UNAUDITED
Office of the Governor (Agencies 301 and 300)
20
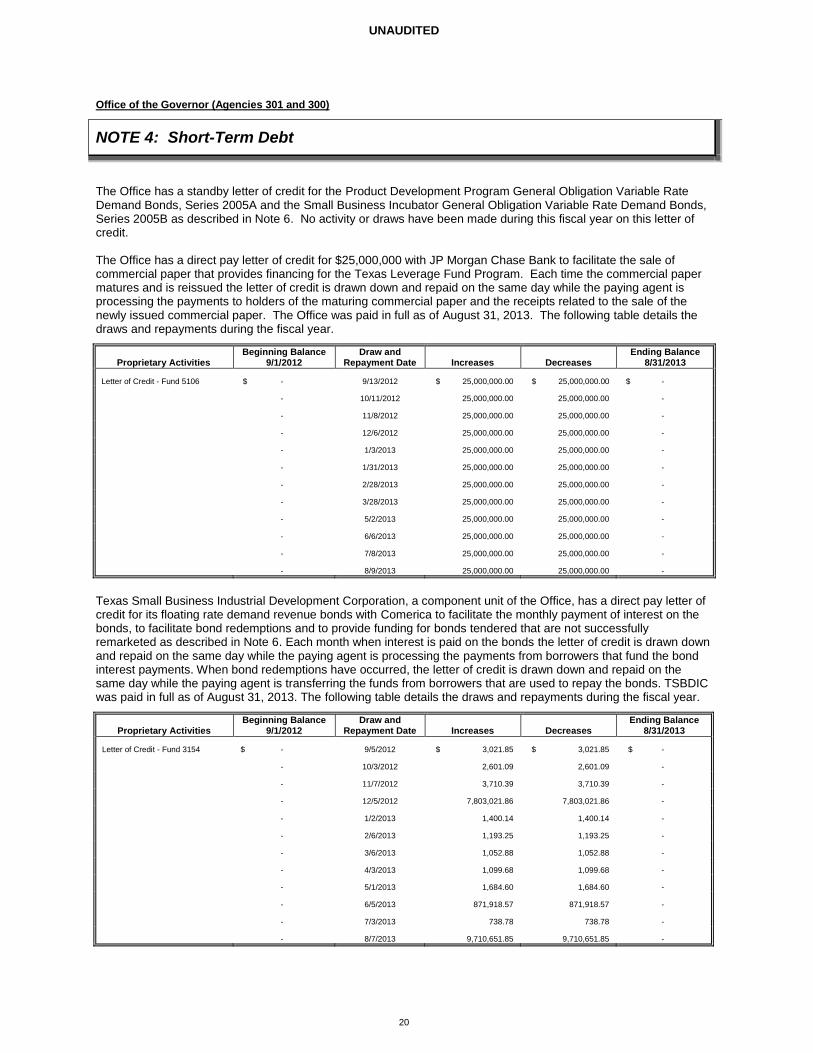
NOTE 4: Short-Term Debt
The Office has a standby letter of credit for the Product Development Program General Obligation Variable Rate Demand Bonds, Series 2005A and the Small Business Incubator General Obligation Variable Rate Demand Bonds, Series 2005B as described in Note 6. No activity or draws have been made during this fiscal year on this letter of credit.
The Office has a direct pay letter of credit for $25,000,000 with JP Morgan Chase Bank to facilitate the sale of commercial paper that provides financing for the Texas Leverage Fund Program. Each time the commercial paper matures and is reissued the letter of credit is drawn down and repaid on the same day while the paying agent is processing the payments to holders of the maturing commercial paper and the receipts related to the sale of the newly issued commercial paper. The Office was paid in full as of August 31, 2013. The following table details the draws and repayments during the fiscal year.
Proprietary Activities Beginning Balance
9/1/2012 Draw and
Repayment Date Increases Decreases Ending Balance
8/31/2013
Letter of Credit - Fund 5106 $ - 9/13/2012 $ 25,000,000.00 $ 25,000,000.00 $ -
- 10/11/2012 25,000,000.00 25,000,000.00 -
- 11/8/2012 25,000,000.00 25,000,000.00 -
- 12/6/2012 25,000,000.00 25,000,000.00 -
- 1/3/2013 25,000,000.00 25,000,000.00 -
- 1/31/2013 25,000,000.00 25,000,000.00 -
- 2/28/2013 25,000,000.00 25,000,000.00 -
- 3/28/2013 25,000,000.00 25,000,000.00 -
- 5/2/2013 25,000,000.00 25,000,000.00 -
- 6/6/2013 25,000,000.00 25,000,000.00 -
- 7/8/2013 25,000,000.00 25,000,000.00 -
- 8/9/2013 25,000,000.00 25,000,000.00 -
Texas Small Business Industrial Development Corporation, a component unit of the Office, has a direct pay letter of credit for its floating rate demand revenue bonds with Comerica to facilitate the monthly payment of interest on the bonds, to facilitate bond redemptions and to provide funding for bonds tendered that are not successfully remarketed as described in Note 6. Each month when interest is paid on the bonds the letter of credit is drawn down and repaid on the same day while the paying agent is processing the payments from borrowers that fund the bond interest payments. When bond redemptions have occurred, the letter of credit is drawn down and repaid on the same day while the paying agent is transferring the funds from borrowers that are used to repay the bonds. TSBDIC was paid in full as of August 31, 2013. The following table details the draws and repayments during the fiscal year.
Proprietary Activities Beginning Balance
9/1/2012 Draw and
Repayment Date Increases Decreases Ending Balance
8/31/2013
Letter of Credit - Fund 3154 $ - 9/5/2012 $ 3,021.85 $ 3,021.85 $ -
- 10/3/2012 2,601.09 2,601.09 -
- 11/7/2012 3,710.39 3,710.39 -
- 12/5/2012 7,803,021.86 7,803,021.86 -
- 1/2/2013 1,400.14 1,400.14 -
- 2/6/2013 1,193.25 1,193.25 -
- 3/6/2013 1,052.88 1,052.88 -
- 4/3/2013 1,099.68 1,099.68 -
- 5/1/2013 1,684.60 1,684.60 -
- 6/5/2013 871,918.57 871,918.57 -
- 7/3/2013 738.78 738.78 -
- 8/7/2013 9,710,651.85 9,710,651.85 -
UNAUDITED
Office of the Governor (Agencies 301 and 300)
21
NOTE 5: Long-Term Liabilities
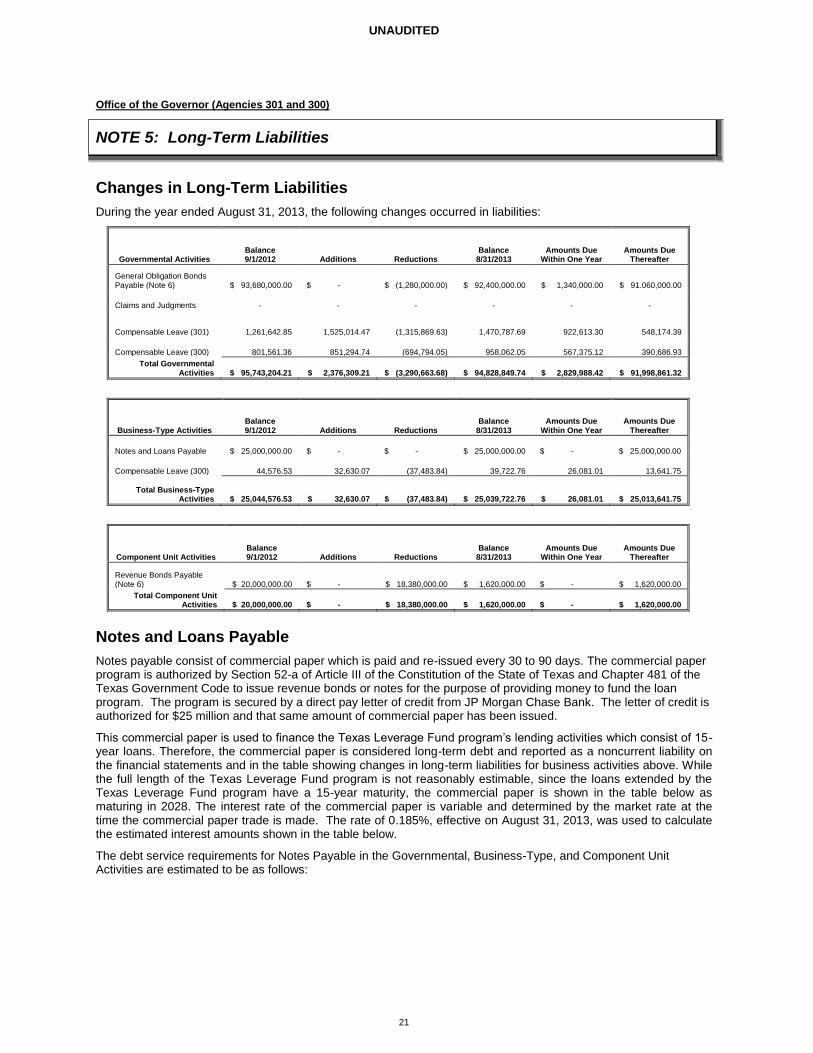
Changes in Long-Term Liabilities
During the year ended August 31, 2013, the following changes occurred in liabilities:
Governmental Activities Balance 9/1/2012 Additions Reductions
Balance 8/31/2013
Amounts Due Within One Year
Amounts Due Thereafter
General Obligation Bonds Payable (Note 6) $ 93,680,000.00 $ - $ (1,280,000.00) $ 92,400,000.00 $ 1,340,000.00 $ 91.060,000.00
Claims and Judgments - - - - - -
Compensable Leave (301) 1,261,642.85 1,525,014.47 (1,315,869.63) 1,470,787.69 922,613.30 548,174.39
Compensable Leave (300) 801,561.36 851,294.74 (694,794.05) 958,062.05 567,375.12 390,686.93
Total Governmental Activities $ 95,743,204.21 $ 2,376,309.21 $ (3,290,663.68) $ 94,828,849.74 $ 2,829,988.42 $ 91,998,861.32
Business-Type Activities Balance 9/1/2012 Additions Reductions
Balance 8/31/2013
Amounts Due Within One Year
Amounts Due Thereafter
Notes and Loans Payable $ 25,000,000.00 $ - $ - $ 25,000,000.00 $ - $ 25,000,000.00
Compensable Leave (300) 44,576.53 32,630.07 (37,483.84) 39,722.76 26,081.01 13,641.75
Total Business-Type Activities $ 25,044,576.53 $ 32,630.07 $ (37,483.84) $ 25,039,722.76
$ 26,081.01 $ 25,013,641.75
Component Unit Activities Balance 9/1/2012 Additions Reductions
Balance 8/31/2013
Amounts Due Within One Year
Amounts Due Thereafter
Revenue Bonds Payable (Note 6) $ 20,000,000.00 $ - $ 18,380,000.00 $ 1,620,000.00 $ - $ 1,620,000.00
Total Component Unit Activities $ 20,000,000.00 $ - $ 18,380,000.00 $ 1,620,000.00 $ - $ 1,620,000.00
Notes and Loans Payable
Notes payable consist of commercial paper which is paid and re-issued every 30 to 90 days. The commercial paper program is authorized by Section 52-a of Article III of the Constitution of the State of Texas and Chapter 481 of the Texas Government Code to issue revenue bonds or notes for the purpose of providing money to fund the loan program. The program is secured by a direct pay letter of credit from JP Morgan Chase Bank. The letter of credit is authorized for $25 million and that same amount of commercial paper has been issued.
This commercial paper is used to finance the Texas Leverage Fund program’s lending activities which consist of 15-year loans. Therefore, the commercial paper is considered long-term debt and reported as a noncurrent liability on the financial statements and in the table showing changes in long-term liabilities for business activities above. While the full length of the Texas Leverage Fund program is not reasonably estimable, since the loans extended by the Texas Leverage Fund program have a 15-year maturity, the commercial paper is shown in the table below as maturing in 2028. The interest rate of the commercial paper is variable and determined by the market rate at the time the commercial paper trade is made. The rate of 0.185%, effective on August 31, 2013, was used to calculate the estimated interest amounts shown in the table below.
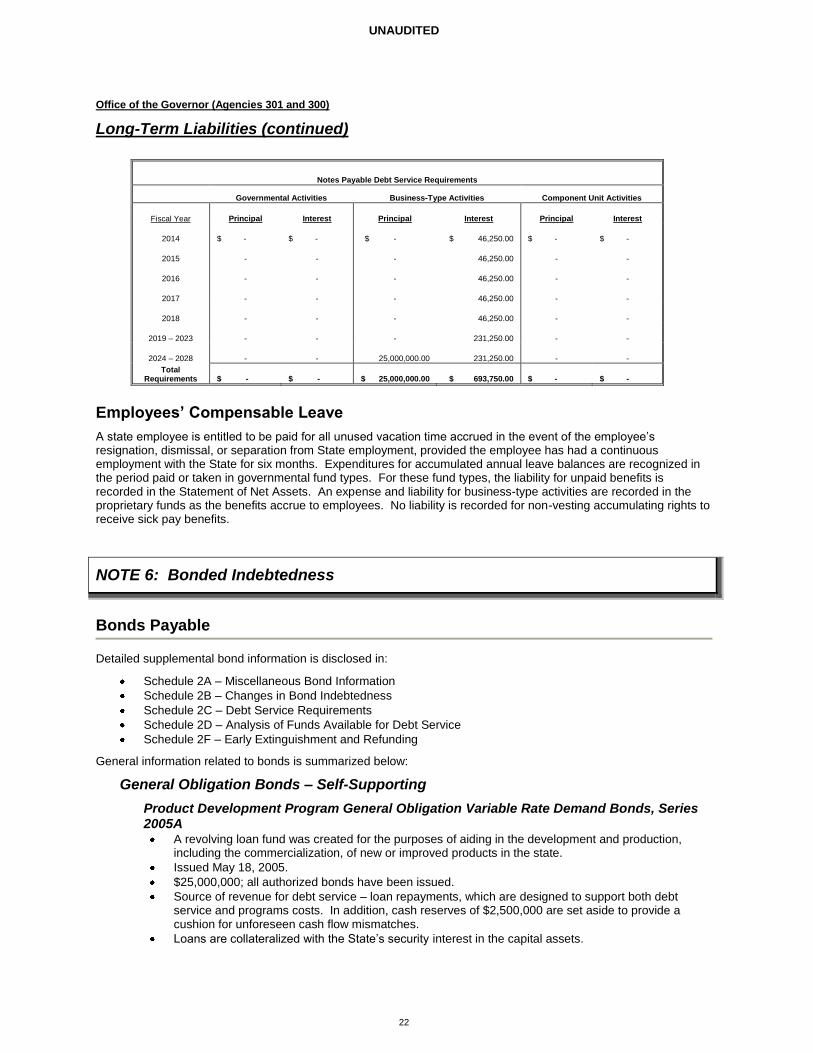
The debt service requirements for Notes Payable in the Governmental, Business-Type, and Component Unit Activities are estimated to be as follows:
UNAUDITED
Office of the Governor (Agencies 301 and 300)
22
Long-Term Liabilities (continued)
Notes Payable Debt Service Requirements
Governmental Activities Business-Type Activities Component Unit Activities
Fiscal Year Principal Interest Principal Interest Principal Interest
2014 $ - $ - $ - $ 46,250.00 $ - $ -
2015 - - - 46,250.00 - -
2016 - - - 46,250.00 - -
2017 - - - 46,250.00 - -
2018 - - - 46,250.00 - -
2019 – 2023 - - - 231,250.00 - -
2024 – 2028 - - 25,000,000.00 231,250.00 - -
Total Requirements $ - $ - $ 25,000,000.00 $ 693,750.00 $ - $ -
Employees’ Compensable Leave
A state employee is entitled to be paid for all unused vacation time accrued in the event of the employee’s resignation, dismissal, or separation from State employment, provided the employee has had a continuous employment with the State for six months. Expenditures for accumulated annual leave balances are recognized in the period paid or taken in governmental fund types. For these fund types, the liability for unpaid benefits is recorded in the Statement of Net Assets. An expense and liability for business-type activities are recorded in the proprietary funds as the benefits accrue to employees. No liability is recorded for non-vesting accumulating rights to receive sick pay benefits.
NOTE 6: Bonded Indebtedness
Bonds Payable
Detailed supplemental bond information is disclosed in:
Schedule 2A – Miscellaneous Bond Information
Schedule 2B – Changes in Bond Indebtedness
Schedule 2C – Debt Service Requirements
Schedule 2D – Analysis of Funds Available for Debt Service
Schedule 2F – Early Extinguishment and Refunding
General information related to bonds is summarized below:
General Obligation Bonds – Self-Supporting
Product Development Program General Obligation Variable Rate Demand Bonds, Series 2005A
A revolving loan fund was created for the purposes of aiding in the development and production, including the commercialization, of new or improved products in the state.
Issued May 18, 2005.
$25,000,000; all authorized bonds have been issued.
Source of revenue for debt service – loan repayments, which are designed to support both debt service and programs costs. In addition, cash reserves of $2,500,000 are set aside to provide a cushion for unforeseen cash flow mismatches.
Loans are collateralized with the State’s security interest in the capital assets.
UNAUDITED
Office of the Governor (Agencies 301 and 300)
23
Bond Indebtedness (continued)
Bondholders may tender the bonds for repurchase every seven days. Any bonds tendered will be purchased with proceeds from loan repayments and/or the standby letter of credit until remarketed.
Demand bonds for the Product Development Program and the Small Business Incubator Program are backed by an irrevocable standby letter of credit issued by National Australia Bank for a limit of $45,419,179 which expires on June 1, 2015. The Product Development Program incurs an estimated annual cost of $23,800 for this letter of credit. As of August 31, 2013, no principal drawings have been made on the letter of credit. The Office does not have a take-out agreement as part of this letter of credit or as a separate agreement.
Small Business Incubator General Obligation Variable Rate Demand Bonds, Series 2005B A revolving loan fund was created for the purposes of fostering and stimulating the development of
new or existing small businesses in the state.
Issued May 18, 2005.
$20,000,000; all authorized bonds have been issued.
Source of revenue for debt service – loan repayments, which are designed to support both debt service and programs costs. In addition, cash reserves of $2,000,000 are set aside to provide a cushion for unforeseen cash flow mismatches.
Loans are collateralized with the State’s security interest in the intangible assets.
Bondholders may tender the bonds for repurchase every seven days. Any bonds tendered will be purchased with proceeds from loan repayments and/or the standby letter of credit until remarketed.
Demand bonds for the Product Development Program and the Small Business Incubator Program are backed by an irrevocable standby letter of credit issued by National Australia Bank for a limit of $45,419,179 which expires on June 1, 2015. The Small Business Incubator Program incurs an estimated annual cost of $19,100 for this letter of credit. As of August 31, 2013, no principal drawings have been made on the letter of credit. The Office does not have a take-out agreement as part of this letter of credit or as a separate agreement.
Texas Military Value Revolving Loan Program General Obligation Bonds, Series 2007A-1, Series 2007A-2, and Taxable Series 2007B
A revolving loan fund was created to provide loans to defense-related communities for economic development projects, including projects that enhance military value of installations located in Texas.
Issued March 15, 2007.
$250,000,000 authorized – $49,595,000 issued: $10,815,000 under Series 2007A-1, $10,160,000 under Series 2007A-2, and $28,620,000 under Series 2007B. Bond authority of $200,405,000 remains unissued.
Bonds totaling $450,000 matured in fiscal year 2011; $465,000 matured in fiscal year 2012; and $1,280,000 matured in fiscal year 2013, leaving an outstanding principal amount of $47,400,000.
Debt service payments are processed by the Texas Public Finance Authority by means of shared funds established in the Treasury.
Source of revenue for debt service – loan repayments, which are designed to support both debt service and programs costs. Any interest rate resets are mirrored in the interest rate provisions in the underlying loan so as to create a match in interest rate payments from the borrower with interest payments to the bondholders.
Loans are collateralized with the State’s interest in the agreements financed with the loan proceeds.
Bondholders do not have the authority to tender the bonds for repurchase.
Component Unit Revenue Bonds – Self-Supporting
Texas Small Business Industrial Development Corporation Floating Rate Demand Revenue Bonds
The purpose of the program is to provide a capital financing source for eligible participants to promote economic development in the State of Texas and for purchasing obligations of eligible economic development projects.
Issued July 15, 1986.
$750,000,000; all authorized bonds have been issued.
UNAUDITED
Office of the Governor (Agencies 301 and 300)
24
Bond Indebtedness (continued)
Bonds totaling $649,600,000 and $1,065,000 were redeemed on July 5, 1989, and November 1, 1989, respectively. Bonds totaling $39,335,000 were redeemed in 2009. Bonds totaling $13,500,000 and $26,500,000 were redeemed on March 7, 2012 and May 2, 2012, respectively. Bonds totaling $7,800,000 were redeemed on December 5, 2012; $870,000 were redeemed on June 5, 2013; and $9,710,000 were redeemed on August 7, 2013, leaving an outstanding principal amount of $1,620,000.
Source of revenue for debt service – loan repayments and investment earnings on bond proceeds.
Bondholders may tender the bonds for repurchase every seven days. Any bonds tendered will be purchased with proceeds from the remarketing of the bonds, or if not successfully marketed, from amounts drawn under the LOC.
Bonds are secured by an irrevocable letter of credit issued by Comerica for a limit of $1,658,614 which expires on February 8, 2014. Texas Small Business Industrial Development Corporation incurred for fiscal year 2013 an estimated annual cost of $176,778 for this letter of credit which secured bonds with a principal amount of $20 million at the beginning of the fiscal year. As of August 31, 2013, no principal drawings were outstanding on the letter of credit. The Office does not have a take-out agreement as part of this letter of credit or as a separate agreement.
Bonds are issued by Texas Small Business Industrial Corporation; neither the State of Texas nor the Office is responsible for repayment of these bonds.
Early Extinguishment
Texas Small Business Industrial Development Corporation, a component unit of the Office, redeemed $7,800,000 on December 5, 2012, $870,000 on June 5, 2013 and $9,710,000 on August 7, 2013 of its floating rate demand revenue bonds at a redemption price of 100% as shown in Schedule 2F. The source of funds used for the extinguishments was loan repayments from borrowers and a reduction in the debt service reserve account.
Refunding
No advance or current refundings occurred during fiscal year 2013.
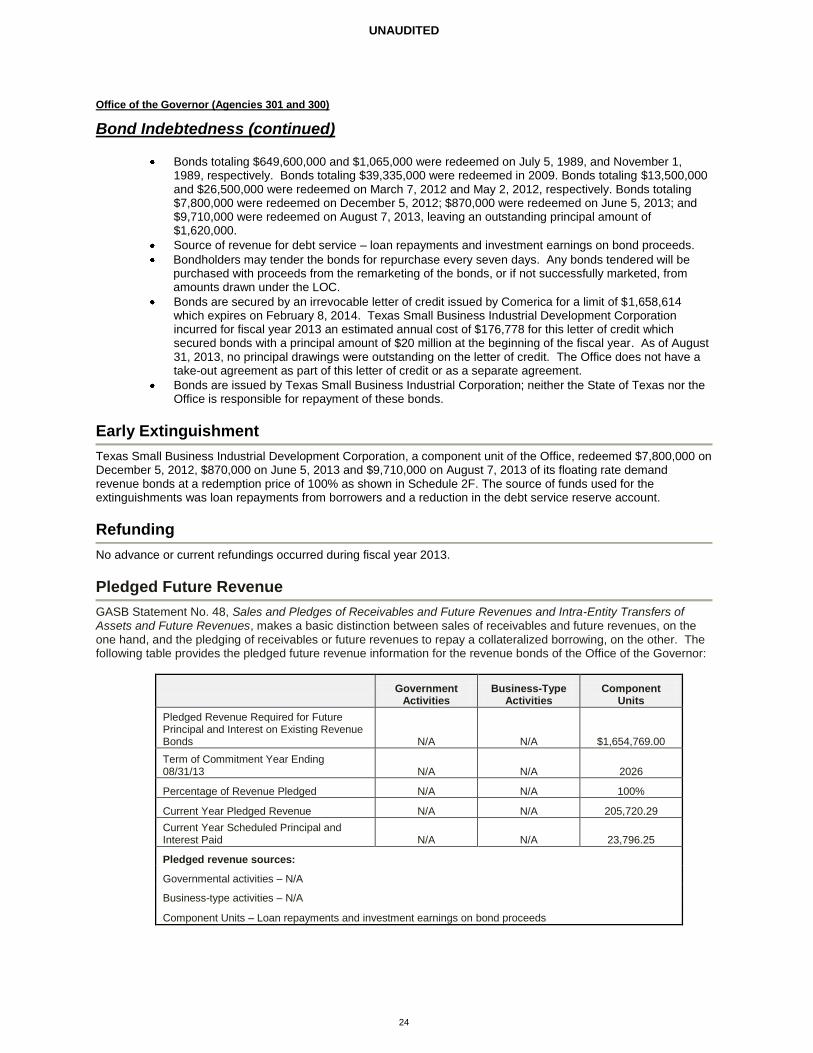
Pledged Future Revenue
GASB Statement No. 48, Sales and Pledges of Receivables and Future Revenues and Intra-Entity Transfers of Assets and Future Revenues, makes a basic distinction between sales of receivables and future revenues, on the one hand, and the pledging of receivables or future revenues to repay a collateralized borrowing, on the other. The following table provides the pledged future revenue information for the revenue bonds of the Office of the Governor:
Government
Activities Business-Type
Activities Component
Units
Pledged Revenue Required for Future Principal and Interest on Existing Revenue Bonds N/A N/A $1,654,769.00
Term of Commitment Year Ending 08/31/13 N/A N/A 2026
Percentage of Revenue Pledged N/A N/A 100%
Current Year Pledged Revenue N/A N/A 205,720.29
Current Year Scheduled Principal and Interest Paid N/A N/A 23,796.25
Pledged revenue sources:
Governmental activities – N/A
Business-type activities – N/A
Component Units – Loan repayments and investment earnings on bond proceeds
UNAUDITED
Office of the Governor (Agencies 301 and 300)
25
NOTE 7: Derivative Instruments
(Not Applicable)
NOTE 8: Leases
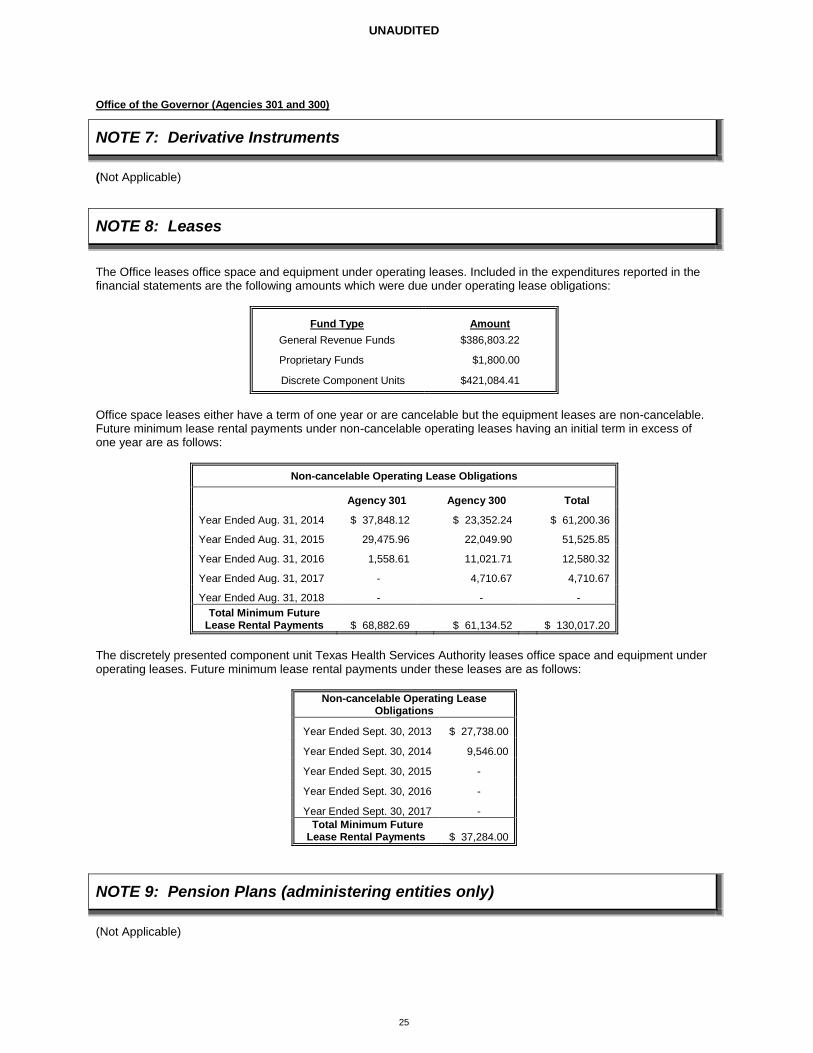
The Office leases office space and equipment under operating leases. Included in the expenditures reported in the financial statements are the following amounts which were due under operating lease obligations:
Fund Type Amount
General Revenue Funds $386,803.22
Proprietary Funds $1,800.00
Discrete Component Units $421,084.41
Office space leases either have a term of one year or are cancelable but the equipment leases are non-cancelable. Future minimum lease rental payments under non-cancelable operating leases having an initial term in excess of one year are as follows:
Non-cancelable Operating Lease Obligations
Agency 301 Agency 300 Total
Year Ended Aug. 31, 2014 $ 37,848.12
$ 23,352.24
$ 61,200.36
Year Ended Aug. 31, 2015 29,475.96
22,049.90
51,525.85
Year Ended Aug. 31, 2016 1,558.61
11,021.71
12,580.32
Year Ended Aug. 31, 2017 -
4,710.67
4,710.67
Year Ended Aug. 31, 2018 -
-
-
Total Minimum Future Lease Rental Payments $ 68,882.69
$ 61,134.52
$ 130,017.20
The discretely presented component unit Texas Health Services Authority leases office space and equipment under operating leases. Future minimum lease rental payments under these leases are as follows:
Non-cancelable Operating Lease Obligations
Year Ended Sept. 30, 2013 $ 27,738.00
Year Ended Sept. 30, 2014 9,546.00
Year Ended Sept. 30, 2015 -
Year Ended Sept. 30, 2016 -
Year Ended Sept. 30, 2017 -
Total Minimum Future Lease Rental Payments $ 37,284.00
NOTE 9: Pension Plans (administering entities only)
(Not Applicable)
UNAUDITED
Office of the Governor (Agencies 301 and 300)
26
NOTE 10: Deferred Compensation (administering agencies only)
(Not Applicable)
NOTE 11: Post Employment Health Care and Life Insurance Benefits (administering agencies only)
(Not Applicable)
NOTE 12: Interfund Activity and Transactions
The Office experienced routine transfers with other state agencies, which were consistent with the activities of the fund making the transfer. The Office had no Interfund receivables or payables as of August 31, 2013.
NOTE 13: Continuance Subject To Review
(Not Applicable)
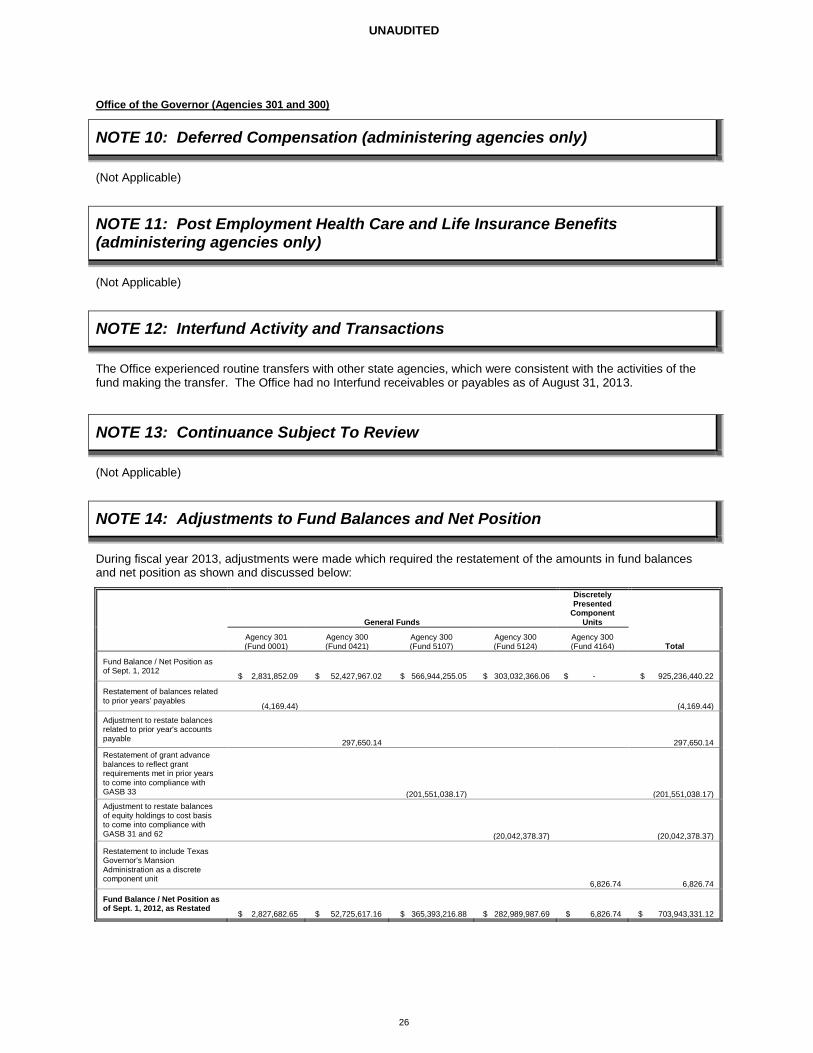
NOTE 14: Adjustments to Fund Balances and Net Position
During fiscal year 2013, adjustments were made which required the restatement of the amounts in fund balances and net position as shown and discussed below:
General Funds
Discretely Presented
Component Units
Agency 301 (Fund 0001)
Agency 300 (Fund 0421)
Agency 300 (Fund 5107)
Agency 300 (Fund 5124)
Agency 300 (Fund 4164) Total
Fund Balance / Net Position as of Sept. 1, 2012
$ 2,831,852.09 $ 52,427,967.02 $ 566,944,255.05 $ 303,032,366.06 $ - $ 925,236,440.22
Restatement of balances related to prior years' payables
(4,169.44) (4,169.44)
Adjustment to restate balances related to prior year's accounts payable
297,650.14 297,650.14
Restatement of grant advance balances to reflect grant requirements met in prior years to come into compliance with GASB 33
(201,551,038.17) (201,551,038.17)
Adjustment to restate balances of equity holdings to cost basis to come into compliance with GASB 31 and 62
(20,042,378.37) (20,042,378.37)
Restatement to include Texas Governor's Mansion Administration as a discrete component unit
6,826.74 6,826.74
Fund Balance / Net Position as of Sept. 1, 2012, as Restated
$ 2,827,682.65 $ 52,725,617.16 $ 365,393,216.88 $ 282,989,987.69 $ 6,826.74 $ 703,943,331.12
UNAUDITED
Office of the Governor (Agencies 301 and 300)
27
NOTE 15: Contingencies and Commitments
Federal Assistance
The Office has received several federal grants for specific purposes that are subject to review and audit by the grantor agencies. Such audits could lead to a request for reimbursements to the grantor agencies for expenditures disallowed under the terms of the grant. Based on prior experience, management believes such disallowances, if any, will be immaterial.
Unpaid Claims and Lawsuits
The Governor of the State of Texas is a defendant in pending litigations related to public information requests, State administration and policy disagreements. While plaintiffs seek attorney fees in many of these lawsuits, no liability is recorded because adverse rulings are not probable.
Contingent Revenue
The Office has acquired as a result of impairments of equity holdings from commercialization awards of the Texas Emerging Technology Fund (Fund 5124) certain royalties and intellectual property rights. Since the value of these royalties and intellectual property rights is undeterminable, these rights are not recorded as an asset. These royalties and intellectual property rights may result in revenue to the Texas Emerging Technology Fund in future years.
NOTE 16: Subsequent Events
On September 12, 2013 an escrow account was established to defease and discharge the Texas Military Value Revolving Loan Program General Obligation Bonds, Series 2007A-2. The defeased bonds will be redeemed on a redemption date of October 1, 2016, the earliest date on which these bonds can be called for optional redemption.
On October 18, 2013 the outstanding amount of commercial paper which is issued to finance the Texas Leverage Fund program’s lending activities was lowered from $25 million to $20 million.
On August 5, 2013 Texas Small Business Industrial Development Corporation, a component unit of the Office, notified bondholders of its intent to redeem on September 4, 2013 $800,000 principal amount of the total outstanding amount of $1,620,000 of its Floating Rate Demand Revenue Bonds.
NOTE 17: Risk Management
(Not Applicable)
(Not Applicable)
NOTE 19: The Financial Reporting Entity
As required by generally accepted accounting principles, the financial statements present the Office and its component units. The component units discussed in this note are included in the Office’s reporting entity because of the significance of their operational or financial relationships with the Office. These component units are legally separate from the State but have a relationship with the State such that exclusion would cause the financial statements to be misleading or incomplete.
NOTE 18: Management’s Discussion and Analysis (MD&A)
UNAUDITED
Office of the Governor (Agencies 301 and 300)
28
Financial Reporting Entity (continued)
Individual Component Unit Disclosures
Blended Component Units
Blended component units’ financial data are reported in a separate special revenue fund column (USAS GAAP fund 9999) of the governmental fund type as if these legally separate organizations were part of the government since its purpose is to provide a service to the government. A single blended component unit, the Texas Governor’s Mansion Restoration Fund, is included in these financial statements (USAS GAAP Fund 9999, U/F 7010).
The Texas Governor’s Mansion Restoration Fund (TGMRF) is a 501(c)(3) corporation established to help the Office raise awareness and provide financial assistance to the State for the restoration of the Texas Governor’s Mansion. The First Lady of Texas serves as a board member. While legally separate from the Office, TGMRF is closely related to and administered by the Office. The corporation’s financial statements, for its fiscal year ending August 31, 2013, are available from the Office’s Financial Services Division.
Discretely Presented Component Units
Discrete component units’ financial data are reported in separate columns in the combined financial statements to emphasize that they are legally separate from the Office.
The Texas Disaster Relief Fund (TDRF) is a 501(c)(3) corporation established to help the Office provide disaster relief. The services provided by TDRF assist the Office in responding to the needs of the citizens before, during, and after a disaster in Texas. While legally separate from the Office, TDRF is closely related to and is administered by the Office. The corporation’s financial statements, for its fiscal year ending August 31, 2013, are available from the Office’s Financial Services Division.
The Texas Health Services Authority (THSA) is a 501(c)(3) corporation and was created by House Bill 1066, 80
th Session to support improvement of the Texas health care system. Services provided by THSA are the
promotion and coordination of the electronic exchange of health information throughout the State to ensure that information is available to health care providers. The governor appoints the Board of THSA and may order the dissolution of the corporation at any time he declares that the purposes of the corporation have been fulfilled or that the corporation is inoperative or abandoned. The corporation’s financial statements, for its fiscal year ending September 30, 2012, are available from THSA, San Jacinto Building, 221 E. 9th, Suite 201, Austin, TX 78701. The Texas Small Business Industrial Development Corporation (TSBIDC) is a non-profit corporation. TSBIDC was chartered in 1983 under the Development Corporation Act of 1979 to promote economic development in Texas. The governor appoints the Board and may remove board members at will. The Articles of Incorporation and Bylaws of TSBIDC may be changed only with the approval of the Office. The executive director of the Office’s Division of Economic Development and Tourism and a Governor’s designee serve as non-voting, ex officio directors. The services provided by TSBIDC primarily benefit the Texas citizenry through supporting job creation and capital investment for businesses and communities in Texas. The corporation’s financial statements, for its fiscal year ending August 31, 2013, are available from the Office’s Financial Services Division. TSBDIC has issued self-supporting demand revenue bonds; information on these bonds and the pledged future revenue is disclosed in Schedules 2A, 2B, 2C, and 2D and Notes 5 and 6.
The Texas Economic Development Corporation (TEDC) is a 501(c)(3) corporation established by the legislature to benefit the Texas citizenry by carrying out some of the same public purposes as the Office’s Division of Economic Development and Tourism. The services provided by TEDC assist, promote, develop, and advance economic development in Texas. The governor appoints the Board and may remove board members at will. The board of TEDC and the executive director of the Office’s Division of Economic Development and Tourism determine when specific services will be addressed jointly by the office and TEDC. The corporation’s financial statements, for its fiscal year ending August 31, 2013, are available from TEDC, P.O. Box 684702, Austin, Texas 78768.
UNAUDITED
Office of the Governor (Agencies 301 and 300)
29
Financial Reporting Entity (continued)
The Beacon State Fund is a 501(c)(3) corporation which was created to support the goals of the Governor’s Commission on Women in promoting issues affecting the women of Texas. The corporation benefits the Texas citizenry by increasing public awareness of issues affecting the women of Texas through distributing information, holding media events, and supporting community outreach programs which are consistent with the goals of the Commission. The Office appoints the Board and provides reasonable use of its office facilities and personnel. The corporation’s financial statements for its fiscal year ending December 31, 2012, are available from the Governor’s Commission on Women.
The State Agency Council was also established to support the goals of the Governor’s Commission on Women. The Council is a 501(c)(3) corporation that assists the Commission in benefiting the Texas citizenry by honoring women who have made significant contributions to Texas through their work in state government, providing opportunities for professional development to its state agency representatives and supporting community outreach programs consistent with the goals of the Commission. The Director of the Governor’s Commission for Women appoints the Board and has significant operational influence on the activities of the corporation. The corporation’s financial statements, for its fiscal year ending August 31, 2013, are available from the Governor’s Commission on Women.
The Film Texas Fund is a 501(c)(6) corporation which was created to promote the development of the film, television, and multimedia industry in Texas in close cooperation with the Texas Film Commission. While legally separate from the Office, Film Texas Fund is closely related to and administered by the Office. The corporation’s financial statements, for its fiscal year ending December 31, 2012, are available from the Office’s Financial Services Division.
The Texas Governor’s Mansion Administration (TGMA) is a non-profit corporation which supports the financial administration of catering and facility expenses associated with use of the official residence of the Governor of the State of Texas for non-political events. While legally separate from the Office, TGMA is closely related to and administered by the Office. The corporation’s financial statements, for its fiscal year ending December 31, 2012, are available from the Office’s Financial Services Division.
NOTE 20: Stewardship, Compliance and Accountability
(Not Applicable)
NOTE 21: Not Applicable to the AFR
(Not Applicable)
NOTE 22: Donor-Restricted Endowments
(Not Applicable)
NOTE 23: Extraordinary Items and Special Items
(Not Applicable)
NOTE 24: Disaggregation of Receivable and Payable Balances
(Not Applicable)
UNAUDITED
Office of the Governor (Agencies 301 and 300)
30
NOTE 25: Termination Benefits
(Not Applicable)
NOTE 26: Segment Information
Segment disclosure is not required as the Discretely Presented Component Units and the Enterprise Fund financial statements are an integral part of this financial presentation.
NOTE 27: Service Concession Arrangements
(Not Applicable)
NOTE 28: Troubled Debt Restructuring
(Not Applicable)
NOTE 29: Deferred Outflows and Deferred Inflows of Resources
(Not Applicable)

This page intentionally left blank.
31

The Office of the Governor
Combining Statements -
Exhibits and Schedules
32
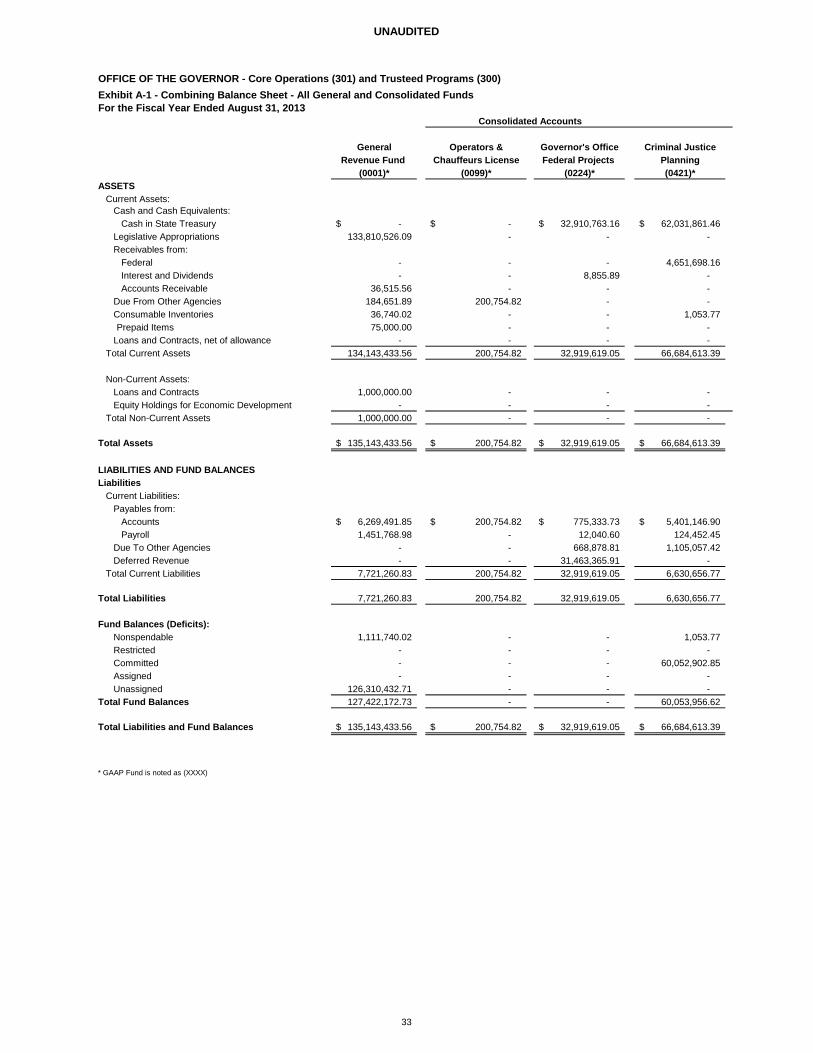
UNAUDITED
OFFICE OF THE GOVERNOR - Core Operations (301) and Trusteed Programs (300)Exhibit A-1 - Combining Balance Sheet - All General and Consolidated FundsFor the Fiscal Year Ended August 31, 2013
General Operators & Governor's Office Criminal JusticeRevenue Fund Chauffeurs License Federal Projects Planning
(0001)* (0099)* (0224)* (0421)*ASSETS
Current Assets:Cash and Cash Equivalents:
Cash in State Treasury -$ -$ 32,910,763.16$ 62,031,861.46$ Legislative Appropriations 133,810,526.09 - - - Receivables from:
Federal - - - 4,651,698.16 Interest and Dividends - - 8,855.89 - Accounts Receivable 36,515.56 - - -
Due From Other Agencies 184,651.89 200,754.82 - - Consumable Inventories 36,740.02 - - 1,053.77 Prepaid Items 75,000.00 - - -
Loans and Contracts, net of allowance - - - - Total Current Assets 134,143,433.56 200,754.82 32,919,619.05 66,684,613.39
Non-Current Assets:Loans and Contracts 1,000,000.00 - - - Equity Holdings for Economic Development - - - -
Total Non-Current Assets 1,000,000.00 - - -
Total Assets 135,143,433.56$ 200,754.82$ 32,919,619.05$ 66,684,613.39$
LIABILITIES AND FUND BALANCESLiabilities
Current Liabilities:Payables from:
Accounts 6,269,491.85$ 200,754.82$ 775,333.73$ 5,401,146.90$ Payroll 1,451,768.98 - 12,040.60 124,452.45
Due To Other Agencies - - 668,878.81 1,105,057.42 Deferred Revenue - - 31,463,365.91 -
Total Current Liabilities 7,721,260.83 200,754.82 32,919,619.05 6,630,656.77
Total Liabilities 7,721,260.83 200,754.82 32,919,619.05 6,630,656.77
Fund Balances (Deficits):Nonspendable 1,111,740.02 - - 1,053.77 Restricted - - - - Committed - - - 60,052,902.85 Assigned - - - - Unassigned 126,310,432.71 - - -
Total Fund Balances 127,422,172.73 - - 60,053,956.62
Total Liabilities and Fund Balances 135,143,433.56$ 200,754.82$ 32,919,619.05$ 66,684,613.39$
* GAAP Fund is noted as (XXXX)
Consolidated Accounts
33
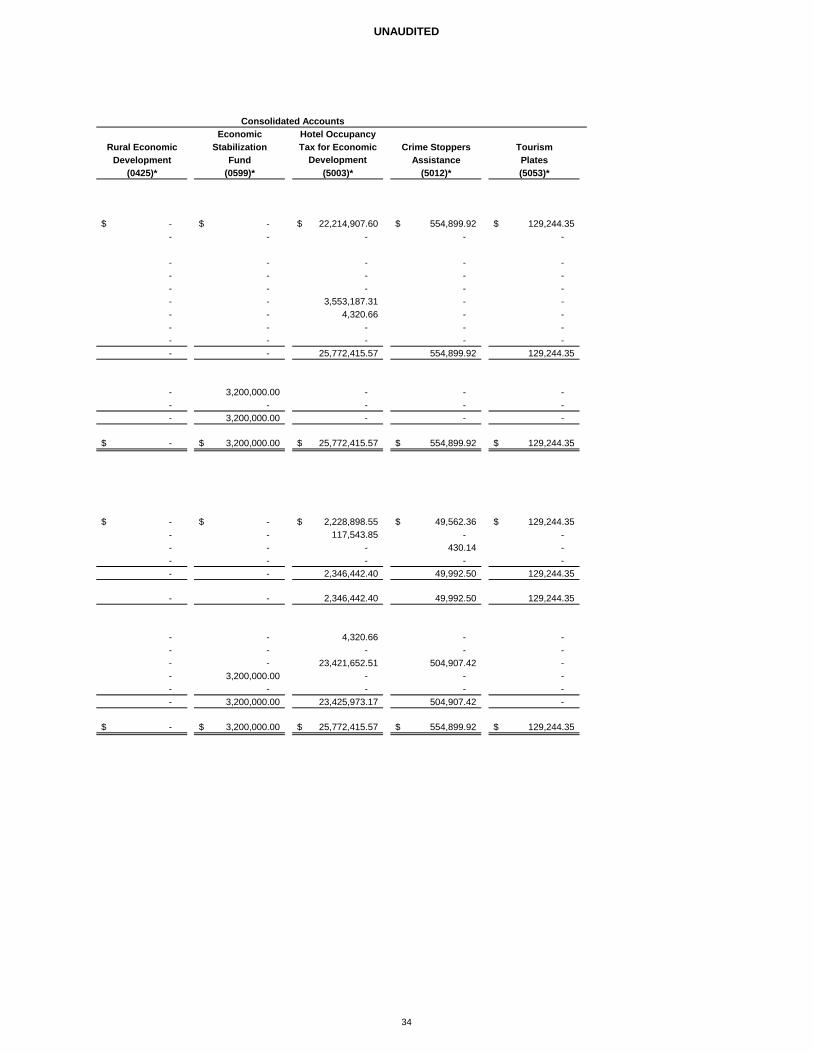
UNAUDITED
Economic Hotel OccupancyRural Economic Stabilization Tax for Economic Crime Stoppers Tourism
Development Fund Development Assistance Plates(0425)* (0599)* (5003)* (5012)* (5053)*
-$ -$ 22,214,907.60$ 554,899.92$ 129,244.35$ - - - - -
- - - - - - - - - - - - - - - - - 3,553,187.31 - - - - 4,320.66 - - - - - - - - - - - - - - 25,772,415.57 554,899.92 129,244.35
- 3,200,000.00 - - - - - - - - - 3,200,000.00 - - -
-$ 3,200,000.00$ 25,772,415.57$ 554,899.92$ 129,244.35$
-$ -$ 2,228,898.55$ 49,562.36$ 129,244.35$ - - 117,543.85 - - - - - 430.14 - - - - - - - - 2,346,442.40 49,992.50 129,244.35
- - 2,346,442.40 49,992.50 129,244.35
- - 4,320.66 - - - - - - - - - 23,421,652.51 504,907.42 - - 3,200,000.00 - - - - - - - - - 3,200,000.00 23,425,973.17 504,907.42 -
-$ 3,200,000.00$ 25,772,415.57$ 554,899.92$ 129,244.35$
Consolidated Accounts
34
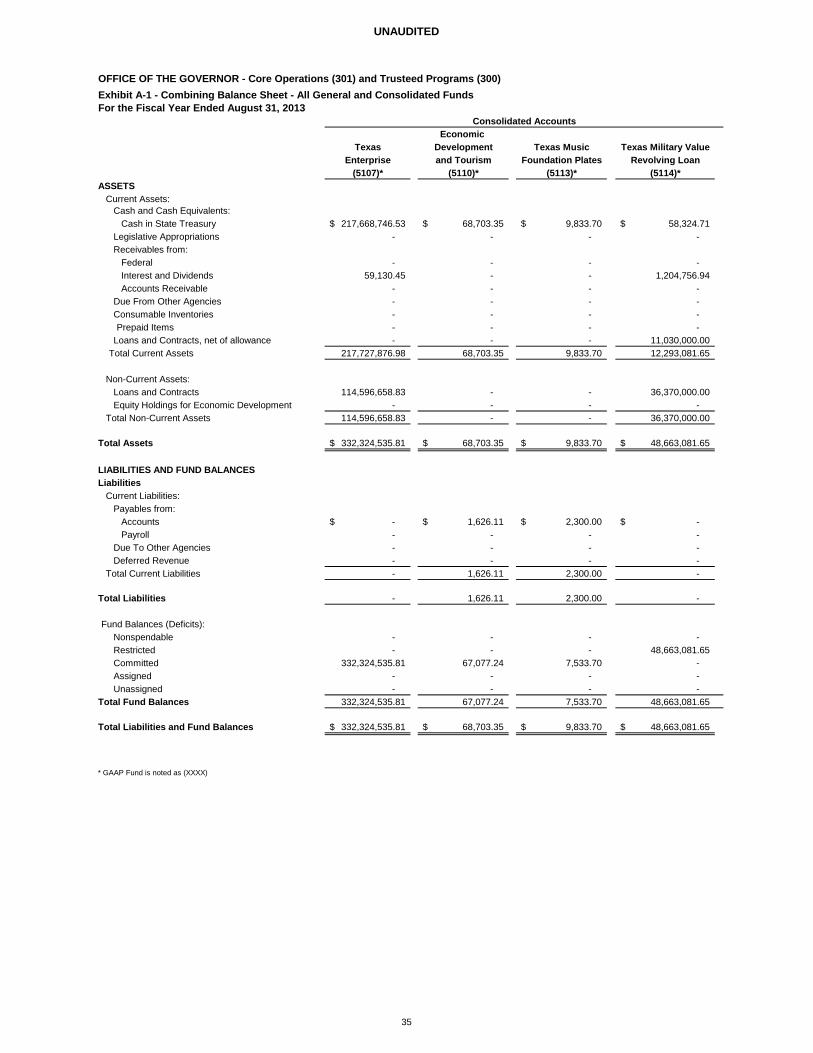
UNAUDITED
OFFICE OF THE GOVERNOR - Core Operations (301) and Trusteed Programs (300)Exhibit A-1 - Combining Balance Sheet - All General and Consolidated FundsFor the Fiscal Year Ended August 31, 2013
Economic Texas Development Texas Music Texas Military Value
Enterprise and Tourism Foundation Plates Revolving Loan(5107)* (5110)* (5113)* (5114)*
ASSETSCurrent Assets:
Cash and Cash Equivalents:Cash in State Treasury 217,668,746.53$ 68,703.35$ 9,833.70$ 58,324.71$
Legislative Appropriations - - - - Receivables from:
Federal - - - - Interest and Dividends 59,130.45 - - 1,204,756.94 Accounts Receivable - - - -
Due From Other Agencies - - - - Consumable Inventories - - - - Prepaid Items - - - -
Loans and Contracts, net of allowance - - - 11,030,000.00 Total Current Assets 217,727,876.98 68,703.35 9,833.70 12,293,081.65
Non-Current Assets:Loans and Contracts 114,596,658.83 - - 36,370,000.00 Equity Holdings for Economic Development - - - -
Total Non-Current Assets 114,596,658.83 - - 36,370,000.00
Total Assets 332,324,535.81$ 68,703.35$ 9,833.70$ 48,663,081.65$
LIABILITIES AND FUND BALANCESLiabilities
Current Liabilities:Payables from:
Accounts -$ 1,626.11$ 2,300.00$ -$ Payroll - - - -
Due To Other Agencies - - - - Deferred Revenue - - - -
Total Current Liabilities - 1,626.11 2,300.00 -
Total Liabilities - 1,626.11 2,300.00 -
Fund Balances (Deficits):Nonspendable - - - - Restricted - - - 48,663,081.65 Committed 332,324,535.81 67,077.24 7,533.70 - Assigned - - - - Unassigned - - - -
Total Fund Balances 332,324,535.81 67,077.24 7,533.70 48,663,081.65
Total Liabilities and Fund Balances 332,324,535.81$ 68,703.35$ 9,833.70$ 48,663,081.65$
* GAAP Fund is noted as (XXXX)
Consolidated Accounts
35
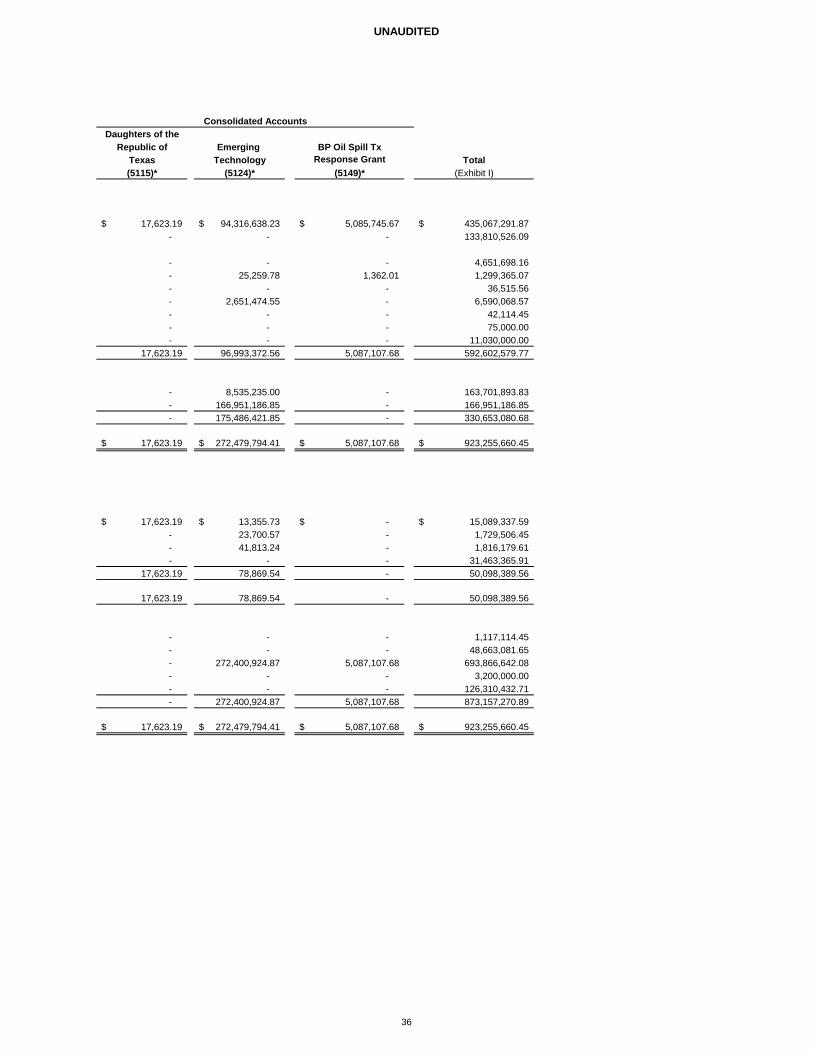
UNAUDITED
Daughters of theRepublic of Emerging BP Oil Spill Tx
Texas Technology Response Grant Total(5115)* (5124)* (5149)* (Exhibit I)
17,623.19$ 94,316,638.23$ 5,085,745.67$ 435,067,291.87$ - - - 133,810,526.09
- - - 4,651,698.16 - 25,259.78 1,362.01 1,299,365.07 - - - 36,515.56 - 2,651,474.55 - 6,590,068.57 - - - 42,114.45 - - - 75,000.00 - - - 11,030,000.00
17,623.19 96,993,372.56 5,087,107.68 592,602,579.77
- 8,535,235.00 - 163,701,893.83 - 166,951,186.85 - 166,951,186.85 - 175,486,421.85 - 330,653,080.68
17,623.19$ 272,479,794.41$ 5,087,107.68$ 923,255,660.45$
17,623.19$ 13,355.73$ -$ 15,089,337.59$ - 23,700.57 - 1,729,506.45 - 41,813.24 - 1,816,179.61 - - - 31,463,365.91
17,623.19 78,869.54 - 50,098,389.56
17,623.19 78,869.54 - 50,098,389.56
- - - 1,117,114.45 - - - 48,663,081.65 - 272,400,924.87 5,087,107.68 693,866,642.08 - - - 3,200,000.00 - - - 126,310,432.71 - 272,400,924.87 5,087,107.68 873,157,270.89
17,623.19$ 272,479,794.41$ 5,087,107.68$ 923,255,660.45$
Consolidated Accounts
36
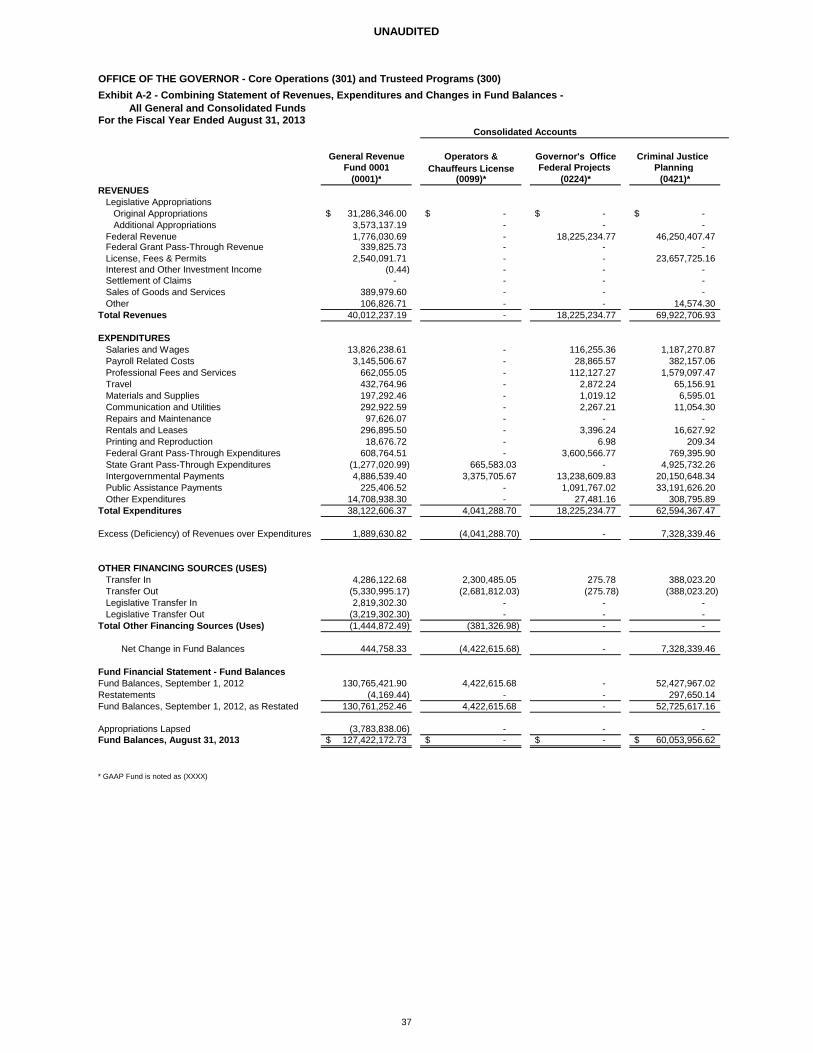
UNAUDITED
OFFICE OF THE GOVERNOR - Core Operations (301) and Trusteed Programs (300)Exhibit A-2 - Combining Statement of Revenues, Expenditures and Changes in Fund Balances -
All General and Consolidated FundsFor the Fiscal Year Ended August 31, 2013
General Revenue Operators & Governor's Office Criminal Justice Fund 0001 Chauffeurs License Federal Projects Planning
(0001)* (0099)* (0224)* (0421)*REVENUES
Legislative AppropriationsOriginal Appropriations 31,286,346.00$ -$ -$ -$ Additional Appropriations 3,573,137.19 - - -
Federal Revenue 1,776,030.69 - 18,225,234.77 46,250,407.47 Federal Grant Pass-Through Revenue 339,825.73 - - - License, Fees & Permits 2,540,091.71 - - 23,657,725.16 Interest and Other Investment Income (0.44) - - - Settlement of Claims - - - - Sales of Goods and Services 389,979.60 - - - Other 106,826.71 - - 14,574.30
Total Revenues 40,012,237.19 - 18,225,234.77 69,922,706.93
EXPENDITURESSalaries and Wages 13,826,238.61 - 116,255.36 1,187,270.87 Payroll Related Costs 3,145,506.67 - 28,865.57 382,157.06 Professional Fees and Services 662,055.05 - 112,127.27 1,579,097.47 Travel 432,764.96 - 2,872.24 65,156.91 Materials and Supplies 197,292.46 - 1,019.12 6,595.01 Communication and Utilities 292,922.59 - 2,267.21 11,054.30 Repairs and Maintenance 97,626.07 - - - Rentals and Leases 296,895.50 - 3,396.24 16,627.92 Printing and Reproduction 18,676.72 - 6.98 209.34 Federal Grant Pass-Through Expenditures 608,764.51 - 3,600,566.77 769,395.90 State Grant Pass-Through Expenditures (1,277,020.99) 665,583.03 - 4,925,732.26 Intergovernmental Payments 4,886,539.40 3,375,705.67 13,238,609.83 20,150,648.34 Public Assistance Payments 225,406.52 - 1,091,767.02 33,191,626.20 Other Expenditures 14,708,938.30 - 27,481.16 308,795.89
Total Expenditures 38,122,606.37 4,041,288.70 18,225,234.77 62,594,367.47
Excess (Deficiency) of Revenues over Expenditures 1,889,630.82 (4,041,288.70) - 7,328,339.46
OTHER FINANCING SOURCES (USES)Transfer In 4,286,122.68 2,300,485.05 275.78 388,023.20 Transfer Out (5,330,995.17) (2,681,812.03) (275.78) (388,023.20) Legislative Transfer In 2,819,302.30 - - - Legislative Transfer Out (3,219,302.30) - - -
Total Other Financing Sources (Uses) (1,444,872.49) (381,326.98) - -
Net Change in Fund Balances 444,758.33 (4,422,615.68) - 7,328,339.46
Fund Financial Statement - Fund BalancesFund Balances, September 1, 2012 130,765,421.90 4,422,615.68 - 52,427,967.02 Restatements (4,169.44) - - 297,650.14 Fund Balances, September 1, 2012, as Restated 130,761,252.46 4,422,615.68 - 52,725,617.16
Appropriations Lapsed (3,783,838.06) - - - Fund Balances, August 31, 2013 127,422,172.73$ -$ -$ 60,053,956.62$
* GAAP Fund is noted as (XXXX)
Consolidated Accounts
37
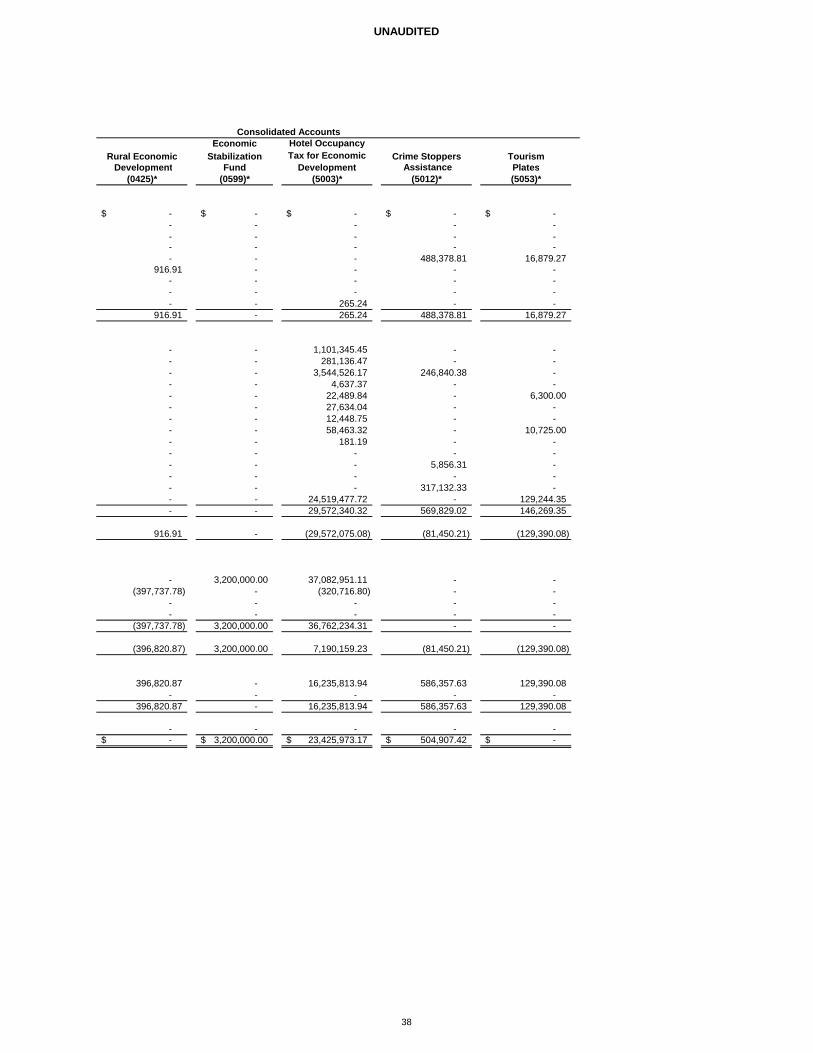
UNAUDITED
Economic Hotel OccupancyRural Economic Stabilization Crime Stoppers Tourism Development Fund Assistance Plates
(0425)* (0599)* (5003)* (5012)* (5053)*
-$ -$ -$ -$ -$ - - - - - - - - - - - - - - - - - - 488,378.81 16,879.27
916.91 - - - - - - - - - - - - - - - - 265.24 - -
916.91 - 265.24 488,378.81 16,879.27
- - 1,101,345.45 - - - - 281,136.47 - - - - 3,544,526.17 246,840.38 - - - 4,637.37 - - - - 22,489.84 - 6,300.00 - - 27,634.04 - - - - 12,448.75 - - - - 58,463.32 - 10,725.00 - - 181.19 - - - - - - - - - - 5,856.31 - - - - - - - - - 317,132.33 - - - 24,519,477.72 - 129,244.35 - - 29,572,340.32 569,829.02 146,269.35
916.91 - (29,572,075.08) (81,450.21) (129,390.08)
- 3,200,000.00 37,082,951.11 - - (397,737.78) - (320,716.80) - -
- - - - - - - - - -
(397,737.78) 3,200,000.00 36,762,234.31 - -
(396,820.87) 3,200,000.00 7,190,159.23 (81,450.21) (129,390.08)
396,820.87 - 16,235,813.94 586,357.63 129,390.08 - - - - -
396,820.87 - 16,235,813.94 586,357.63 129,390.08
- - - - - -$ 3,200,000.00$ 23,425,973.17$ 504,907.42$ -$
Tax for Economic Development
Consolidated Accounts
38
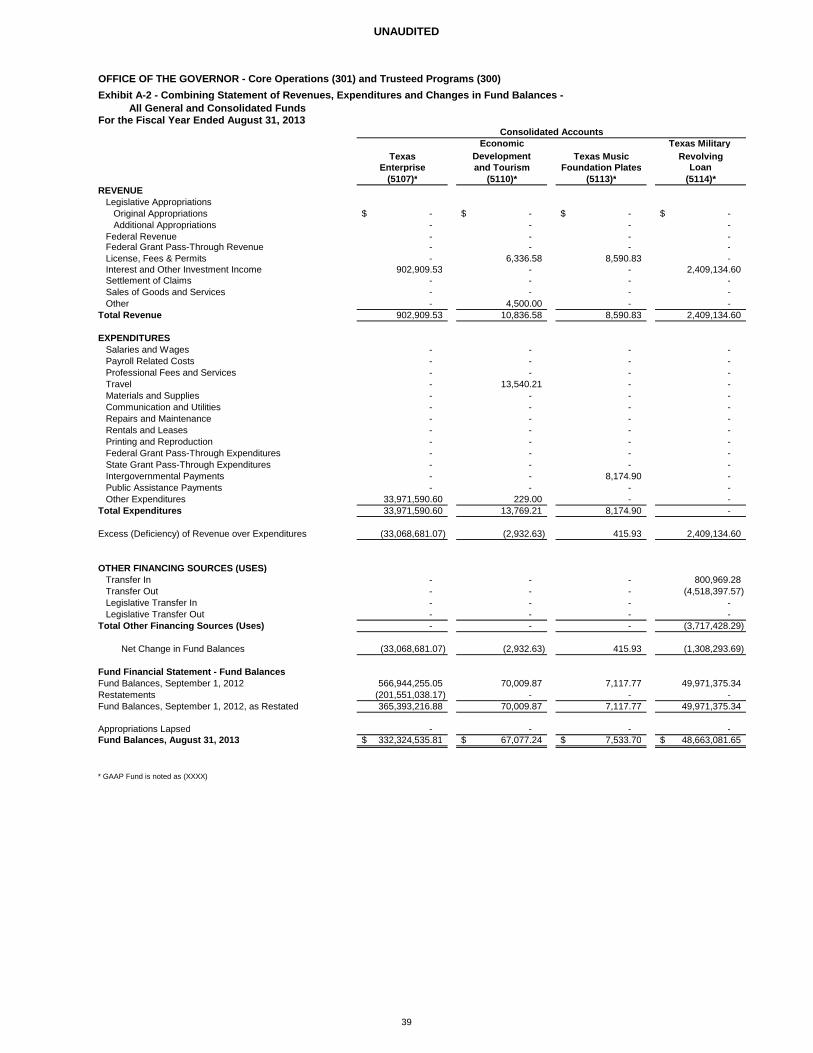
UNAUDITED
OFFICE OF THE GOVERNOR - Core Operations (301) and Trusteed Programs (300)
Exhibit A-2 - Combining Statement of Revenues, Expenditures and Changes in Fund Balances -All General and Consolidated Funds
For the Fiscal Year Ended August 31, 2013
Economic Texas Military Texas Development Texas Music Revolving
Enterprise and Tourism Foundation Plates Loan(5107)* (5110)* (5113)* (5114)*
REVENUE Legislative Appropriations
Original Appropriations -$ -$ -$ -$ Additional Appropriations - - - -
Federal Revenue - - - - Federal Grant Pass-Through Revenue - - - - License, Fees & Permits - 6,336.58 8,590.83 - Interest and Other Investment Income 902,909.53 - - 2,409,134.60 Settlement of Claims - - - - Sales of Goods and Services - - - - Other - 4,500.00 - -
Total Revenue 902,909.53 10,836.58 8,590.83 2,409,134.60
EXPENDITURES Salaries and Wages - - - - Payroll Related Costs - - - - Professional Fees and Services - - - - Travel - 13,540.21 - - Materials and Supplies - - - - Communication and Utilities - - - - Repairs and Maintenance - - - - Rentals and Leases - - - - Printing and Reproduction - - - - Federal Grant Pass-Through Expenditures - - - - State Grant Pass-Through Expenditures - - - - Intergovernmental Payments - - 8,174.90 - Public Assistance Payments - - - - Other Expenditures 33,971,590.60 229.00 - -
Total Expenditures 33,971,590.60 13,769.21 8,174.90 -
Excess (Deficiency) of Revenue over Expenditures (33,068,681.07) (2,932.63) 415.93 2,409,134.60
OTHER FINANCING SOURCES (USES) Transfer In - - - 800,969.28 Transfer Out - - - (4,518,397.57) Legislative Transfer In - - - - Legislative Transfer Out - - - -
Total Other Financing Sources (Uses) - - - (3,717,428.29)
Net Change in Fund Balances (33,068,681.07) (2,932.63) 415.93 (1,308,293.69)
Fund Financial Statement - Fund Balances Fund Balances, September 1, 2012 566,944,255.05 70,009.87 7,117.77 49,971,375.34 Restatements (201,551,038.17) - - - Fund Balances, September 1, 2012, as Restated 365,393,216.88 70,009.87 7,117.77 49,971,375.34 Appropriations Lapsed - - - - Fund Balances, August 31, 2013 332,324,535.81$ 67,077.24$ 7,533.70$ 48,663,081.65$
* GAAP Fund is noted as (XXXX)
Consolidated Accounts
39
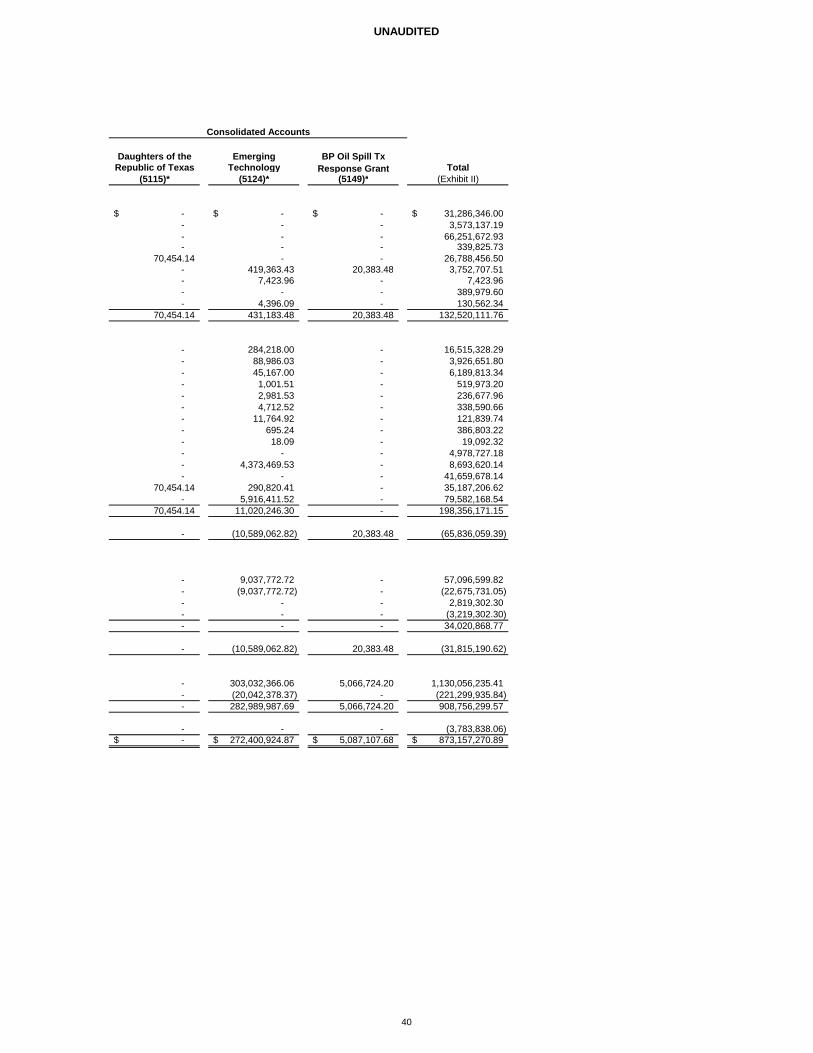
UNAUDITED
Daughters of the Emerging BP Oil Spill TxRepublic of Texas Technology Response Grant Total
(5115)* (5124)* (5149)* (Exhibit II)
-$ -$ -$ 31,286,346.00$ - - - 3,573,137.19 - - - 66,251,672.93 - - - 339,825.73
70,454.14 - - 26,788,456.50 - 419,363.43 20,383.48 3,752,707.51 - 7,423.96 - 7,423.96 - - - 389,979.60 - 4,396.09 - 130,562.34
70,454.14 431,183.48 20,383.48 132,520,111.76
- 284,218.00 - 16,515,328.29 - 88,986.03 - 3,926,651.80 - 45,167.00 - 6,189,813.34 - 1,001.51 - 519,973.20 - 2,981.53 - 236,677.96 - 4,712.52 - 338,590.66 - 11,764.92 - 121,839.74 - 695.24 - 386,803.22 - 18.09 - 19,092.32 - - - 4,978,727.18 - 4,373,469.53 - 8,693,620.14 - - - 41,659,678.14
70,454.14 290,820.41 - 35,187,206.62 - 5,916,411.52 - 79,582,168.54
70,454.14 11,020,246.30 - 198,356,171.15
- (10,589,062.82) 20,383.48 (65,836,059.39)
- 9,037,772.72 - 57,096,599.82 - (9,037,772.72) - (22,675,731.05) - - - 2,819,302.30 - - - (3,219,302.30) - - - 34,020,868.77
- (10,589,062.82) 20,383.48 (31,815,190.62)
- 303,032,366.06 5,066,724.20 1,130,056,235.41 - (20,042,378.37) - (221,299,935.84) - 282,989,987.69 5,066,724.20 908,756,299.57
- - - (3,783,838.06) -$ 272,400,924.87$ 5,087,107.68$ 873,157,270.89$
Consolidated Accounts
40
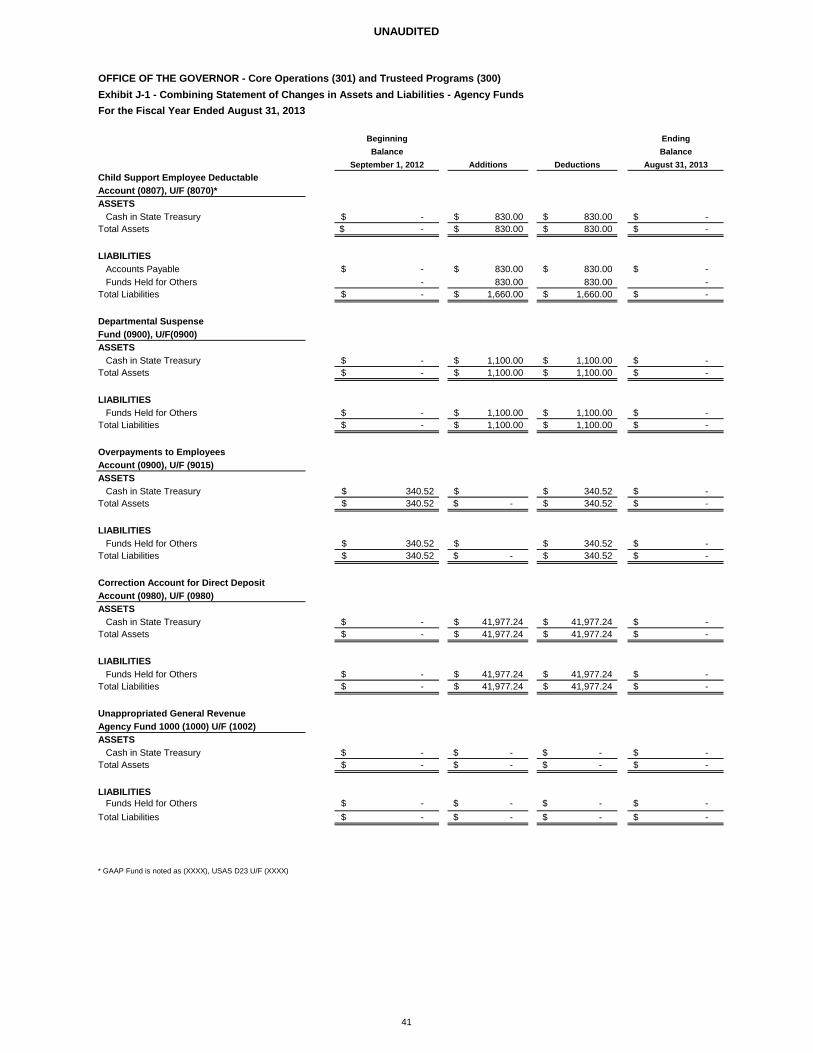
UNAUDITED
OFFICE OF THE GOVERNOR - Core Operations (301) and Trusteed Programs (300)Exhibit J-1 - Combining Statement of Changes in Assets and Liabilities - Agency FundsFor the Fiscal Year Ended August 31, 2013
Beginning EndingBalance Balance
September 1, 2012 Additions Deductions August 31, 2013Child Support Employee DeductableAccount (0807), U/F (8070)*ASSETS
Cash in State Treasury -$ 830.00$ 830.00$ -$ Total Assets -$ 830.00$ 830.00$ -$
LIABILITIESAccounts Payable -$ 830.00$ 830.00$ -$ Funds Held for Others - 830.00 830.00 -
Total Liabilities -$ 1,660.00$ 1,660.00$ -$
Departmental Suspense Fund (0900), U/F(0900)ASSETS
Cash in State Treasury -$ 1,100.00$ 1,100.00$ -$ Total Assets -$ 1,100.00$ 1,100.00$ -$
LIABILITIESFunds Held for Others -$ 1,100.00$ 1,100.00$ -$
Total Liabilities -$ 1,100.00$ 1,100.00$ -$
Overpayments to EmployeesAccount (0900), U/F (9015)ASSETS
Cash in State Treasury 340.52$ $ 340.52$ -$ Total Assets 340.52$ -$ 340.52$ -$
LIABILITIESFunds Held for Others 340.52$ $ 340.52$ -$
Total Liabilities 340.52$ -$ 340.52$ -$
Correction Account for Direct DepositAccount (0980), U/F (0980)ASSETS
Cash in State Treasury -$ 41,977.24$ 41,977.24$ -$ Total Assets -$ 41,977.24$ 41,977.24$ -$
LIABILITIES Funds Held for Others -$ 41,977.24$ 41,977.24$ -$
Total Liabilities -$ 41,977.24$ 41,977.24$ -$
Unappropriated General RevenueAgency Fund 1000 (1000) U/F (1002)ASSETS
Cash in State Treasury -$ -$ -$ -$ Total Assets -$ -$ -$ -$
LIABILITIESFunds Held for Others -$ -$ -$ -$
Total Liabilities -$ -$ -$ -$
* GAAP Fund is noted as (XXXX), USAS D23 U/F (XXXX)
41
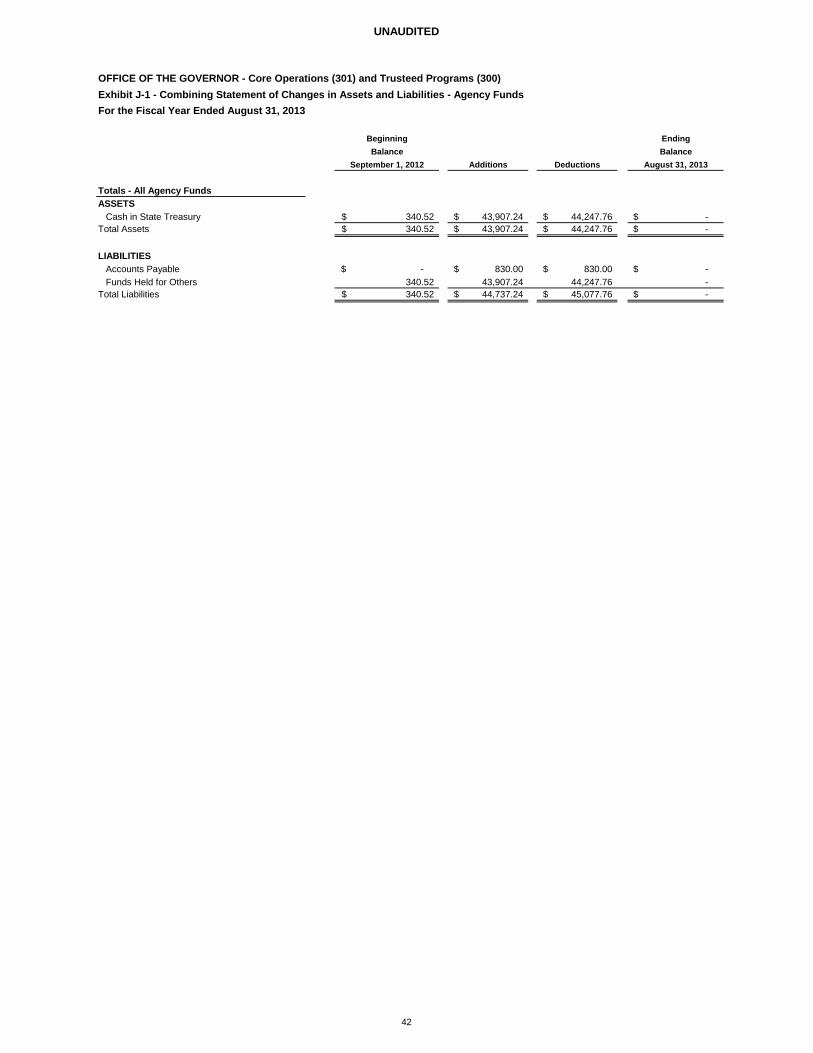
UNAUDITED
OFFICE OF THE GOVERNOR - Core Operations (301) and Trusteed Programs (300)Exhibit J-1 - Combining Statement of Changes in Assets and Liabilities - Agency FundsFor the Fiscal Year Ended August 31, 2013
Beginning EndingBalance Balance
September 1, 2012 Additions Deductions August 31, 2013
Totals - All Agency FundsASSETS
Cash in State Treasury 340.52$ 43,907.24$ 44,247.76$ -$ Total Assets 340.52$ 43,907.24$ 44,247.76$ -$
LIABILITIESAccounts Payable -$ 830.00$ 830.00$ -$ Funds Held for Others 340.52 43,907.24 44,247.76 -
Total Liabilities 340.52$ 44,737.24$ 45,077.76$ -$
42
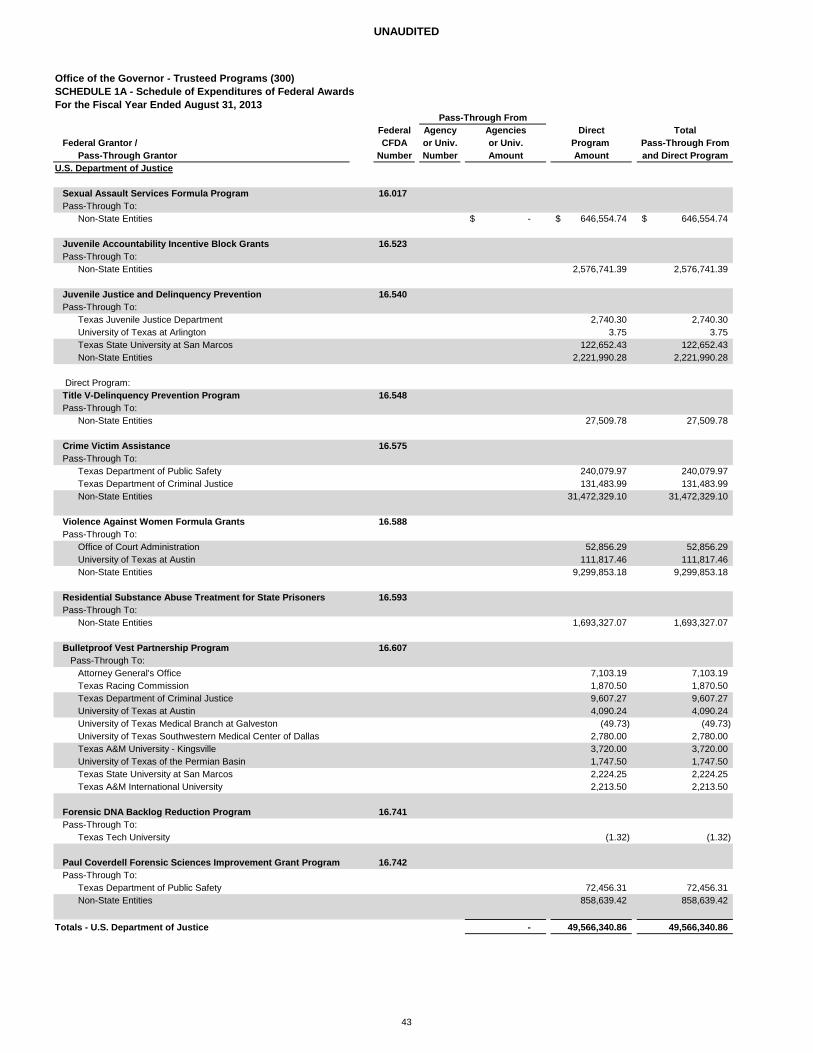
UNAUDITED
Office of the Governor - Trusteed Programs (300)SCHEDULE 1A - Schedule of Expenditures of Federal AwardsFor the Fiscal Year Ended August 31, 2013
Federal Agency Agencies Direct Total
Federal Grantor / CFDA or Univ. or Univ. Program Pass-Through FromPass-Through Grantor Number Number Amount Amount and Direct Program
U.S. Department of Justice
Sexual Assault Services Formula Program 16.017Pass-Through To:
Non-State Entities -$ 646,554.74$ 646,554.74$
Juvenile Accountability Incentive Block Grants 16.523Pass-Through To:
Non-State Entities 2,576,741.39 2,576,741.39
Juvenile Justice and Delinquency Prevention 16.540 Pass-Through To:
Texas Juvenile Justice Department 2,740.30 2,740.30 University of Texas at Arlington 3.75 3.75 Texas State University at San Marcos 122,652.43 122,652.43 Non-State Entities 2,221,990.28 2,221,990.28
Direct Program: Title V-Delinquency Prevention Program 16.548Pass-Through To:
Non-State Entities 27,509.78 27,509.78
Crime Victim Assistance 16.575 Pass-Through To:
Texas Department of Public Safety 240,079.97 240,079.97 Texas Department of Criminal Justice 131,483.99 131,483.99 Non-State Entities 31,472,329.10 31,472,329.10
Violence Against Women Formula Grants 16.588 Pass-Through To:
Office of Court Administration 52,856.29 52,856.29 University of Texas at Austin 111,817.46 111,817.46 Non-State Entities 9,299,853.18 9,299,853.18
Residential Substance Abuse Treatment for State Prisoners 16.593Pass-Through To:
Non-State Entities 1,693,327.07 1,693,327.07
Bulletproof Vest Partnership Program 16.607Pass-Through To:
Attorney General's Office 7,103.19 7,103.19 Texas Racing Commission 1,870.50 1,870.50 Texas Department of Criminal Justice 9,607.27 9,607.27 University of Texas at Austin 4,090.24 4,090.24 University of Texas Medical Branch at Galveston (49.73) (49.73) University of Texas Southwestern Medical Center of Dallas 2,780.00 2,780.00 Texas A&M University - Kingsville 3,720.00 3,720.00 University of Texas of the Permian Basin 1,747.50 1,747.50 Texas State University at San Marcos 2,224.25 2,224.25 Texas A&M International University 2,213.50 2,213.50
Forensic DNA Backlog Reduction Program 16.741Pass-Through To:
Texas Tech University (1.32) (1.32)
Paul Coverdell Forensic Sciences Improvement Grant Program 16.742 Pass-Through To:
Texas Department of Public Safety 72,456.31 72,456.31 Non-State Entities 858,639.42 858,639.42
Totals - U.S. Department of Justice - 49,566,340.86 49,566,340.86
Pass-Through From
43
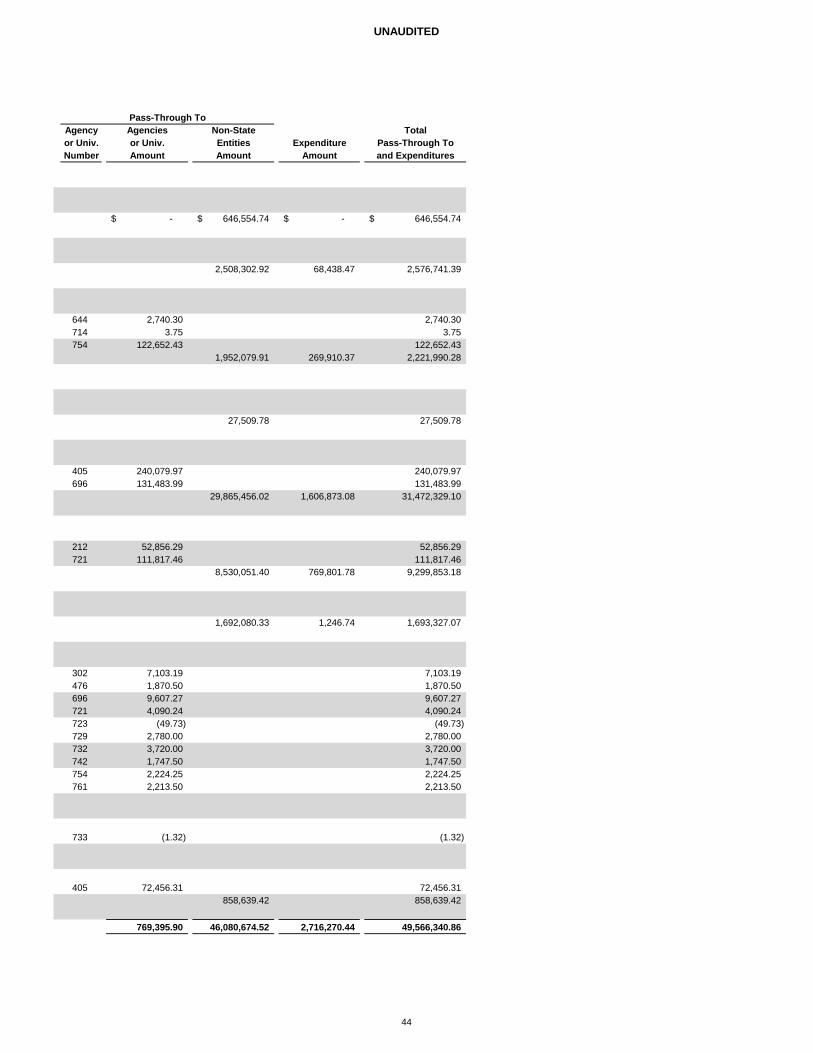
UNAUDITED
Agency Agencies Non-State Totalor Univ. or Univ. Entities Expenditure Pass-Through ToNumber Amount Amount Amount and Expenditures
-$ 646,554.74$ -$ 646,554.74$
2,508,302.92 68,438.47 2,576,741.39
644 2,740.30 2,740.30 714 3.75 3.75 754 122,652.43 122,652.43
1,952,079.91 269,910.37 2,221,990.28
27,509.78 27,509.78
405 240,079.97 240,079.97 696 131,483.99 131,483.99
29,865,456.02 1,606,873.08 31,472,329.10
212 52,856.29 52,856.29 721 111,817.46 111,817.46
8,530,051.40 769,801.78 9,299,853.18
1,692,080.33 1,246.74 1,693,327.07
302 7,103.19 7,103.19 476 1,870.50 1,870.50 696 9,607.27 9,607.27 721 4,090.24 4,090.24 723 (49.73) (49.73) 729 2,780.00 2,780.00 732 3,720.00 3,720.00 742 1,747.50 1,747.50 754 2,224.25 2,224.25 761 2,213.50 2,213.50
733 (1.32) (1.32)
405 72,456.31 72,456.31 858,639.42 858,639.42
769,395.90 46,080,674.52 2,716,270.44 49,566,340.86
Pass-Through To
44
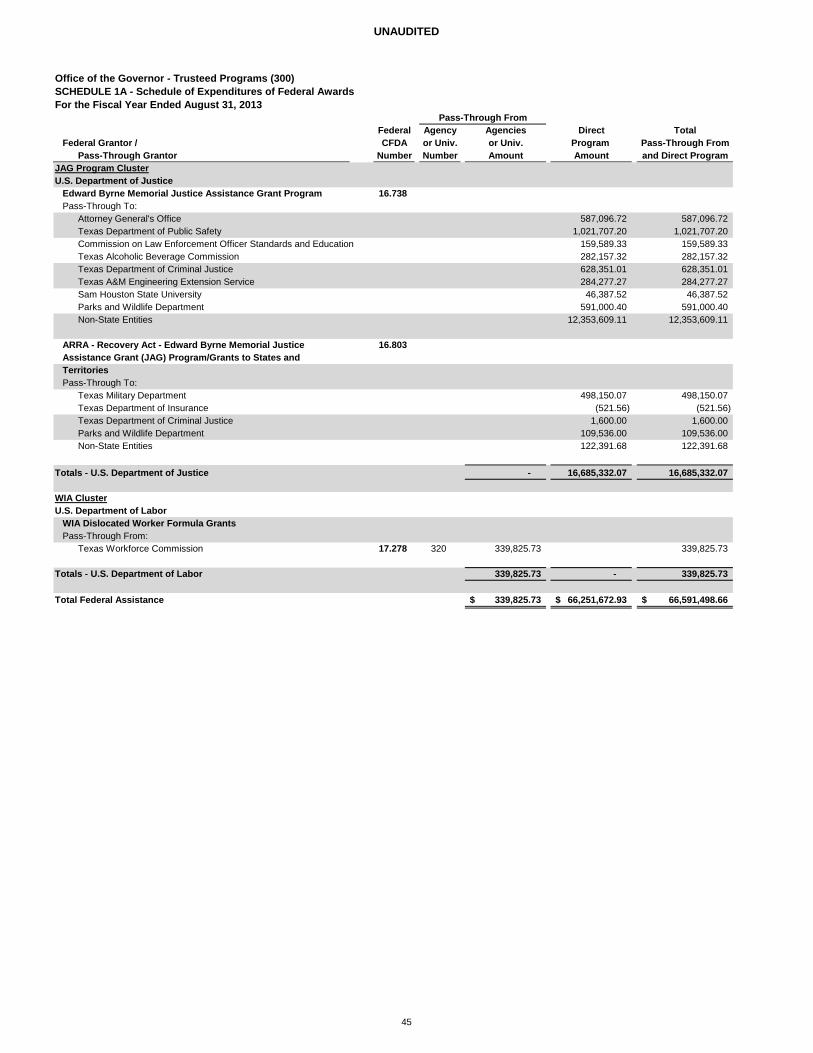
UNAUDITED
Office of the Governor - Trusteed Programs (300)SCHEDULE 1A - Schedule of Expenditures of Federal AwardsFor the Fiscal Year Ended August 31, 2013
Federal Agency Agencies Direct Total
Federal Grantor / CFDA or Univ. or Univ. Program Pass-Through FromPass-Through Grantor Number Number Amount Amount and Direct Program
Pass-Through From
JAG Program ClusterU.S. Department of Justice
Edward Byrne Memorial Justice Assistance Grant Program 16.738Pass-Through To:
Attorney General's Office 587,096.72 587,096.72 Texas Department of Public Safety 1,021,707.20 1,021,707.20 Commission on Law Enforcement Officer Standards and Education 159,589.33 159,589.33 Texas Alcoholic Beverage Commission 282,157.32 282,157.32 Texas Department of Criminal Justice 628,351.01 628,351.01 Texas A&M Engineering Extension Service 284,277.27 284,277.27 Sam Houston State University 46,387.52 46,387.52 Parks and Wildlife Department 591,000.40 591,000.40 Non-State Entities 12,353,609.11 12,353,609.11
ARRA - Recovery Act - Edward Byrne Memorial Justice 16.803Assistance Grant (JAG) Program/Grants to States andTerritoriesPass-Through To:
Texas Military Department 498,150.07 498,150.07 Texas Department of Insurance (521.56) (521.56) Texas Department of Criminal Justice 1,600.00 1,600.00 Parks and Wildlife Department 109,536.00 109,536.00 Non-State Entities 122,391.68 122,391.68
Totals - U.S. Department of Justice - 16,685,332.07 16,685,332.07
WIA ClusterU.S. Department of Labor
WIA Dislocated Worker Formula GrantsPass-Through From:
Texas Workforce Commission 17.278 320 339,825.73 339,825.73
Totals - U.S. Department of Labor 339,825.73 - 339,825.73
Total Federal Assistance 339,825.73$ 66,251,672.93$ 66,591,498.66$
45
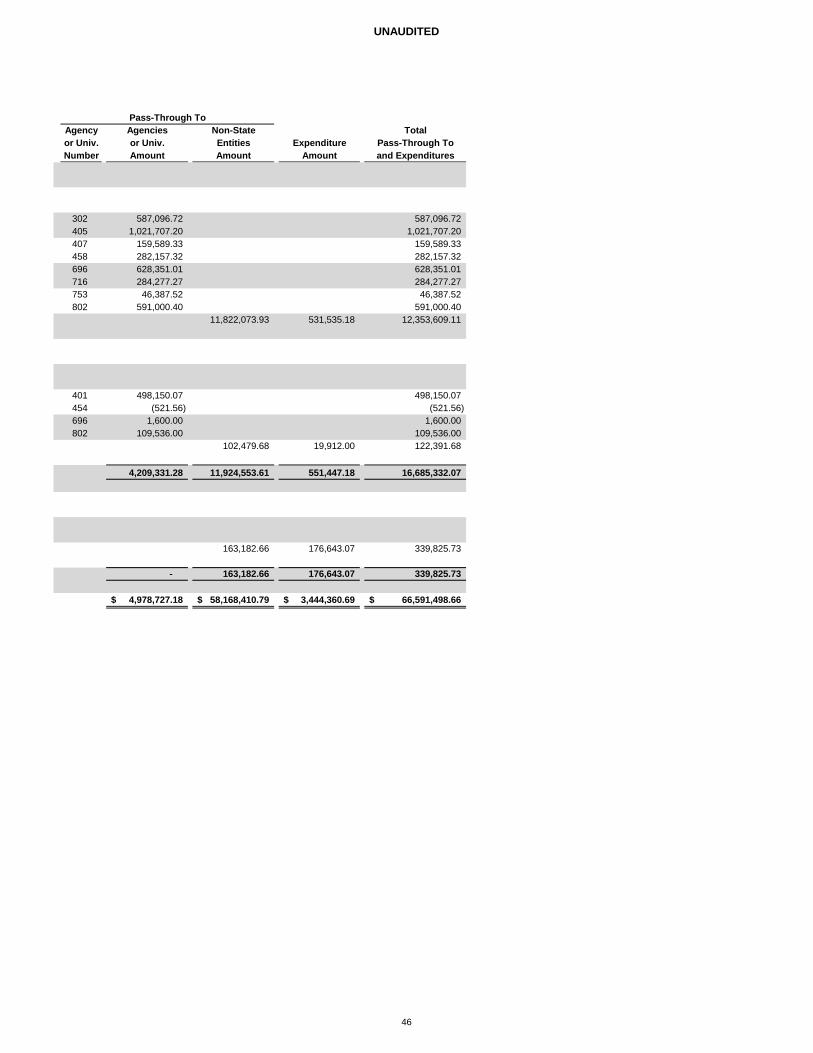
UNAUDITED
Agency Agencies Non-State Totalor Univ. or Univ. Entities Expenditure Pass-Through ToNumber Amount Amount Amount and Expenditures
Pass-Through To
302 587,096.72 587,096.72 405 1,021,707.20 1,021,707.20 407 159,589.33 159,589.33 458 282,157.32 282,157.32 696 628,351.01 628,351.01 716 284,277.27 284,277.27 753 46,387.52 46,387.52 802 591,000.40 591,000.40
11,822,073.93 531,535.18 12,353,609.11
401 498,150.07 498,150.07 454 (521.56) (521.56) 696 1,600.00 1,600.00 802 109,536.00 109,536.00
102,479.68 19,912.00 122,391.68
4,209,331.28 11,924,553.61 551,447.18 16,685,332.07
163,182.66 176,643.07 339,825.73
- 163,182.66 176,643.07 339,825.73
4,978,727.18$ 58,168,410.79$ 3,444,360.69$ 66,591,498.66$
46
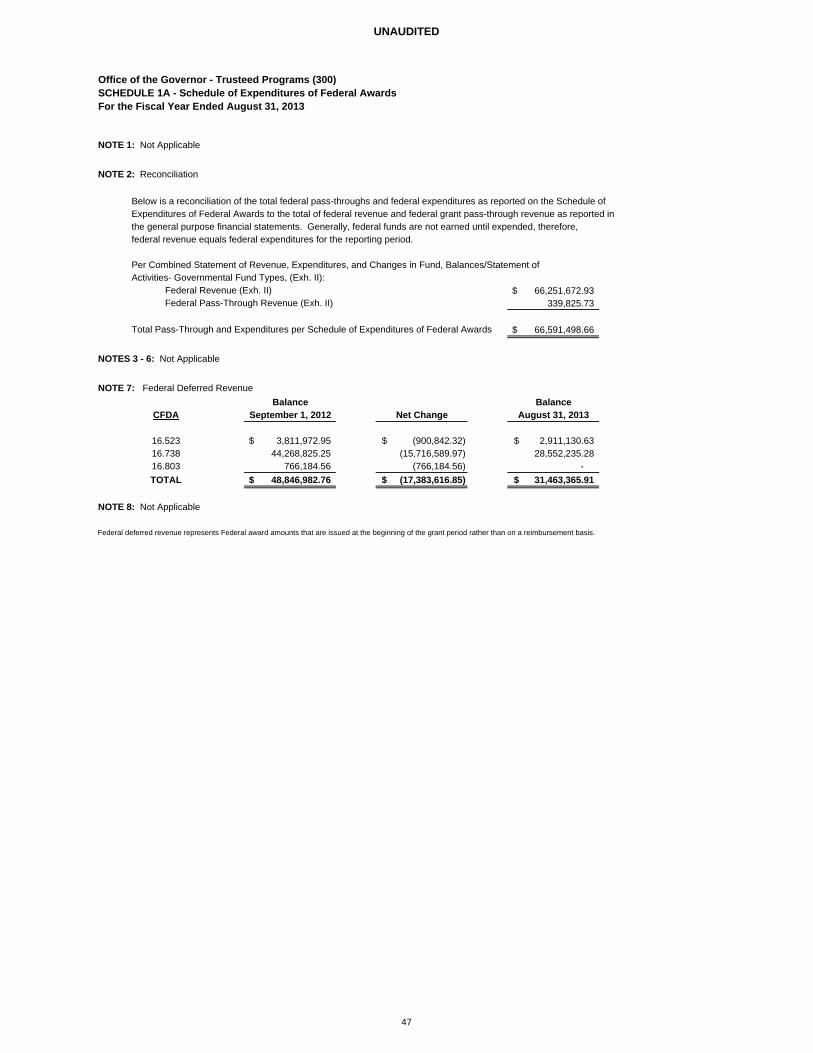
UNAUDITED
Office of the Governor - Trusteed Programs (300)SCHEDULE 1A - Schedule of Expenditures of Federal AwardsFor the Fiscal Year Ended August 31, 2013
NOTE 1: Not Applicable
NOTE 2: Reconciliation
Below is a reconciliation of the total federal pass-throughs and federal expenditures as reported on the Schedule of Expenditures of Federal Awards to the total of federal revenue and federal grant pass-through revenue as reported inthe general purpose financial statements. Generally, federal funds are not earned until expended, therefore, federal revenue equals federal expenditures for the reporting period.
Per Combined Statement of Revenue, Expenditures, and Changes in Fund, Balances/Statement of Activities- Governmental Fund Types, (Exh. II):
Federal Revenue (Exh. II) 66,251,672.93$ Federal Pass-Through Revenue (Exh. II) 339,825.73
Total Pass-Through and Expenditures per Schedule of Expenditures of Federal Awards 66,591,498.66$
NOTES 3 - 6: Not Applicable
NOTE 7: Federal Deferred RevenueBalance Balance
CFDA September 1, 2012 Net Change August 31, 2013
16.523 3,811,972.95$ (900,842.32)$ 2,911,130.63$ 16.738 44,268,825.25 (15,716,589.97) 28,552,235.2816.803 766,184.56 (766,184.56) - TOTAL 48,846,982.76$ (17,383,616.85)$ 31,463,365.91$
NOTE 8: Not Applicable
Federal deferred revenue represents Federal award amounts that are issued at the beginning of the grant period rather than on a reimbursement basis.
47
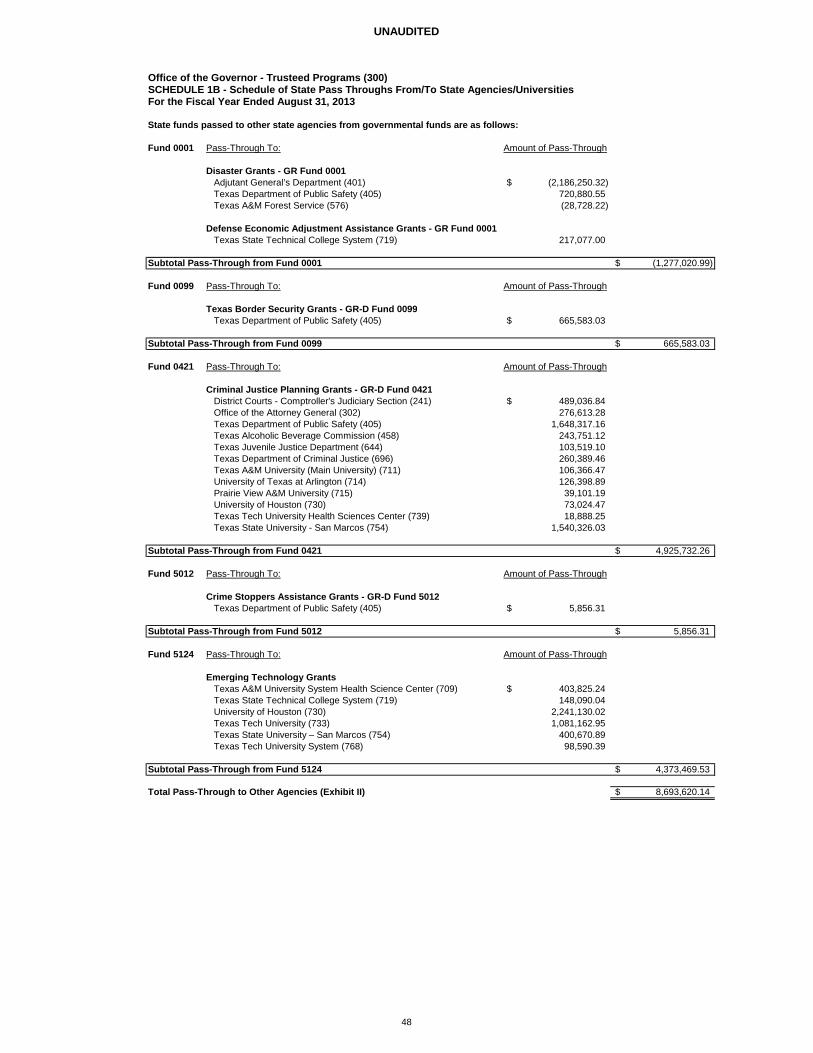
UNAUDITED
Office of the Governor - Trusteed Programs (300)SCHEDULE 1B - Schedule of State Pass Throughs From/To State Agencies/UniversitiesFor the Fiscal Year Ended August 31, 2013
State funds passed to other state agencies from governmental funds are as follows:
Fund 0001 Pass-Through To: Amount of Pass-Through
Disaster Grants - GR Fund 0001Adjutant General’s Department (401) (2,186,250.32)$ Texas Department of Public Safety (405) 720,880.55Texas A&M Forest Service (576) (28,728.22)
Defense Economic Adjustment Assistance Grants - GR Fund 0001Texas State Technical College System (719) 217,077.00
Subtotal Pass-Through from Fund 0001 (1,277,020.99)$
Fund 0099 Pass-Through To: Amount of Pass-Through
Texas Border Security Grants - GR-D Fund 0099Texas Department of Public Safety (405) 665,583.03$
Subtotal Pass-Through from Fund 0099 665,583.03$
Fund 0421 Pass-Through To: Amount of Pass-Through
Criminal Justice Planning Grants - GR-D Fund 0421District Courts - Comptroller's Judiciary Section (241) 489,036.84$ Office of the Attorney General (302) 276,613.28 Texas Department of Public Safety (405) 1,648,317.16Texas Alcoholic Beverage Commission (458) 243,751.12Texas Juvenile Justice Department (644) 103,519.10Texas Department of Criminal Justice (696) 260,389.46 Texas A&M University (Main University) (711) 106,366.47University of Texas at Arlington (714) 126,398.89Prairie View A&M University (715) 39,101.19 University of Houston (730) 73,024.47 Texas Tech University Health Sciences Center (739) 18,888.25Texas State University - San Marcos (754) 1,540,326.03
Subtotal Pass-Through from Fund 0421 4,925,732.26$
Fund 5012 Pass-Through To: Amount of Pass-Through
Crime Stoppers Assistance Grants - GR-D Fund 5012Texas Department of Public Safety (405) 5,856.31$
Subtotal Pass-Through from Fund 5012 5,856.31$
Fund 5124 Pass-Through To: Amount of Pass-Through
Emerging Technology GrantsTexas A&M University System Health Science Center (709) 403,825.24$ Texas State Technical College System (719) 148,090.04 University of Houston (730) 2,241,130.02 Texas Tech University (733) 1,081,162.95 Texas State University – San Marcos (754) 400,670.89 Texas Tech University System (768) 98,590.39
Subtotal Pass-Through from Fund 5124 4,373,469.53$
Total Pass-Through to Other Agencies (Exhibit II) 8,693,620.14$
48
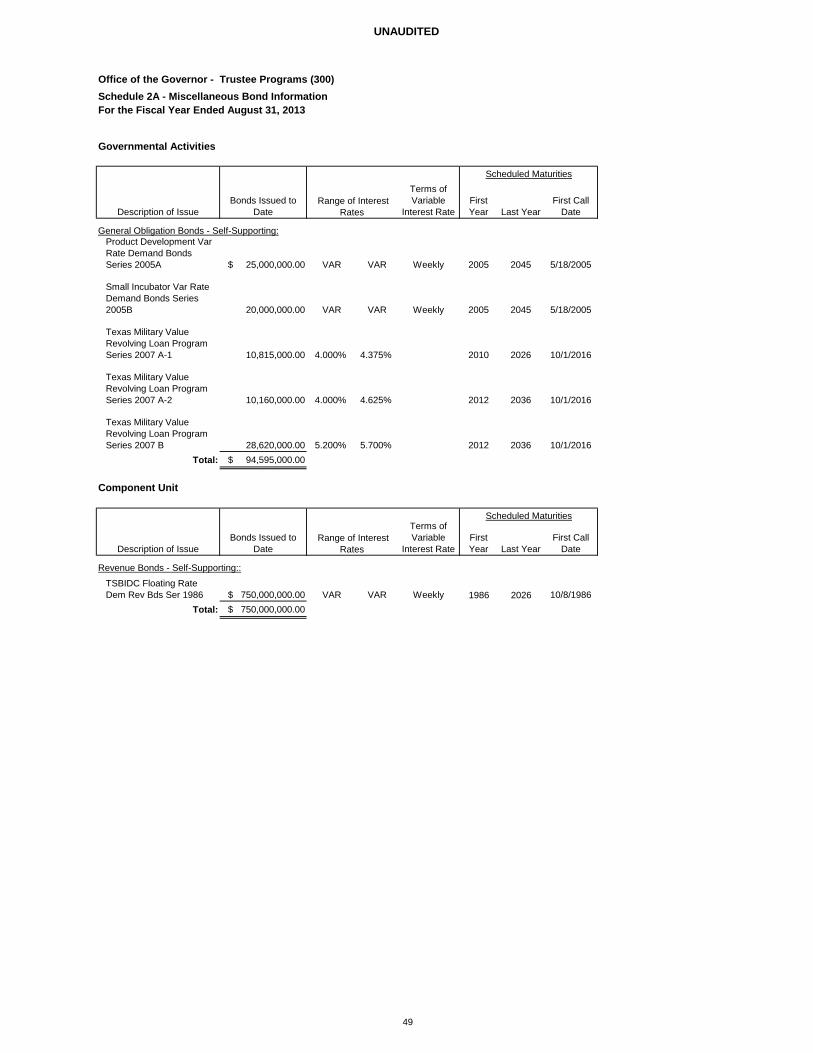
UNAUDITED
Office of the Governor - Trustee Programs (300)Schedule 2A - Miscellaneous Bond InformationFor the Fiscal Year Ended August 31, 2013
Description of IssueBonds Issued to
Date
Terms of Variable
Interest RateFirst Year Last Year
First Call Date
General Obligation Bonds - Self-Supporting: Product Development Var Rate Demand Bonds Series 2005A $ 25,000,000.00 VAR VAR Weekly 2005 2045 5/18/2005
Small Incubator Var Rate Demand Bonds Series 2005B 20,000,000.00 VAR VAR Weekly 2005 2045 5/18/2005
Texas Military Value Revolving Loan Program Series 2007 A-1 10,815,000.00 4.000% 4.375% 2010 2026 10/1/2016
Texas Military Value Revolving Loan Program Series 2007 A-2 10,160,000.00 4.000% 4.625% 2012 2036 10/1/2016
Texas Military Value Revolving Loan Program Series 2007 B 28,620,000.00 5.200% 5.700% 2012 2036 10/1/2016
Total: $ 94,595,000.00
Description of IssueBonds Issued to
Date
Terms of Variable
Interest RateFirst Year Last Year
First Call Date
Revenue Bonds - Self-Supporting::
TSBIDC Floating Rate Dem Rev Bds Ser 1986 $ 750,000,000.00 VAR VAR Weekly 1986 2026 10/8/1986
Total: $ 750,000,000.00
Scheduled Maturities
Range of Interest Rates
Governmental Activities
Scheduled Maturities
Component Unit
Range of Interest Rates
49
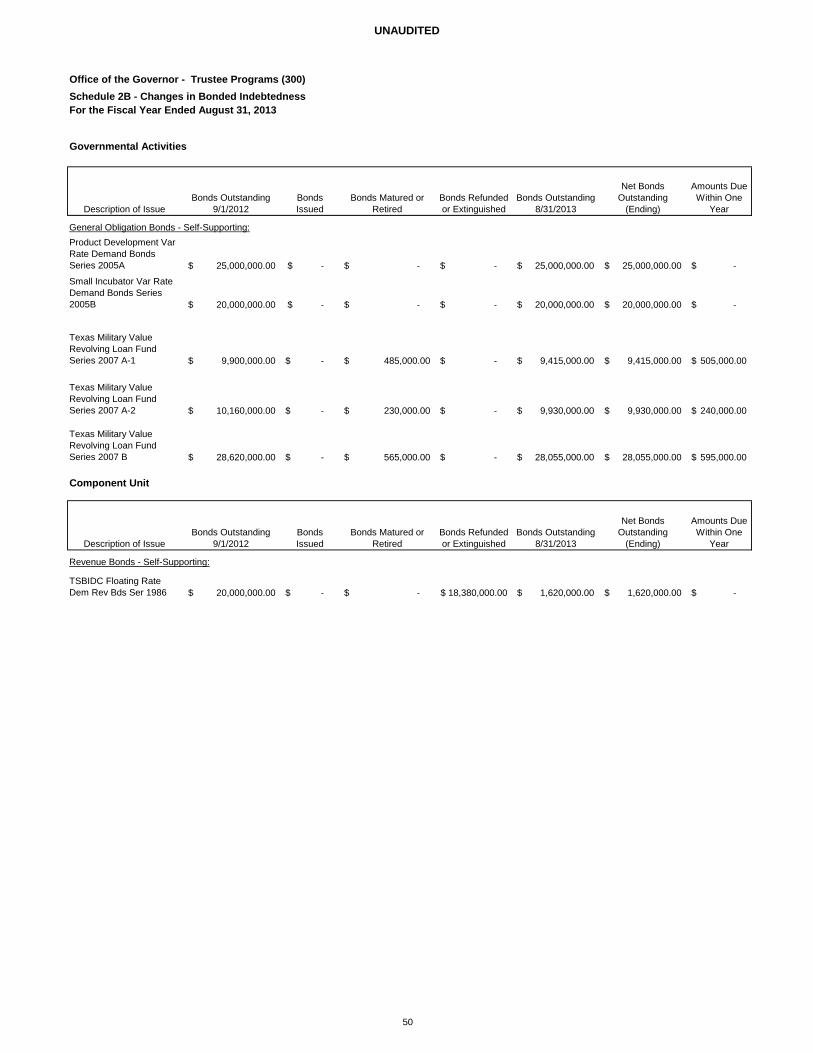
UNAUDITED
Office of the Governor - Trustee Programs (300)Schedule 2B - Changes in Bonded IndebtednessFor the Fiscal Year Ended August 31, 2013
Description of IssueBonds Outstanding
9/1/2012Bonds Issued
Bonds Matured or Retired
Bonds Refunded or Extinguished
Bonds Outstanding 8/31/2013
Net Bonds Outstanding
(Ending)
Amounts Due Within One
Year
General Obligation Bonds - Self-Supporting:Product Development Var Rate Demand Bonds Series 2005A 25,000,000.00$ -$ -$ -$ 25,000,000.00$ 25,000,000.00$ -$
Small Incubator Var Rate Demand Bonds Series 2005B 20,000,000.00$ -$ -$ -$ 20,000,000.00$ 20,000,000.00$ -$
Texas Military Value Revolving Loan Fund Series 2007 A-1 9,900,000.00$ -$ 485,000.00$ -$ 9,415,000.00$ 9,415,000.00$ 505,000.00$
Texas Military Value Revolving Loan Fund Series 2007 A-2 10,160,000.00$ -$ 230,000.00$ -$ 9,930,000.00$ 9,930,000.00$ 240,000.00$
Texas Military Value Revolving Loan Fund Series 2007 B 28,620,000.00$ -$ 565,000.00$ -$ 28,055,000.00$ 28,055,000.00$ 595,000.00$
Description of IssueBonds Outstanding
9/1/2012Bonds Issued
Bonds Matured or Retired
Bonds Refunded or Extinguished
Bonds Outstanding 8/31/2013
Net Bonds Outstanding
(Ending)
Amounts Due Within One
Year
Revenue Bonds - Self-Supporting:
TSBIDC Floating Rate Dem Rev Bds Ser 1986 20,000,000.00$ -$ -$ 18,380,000.00$ 1,620,000.00$ 1,620,000.00$ -$
Governmental Activities
Component Unit
50
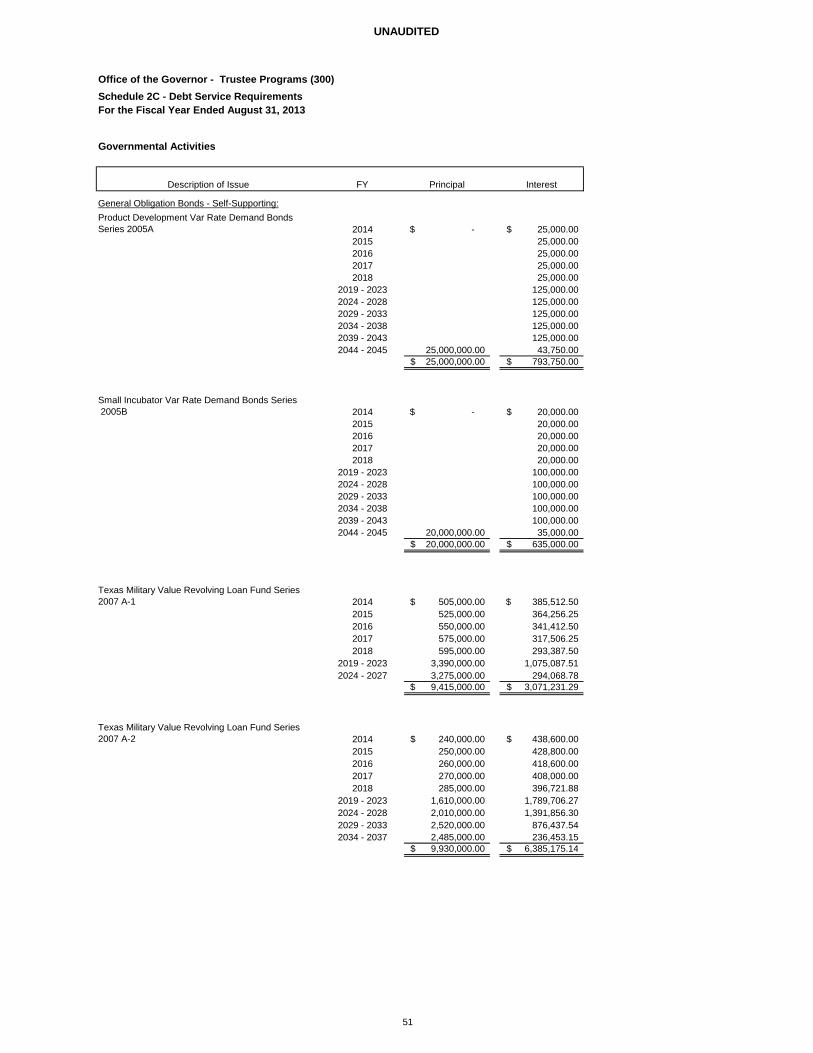
UNAUDITED
Office of the Governor - Trustee Programs (300)Schedule 2C - Debt Service RequirementsFor the Fiscal Year Ended August 31, 2013
Description of Issue FY Principal Interest
General Obligation Bonds - Self-Supporting:Product Development Var Rate Demand Bonds Series 2005A 2014 -$ 25,000.00$
2015 25,000.00 2016 25,000.00 2017 25,000.00 2018 25,000.00
2019 - 2023 125,000.00 2024 - 2028 125,000.00 2029 - 2033 125,000.00 2034 - 2038 125,000.00 2039 - 2043 125,000.00 2044 - 2045 25,000,000.00 43,750.00
25,000,000.00$ 793,750.00$
Small Incubator Var Rate Demand Bonds Series 2005B 2014 -$ 20,000.00$
2015 20,000.00 2016 20,000.00 2017 20,000.00 2018 20,000.00
2019 - 2023 100,000.00 2024 - 2028 100,000.00 2029 - 2033 100,000.00 2034 - 2038 100,000.00 2039 - 2043 100,000.00 2044 - 2045 20,000,000.00 35,000.00
20,000,000.00$ 635,000.00$
Texas Military Value Revolving Loan Fund Series 2007 A-1 2014 505,000.00$ 385,512.50$
2015 525,000.00 364,256.25 2016 550,000.00 341,412.50 2017 575,000.00 317,506.25 2018 595,000.00 293,387.50
2019 - 2023 3,390,000.00 1,075,087.51 2024 - 2027 3,275,000.00 294,068.78
9,415,000.00$ 3,071,231.29$
Texas Military Value Revolving Loan Fund Series 2007 A-2 2014 240,000.00$ 438,600.00$
2015 250,000.00 428,800.00 2016 260,000.00 418,600.00 2017 270,000.00 408,000.00 2018 285,000.00 396,721.88
2019 - 2023 1,610,000.00 1,789,706.27 2024 - 2028 2,010,000.00 1,391,856.30 2029 - 2033 2,520,000.00 876,437.54 2034 - 2037 2,485,000.00 236,453.15
9,930,000.00$ 6,385,175.14$
Governmental Activities
51
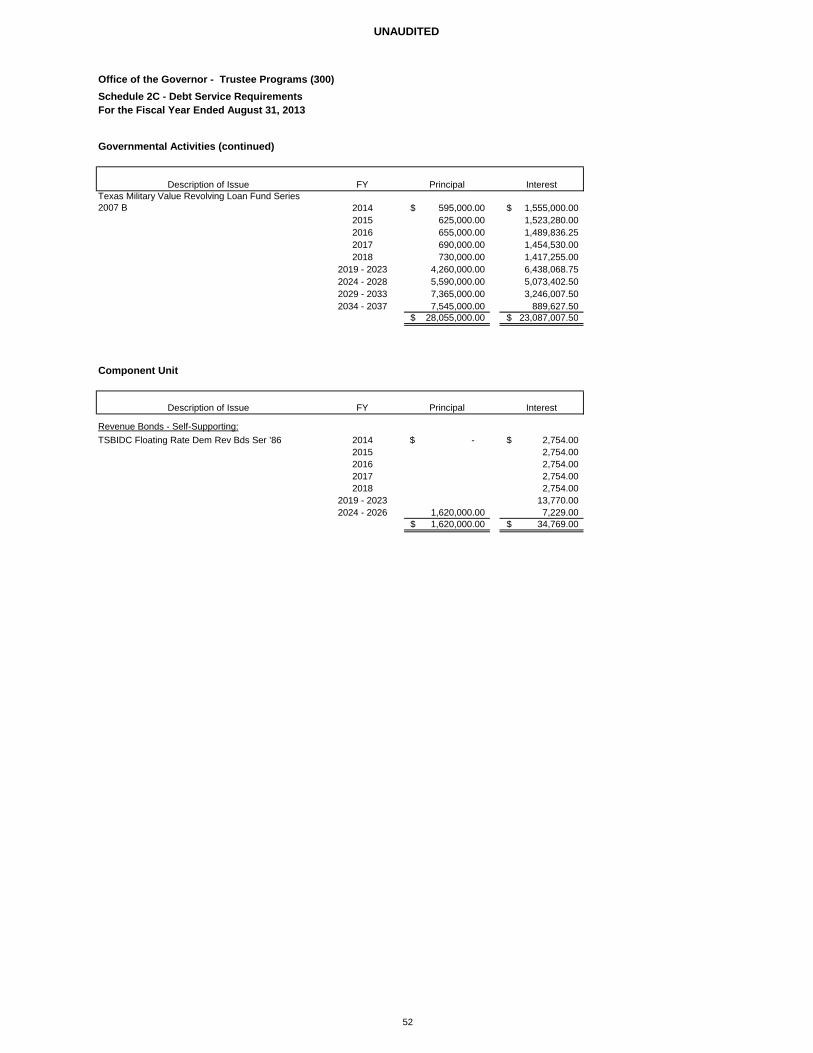
UNAUDITED
Office of the Governor - Trustee Programs (300)Schedule 2C - Debt Service RequirementsFor the Fiscal Year Ended August 31, 2013
Description of Issue FY Principal InterestTexas Military Value Revolving Loan Fund Series 2007 B 2014 595,000.00$ 1,555,000.00$
2015 625,000.00 1,523,280.00 2016 655,000.00 1,489,836.25 2017 690,000.00 1,454,530.00 2018 730,000.00 1,417,255.00
2019 - 2023 4,260,000.00 6,438,068.75 2024 - 2028 5,590,000.00 5,073,402.502029 - 2033 7,365,000.00 3,246,007.50 2034 - 2037 7,545,000.00 889,627.50
28,055,000.00$ 23,087,007.50$
Description of Issue FY Principal Interest
Revenue Bonds - Self-Supporting:TSBIDC Floating Rate Dem Rev Bds Ser ’86 2014 -$ 2,754.00$
2015 2,754.00 2016 2,754.00 2017 2,754.00 2018 2,754.00
2019 - 2023 13,770.00 2024 - 2026 1,620,000.00 7,229.00
1,620,000.00$ 34,769.00$
Component Unit
Governmental Activities (continued)
52
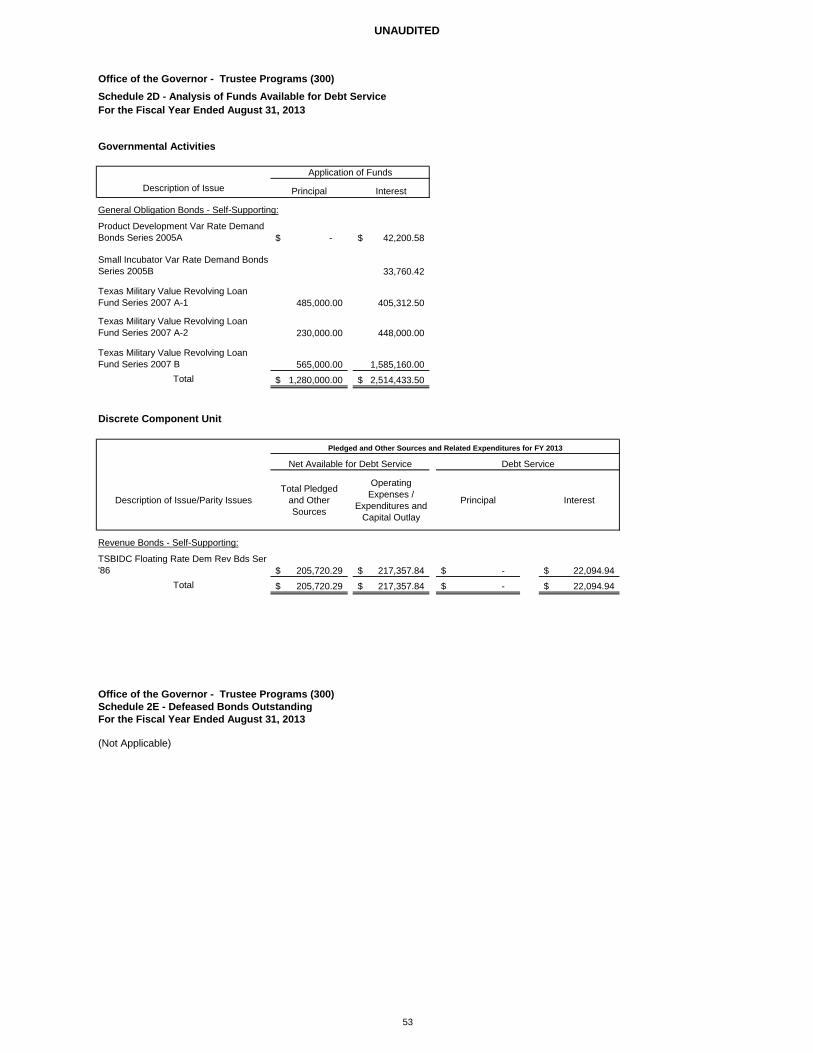
UNAUDITED
Office of the Governor - Trustee Programs (300)Schedule 2D - Analysis of Funds Available for Debt Service For the Fiscal Year Ended August 31, 2013
Description of Issue Principal Interest
General Obligation Bonds - Self-Supporting:
Product Development Var Rate Demand Bonds Series 2005A -$ 42,200.58$
Small Incubator Var Rate Demand Bonds Series 2005B 33,760.42
Texas Military Value Revolving Loan Fund Series 2007 A-1 485,000.00 405,312.50
Texas Military Value Revolving Loan Fund Series 2007 A-2 230,000.00 448,000.00
Texas Military Value Revolving Loan Fund Series 2007 B 565,000.00 1,585,160.00
Total 1,280,000.00$ 2,514,433.50$
Description of Issue/Parity IssuesTotal Pledged
and Other Sources
Operating Expenses /
Expenditures and Capital Outlay
Principal Interest
Revenue Bonds - Self-Supporting:
TSBIDC Floating Rate Dem Rev Bds Ser '86 205,720.29$ 217,357.84$ -$ 22,094.94$
Total 205,720.29$ 217,357.84$ -$ 22,094.94$
Office of the Governor - Trustee Programs (300)Schedule 2E - Defeased Bonds OutstandingFor the Fiscal Year Ended August 31, 2013
(Not Applicable)
Application of Funds
Governmental Activities
Discrete Component Unit
Net Available for Debt Service Debt Service
Pledged and Other Sources and Related Expenditures for FY 2013
53
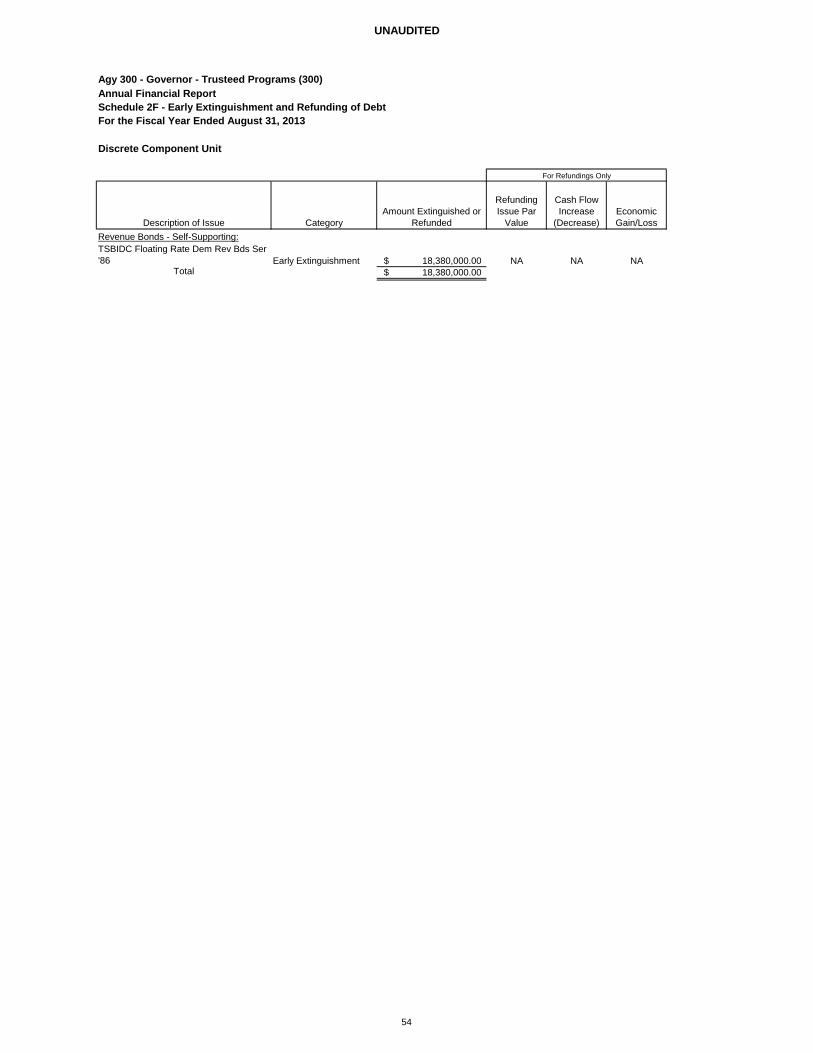
UNAUDITED
Agy 300 - Governor - Trusteed Programs (300)Annual Financial ReportSchedule 2F - Early Extinguishment and Refunding of DebtFor the Fiscal Year Ended August 31, 2013
Description of Issue CategoryAmount Extinguished or
Refunded
Refunding Issue Par
Value
Cash Flow Increase
(Decrease)Economic Gain/Loss
Revenue Bonds - Self-Supporting:TSBIDC Floating Rate Dem Rev Bds Ser '86 Early Extinguishment 18,380,000.00$ NA NA NA
Total 18,380,000.00$
For Refundings Only
Discrete Component Unit
54

This page intentionally left blank.
55

The Office of the Governor
Core OperationsAgency 301
Financial Statements
56

This page intentionally left blank.
57
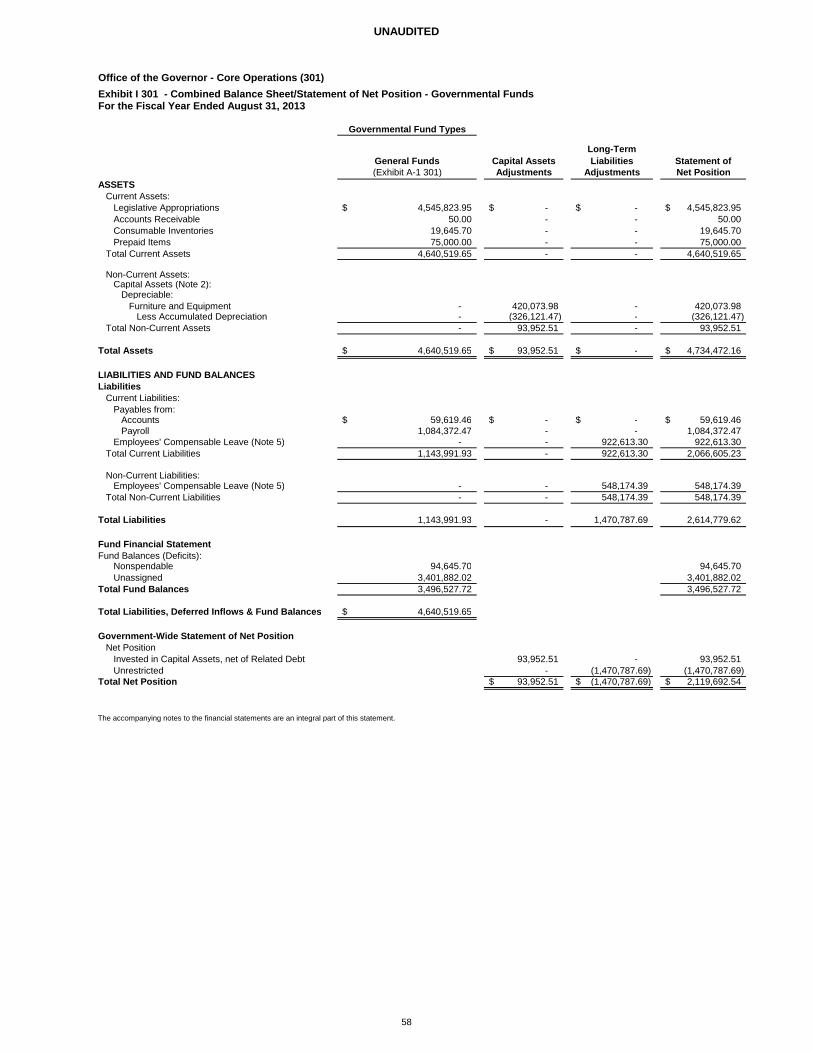
UNAUDITED
Office of the Governor - Core Operations (301)Exhibit I 301 - Combined Balance Sheet/Statement of Net Position - Governmental FundsFor the Fiscal Year Ended August 31, 2013
Governmental Fund Types
General Funds Capital AssetsLong-Term Liabilities Statement of
(Exhibit A-1 301) Adjustments Adjustments Net PositionASSETS
Current Assets:Legislative Appropriations 4,545,823.95$ -$ -$ 4,545,823.95$ Accounts Receivable 50.00 - - 50.00 Consumable Inventories 19,645.70 - - 19,645.70 Prepaid Items 75,000.00 - - 75,000.00
Total Current Assets 4,640,519.65 - - 4,640,519.65
Non-Current Assets:Capital Assets (Note 2):
Depreciable: Furniture and Equipment - 420,073.98 - 420,073.98
Less Accumulated Depreciation - (326,121.47) - (326,121.47) Total Non-Current Assets - 93,952.51 - 93,952.51
Total Assets 4,640,519.65$ 93,952.51$ -$ 4,734,472.16$
LIABILITIES AND FUND BALANCESLiabilities
Current Liabilities:Payables from:
Accounts 59,619.46$ -$ -$ 59,619.46$ Payroll 1,084,372.47 - - 1,084,372.47
Employees' Compensable Leave (Note 5) - - 922,613.30 922,613.30 Total Current Liabilities 1,143,991.93 - 922,613.30 2,066,605.23
Non-Current Liabilities:Employees' Compensable Leave (Note 5) - - 548,174.39 548,174.39
Total Non-Current Liabilities - - 548,174.39 548,174.39
Total Liabilities 1,143,991.93 - 1,470,787.69 2,614,779.62
Fund Financial StatementFund Balances (Deficits):
Nonspendable 94,645.70 94,645.70 Unassigned 3,401,882.02 3,401,882.02
Total Fund Balances 3,496,527.72 3,496,527.72
Total Liabilities, Deferred Inflows & Fund Balances 4,640,519.65$
Government-Wide Statement of Net PositionNet Position
Invested in Capital Assets, net of Related Debt 93,952.51 - 93,952.51 Unrestricted - (1,470,787.69) (1,470,787.69)
Total Net Position 93,952.51$ (1,470,787.69)$ 2,119,692.54$
The accompanying notes to the financial statements are an integral part of this statement.
58
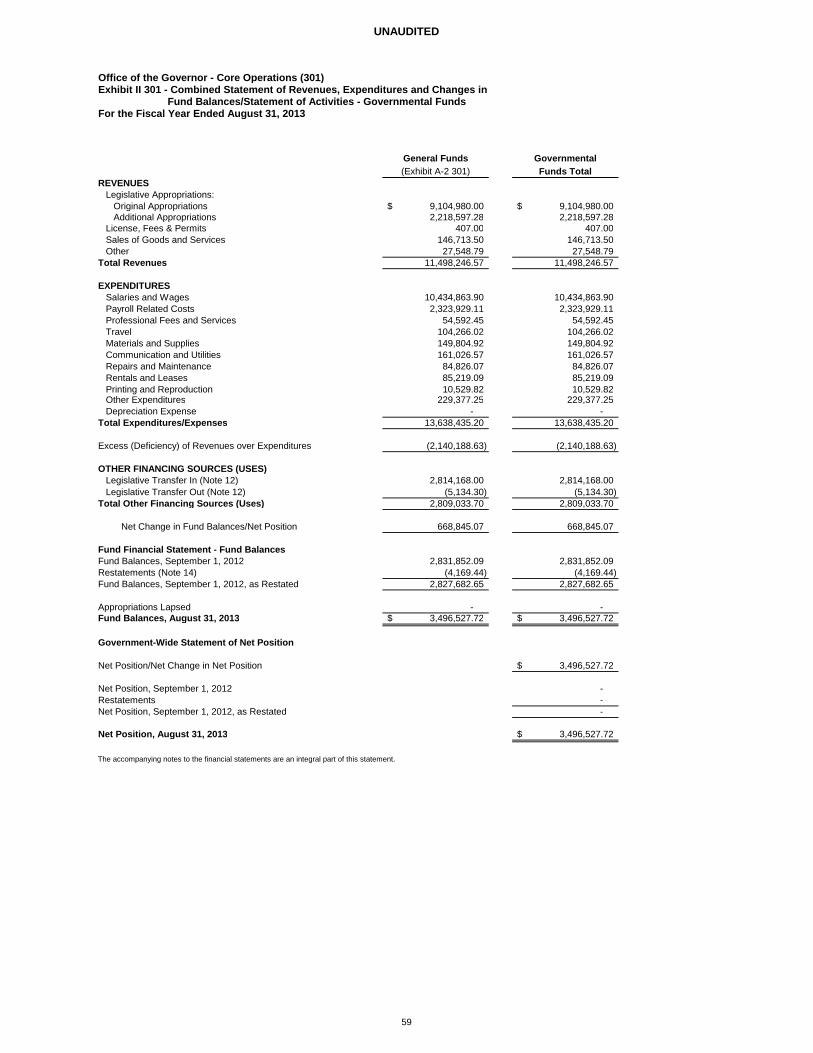
UNAUDITED
Office of the Governor - Core Operations (301)Exhibit II 301 - Combined Statement of Revenues, Expenditures and Changes in
Fund Balances/Statement of Activities - Governmental FundsFor the Fiscal Year Ended August 31, 2013
General Funds Governmental(Exhibit A-2 301) Funds Total
REVENUESLegislative Appropriations:
Original Appropriations 9,104,980.00$ 9,104,980.00$ Additional Appropriations 2,218,597.28 2,218,597.28
License, Fees & Permits 407.00 407.00 Sales of Goods and Services 146,713.50 146,713.50 Other 27,548.79 27,548.79
Total Revenues 11,498,246.57 11,498,246.57
EXPENDITURESSalaries and Wages 10,434,863.90 10,434,863.90 Payroll Related Costs 2,323,929.11 2,323,929.11 Professional Fees and Services 54,592.45 54,592.45 Travel 104,266.02 104,266.02 Materials and Supplies 149,804.92 149,804.92 Communication and Utilities 161,026.57 161,026.57 Repairs and Maintenance 84,826.07 84,826.07 Rentals and Leases 85,219.09 85,219.09 Printing and Reproduction 10,529.82 10,529.82 Other Expenditures 229,377.25 229,377.25 Depreciation Expense - -
Total Expenditures/Expenses 13,638,435.20 13,638,435.20
Excess (Deficiency) of Revenues over Expenditures (2,140,188.63) (2,140,188.63)
OTHER FINANCING SOURCES (USES)Legislative Transfer In (Note 12) 2,814,168.00 2,814,168.00 Legislative Transfer Out (Note 12) (5,134.30) (5,134.30)
Total Other Financing Sources (Uses) 2,809,033.70 2,809,033.70
Net Change in Fund Balances/Net Position 668,845.07 668,845.07
Fund Financial Statement - Fund BalancesFund Balances, September 1, 2012 2,831,852.09 2,831,852.09 Restatements (Note 14) (4,169.44) (4,169.44) Fund Balances, September 1, 2012, as Restated 2,827,682.65 2,827,682.65
Appropriations Lapsed - - Fund Balances, August 31, 2013 3,496,527.72$ 3,496,527.72$
Government-Wide Statement of Net Position
Net Position/Net Change in Net Position 3,496,527.72$
Net Position, September 1, 2012 - Restatements - Net Position, September 1, 2012, as Restated -
Net Position, August 31, 2013 3,496,527.72$
The accompanying notes to the financial statements are an integral part of this statement.
59
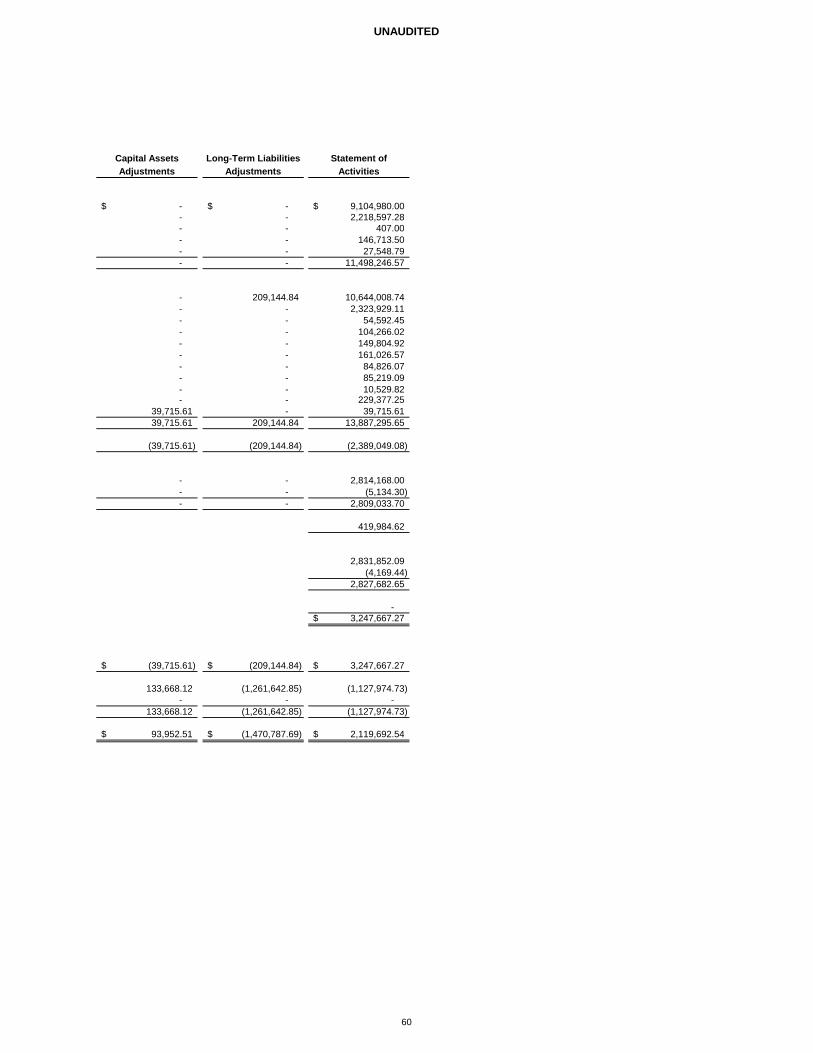
UNAUDITED
Capital Assets Long-Term Liabilities Statement ofAdjustments Adjustments Activities
-$ -$ 9,104,980.00$ - - 2,218,597.28 - - 407.00 - - 146,713.50 - - 27,548.79 - - 11,498,246.57
- 209,144.84 10,644,008.74 - - 2,323,929.11 - - 54,592.45 - - 104,266.02 - - 149,804.92 - - 161,026.57 - - 84,826.07 - - 85,219.09 - - 10,529.82 - - 229,377.25
39,715.61 - 39,715.61 39,715.61 209,144.84 13,887,295.65
(39,715.61) (209,144.84) (2,389,049.08)
- - 2,814,168.00 - - (5,134.30) - - 2,809,033.70
419,984.62
2,831,852.09 (4,169.44)
2,827,682.65
- 3,247,667.27$
(39,715.61)$ (209,144.84)$ 3,247,667.27$
133,668.12 (1,261,642.85) (1,127,974.73) - - -
133,668.12 (1,261,642.85) (1,127,974.73)
93,952.51$ (1,470,787.69)$ 2,119,692.54$
60
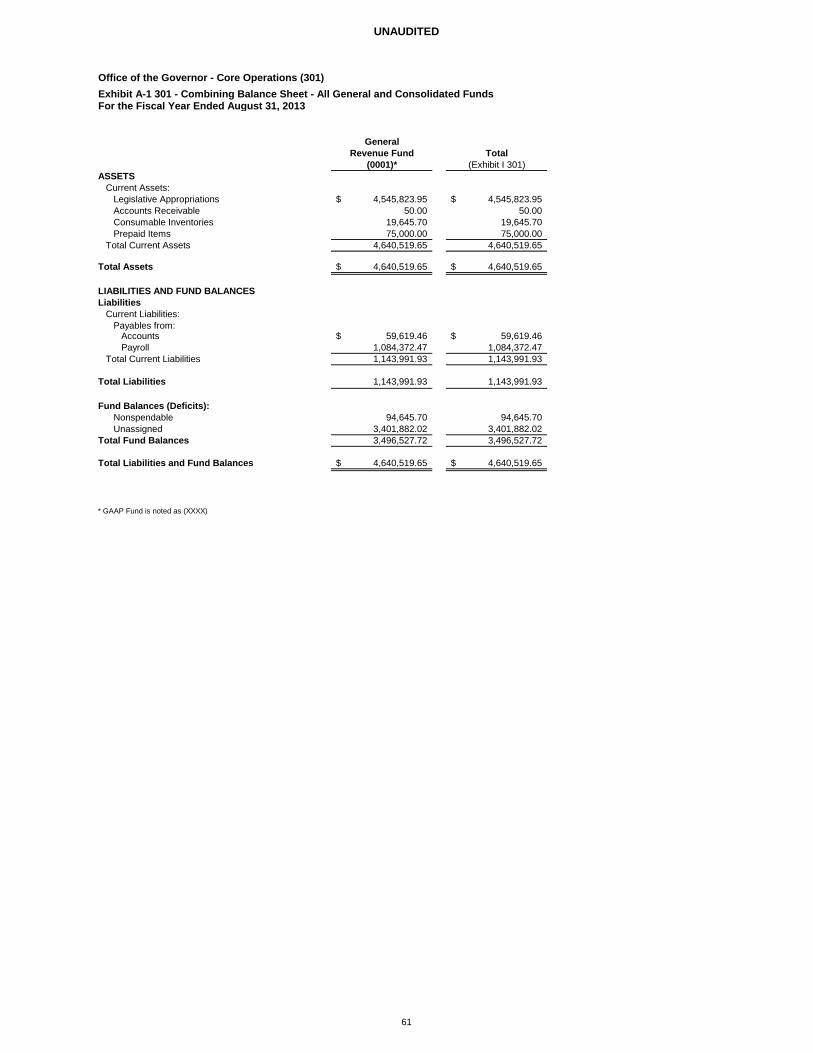
UNAUDITED
Office of the Governor - Core Operations (301)Exhibit A-1 301 - Combining Balance Sheet - All General and Consolidated FundsFor the Fiscal Year Ended August 31, 2013
GeneralRevenue Fund Total
(0001)* (Exhibit I 301)ASSETS
Current Assets:Legislative Appropriations 4,545,823.95$ 4,545,823.95$ Accounts Receivable 50.00 50.00 Consumable Inventories 19,645.70 19,645.70 Prepaid Items 75,000.00 75,000.00
Total Current Assets 4,640,519.65 4,640,519.65
Total Assets 4,640,519.65$ 4,640,519.65$
LIABILITIES AND FUND BALANCESLiabilities
Current Liabilities: Payables from:
Accounts 59,619.46$ 59,619.46$ Payroll 1,084,372.47 1,084,372.47
Total Current Liabilities 1,143,991.93 1,143,991.93
Total Liabilities 1,143,991.93 1,143,991.93
Fund Balances (Deficits):Nonspendable 94,645.70 94,645.70 Unassigned 3,401,882.02 3,401,882.02
Total Fund Balances 3,496,527.72 3,496,527.72
Total Liabilities and Fund Balances 4,640,519.65$ 4,640,519.65$
* GAAP Fund is noted as (XXXX)
61
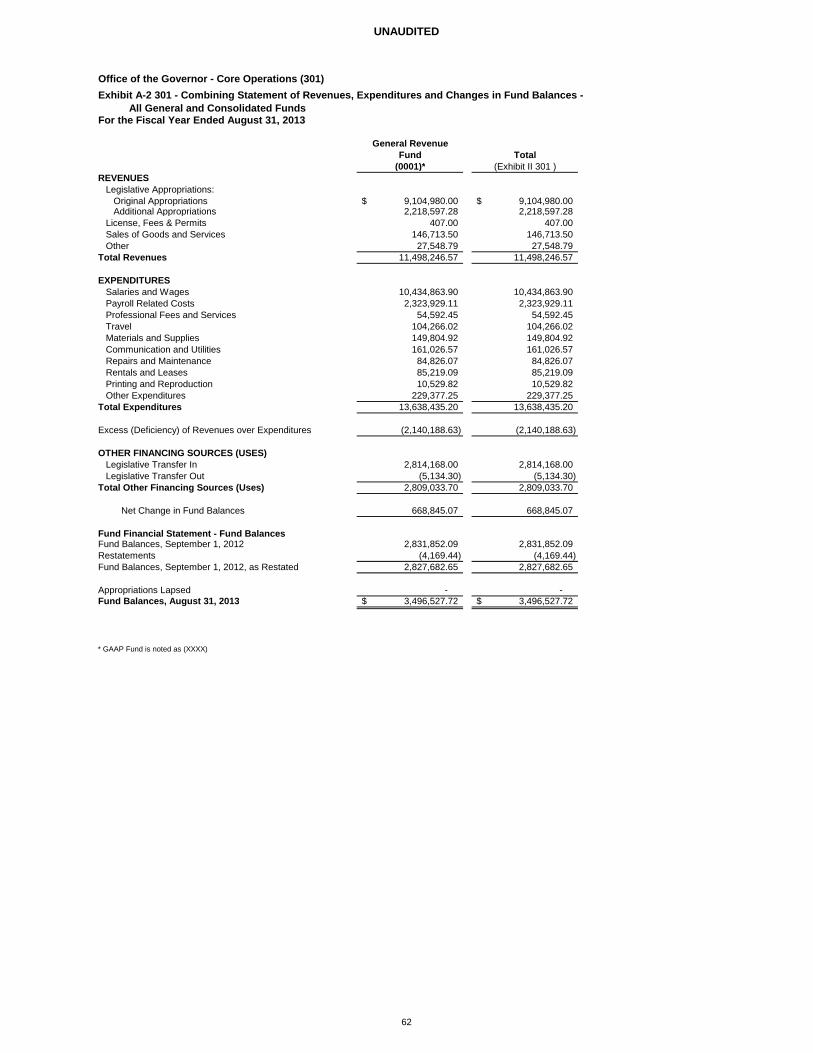
UNAUDITED
Office of the Governor - Core Operations (301)Exhibit A-2 301 - Combining Statement of Revenues, Expenditures and Changes in Fund Balances -
All General and Consolidated FundsFor the Fiscal Year Ended August 31, 2013
General RevenueFund Total
(0001)* (Exhibit II 301 )REVENUES
Legislative Appropriations:Original Appropriations 9,104,980.00$ 9,104,980.00$ Additional Appropriations 2,218,597.28 2,218,597.28
License, Fees & Permits 407.00 407.00 Sales of Goods and Services 146,713.50 146,713.50 Other 27,548.79 27,548.79
Total Revenues 11,498,246.57 11,498,246.57
EXPENDITURESSalaries and Wages 10,434,863.90 10,434,863.90 Payroll Related Costs 2,323,929.11 2,323,929.11 Professional Fees and Services 54,592.45 54,592.45 Travel 104,266.02 104,266.02 Materials and Supplies 149,804.92 149,804.92 Communication and Utilities 161,026.57 161,026.57 Repairs and Maintenance 84,826.07 84,826.07 Rentals and Leases 85,219.09 85,219.09 Printing and Reproduction 10,529.82 10,529.82 Other Expenditures 229,377.25 229,377.25
Total Expenditures 13,638,435.20 13,638,435.20
Excess (Deficiency) of Revenues over Expenditures (2,140,188.63) (2,140,188.63)
OTHER FINANCING SOURCES (USES)Legislative Transfer In 2,814,168.00 2,814,168.00 Legislative Transfer Out (5,134.30) (5,134.30)
Total Other Financing Sources (Uses) 2,809,033.70 2,809,033.70
Net Change in Fund Balances 668,845.07 668,845.07
Fund Financial Statement - Fund BalancesFund Balances, September 1, 2012 2,831,852.09 2,831,852.09 Restatements (4,169.44) (4,169.44) Fund Balances, September 1, 2012, as Restated 2,827,682.65 2,827,682.65
Appropriations Lapsed - - Fund Balances, August 31, 2013 3,496,527.72$ 3,496,527.72$
* GAAP Fund is noted as (XXXX)
62
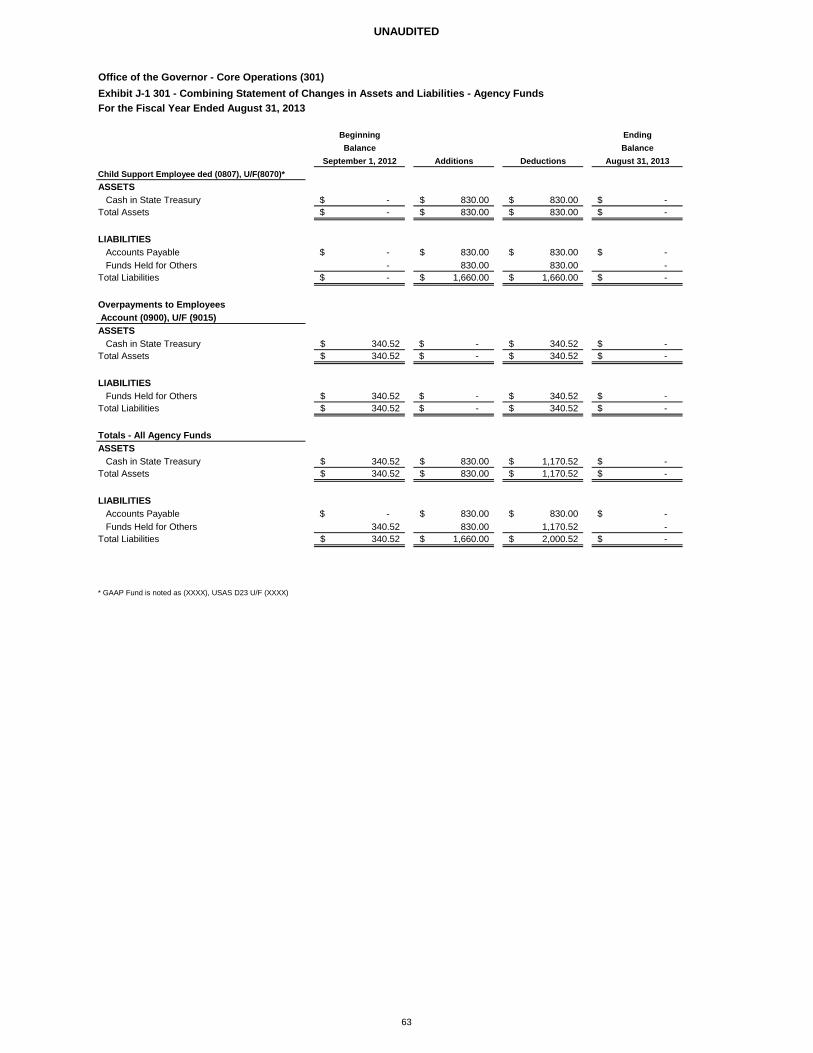
UNAUDITED
Office of the Governor - Core Operations (301)Exhibit J-1 301 - Combining Statement of Changes in Assets and Liabilities - Agency FundsFor the Fiscal Year Ended August 31, 2013
Beginning EndingBalance Balance
September 1, 2012 Additions Deductions August 31, 2013Child Support Employee ded (0807), U/F(8070)*ASSETS
Cash in State Treasury -$ 830.00$ 830.00$ -$ Total Assets -$ 830.00$ 830.00$ -$
LIABILITIES Accounts Payable -$ 830.00$ 830.00$ -$
Funds Held for Others - 830.00 830.00 - Total Liabilities -$ 1,660.00$ 1,660.00$ -$
Overpayments to Employees Account (0900), U/F (9015)ASSETS
Cash in State Treasury 340.52$ -$ 340.52$ -$ Total Assets 340.52$ -$ 340.52$ -$
LIABILITIESFunds Held for Others 340.52$ -$ 340.52$ -$
Total Liabilities 340.52$ -$ 340.52$ -$
Totals - All Agency FundsASSETS
Cash in State Treasury 340.52$ 830.00$ 1,170.52$ -$ Total Assets 340.52$ 830.00$ 1,170.52$ -$
LIABILITIESAccounts Payable -$ 830.00$ 830.00$ -$ Funds Held for Others 340.52 830.00 1,170.52 -
Total Liabilities 340.52$ 1,660.00$ 2,000.52$ -$
* GAAP Fund is noted as (XXXX), USAS D23 U/F (XXXX)
63

The Office of the Governor
Trusteed Programs
Agency 300
Financial Statements
64
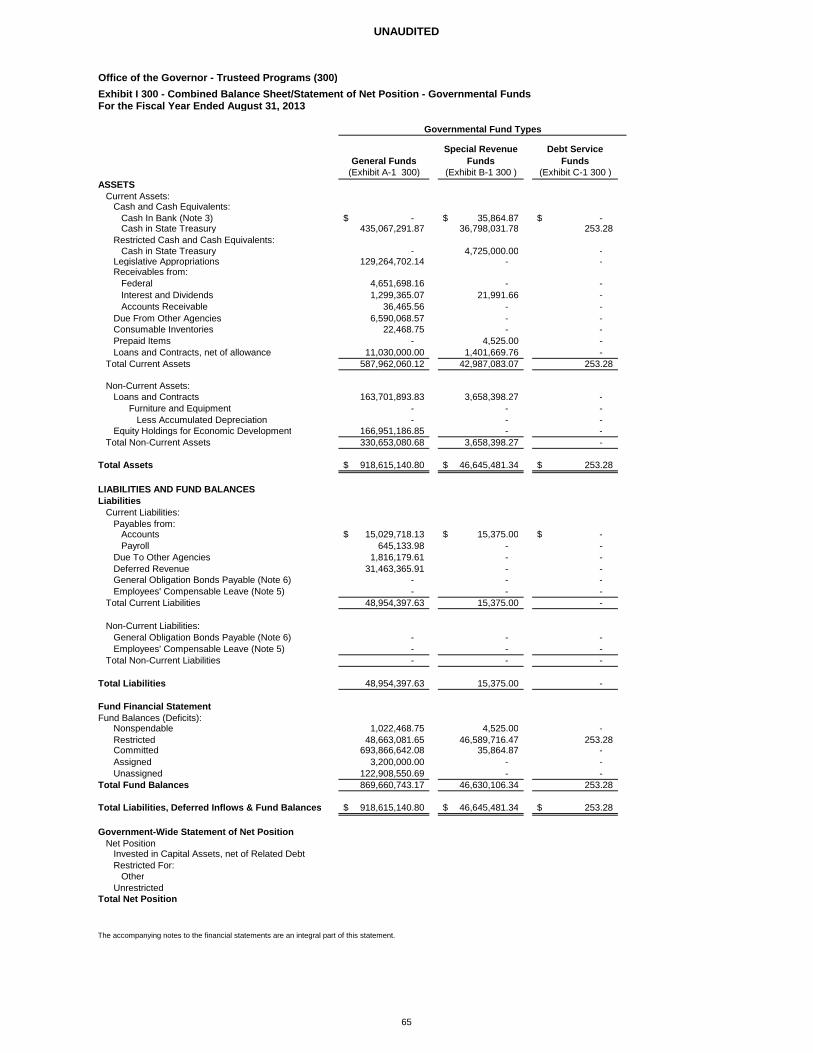
UNAUDITED
Office of the Governor - Trusteed Programs (300)Exhibit I 300 - Combined Balance Sheet/Statement of Net Position - Governmental FundsFor the Fiscal Year Ended August 31, 2013
General FundsSpecial Revenue
FundsDebt Service
Funds(Exhibit A-1 300) (Exhibit B-1 300 ) (Exhibit C-1 300 )
ASSETSCurrent Assets:
Cash and Cash Equivalents:Cash In Bank (Note 3) -$ 35,864.87$ -$ Cash in State Treasury 435,067,291.87 36,798,031.78 253.28
Restricted Cash and Cash Equivalents: Cash in State Treasury - 4,725,000.00 -
Legislative Appropriations 129,264,702.14 - - Receivables from:
Federal 4,651,698.16 - - Interest and Dividends 1,299,365.07 21,991.66 - Accounts Receivable 36,465.56 - -
Due From Other Agencies 6,590,068.57 - - Consumable Inventories 22,468.75 - - Prepaid Items - 4,525.00 - Loans and Contracts, net of allowance 11,030,000.00 1,401,669.76 -
Total Current Assets 587,962,060.12 42,987,083.07 253.28
Non-Current Assets:Loans and Contracts 163,701,893.83 3,658,398.27 -
Furniture and Equipment - - - Less Accumulated Depreciation - - -
Equity Holdings for Economic Development 166,951,186.85 - - Total Non-Current Assets 330,653,080.68 3,658,398.27 -
Total Assets 918,615,140.80$ 46,645,481.34$ 253.28$
LIABILITIES AND FUND BALANCESLiabilities
Current Liabilities:Payables from:
Accounts 15,029,718.13$ 15,375.00$ -$ Payroll 645,133.98 - -
Due To Other Agencies 1,816,179.61 - - Deferred Revenue 31,463,365.91 - - General Obligation Bonds Payable (Note 6) - - - Employees' Compensable Leave (Note 5) - - -
Total Current Liabilities 48,954,397.63 15,375.00 -
Non-Current Liabilities:General Obligation Bonds Payable (Note 6) - - - Employees' Compensable Leave (Note 5) - - -
Total Non-Current Liabilities - - -
Total Liabilities 48,954,397.63 15,375.00 -
Fund Financial StatementFund Balances (Deficits):
Nonspendable 1,022,468.75 4,525.00 - Restricted 48,663,081.65 46,589,716.47 253.28 Committed 693,866,642.08 35,864.87 - Assigned 3,200,000.00 - - Unassigned 122,908,550.69 - -
Total Fund Balances 869,660,743.17 46,630,106.34 253.28
Total Liabilities, Deferred Inflows & Fund Balances 918,615,140.80$ 46,645,481.34$ 253.28$
Government-Wide Statement of Net PositionNet Position
Invested in Capital Assets, net of Related DebtRestricted For:
OtherUnrestricted
Total Net Position
The accompanying notes to the financial statements are an integral part of this statement.
Governmental Fund Types
65
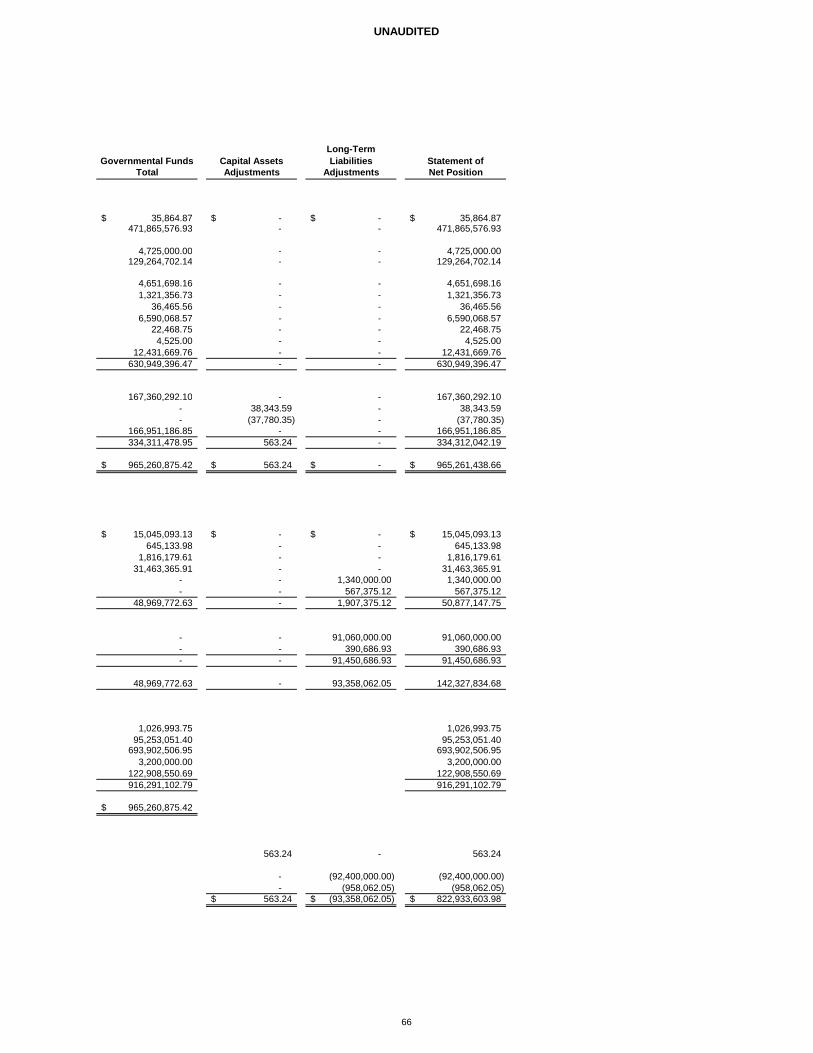
UNAUDITED
Governmental Funds Capital AssetsLong-Term Liabilities Statement of
Total Adjustments Adjustments Net Position
35,864.87$ -$ -$ 35,864.87$ 471,865,576.93 - - 471,865,576.93
4,725,000.00 - - 4,725,000.00
129,264,702.14 - - 129,264,702.14
4,651,698.16 - - 4,651,698.16 1,321,356.73 - - 1,321,356.73
36,465.56 - - 36,465.56 6,590,068.57 - - 6,590,068.57
22,468.75 - - 22,468.75 4,525.00 - - 4,525.00
12,431,669.76 - - 12,431,669.76 630,949,396.47 - - 630,949,396.47
167,360,292.10 - - 167,360,292.10 - 38,343.59 - 38,343.59 - (37,780.35) - (37,780.35)
166,951,186.85 - - 166,951,186.85 334,311,478.95 563.24 - 334,312,042.19
965,260,875.42$ 563.24$ -$ 965,261,438.66$
15,045,093.13$ -$ -$ 15,045,093.13$ 645,133.98 - - 645,133.98
1,816,179.61 - - 1,816,179.61 31,463,365.91 - - 31,463,365.91
- - 1,340,000.00 1,340,000.00 - - 567,375.12 567,375.12
48,969,772.63 - 1,907,375.12 50,877,147.75
- - 91,060,000.00 91,060,000.00- - 390,686.93 390,686.93- - 91,450,686.93 91,450,686.93
48,969,772.63 - 93,358,062.05 142,327,834.68
1,026,993.75 1,026,993.75 95,253,051.40 95,253,051.40
693,902,506.95 693,902,506.95 3,200,000.00 3,200,000.00
122,908,550.69 122,908,550.69 916,291,102.79 916,291,102.79
965,260,875.42$
563.24 - 563.24
- (92,400,000.00) (92,400,000.00) - (958,062.05) (958,062.05)
563.24$ (93,358,062.05)$ 822,933,603.98$
66
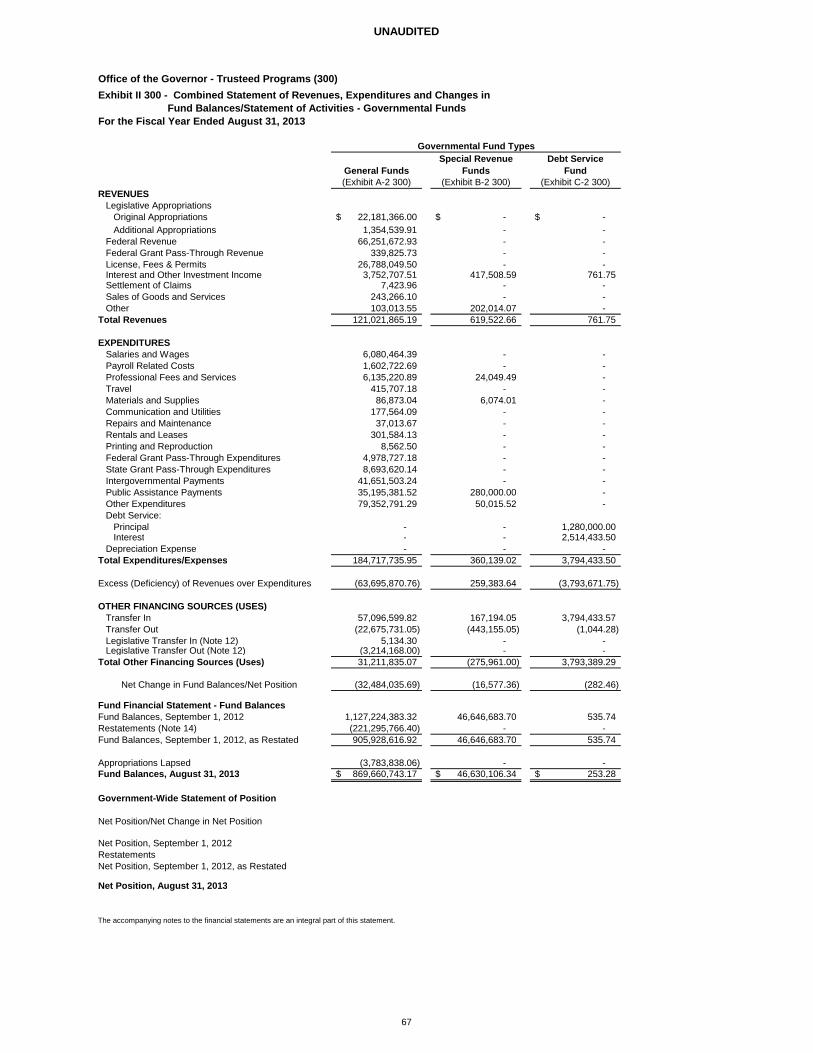
UNAUDITED
Office of the Governor - Trusteed Programs (300)Exhibit II 300 - Combined Statement of Revenues, Expenditures and Changes in
Fund Balances/Statement of Activities - Governmental FundsFor the Fiscal Year Ended August 31, 2013
General FundsSpecial Revenue
FundsDebt Service
Fund(Exhibit A-2 300) (Exhibit B-2 300) (Exhibit C-2 300)
REVENUESLegislative Appropriations
Original Appropriations 22,181,366.00$ -$ -$ Additional Appropriations 1,354,539.91 - -
Federal Revenue 66,251,672.93 - - Federal Grant Pass-Through Revenue 339,825.73 - - License, Fees & Permits 26,788,049.50 - - Interest and Other Investment Income 3,752,707.51 417,508.59 761.75 Settlement of Claims 7,423.96 - - Sales of Goods and Services 243,266.10 - - Other 103,013.55 202,014.07 -
Total Revenues 121,021,865.19 619,522.66 761.75
EXPENDITURESSalaries and Wages 6,080,464.39 - - Payroll Related Costs 1,602,722.69 - - Professional Fees and Services 6,135,220.89 24,049.49 - Travel 415,707.18 - - Materials and Supplies 86,873.04 6,074.01 - Communication and Utilities 177,564.09 - - Repairs and Maintenance 37,013.67 - - Rentals and Leases 301,584.13 - - Printing and Reproduction 8,562.50 - - Federal Grant Pass-Through Expenditures 4,978,727.18 - - State Grant Pass-Through Expenditures 8,693,620.14 - - Intergovernmental Payments 41,651,503.24 - - Public Assistance Payments 35,195,381.52 280,000.00 - Other Expenditures 79,352,791.29 50,015.52 - Debt Service:
Principal - - 1,280,000.00 Interest - - 2,514,433.50
Depreciation Expense - - - Total Expenditures/Expenses 184,717,735.95 360,139.02 3,794,433.50
Excess (Deficiency) of Revenues over Expenditures (63,695,870.76) 259,383.64 (3,793,671.75)
OTHER FINANCING SOURCES (USES)Transfer In 57,096,599.82 167,194.05 3,794,433.57 Transfer Out (22,675,731.05) (443,155.05) (1,044.28) Legislative Transfer In (Note 12) 5,134.30 - - Legislative Transfer Out (Note 12) (3,214,168.00) - -
Total Other Financing Sources (Uses) 31,211,835.07 (275,961.00) 3,793,389.29
Net Change in Fund Balances/Net Position (32,484,035.69) (16,577.36) (282.46)
Fund Financial Statement - Fund BalancesFund Balances, September 1, 2012 1,127,224,383.32 46,646,683.70 535.74 Restatements (Note 14) (221,295,766.40) - - Fund Balances, September 1, 2012, as Restated 905,928,616.92 46,646,683.70 535.74
Appropriations Lapsed (3,783,838.06) - - Fund Balances, August 31, 2013 869,660,743.17$ 46,630,106.34$ 253.28$
Government-Wide Statement of Position
Net Position/Net Change in Net Position
Net Position, September 1, 2012RestatementsNet Position, September 1, 2012, as Restated
Net Position, August 31, 2013
The accompanying notes to the financial statements are an integral part of this statement.
Governmental Fund Types
67
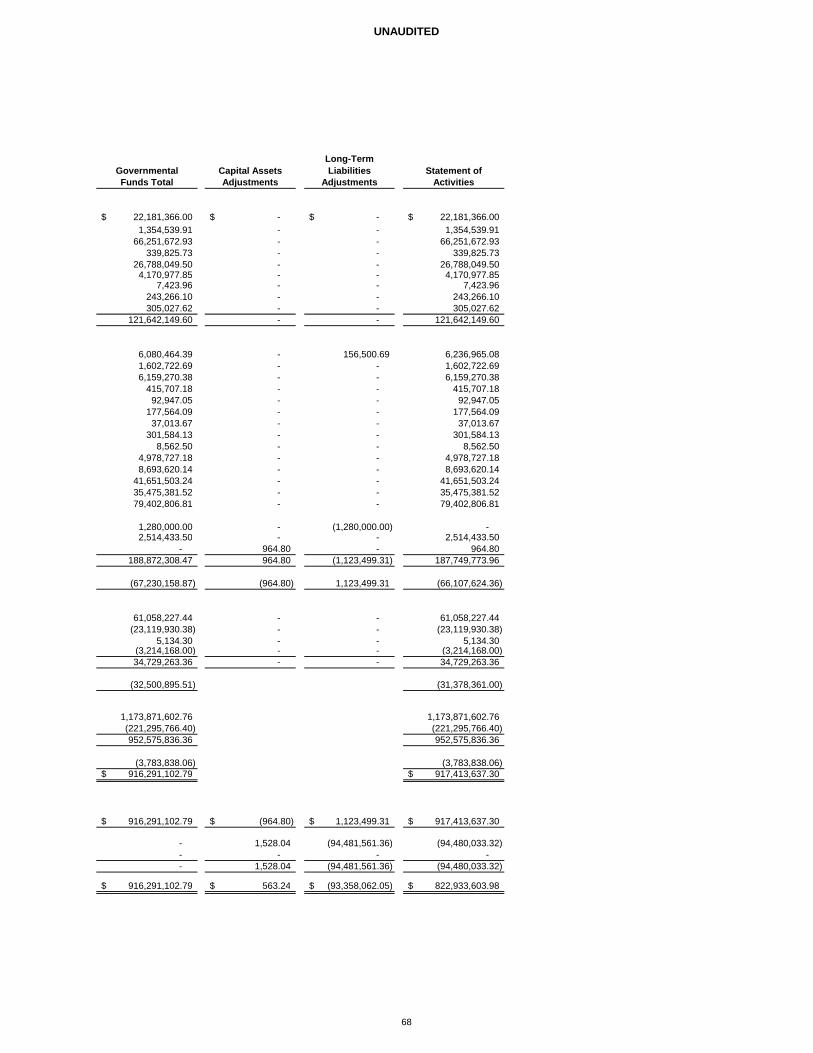
UNAUDITED
Governmental Capital AssetsLong-Term Liabilities Statement of
Funds Total Adjustments Adjustments Activities
22,181,366.00$ -$ -$ 22,181,366.00$ 1,354,539.91 - - 1,354,539.91
66,251,672.93 - - 66,251,672.93 339,825.73 - - 339,825.73
26,788,049.50 - - 26,788,049.50 4,170,977.85 - - 4,170,977.85
7,423.96 - - 7,423.96 243,266.10 - - 243,266.10 305,027.62 - - 305,027.62
121,642,149.60 - - 121,642,149.60
6,080,464.39 - 156,500.69 6,236,965.08 1,602,722.69 - - 1,602,722.69 6,159,270.38 - - 6,159,270.38
415,707.18 - - 415,707.18 92,947.05 - - 92,947.05
177,564.09 - - 177,564.09 37,013.67 - - 37,013.67
301,584.13 - - 301,584.13 8,562.50 - - 8,562.50
4,978,727.18 - - 4,978,727.18 8,693,620.14 - - 8,693,620.14
41,651,503.24 - - 41,651,503.24 35,475,381.52 - - 35,475,381.52 79,402,806.81 - - 79,402,806.81
1,280,000.00 - (1,280,000.00) - 2,514,433.50 - - 2,514,433.50
- 964.80 - 964.80 188,872,308.47 964.80 (1,123,499.31) 187,749,773.96
(67,230,158.87) (964.80) 1,123,499.31 (66,107,624.36)
61,058,227.44 - - 61,058,227.44 (23,119,930.38) - - (23,119,930.38)
5,134.30 - - 5,134.30 (3,214,168.00) - - (3,214,168.00) 34,729,263.36 - - 34,729,263.36
(32,500,895.51) (31,378,361.00)
1,173,871,602.76 1,173,871,602.76 (221,295,766.40) (221,295,766.40) 952,575,836.36 952,575,836.36
(3,783,838.06) (3,783,838.06) 916,291,102.79$ 917,413,637.30$
916,291,102.79$ (964.80)$ 1,123,499.31$ 917,413,637.30$
- 1,528.04 (94,481,561.36) (94,480,033.32) - - - - - 1,528.04 (94,481,561.36) (94,480,033.32)
916,291,102.79$ 563.24$ (93,358,062.05)$ 822,933,603.98$
68
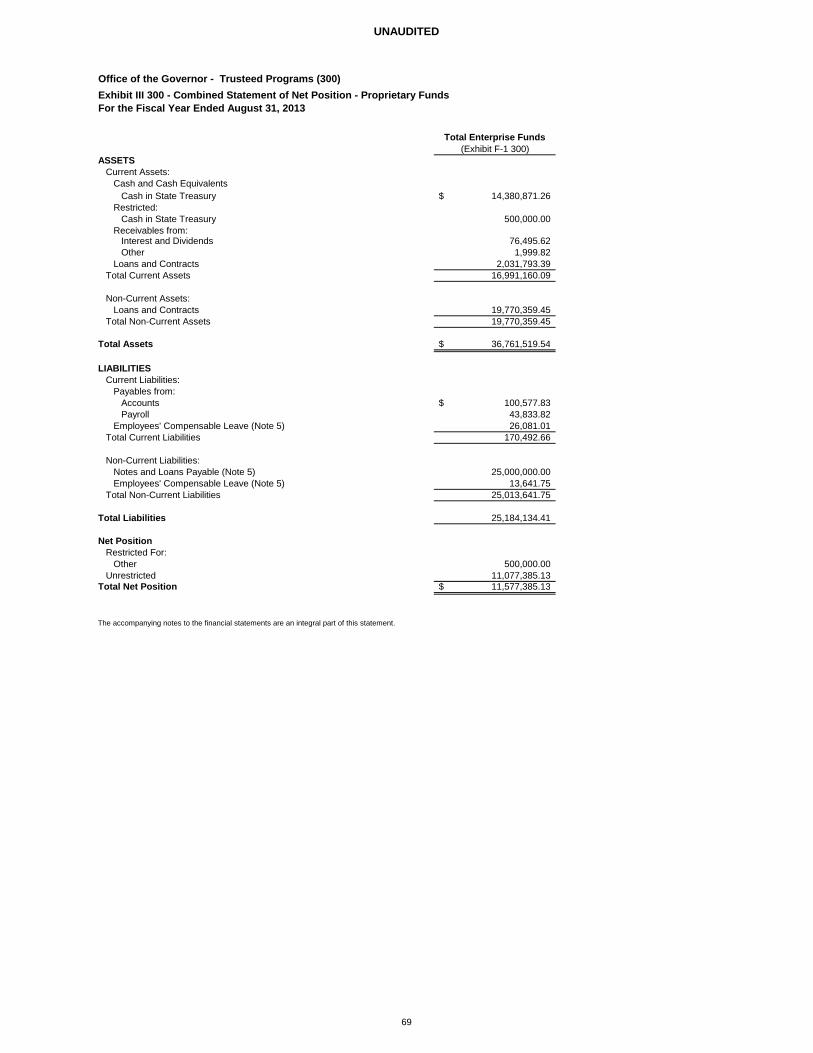
UNAUDITED
Office of the Governor - Trusteed Programs (300)Exhibit III 300 - Combined Statement of Net Position - Proprietary FundsFor the Fiscal Year Ended August 31, 2013
Total Enterprise Funds(Exhibit F-1 300)
ASSETSCurrent Assets:
Cash and Cash EquivalentsCash in State Treasury 14,380,871.26$
Restricted: Cash in State Treasury 500,000.00
Receivables from: Interest and Dividends 76,495.62 Other 1,999.82
Loans and Contracts 2,031,793.39 Total Current Assets 16,991,160.09
Non-Current Assets:Loans and Contracts 19,770,359.45
Total Non-Current Assets 19,770,359.45
Total Assets 36,761,519.54$
LIABILITIESCurrent Liabilities:
Payables from:Accounts 100,577.83$ Payroll 43,833.82
Employees' Compensable Leave (Note 5) 26,081.01 Total Current Liabilities 170,492.66
Non-Current Liabilities:Notes and Loans Payable (Note 5) 25,000,000.00 Employees' Compensable Leave (Note 5) 13,641.75
Total Non-Current Liabilities 25,013,641.75
Total Liabilities 25,184,134.41
Net PositionRestricted For:
Other 500,000.00 Unrestricted 11,077,385.13
Total Net Position 11,577,385.13$
The accompanying notes to the financial statements are an integral part of this statement.
69
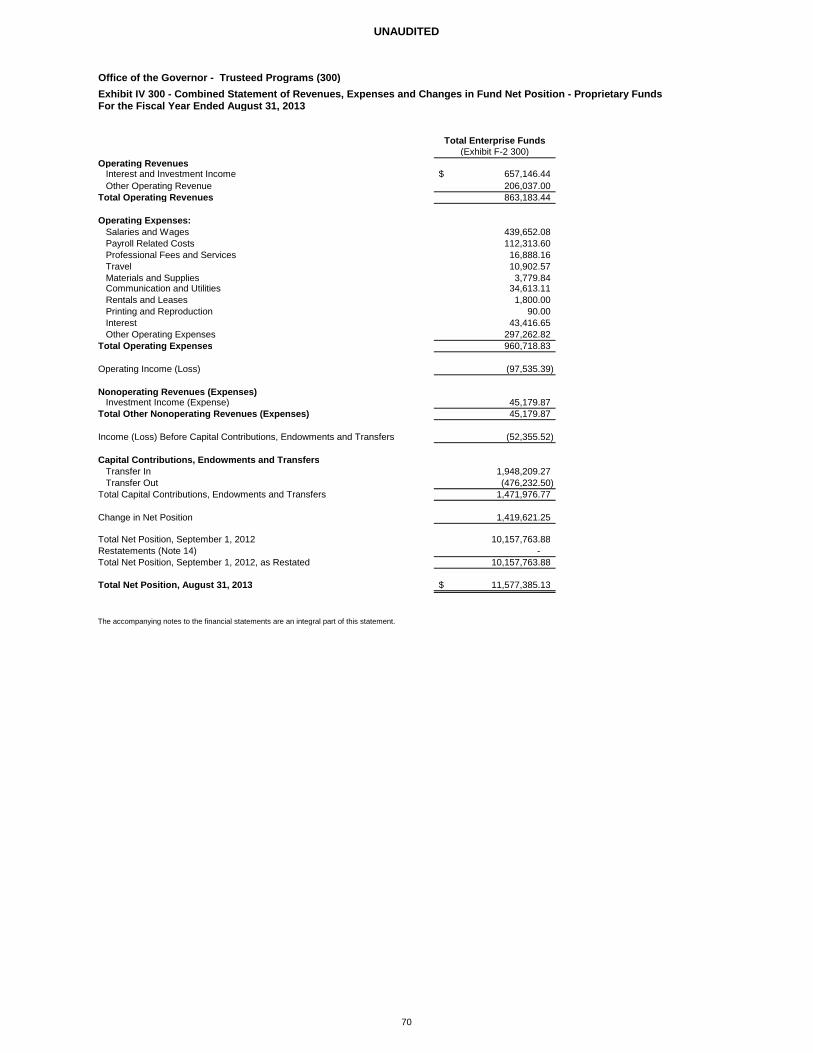
UNAUDITED
Office of the Governor - Trusteed Programs (300)Exhibit IV 300 - Combined Statement of Revenues, Expenses and Changes in Fund Net Position - Proprietary FundsFor the Fiscal Year Ended August 31, 2013
Total Enterprise Funds
(Exhibit F-2 300)Operating Revenues
Interest and Investment Income 657,146.44$ Other Operating Revenue 206,037.00
Total Operating Revenues 863,183.44
Operating Expenses:Salaries and Wages 439,652.08 Payroll Related Costs 112,313.60 Professional Fees and Services 16,888.16 Travel 10,902.57 Materials and Supplies 3,779.84 Communication and Utilities 34,613.11 Rentals and Leases 1,800.00 Printing and Reproduction 90.00 Interest 43,416.65 Other Operating Expenses 297,262.82
Total Operating Expenses 960,718.83 Operating Income (Loss) (97,535.39)
Nonoperating Revenues (Expenses)Investment Income (Expense) 45,179.87
Total Other Nonoperating Revenues (Expenses) 45,179.87
Income (Loss) Before Capital Contributions, Endowments and Transfers (52,355.52)
Capital Contributions, Endowments and TransfersTransfer In 1,948,209.27 Transfer Out (476,232.50)
Total Capital Contributions, Endowments and Transfers 1,471,976.77
Change in Net Position 1,419,621.25
Total Net Position, September 1, 2012 10,157,763.88 Restatements (Note 14) - Total Net Position, September 1, 2012, as Restated 10,157,763.88
Total Net Position, August 31, 2013 11,577,385.13$
The accompanying notes to the financial statements are an integral part of this statement.
70
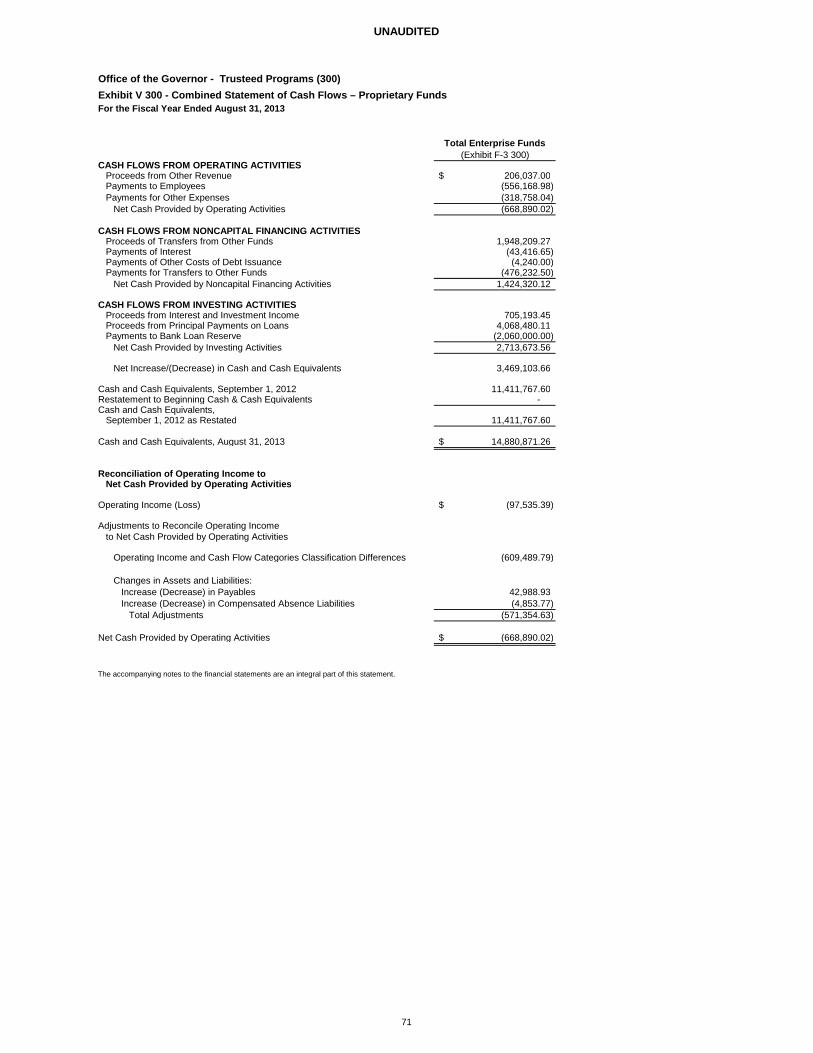
UNAUDITED
Office of the Governor - Trusteed Programs (300)Exhibit V 300 - Combined Statement of Cash Flows – Proprietary FundsFor the Fiscal Year Ended August 31, 2013
Total Enterprise Funds(Exhibit F-3 300)
CASH FLOWS FROM OPERATING ACTIVITIESProceeds from Other Revenue 206,037.00$ Payments to Employees (556,168.98) Payments for Other Expenses (318,758.04)
Net Cash Provided by Operating Activities (668,890.02)
CASH FLOWS FROM NONCAPITAL FINANCING ACTIVITIESProceeds of Transfers from Other Funds 1,948,209.27 Payments of Interest (43,416.65) Payments of Other Costs of Debt Issuance (4,240.00) Payments for Transfers to Other Funds (476,232.50)
Net Cash Provided by Noncapital Financing Activities 1,424,320.12
CASH FLOWS FROM INVESTING ACTIVITIESProceeds from Interest and Investment Income 705,193.45 Proceeds from Principal Payments on Loans 4,068,480.11 Payments to Bank Loan Reserve (2,060,000.00)
Net Cash Provided by Investing Activities 2,713,673.56
Net Increase/(Decrease) in Cash and Cash Equivalents 3,469,103.66
Cash and Cash Equivalents, September 1, 2012 11,411,767.60 Restatement to Beginning Cash & Cash Equivalents - Cash and Cash Equivalents,
September 1, 2012 as Restated 11,411,767.60
Cash and Cash Equivalents, August 31, 2013 14,880,871.26$
Reconciliation of Operating Income to Net Cash Provided by Operating Activities
Operating Income (Loss) (97,535.39)$
Adjustments to Reconcile Operating Income to Net Cash Provided by Operating Activities
Operating Income and Cash Flow Categories Classification Differences (609,489.79)
Changes in Assets and Liabilities:Increase (Decrease) in Payables 42,988.93 Increase (Decrease) in Compensated Absence Liabilities (4,853.77)
Total Adjustments (571,354.63)
Net Cash Provided by Operating Activities (668,890.02)$
The accompanying notes to the financial statements are an integral part of this statement.
71

This page intentionally left blank.
72
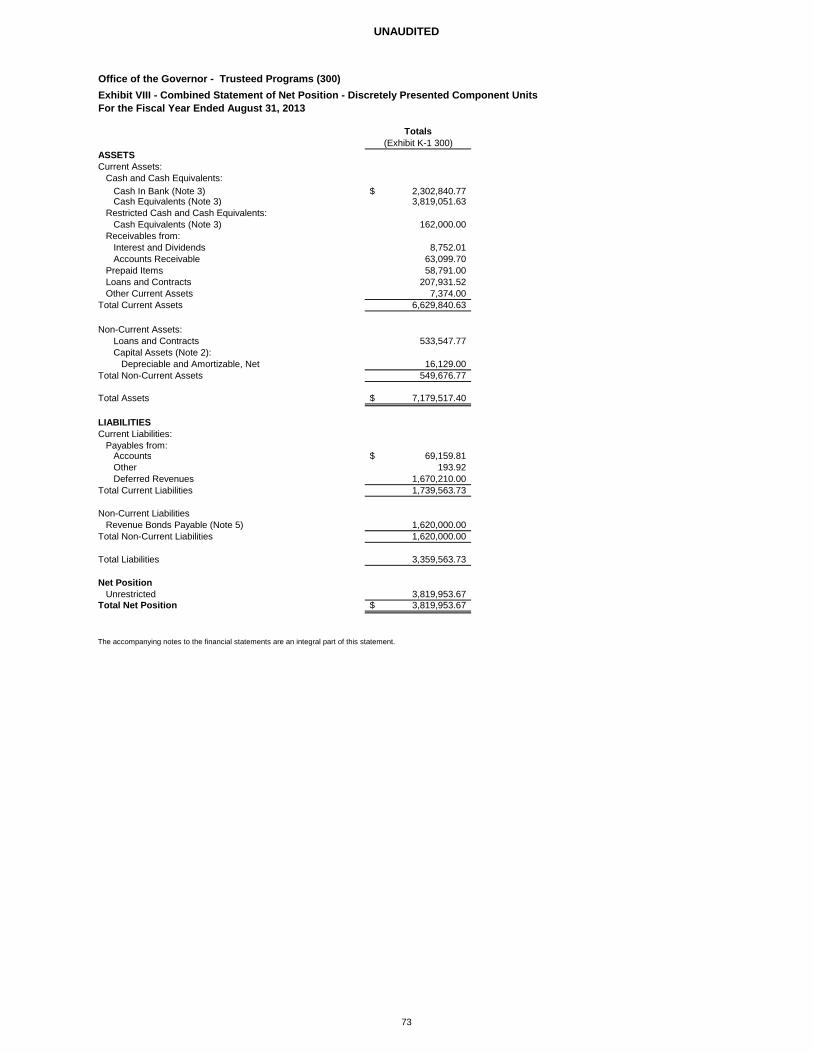
UNAUDITED
Office of the Governor - Trusteed Programs (300)Exhibit VIII - Combined Statement of Net Position - Discretely Presented Component UnitsFor the Fiscal Year Ended August 31, 2013
Totals(Exhibit K-1 300)
ASSETSCurrent Assets:
Cash and Cash Equivalents:Cash In Bank (Note 3) 2,302,840.77$ Cash Equivalents (Note 3) 3,819,051.63
Restricted Cash and Cash Equivalents:Cash Equivalents (Note 3) 162,000.00
Receivables from:Interest and Dividends 8,752.01 Accounts Receivable 63,099.70
Prepaid Items 58,791.00 Loans and Contracts 207,931.52 Other Current Assets 7,374.00
Total Current Assets 6,629,840.63
Non-Current Assets:Loans and Contracts 533,547.77 Capital Assets (Note 2):
Depreciable and Amortizable, Net 16,129.00 Total Non-Current Assets 549,676.77
Total Assets 7,179,517.40$
LIABILITIESCurrent Liabilities:
Payables from:Accounts 69,159.81$ Other 193.92 Deferred Revenues 1,670,210.00
Total Current Liabilities 1,739,563.73
Non-Current LiabilitiesRevenue Bonds Payable (Note 5) 1,620,000.00
Total Non-Current Liabilities 1,620,000.00
Total Liabilities 3,359,563.73
Net PositionUnrestricted 3,819,953.67
Total Net Position 3,819,953.67$
The accompanying notes to the financial statements are an integral part of this statement.
73
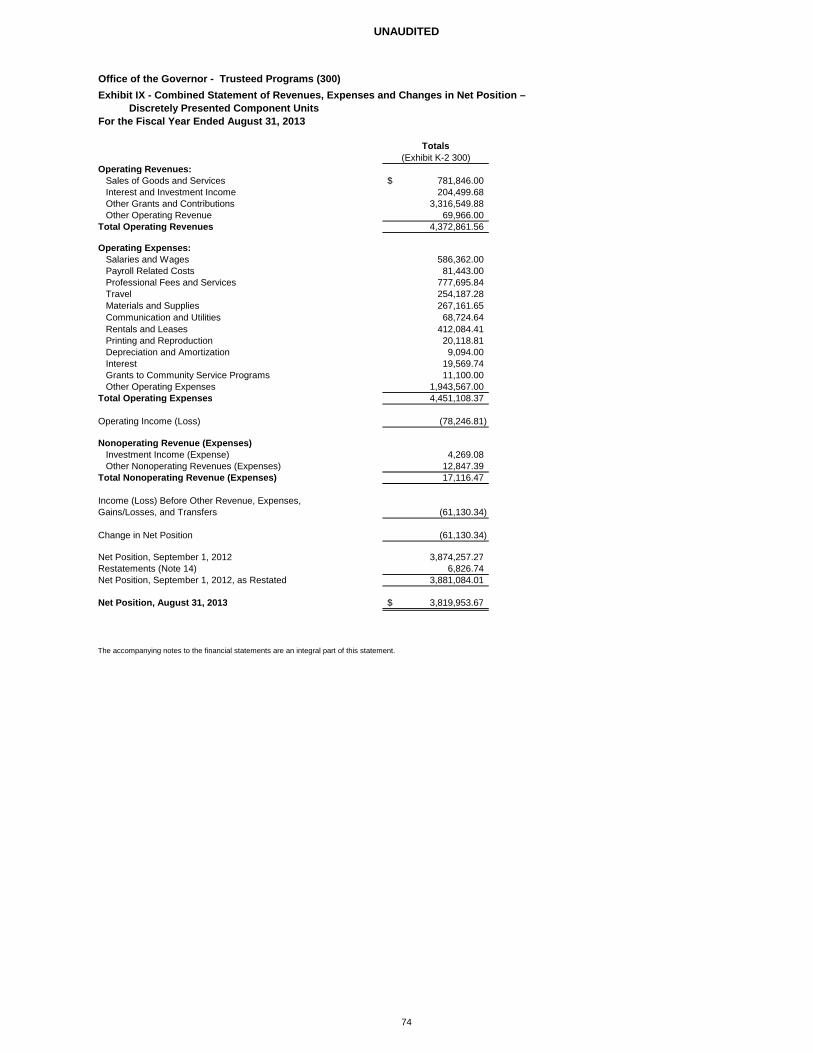
UNAUDITED
Office of the Governor - Trusteed Programs (300)Exhibit IX - Combined Statement of Revenues, Expenses and Changes in Net Position –
Discretely Presented Component UnitsFor the Fiscal Year Ended August 31, 2013
Totals(Exhibit K-2 300)
Operating Revenues:Sales of Goods and Services 781,846.00$ Interest and Investment Income 204,499.68 Other Grants and Contributions 3,316,549.88 Other Operating Revenue 69,966.00
Total Operating Revenues 4,372,861.56
Operating Expenses:Salaries and Wages 586,362.00 Payroll Related Costs 81,443.00 Professional Fees and Services 777,695.84 Travel 254,187.28 Materials and Supplies 267,161.65 Communication and Utilities 68,724.64 Rentals and Leases 412,084.41 Printing and Reproduction 20,118.81 Depreciation and Amortization 9,094.00 Interest 19,569.74 Grants to Community Service Programs 11,100.00 Other Operating Expenses 1,943,567.00
Total Operating Expenses 4,451,108.37
Operating Income (Loss) (78,246.81)
Nonoperating Revenue (Expenses)Investment Income (Expense) 4,269.08 Other Nonoperating Revenues (Expenses) 12,847.39
Total Nonoperating Revenue (Expenses) 17,116.47
Income (Loss) Before Other Revenue, Expenses,Gains/Losses, and Transfers (61,130.34)
Change in Net Position (61,130.34)
Net Position, September 1, 2012 3,874,257.27 Restatements (Note 14) 6,826.74 Net Position, September 1, 2012, as Restated 3,881,084.01
Net Position, August 31, 2013 3,819,953.67$
The accompanying notes to the financial statements are an integral part of this statement.
74
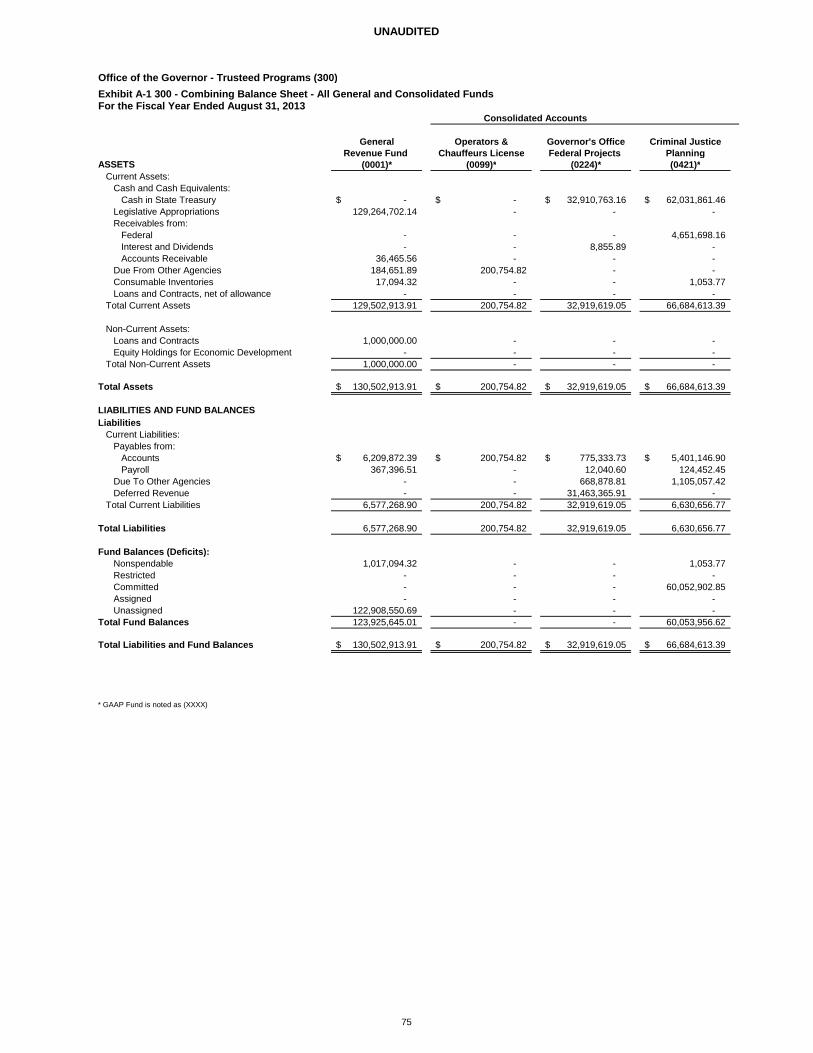
UNAUDITED
Office of the Governor - Trusteed Programs (300)Exhibit A-1 300 - Combining Balance Sheet - All General and Consolidated FundsFor the Fiscal Year Ended August 31, 2013
General Operators & Governor's Office Criminal JusticeRevenue Fund Chauffeurs License Federal Projects Planning
ASSETS (0001)* (0099)* (0224)* (0421)*Current Assets:
Cash and Cash Equivalents:Cash in State Treasury -$ -$ 32,910,763.16$ 62,031,861.46$
Legislative Appropriations 129,264,702.14 - - - Receivables from:
Federal - - - 4,651,698.16 Interest and Dividends - - 8,855.89 - Accounts Receivable 36,465.56 - - -
Due From Other Agencies 184,651.89 200,754.82 - - Consumable Inventories 17,094.32 - - 1,053.77 Loans and Contracts, net of allowance - - - -
Total Current Assets 129,502,913.91 200,754.82 32,919,619.05 66,684,613.39
Non-Current Assets:Loans and Contracts 1,000,000.00 - - - Equity Holdings for Economic Development - - - -
Total Non-Current Assets 1,000,000.00 - - -
Total Assets 130,502,913.91$ 200,754.82$ 32,919,619.05$ 66,684,613.39$
LIABILITIES AND FUND BALANCESLiabilities
Current Liabilities:Payables from:
Accounts 6,209,872.39$ 200,754.82$ 775,333.73$ 5,401,146.90$ Payroll 367,396.51 - 12,040.60 124,452.45
Due To Other Agencies - - 668,878.81 1,105,057.42 Deferred Revenue - - 31,463,365.91 -
Total Current Liabilities 6,577,268.90 200,754.82 32,919,619.05 6,630,656.77
Total Liabilities 6,577,268.90 200,754.82 32,919,619.05 6,630,656.77
Fund Balances (Deficits):Nonspendable 1,017,094.32 - - 1,053.77 Restricted - - - - Committed - - - 60,052,902.85 Assigned - - - - Unassigned 122,908,550.69 - - -
Total Fund Balances 123,925,645.01 - - 60,053,956.62
Total Liabilities and Fund Balances 130,502,913.91$ 200,754.82$ 32,919,619.05$ 66,684,613.39$
* GAAP Fund is noted as (XXXX)
Consolidated Accounts
75
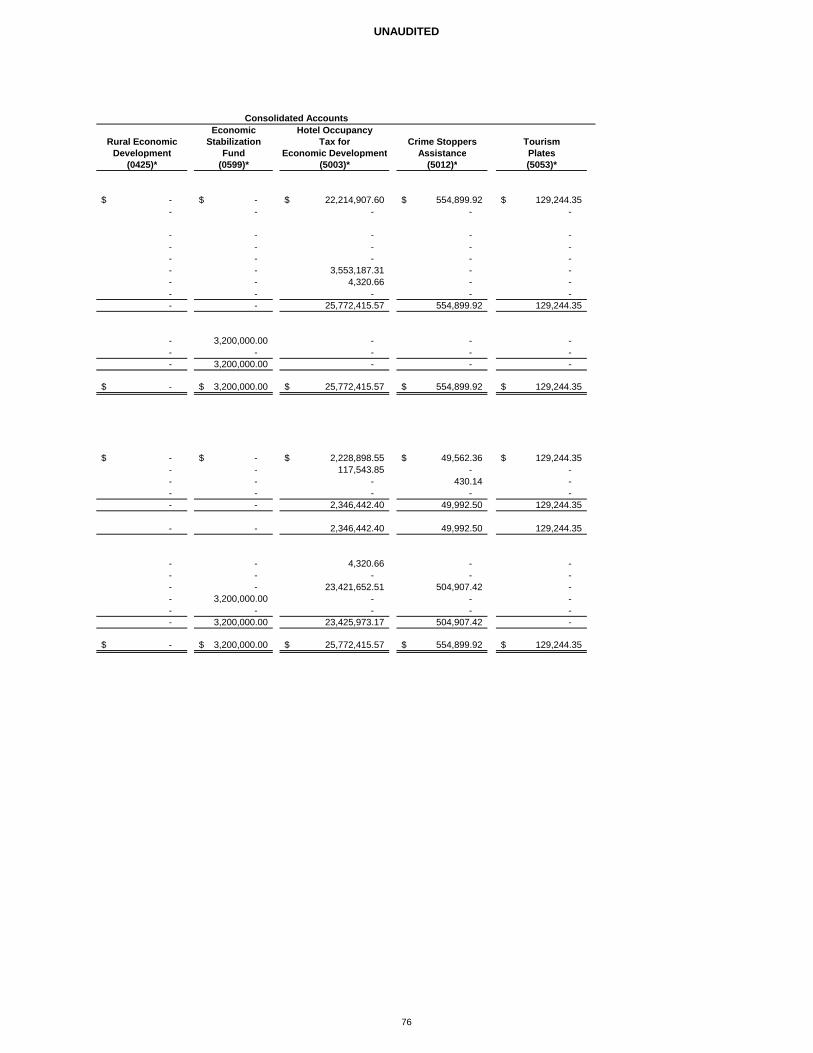
UNAUDITED
Economic Hotel OccupancyRural Economic Stabilization Tax for Crime Stoppers Tourism
Development Fund Economic Development Assistance Plates(0425)* (0599)* (5003)* (5012)* (5053)*
-$ -$ 22,214,907.60$ 554,899.92$ 129,244.35$ - - - - -
- - - - - - - - - - - - - - - - - 3,553,187.31 - - - - 4,320.66 - - - - - - - - - 25,772,415.57 554,899.92 129,244.35
- 3,200,000.00 - - - - - - - - - 3,200,000.00 - - -
-$ 3,200,000.00$ 25,772,415.57$ 554,899.92$ 129,244.35$
-$ -$ 2,228,898.55$ 49,562.36$ 129,244.35$ - - 117,543.85 - - - - - 430.14 - - - - - - - - 2,346,442.40 49,992.50 129,244.35
- - 2,346,442.40 49,992.50 129,244.35
- - 4,320.66 - - - - - - - - - 23,421,652.51 504,907.42 - - 3,200,000.00 - - - - - - - - - 3,200,000.00 23,425,973.17 504,907.42 -
-$ 3,200,000.00$ 25,772,415.57$ 554,899.92$ 129,244.35$
Consolidated Accounts
76
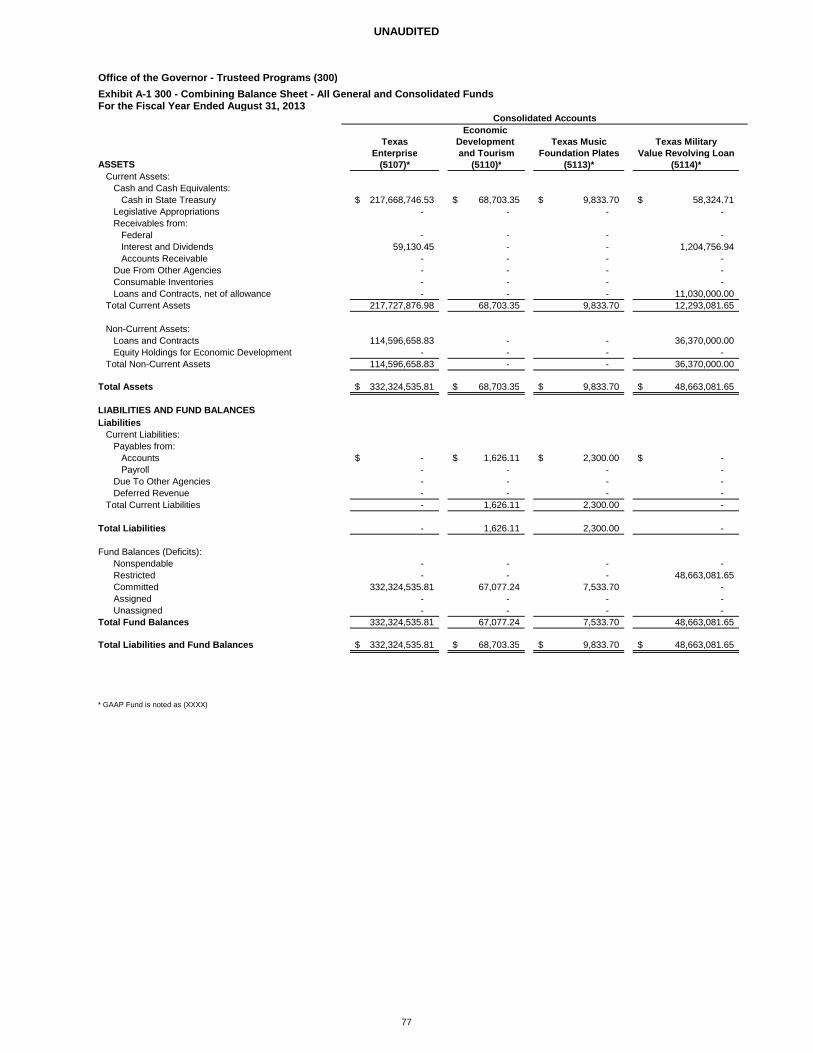
UNAUDITED
Office of the Governor - Trusteed Programs (300)Exhibit A-1 300 - Combining Balance Sheet - All General and Consolidated FundsFor the Fiscal Year Ended August 31, 2013
Economic Texas Development Texas Music Texas Military
Enterprise and Tourism Foundation Plates Value Revolving LoanASSETS (5107)* (5110)* (5113)* (5114)*
Current Assets:Cash and Cash Equivalents:
Cash in State Treasury 217,668,746.53$ 68,703.35$ 9,833.70$ 58,324.71$ Legislative Appropriations - - - - Receivables from:
Federal - - - - Interest and Dividends 59,130.45 - - 1,204,756.94 Accounts Receivable - - - -
Due From Other Agencies - - - - Consumable Inventories - - - - Loans and Contracts, net of allowance - - - 11,030,000.00
Total Current Assets 217,727,876.98 68,703.35 9,833.70 12,293,081.65
Non-Current Assets:Loans and Contracts 114,596,658.83 - - 36,370,000.00 Equity Holdings for Economic Development - - - -
Total Non-Current Assets 114,596,658.83 - - 36,370,000.00
Total Assets 332,324,535.81$ 68,703.35$ 9,833.70$ 48,663,081.65$
LIABILITIES AND FUND BALANCESLiabilities
Current Liabilities:Payables from:
Accounts -$ 1,626.11$ 2,300.00$ -$ Payroll - - - -
Due To Other Agencies - - - - Deferred Revenue - - - -
Total Current Liabilities - 1,626.11 2,300.00 -
Total Liabilities - 1,626.11 2,300.00 -
Fund Balances (Deficits):Nonspendable - - - - Restricted - - - 48,663,081.65 Committed 332,324,535.81 67,077.24 7,533.70 - Assigned - - - - Unassigned - - - -
Total Fund Balances 332,324,535.81 67,077.24 7,533.70 48,663,081.65
Total Liabilities and Fund Balances 332,324,535.81$ 68,703.35$ 9,833.70$ 48,663,081.65$
* GAAP Fund is noted as (XXXX)
Consolidated Accounts
77
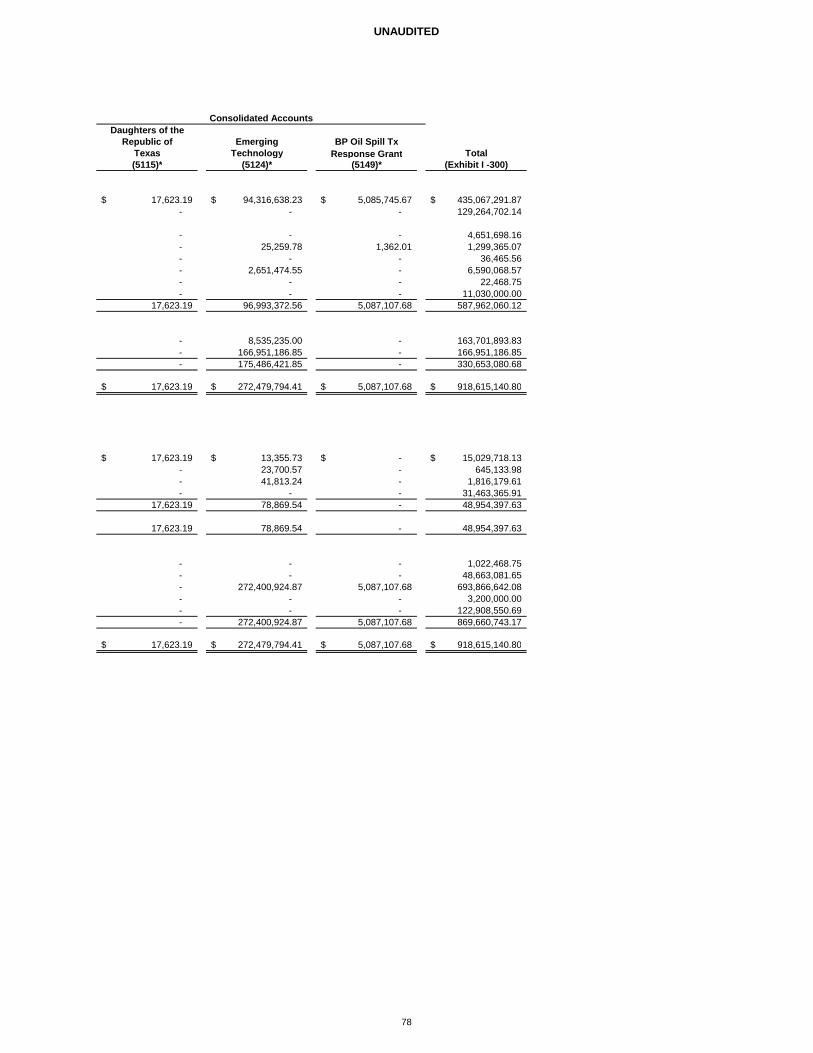
UNAUDITED
Daughters of theRepublic of Emerging BP Oil Spill Tx
Texas Technology Response Grant Total(5115)* (5124)* (5149)* (Exhibit I -300)
17,623.19$ 94,316,638.23$ 5,085,745.67$ 435,067,291.87$ - - - 129,264,702.14
- - - 4,651,698.16 - 25,259.78 1,362.01 1,299,365.07 - - - 36,465.56 - 2,651,474.55 - 6,590,068.57 - - - 22,468.75 - - - 11,030,000.00
17,623.19 96,993,372.56 5,087,107.68 587,962,060.12
- 8,535,235.00 - 163,701,893.83 - 166,951,186.85 - 166,951,186.85 - 175,486,421.85 - 330,653,080.68
17,623.19$ 272,479,794.41$ 5,087,107.68$ 918,615,140.80$
17,623.19$ 13,355.73$ -$ 15,029,718.13$ - 23,700.57 - 645,133.98 - 41,813.24 - 1,816,179.61 - - - 31,463,365.91
17,623.19 78,869.54 - 48,954,397.63
17,623.19 78,869.54 - 48,954,397.63
- - - 1,022,468.75 - - - 48,663,081.65 - 272,400,924.87 5,087,107.68 693,866,642.08 - - - 3,200,000.00 - - - 122,908,550.69 - 272,400,924.87 5,087,107.68 869,660,743.17
17,623.19$ 272,479,794.41$ 5,087,107.68$ 918,615,140.80$
Consolidated Accounts
78
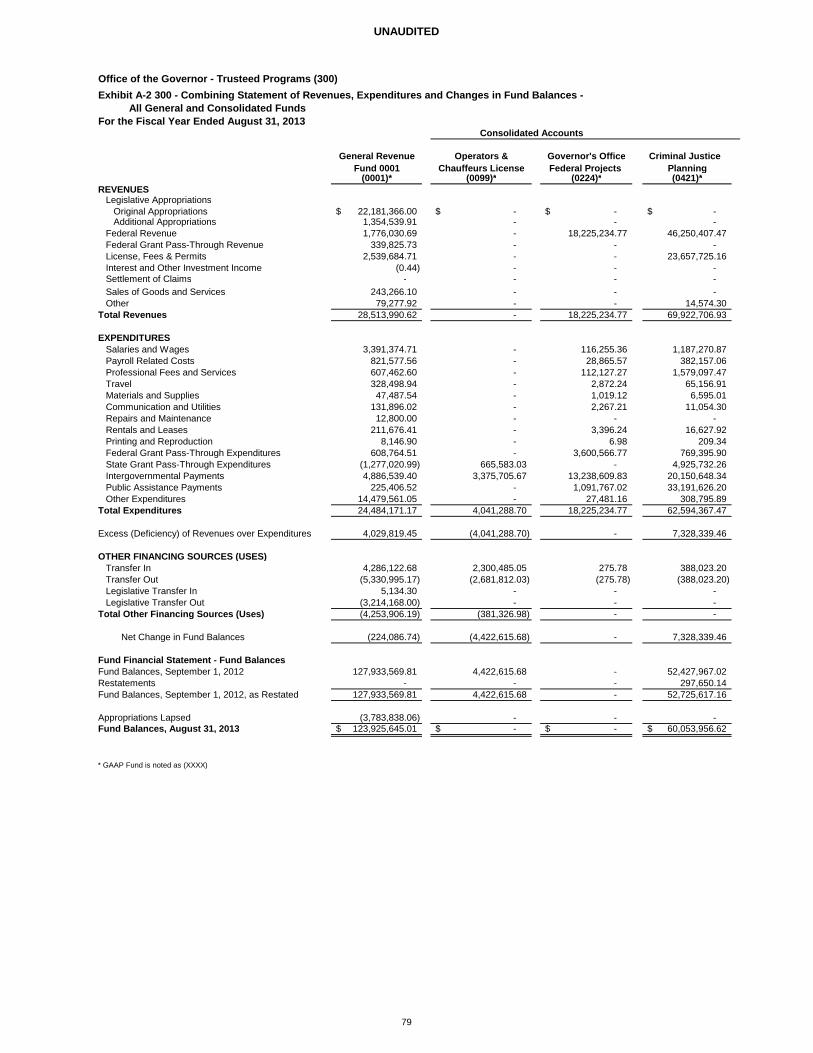
UNAUDITED
Office of the Governor - Trusteed Programs (300)Exhibit A-2 300 - Combining Statement of Revenues, Expenditures and Changes in Fund Balances -
All General and Consolidated FundsFor the Fiscal Year Ended August 31, 2013
General Revenue Operators & Governor's Office Criminal Justice Fund 0001 Chauffeurs License Federal Projects Planning
(0001)* (0099)* (0224)* (0421)*REVENUES
Legislative AppropriationsOriginal Appropriations 22,181,366.00$ -$ -$ -$ Additional Appropriations 1,354,539.91 - - -
Federal Revenue 1,776,030.69 - 18,225,234.77 46,250,407.47 Federal Grant Pass-Through Revenue 339,825.73 - - - License, Fees & Permits 2,539,684.71 - - 23,657,725.16 Interest and Other Investment Income (0.44) - - - Settlement of Claims - - - - Sales of Goods and Services 243,266.10 - - - Other 79,277.92 - - 14,574.30
Total Revenues 28,513,990.62 - 18,225,234.77 69,922,706.93
EXPENDITURESSalaries and Wages 3,391,374.71 - 116,255.36 1,187,270.87 Payroll Related Costs 821,577.56 - 28,865.57 382,157.06 Professional Fees and Services 607,462.60 - 112,127.27 1,579,097.47 Travel 328,498.94 - 2,872.24 65,156.91 Materials and Supplies 47,487.54 - 1,019.12 6,595.01 Communication and Utilities 131,896.02 - 2,267.21 11,054.30 Repairs and Maintenance 12,800.00 - - - Rentals and Leases 211,676.41 - 3,396.24 16,627.92 Printing and Reproduction 8,146.90 - 6.98 209.34 Federal Grant Pass-Through Expenditures 608,764.51 - 3,600,566.77 769,395.90 State Grant Pass-Through Expenditures (1,277,020.99) 665,583.03 - 4,925,732.26 Intergovernmental Payments 4,886,539.40 3,375,705.67 13,238,609.83 20,150,648.34 Public Assistance Payments 225,406.52 - 1,091,767.02 33,191,626.20 Other Expenditures 14,479,561.05 - 27,481.16 308,795.89
Total Expenditures 24,484,171.17 4,041,288.70 18,225,234.77 62,594,367.47
Excess (Deficiency) of Revenues over Expenditures 4,029,819.45 (4,041,288.70) - 7,328,339.46
OTHER FINANCING SOURCES (USES)Transfer In 4,286,122.68 2,300,485.05 275.78 388,023.20 Transfer Out (5,330,995.17) (2,681,812.03) (275.78) (388,023.20) Legislative Transfer In 5,134.30 - - - Legislative Transfer Out (3,214,168.00) - - -
Total Other Financing Sources (Uses) (4,253,906.19) (381,326.98) - -
Net Change in Fund Balances (224,086.74) (4,422,615.68) - 7,328,339.46
Fund Financial Statement - Fund BalancesFund Balances, September 1, 2012 127,933,569.81 4,422,615.68 - 52,427,967.02 Restatements - - - 297,650.14 Fund Balances, September 1, 2012, as Restated 127,933,569.81 4,422,615.68 - 52,725,617.16
Appropriations Lapsed (3,783,838.06) - - - Fund Balances, August 31, 2013 123,925,645.01$ -$ -$ 60,053,956.62$
* GAAP Fund is noted as (XXXX)
Consolidated Accounts
79
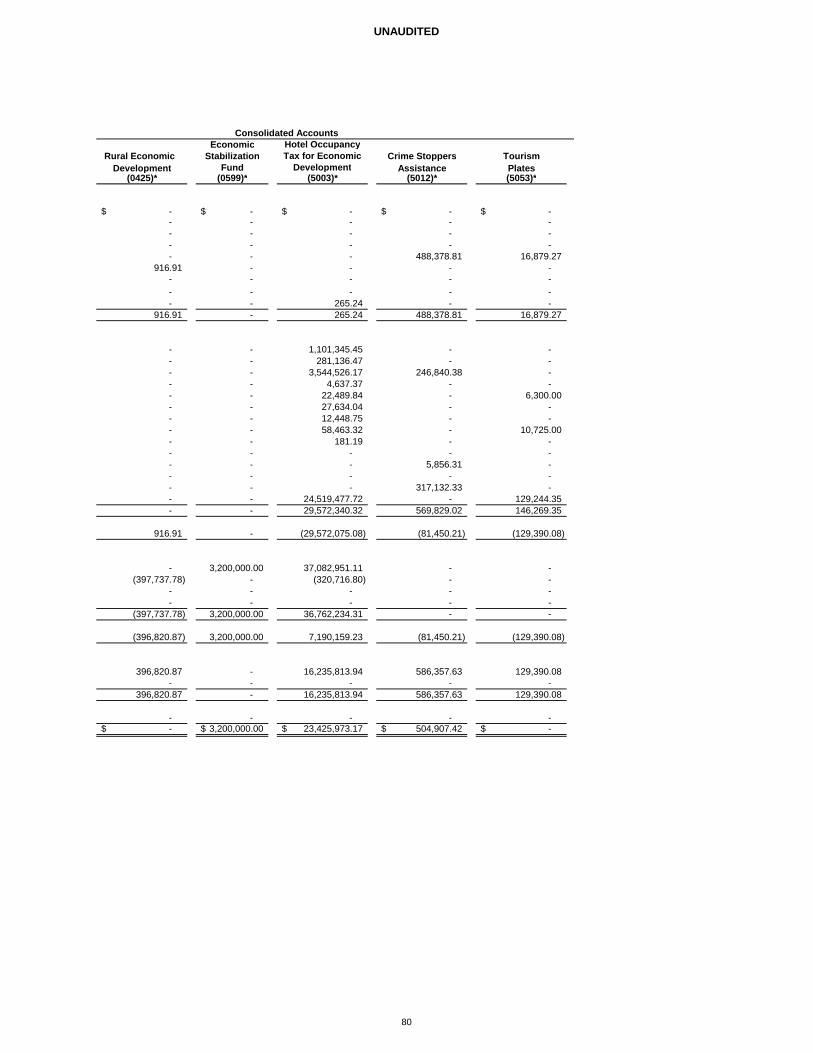
UNAUDITED
Economic Hotel OccupancyRural Economic Stabilization Tax for Economic Crime Stoppers Tourism
Development Fund Development Assistance Plates(0425)* (0599)* (5003)* (5012)* (5053)*
-$ -$ -$ -$ -$ - - - - - - - - - - - - - - - - - - 488,378.81 16,879.27
916.91 - - - - - - - - - - - - - - - - 265.24 - -
916.91 - 265.24 488,378.81 16,879.27
- - 1,101,345.45 - - - - 281,136.47 - - - - 3,544,526.17 246,840.38 - - - 4,637.37 - - - - 22,489.84 - 6,300.00 - - 27,634.04 - - - - 12,448.75 - - - - 58,463.32 - 10,725.00 - - 181.19 - - - - - - - - - - 5,856.31 - - - - - - - - - 317,132.33 - - - 24,519,477.72 - 129,244.35 - - 29,572,340.32 569,829.02 146,269.35
916.91 - (29,572,075.08) (81,450.21) (129,390.08)
- 3,200,000.00 37,082,951.11 - - (397,737.78) - (320,716.80) - -
- - - - - - - - - -
(397,737.78) 3,200,000.00 36,762,234.31 - -
(396,820.87) 3,200,000.00 7,190,159.23 (81,450.21) (129,390.08)
396,820.87 - 16,235,813.94 586,357.63 129,390.08 - - - - -
396,820.87 - 16,235,813.94 586,357.63 129,390.08
- - - - - -$ 3,200,000.00$ 23,425,973.17$ 504,907.42$ -$
Consolidated Accounts
80
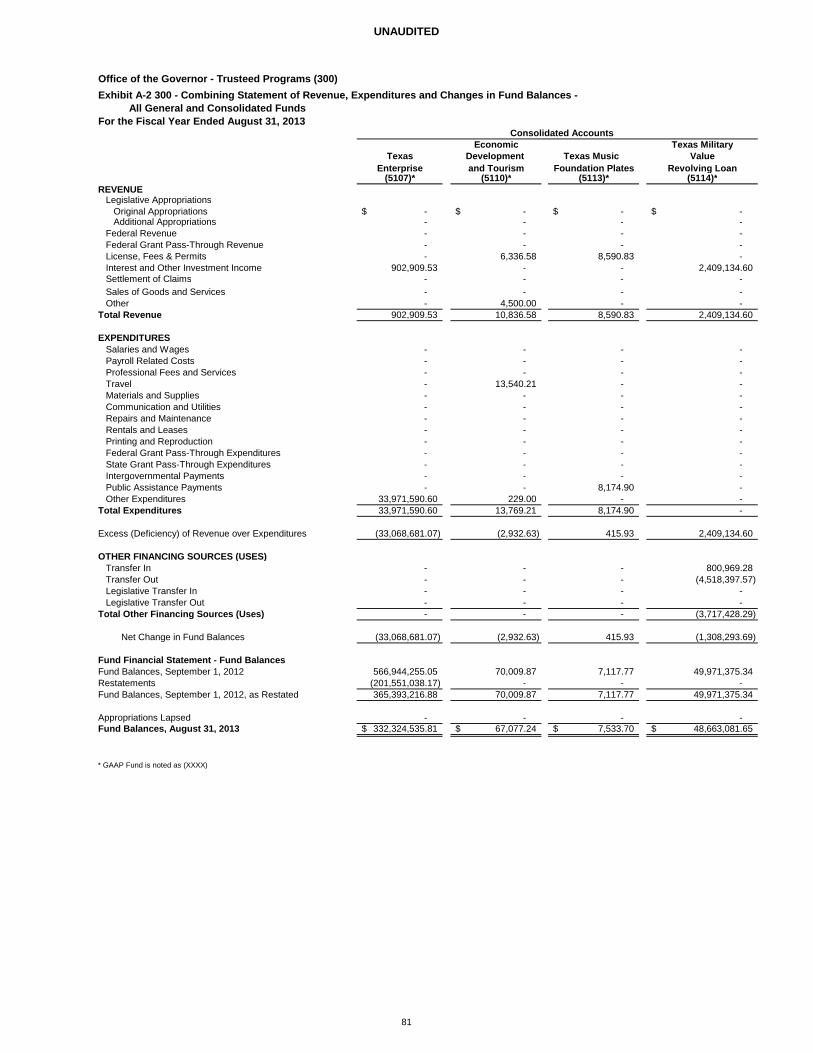
UNAUDITED
Office of the Governor - Trusteed Programs (300)Exhibit A-2 300 - Combining Statement of Revenue, Expenditures and Changes in Fund Balances -
All General and Consolidated FundsFor the Fiscal Year Ended August 31, 2013
Economic Texas MilitaryTexas Development Texas Music Value
Enterprise and Tourism Foundation Plates Revolving Loan(5107)* (5110)* (5113)* (5114)*
REVENUELegislative Appropriations
Original Appropriations -$ -$ -$ -$ Additional Appropriations - - - -
Federal Revenue - - - - Federal Grant Pass-Through Revenue - - - - License, Fees & Permits - 6,336.58 8,590.83 - Interest and Other Investment Income 902,909.53 - - 2,409,134.60 Settlement of Claims - - - - Sales of Goods and Services - - - - Other - 4,500.00 - -
Total Revenue 902,909.53 10,836.58 8,590.83 2,409,134.60
EXPENDITURESSalaries and Wages - - - - Payroll Related Costs - - - - Professional Fees and Services - - - - Travel - 13,540.21 - - Materials and Supplies - - - - Communication and Utilities - - - - Repairs and Maintenance - - - - Rentals and Leases - - - - Printing and Reproduction - - - - Federal Grant Pass-Through Expenditures - - - - State Grant Pass-Through Expenditures - - - - Intergovernmental Payments - - - - Public Assistance Payments - - 8,174.90 - Other Expenditures 33,971,590.60 229.00 - -
Total Expenditures 33,971,590.60 13,769.21 8,174.90 -
Excess (Deficiency) of Revenue over Expenditures (33,068,681.07) (2,932.63) 415.93 2,409,134.60
OTHER FINANCING SOURCES (USES)Transfer In - - - 800,969.28 Transfer Out - - - (4,518,397.57) Legislative Transfer In - - - - Legislative Transfer Out - - - -
Total Other Financing Sources (Uses) - - - (3,717,428.29)
Net Change in Fund Balances (33,068,681.07) (2,932.63) 415.93 (1,308,293.69)
Fund Financial Statement - Fund BalancesFund Balances, September 1, 2012 566,944,255.05 70,009.87 7,117.77 49,971,375.34 Restatements (201,551,038.17) - - - Fund Balances, September 1, 2012, as Restated 365,393,216.88 70,009.87 7,117.77 49,971,375.34 Appropriations Lapsed - - - - Fund Balances, August 31, 2013 332,324,535.81$ 67,077.24$ 7,533.70$ 48,663,081.65$
* GAAP Fund is noted as (XXXX)
Consolidated Accounts
81
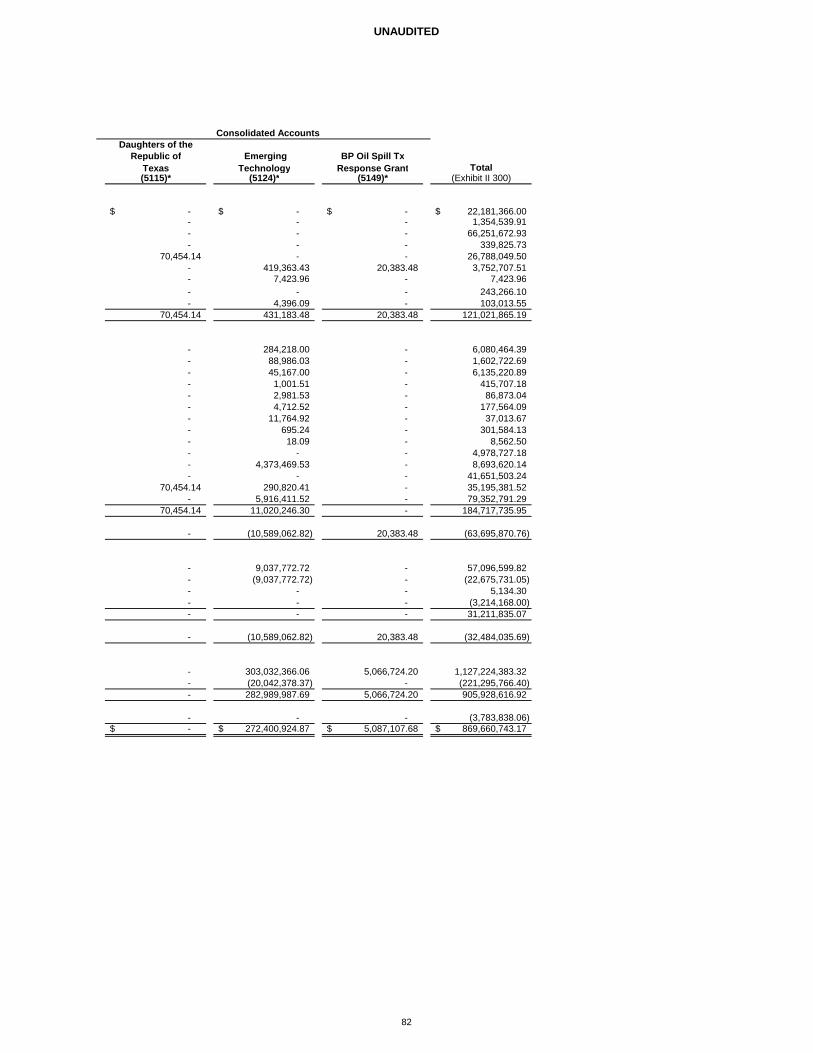
UNAUDITED
Daughters of theRepublic of Emerging BP Oil Spill Tx
Texas Technology Response Grant Total(5115)* (5124)* (5149)* (Exhibit II 300)
-$ -$ -$ 22,181,366.00$ - - - 1,354,539.91 - - - 66,251,672.93 - - - 339,825.73
70,454.14 - - 26,788,049.50 - 419,363.43 20,383.48 3,752,707.51 - 7,423.96 - 7,423.96 - - - 243,266.10 - 4,396.09 - 103,013.55
70,454.14 431,183.48 20,383.48 121,021,865.19
- 284,218.00 - 6,080,464.39 - 88,986.03 - 1,602,722.69 - 45,167.00 - 6,135,220.89 - 1,001.51 - 415,707.18 - 2,981.53 - 86,873.04 - 4,712.52 - 177,564.09 - 11,764.92 - 37,013.67 - 695.24 - 301,584.13 - 18.09 - 8,562.50 - - - 4,978,727.18 - 4,373,469.53 - 8,693,620.14 - - - 41,651,503.24
70,454.14 290,820.41 - 35,195,381.52 - 5,916,411.52 - 79,352,791.29
70,454.14 11,020,246.30 - 184,717,735.95
- (10,589,062.82) 20,383.48 (63,695,870.76)
- 9,037,772.72 - 57,096,599.82 - (9,037,772.72) - (22,675,731.05) - - - 5,134.30 - - - (3,214,168.00) - - - 31,211,835.07
- (10,589,062.82) 20,383.48 (32,484,035.69)
- 303,032,366.06 5,066,724.20 1,127,224,383.32 - (20,042,378.37) - (221,295,766.40) - 282,989,987.69 5,066,724.20 905,928,616.92
- - - (3,783,838.06) -$ 272,400,924.87$ 5,087,107.68$ 869,660,743.17$
Consolidated Accounts
82
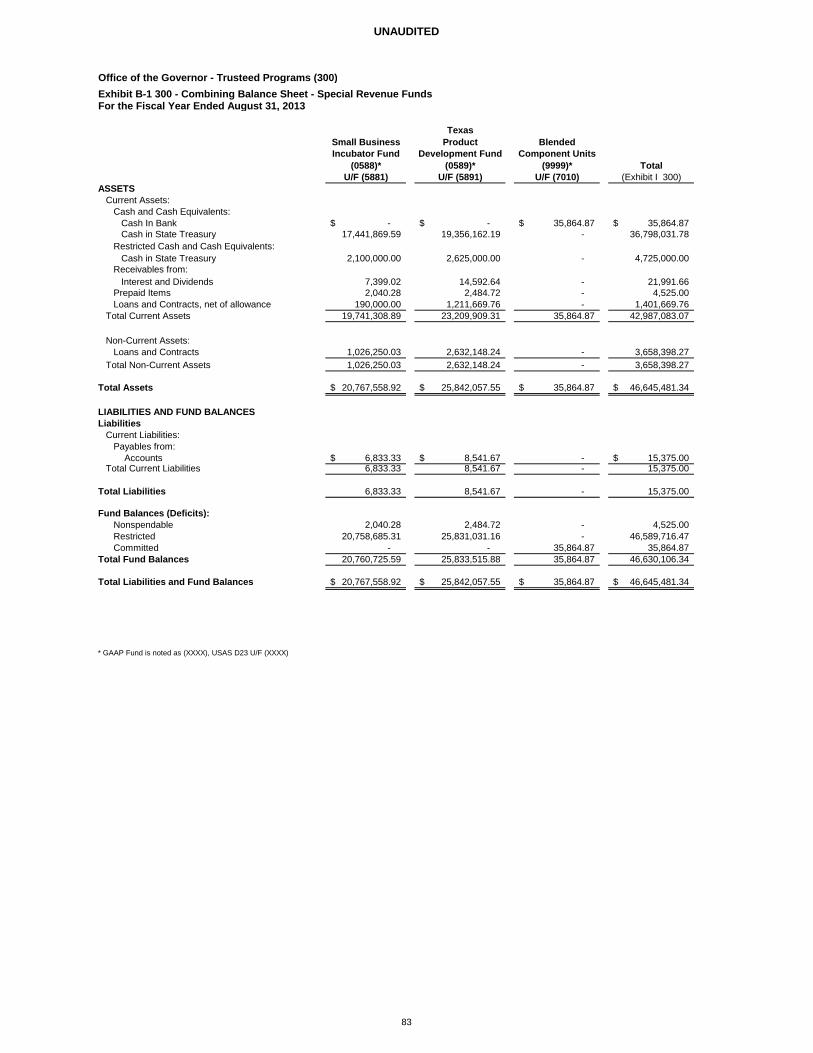
UNAUDITED
Office of the Governor - Trusteed Programs (300)Exhibit B-1 300 - Combining Balance Sheet - Special Revenue FundsFor the Fiscal Year Ended August 31, 2013
TexasSmall Business Product BlendedIncubator Fund Development Fund Component Units
(0588)* (0589)* (9999)* TotalU/F (5881) U/F (5891) U/F (7010) (Exhibit I 300)
ASSETSCurrent Assets:
Cash and Cash Equivalents:Cash In Bank -$ -$ 35,864.87$ 35,864.87$ Cash in State Treasury 17,441,869.59 19,356,162.19 - 36,798,031.78
Restricted Cash and Cash Equivalents:Cash in State Treasury 2,100,000.00 2,625,000.00 - 4,725,000.00
Receivables from: Interest and Dividends 7,399.02 14,592.64 - 21,991.66
Prepaid Items 2,040.28 2,484.72 - 4,525.00 Loans and Contracts, net of allowance 190,000.00 1,211,669.76 - 1,401,669.76
Total Current Assets 19,741,308.89 23,209,909.31 35,864.87 42,987,083.07
Non-Current Assets:Loans and Contracts 1,026,250.03 2,632,148.24 - 3,658,398.27
Total Non-Current Assets 1,026,250.03 2,632,148.24 - 3,658,398.27
Total Assets 20,767,558.92$ 25,842,057.55$ 35,864.87$ 46,645,481.34$
LIABILITIES AND FUND BALANCESLiabilities
Current Liabilities:Payables from:
Accounts 6,833.33$ 8,541.67$ - 15,375.00$ Total Current Liabilities 6,833.33 8,541.67 - 15,375.00
Total Liabilities 6,833.33 8,541.67 - 15,375.00
Fund Balances (Deficits):Nonspendable 2,040.28 2,484.72 - 4,525.00 Restricted 20,758,685.31 25,831,031.16 - 46,589,716.47 Committed - - 35,864.87 35,864.87
Total Fund Balances 20,760,725.59 25,833,515.88 35,864.87 46,630,106.34
Total Liabilities and Fund Balances 20,767,558.92$ 25,842,057.55$ 35,864.87$ 46,645,481.34$
* GAAP Fund is noted as (XXXX), USAS D23 U/F (XXXX)
83
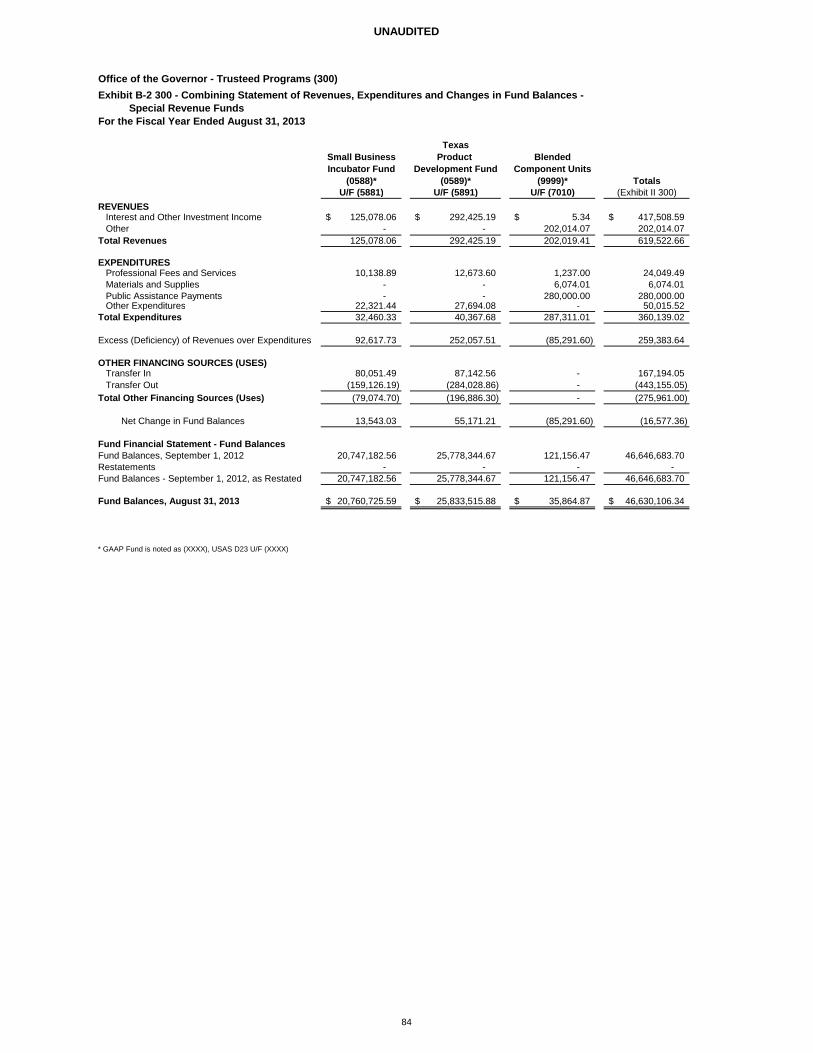
UNAUDITED
Office of the Governor - Trusteed Programs (300)Exhibit B-2 300 - Combining Statement of Revenues, Expenditures and Changes in Fund Balances -
Special Revenue FundsFor the Fiscal Year Ended August 31, 2013
TexasSmall Business Product BlendedIncubator Fund Development Fund Component Units
(0588)* (0589)* (9999)* TotalsU/F (5881) U/F (5891) U/F (7010) (Exhibit II 300)
REVENUESInterest and Other Investment Income 125,078.06$ 292,425.19$ 5.34$ 417,508.59$ Other - - 202,014.07 202,014.07
Total Revenues 125,078.06 292,425.19 202,019.41 619,522.66
EXPENDITURESProfessional Fees and Services 10,138.89 12,673.60 1,237.00 24,049.49 Materials and Supplies - - 6,074.01 6,074.01 Public Assistance Payments - - 280,000.00 280,000.00 Other Expenditures 22,321.44 27,694.08 - 50,015.52
Total Expenditures 32,460.33 40,367.68 287,311.01 360,139.02
Excess (Deficiency) of Revenues over Expenditures 92,617.73 252,057.51 (85,291.60) 259,383.64
OTHER FINANCING SOURCES (USES)Transfer In 80,051.49 87,142.56 - 167,194.05 Transfer Out (159,126.19) (284,028.86) - (443,155.05)
Total Other Financing Sources (Uses) (79,074.70) (196,886.30) - (275,961.00)
Net Change in Fund Balances 13,543.03 55,171.21 (85,291.60) (16,577.36)
Fund Financial Statement - Fund BalancesFund Balances, September 1, 2012 20,747,182.56 25,778,344.67 121,156.47 46,646,683.70 Restatements - - - - Fund Balances - September 1, 2012, as Restated 20,747,182.56 25,778,344.67 121,156.47 46,646,683.70
Fund Balances, August 31, 2013 20,760,725.59$ 25,833,515.88$ 35,864.87$ 46,630,106.34$
* GAAP Fund is noted as (XXXX), USAS D23 U/F (XXXX)
84
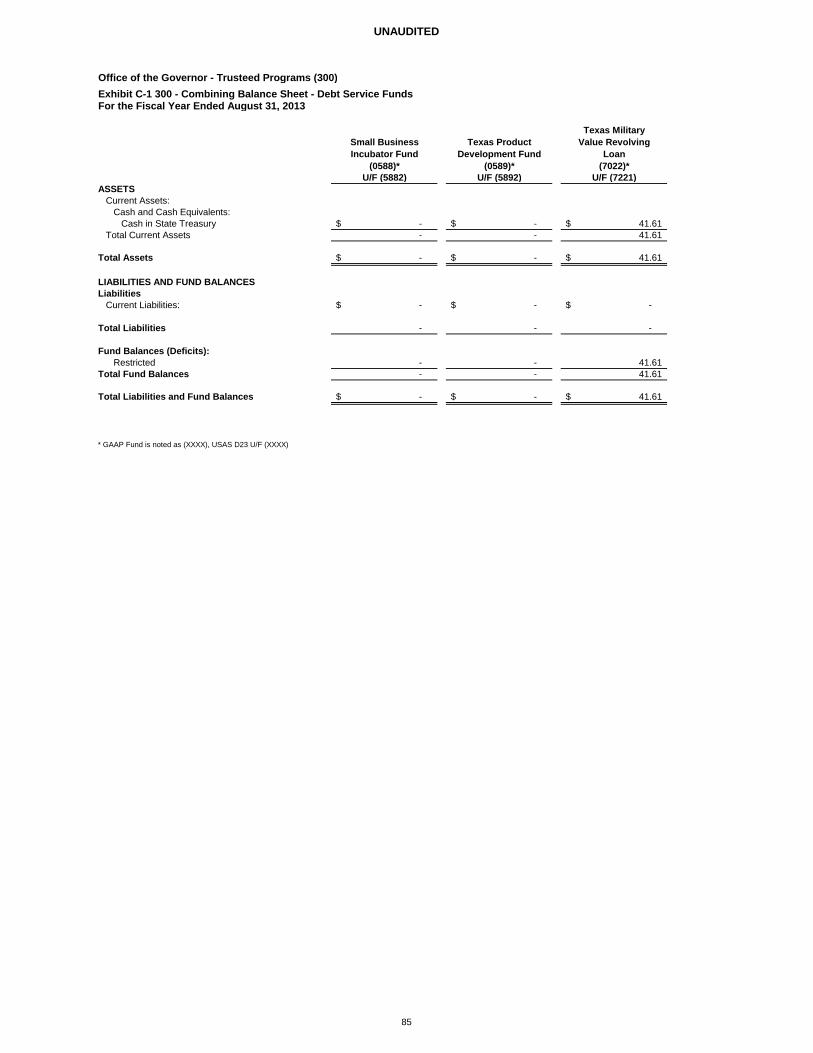
UNAUDITED
Office of the Governor - Trusteed Programs (300)Exhibit C-1 300 - Combining Balance Sheet - Debt Service FundsFor the Fiscal Year Ended August 31, 2013
Texas MilitarySmall Business Texas Product Value RevolvingIncubator Fund Development Fund Loan
(0588)* (0589)* (7022)*U/F (5882) U/F (5892) U/F (7221)
ASSETSCurrent Assets:
Cash and Cash Equivalents:Cash in State Treasury -$ -$ 41.61$
Total Current Assets - - 41.61
Total Assets -$ -$ 41.61$
LIABILITIES AND FUND BALANCESLiabilities
Current Liabilities: -$ -$ -$
Total Liabilities - - -
Fund Balances (Deficits):Restricted - - 41.61
Total Fund Balances - - 41.61
Total Liabilities and Fund Balances -$ -$ 41.61$
* GAAP Fund is noted as (XXXX), USAS D23 U/F (XXXX)
85
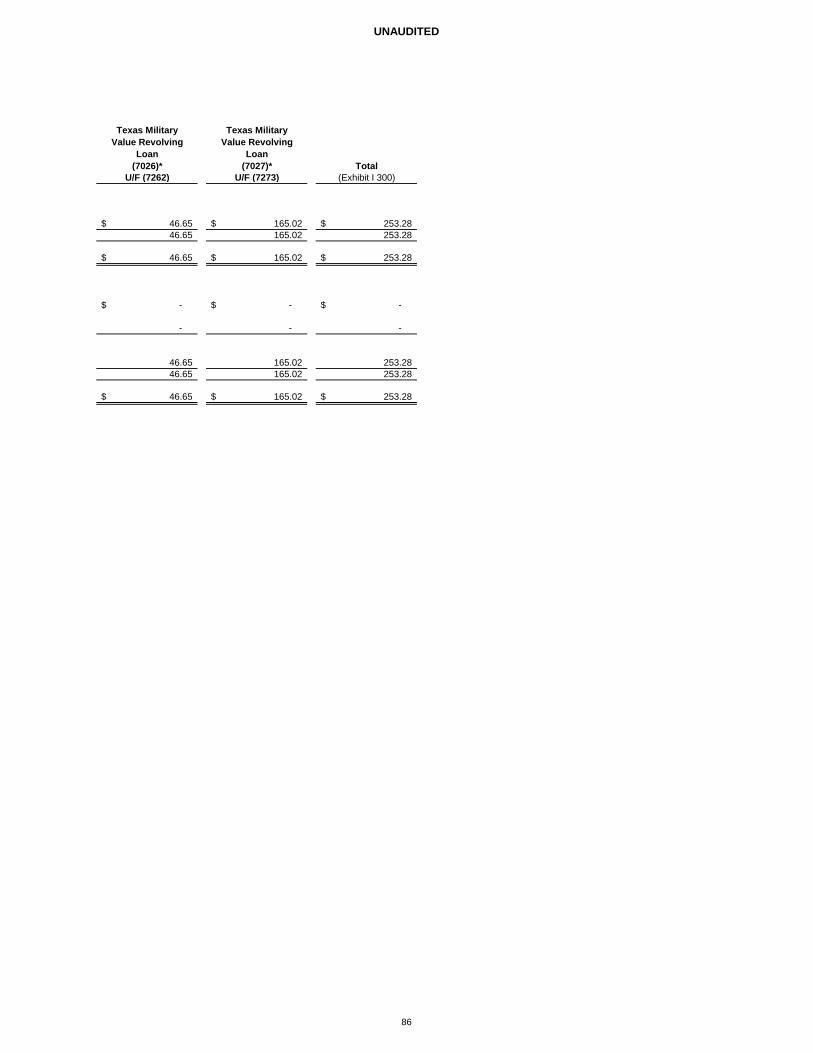
UNAUDITED
Texas Military Texas MilitaryValue Revolving Value Revolving
Loan Loan(7026)* (7027)* Total
U/F (7262) U/F (7273) (Exhibit I 300)
46.65$ 165.02$ 253.28$ 46.65 165.02 253.28
46.65$ 165.02$ 253.28$
-$ -$ -$
- - -
46.65 165.02 253.28 46.65 165.02 253.28
46.65$ 165.02$ 253.28$
86
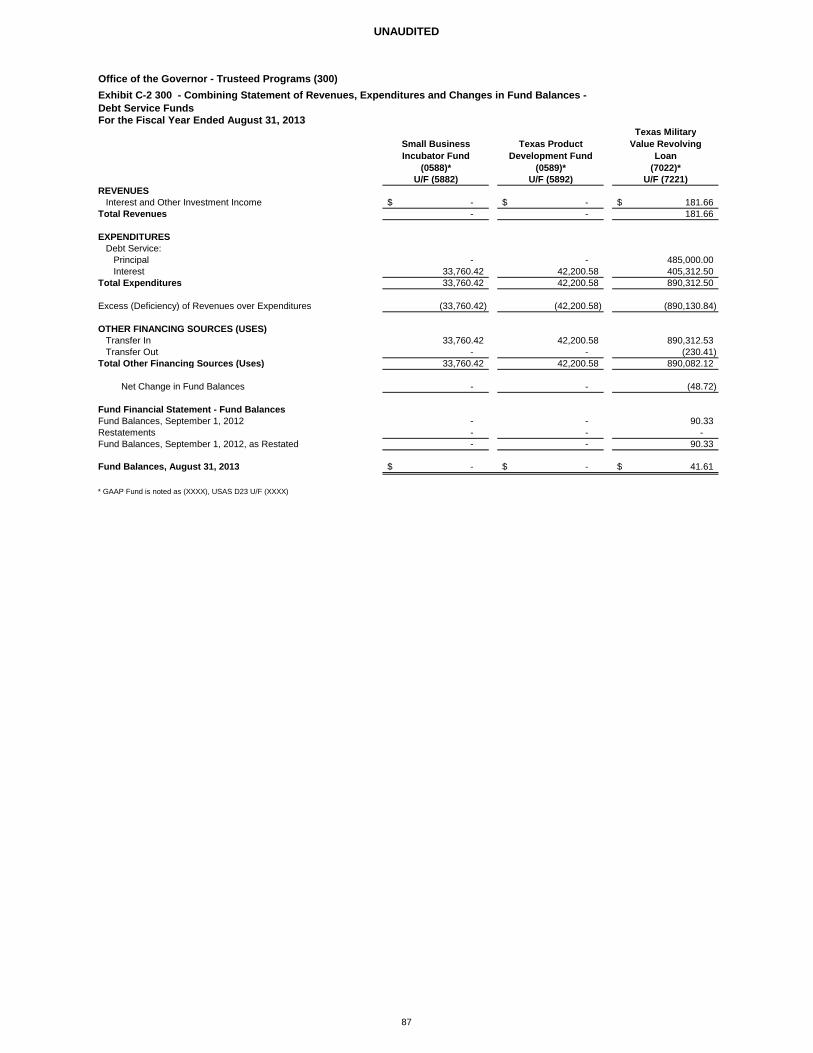
UNAUDITED
Office of the Governor - Trusteed Programs (300)Exhibit C-2 300 - Combining Statement of Revenues, Expenditures and Changes in Fund Balances -Debt Service FundsFor the Fiscal Year Ended August 31, 2013
Texas MilitarySmall Business Texas Product Value RevolvingIncubator Fund Development Fund Loan
(0588)* (0589)* (7022)*U/F (5882) U/F (5892) U/F (7221)
REVENUESInterest and Other Investment Income -$ -$ 181.66$
Total Revenues - - 181.66
EXPENDITURESDebt Service:
Principal - - 485,000.00 Interest 33,760.42 42,200.58 405,312.50
Total Expenditures 33,760.42 42,200.58 890,312.50
Excess (Deficiency) of Revenues over Expenditures (33,760.42) (42,200.58) (890,130.84)
OTHER FINANCING SOURCES (USES)Transfer In 33,760.42 42,200.58 890,312.53 Transfer Out - - (230.41)
Total Other Financing Sources (Uses) 33,760.42 42,200.58 890,082.12
Net Change in Fund Balances - - (48.72)
Fund Financial Statement - Fund BalancesFund Balances, September 1, 2012 - - 90.33 Restatements - - - Fund Balances, September 1, 2012, as Restated - - 90.33
Fund Balances, August 31, 2013 -$ -$ 41.61$
* GAAP Fund is noted as (XXXX), USAS D23 U/F (XXXX)
87
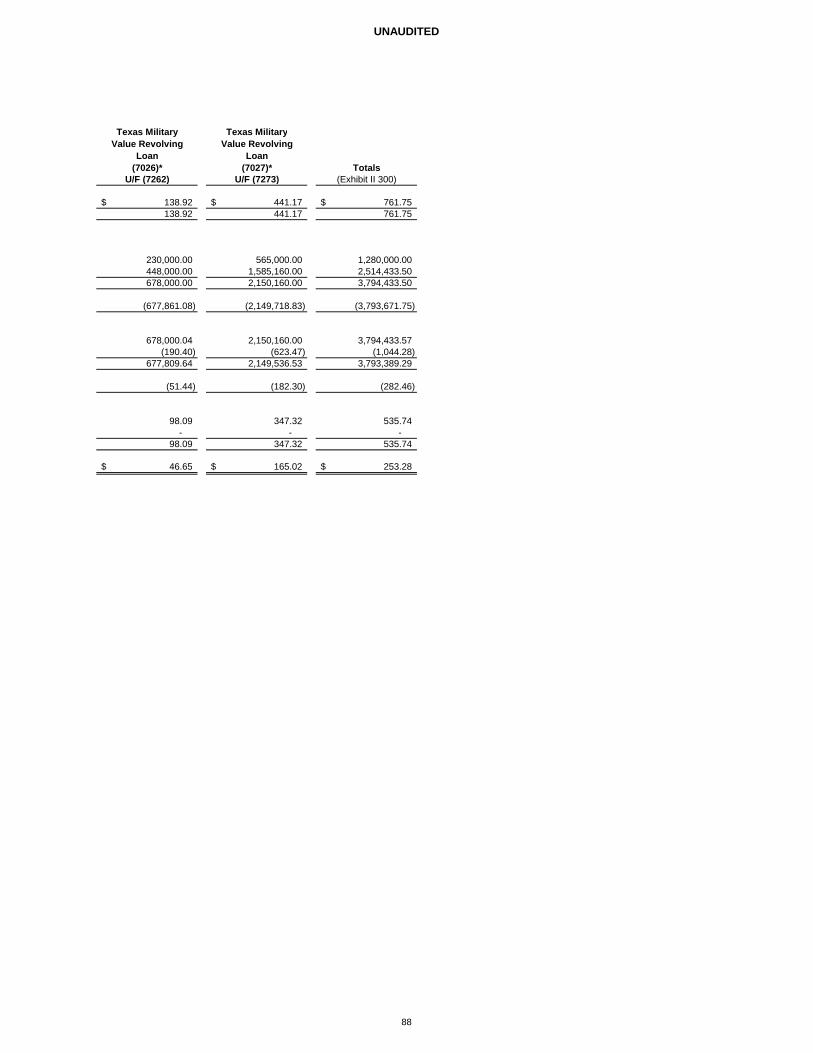
UNAUDITED
Texas Military Texas MilitaryValue Revolving Value Revolving
Loan Loan(7026)* (7027)* Totals
U/F (7262) U/F (7273) (Exhibit II 300)
138.92$ 441.17$ 761.75$ 138.92 441.17 761.75
230,000.00 565,000.00 1,280,000.00 448,000.00 1,585,160.00 2,514,433.50 678,000.00 2,150,160.00 3,794,433.50
(677,861.08) (2,149,718.83) (3,793,671.75)
678,000.04 2,150,160.00 3,794,433.57 (190.40) (623.47) (1,044.28)
677,809.64 2,149,536.53 3,793,389.29
(51.44) (182.30) (282.46)
98.09 347.32 535.74 - - -
98.09 347.32 535.74
46.65$ 165.02$ 253.28$
88
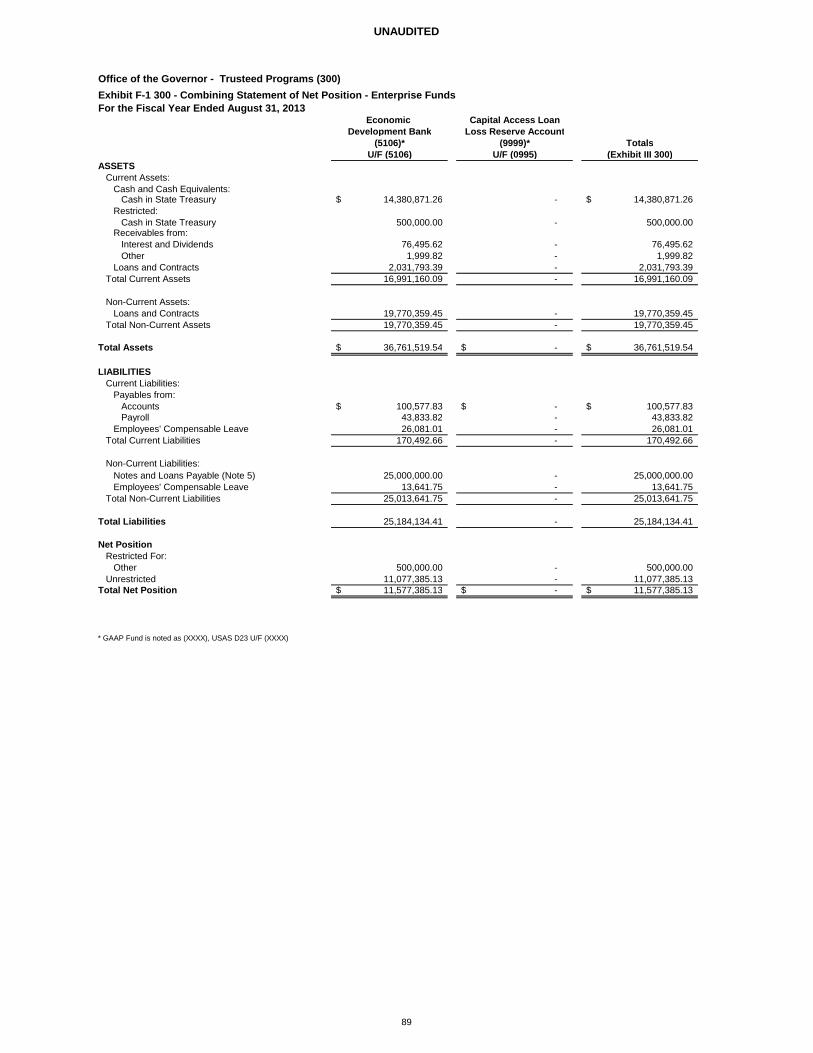
UNAUDITED
Office of the Governor - Trusteed Programs (300)Exhibit F-1 300 - Combining Statement of Net Position - Enterprise FundsFor the Fiscal Year Ended August 31, 2013
Economic Capital Access LoanDevelopment Bank Loss Reserve Account
(5106)* (9999)* TotalsU/F (5106) U/F (0995) (Exhibit III 300)
ASSETSCurrent Assets:
Cash and Cash Equivalents:Cash in State Treasury 14,380,871.26$ - 14,380,871.26$
Restricted: Cash in State Treasury 500,000.00 - 500,000.00
Receivables from:Interest and Dividends 76,495.62 - 76,495.62 Other 1,999.82 - 1,999.82
Loans and Contracts 2,031,793.39 - 2,031,793.39 Total Current Assets 16,991,160.09 - 16,991,160.09
Non-Current Assets:Loans and Contracts 19,770,359.45 - 19,770,359.45
Total Non-Current Assets 19,770,359.45 - 19,770,359.45
Total Assets 36,761,519.54$ -$ 36,761,519.54$
LIABILITIESCurrent Liabilities:
Payables from:Accounts 100,577.83$ -$ 100,577.83$ Payroll 43,833.82 - 43,833.82
Employees' Compensable Leave 26,081.01 - 26,081.01 Total Current Liabilities 170,492.66 - 170,492.66
Non-Current Liabilities:Notes and Loans Payable (Note 5) 25,000,000.00 - 25,000,000.00 Employees' Compensable Leave 13,641.75 - 13,641.75
Total Non-Current Liabilities 25,013,641.75 - 25,013,641.75
Total Liabilities 25,184,134.41 - 25,184,134.41
Net PositionRestricted For:
Other 500,000.00 - 500,000.00 Unrestricted 11,077,385.13 - 11,077,385.13
Total Net Position 11,577,385.13$ -$ 11,577,385.13$
* GAAP Fund is noted as (XXXX), USAS D23 U/F (XXXX)
89
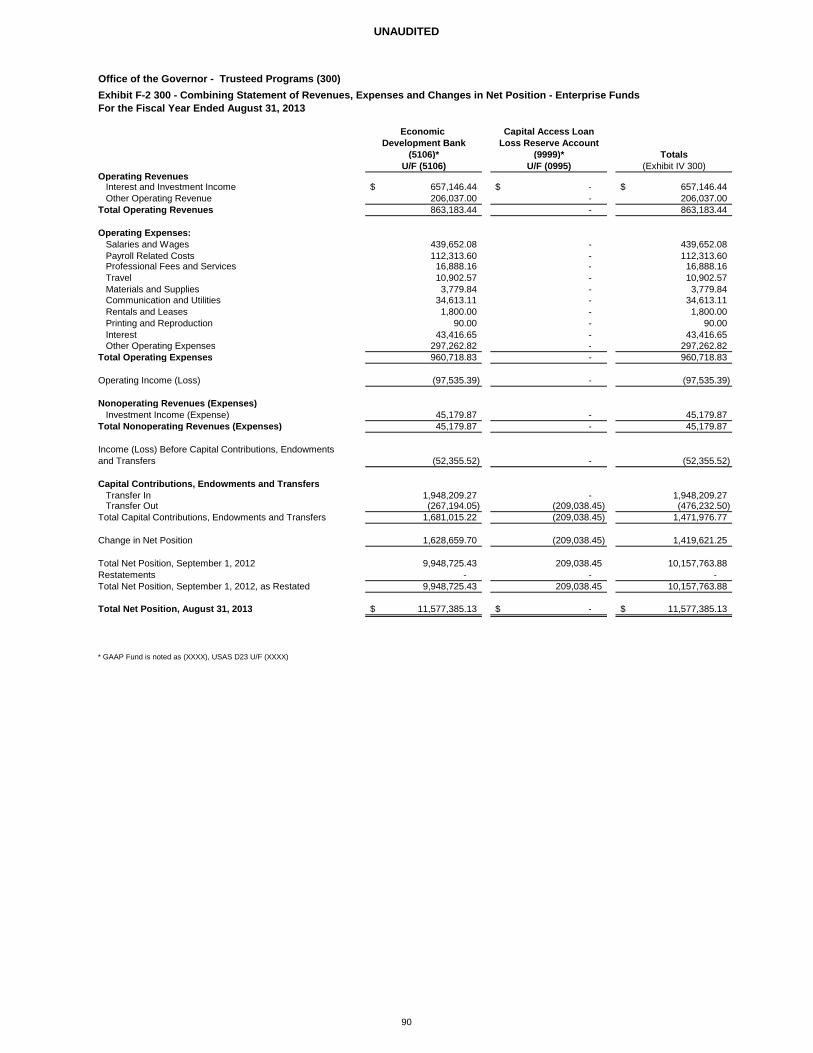
UNAUDITED
Office of the Governor - Trusteed Programs (300)Exhibit F-2 300 - Combining Statement of Revenues, Expenses and Changes in Net Position - Enterprise FundsFor the Fiscal Year Ended August 31, 2013
Economic Capital Access LoanDevelopment Bank Loss Reserve Account
(5106)* (9999)* TotalsU/F (5106) U/F (0995) (Exhibit IV 300)
Operating RevenuesInterest and Investment Income 657,146.44$ -$ 657,146.44$ Other Operating Revenue 206,037.00 - 206,037.00
Total Operating Revenues 863,183.44 - 863,183.44
Operating Expenses:Salaries and Wages 439,652.08 - 439,652.08 Payroll Related Costs 112,313.60 - 112,313.60 Professional Fees and Services 16,888.16 - 16,888.16 Travel 10,902.57 - 10,902.57 Materials and Supplies 3,779.84 - 3,779.84 Communication and Utilities 34,613.11 - 34,613.11 Rentals and Leases 1,800.00 - 1,800.00 Printing and Reproduction 90.00 - 90.00 Interest 43,416.65 - 43,416.65 Other Operating Expenses 297,262.82 - 297,262.82
Total Operating Expenses 960,718.83 - 960,718.83
Operating Income (Loss) (97,535.39) - (97,535.39)
Nonoperating Revenues (Expenses) Investment Income (Expense) 45,179.87 - 45,179.87
Total Nonoperating Revenues (Expenses) 45,179.87 - 45,179.87
Income (Loss) Before Capital Contributions, Endowmentsand Transfers (52,355.52) - (52,355.52)
Capital Contributions, Endowments and TransfersTransfer In 1,948,209.27 - 1,948,209.27 Transfer Out (267,194.05) (209,038.45) (476,232.50)
Total Capital Contributions, Endowments and Transfers 1,681,015.22 (209,038.45) 1,471,976.77
Change in Net Position 1,628,659.70 (209,038.45) 1,419,621.25
Total Net Position, September 1, 2012 9,948,725.43 209,038.45 10,157,763.88 Restatements - - - Total Net Position, September 1, 2012, as Restated 9,948,725.43 209,038.45 10,157,763.88
Total Net Position, August 31, 2013 11,577,385.13$ -$ 11,577,385.13$
* GAAP Fund is noted as (XXXX), USAS D23 U/F (XXXX)
90
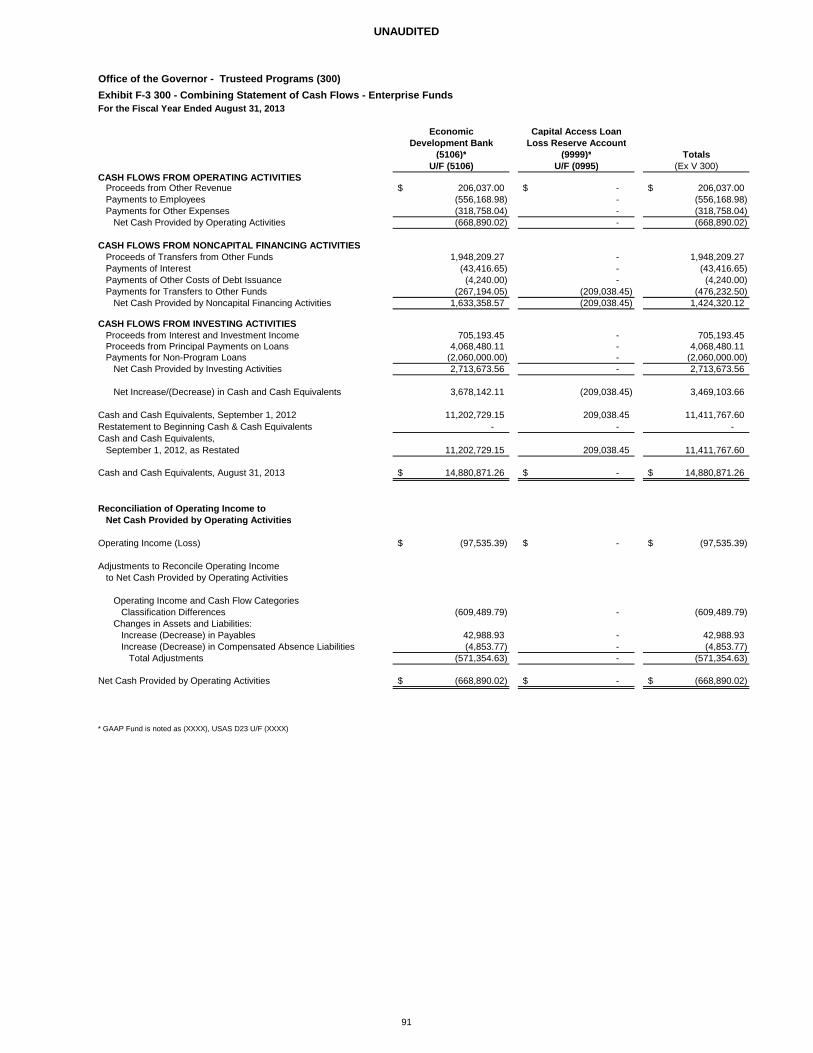
UNAUDITED
Office of the Governor - Trusteed Programs (300)Exhibit F-3 300 - Combining Statement of Cash Flows - Enterprise FundsFor the Fiscal Year Ended August 31, 2013
Economic Capital Access Loan
Development Bank Loss Reserve Account(5106)* (9999)* Totals
U/F (5106) U/F (0995) (Ex V 300)CASH FLOWS FROM OPERATING ACTIVITIES
Proceeds from Other Revenue 206,037.00$ -$ 206,037.00$ Payments to Employees (556,168.98) - (556,168.98) Payments for Other Expenses (318,758.04) - (318,758.04)
Net Cash Provided by Operating Activities (668,890.02) - (668,890.02)
CASH FLOWS FROM NONCAPITAL FINANCING ACTIVITIES Proceeds of Transfers from Other Funds 1,948,209.27 - 1,948,209.27 Payments of Interest (43,416.65) - (43,416.65) Payments of Other Costs of Debt Issuance (4,240.00) - (4,240.00) Payments for Transfers to Other Funds (267,194.05) (209,038.45) (476,232.50)
Net Cash Provided by Noncapital Financing Activities 1,633,358.57 (209,038.45) 1,424,320.12
CASH FLOWS FROM INVESTING ACTIVITIESProceeds from Interest and Investment Income 705,193.45 - 705,193.45 Proceeds from Principal Payments on Loans 4,068,480.11 - 4,068,480.11 Payments for Non-Program Loans (2,060,000.00) - (2,060,000.00)
Net Cash Provided by Investing Activities 2,713,673.56 - 2,713,673.56
Net Increase/(Decrease) in Cash and Cash Equivalents 3,678,142.11 (209,038.45) 3,469,103.66
Cash and Cash Equivalents, September 1, 2012 11,202,729.15 209,038.45 11,411,767.60 Restatement to Beginning Cash & Cash Equivalents - - - Cash and Cash Equivalents,
September 1, 2012, as Restated 11,202,729.15 209,038.45 11,411,767.60
Cash and Cash Equivalents, August 31, 2013 14,880,871.26$ -$ 14,880,871.26$
Reconciliation of Operating Income to Net Cash Provided by Operating Activities
Operating Income (Loss) (97,535.39)$ -$ (97,535.39)$
Adjustments to Reconcile Operating Income to Net Cash Provided by Operating Activities
Operating Income and Cash Flow Categories Classification Differences (609,489.79) - (609,489.79)
Changes in Assets and Liabilities:Increase (Decrease) in Payables 42,988.93 - 42,988.93 Increase (Decrease) in Compensated Absence Liabilities (4,853.77) - (4,853.77)
Total Adjustments (571,354.63) - (571,354.63)
Net Cash Provided by Operating Activities (668,890.02)$ -$ (668,890.02)$
* GAAP Fund is noted as (XXXX), USAS D23 U/F (XXXX)
91
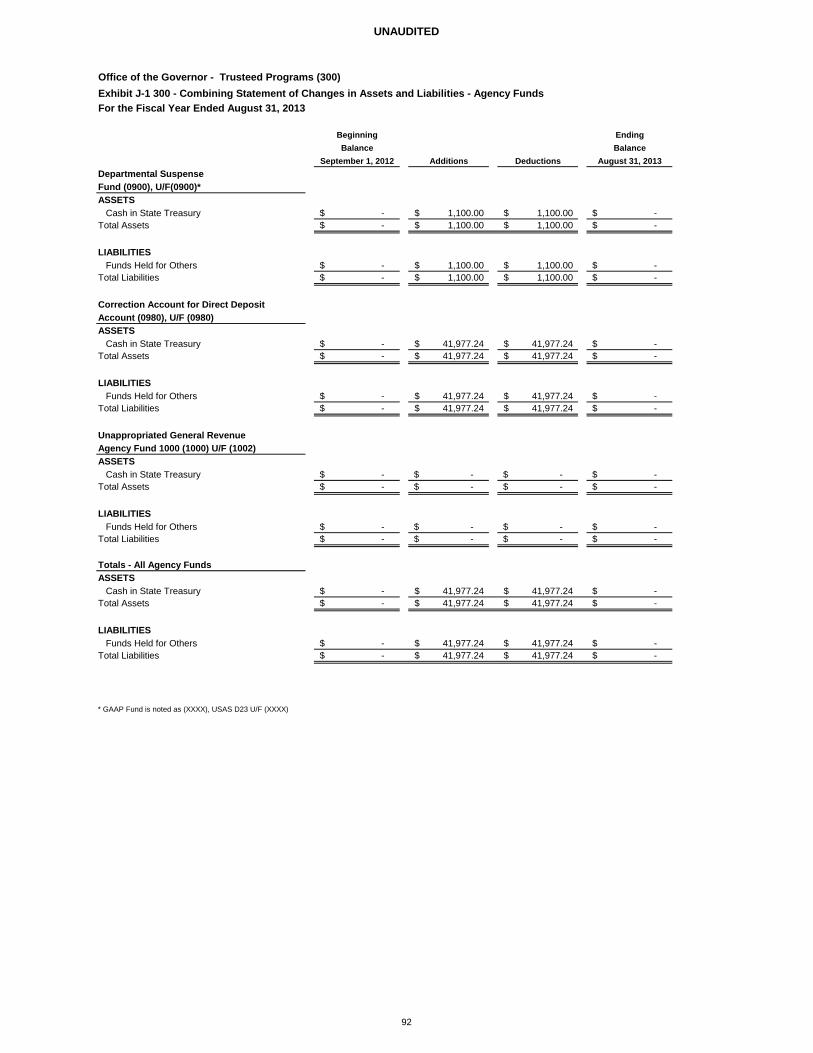
UNAUDITED
Office of the Governor - Trusteed Programs (300)Exhibit J-1 300 - Combining Statement of Changes in Assets and Liabilities - Agency FundsFor the Fiscal Year Ended August 31, 2013
Beginning EndingBalance Balance
September 1, 2012 Additions Deductions August 31, 2013Departmental Suspense Fund (0900), U/F(0900)*ASSETS
Cash in State Treasury -$ 1,100.00$ 1,100.00$ -$ Total Assets -$ 1,100.00$ 1,100.00$ -$
LIABILITIESFunds Held for Others -$ 1,100.00$ 1,100.00$ -$
Total Liabilities -$ 1,100.00$ 1,100.00$ -$
Correction Account for Direct DepositAccount (0980), U/F (0980)ASSETS
Cash in State Treasury -$ 41,977.24$ 41,977.24$ -$ Total Assets -$ 41,977.24$ 41,977.24$ -$
LIABILITIES Funds Held for Others -$ 41,977.24$ 41,977.24$ -$
Total Liabilities -$ 41,977.24$ 41,977.24$ -$
Unappropriated General RevenueAgency Fund 1000 (1000) U/F (1002)ASSETS
Cash in State Treasury -$ -$ -$ -$ Total Assets -$ -$ -$ -$
LIABILITIESFunds Held for Others -$ -$ -$ -$
Total Liabilities -$ -$ -$ -$
Totals - All Agency FundsASSETS
Cash in State Treasury -$ 41,977.24$ 41,977.24$ -$ Total Assets -$ 41,977.24$ 41,977.24$ -$
LIABILITIESFunds Held for Others -$ 41,977.24$ 41,977.24$ -$
Total Liabilities -$ 41,977.24$ 41,977.24$ -$
* GAAP Fund is noted as (XXXX), USAS D23 U/F (XXXX)
92
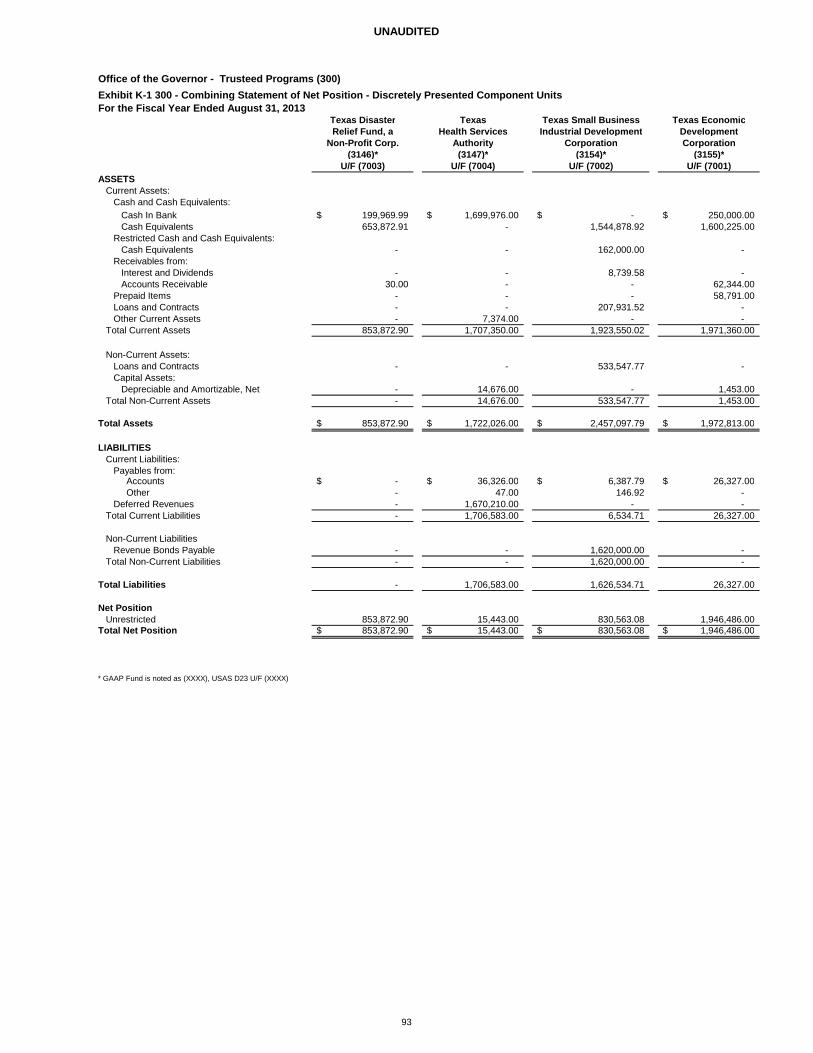
UNAUDITED
Office of the Governor - Trusteed Programs (300)Exhibit K-1 300 - Combining Statement of Net Position - Discretely Presented Component UnitsFor the Fiscal Year Ended August 31, 2013 Texas Disaster Texas Texas Small Business Texas Economic
Relief Fund, a Health Services Industrial Development DevelopmentNon-Profit Corp. Authority Corporation Corporation
(3146)* (3147)* (3154)* (3155)*U/F (7003) U/F (7004) U/F (7002) U/F (7001)
ASSETSCurrent Assets:
Cash and Cash Equivalents:Cash In Bank 199,969.99$ 1,699,976.00$ -$ 250,000.00$ Cash Equivalents 653,872.91 - 1,544,878.92 1,600,225.00
Restricted Cash and Cash Equivalents:Cash Equivalents - - 162,000.00 -
Receivables from:Interest and Dividends - - 8,739.58 - Accounts Receivable 30.00 - - 62,344.00
Prepaid Items - - - 58,791.00 Loans and Contracts - - 207,931.52 - Other Current Assets - 7,374.00 - -
Total Current Assets 853,872.90 1,707,350.00 1,923,550.02 1,971,360.00
Non-Current Assets:Loans and Contracts - - 533,547.77 - Capital Assets:
Depreciable and Amortizable, Net - 14,676.00 - 1,453.00 Total Non-Current Assets - 14,676.00 533,547.77 1,453.00
Total Assets 853,872.90$ 1,722,026.00$ 2,457,097.79$ 1,972,813.00$
LIABILITIESCurrent Liabilities: Payables from:
Accounts -$ 36,326.00$ 6,387.79$ 26,327.00$ Other - 47.00 146.92 - Deferred Revenues - 1,670,210.00 - -
Total Current Liabilities - 1,706,583.00 6,534.71 26,327.00
Non-Current LiabilitiesRevenue Bonds Payable - - 1,620,000.00 -
Total Non-Current Liabilities - - 1,620,000.00 -
Total Liabilities - 1,706,583.00 1,626,534.71 26,327.00
Net PositionUnrestricted 853,872.90 15,443.00 830,563.08 1,946,486.00
Total Net Position 853,872.90$ 15,443.00$ 830,563.08$ 1,946,486.00$
* GAAP Fund is noted as (XXXX), USAS D23 U/F (XXXX)
93
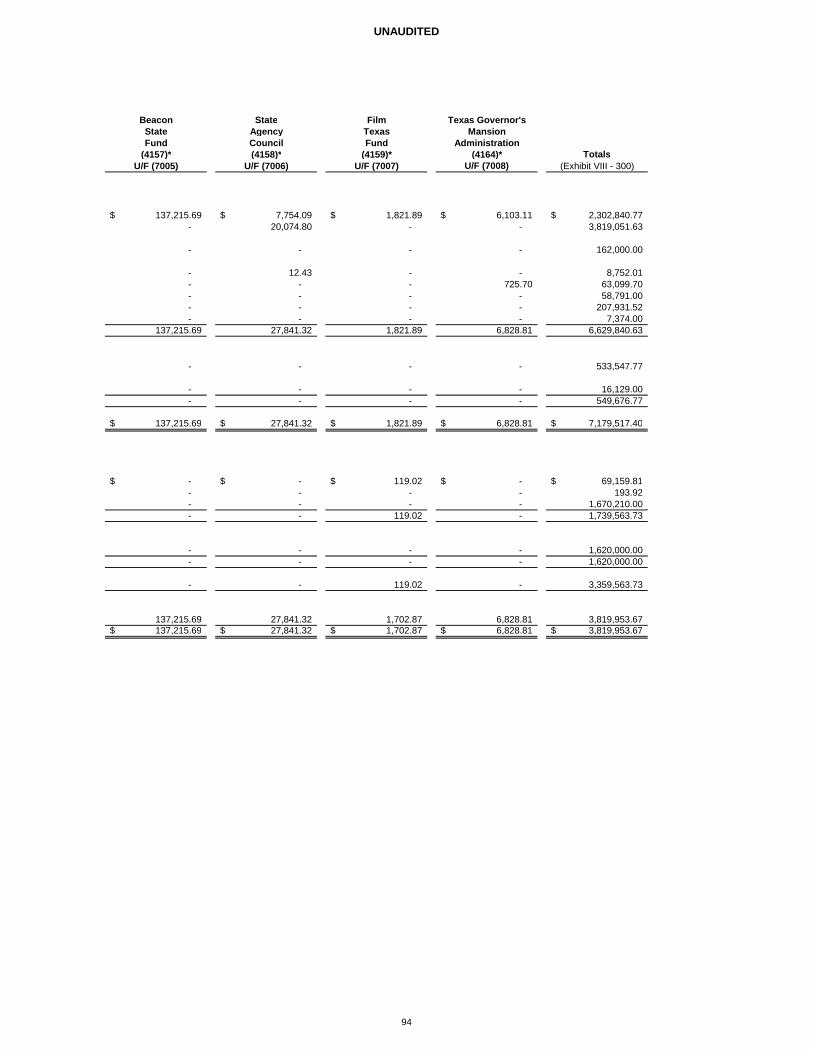
UNAUDITED
Beacon State Film Texas Governor'sState Agency Texas MansionFund Council Fund Administration
(4157)* (4158)* (4159)* (4164)* TotalsU/F (7005) U/F (7006) U/F (7007) U/F (7008) (Exhibit VIII - 300)
137,215.69$ 7,754.09$ 1,821.89$ 6,103.11$ 2,302,840.77$ - 20,074.80 - - 3,819,051.63
- - - - 162,000.00
- 12.43 - - 8,752.01 - - - 725.70 63,099.70 - - - - 58,791.00 - - - - 207,931.52 - - - - 7,374.00
137,215.69 27,841.32 1,821.89 6,828.81 6,629,840.63
- - - - 533,547.77
- - - - 16,129.00 - - - - 549,676.77
137,215.69$ 27,841.32$ 1,821.89$ 6,828.81$ 7,179,517.40$
-$ -$ 119.02$ -$ 69,159.81$ - - - - 193.92 - - - - 1,670,210.00 - - 119.02 - 1,739,563.73
- - - - 1,620,000.00 - - - - 1,620,000.00
- - 119.02 - 3,359,563.73
137,215.69 27,841.32 1,702.87 6,828.81 3,819,953.67 137,215.69$ 27,841.32$ 1,702.87$ 6,828.81$ 3,819,953.67$
94
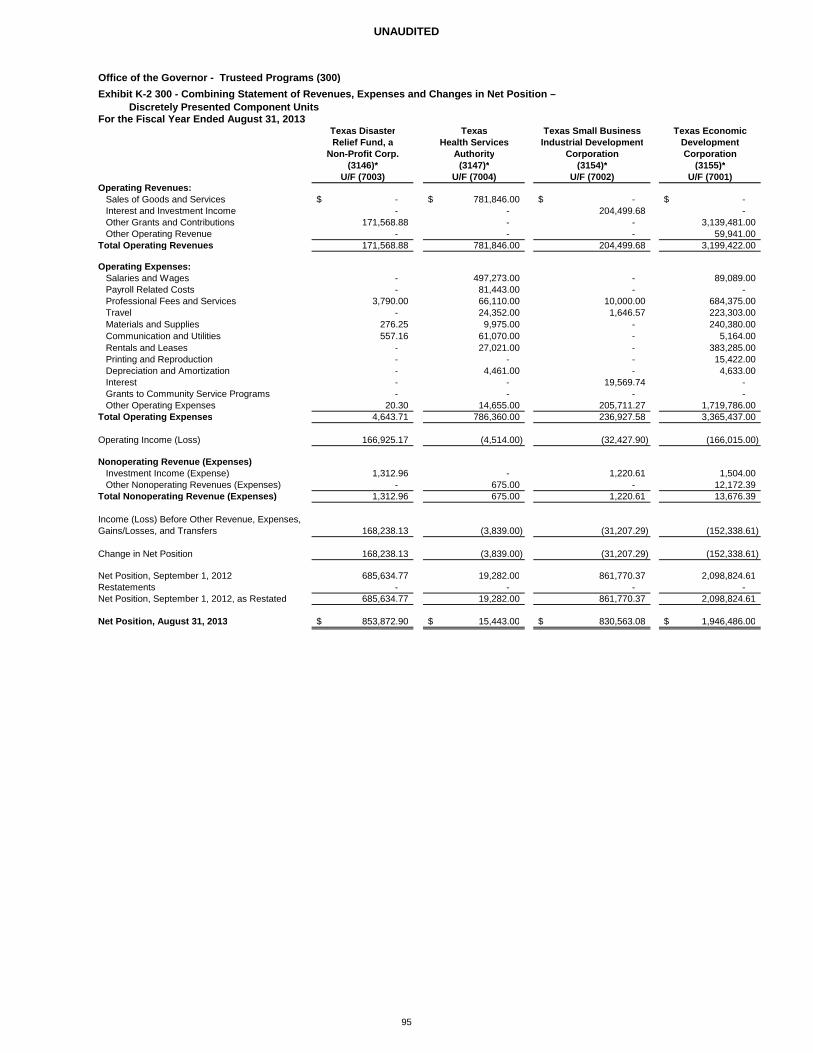
UNAUDITED
Office of the Governor - Trusteed Programs (300)Exhibit K-2 300 - Combining Statement of Revenues, Expenses and Changes in Net Position –
Discretely Presented Component UnitsFor the Fiscal Year Ended August 31, 2013
Texas Disaster Texas Texas Small Business Texas EconomicRelief Fund, a Health Services Industrial Development Development
Non-Profit Corp. Authority Corporation Corporation(3146)* (3147)* (3154)* (3155)*
U/F (7003) U/F (7004) U/F (7002) U/F (7001)Operating Revenues:
Sales of Goods and Services -$ 781,846.00$ -$ -$ Interest and Investment Income - - 204,499.68 - Other Grants and Contributions 171,568.88 - - 3,139,481.00 Other Operating Revenue - - - 59,941.00
Total Operating Revenues 171,568.88 781,846.00 204,499.68 3,199,422.00
Operating Expenses:Salaries and Wages - 497,273.00 - 89,089.00 Payroll Related Costs - 81,443.00 - - Professional Fees and Services 3,790.00 66,110.00 10,000.00 684,375.00 Travel - 24,352.00 1,646.57 223,303.00 Materials and Supplies 276.25 9,975.00 - 240,380.00 Communication and Utilities 557.16 61,070.00 - 5,164.00 Rentals and Leases - 27,021.00 - 383,285.00 Printing and Reproduction - - - 15,422.00 Depreciation and Amortization - 4,461.00 - 4,633.00 Interest - - 19,569.74 - Grants to Community Service Programs - - - - Other Operating Expenses 20.30 14,655.00 205,711.27 1,719,786.00
Total Operating Expenses 4,643.71 786,360.00 236,927.58 3,365,437.00
Operating Income (Loss) 166,925.17 (4,514.00) (32,427.90) (166,015.00)
Nonoperating Revenue (Expenses)Investment Income (Expense) 1,312.96 - 1,220.61 1,504.00 Other Nonoperating Revenues (Expenses) - 675.00 - 12,172.39
Total Nonoperating Revenue (Expenses) 1,312.96 675.00 1,220.61 13,676.39
Income (Loss) Before Other Revenue, Expenses,Gains/Losses, and Transfers 168,238.13 (3,839.00) (31,207.29) (152,338.61)
Change in Net Position 168,238.13 (3,839.00) (31,207.29) (152,338.61)
Net Position, September 1, 2012 685,634.77 19,282.00 861,770.37 2,098,824.61 Restatements - - - - Net Position, September 1, 2012, as Restated 685,634.77 19,282.00 861,770.37 2,098,824.61
Net Position, August 31, 2013 853,872.90$ 15,443.00$ 830,563.08$ 1,946,486.00$
95
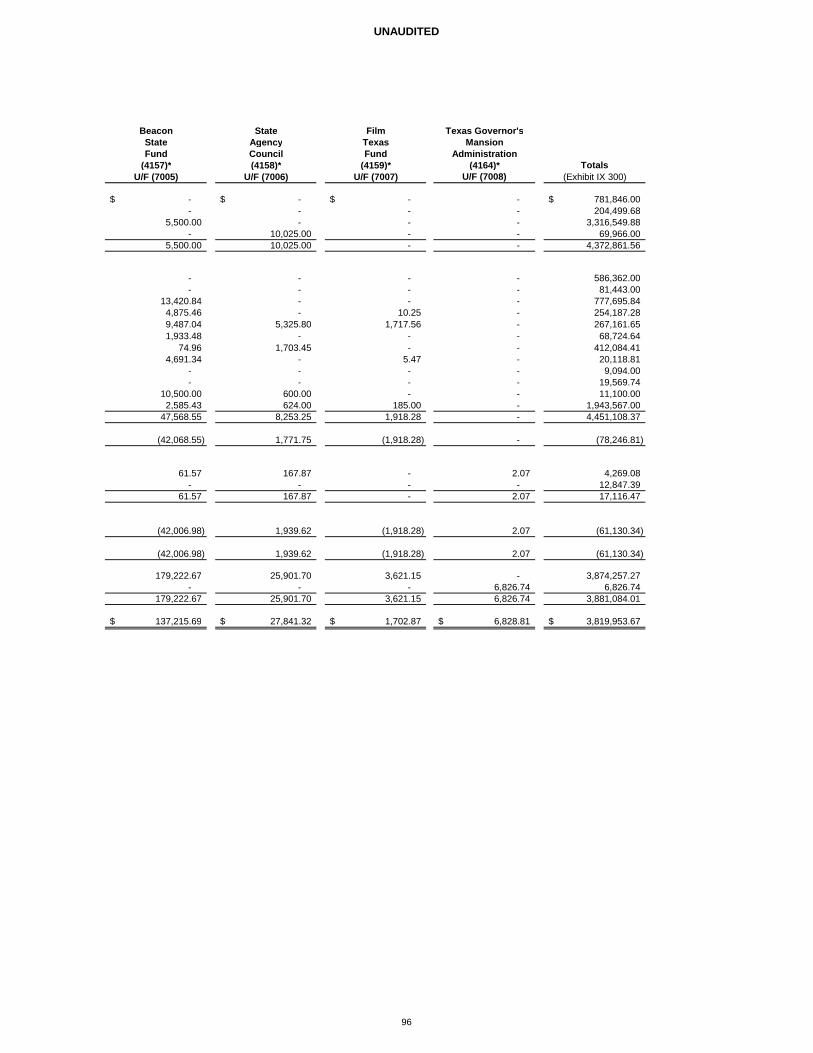
UNAUDITED
Beacon State Film Texas Governor'sState Agency Texas MansionFund Council Fund Administration
(4157)* (4158)* (4159)* (4164)* TotalsU/F (7005) U/F (7006) U/F (7007) U/F (7008) (Exhibit IX 300)
-$ -$ -$ - 781,846.00$ - - - - 204,499.68
5,500.00 - - - 3,316,549.88 - 10,025.00 - - 69,966.00
5,500.00 10,025.00 - - 4,372,861.56
- - - - 586,362.00 - - - - 81,443.00
13,420.84 - - - 777,695.84 4,875.46 - 10.25 - 254,187.28 9,487.04 5,325.80 1,717.56 - 267,161.65 1,933.48 - - - 68,724.64
74.96 1,703.45 - - 412,084.41 4,691.34 - 5.47 - 20,118.81
- - - - 9,094.00 - - - - 19,569.74
10,500.00 600.00 - - 11,100.00 2,585.43 624.00 185.00 - 1,943,567.00
47,568.55 8,253.25 1,918.28 - 4,451,108.37
(42,068.55) 1,771.75 (1,918.28) - (78,246.81)
61.57 167.87 - 2.07 4,269.08 - - - - 12,847.39
61.57 167.87 - 2.07 17,116.47
(42,006.98) 1,939.62 (1,918.28) 2.07 (61,130.34)
(42,006.98) 1,939.62 (1,918.28) 2.07 (61,130.34)
179,222.67 25,901.70 3,621.15 - 3,874,257.27 - - - 6,826.74 6,826.74
179,222.67 25,901.70 3,621.15 6,826.74 3,881,084.01
137,215.69$ 27,841.32$ 1,702.87$ 6,828.81$ 3,819,953.67$
96