Embed Size (px)
Citation preview
The New Zealand tax system and how it compares internationally
Prepared by Inland Revenue, October 2017

Contents
An overview of tax revenue...............................................................................................1Personal income tax...........................................................................................................3GST.................................................................................................................................... 6Company tax......................................................................................................................6Progressivity of the personal tax system...........................................................................8Effective marginal tax rates.............................................................................................10Administration and compliance........................................................................................12
An overview of tax revenue
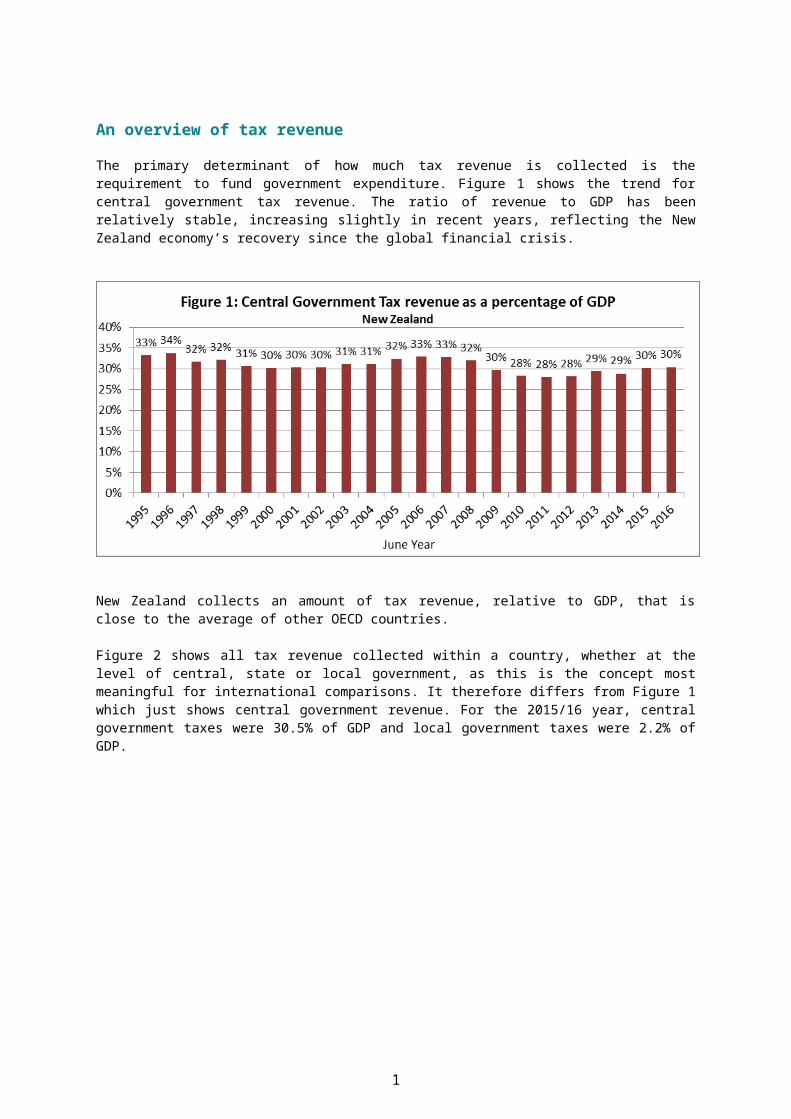
The primary determinant of how much tax revenue is collected is the requirement to fund government expenditure. Figure 1 shows the trend for central government tax revenue. The ratio of revenue to GDP has been relatively stable, increasing slightly in recent years, reflecting the New Zealand economy’s recovery since the global financial crisis.
New Zealand collects an amount of tax revenue, relative to GDP, that is close to the average of other OECD countries.
Figure 2 shows all tax revenue collected within a country, whether at the level of central, state or local government, as this is the concept most meaningful for international comparisons. It therefore differs from Figure 1 which just shows central government revenue. For the 2015/16 year, central government taxes were 30.5% of GDP and local government taxes were 2.2% of GDP.
1
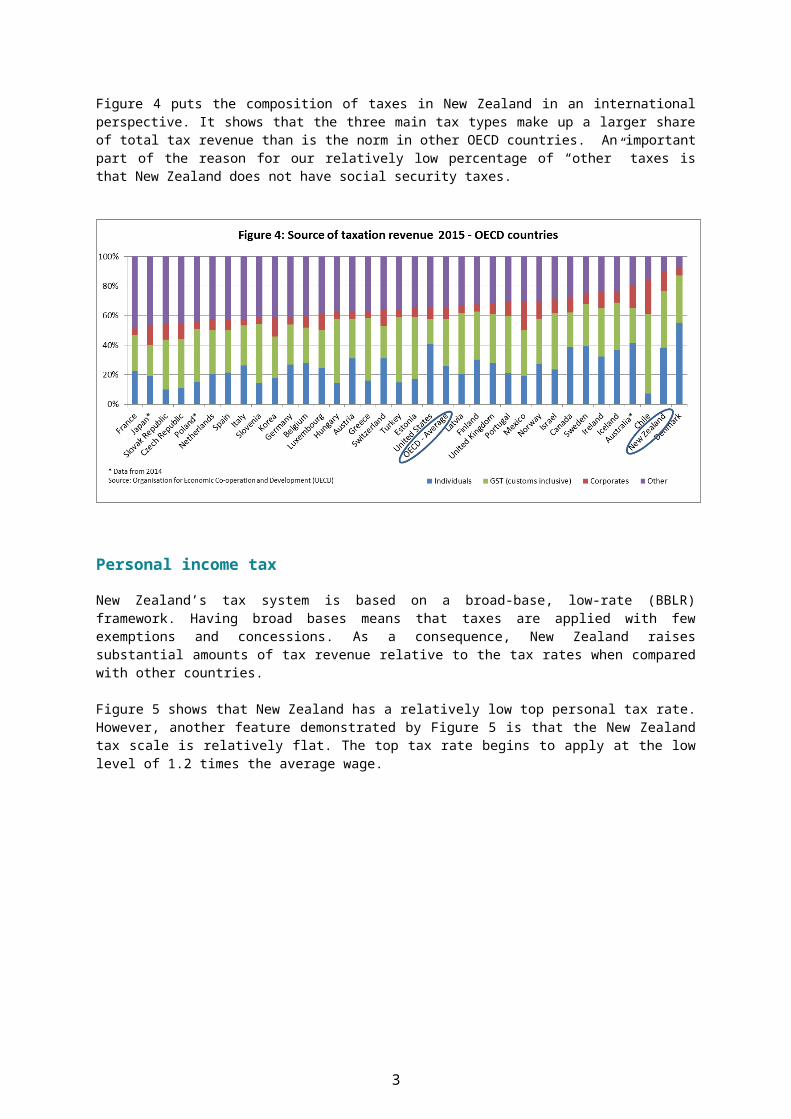
New Zealand collects a large share of revenue from its three major tax bases: personal income, company income and GST.
As shown in Figure 3, more than 90% of our tax revenue is collected from these or similar taxes (including resident and non-resident withholding taxes and fringe benefit tax). New Zealand does not have taxes on transactions or turnover, such as stamp duty and cheque duty, which international tax reviews have identified as being particularly inefficient.
Individual income tax, 40.4%
Company income tax, 14.8%
GST (including customs GST), 31.9%
FBT, 0.6%
Resident withholding tax, 2.9%Non-resident withholding
tax, 0.9%
Excise taxes & duties, 6.4%
Other, 2.1%
Figure 3: New Zealand source of taxation revenue 12 months to June 2016
Source: NZ Treasury
2
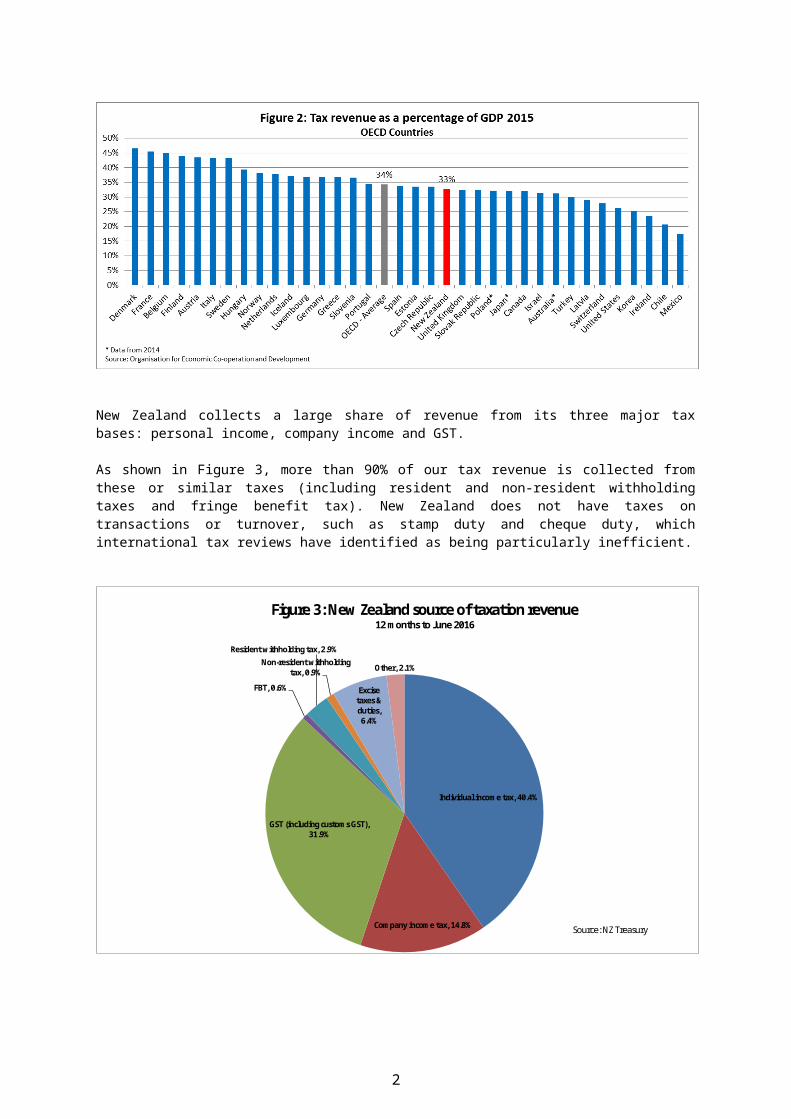
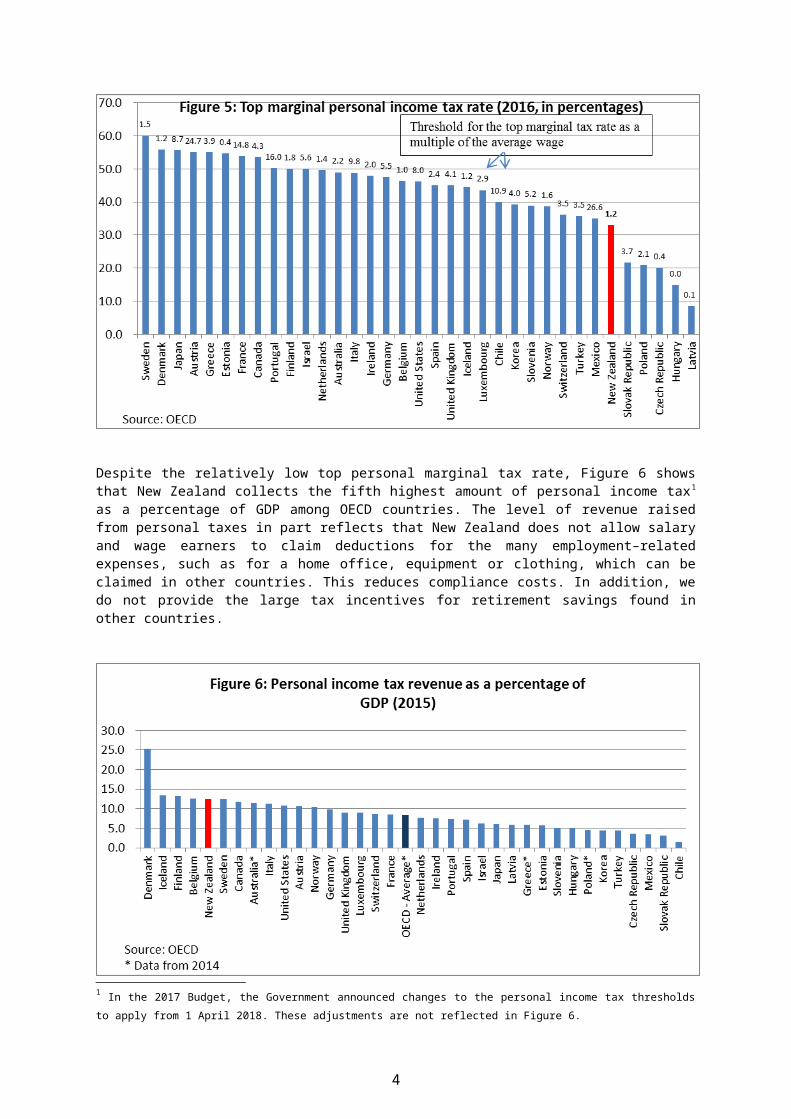
Figure 4 puts the composition of taxes in New Zealand in an international perspective. It shows that the three main tax types make up a larger share of total tax revenue than is the norm in other OECD countries. An important part of the reason for our relatively low percentage of “other” taxes is that New Zealand does not have social security taxes.
Personal income tax
New Zealand’s tax system is based on a broad-base, low-rate (BBLR) framework. Having broad bases means that taxes are applied with few exemptions and concessions. As a consequence, New Zealand raises substantial amounts of tax revenue relative to the tax rates when compared with other countries.
Figure 5 shows that New Zealand has a relatively low top personal tax rate. However, another feature demonstrated by Figure 5 is that the New Zealand tax scale is relatively flat. The top tax rate begins to apply at the low level of 1.2 times the average wage.
3
Despite the relatively low top personal marginal tax rate, Figure 6 shows that New Zealand collects the fifth highest amount of personal income tax1 as a percentage of GDP among OECD countries. The level of revenue raised from personal taxes in part reflects that New Zealand does not allow salary and wage earners to claim deductions for the many employment–related expenses, such as for a home office, equipment or clothing, which can be claimed in other countries. This reduces compliance costs. In addition, we do not provide the large tax incentives for retirement savings found in other countries.
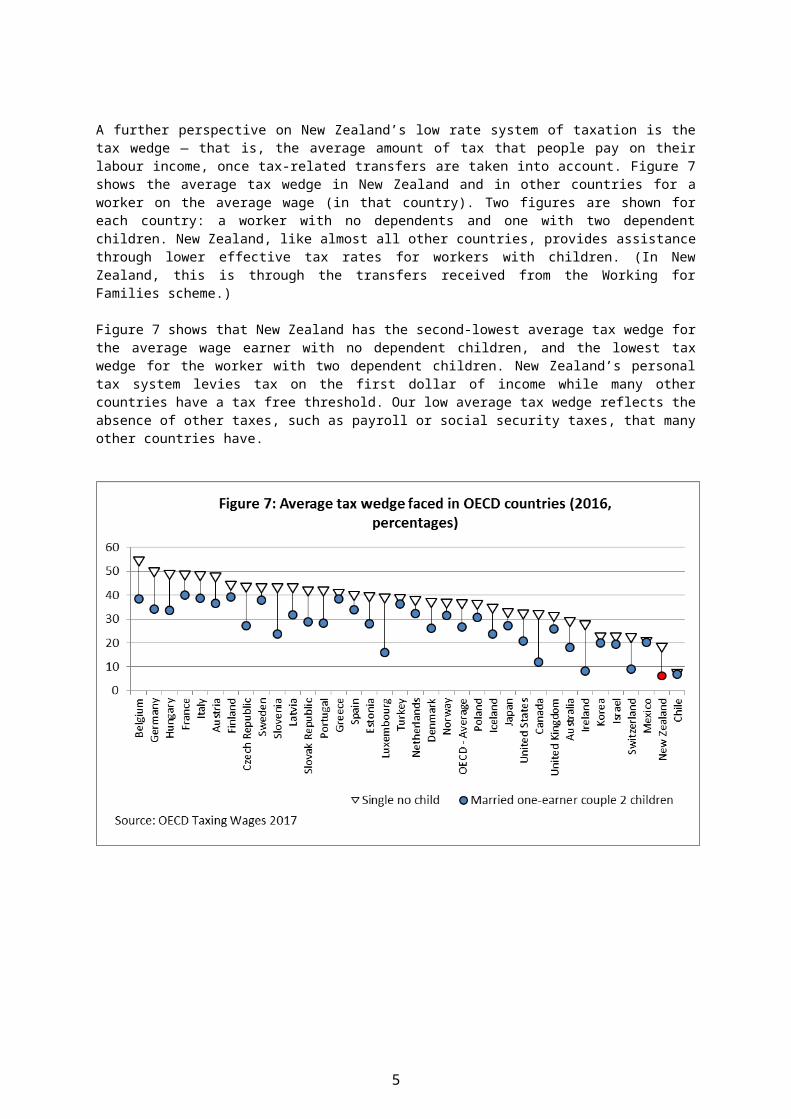
A further perspective on New Zealand’s low rate system of taxation is the tax wedge — that is, the average amount of tax that people pay on their labour income, once tax-1 In the 2017 Budget, the Government announced changes to the personal income tax thresholds to apply from 1 April 2018. These adjustments are not reflected in Figure 6.
4
related transfers are taken into account. Figure 7 shows the average tax wedge in New Zealand and in other countries for a worker on the average wage (in that country). Two figures are shown for each country: a worker with no dependents and one with two dependent children. New Zealand, like almost all other countries, provides assistance through lower effective tax rates for workers with children. (In New Zealand, this is through the transfers received from the Working for Families scheme.)
Figure 7 shows that New Zealand has the second-lowest average tax wedge for the average wage earner with no dependent children, and the lowest tax wedge for the worker with two dependent children. New Zealand’s personal tax system levies tax on the first dollar of income while many other countries have a tax free threshold. Our low average tax wedge reflects the absence of other taxes, such as payroll or social security taxes, that many other countries have.
5
GST
Despite having the sixth lowest rate of GST2, Figure 8 shows that New Zealand’s GST collections amounted to 10% of GDP, the highest proportion in the OECD. The very high amount of tax raised, despite New Zealand’s relatively low rate of tax, mainly reflects the fact that New Zealand’s GST base is particularly broad.
However, it also reflects a different tax treatment of government appropriations from other countries. Other OECD countries typically make government departments exempt from GST, whereas New Zealand levies GST on the Government’s appropriations to government departments, but allows departments to claim input credits on their purchases. If New Zealand adopted the more common treatment of making government departments exempt from GST, we estimate it would collect just under 8.5% of GDP in GST. This would mean that New Zealand would collect about the eighth highest amount of GST as a proportion of GDP for the 34 OECD countries shown in Figure 8.
Company tax
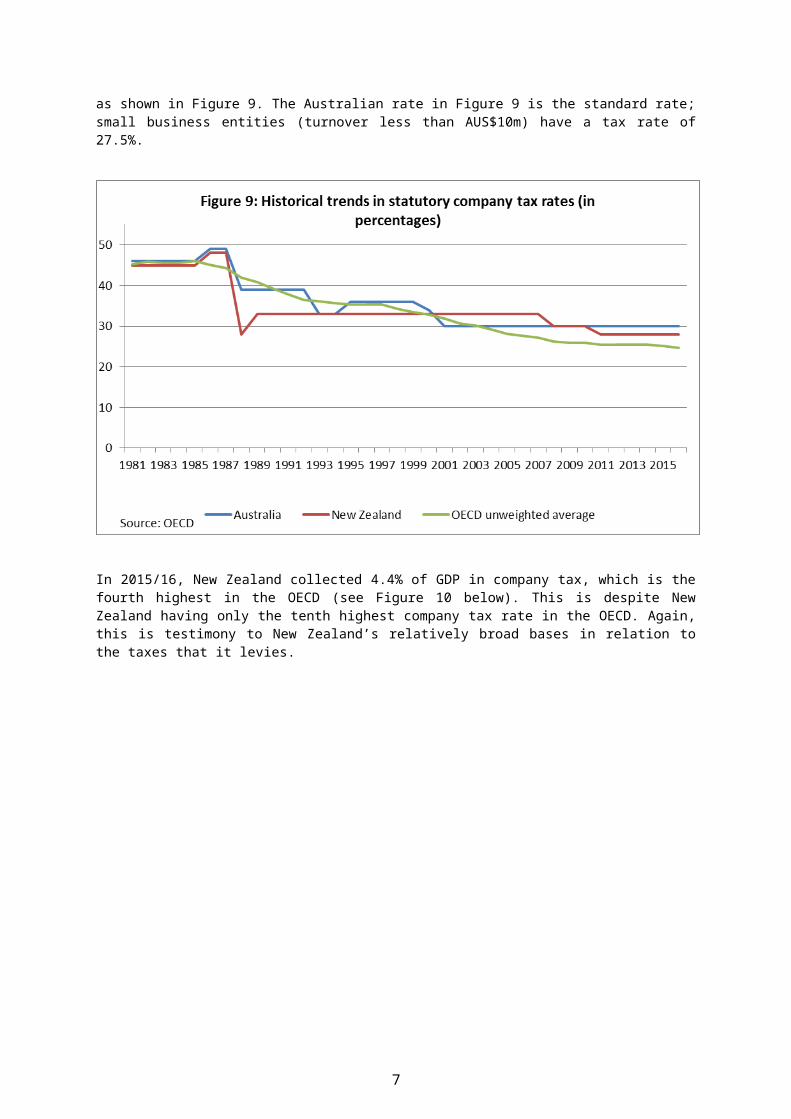
Company tax is New Zealand’s third main tax base. Despite cuts in 2008/09 and 2011/12 to New Zealand’s company tax rate, it is higher than the OECD average, reflecting the international trend to lower rates for company tax, as shown in Figure 9. The Australian rate in Figure 9 is the standard rate; small business entities (turnover less than AUS$10m) have a tax rate of 27.5%.
2 Figure 8 shows the statutory or headline rate for each country. This is the rate at which GST is levied, though in many countries other goods will be taxed at lower rates.
6

In 2015/16, New Zealand collected 4.4% of GDP in company tax, which is the fourth highest in the OECD (see Figure 10 below). This is despite New Zealand having only the tenth highest company tax rate in the OECD. Again, this is testimony to New Zealand’s relatively broad bases in relation to the taxes that it levies.
7
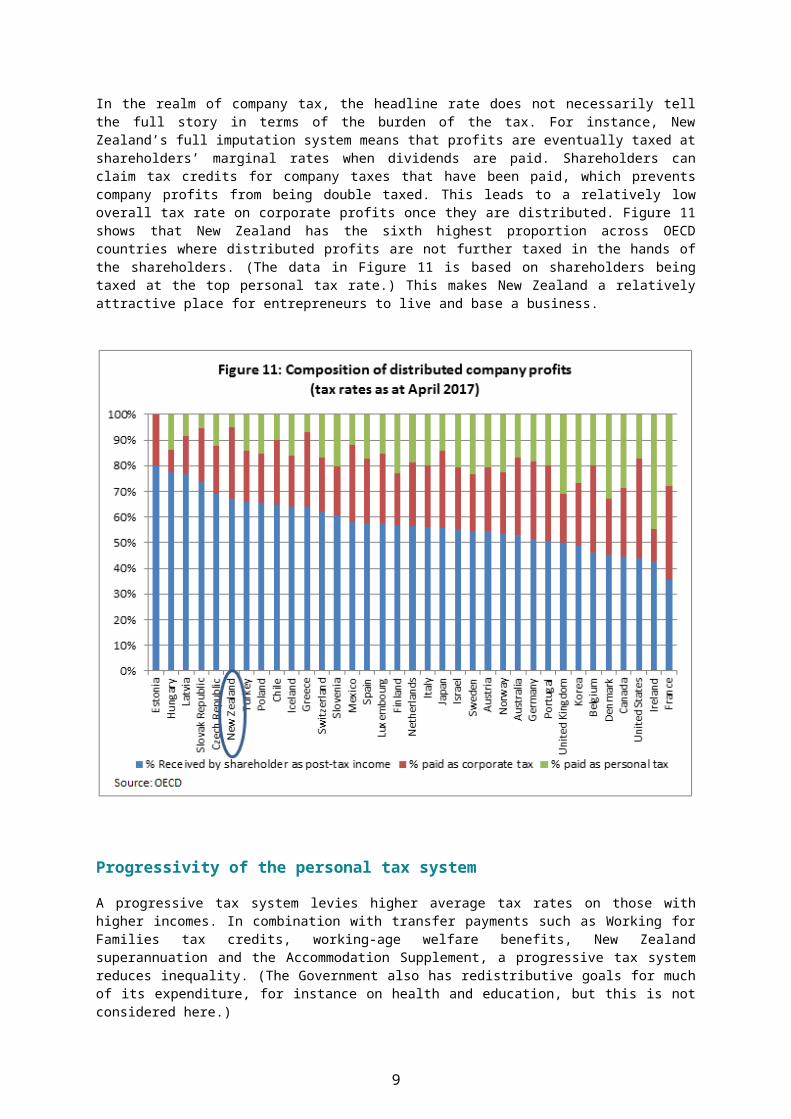
In the realm of company tax, the headline rate does not necessarily tell the full story in terms of the burden of the tax. For instance, New Zealand’s full imputation system means that profits are eventually taxed at shareholders’ marginal rates when dividends are paid. Shareholders can claim tax credits for company taxes that have been paid, which prevents company profits from being double taxed. This leads to a relatively low overall tax rate on corporate profits once they are distributed. Figure 11 shows that New Zealand has the sixth highest proportion across OECD countries where distributed profits are not further taxed in the hands of the shareholders. (The data in Figure 11 is based on shareholders being taxed at the top personal tax rate.) This makes New Zealand a relatively attractive place for entrepreneurs to live and base a business.
Progressivity of the personal tax system
A progressive tax system levies higher average tax rates on those with higher incomes. In combination with transfer payments such as Working for Families tax credits, working-age welfare benefits, New Zealand superannuation and the Accommodation Supplement, a progressive tax system reduces inequality. (The Government also has redistributive goals for much of its expenditure, for instance on health and education, but this is not considered here.)
The Ministry of Social Development3 has analysed the impact of taxes and transfers by household income deciles. It finds that households in the highest deciles pay the bulk of the income tax – the highest decile pays 35% of all income tax and the lowest four 3 Household incomes in New Zealand: Trends in indicators of inequality and hardship 1982 to 2016 Prepared by Bryan Perry, Ministry of Social Development, Wellington, July 2017
8

deciles each pay less than 5% of the income tax. Transfers have an opposite pattern – the lowest three deciles receiving a larger share of transfers than the other deciles.
The outcome is the lowest four deciles have a negative net tax liability, that is they receive more by way of government cash transfers than they pay in income tax. The net tax liability increases with each of deciles five to ten.
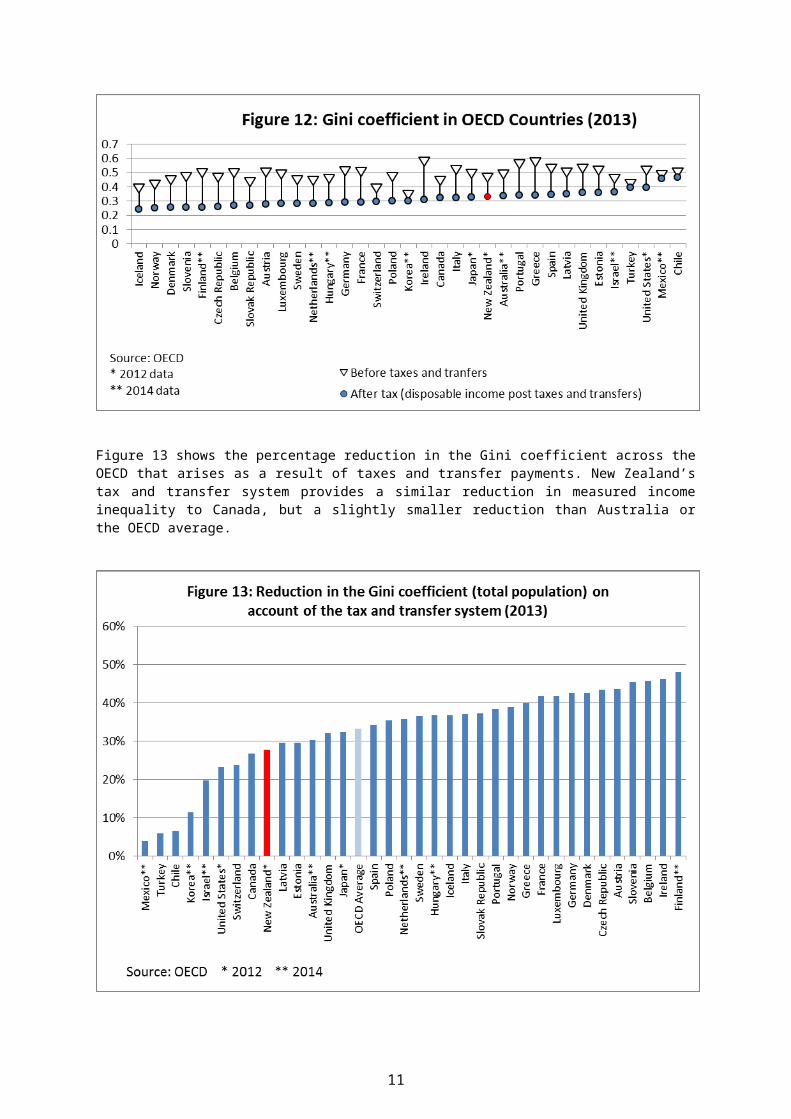
A common measure of income equality is the Gini coefficient. With Gini coefficients, the higher the measure, the more unequal the distribution. Figure 12 shows Gini coefficients before and after taxes and transfers. As with other countries, New Zealand’s Gini coefficient after taxes and transfers is lower than its pre-tax Gini coefficient. The tax and transfer system reduces inequality.
Figure 12 also shows that New Zealand’s Gini coefficient for disposable income for 2013 is very similar to Australia’s, and both are slightly above the OECD mean.4 This is the most recent year for which the OECD has comparable international data. The Ministry of Social Development has published more recent data for New Zealand (see footnote 4). This indicates that the New Zealand Gini coefficients have been largely constant since the mid-1990s, following a rise in the late 1980s and early 1990s.
Figure 13 shows the percentage reduction in the Gini coefficient across the OECD that arises as a result of taxes and transfer payments. New Zealand’s tax and transfer system provides a similar reduction in measured income inequality to Canada, but a slightly smaller reduction than Australia or the OECD average.
4 A much more extensive discussion of Gini coefficients and other measures of inequality is included in the Ministry of Social Development’s 2016 Household Incomes Report Ministry of Social Development, Wellington August 2016. There are minor differences in the methodologies used by the Ministry of Social Development and the OECD.
9
There are a number of reasons why Gini coefficients are an imperfect measure of inequality, especially in international comparisons. For instance, the way that unemployment benefits or pensions are calculated, or the impact of the dividend imputation regime, will affect measures of how the tax and transfer system affects inequality, without necessarily providing a good reflection of progressivity. For example, New Zealand superannuation is provided at the same level for all eligible superannuitants, whereas in many other countries the level of superannuation benefits is tied to lifetime contributions. This means that from a lifetime perspective, New Zealand superannuation is highly progressive even though, because superannuitants tend to have low incomes, retirement income payments in other countries appear to be doing more to redistribute income.
Another factor is how “income distributions” are calculated. In New Zealand, Ball and Creedy found that Gini coefficients based on consumption data do not display the increase in inequality from the 1980s to 2010s that is suggested by Gini coefficients based on incomes.5
Effective marginal tax rates
When additional income is earned, a household only gets to keep a fraction of it, because some part may go in tax and other parts may go in abating benefits. The effective marginal tax rate (EMTR) measures the total impact of taxes and loss of benefits when an additional dollar of income is earned. It adds together the extra tax paid and the loss of benefits.
High EMTRs can significantly reduce incentives to work more or save, because large increases in before-tax income will only result in small increases in disposable income. 5 Christopher Ball and John Creedy, “Inequality in New Zealand 1983/84 to 2013/14”, Working Paper 15/06 (Wellington: New Zealand Treasury, 2015)
10
This can have an adverse impact on economic efficiency, because it deters people from doing what would be sensible in the absence of tax.
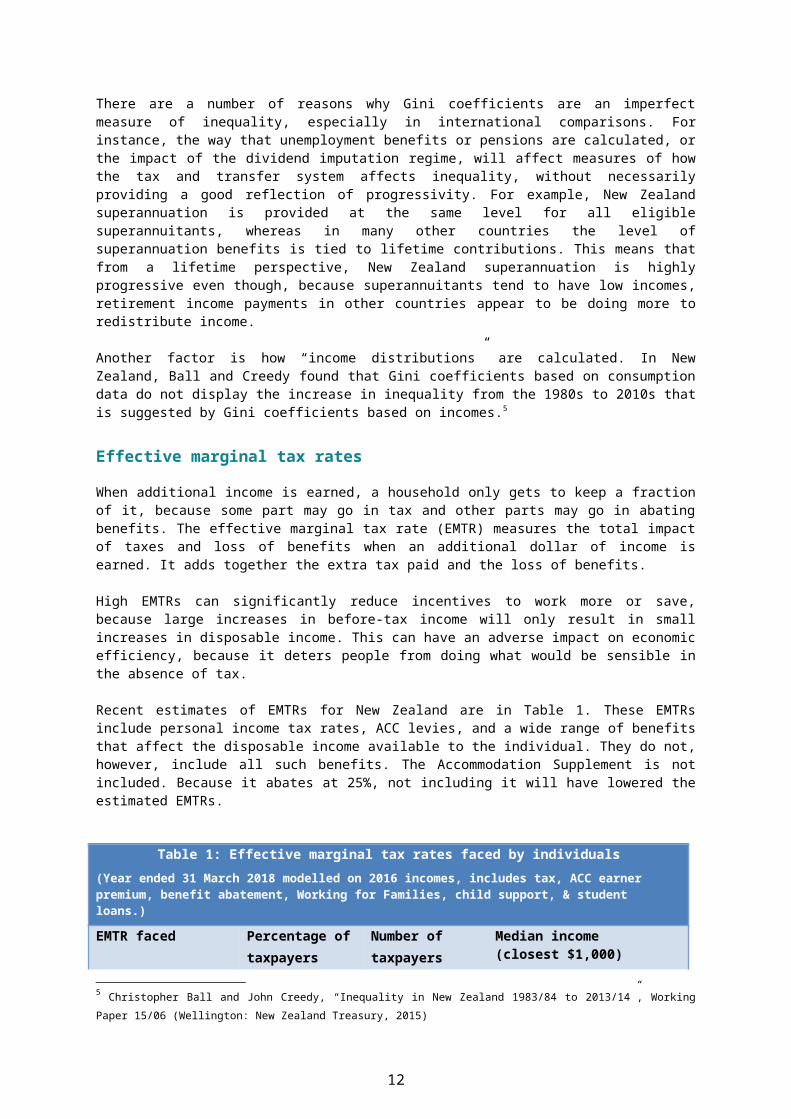
Recent estimates of EMTRs for New Zealand are in Table 1. These EMTRs include personal income tax rates, ACC levies, and a wide range of benefits that affect the disposable income available to the individual. They do not, however, include all such benefits. The Accommodation Supplement is not included. Because it abates at 25%, not including it will have lowered the estimated EMTRs.
Table 1: Effective marginal tax rates faced by individuals(Year ended 31 March 2018 modelled on 2016 incomes, includes tax, ACC earner premium, benefit abatement, Working for Families, child support, & student loans.)EMTR faced Percentage of
taxpayersNumber of taxpayers
Median income(closest $1,000)
Less than 30% 58.3% 2,127,950 $17,00030-39% 34.8% 1,272,350 $68,00040-49% 3.2% 115,350 $35,00050-59% 2.4% 88,900 $60,000More than 60% 1.3% 47,350 $22,000
Source: Inland Revenue
Although some taxpayers do face high EMTRs, they are the minority. Only 7% of taxpayers face EMTRS of over 40%, and only 4% face EMTRs of over 50%.6 Nonetheless, many of those who face very high EMTRs of over 60% have relatively low incomes.
Although New Zealand has high EMTRs for some, compared with other OECD countries, New Zealand has low EMTRs overall. The OECD has modelled EMTRs for different household types at different income levels. Table 2 shows the New Zealand EMTRs compared with the OECD average.
Table 2: Effective Marginal Tax RatesAs % of labour costs, by family type and wage level
Single no ch
67% of AW
Single no ch 100% of AW
Single no ch 167% of AW
Single 2 ch 67%
of AW
Married 2 ch
100-0 of AW
Married 2 ch
100-33% of AW
Married 2 ch
100-67% of AW
Married no ch
100-33% of AW
NZ 17.5 30.0 33.0 38.8 51.3 51.3 30.0 30.0OECD Av
41.8 44.6 47.0 45.0 44.3 44.4 43.8 43.2
Source: OECD Taxing Wages 2017
Administration and compliance
How easy it is for taxpayers to comply with their obligations, and how the tax system is administered, are important in determining the overall effectiveness of the tax system.
6 The figures reported in Table 1 include child support and student loan repayments. Child support payments involve meeting a parental obligation and a student loan repayment reduces a student’s future liability so these are less like taxes. Excluding student loan repayments and child support from the model would lower the EMTRs from those in Table 1.
11
There are few international comparisons of compliance costs that include New Zealand. Evans and Tran-Nam (2014)7 provide warnings about difficulties in making international comparisons, but conclude that compliance costs for New Zealand individuals and small-medium enterprises (SMEs) are likely to be low by international standards. They comment that New Zealand may be atypical in bucking the worldwide trend of increasing compliance costs for SMEs. They suggest that New Zealand’s key strengths are its very lean business environment and relatively simple tax legislation.
Their conclusions are supported by Inland Revenue’s most recent survey of SME compliance cost. Conducted in 2016, this found that the median annual time SMEs spent meeting their business tax obligations was 27 hours, a 25% reduction from the 36 hours reported in the previous 2013 survey. The amount they spent on external tax professionals—tax agents, lawyers, and accountants—also declined between the two surveys, and was 10% lower in 2016 compared with 2013. Survey respondents attributed the decline in compliance costs to better customer service by Inland Revenue, less paperwork and more digital filing, and improved online services.
The World Bank and PricewaterhouseCoopers regularly survey how easy it is for companies to pay taxes in countries around the world. The most recent survey was based on conditions that prevailed in 2015 and looked at how many hours it takes a representative company to file its taxes, and also how easy it is to undertake a series of post-filing tasks (such as claiming a GST refund or appealing a tax assessment). Table 3 shows New Zealand’s rank among OECD countries and across the 190 countries worldwide that were surveyed. The table also shows the overall result for ease of paying taxes—this factor includes the influence of the level of the corporate tax rate, which is not strictly a cost of compliance measure.
Table 3: Ease of paying company taxes (2015)New Zealand’s ranking under various measures
Ranking in the OECD Ranking in the WorldHours to file taxes 15th 50th
Ease of post-filing tasks 3rd 12th
Overall 4th 11th
Source: Price Waterhouse Coopers www.pwc.com/gx/en/paying-taxes/pdf/pwc-paying-taxes-2017.pdf
Consistency and predictability of the tax system are rated by the private sector as being particularly important. New Zealand has had a BBLR tax framework and a reasonably stable set of tax policies since the mid-1980s. Deloitte released the Asia Pacific Tax Complexity Survey Report in early 20178, in which 92% of survey respondents said that New Zealand’s tax system is consistent, and 87% that it is predictable. (Australia scores were 80% and 83%). These results contribute to New Zealand being perceived as a good place to invest.
Figure 14 provides a perspective on the administrative costs of revenue collection. It illustrates the average cost of collecting revenue for OECD countries, and suggests New Zealand is neither high nor low cost. International comparisons regarding administrative costs are difficult because revenue authorities have different responsibilities, which makes like-with-like comparisons difficult (for example, Inland Revenue administers KiwiSaver but does not collect excise duties). Also, intuitively, one would expect larger countries or more highly taxed countries to achieve lower ratios, irrespective of the underlying efficiency of the revenue-collection processes.7 Evans, C. and Tran-Nam, B., 2014, Tax compliance costs in New Zealand: An international comparative evaluation, Paper presented to the Conference Tax Administration in the 21st Century, Wellington, June 2014,
Available at http://nzpublicfinance.com/tax-administration-conference/.8 https://www2.deloitte.com/nz/asia-pac-tax-survey
12
13


![Wimax Compares[1]](https://img.pdfslide.us/doc/110x75/577d34821a28ab3a6b8e3164/wimax-compares1.jpg)