Embed Size (px)
Citation preview
International Seminar on Social Security
Employees’ Provident Fund, Malaysia
Best Practice in Smoothing the Tax Burden:
The New Zealand experience
13 July 2010
Michael Littlewood1
Retirement Policy and Research Centre
Economics Department Business School The University of Auckland Private Bag 92019 Auckland, New Zealand www.rprc.auckland.ac.nz
1 Michael Littlewood is a co-director of the Retirement Policy and Research Centre, the University of Auckland. The opinions expressed in this paper are those of the author and not necessarily of the RPRC.
2
Table of Contents
Abstract ............................................................................................................................. 3
1. Introduction ............................................................................................................. 4
1.1 New Zealand Superannuation .............................................................................................. 4
1.2 New Zealand Superannuation Fund ................................................................................... 4
1.3 Outline of this paper ................................................................................................................ 4
2. The background to the NZSF’s establishment ........................................................... 5
2.1 Ageing population ..................................................................................................................... 5
2.2 Change to funding of NZS ..................................................................................................... 5
2.3 Governance of the NZSF ........................................................................................................ 6
2.4 Investment processes ............................................................................................................. 7
2.5 Investment performance to date ........................................................................................ 8
2.5 Regular reviews ......................................................................................................................... 9
2.6 The 2009 Budget announcements .................................................................................... 10
3. The NZSF’s impact on the government’s balance sheet: the ‘hurdle rate’ ............... 12
3.1 ‘Best of class’ but... ................................................................................................................ 12
3.2 The investment decision ....................................................................................................... 13
3.3 The ‘hurdle rate’ ...................................................................................................................... 13
3.4 Actual return vs. the hurdle rate ...................................................................................... 14
3.5 Borrowing to invest ................................................................................................................ 16
4. The economics of an ageing population .................................................................. 19
4.1 Economic strength matters ................................................................................................. 19
4.2 How do we support the growing elderly population? ................................................ 19
4.3 Where does the money come from? ................................................................................ 20
4.4 Current workers pay twice .................................................................................................. 21
4.5 Long-term costs probably higher ...................................................................................... 21
4.6 Partial pre-funding or PAYG? .............................................................................................. 21
4.7 Where is the money invested? ........................................................................................... 24
4.8 The investment process........................................................................................................ 26
4.9 The lessons of history ........................................................................................................... 27
4.10 The impact on saving decisions ................................................................................... 27
4.11 Politicising the problem .................................................................................................... 27
5. Conclusion – partial pre-funding an ineffective distraction ..................................... 29
3
Abstract In 2001, the government established the New Zealand Superannuation Fund. This is intended to partially pre-fund the future costs of New Zealand Superannuation (NZS), the universal Tier 1 pension payable to all New Zealanders over age 65. The current National-led government suspended contributions in 2009 and has said it intends to resume those when economic conditions allow. That will probably not be before 2020. The legislation governing the Fund required the total cost of NZS, including current pensions, to be calculated on a smoothed basis so that more was contributed in the early years and less in the later. The excess was invested in financial markets on an arms-length basis by ‘Guardians’. An analysis in a ‘total accounting context’ would probably have precluded the Fund’s introduction in 2001 because the Fund is effectively 100% leveraged and taxpayers are unlikely to be adequately compensated for assuming that risk. Over the six years to 30 June 2009, the Fund diminished the net worth of the government by about $2.6 billion and, even if it fully recovers those losses, is unlikely to make any significant future contribution to the security of payments of New Zealand Superannuation. In fact, it raises financial risks for taxpayers and may increase the long-term cost of New Zealand Superannuation. Note: the analysis in sections 3 and 4 of this paper draws on Littlewood (2010).
4
1. Introduction 1.1 New Zealand Superannuation New Zealand Superannuation (NZS) is a universal taxable pension, funded largely on a ‘pay-as-you-go’ (PAYG) basis from general taxation. The gross married couple’s rate is set in section 16 of the New Zealand Superannuation and Retirement Income Act 2001 (the NZS Act) to be between 65-72.5% of average ‘ordinary time’ earnings. Following a ‘side agreement’ between the Labour and New Zealand First parties in 2005, the floor for after-tax NZS was raised to 66% of the after-tax average wage. Despite a change of government in 2008, that 66% floor remains. Rates of NZS vary depending on whether the person is married, single or living alone. From 1 April 2010, NZS at the married rate is $14,229 p.a. before tax for each of a couple, or $28,458 in total for the couple. NZS is taxed on an individual basis and is paid without regard for other income or assets. 1.2 New Zealand Superannuation Fund Section 37 of the NZS Act established the New Zealand Superannuation Fund (NZSF). It is the “property of the Crown” (section 40) and section 43 sets out the basis on which the Crown must contribute each year. In summary, the formula requires the annual payment to be the net total of all current pension payments (section 45) plus an amount that is derived from a rolling 40 year calculation, intended to partially smooth the amounts that future governments will need to meet the expected NZS outgo. The effect of this calculation is that the NZSF, in the years to 2009, received more than the net cost of current pensions. The excess has been invested by the Guardians of New Zealand Superannuation (the Guardians) a Crown Entity, established under section 48 of the NZS Act. 1.3 Outline of this paper This paper describes the establishment of the NZSF and its governance structure. It then discusses the issues connected with the partial pre-funding of NZS, or indeed any long-term government expenditure, in the context of the government’s overall budget and risk management. It concludes that pure PAYG funding is more appropriate for this type of benefit payment.
5
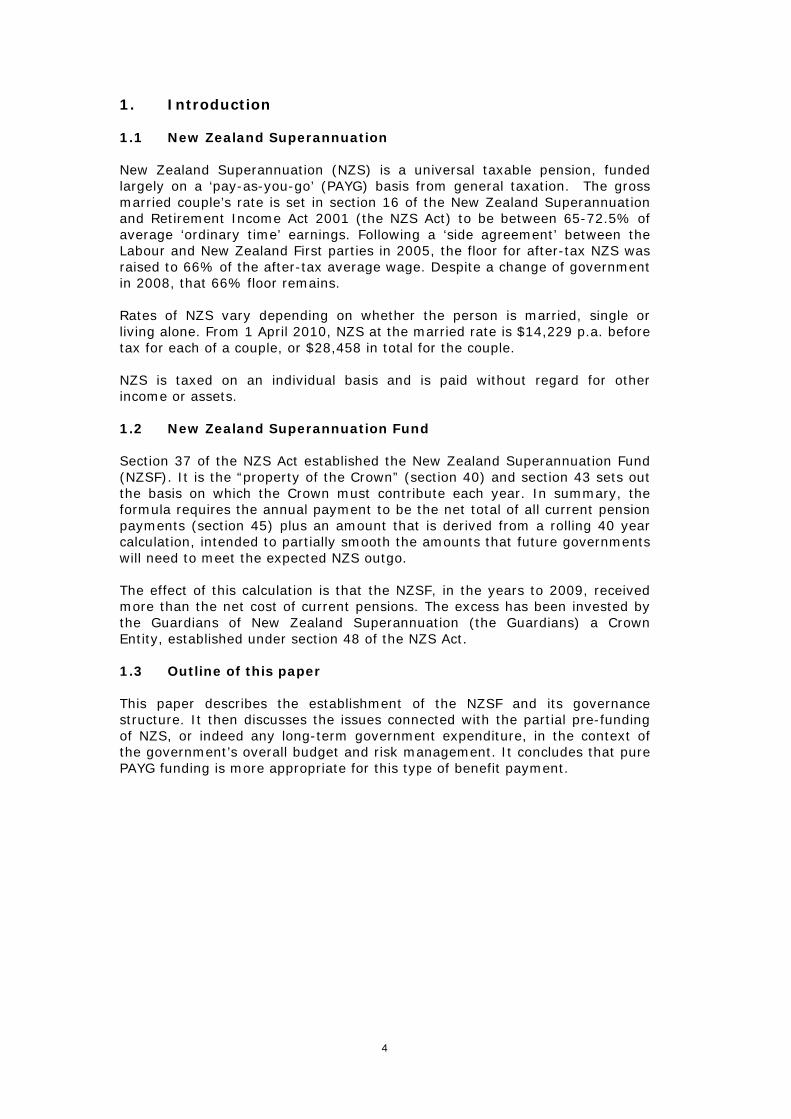
2. The background to the NZSF’s establishment 2.1 Ageing population New Zealand has an ageing population. By traditional measures, the number of ‘retired’ New Zealanders will increase over the next 50 years while those ‘working’ reduce. This is expected to lead to an approximate doubling of the ‘retired dependency’ ratio (the number of ‘retired’ who are ‘supported’ by each ‘working’ person2). As with many developed countries, the net cost of NZS will about double from its current 4.3% of GDP to about 8% by 2050 (The New Zealand Treasury, 2009a). 2.2 Change to funding of NZS When the NZSF was established, the government described the change to the financing of NZS as a "smoothed pay as you go" way of providing for NZS rather than the pure PAYG system that has been used to support the elderly for more than 100 years (see for example Cullen, 2000a). At establishment, the NZSF was expected to build and to reach, at its peak, 50% of GDP (about $89 billion in 2009 dollars). The “smoothed PAYG” model sees the government saving money for the future retirement needs of its citizens in much the same way as households do that for themselves. The question is whether this decision might be based on a fallacy of composition. It may be a good idea for a household to save specifically for its retirement income needs but it may not be a good idea either for all households to do that (the “paradox of thrift”); nor even for the government to do that on behalf of all New Zealand households. Later sections of this paper examine this possibility. When the NZSF was established, the funding objective was to build up the assets while the annual contributions exceeded the benefit outgo and then to gradually run those down over the period to the year 2100. Since then, the long-term objective seems to have changed as Figure 1 illustrates: Figure 1
(Source: The New Zealand Treasury, 2004)
2 The traditional definitions of the working and the retired are entirely age-based and are therefore unsatisfactory. Many between the internationally used ages of 16-64 for the ‘working’ population do not work while an increasing number over age 65 do. All those receiving income pay income tax, even the retired. NZS is supported by all government revenue, including income and expenditure taxes from the retired.
6
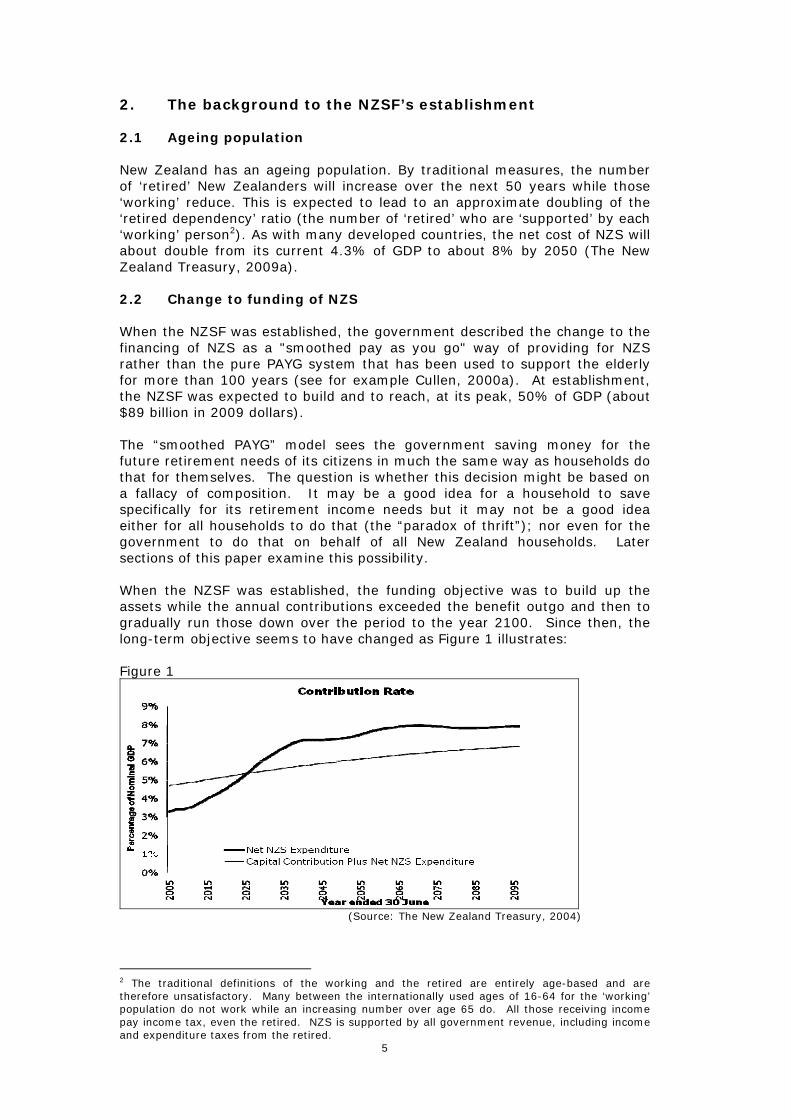
Figure 2 tracks the expected capital flows to and from the NZSF starting, again in 2005: Figure 2
(Source:The New Zealand Treasury, 2004)
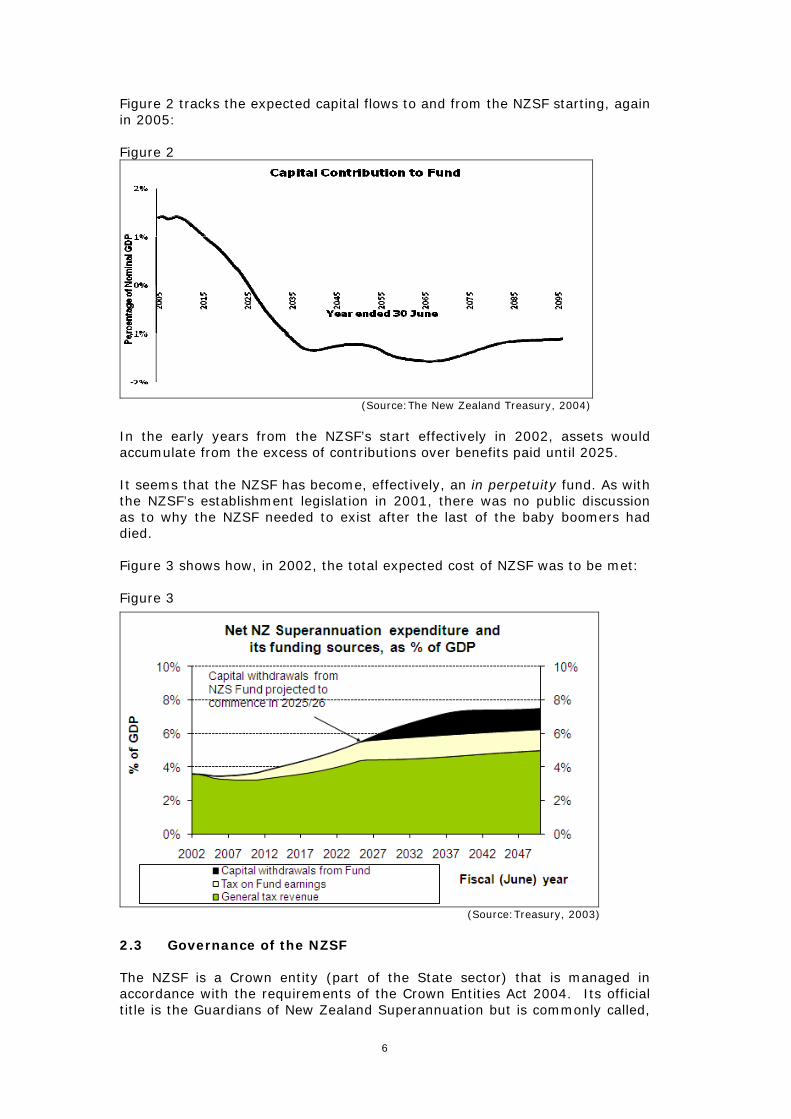
In the early years from the NZSF’s start effectively in 2002, assets would accumulate from the excess of contributions over benefits paid until 2025. It seems that the NZSF has become, effectively, an in perpetuity fund. As with the NZSF’s establishment legislation in 2001, there was no public discussion as to why the NZSF needed to exist after the last of the baby boomers had died. Figure 3 shows how, in 2002, the total expected cost of NZSF was to be met: Figure 3
(Source:Treasury, 2003)
2.3 Governance of the NZSF The NZSF is a Crown entity (part of the State sector) that is managed in accordance with the requirements of the Crown Entities Act 2004. Its official title is the Guardians of New Zealand Superannuation but is commonly called,
7
simply, the Guardians in recognition of the body responsible for its governance, the Board of the Guardians of New Zealand Superannuation. The Board (established under the NZS Act) comprises at least five, but no more than seven members appointed by the head of state on the recommendations of the Minister of Finance. The NZSF’s annual accounts are prepared and audited annually in accordance with ‘generally accepted accounting principles’ (GAAP), as are the entire accounts of the government itself. 2.4 Investment processes When the NZSF was established, the government went to some trouble to distance the Guardians from the political process. It was recognised that a large pool of assets in a relatively small market carried with it a considerable potential for political interference.
“The Guardians will run the Fund at arms-length from the government. The selection process will begin with a nominating committee. The Minister of Finance will make recommendations from the nominations provided. The Governor General will make the appointments. "Guardians will have to have a background in managing financial investments and will be required to manage the Fund independently of government and on a prudent, commercial basis in line with best practice portfolio management. "They will be subject to independent performance reviews at least every five years, with the first review to be conducted as soon as possible after 1 July, 2003. "This elaborate system of checks and balances has been inserted to protect the integrity and independence of the Fund.” (Cullen, 2001)
In the nine years of the NZSF’s existence, the arms-length process has worked reasonably well. That has not, however, prevented politicians from making ‘helpful’ suggestions as to what the Guardians should, or should not be doing with the money. It is almost inevitable that political pressures will influence the NZSF's investment strategy. For example, it seems that the NZSF will not be permitted by the current government to invest unlimited amounts overseas (see below). It is also constrained by government policy to invest in a manner consistent with “avoiding prejudice to New Zealand's reputation as a responsible member of the world community.”3 The government has, under section 64(1) of the NZS Act the right to “give directions to the Guardians regarding the Government's expectations as to the Fund's performance, including the Government's expectations as to risk and return.” However, any such direction must not be “... inconsistent with the Guardians' duty to invest the Fund on a prudent, commercial basis, in accordance with section 58.” This requires the Guardians to adopt a “prudent commercial basis” consistent with “best practice” and “maximising return without undue risk”.
3 The NZS Act, section 58(2)(c).
8
Despite the apparent independence of the Guardians, there is significant potential for the politicisation of the investment process. The current government’s inexplicable pressure to require the NZSF to increase its exposure to New Zealand investments is a case in point. The announcements by the National Party in opposition were less constrained than those now being made in government. For example, National suggested the following as part of its 2008 election policy:
“National will:
• Amend the New Zealand Superannuation and Retirement Income Act 2001 to allow the Minister of Finance to give a direction to the Guardians of the Fund in relation to the proportion of the fund which is to be allocated to New Zealand.
• Set the target of at least 40% of the Super Fund to be invested in New Zealand.
• Maintain the independence of the Guardians of the Fund in every other regard. The Guardians will continue to invest on a prudent, commercial basis, by making their own decisions about what asset classes to invest in, in line with best-practice portfolio management. In particular, the Guardians will determine the appropriate rate at which to increase their investment in New Zealand to 40%, taking into account their need to manage their overall risk profile, the availability of quality investments, and the impact of increased investment on local markets.” (National Party of New Zealand, 2008)
The 2009 National-led government has drawn back from that commitment:
“The Guardians will actively consider New Zealand-based investments as part of their role of managing the Fund prudently and commercially.” (English, 2009, page 26)
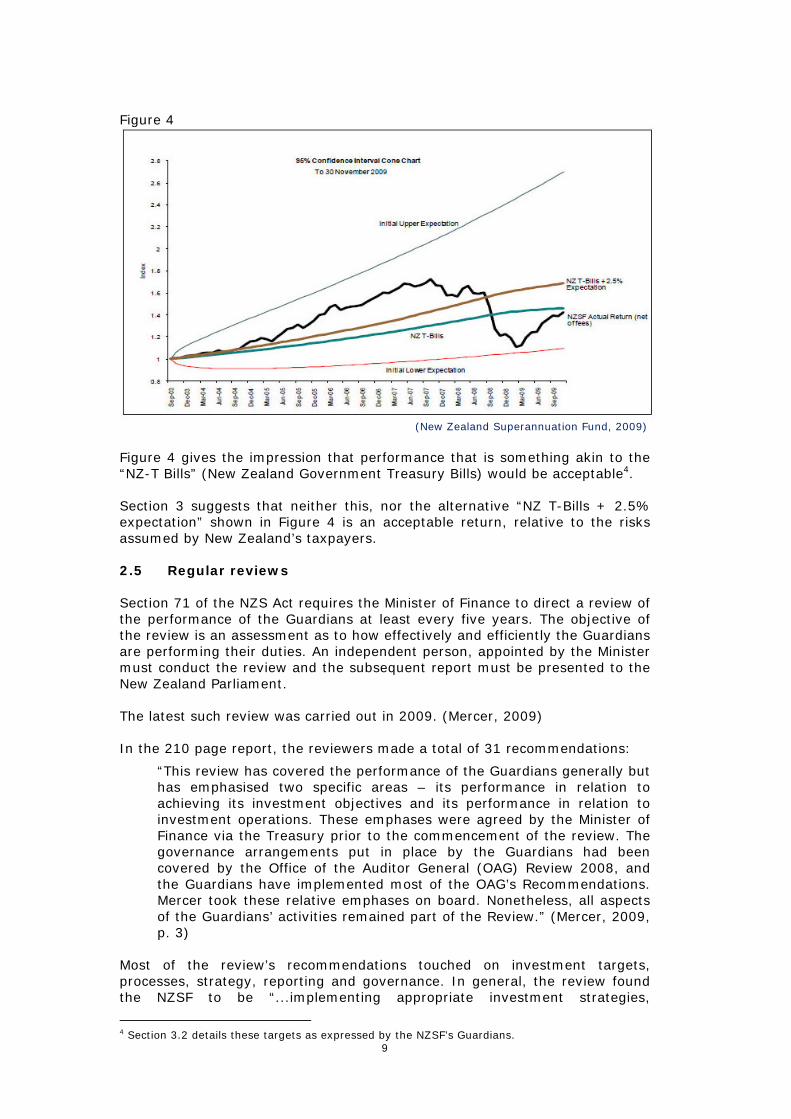
But National could, as it promised in 2008, change the NZS Act to give the government a more direct involvement in the investment process. 2.5 Investment performance to date Most of the NZSF’s assets (72.2% at 31 May 2010) are invested overseas and most (55.3% of all assets at 31 May 2010) are in international shares. Figure 4 shows how the NZSF itself has presented its performance against its self-chosen benchmarks.
9
Figure 4
(New Zealand Superannuation Fund, 2009)
Figure 4 gives the impression that performance that is something akin to the “NZ-T Bills” (New Zealand Government Treasury Bills) would be acceptable4. Section 3 suggests that neither this, nor the alternative “NZ T-Bills + 2.5% expectation” shown in Figure 4 is an acceptable return, relative to the risks assumed by New Zealand’s taxpayers. 2.5 Regular reviews Section 71 of the NZS Act requires the Minister of Finance to direct a review of the performance of the Guardians at least every five years. The objective of the review is an assessment as to how effectively and efficiently the Guardians are performing their duties. An independent person, appointed by the Minister must conduct the review and the subsequent report must be presented to the New Zealand Parliament. The latest such review was carried out in 2009. (Mercer, 2009) In the 210 page report, the reviewers made a total of 31 recommendations:
“This review has covered the performance of the Guardians generally but has emphasised two specific areas – its performance in relation to achieving its investment objectives and its performance in relation to investment operations. These emphases were agreed by the Minister of Finance via the Treasury prior to the commencement of the review. The governance arrangements put in place by the Guardians had been covered by the Office of the Auditor General (OAG) Review 2008, and the Guardians have implemented most of the OAG’s Recommendations. Mercer took these relative emphases on board. Nonetheless, all aspects of the Guardians’ activities remained part of the Review.” (Mercer, 2009, p. 3)
Most of the review’s recommendations touched on investment targets, processes, strategy, reporting and governance. In general, the review found the NZSF to be “...implementing appropriate investment strategies,
4 Section 3.2 details these targets as expressed by the NZSF’s Guardians.
10
governance arrangements and operational activities to position itself to meet its long-term objectives.” (Mercer, 2009, p. 1) With particular respect to the NZSF’s investment performance, the review noted that its comparative performance by sector has been mixed:
“The global large cap equities sector performed moderately well against their benchmark before the sector capitulated to the global financial crisis. The emerging market sector is a little more interesting, performing below their benchmark in the financial years 2005 and 2006, recovering in 2007 and 2008, before falling back against their benchmark in 2009. The multi-sector strategy started off strongly in the year ended 2006. But it has gone downhill since then with the performance against benchmark getting progressively worse each year. The New Zealand equities, global property and commodity sectors all performed relatively well against their benchmarks since inception.”(Mercer, 2009, p. 154)
Despite this, Mercer thinks that the performance of the Guardians was “broadly consistent with other funds of the same type through the same period.” (Mercer, 2009, p. 142) 2.6 The 2009 Budget announcements As part of the government’s response to the 2008 economic downturn, the 2009 Budget announced that contributions to the NZSF would be suspended for about ten years:
“When it was set up, the idea of the Super Fund was to invest Budget surpluses. The Government was then in surplus and expected to remain so for the foreseeable future. Those Budget surpluses have disappeared.
Had contributions continued at the previous rate, the Government would have had to borrow an additional $1.5 billion a year, rising to over $2 billion a year during the next decade. It makes little economic sense to burden future generations with debt incurred financing investments that were intended to reduce their need to borrow.
We will resume contributions when the operating balance is sufficient in terms of cash flow to meet contributions and other capital spending. On current projections this will be from 2020/21, and will continue for a decade until withdrawals from the Fund begin in around 2031.” (English, 2009)
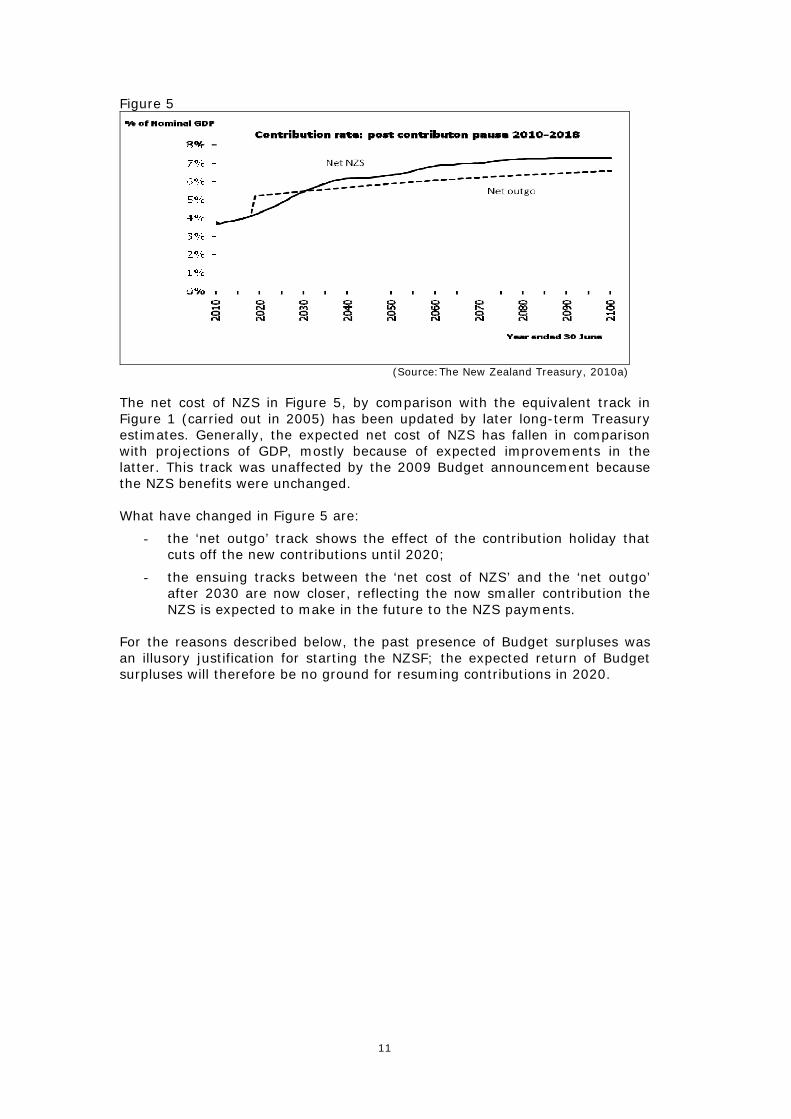
After the 2009 Budget, the projected peak will now be 23% of GDP in 2056 (about $43 billion in today’s money) when today’s 18 year olds reach the present state pension age of 65 (The New Zealand Treasury, 2009c)5. Figure 5 shows the impact of this ‘contribution holiday’ on the total and net payments in respect of NZS.
5 The reduction from 50% of GDP described in section 2.2 to 23% is caused by the combined effect of the 10 year contribution suspension and the rolling 40 year calculation resuming 10 years after the first baby boomers have started to receive their pensions.
11
Figure 5
(Source:The New Zealand Treasury, 2010a)
The net cost of NZS in Figure 5, by comparison with the equivalent track in Figure 1 (carried out in 2005) has been updated by later long-term Treasury estimates. Generally, the expected net cost of NZS has fallen in comparison with projections of GDP, mostly because of expected improvements in the latter. This track was unaffected by the 2009 Budget announcement because the NZS benefits were unchanged. What have changed in Figure 5 are:
- the ‘net outgo’ track shows the effect of the contribution holiday that cuts off the new contributions until 2020;
- the ensuing tracks between the ‘net cost of NZS’ and the ‘net outgo’ after 2030 are now closer, reflecting the now smaller contribution the NZS is expected to make in the future to the NZS payments.
For the reasons described below, the past presence of Budget surpluses was an illusory justification for starting the NZSF; the expected return of Budget surpluses will therefore be no ground for resuming contributions in 2020.
12
3. The NZSF’s impact on the government’s balance sheet: the ‘hurdle rate’
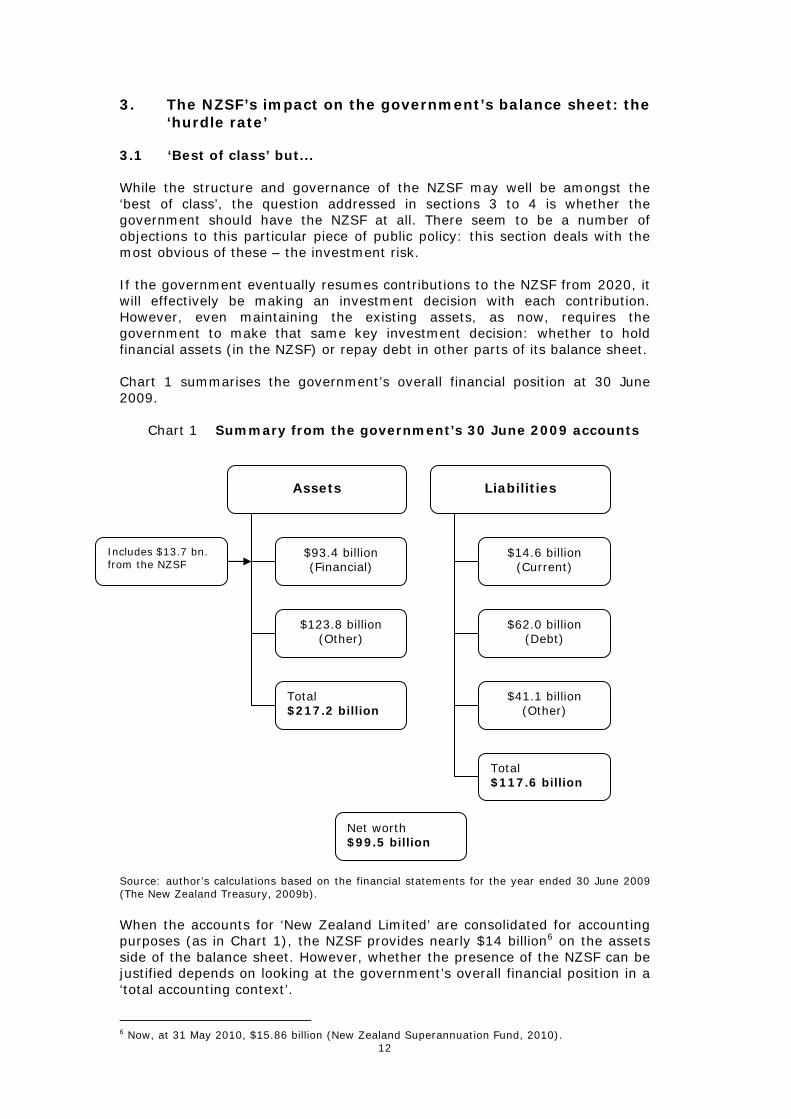
3.1 ‘Best of class’ but... While the structure and governance of the NZSF may well be amongst the ‘best of class’, the question addressed in sections 3 to 4 is whether the government should have the NZSF at all. There seem to be a number of objections to this particular piece of public policy: this section deals with the most obvious of these – the investment risk. If the government eventually resumes contributions to the NZSF from 2020, it will effectively be making an investment decision with each contribution. However, even maintaining the existing assets, as now, requires the government to make that same key investment decision: whether to hold financial assets (in the NZSF) or repay debt in other parts of its balance sheet. Chart 1 summarises the government’s overall financial position at 30 June 2009.
Chart 1 Summary from the government’s 30 June 2009 accounts
Source: author’s calculations based on the financial statements for the year ended 30 June 2009 (The New Zealand Treasury, 2009b). When the accounts for ‘New Zealand Limited’ are consolidated for accounting purposes (as in Chart 1), the NZSF provides nearly $14 billion6 on the assets side of the balance sheet. However, whether the presence of the NZSF can be justified depends on looking at the government’s overall financial position in a ‘total accounting context’.
6 Now, at 31 May 2010, $15.86 billion (New Zealand Superannuation Fund, 2010).
Liabilities
$14.6 billion (Current)
$62.0 billion (Debt)
$41.1 billion (Other)
Total $117.6 billion
Assets
$93.4 billion (Financial)
$123.8 billion (Other)
Total $217.2 billion
Net worth $99.5 billion
Includes $13.7 bn. from the NZSF
13
3.2 The investment decision By maintaining the NZSF’s assets as financial investments (and even resuming contributions in 2020 as is intended), the government must assume that the return on the NZSF will exceed the cost of new borrowings it will be making in other parts of its financial activities. The interest payable on that debt is the ‘hurdle rate’ in this regard. The NZSF usually has a statement in its annual reports about its investment return objective over the long term. Here, for example, is the 2009 version:
“Our reference point for [the long-term return] is benchmarking the Fund performance against the 90-day Treasury bill rate (i.e. a proxy for the Government’s ‘risk-free’ rate or its opportunity cost of raising debt). Based on our investment blueprint – our Strategic Asset Allocation (SAA) – our internal expectation is to deliver a rate of return averaging at least 2.5% per annum above the 90-day Treasury bill (T-Bill) rate over rolling 20-year periods….It is important to note that this outperformance is not our target, which is to maximise return without undue risk. In fact we aspire to outperforming the +2.5% whenever we have opportunities to do so.” (Guardians of New Zealand Superannuation, 2009a pp 8-9)
Phrased in these terms, the “reference point” (the T-Bill rate) is characterised as one of the two separate return targets. That is the minimum the Guardians aim for; however, the “internal expectation” is to exceed that by “at least 2.5%” a year7. 3.3 The ‘hurdle rate’ When the NZSF describes the T-Bill rate as the “reference point” the NZSF considerably understates its significance to the government. Re-characterising it as a ‘hurdle rate’ is a more accurate depiction. In a ‘total accounting context’, it is a target the NZSF must achieve. For the reasons explained below, to the extent the Guardians miss the hurdle rate in any year, the government is losing money overall. Further, the 2.5% a year that the Guardians “aspire to” is probably an inadequate margin to compensate taxpayers for the investment risks undertaken by the NZSF. It should be more than an aspirational target. It should be a prerequisite to justify the portfolio’s existence in the government’s overall balance sheet. The T-Bill rate over the long-term should be the cheapest money the government expects to borrow. It is equivalent to a short-term cash rate. Of greater significance to taxpayers in the context of the NZSF should be the cost of long-term borrowings by the government. In New Zealand, the longest-term government securities are 10 year bonds and the cost of those was 6.35% per annum at 1 July 2009 (the start of the financial year just ended). In order for the government to justify the existence of the NZSF as part of its overall activities in the 2009/10 financial year, the NZSF’s Guardians must have achieved at least that hurdle rate of 6.35% in that year before the government as a whole is better off financially8. As the government’s cost of debt changes, so too does the hurdle rate.
7 The 2009 Review of the NZSF’s operations concluded that “...under our modelling assumptions we consider that the Guardians is expected to achieve its expectations over rolling 20 year periods.”(Mercer, 2009, p. 20) 8 The hurdle rate could also be the cost of interest on the most expensive debt currently held as that is the debt that the government should repay first.
14
There is a case to suggest that the ‘hurdle rate’ should be after-tax; at present 4.45% a year for a 30% taxpayer. Although the government pays interest of 6.35%, it collects tax from the lender so the net cost is after-tax. There seem to be three difficulties with this:
• First, if the lender is overseas, the government collects only 15% in Non-resident Withholding Tax leaving a net cost of 5.40%.
• Secondly, if the lender is a charity, the government would collect no tax.
• Lastly, for a domestic lender, if the government had not borrowed the money, the lender would have invested it elsewhere and still paid tax. So the government would receive the tax regardless.
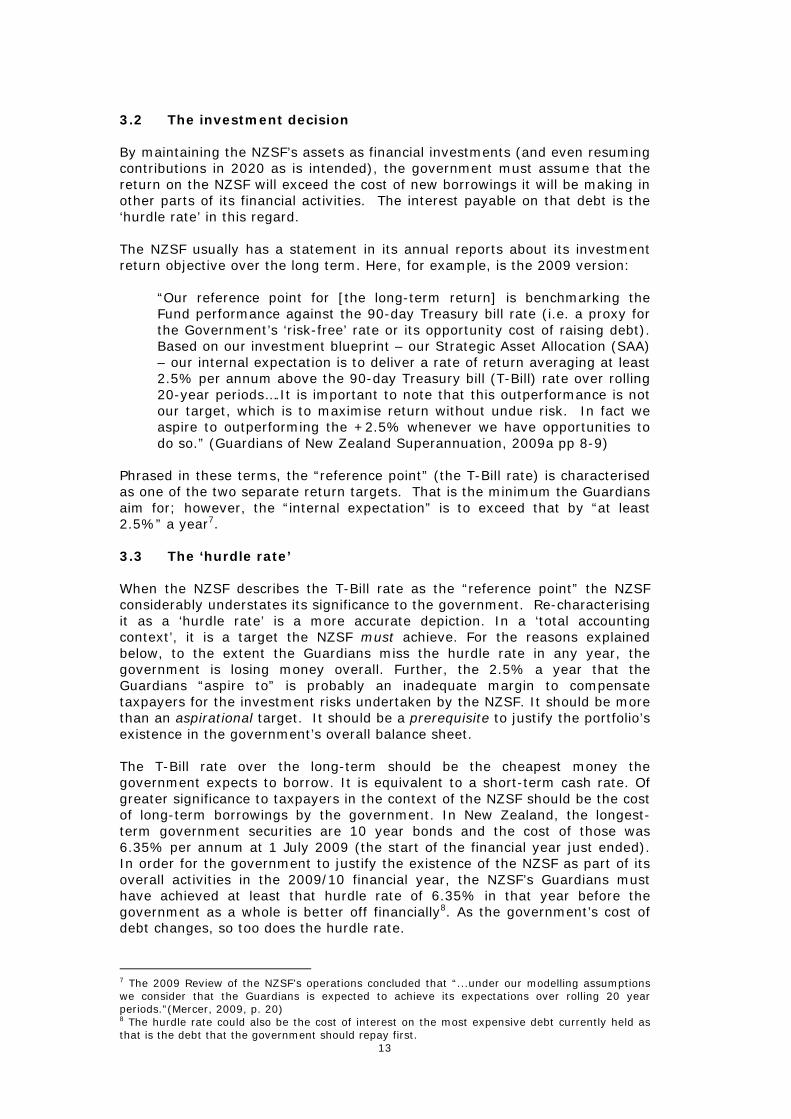
Using gross interest as the hurdle rate seems a better assumption. 3.4 Actual return vs. the hurdle rate Table 1 shows a year-by-year comparison for the last six financial years (the most recent one ended on 30 June 2010 and the audited accounts will not be available for some months). In each year, the hurdle rate is the cost of ten year bonds at the start of the financial year – 1 July in each case. It is appropriate to fix the rate in this way for the then following 12 months as the government should effectively be making its decisions in this regard on an annual, in advance, basis.
Table 1
New Zealand Superannuation Fund’s returns vs. hurdle rate 2004-2009
Year ending 30 June
NZSF’s return (Note 2)
Hurdle rate (Note 3)
2004 (Note 1) 7.69% 6.15% 2005 14.13% 6.31% 2006 19.20% 5.72% 2007 14.58% 5.85% 2008 -4.92% 6.71% 2009 -22.14% 6.35%
Notes: 1. The Guardians received the first tranche of money in
October 2003 so the first period is effectively eight months. 2. The returns are as reported in the NZSF’s annual reports.
It seems they are before tax but after expenses. 3. The hurdle rate is the yield on 10 year government stock at
the beginning of each year (except for 2004 when it is as of 30 October 2003).
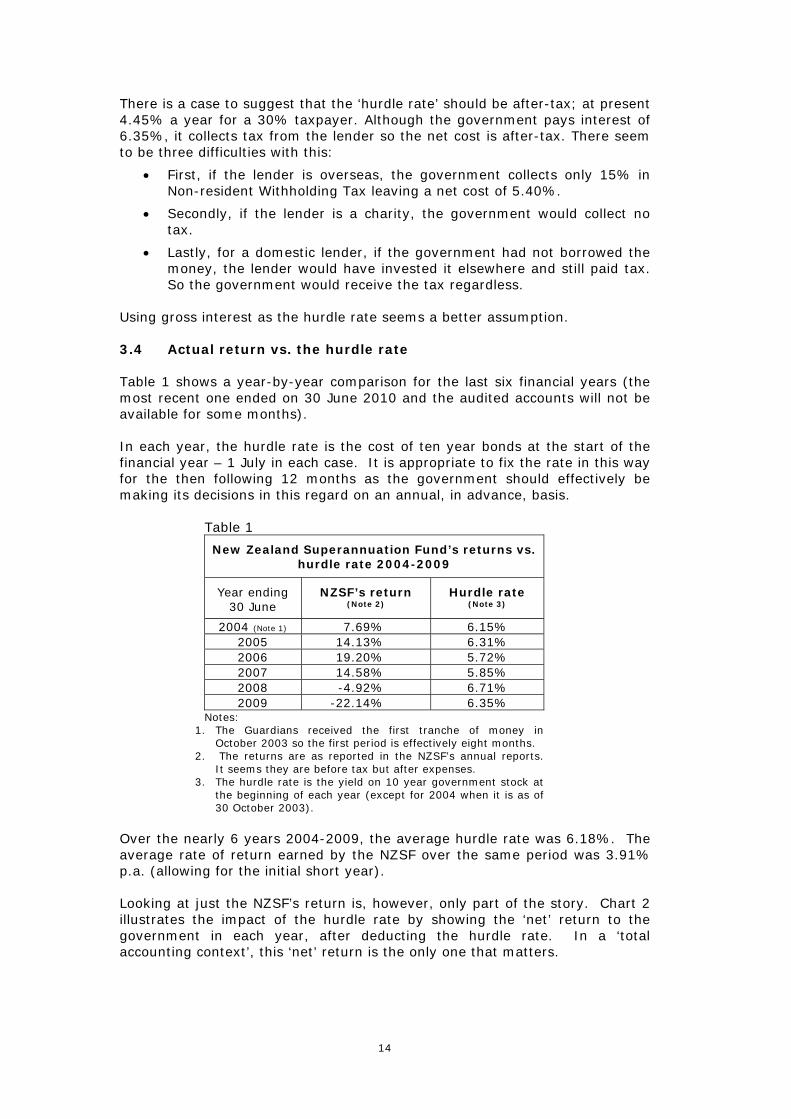
Over the nearly 6 years 2004-2009, the average hurdle rate was 6.18%. The average rate of return earned by the NZSF over the same period was 3.91% p.a. (allowing for the initial short year). Looking at just the NZSF’s return is, however, only part of the story. Chart 2 illustrates the impact of the hurdle rate by showing the ‘net’ return to the government in each year, after deducting the hurdle rate. In a ‘total accounting context’, this ‘net’ return is the only one that matters.
15
Chart 2
-30.0%-25.0%-20.0%-15.0%-10.0%-5.0%0.0%5.0%
10.0%15.0%20.0%
2004 2005 2006 2007 2008 2009
% per annum
Impact of 'net' return(NZSF return less hurdle rate)
NZSF return
Hurdle rate
Net return
(part year)
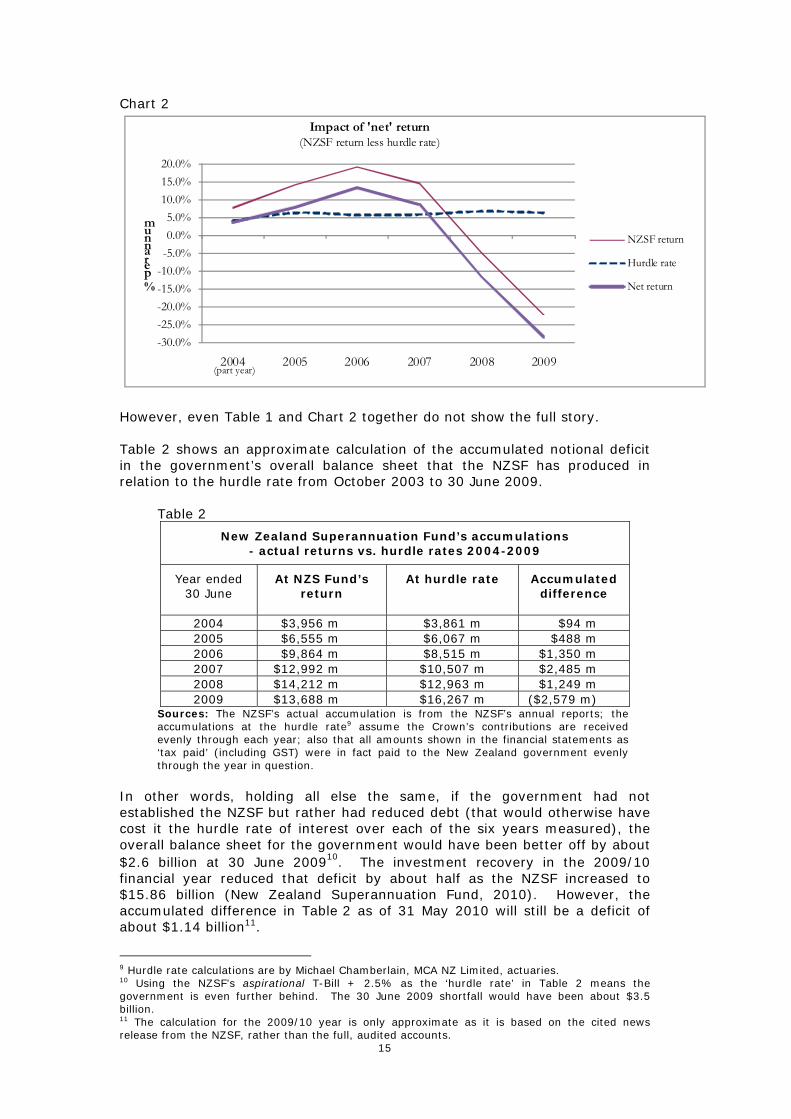
However, even Table 1 and Chart 2 together do not show the full story. Table 2 shows an approximate calculation of the accumulated notional deficit in the government’s overall balance sheet that the NZSF has produced in relation to the hurdle rate from October 2003 to 30 June 2009.
Table 2
New Zealand Superannuation Fund’s accumulations - actual returns vs. hurdle rates 2004-2009
Year ended 30 June
At NZS Fund’s return
At hurdle rate
Accumulated difference
2004 $3,956 m $3,861 m $94 m 2005 $6,555 m $6,067 m $488 m 2006 $9,864 m $8,515 m $1,350 m 2007 $12,992 m $10,507 m $2,485 m 2008 $14,212 m $12,963 m $1,249 m 2009 $13,688 m $16,267 m ($2,579 m)
Sources: The NZSF’s actual accumulation is from the NZSF’s annual reports; the accumulations at the hurdle rate9 assume the Crown’s contributions are received evenly through each year; also that all amounts shown in the financial statements as ‘tax paid’ (including GST) were in fact paid to the New Zealand government evenly through the year in question.
In other words, holding all else the same, if the government had not established the NZSF but rather had reduced debt (that would otherwise have cost it the hurdle rate of interest over each of the six years measured), the overall balance sheet for the government would have been better off by about $2.6 billion at 30 June 200910. The investment recovery in the 2009/10 financial year reduced that deficit by about half as the NZSF increased to $15.86 billion (New Zealand Superannuation Fund, 2010). However, the accumulated difference in Table 2 as of 31 May 2010 will still be a deficit of about $1.14 billion11.
9 Hurdle rate calculations are by Michael Chamberlain, MCA NZ Limited, actuaries. 10 Using the NZSF’s aspirational T-Bill + 2.5% as the ‘hurdle rate’ in Table 2 means the government is even further behind. The 30 June 2009 shortfall would have been about $3.5 billion. 11 The calculation for the 2009/10 year is only approximate as it is based on the cited news release from the NZSF, rather than the full, audited accounts.
16
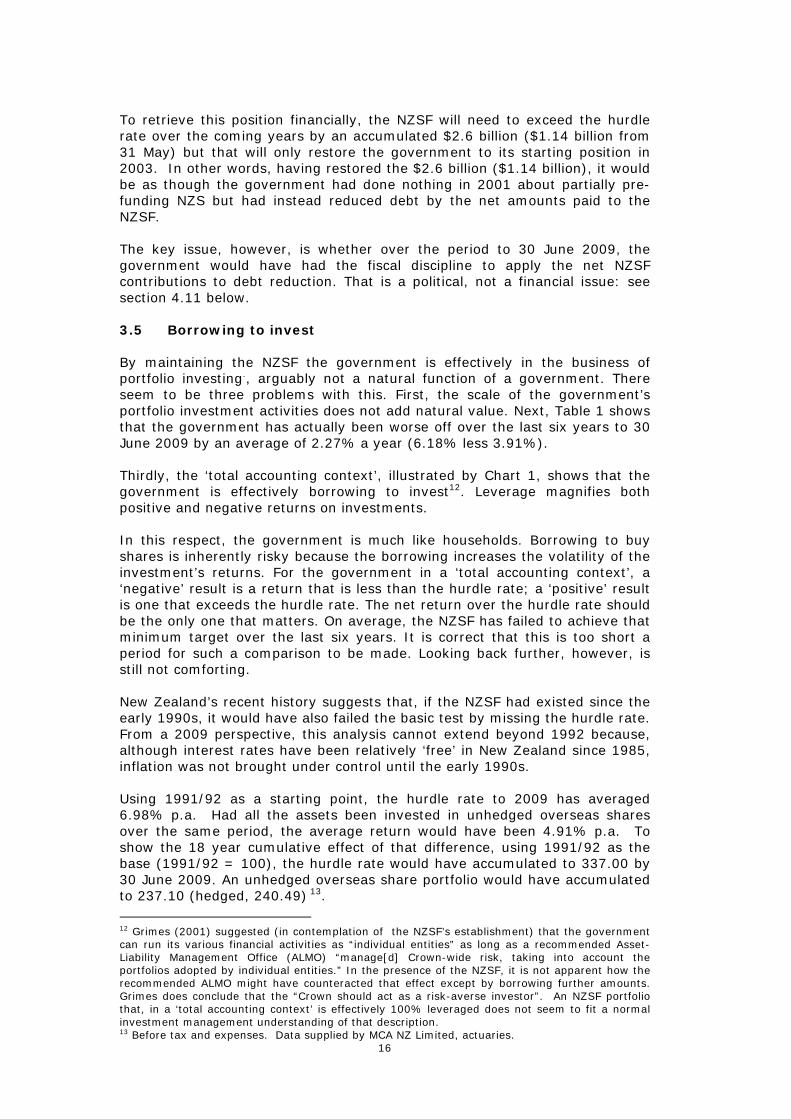
To retrieve this position financially, the NZSF will need to exceed the hurdle rate over the coming years by an accumulated $2.6 billion ($1.14 billion from 31 May) but that will only restore the government to its starting position in 2003. In other words, having restored the $2.6 billion ($1.14 billion), it would be as though the government had done nothing in 2001 about partially pre-funding NZS but had instead reduced debt by the net amounts paid to the NZSF. The key issue, however, is whether over the period to 30 June 2009, the government would have had the fiscal discipline to apply the net NZSF contributions to debt reduction. That is a political, not a financial issue: see section 4.11 below. 3.5 Borrowing to invest By maintaining the NZSF the government is effectively in the business of portfolio investing., arguably not a natural function of a government. There seem to be three problems with this. First, the scale of the government’s portfolio investment activities does not add natural value. Next, Table 1 shows that the government has actually been worse off over the last six years to 30 June 2009 by an average of 2.27% a year (6.18% less 3.91%). Thirdly, the ‘total accounting context’, illustrated by Chart 1, shows that the government is effectively borrowing to invest12. Leverage magnifies both positive and negative returns on investments. In this respect, the government is much like households. Borrowing to buy shares is inherently risky because the borrowing increases the volatility of the investment’s returns. For the government in a ‘total accounting context’, a ‘negative’ result is a return that is less than the hurdle rate; a ‘positive’ result is one that exceeds the hurdle rate. The net return over the hurdle rate should be the only one that matters. On average, the NZSF has failed to achieve that minimum target over the last six years. It is correct that this is too short a period for such a comparison to be made. Looking back further, however, is still not comforting. New Zealand’s recent history suggests that, if the NZSF had existed since the early 1990s, it would have also failed the basic test by missing the hurdle rate. From a 2009 perspective, this analysis cannot extend beyond 1992 because, although interest rates have been relatively ‘free’ in New Zealand since 1985, inflation was not brought under control until the early 1990s. Using 1991/92 as a starting point, the hurdle rate to 2009 has averaged 6.98% p.a. Had all the assets been invested in unhedged overseas shares over the same period, the average return would have been 4.91% p.a. To show the 18 year cumulative effect of that difference, using 1991/92 as the base (1991/92 = 100), the hurdle rate would have accumulated to 337.00 by 30 June 2009. An unhedged overseas share portfolio would have accumulated to 237.10 (hedged, 240.49) 13.
12 Grimes (2001) suggested (in contemplation of the NZSF’s establishment) that the government can run its various financial activities as “individual entities” as long as a recommended Asset-Liability Management Office (ALMO) “manage[d] Crown-wide risk, taking into account the portfolios adopted by individual entities.” In the presence of the NZSF, it is not apparent how the recommended ALMO might have counteracted that effect except by borrowing further amounts. Grimes does conclude that the “Crown should act as a risk-averse investor”. An NZSF portfolio that, in a ‘total accounting context’ is effectively 100% leveraged does not seem to fit a normal investment management understanding of that description. 13 Before tax and expenses. Data supplied by MCA NZ Limited, actuaries.
17
That average annual return margin over the 18 years of 2.07% a year, the difference between 6.98% and 4.91%, is not very different to the gap over the last six years since the NZSF started (2.27% a year). That said, looking back is probably unhelpful. The recent past has seen an unprecedented three periods of significant falls in international share prices. However, looking forward does not help either. Using the NZSF’s own aspirational target (T-Bill + 2.5%), the Reserve Bank of New Zealand expects long term nominal cash rates of about 6% p.a.14 Adding 2.5% to that gives a total of 8.5% p.a. Overseas shares might be expected to earn a long-term return of about 9% p.a. with a volatility of 18% a year15. Expecting a return of at least 8.5% a year from a portfolio that returns between -27% to +45% in any year (with two-thirds of those returns expected to be in the range -9% to +27%) seems inherently risky. According to the NZSF’s current Strategic Asset Allocation (Hayward, Dyer, & Frogley, 2007), 17% of the portfolio is to be invested in fixed interest securities of all kinds. Borrowing to buy bonds is probably even riskier than borrowing to buy shares because of the small or even non-existent margin between the cost of borrowing (in other parts of the government’s balance sheet) and the expected return to the NZSF. At 30 June 2009, the NZSF actually held 18.5% of its portfolio in fixed interest securities, 93% of that in overseas holdings (Guardians of New Zealand Superannuation, 2009b). Given that 18.5% of the portfolio will probably fail to earn more than the hurdle rate, it means that the remaining 81.5% has to earn 3.1% a year more than the T-Bill rate to achieve what the NZSF describes as its aspirational target but what this paper suggests is a prerequisite in a ‘total accounting context’. Borrowing to invest is not necessarily a bad idea. Borrowing helps households and businesses pay over time for ‘lumpy’ investments. A household takes on a mortgage to pay for the home and then repays that over a long period while living in the home. A business might need to take on debt to expand or buy new equipment if it cannot pay for those directly from cash but can from future profits. Even governments might need to do this to pay for expensive motorway networks or other infrastructure. In this case, borrowing to invest has the added advantage of sharing the costs between generations of users of that infrastructure. An investor who borrows to buy portfolio investments (shares, bonds etc) is engaging in speculation – again, not necessarily a bad thing. The borrower takes on the risk that the returns from those investments will be at least as great as the cost of the debt used to acquire them. Borrowing to invest magnifies positive yields and also the losses. It turns a good return into an excellent result; and a bad return into a potential disaster. While a private investor may be willing to speculate in this way, it seems questionable for a government to do that with public money. In a ‘total accounting context’, it is clear that amounts added by way of contributions to the NZSF are, as illustrated in Chart 1, effectively (not actually) borrowed money16.
14 The Reserve Bank notes that the “current model includes an assumed equilibrium nominal 90-day interest rate at 6%.” This is based on what the Reserve Bank calls a long term “neutral real return” of 4% p.a. (+/- 0.75%) plus expected inflation. See Björksten & Karagedikli (2003). 15 Using the MSCI World Index - information supplied by MCA NZ Limited, actuaries. 16 The same logic also applies to other investments the government makes, such as in state-owned businesses like New Zealand Post, KiwiRail etc. It also applies to the assets of the state-owned Accident Compensation Corporation: see Littlewood (2009).

18
The same applies to assets already held in the NZSF even if the current ‘contribution holiday’ continues: new borrowing by the government in the presence of the assets held by the NZSF is effectively the same as borrowing to invest. That is because the government has a choice with respect to all new borrowings: it can borrow, say, $1 million and maintain that amount of invested assets in the NZSF or it can sell $1 million of those investments and not borrow. The suggested ‘total accounting context’ makes clear that a decision to borrow in the presence of the NZSF’s current assets is also a ‘borrow to invest’ decision. In a ‘total accounting context’, the NZSF’s portfolio is effectively 100% leveraged.
19
4. The economics of an ageing population The NZSF ‘sets aside’ financial assets to help meet the pension outgoings of tomorrow’s retirees. Sections 4.1 to 4.11 analyse the implications of doing this: might the presence of the NZSF actually help New Zealand withstand the fiscal pressures of an ageing population? 4.1 Economic strength matters The material living standards of people in retirement are largely determined by their ability to consume goods and services. Retirees cannot directly consume the money represented by public or private savings. Those savings must be used to buy goods and services that are produced by New Zealand's future working-age population or by workers of other countries (imports). The British economist, Nicholas Barr, expressed this point memorably:
"Pensioners do not eat pound note 'butties' [sandwiches] – they use the pound notes to purchase consumption, and it is consumption that matters." (Barr, 1979)17
With respect to the growing future number of pensioners, it is New Zealand’s future capacity to create wealth that matters. The ability to produce goods and services and to buy imports is the key to the living standards of present and future retirees (and everyone else). Savings by the government or by individuals will not help by themselves. What matters is how those savings are applied (investment and then growth). It is not apparent how the presence of the NZSF will help increase the capacity of tomorrow's New Zealand workers to produce more for tomorrow’s retirees to consume. 4.2 How do we support the growing elderly population? An increasing elderly population can only continue to be supported at current real income levels broadly by either increasing output today and tomorrow, restricting consumption today and tomorrow or by improving the productivity of the relatively smaller workforce we expect to have. In a retirement income context, this means, specifically:
4.2.1 Raising future output by increasing the working-age population
relative to the dependent population of all ages: the young, the infirm and the old, but particularly the last group because it will become relatively much larger. Changing the working population can be done in a number of ways such as:
• Bringing new workers into New Zealand through immigration18
;
• Lowering the impact on the retirement/work decisions of NZS by having an income test or by allowing a more flexible state pension age. This might have the effect of extending retirement ages on a voluntary basis but may also reduce them as people leave the workforce to take up NZS19;
• Increasing the state pension age (currently age 65) so that the age from which the future old start receiving NZS is deferred;
• Increasing the labour force participation rate, such as by reducing unemployment, persuading more people to work
17 The analysis in paragraphs 7.1 and 7.2 draws on Barr (1979). 18 However, immigration tends to import other countries' demographic problems. 19 There is some evidence of this effect amongst men (but not women) in Australia: see Warren & Oguzoglu (2007).
20
(including by increasing the state pension age), lowering the unemployment benefit or making that benefit more difficult to get.
4.2.2 Restricting current consumption and investing overseas with a view to paying for retirees’ future imports. At 30 June 2009, 76.2% of the NZSF is in fact invested overseas (Guardians of New Zealand Superannuation, 2009a). On this ground alone, there is a case to make that 100%.
4.2.3 Constraining the consumption of the working-age population in future, for example through higher taxes on wages, to make proportionately more goods and services available to retirees. A compulsory, private savings scheme that reduces current consumption, as long as it has no impact on other savings, can have this effect.
4.2.4 Improving productivity through investment in education and training. In the debate about the introduction of the NZSF, the last government argued that as productivity rises so do wages (and, therefore, NZS because of its link to wages). On that view, increasing the size of the cake does not help to make NZS more affordable (see, for example Cullen, 2000b). There are two possible answers to this:
• First, increases in the productivity of capital employed and also innovations can raise total factor productivity and let GDP increase without increasing wages and, therefore, NZS (see below)20.
• Secondly, the link between real wages and NZS could change as relative incomes increase.
4.2.5 Increasing the capital stock and its quality to compensate for the potential labour shortage. That can make a relatively smaller workforce more productive. Also, robots have the advantage of not needing pensions.
In order for the government to support the presence of the NZSF as a way of helping to address the problem of the sustainability of NZS with an ageing population, it would have to show how the NZSF will increase output, raise productivity or might possibly constrain the consumption of future workers, as the retired population increases. Of the above list, the only possible contribution the NZSF might make is to constrain current, in favour of future consumption: paragraph 4.2.2 above. The NZSF could also, by smoothing tax receipts, reduce the impact of the deadweight costs associated with higher expected taxes: see paragraph 4.6.6 below. 4.3 Where does the money come from? The NZSF is used as an accounting device to pass through all the money that is paid to existing and future superannuitants. Total payments by the government to the NZSF for the year ended 30 June 2009 were $9.99 billion but of that, $7.74 billion was immediately paid out to superannuitants, leaving $2.24 billion (about 1.3% of GDP) for investment purposes (Guardians of New Zealand Superannuation, 2009b, p. 63). So, what is not needed to pay for pensions today is left behind to build up into a fund.
20 In fact, employees’ compensation as a proportion of GDP has fallen from about 55% in the early 1980s to less than 45% in the 2000s: 44% in 2008 (Statistics New Zealand, 2008).
21
The transfer to the NZSF of a dollar of tax revenue to pay a dollar of NZS to an existing pensioner is accounting ‘housework’. It is like putting a dollar of wages directly into the housekeeping jar instead of the tin for general spending. The partial pre-funding of NZS has been necessarily matched in past years by an equal reduction in money available to fund other activities. For instance, general government debt may have increased; health or capital spending may have reduced or there may have been less available for education. Again there was no change of substance but, for the reasons described in paragraph 4.11, limiting cash resources to fund other activities may in fact have been the main (political) reason for the NZSF’s establishment. The recent arrival of potentially long-term fiscal deficits21 has changed the past justification for the NZSF’s existence. They have brought into focus more sharply the substance of what was previously happening: the government’s borrowing to invest. However, that difficulty existed even without the deficits. Had the true nature of the NZSF’s arrangements been properly debated at the outset in a ‘total accounting context’, the risks of borrowing to invest that section 3 has quantified might have been more clearly understood. 4.4 Current workers pay twice A change from the previous pure PAYG approach to a partially pre-funded basis requires workers during the transition to pay twice. Those workers must meet, through their taxes, the costs of NZS for current retirees as at present. In addition, they must pay the capital contributions to the NZSF that, together with related investment income, will provide partly for their own NZS when they retire. It is not possible to change to a partly pre-funded NZS without increasing taxes and/or reducing spending on NZS or other goods and services or transfers like education, health and welfare. If capital contributions resume from 2020 as the government intends, it will be effectively asking today's workers to pay twice (at least partially) for NZS. 4.5 Long-term costs probably higher The cost of any superannuation scheme (public or private; pre-funded or PAYG; defined benefit or defined contribution; lump sum or pension) is the benefits that the scheme pays (plus administration costs). In that regard, it does not matter how the scheme is paid for: whether from current taxes, contributions paid in earlier years or from investment income. Investment risks aside, what matters is the type of structure that is the cheapest to administer. NZS, in the presence of the NZSF, will probably be more expensive than in its absence. 4.6 Partial pre-funding or PAYG? When the NZSF was established, the economic substance of the “smoothed, PAYG” method of paying for the future costs of NZS received little public examination. In fact, adding a pre-funded component to the process raises a number of issues:
4.6.1 No reduction in cost: The establishment of a partly pre-funded scheme does not reduce the cost of NZS, other things being equal. A
21 The government’s accounts are expected to remain in deficit until the 2015/16 year (The New Zealand Treasury, 2010b, p. 37).
22
transfer to the NZSF of a dollar today that increases in value with net investment income of, say, 5% a year (before adjusting for inflation) to $7 in 40 years' time is exactly equivalent to a PAYG payment of $7 (plus an adjustment for inflation) in 40 years' time. In the latter case the taxpayer can invest a dollar today and earn the same investment income as the NZSF to pay his or her tax bill in 40 years' time. Similarly, the transfer of a dollar of personal income tax to the NZSF which increases to $7 in 40 years' time is matched by a dollar plus related forgone earnings elsewhere in the government sector which, other things being equal, can be expected to have an opportunity cost of $7 in 40 years' time.
Contrary to the then government's claim, adding the NZSF to the mix provides no additional security about where the money for NZS will come from. It will effectively continue to come from tax revenue. There is no separate source of funding for NZS. The best that can be argued in support of partial pre-funding is that it affects the timing of tax receipts by increasing today’s tax in favour of a possible (not promised) reduction in tomorrow’s tax. Neither the last nor this government has promised that tomorrow’s tax take will be reduced by the draw-downs from the NZSF that help pay for NZS.
4.6.2 The strength of the economy matters: There seem to be no grounds for partly pre-funding NZS over similar non-contributory public programmes, such as the invalid's benefit or health-spending, that are presently funded on a PAYG basis. The future funding of these schemes primarily depends on the prosperity of the economy and the government's power to tax22.
Private superannuation schemes are not analogous to state pensions as their sponsors are unable to tax citizens. This is the main reason they seek to provide security for contributors by fully pre-funding their schemes. Governments face no such problem because of their ability to tax and the fact that they do not go out of business.
As Nicholas Barr explains it:
“I know that I will need to buy food for the rest of my life; but I do not accumulate a food fund but intend to pay my grocery bills out of future earnings. The reason for making a pension accumulation is a different one – namely that I intend to retire, that is to stop producing goods which I can exchange for other goods; no such accumulation is needed in a world without retirement, where people are immortal, or remain healthy and active in the labour force until their death. Such a world is mythical for the individual but is exactly the case for a country, which does not have to take action to anticipate a time when production will cease. The fact that countries are immortal is central: from an economic perspective, it makes prefunding unnecessary unless it has a positive effect on output....” (Barr, 2000)
4.6.3 Re-arranging claims on the economy: It is a good idea for individuals or employers to put aside money for future retirement payments. However, it does not follow that what is right for an individual is necessarily right for the country. Building up the NZSF will
22 The Ministry of Health suggests that healthcare costs will rise from 6.2% of GDP to 9.2% by 2051 (Ministry of Health, 2004). If a government were concerned about the future affordability of health care, why is there no proposal for a similar "smoothed pay as you go" approach to rising health costs? There seems to be no economic distinction between these two demographically influenced programmes.
23
re-arrange claims on today's economy between earners and non-earners and also, through overseas investment, as between New Zealand and other countries. However, that does not necessarily increase the security of the claims by both tomorrow’s earners and non-earners. Only a stronger economy can do that.
There is an even more significant political issue in this connection. The NZSF is founded on the principle that, when a future government looks at the amount to be spent on NZS, it will have regard for only the net amount, after allowing for the receipts from the NZSF. This seems unrealistic politically. The government is more likely to make compensating adjustments in other parts of its spending to allow for the NZSF’s contributions. In other words, the existence of the NZSF and the expected future draw-downs can give no assurance that total spending is likely to be less in the presence of those draw-downs. The contrary view seems just as likely: that total government spending would be higher in the presence of the NZSF draw-downs than in their absence (with a pure PAYG pension).
In fact, NZS is (and should continue to be) part of an annual balancing by governments of spending priorities against income. In any year, the annual amount of NZS is effectively the total amount the government decides to spend on NZS divided by the number of people then eligible to receive it. The presence (or absence) of the NZSF does not affect that fundamental process. It may affect the pocket from which amounts come but is unlikely to affect the process itself.
In that way, the NZSF might obscure a political ‘safety valve’. Given that the country’s capacity to meet the economic obligations to superannuitants (both public and private) depends on the strength of the contemporary economy, the NZSF will partly disguise one of the safety valves that will be required to regulate the relative equities of competing claims on that economy. The annual budget process is the most practical example of the way in which those relative equities are resolved year by year. The NZSF creates a partial barrier for that on-going, self-balancing process.
4.6.4 Increases retirement income costs: The presence of the NZSF may mean that NZS costs more than the past pure PAYG arrangements. First, there are the risks of investment losses, both direct and indirect, that, as at 30 June 2009, effectively amount to about $2.6 billion (see section 3 above). Then there are the potential losses that the New Zealand government might suffer if the NZSF fails in the future to achieve returns at least equal to the hurdle rate. Finally, there are the administration costs of running the NZSF. According to the NZSF, these amounted to $96.8 million for the 2008/09 year (Guardians of New Zealand Superannuation, 2009b at page 74) or 0.69% of average assets for the 2008/09 year.
4.6.5 Deadweight costs of higher tax: If, as suggested in paragraph 4.6.4, NZS costs more over the long term than the pure PAYG alternative, taxes must also be higher unless other spending is constrained. Higher taxes involve indirect costs, such as the dead-weight costs on the economy. Collecting taxes is not costless. Not only are there the direct administrative costs but there are more subtle, but real costs to the economy as people change their behaviour as a result of the structure of taxation. These are the ‘deadweight costs’ or sometimes known as the ‘social costs’ of the tax system’s design23.
23 See, for example, Becker (1985). The deadweight costs in the present case do not apply to the higher taxes collected during the build-up of the NZSF as these should be matched by the
24
Estimating this cost is not a precise matter. An attempt for New Zealand was made in 1994 (see Diewart & Lawrence, 1996, 2001). The authors found that the excess burden arising from labour taxation (primarily taxation on the income of wage earners and the self-employed) had gone up from 5 cents to 18 cents for each additional dollar of revenue raised between 1972 and 1992. The marginal excess burden of consumption taxation (mainly GST) increased from about 5 cents to 14 cents.
With respect specifically to the additional tax needed to pay for any NZSF-derived direct and indirect losses, the deadweight cost depends on the way the tax was raised but on the above analysis, something more than 14 cents in every dollar raised seems possible. Looking at the economy as a whole, any difference between the hurdle rate and the return actually achieved (that was an accumulated deficit of $2.6 billion at 30 June 2009) must eventually be recovered through higher taxes (other things being held equal). This is a hidden additional cost when the NZSF does not beat the hurdle rate. That it is hidden makes it no less real: as of 30 June 2009, that implicit addition to the effective, direct losses was at least $360 million.
Even setting aside the overall accumulated losses the NZSF has incurred to date for the government in relation to the hurdle rate, it seems difficult to see how the NZSF will save money over the pure PAYG arrangement that applied until 2001. It also seems difficult to understand why the NZSF is more ‘secure’ than the capacity of future governments to tax; or how rearranging economic claims in today's economy will better prepare future New Zealanders for the impact of a growing aged population. These are all issues that governments must resolve politically. 4.7 Where is the money invested? The extra amount of tax required each year to achieve the NZS Act’s ‘smoothed, pay as you go’ objective averaged $2.1 billion a year in the three years leading up to the 2009 Budget. The current government’s suspension of contributions for up to ten years until 2020 will increase the expected annual contributions, in today’s money once they resume, to $2.7 billion (The New Zealand Treasury, 2009c).
For a number of reasons, nearly all of that money must be invested overseas. The New Zealand market cannot absorb much but, even if it could, there are two main reasons for investing outside New Zealand:
4.7.1 The New Zealand markets: New Zealand does not have sufficient local diversification or depth in its investment markets. There is not the range of companies and industries in sufficient quantities that such a large pool of assets will require for a diversified portfolio. The NZSF could, arguably, be part of the solution here but that raises the question whether it is appropriate for a government agency to undertake that role given the other risks associated with the government’s balance sheet.
4.7.2 Economic ‘insurance’: Aside from the modest intergenerational cash flow smoothing of the "smoothed pay as you go" system required by
assumed lower taxes when the NZSF is drawn down. Given the expected higher overall levels of taxation during the draw down, the value of future lower taxes derived from the NZSF’s tax smoothing effect might be higher than the costs incurred during the build-up. See, for example, Creedy (2003) where the ‘excess burden’ of tax is estimated as the “square of the tax rate”. That ‘compensatory’ effect depends on future governments reducing overall tax levels by the full value of the drawdown from the NZSF – see paragraph 4.6.3. However, that potential saving comes, currently, at a high cost.
25
the NZS Act, the NZSF could also help to partially insulate the New Zealand economy from internal economic shocks. On that basis, it will act like an insurance fund but only to the extent the money is invested in other economies. The NZSF would then be diversified away from the economy that could most directly affect the affordability of NZS (New Zealand’s).
If the local economy performs better than others, future retirees can look to the New Zealand economy itself for their retirement income security. By contrast, a relative under-performance by New Zealand would see the NZSF act as a form of risk-sharing.
In the first case of relative over-performance locally, the cost of that insurance will be the likely relatively poor performance of the NZSF.
However, it is probably inappropriate for a government to intermediate that form of risk-sharing. The better alternative would probably be for individuals/businesses to undertake that.
With that background, it seems difficult to explain why the NZSF’s overseas investments are currently almost wholly hedged back to the New Zealand dollar:
“At the end of May 2010, the foreign currency exposure was approximately 76.8% hedged back to NZD.” (New Zealand Superannuation Fund, 2010, p. 3)24
One explanation might be that this exposure is a currency play because the Guardians expect the New Zealand dollar to rise against other currencies. The alternative, more likely explanation is that the Guardians do not want to run the short-run political risk of exposing the NZSF to sudden swings in capital values based solely on the relationship between the currencies of the countries the NZSF invests in and the New Zealand dollar25. This sees the Guardians’ taking an unnecessarily short-term perspective to what should be a long-term issue, given the nature of the liabilities the NZSF is intended to pre-fund. Any suggestion that NZS is a New Zealand dollar-denominated liability is misplaced. NZS is effectively a New Zealand economy-denominated liability. As has already been explained, the ultimate security of future payments of NZS depends on the strength of the economy.
Investing such a large amount overseas raises two further issues:
4.7.3 Exchange rate impact: First, there is the immediate impact on New Zealand's exchange rate as the investment money flows overseas. Then, the impact will be reversed as that money comes back into New Zealand to help finance the consumption of tomorrow’s retirees.
4.7.4 Timing of draw down: The citizens of all other developed countries face similar but, in most cases, more serious ageing issues than New Zealand. Just as New Zealand will want to be drawing down on the NZSF to meet payments to superannuitants, other baby boomers around the world will already have started their draw-downs.
Some suggest that such a co-ordinated withdrawal of money from markets to pay for retirement consumption will have a significant, negative impact on global asset values26. Shifting the investment
24 Overseas investments totalled 72.2% of the portfolio at 31 May 2010.(New Zealand Superannuation Fund, 2010, p. 3) 25 The NZSF states (New Zealand Superannuation Fund, 2008): “To reduce the volatility of returns due to exchange rate fluctuations, the majority of non-New Zealand exposure is hedged back to New Zealand dollars.” 26 See, for example, Börsch-Supan (2006). An alternative view can be seen at Bohn (2006).
26
response to the ageing issue from individuals to the government, as the NZSF implies, does not change that risk but could magnify it. Individuals are more likely to respond rationally with their own money to this issue than can governments that make decisions about taxpayers’ money and that aren’t directly accountable for the outcome.
The final investment issue extends the ‘debt versus investment’ argument, already described in section 3 in a ‘total accounting context’.
For individuals, paying off debt before investing for retirement income is a sensible strategy. The most important reason for that is tax: it is very difficult for future, after-tax investment returns to exceed the interest rates charged on personal debt, the cost of which is normally not deductible. Reducing debt is effectively an investment with a guaranteed return equal to the interest rate avoided. However, reducing risk is also important. Given the volatility of interest rates, paying off debt also reduces a family’s exposure to risk.
Similar arguments apply to the NZSF when examining the government’s balance sheet in a ‘total accounting context’. Investment logic says that returns from investing in shares should be higher over the long term than the cost of debt. However, they might not be, as has been demonstrated by the last six years; and they were not higher for a New Zealand investor, even over the last 18 years as section 3 has shown. The risk that after-tax returns might be less than the cost of debt should favour the repayment of debt by the government over portfolio investment through the NZSF. This argument should also preclude the inclusion of any government debt (bills or bonds) in the NZSF’s portfolio. Maintaining debt in the government’s balance sheet while investing in other governments’ debt (or especially New Zealand government debt) through the NZSF makes little investment sense27.
At 30 June 2009, the NZSF’s $13.7 billion is effectively equivalent to 11.6% of the government’s overall liabilities in a ‘total accounting context’ (see Chart 1). If the logic of investing in the presence of debt prevailed then there would be a theoretical case to double the amount of effective debt to, say, $27.4 billion and invest it all through the NZSF. If that doesn’t sound sensible then neither is the concept of building, or even maintaining the NZSF in the presence of debt.
To summarise the investment perspective, the unintended consequences of the NZSF may be that:
(a) The NZSF increases New Zealand's exposure to risk in the short run (exchange rate; interest rates vs. portfolio returns) and also in the long-term as New Zealand reaches its peak retirement income demand period later and less severely than most other developed countries.
(b) The NZSF’s indirect investments in other countries’ businesses are more likely to produce lower returns for New Zealand than would be produced for the country if New Zealanders made their own decisions with their own money.
4.8 The investment process The NZSF is managed independently of the government on an arms-length, ‘commercial’ basis. All the risk, however, remains with the government in the first instance (and ultimately with taxpayers) because the level of NZS payments will continue to be determined by the government. As the history of the last 30 years has shown, that is a political issue. The cost of those future payments of NZS will not be directly related to the level that would be
27 At 30 June 2009, the NZSF had no investments in New Zealand government debt (3.9% in 2008) and only 1.3% of its investments in other local fixed interest investments (Guardians of New Zealand Superannuation, 2009b, page 77).
27
actuarially prudent given the levels of the NZSF and income tax. There can therefore be no suggestion that the government can reduce the future risk posed by its current promise to pay NZS to present and future retirees.
Because of almost inevitable political interference and the politicised nature of the NZSF, the returns from the NZSF are likely to be lower over the longer term than the returns from other equivalent, politically unconstrained funds. 4.9 The lessons of history History seems also to be against the long-term survival of the NZSF. The 1938 social security “charge” (1/- in every £1 or 5%) was intended to fund the contributory health and welfare programmes that were charged to the Social Security Fund by the Social Security Act 1938. A 1958 change credited the successor to the charge (the Social Security Income Tax of 1/6 in every £1 or 7.5%), to the Consolidated Fund to which social security and other spending was then debited. The separate tax was eventually abolished on the recommendation of the Ross Committee because it reflected "an artificial splitting of tax receipts" and social security spending had consistently exceeded the level of the tax (Ross, 1967). The current government has suspended contributions to the NZSF until 2020. It remains to be seen whether contributions are resumed. The lessons of the last 30 years suggest that what is perhaps more likely is for the NZSF to be disbanded. 4.10 The impact on saving decisions People are more likely to save for retirement if they doubt the future sustainability of NZS or think it will not be enough to meet their retirement income needs. The last government suggested that the NZSF would put an end to that uncertainty.
Relative certainty of outcomes should undoubtedly form a significant plank of any retirement income system. Given the importance of NZS to the retirement incomes of today’s pensioners (and probably tomorrow’s), its sustainability is of considerable significance. However, in another example of the law of unintended consequences that afflicts modern government, the mere existence of the NZSF and its seemingly substantial appearance might induce New Zealanders to save less than they would otherwise have done28.
The NZSF does not answer the affordability issue, as stated in paragraph 4.5 so, the NZSF may lead New Zealanders to save less while at the same time it fails to address the issues of sustainability that really matter to NZS. 4.11 Politicising the problem David Thomson argues (Thomson, 1991) that the history of the welfare state in the latter half of the 20th Century was a direct response to the needs of the baby boom generation and its parents. From birth, education, household formation, health care and retirement income provision for their parents, Thomson suggests that the baby boomers are the “selfish generation”.
The NZSF might be seen by future taxpayers as an attempt to lock in benefits that the country might subsequently discover that it cannot afford.
The growing NZSF is already the largest local pool of investment capital and will grow especially if contributions resume, as intended, in 2020. The NZSF
28 As was noted by The Treasury in a report to the government before the NZSF started (The New Zealand Treasury, 2000b).
28
could, in fact, be an impediment to needed change in NZS itself. It may be that this was what the last government intended.
The NZSF may therefore tend to politicise the issue of a sustainable NZS. In other words, as the most visible flagship of Thompson’s “selfish generation”, the NZSF may increase policy uncertainty rather than reduce it.
Another political dimension to the NZSF’s establishment is derived from the almost embarrassing fiscal surpluses the last government ran for the nine years it held office. It apparently preferred to lock up surpluses under the government’s control rather than alternatives such as:
• Initiating further spending programmes, such as investment in infrastructure;
• Reducing debt and then resisting pressures to raise further debt to fund additional spending29;
• Reducing taxes and let taxpayers decide whether they wanted to save the tax reductions for their retirement.
29 As part of the background papers to the establishment of the NZSF, the Treasury suggested that “...pre-funding may provide greater fiscal discipline on government than debt repayment or a general accumulation of assets, as it ensures some of the future costs of provision for retirement are taken into account in current fiscal decisions.” (The New Zealand Treasury, 2000a)
29
5. Conclusion – partial pre-funding an ineffective distraction New Zealand faces an ageing population with fewer workers supporting a growing retired population. There has been a long period of policy instability on retirement income issues over the last 35 years: see Littlewood (2008). The last government intended that the NZS Act and the NZSF would add stability. Because of the significance of NZS to most New Zealanders’ retirement income security, public policy on this component of retirement income in New Zealand sends quite powerful messages to individuals. If New Zealanders are to behave ‘sensibly’, there must be a settled framework. Viewed through the microscope of the ‘total accounting context’, the NZS Act and the NZSF seem little more than fiscal and political window-dressing. Their unintended consequences are likely to be greater instability in public policy at a greater cost than the pure PAYG alternative. Before New Zealand can discuss how to meet the future cost of NZS, it must settle the benefit design for New Zealanders who retire after, say, 2030. From comments made by the current government, it seems that the presence of the NZSF and the political backdrop provided by the last 30 years might be impediments to that needed discussion30. The Prime Minister said after the 2009 Budget changes to the NZSF (see section 2.6 above) that he would resign rather than reduce NZS entitlements:
“The Government is committed to these settings and I have said many times that I would rather resign rather than change them.”(Key, 2009b)
Before deciding how to pay for NZS, New Zealand should first decide what it should pay for. New Zealand must choose the ‘best’ design for NZS. Only then should cost considerations become significant to assess the impact of the growth in numbers of pensioners. That may require aspects of the ‘best’ design to be modified. No other process can produce an answer that might be sustainable over generations. The benefit design is the only thing that will directly affect the cost of NZS. The NZSF is not relevant in that regard. Regardless of the way in which NZS is funded, the cost of the scheme will be the benefits that are paid. If New Zealand is concerned about the future cost of NZS, it must first discuss the benefit design. At best, the NZSF will make a relatively minor contribution to a partial inter-generational smoothing of cash flows. At worst, it could increase costs (the case to date), constrain growth, increase risk, reduce private savings and provide a distraction to the real issues that affect the size and shape of NZS. The NZSF should therefore be dismantled and NZS returned to the original, pure PAYG model.
30For example, see Key (2009a): “The Government has therefore decided to take the sensible step, and hold off making full contributions to the Super Fund until the Government runs an operating surplus sufficient to fund those contributions. I cannot stress enough that this move does not have any detrimental impact on New Zealand Superannuation entitlements, either in the short-term or in the longer term. The bottom line for this Government is preserving current Superannuation entitlements. We will maintain payments at a minimum of 66 per cent of the average wage, and people will continue to be eligible for Super when they reach the age of 65. Future funding at this level is locked into the Government’s long-term spending path and is reflected in all of the Budget projections. In fact it is quite correct to say that, far from putting anything at risk, the combination of measures we have taken in this Budget actually secures Superannuation entitlements in the future.”
30
References Barr, N. A. (1979). Myths My Grandpa Taught Me. Three Banks Review, 124, 27-
55. Barr, N. A. (2000). Reforming Pensions: Myths, Truths, and Policy Choices
(Working paper No. 139). Washington: International Monetary Fund. Becker, G. (1985). Public policies, pressure groups, and dead weight costs.
Journal of Public Economics, 329-487. Björksten, N., & Karagedikli, Ö. (2003). Neutral real interest rates revisited.
Retrieved. from http://www.rbnz.govt.nz/research/bulletin/2002_2006/2003sep66_3bjorkstenkaragedikli.pdf.
Bohn, H. (2006). Optimal Private Responses to Demographic Trends: Savings, Bequests and International Mobility: University of California Santa Barbara.
Börsch-Supan, A. (2006). Demographic Change, Saving and Asset Prices: Theory and Evidence: Mannheim Research Institute.
Creedy, J. (2003). The Excess Burden of Taxation and Why it (Approximately) Quadruples When the Tax Rate Doubles: The Treasury.
Cullen, M. (2000a). Pre-funding New Zealand Superannuation: Funding Arrangements. Retrieved. from http://www.treasury.govt.nz/government/assets/nzsf/release/nzs-funding.pdf.
Cullen, M. (2000b). Questions and answers on the proposed NZ Superannuation Fund [Electronic Version] from http://www.beehive.govt.nz/speech/questions+and+answers+proposed+nz+superannuation+fund.
Cullen, M. (2001). Legislation offers chance to put super above politics [Electronic Version] from http://www.beehive.govt.nz/node/9207.
Diewart, E., & Lawrence, D. (1996). The deadweight costs of taxation in New Zealand. Canadian Journal of Economics, 29, S658-S673.
Diewart, E., & Lawrence, D. (2001). The Marginal Excess Burden of Capital Taxation in New Zealand: The New Zealand Treasury.
English, B. (2009). Budget Speech. Retrieved. from http://www.treasury.govt.nz/budget/2009/speech/b09-speech.pdf
Grimes, A. (2001). Crown Financial Asset Management: Objectives and Practice: The New Zealand Treasury.
Guardians of New Zealand Superannuation. (2009a). Annual Report 2009, Editorials.
Guardians of New Zealand Superannuation. (2009b). Annual Report 2009, Financial Statements.
Hayward, T., Dyer, P., & Frogley, R. (2007). Strategic Asset Allocation Review: New Zealand Superannuation Fund.
Key, J. (2009a). Budget 2009 - The Road To Recovery [Electronic Version] from http://www.national.org.nz/Article.aspx?ArticleID=30088.
Key, J. (2009b). Protecting Superannuation in tough economic times [Electronic Version] from http://blog.labour.org.nz/wp-content/uploads/2009/07/key-super-letter.pdf.
Littlewood, M. (2008). A condensed history of public and private provision for retirement income in New Zealand - 1975 - 2008 [Electronic Version]. Pensionbriefing, 05, 8 from
31
http://www.rprc.auckland.ac.nz/uoa/business/retirement-policy-and-research-centre/briefing-papers.cfm.
Littlewood, M. (2009). Why does the Accident Compensation Corporation have a fund? [Electronic Version]. PensionBriefing 2009-1 from http://www.business.auckland.ac.nz/Portals/4/Research/ResearchCentresGroups/RPRC%20commentary/PC2009-1-WhyShouldTheACCbePre-funded12.10.09.pdf.
Littlewood, M. (2010). Pre-funding a government's future financial obligations - the New Zealand Superannuation case study New Zealand Economic Papers, Volume 44(Issue 1 April 2010 ), 91 - 111.
Mercer. (2009). Review of the Guardians of New Zealand Superannuation. Ministry of Health. (2004). Population Ageing and Health Expenditure: New
Zealand 2002 – 2051. National Party of New Zealand. (2008). 2008: NZ Superannuation Fund
[Electronic Version] from http://www.national.org.nz/Article.aspx?ArticleID=28791.
New Zealand Superannuation Fund. (2008). Strategic Asset Allocation. from http://www.nzsuperfund.co.nz/index.asp?pageID=2145876522#--foreign-currency-exposure
New Zealand Superannuation Fund. (2009). Executive Summary - 2009 Annual Report [Electronic Version] from http://www.nzsuperfund.co.nz/files/Executive%20Summary%20-%20Annual%20Report.pdf.
New Zealand Superannuation Fund. (2010). Portfolio and performance update to 31 May 2010 [Electronic Version] from http://www.nzsuperfund.co.nz/index.asp?PageID=2145855927.
Ross, L. N. (1967). Taxation in New Zealand: Report of the Taxation Review Committee.
Statistics New Zealand. (2008). National Accounts: Year ended March 2008 - GDP Breakdown. Retrieved. from http://www.stats.govt.nz/browse_for_stats/economic_indicators/nationalaccounts/nationalaccounts_hotpyemar08.aspx.
The New Zealand Treasury. (2000a). Macroeconomic effects of the proposal for prefunding New Zealand Superannuation. from http://www.treasury.govt.nz/
The New Zealand Treasury. (2000b). Pre-Funding New Zealand Superannuation: Effect on Private Saving (Report). Wellington.
The New Zealand Treasury. (2004). New Zealand Superannuation Fund Contribution Rate Model. Retrieved. from.
The New Zealand Treasury. (2009a). Challenges and Choices: New Zealand's Long-term Fiscal Statement.
The New Zealand Treasury. (2009b). Financial Statements of the Government of New Zealand.
The New Zealand Treasury. (2009c). The impact of an eleven year contribution holiday on the New Zealand Superannuation (NZS) Fund. Retrieved. from http://www.treasury.govt.nz/government/assets/nzsf/contributionratemodel/nzsf-11yrhol-29may09.pdf.
The New Zealand Treasury. (2010a). 2010 Budget Economic and Fiscal Update New Zealand Superannuation Fund Contribution Rate Model [Electronic Version], New Zealand Superannuation Fund Contribution Rate Model from
32
http://www.treasury.govt.nz/government/assets/nzsf/contributionratemodel.
The New Zealand Treasury. (2010b). Fiscal Strategy Report. Retrieved. from http://www.treasury.govt.nz/budget/2010/fsr/b10-fsr.pdf.
Thomson, D. (1991). Selfish Generations? The Ageing of New Zealand’s Welfare State. Wellington: Bridget Williams Books.
Treasury, T. N. Z. (2003). Chart for Retirement Commission. In L. T. F. M. 2003 (Ed.).
Warren, D., & Oguzoglu, O. (2007). Retirement in Australia: A Closer Look at the Financial Incentives.