Embed Size (px)
Citation preview
Distributional implications of tax evasion in Greece
Manos Matsaganis
Athens University of Economics & Business
Maria Flevotomou
Bank of Greece
Abstract
The shadow economy and resulting tax evasion are both very widespread in Greece (up to 37% and 15% of GDP respectively, according to some estimates). This has adverse effects in terms of horizontal and vertical equity, as well as in terms of efficiency. The paper takes advantage of access to a large sample of income tax returns (approximately 41,300 tax payers in 27,700 tax units, a fraction of 0.53%) in Greece in 2004/05. Specifically, the paper compares incomes reported in tax returns with those observed in the household budget survey of the same year. It then calculates ratios of income under-reporting by region and main source of income. The synthetic distribution of reported income is then fed into a tax-benefit model to provide preliminary estimates of the size and distribution of income tax evasion. Income under-reporting in Greece is estimated at 10%, resulting in a 26% shortfall in tax receipts. The paper concludes that the effects of tax evasion are higher income inequality and poverty, as well as lower progressivity of the income tax system.
Keywords: tax evasion, inequality, microsimulation
JEL subject codes: H26, H23
Acknowledgements
Earlier versions were presented in Dublin (September 2007), Vienna (November 2007), Athens (April 2008) and Milan (June 2008). We are grateful for comments and suggestions to Carlo Fiorio, Daniela Mantovani, Panos Tsakloglou, Emmanuel Saez and two anonymous referees. The microsimulation model EUROMOD (of which we used version 31A) is being continually improved and updated, and the results shown here represent the best available at the time of writing. We remain responsible for any errors, interpretations or views presented. Our research is part of the “Accurate Income Measurement for the Assessment of Public Policies” project, funded by the European Commission under the Integrating and Strengthening the European Research Area programme (Project no. 028412). Additional financial support from the General Secretariat of Research and Technology of the Hellenic Republic (grant no. 03Ε∆319/8.3.1) is also acknowledged.
1
Introduction
Income tax evasion raises significant issues from the point of view of distributional analysis. In
terms of horizontal equity, individuals with similar income may differ in terms of inclination and
opportunity to under-report it. As a result, tax evasion violates notions of fairness and equal
treatment, and undermines the idea of reciprocity which lies at the heart of the social contract
between tax payers and the state.
In terms of vertical equity, “if the poor had more opportunity of evading taxes than the rich, or
were better at it, then the egalitarian policy maker might have good reason to smile indulgently on
evasion: up to a point anyway” (Cowell, 1987). However, it could also be that tax evasion softens
rather than strengthens the redistributive impact intended by the tax schedule. Either way, ignoring
tax evasion is likely to cause decision makers and policy analysts seriously to misjudge the
distributive and fiscal effect of changes in social benefits and the tax system.
Moreover, tax evasion has profound implications for efficiency as well, as lower revenues
might ultimately lead to higher tax burdens on those who do pay. Moreover, given that opportunities
to evade differ by occupation or/and sector of the economy, it seems reasonable to assume that tax
evasion also distorts labour supply decisions (Frederiksen et al., 2004), although it is not always
possible to confirm this assumption empirically (Parker, 2003).
The aim of this paper is to provide preliminary estimates of the size and distribution of
income tax evasion in Greece (where, as discussed in the next section, the informal economy is
widely held to be very extensive).
The paper takes advantage of access to a random sample (approximately 0.53%) of income tax
returns filed in 2005 reporting on incomes earned in 2004, containing information on 41,283
individual tax payers in 27,714 tax units, provided to the authors in anonymised form by the Greek
Ministry of Economy and Finance.
The structure of the paper is as follows. Section two offers a literature review. Section three
presents the data and explains the methodology. Section four reports the results. Section five
discusses the results. Section six concludes with a discussion of policy implications and issues for
further research.
Literature review
Theoretical contributions to the study of tax evasion took off following the seminal work of
Allingham and Sandmo (1972). Assuming a benevolent dictator maximising social welfare, their
2
model assumes rational tax payers who – given income, the marginal tax rate, the subjective
probability of detection and the penalty rate –decide upon the optimal amount evaded. The model
predicts that tax evasion is optimal as long as the expected penalty rate is less than the regular tax
rate, whereas the extent of tax evasion is negatively correlated with the probability of being caught
and the size of punishment if caught. The model initiated a great amount of theoretical work in the
optimal taxation literature, most of which is concerned with solving the puzzle that it predicts too
much tax evasion relative to what is observed in reality (see for example Sandmo, 1981, Andreoni
et al., 1998, Pestieau et al., 2004, Sandmo, 2004). A different approach is adopted in the public
choice literature, which sees both formal and informal activities as the result of self-interested
decision makers maximising their own utility. Within this framework, tax payer behaviour is
determined by tax morale, trust in government and civic virtue (Frey, 1989, Pommerenhe et al.,
1994, Wintrobe, 2001, Frey, 2003, Frey and Torgler, 2007).
Empirical research on tax evasion is only loosely connected to theory. Many studies aim at
identifying the determinants of tax evasion, such as socio-demographic characteristics, evasion
opportunities and the marginal tax rate. Typical in this field are studies using tax audit data in the
US collected under the Taxpayer Compliance Measurement Program. The conclusions of these
studies do not always point to the same direction. For instance, whereas Clotfelter (1983) found a
positive and significant relationship between the tax rate and tax evasion, Feinstein (1991) reached
the opposite conclusion. However, there seems to be some consensus that non-compliance is more
common among married men, aged under 65, often with a regular job in a skilled occupation, while
it is more extensive in the construction and agricultural sectors.
The role of evasion opportunities has been explored through both experimental and
econometric methods. Whereas the former present a consistent picture of a positive relationship
between evasion opportunities and tax evasion, the latter often provide ambiguous results. In fact,
recent research (Sheffrin and Triest, 1992, Gërxhani and Schram, 2006, Fortin et al., 2007,
Schneider and Torgler, 2007) has questioned the assumption that tax payers have objective
knowledge of the audit rate, arguing instead that subjective views on detection chances and actual
tax evasion behaviour might be guided by attitudes toward government and/or social interactions.
The largest body of empirical studies is concerned with the measurement of tax evasion.
Various methods have been employed for that purpose, including the use of tax audit data. Tax audit
data compare tax payer’s reports and Inland Revenue corrections by item, providing detailed
3
information on non-compliance which can be further enriched if linked to census data (Beron et al.,
1992).
Income surveys provide an alternative source of information on non-compliance. On the
grounds that tax evaders have no incentive to conceal their true income when responding to an
income survey, some studies have combined survey information with random samples of tax forms
in order to estimate tax evasion. For example, in their study of tax evasion in Italy Fiorio and
D’Amuri (2005) applied a direct estimation methodology whereby the positive difference between
income net of all taxes and social insurance contributions from the Bank of Italy’s Survey of
Household Income and tax return data was considered concealed taxable income linked to tax
evasion.
In contrast, the consumption-based approach assumes that income surveys are unreliable
(Pissarides and Weber, 1989, Lyssiotou et al., 2004). The main intuition here is that if the self-
employed and dependent employees have the same preferences regarding food, and if the latter
truthfully reveal their income in a survey, then estimated differences in the relationship of reported
income to food expenditure between the two groups can be attributed to income under-reporting on
the part of the self-employed. More recently, a variation of this approach was applied to unaudited
tax returns, when Feldman and Slemrod (2007) derived measurements of non-compliance from the
relationship between charitable contributions and reported income from wages and salary as
compared to alternative reported income.
Another source of information on the size of tax evasion comes from measurements of
discrepancies in economic statistics. Examples include comparing National Accounts income to
income reported to the tax authorities or comparing actual tax revenue to theoretical tax revenue
according to tax legislation. Finally, information on the magnitude of tax evasion may be retrieved
from macro studies of the informal or shadow economy (Schneider and Ernste, 2000, Lacko, 2000,
Schneider, 2002, Schneider, 2004, Schneider and Klinglmair, 2004, Schneider and Torgler, 2007).
Some of these studies have been extensively criticized (Caridi and Passerini, 2001, Breusch, 2006,
Hanousek and Palda, 2006), on the grounds that their estimates rely not only on the realism of the
model but also on the constancy of key parameters. For example, the demand-for-currency approach
relies on the stability of the money demand equation as it amounts to fitting a currency demand
equation to calculate expected currency holdings, which are then recalculated based on a constant
minimum level of tax. The difference is taken to represent the extra currency held in each period as
a result of informal activities.
4
In Greece, empirical studies have estimated the size of the shadow economy at between 28%
and 37% of GDP (Institute of Mediterranean Studies, 1991, Kanellopoulos et al., 1995, Schneider
and Ernste, 2000, Tatsos, 2001, Schneider and Klinglmair 2004). In particular, Tatsos (2001)
estimated the size of the shadow economy and tax evasion in Greece in 1997 at 36.7% and 14.7% of
GDP respectively. He found that the population groups most inclined to underground activities are
high income earners, those aged less than 35 years old, those living in agricultural or touristic areas,
students and the unemployed. Among shadow economy participants, predominant are skilled
craftsmen, farmers, lawyers, lower education groups, and tax payers in two-member households.
Data and methodology
Our estimation of the size and incidence of tax evasion draws on two sets of data: (a) the micro-data
from a household budget survey, and (b) a large sample of income tax returns randomly drawn for
the purposes of this study. The two datasets can be briefly described as follows.
(a) The 2004/05 Household Budget Survey, carried out by the National Statistical Service in
Greece, covers the income year starting February 2004 and ending January 2005. HBS 2004/05
contains detailed information on the demographic characteristics, expenditure patterns and incomes
of 17,386 individuals in 6,555 households.
(b) A sample of income tax returns in 2004/05, drawn from a 0.53% sample of unaudited tax
returns, contains information on the demographic and other characteristics of tax units, as well as on
incomes earned in 2004 (reported in tax year 2005). Our sample covers 41,283 tax payers and
12,203 children and other dependents in 27,414 tax units.
By analysing these data, and by comparing them with each other, we construct (i) a
distribution of “true income”, as observed in HBS 2004/05 but corrected for measurement errors,
and (ii) a synthetic distribution of “reported income”, assumed to be revealed to tax authorities, also
based on the HBS 2004/05 but corrected for income under-reporting in the light of information
derived from the sample of income tax returns.
The crucial assumption here is that respondents to the HBS truthfully reveal their income to
survey interviewers. Given that there is evidence that this may not always be the case, our
estimation of tax evasion will be biased downwards, i.e. it will provide a lower-bound estimate of
the true size of tax evasion.
We begin by adjusting the income components as reported in the HBS 2004/05 in order to
create a synthetic distribution mirroring the distribution of income reported to the tax authorities.
5
The main methodological issues involved here are: (a) ensuring that variables are consistently
defined in the two datasets, (b) identifying the reference population, and (c) obtaining adjustment
factors to correct reported incomes for under-reporting with a view to evading tax.
With respect to defining variables consistently, the income concepts used in the two datasets
had to be comparable.
On the one hand, in tax returns all incomes are obviously reported gross of income tax. Self-
employment incomes, whether from agriculture or not, are gross of social insurance contributions
too. In contrast, wages, salaries and pensions are reported net of social contributions.
On the other hand, in household budget surveys all incomes are reported net of social
contributions and income tax. As a consequence of that, a tax-benefit model had to be used to
compute income taxes (and, in the case of the self-employed, social contributions), which were then
added to the net incomes reported in the HBS 2004/05.
Furthermore, other (i.e. non-agricultural) self-employment income was made to include
property income and maintenance income in both datasets, for the sake of consistency.
With respect to identifying the reference population the aim was, on the one hand, reweighting
the tax return sample on the basis of aggregate data on the entire population of individuals filing a
tax return; on the other hand, reconciling the reweighted tax return sample with the HBS 2004/05.
The tax return sample was reweighted by occupation and region in terms of both the
population distribution as well as the corresponding distribution of average household (tax unit)
income.
Then the reweighted tax return sample had to be reconciled with the HBS 2004/05 to ensure
that the population of those filing a tax return was similar in the two datasets. Two alternative
reference populations were examined: those reporting non-zero incomes, and those with non-zero
tax liabilities.
In the former case, the relevant population was identified on the basis of tax legislation,
stipulating that farmers and others earning less than €3,000 per annum (€6,000 in the case of
wage/salary earners with no other income) are exempt from the obligation to submit a tax return,
except if they are self-employed (not in agriculture), own a car or boat, have gross property income
over €600 per annum etc. Note that not all these conditions can be perfectly simulated, as the
relevant information is often not available.
6
In the latter case, the level of the tax-free personal allowance (€8,400 per annum in 2004, or
€10,000 in the case of employees and pensioners) was used to identify those with non-zero tax
liabilities.
The number of tax filers identified in the HBS 2004/05 was 9,736, of which 9,622 reported
non-zero incomes and 4,964 incomes above the tax-free allowance. Note, however, that not all
information to model the entire list of conditions which make filing a tax return compulsory was
available, as a result of which it is likely that the population of those filing a tax return derived as
above is a lower-bound estimate.
By contrast, our sample of tax returns by definition comprises tax filers only. Our original
sample was reduced to 34,213 persons reporting positive incomes, of which 14,444 reported
incomes above the tax-free allowance.
Having to choose between the two alternative reference populations (those with non-zero
income, and those with non-zero tax due), we opted for the second option. The rationale was that
the obligation to fill in a tax return could not be perfectly simulated, as a result of which the
population of tax filers in the HBS was too dissimilar to that in the sample of tax returns. For
instance, the proportion of tax filers below the tax-free personal allowance (€8,400 per annum, or
€10,000 in the case of employees and pensioners) was significantly higher, and their average income
significantly lower, in the sample of tax returns compared to the HBS.
Finally, with respect to obtaining adjustment factors (needed to correct incomes for tax
evasion), we allocated the reference population of tax filers above the tax-free allowance into 16
categories defined as combinations of macro-region and main source of income. More specifically,
the four macro-regions were Greater Athens, Northern Greece (Thrace, Macedonia and Thessaly),
Southern Greece (Central, Western and Peloponnese), and the Islands (Aegean, Ionian and Crete),
while the four sources of income were wages and salaries, pensions, income from self employment
in agriculture, and other self-employment income.
Adjustment factors were ratios of “reported” to “true” income. More formally, let i denote the
macro-region and j the main source of income. Let Tjiy , denote the average true income as reported
in the HBS in region i of those whose main source of income is j, and Rjiy , denote the corresponding
average reported income as reported to the tax authorities. Further, let Tjy denote the national
7
average true and Rjy the national average reported income for individuals with main income source
j. Each of the 16 adjustment factors jia , was then defined as follows:
Tji
Rji
ji y
ya
,
,, =
i = A, N, S, I j = W, P, Ag, Se
Where:
A = Athens, N = Northern Greece, S = Southern Greece, I = Islands
W = wages and salaries, P = pension income, Ag = self-employment income from agriculture,
Se = other self-employment income.
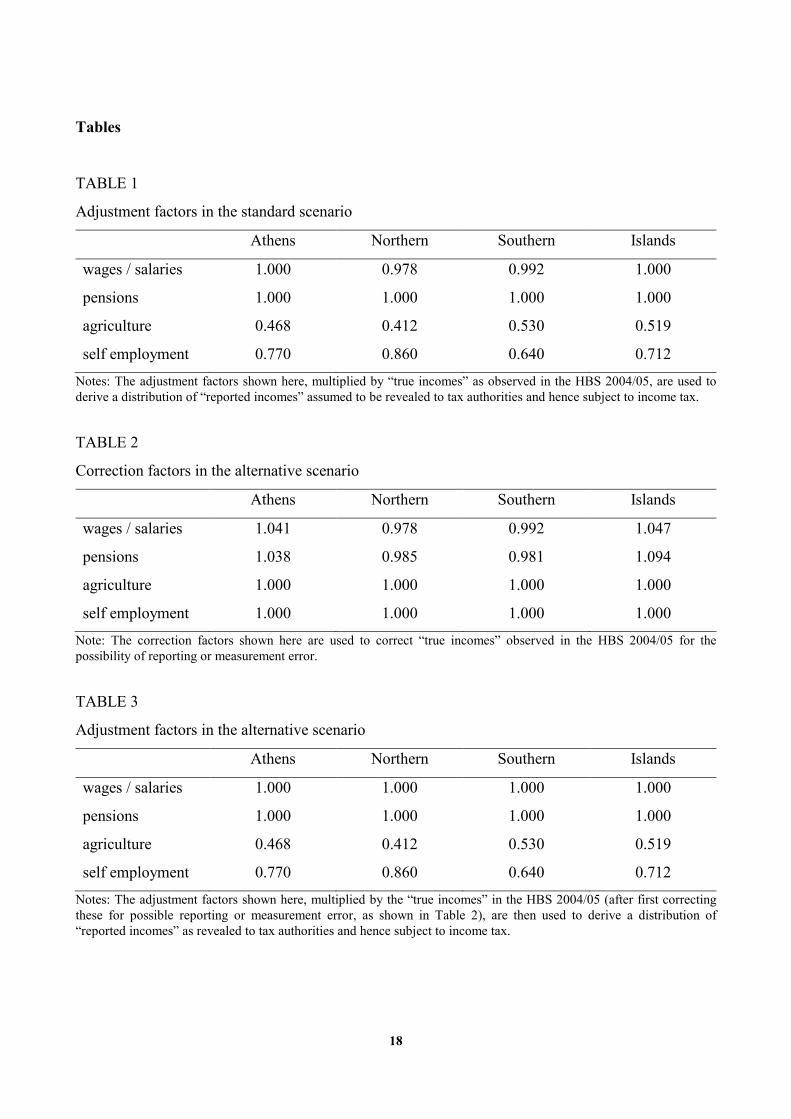
In our standard scenario adjustment factors for pension incomes were set equal to one
irrespective of the ratio of “reported” to “true” incomes found ( 1, =Pia , i∀ ), on the grounds that it is
virtually impossible to under-report (or, for that matter, over-report) one’s pension in tax returns, as
pension incomes reported in tax returns must accurately reflect the statements issued by the social
insurance agencies that pay pensions.
Moreover, small rates of over-reporting were actually observed for wages and salaries in
Athens and in the Islands (4.1% and 4.7% respectively). The corresponding adjustment factors were
set equal to one ( 1, =WAa ; 1, =WIa ), precluding the possibility of higher incomes reported in one’s
tax return than in the HBS ( jiyy Rji
Tji ,,,, ∀≥ ).
[TABLE 1]
Finally, the adjustment factor for income from agriculture in Athens was set equal to 1 minus
the national under-reporting rate for that income source (TAg
RAg
AgA y
ya =,
) as the relevant category was
critically small in the HBS (n=8). The resulting adjustment factors by income source and region are
shown in Table 1.
In our alternative scenario the possibility of reporting higher incomes in one’s tax return than
in the HBS was allowed and attributed to measurement or reporting error. More precisely, the
alternative scenario implies accepting that wages / salaries and pensions are incorrectly reported in
the HBS, and therefore correcting the original dataset in the light of information from tax return
data.
The correction factors jic , were calculated as follows:
8
=
1,
,
,Tji
Rji
ji y
y
c
SeAgj
PWj
,
,
=
=
i∀
These are shown in Table 2.
[TABLE 2]
Thereafter, the adjustment factors by income source and region in the alternative scenario
were set to one for income from wages / salaries and pensions ( 1, =jia , i∀ for PWj ,= ), ruling
out in the process the possibility of under-reporting such income, while remaining as in the standard
scenario in the case of income from self employment in agriculture and other self-employment
income. This is shown in Table 3.
[TABLE 3]
The implications of income under-reporting in terms of tax evaded and the resulting
distribution of (post-tax) disposable incomes were drawn out by using a tax-benefit model to
compare our approximation of the real world on the basis of our estimate of income under-reporting
by category, with the counterfactual of full tax compliance. The tax-benefit model used was the
Greek component of EUROMOD (http://www.iser.essex.ac.uk/msu/emod/).
Results
Our results for the standard scenario are summarized in Tables 4-7.
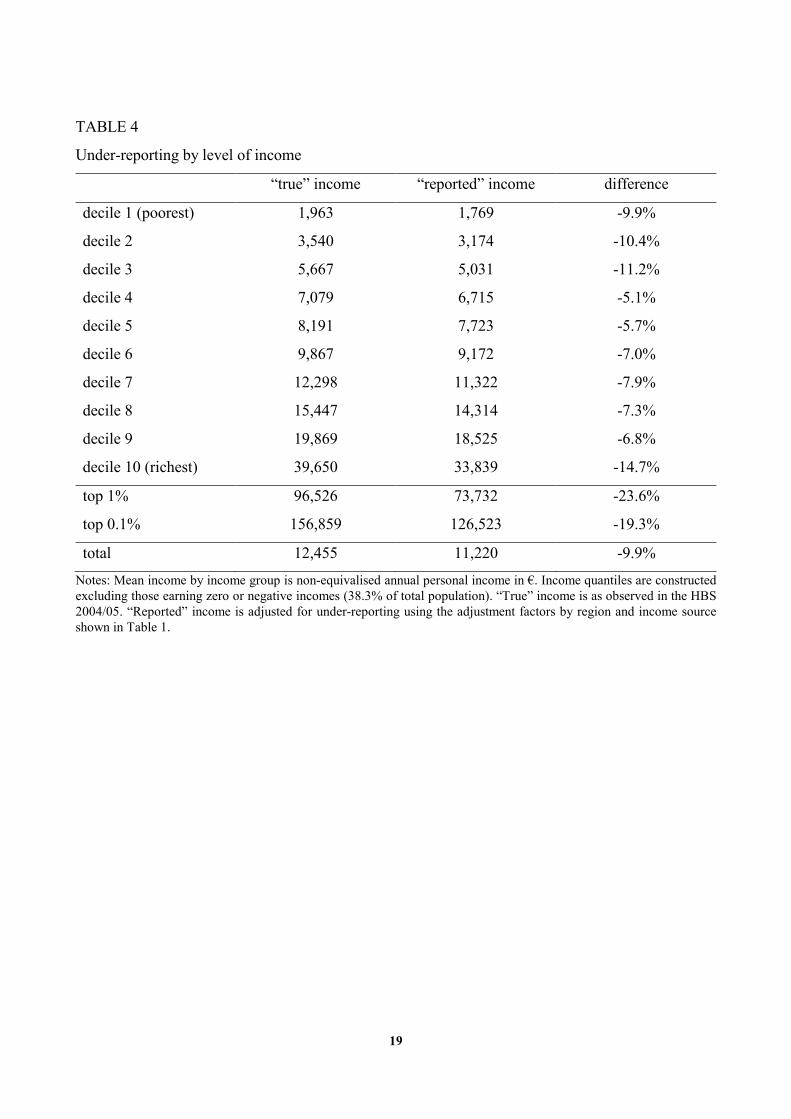
Table 4 shows how under-reporting varies by income group. The extent of income under-
reporting seems to be largest at the two ends of the income distribution. Income is mostly concealed
from the tax authorities by people in the top income decile (about 15%) followed by those in the
bottom three income deciles (10-11%). The average rate of under-reporting for the entire population
reporting positive income is almost 10%.
[TABLE 4]
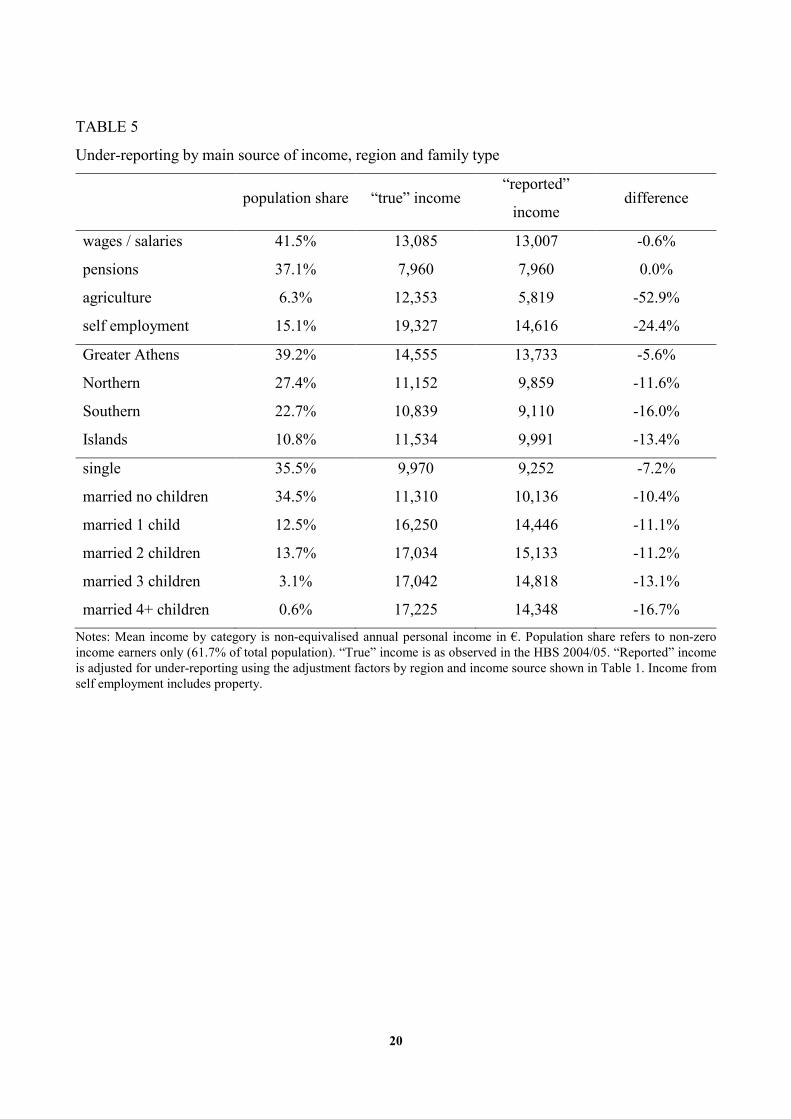
Table 5 shows rates of under-reporting alongside three dimensions: main source of income,
location and family status. In terms of main income source, those mainly earning self-employment
income from agriculture or other self-employment income are (as expected) most likely to under-
report their total income to the tax authorities: average under-reporting rates for these two categories
are 53% and 24% respectively, while those whose main source of income is wages and salaries or
pensions report more or less their true income in tax returns. In terms of region, under-reporting
9
appears to be most pronounced in Southern Greece (16%) and least so in Greater Athens (less than
6%). In terms of family status, income under-reporting seems to increase with family size: singles
under-report the least, while married people with four children under-report the most.
[TABLE 5]
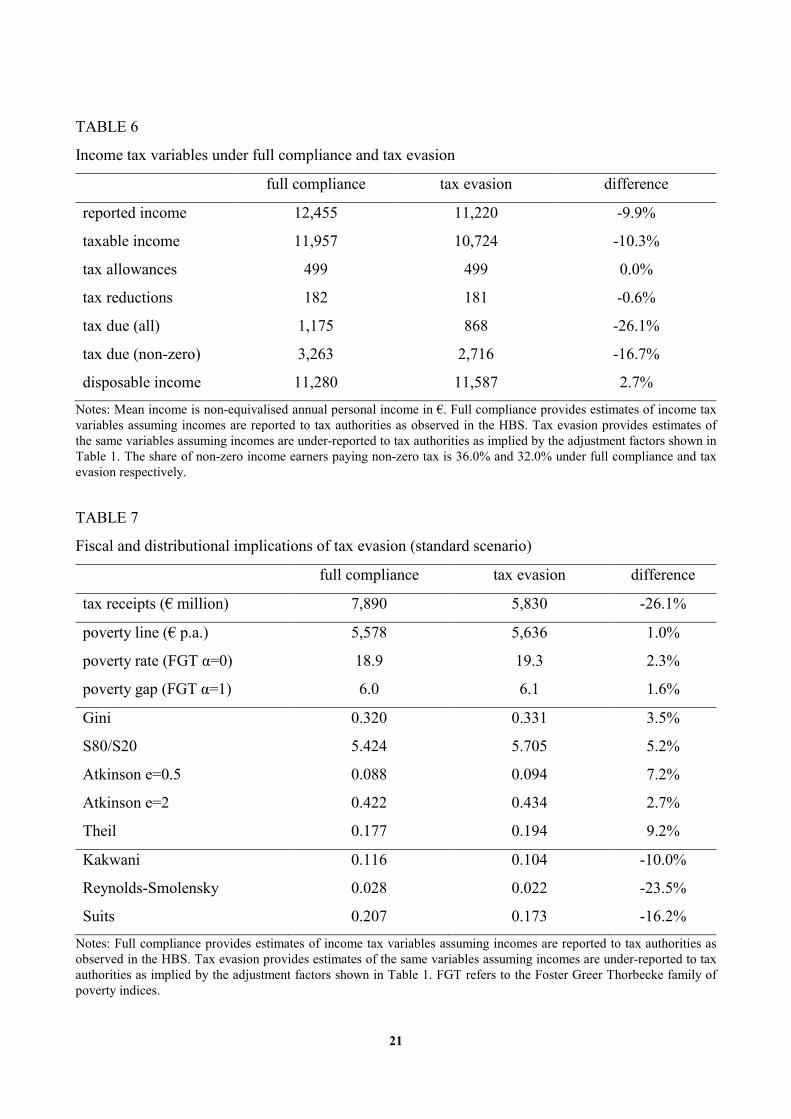
Table 6 presents our estimate of taxable income and the resulting tax liability under the
alternative assumptions of full tax compliance and income under-reporting respectively. The
findings worth highlighting are that under-reporting lowers taxable income by slightly more than
reported income; that tax allowances and reductions are broadly similar in the two datasets; and that
tax evasion reduces the income tax yield by 26.1%. The latter figure can be decomposed to 11.1%
fewer persons paying on average 16.7% less tax. As a result, average disposable income is 2.7%
higher under tax evasion.
[TABLE 6]
Table 7 presents the fiscal and distributional implications of tax evasion in terms of poverty
and inequality, tax progressivity, and tax receipts.
[TABLE 7]
As shown earlier, household disposable income is 2.7% higher under tax evasion than would
have been under full compliance. As a consequence, the poverty line (defined as 60% of median
equivalised household disposable income) is also higher – in this case by 1%. Furthermore, our two
poverty indices rise, suggesting that poverty is higher than would have been in the absence of tax
evasion. All five inequality indicators (S80/S20, Gini, Atkinson for e=0.5 and e=2, and Theil) have
higher values for “reported” than for “true” income, implying that tax evasion results in a more
unequal income distribution. Finally, the tax progressivity and redistribution indices (Kakwani,
Reynolds-Smolensky, Suits) indicate that income under-reporting renders the tax system more
regressive.
As mentioned above, tax evasion lowers the tax yield by 26.1%. Our estimate of income tax
receipts of €5.83 billion falls short of the official €6.66 billion figure by 12.4%. In order to examine
the possibility that the shortfall may be due to the assumptions relied upon to adjust incomes from
wages or salaries and pensions, we also tested the alternative scenario.
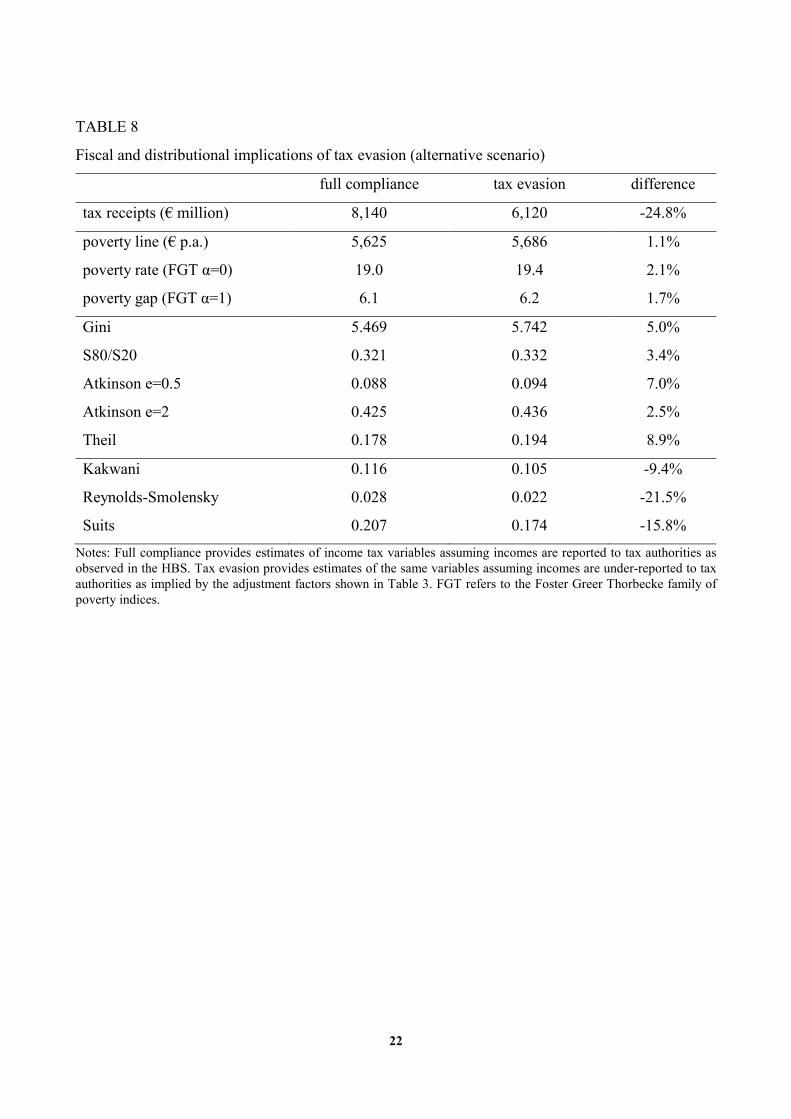
[TABLE 8]
The results of the alternative scenario in terms of income under-reporting (not shown here)
were very similar to those of the standard scenario, except that incomes were now under-reported by
10
a slightly smaller average rate (9.5% vs. 9.9%). The fiscal and distributional implications of tax
evasion under that scenario are shown in Table 8.
Again, the results in terms of poverty, inequality and tax progressivity are broadly in line with
our earlier findings. However, tax receipts are now estimated at €6.12 billion, falling short of the
official €6.66 billion figure for the tax year 2005 by only 8%. The residual shortfall may be due to
the fact that tax rules can only be imperfectly simulated on the basis of information available in the
HBS 2004/05 dataset.
Discussion
It may be useful to begin this section by summarizing the main findings of our work. As shown
above, the aggregate rate of income under-reporting for the purposes of tax evasion according to our
standard scenario is around 10%. Moreover, the distribution of under-reporting by income suggests
a U-shape: the rate of income under-reporting is 10-11% in the bottom 3 income deciles, falls to 5-
6% in deciles 4 and 5, rises slightly to 7-8% in deciles 6 to 9, and then sharply to almost 15% in the
top decile (24% in the top centile).
In other words, it appears that income under-reporting, for the purposes of tax evasion, is
higher in low-income groups than middle-to-high income groups, and highest in top incomes.
Under-reporting among those on low incomes suggests the existence of a large shadow economy
centred on precarious, unregistered, informal jobs (petits boulots). However, because of progressive
income taxation and significant tax-free allowances for single persons and especially families with
children, the effect on tax receipts of income under-reporting at low income levels is pretty minimal.
On the other hand, extensive income under-reporting at top incomes (as practised, for example, by
the medical profession and other such groups) translates into very significant losses in terms of tax
receipts, and must have considerable effects in terms of income inequality and the progressivity of
the income tax system in the real world.
Furthermore, income under-reporting by income source is close to zero with respect to income
from dependent employment and pensions, but seems to reach or exceed 53% and 24% with respect
to self-employment income (from agriculture or other activities, respectively). This is a striking
finding, but again quite consistent with the literature as well as prior notions and widely held beliefs
as to the different opportunities for tax evasion presented to different occupations (Pissarides and
Weber 1989, Fiorio and D’Amuri, 2005, Kriz et al., 2007, Feldman and Slemrod, 2007).
11
The extent of income under-reporting by region appears to be highest in Southern Greece
(16%) and lowest in Greater Athens (below 6%), while it is estimated at 12-13% in Northern Greece
and the Islands. This result could be driven by geographical patterns of the relative weight of
farming, tourism or the construction sector in the relevant regional economies (Tatsos, 2001).
In terms of marital status, income under-reporting seems to be lowest for single persons (7%),
and to rise with household size, up to 17% for families with 4+ children. Again, this is quite
consistent with most of the empirical literature on the distribution of tax evasion (Feinstein, 1991,
Clotfelter, 1983, Tatsos, 2001).
Using a tax-benefit model we were able to compute the distributional effects of tax evasion,
by first simulating tax due under full tax compliance (based on the distribution of “true income”),
then assuming under-reporting (based on the distribution of “reported income”). This produced a
series of interesting results. To start with, we found that 10% income under-reporting results in 26%
shortfall in tax receipts, which is obviously a function of the progressive structure of income
taxation in Greece.
Overall, our analysis seems to underestimate the magnitude of income tax receipts under tax
evasion (€5.83 billion) compared with official figures (€6.66 billion), against an estimate of tax
receipts under full tax compliance at €7.89 billion. We believe this is because we have been unable
to simulate the Greek tax system in its full complexity, for example with respect to the presence of
luxury assets which may cause tax authorities to revise upwards the taxable income of their holders.
Another important feature of the Greek tax system that defies simulation is presumptive
taxation. This amounts to a detailed set of rules applying to a number of activities (e.g. shop-
keeping, self employment in the medical and other professions), which specify a minimum taxable
income varying by type of activity, location, seniority etc. When someone active in a relevant
category declares earnings below the minimum taxable income, her tax liability is calculated at the
minimum. Such rules are impossible to simulate because the level of detail of the information they
rest on exceeds by far that available in the HBS. On the whole, presumptive taxation corrects some
tax evasion at the margin, although the correction (and corresponding recovery of tax receipts)
seems more effective at lower rather than higher levels of reported income.
The paper also estimated the distributional impact of tax evasion in terms of poverty and
income inequality. Our results suggest that tax evasion causes the poverty rate (FGT α=0) to rise by
2.3%, and the poverty gap (FGT α=1) by 1.6% above what would have been under full tax
compliance. Furthermore, tax evasion markedly raises income inequality by between 2.7%
12
(Atkinson e=2) and 9.2% (Theil). The effect was 3.5% on the Gini index, 5.2% on the S80/S20
index, and 7.2% on the Atkinson index (e=0.5). What this seems to suggest is that the effect of tax
evasion on inequality is highest for indices that are more sensitive to changes at high levels of
income, which is not unexpected, given the distribution of income under-reporting and the operation
of a progressive income tax schedule.
Finally, the effect of tax evasion on tax progressivity appears to be very large: the decline in
the Kakwani index was estimated at 10%; that of the Suits index at 16.2%; furthermore, the
reduction in the Reynolds-Smolensky index was estimated at 23.5%. All three suggest that tax
evasion renders the tax system more regressive.
By way of sensitivity analysis, i.e. to establish the general robustness of these findings, we
also examined an alternative scenario resting on different assumptions, namely correcting baseline
incomes from dependent work and pensions in the income survey in the light of information drawn
from the sample of tax returns.
Rather reassuringly, we found that the results of the alternative scenario were very similar to
those of the standard scenario. More specifically, the overall rate of under-reporting was 9.5%
(down from 9.9%), the shortfall in tax receipts 24.8% (26.1%), the increase in the poverty rate 2.1%
(2.3%), the rise in the Gini index 3.4% (3.5%), the decline in the Kakwani index 9.4% (10%) etc.
The pattern of under-reporting by level and source of income, geographical area and marital status
under the alternative scenario was almost exactly identical to the standard scenario. On the whole,
the main difference was that the alternative scenario estimated higher aggregate tax receipts under
tax evasion (€6.12 billion), i.e. closer to official figures (€6.66 billion), while the estimate of tax
receipts under no tax evasion was correspondingly higher (€8.14 billion).
Conclusion
As shown above, the effects of tax evasion in Greece seem to be higher poverty and income
inequality, and lower tax progressivity, as well as a loss of tax receipts. This is an important finding,
but is it to be trusted?
Our approach, matching income survey data with data from a sample of income tax returns,
provided a tentative response to the question this paper has set out to examine, and as such it can
never resolve it in a definitive way. While we have made an effort to reconcile the income survey
with the tax returns sample, and that sample with the population of tax payers, our adjustment
techniques offer at best good approximations. In particular, the truncated nature of tax records (low-

13
income families pay no taxes) and the limited reliability of income statistics at either end of the
income scale, may cause residual estimation errors.
On the other hand, we have reason to believe that our results are lower-bound estimates of tax
evasion. Our key assumption is to treat the incomes reported in the HBS 2004/05 as “true” incomes,
on the grounds that people have no incentive to report lower-than-true incomes to survey
interviewers, since their disposable income is not affected by their response. The intuition –
reflected in similar approaches taken in other studies (Fiorio and D’Amuri, 2005) – is reasonable,
but not necessarily correct. On the contrary, there is considerable evidence (Elffers et al., 1987) that
the same factors causing tax evasion (low trust, low tax morale and so on), together with the wish of
tax-evading individuals to be somehow “consistent”, can cause under-reporting of incomes in the
income survey as well, albeit at a lower level. In other words, the actual but unknown level of tax
evasion may be considerably higher than that implied by our estimates.
Moreover, a distinction must be introduced between static and dynamic effects of tax evasion.
Taxation not only reduces disposable incomes, but also affects decisions concerning labour supply
and demand, the allocation of disposable income between consumption and savings, the allocation
of consumption between different goods and services and so on. Although the analysis of such
dynamic effects lies well beyond the scope of this paper, we need to recognise that the implications
of tax evasion exceed what we can show through a static, arithmetical recalculation of the income
distribution.
On a related point, while our approach focuses on income tax alone, the distributional effects
of evading other taxes (e.g. company tax, property tax, value added tax) can be very different to the
ones to be estimated here. For instance, social contributions are often evaded alongside income
taxes. Two effects operate here. On the one hand, as social contributions are paid at a flat rate or as
a lump sum, and no lower earnings threshold applies (i.e. they are payable from the first €1), the
distributional implications of contribution evasion may be less regressive than in the case of income
tax. On the other hand, under-reporting of wages and especially unregistered work reduce
employers’ labour costs by more than they raise take-home workers’ incomes. Taking both effects
into account is likely to reinforce rather than mitigate the distributional impact of tax evasion.
On the whole, our results should be viewed as tentative estimates under an experimental
research design. The design itself can be improved further, e.g. by trying other approaches to
matching the two databases, by repeating the analysis with a larger sample of tax returns, or by
collecting more information, enabling us to create smaller, more homogeneous categories.
14
A possible refinement concerns the introduction of stochastic variation. Specifically, there is
no reason to think that all members of a given category under-report their incomes by the same
ratio: some will do so by a higher percentage, some by a lower one, while some others may even
faithfully reveal their incomes to the tax authorities. Stochastic variation may involve introducing a
random term around the estimated average rate of under-reporting by category. Clearly, this exceeds
the scope of the current paper.
A final word concerns the nature of our research. Even though the design of our work was
experimental, the assumptions we have had to rely upon were sometimes crude, and several issues
(some of which discussed above) remained unresolved, we believe our results capture essential
aspects of the problem we set out to explore. Our core finding, that tax evasion in Greece causes
poverty and income inequality to rise, and reduces tax progressivity, as well as leading to a loss in
tax receipts, was found to be reasonably robust. This is a significant finding, with important policy
implications. It suggests that the payoff of efforts to improve tax morale and reduce tax evasion
could be very substantial indeed: higher tax receipts by at least a third, lower poverty, reduced
inequality, and a more progressive tax system.
After all, it may be that the “egalitarian policy maker” invoked by Cowell (1987) has little
reason to “smile indulgently on evasion”, and every reason actively to engage in a sustained effort to
reduce it.
15
References
Allingham, M.G. and Sandmo, A. (1972), ‘Income tax evasion: a theoretical analysis’, Journal of
Public Economics, vol. 1, pp. 323-38.
Andreoni, J., Erard, B. and Feinstein, J. (1998), ‘Tax compliance’, Journal of Economic Literature,
vol. 36, pp. 818-860.
Beron, K.J., Tauchen, H.V. and Witte, A.V. (1992), ‘The effect of audits and socioeconomic
variables on compliance’, in J. Slemrod (ed) Why people pay taxes, Ann Arbor: University of
Michigan Press.
Breusch, T. (2006), ‘Book review of C. Bajada and F. Schneider (eds) Size, causes and
consequences of the underground economy: an international perspective’, Aldershot: Ashgate,
2005, Economic Record, pp. 492-4.
Caridi, P. and Passerini, P. (2001), ‘The underground economy, the demand for currency approach
and the analysis of discrepancies: some recent European experience’, Review of Income and
Wealth, vol. 47, pp. 239-50.
Clotfelter, C.T. (1983), ‘Tax evasion and tax rates: an analysis of individual returns’, Review of
Economic Statistics, vol. 65, pp. 363-73.
Cowell, F. (1987) ‘The economic analysis of tax evasion’. In: J.D. Hey and P.J. Lambert (eds)
Surveys in the economics of uncertainty. Oxford: Blackwell.
Elffers, H., Weigel, R.H. and Dick, J. (1987), ‘The consequences of different strategies for
measuring tax evasion behaviour’, Journal of Economic Psychology, vol. 8, pp. 311-37.
Feinstein, J.S. (1991), ‘An econometric analysis of income tax evasion and its detection’, Rand
Journal of Economics, vol. 22, pp. 14-35.
Feldman, N. and Slemrod, J. (2007), ‘Estimating tax noncompliance with evidence from unaudited
tax returns’, Economic Journal, vol. 117, pp. 327-52.
Fiorio, C.V. and D’Amuri, F. (2005), ‘Workers’ tax evasion in Italy’, Giornale degli Economisti e
Annali di Economia vol. 64, pp. 241-264.
Fortin, B., Lacroix, G. and Villeval, M.-C. (2007), ‘Tax evasion and social interactions’, Journal of
Public Economics, vol. 91, pp. 2089-112.
Frederiksen, A., Graversen, E.K. and Smith, N. (2005), ‘Tax evasion and work in the underground
sector’, Labour Economics, vol. 12, pp. 613-28.
16
Frey, B.S. (1989), ‘How large (or small) should the underground economy be?’ In E.L. Feige (ed)
The underground economy: tax evasion and information distortion, Cambridge: Cambridge
University Press.
Frey, B.S. (2003), ‘Deterrence and tax morale in the European Union’, European Review, vol. 11,
pp. 385-406.
Frey, B.S. and Torgler, B. (2007), ‘Tax morale and conditional cooperation’, Journal of
Comparative Economics, vol. 35, pp. 136-59.
Gërxhani, K. and Schram, A. (2006), ‘Tax evasion and income source: a comparative experimental
study’, Journal of Economic Psychology, vol. 27, pp. 402–22.
Hanousek, J. and Palda, F. (2006), ‘Problems measuring the underground economy in transition’,
Economics of Transition, vol. 14, pp. 707-18.
Institute of Mediterranean Studies (1991), Tax regime, shadow economy, and tax evasion in Greece,
Athens: Papazisi (in Greek).
Kanellopoulos, K., Kousoulakos, I. and Rapanos, B. (1995), Shadow economy and tax evasion:
estimates and economic implications, Athens: Centre of Planning and Economic Research (in
Greek).
Kriz, K.A., Merikull, J., Paulus, A. and Staehr, K. (2007), Why individuals evade payroll and
income taxation in Estonia? Economics and Business Administration Working Paper no. 49.
University of Tartu.
Lacko, M. (2000), ‘Hidden economy: an unknown quantity? Comparative analysis of hidden
economies in transition countries, 1989-95’, Economics of Transition, vol. 8, pp. 117-49.
Lyssiotou, P., Pashardes, P. and Stengos, T. (2004), ‘Estimates of the black economy based on
consumer demand approaches’, Economic Journal, vol. 114, pp. 622-40.
Parker, S. (2003), ‘Does tax evasion affect occupational choice?’ Oxford Bulletin of Economics and
Statistics, vol. 65, pp. 379-94.
Pestieau, P., Possen, U.M. and Slutsky, S.M. (2004), ‘Joint optimal taxes and enforcement policies
in response to tax evasion’, Journal of Public Economic Theory, vol. 6, pp. 337-74.
Pissarides, C.A. and Weber, G. (1989), ‘An expenditure-based estimate of Britain’s black
economy’, Journal of Public Economics, vol. 39, pp. 17-32.
Pommerenhe, W.W., Hart, A. and Frey, B. (1994), ‘Tax morale, tax evasion and the choice of
policy instruments in different political systems’, Public Finance, vol. 49 (supplement), pp.
52-69.
17
Sandmo, A. (1981), ‘Income tax evasion, labour supply, and the equity-efficiency tradeoff’, Journal
of Public Economics, vol. 16, pp. 265-88.
Sandmo, A. (2004), ‘The theory of tax evasion: a retrospective view’, National Tax Journal, vol. 58,
pp. 643-663.
Schneider, F. (2002), The size and development of shadow economies of 22 transition and 21
OECD countries, Discussion Paper no. 514, Bonn: Institute for the Study of Labor.
Schneider, F. (2004), The size of the shadow economies of 145 countries, all over the world: first
results over the period 1999 to 2003, Discussion Paper no. 1431, Bonn: Institute for the Study
of Labor.
Schneider, F. and Ernste, D. (2000), ‘Shadow economies: size, causes and consequences’, Journal
of Economic Literature, vol. 38, pp. 77-114.
Schneider, F. and Klinglmair, R. (2004), Shadow economies around the world: what do we know?,
Discussion Paper no. 1043, Bonn: Institute for the Study of Labor.
Schneider, F. and Torgler, B. (2007), Shadow economy, tax morale, governance and institutional
quality: a panel analysis, Working Paper no. 1923, Munich: Center for Economic Studies.
Sheffrin, S.M. and Triest, R.K. (1992), ‘Can brute deterrence backfire? perceptions and attitudes in
taxpayer compliance’, in J. Slemrod (ed) Why people pay taxes, Ann Arbor: University of
Michigan Press.
Tatsos, N. (2001), Shadow economy and tax evasion in Greece, Athens: Institute of Economic and
Industrial Research (in Greek).
Wintrobe, R. (2001), Tax evasion and trust, Department of Economics Working Paper no. 11.
University of Western Ohio.
18
Tables
TABLE 1
Adjustment factors in the standard scenario
Athens Northern Southern Islands
wages / salaries 1.000 0.978 0.992 1.000
pensions 1.000 1.000 1.000 1.000
agriculture 0.468 0.412 0.530 0.519
self employment 0.770 0.860 0.640 0.712
Notes: The adjustment factors shown here, multiplied by “true incomes” as observed in the HBS 2004/05, are used to derive a distribution of “reported incomes” assumed to be revealed to tax authorities and hence subject to income tax.
TABLE 2
Correction factors in the alternative scenario
Athens Northern Southern Islands
wages / salaries 1.041 0.978 0.992 1.047
pensions 1.038 0.985 0.981 1.094
agriculture 1.000 1.000 1.000 1.000
self employment 1.000 1.000 1.000 1.000
Note: The correction factors shown here are used to correct “true incomes” observed in the HBS 2004/05 for the possibility of reporting or measurement error.
TABLE 3
Adjustment factors in the alternative scenario
Athens Northern Southern Islands
wages / salaries 1.000 1.000 1.000 1.000
pensions 1.000 1.000 1.000 1.000
agriculture 0.468 0.412 0.530 0.519
self employment 0.770 0.860 0.640 0.712
Notes: The adjustment factors shown here, multiplied by the “true incomes” in the HBS 2004/05 (after first correcting these for possible reporting or measurement error, as shown in Table 2), are then used to derive a distribution of “reported incomes” as revealed to tax authorities and hence subject to income tax.
19
TABLE 4
Under-reporting by level of income
“true” income “reported” income difference
decile 1 (poorest) 1,963 1,769 -9.9%
decile 2 3,540 3,174 -10.4%
decile 3 5,667 5,031 -11.2%
decile 4 7,079 6,715 -5.1%
decile 5 8,191 7,723 -5.7%
decile 6 9,867 9,172 -7.0%
decile 7 12,298 11,322 -7.9%
decile 8 15,447 14,314 -7.3%
decile 9 19,869 18,525 -6.8%
decile 10 (richest) 39,650 33,839 -14.7%
top 1% 96,526 73,732 -23.6%
top 0.1% 156,859 126,523 -19.3%
total 12,455 11,220 -9.9%
Notes: Mean income by income group is non-equivalised annual personal income in €. Income quantiles are constructed excluding those earning zero or negative incomes (38.3% of total population). “True” income is as observed in the HBS 2004/05. “Reported” income is adjusted for under-reporting using the adjustment factors by region and income source shown in Table 1.
20
TABLE 5
Under-reporting by main source of income, region and family type
population share “true” income “reported”
income difference
wages / salaries 41.5% 13,085 13,007 -0.6%
pensions 37.1% 7,960 7,960 0.0%
agriculture 6.3% 12,353 5,819 -52.9%
self employment 15.1% 19,327 14,616 -24.4%
Greater Athens 39.2% 14,555 13,733 -5.6%
Northern 27.4% 11,152 9,859 -11.6%
Southern 22.7% 10,839 9,110 -16.0%
Islands 10.8% 11,534 9,991 -13.4%
single 35.5% 9,970 9,252 -7.2%
married no children 34.5% 11,310 10,136 -10.4%
married 1 child 12.5% 16,250 14,446 -11.1%
married 2 children 13.7% 17,034 15,133 -11.2%
married 3 children 3.1% 17,042 14,818 -13.1%
married 4+ children 0.6% 17,225 14,348 -16.7%
Notes: Mean income by category is non-equivalised annual personal income in €. Population share refers to non-zero income earners only (61.7% of total population). “True” income is as observed in the HBS 2004/05. “Reported” income is adjusted for under-reporting using the adjustment factors by region and income source shown in Table 1. Income from self employment includes property.
21
TABLE 6
Income tax variables under full compliance and tax evasion
full compliance tax evasion difference
reported income 12,455 11,220 -9.9%
taxable income 11,957 10,724 -10.3%
tax allowances 499 499 0.0%
tax reductions 182 181 -0.6%
tax due (all) 1,175 868 -26.1%
tax due (non-zero) 3,263 2,716 -16.7%
disposable income 11,280 11,587 2.7%
Notes: Mean income is non-equivalised annual personal income in €. Full compliance provides estimates of income tax variables assuming incomes are reported to tax authorities as observed in the HBS. Tax evasion provides estimates of the same variables assuming incomes are under-reported to tax authorities as implied by the adjustment factors shown in Table 1. The share of non-zero income earners paying non-zero tax is 36.0% and 32.0% under full compliance and tax evasion respectively.
TABLE 7
Fiscal and distributional implications of tax evasion (standard scenario)
full compliance tax evasion difference
tax receipts (€ million) 7,890 5,830 -26.1%
poverty line (€ p.a.) 5,578 5,636 1.0%
poverty rate (FGT α=0) 18.9 19.3 2.3%
poverty gap (FGT α=1) 6.0 6.1 1.6%
Gini 0.320 0.331 3.5%
S80/S20 5.424 5.705 5.2%
Atkinson e=0.5 0.088 0.094 7.2%
Atkinson e=2 0.422 0.434 2.7%
Theil 0.177 0.194 9.2%
Kakwani 0.116 0.104 -10.0%
Reynolds-Smolensky 0.028 0.022 -23.5%
Suits 0.207 0.173 -16.2%
Notes: Full compliance provides estimates of income tax variables assuming incomes are reported to tax authorities as observed in the HBS. Tax evasion provides estimates of the same variables assuming incomes are under-reported to tax authorities as implied by the adjustment factors shown in Table 1. FGT refers to the Foster Greer Thorbecke family of poverty indices.
22
TABLE 8
Fiscal and distributional implications of tax evasion (alternative scenario)
full compliance tax evasion difference
tax receipts (€ million) 8,140 6,120 -24.8%
poverty line (€ p.a.) 5,625 5,686 1.1%
poverty rate (FGT α=0) 19.0 19.4 2.1%
poverty gap (FGT α=1) 6.1 6.2 1.7%
Gini 5.469 5.742 5.0%
S80/S20 0.321 0.332 3.4%
Atkinson e=0.5 0.088 0.094 7.0%
Atkinson e=2 0.425 0.436 2.5%
Theil 0.178 0.194 8.9%
Kakwani 0.116 0.105 -9.4%
Reynolds-Smolensky 0.028 0.022 -21.5%
Suits 0.207 0.174 -15.8%
Notes: Full compliance provides estimates of income tax variables assuming incomes are reported to tax authorities as observed in the HBS. Tax evasion provides estimates of the same variables assuming incomes are under-reported to tax authorities as implied by the adjustment factors shown in Table 3. FGT refers to the Foster Greer Thorbecke family of poverty indices.