Embed Size (px)
Citation preview
The New Macroeconomic Matrix and Monetary Policy Brazil 2011-2014*, **
Paulo Vieira da Cunha New York, February 2017
* An essay in honor of Edmar Bacha’s 75th anniversary. **Preliminary draft, for comments only.
2
1. Introduction
From 2010 to 2015, CPI inflation in Brazil averaged 6.4% year-on-year (yoy), nearly 2% above the
midpoint of the central bank’s target.i During the period of the New Macroeconomic Matrix (NEM),
introduced by President Dilma Rousseff in mid-2011, and pursued until early into her second term in
2015, monetary policy was discredited, relegated to a supporting role for political objectives. The
reintroduction of more sensible and coherent macro policies starting in May 2016, following the start of
impeachment proceedings against Rousseff and, principally, after a new administration assumed the
helm of the central bank on June 2016, brought back expectations that monetary policy will be again
effective. It already is. But the structural, mainly fiscal, limitations for effectiveness are strong and will
take long to overcome.
This note outlines the evolution of monetary policy during the NEM. Section 2 summarizes the
debates that led to the adoption of the NEM; discusses the transition to a “modified” IT regime in the
aftermath of the Global Financial Crisis (GFC); and examines the key innovations introduced by the NEM
central bank. Although the focus is on monetary, the objective is to emphasize the role of fiscal policy.
Section 3 discusses the monetary-fiscal links. Section 4 concludes with some observations for the future.
3
2. The New Macroeconomic Matrix (NEM)
The main economic indicators for the period 1995-2016 are shown in Annex Table 1. The first
two administrations of the PT (Workers’ Party) under President Lula stand out: GDP growth at 4.1%
average annual rate; real payroll growth at 4.8% with a strong expansion in formal wage-based
employment; a near balance in the external current account with rapid growth in imports made possible
by an even faster expansion in exports during the China-led commodity boom; a buildup in foreign
reserves that buttressed external creditworthiness; prudent fiscal performance with primary surpluses
averaging 3.1% of GDP, about the same as in the earlier two Cardoso administrations, but with a
reduction in the nominal deficits given lower interest payments. The impact of the Global Financial Crisis
(GFC) was short and mild. As late as in Q3/2008, the economy was booming, growing at the fastest
quarterly rate on record. It slowed down in Q4/2008. But it was not until Q1/2009 that the crisis hit.
********* Figure 1. CPI inflation & monetary policy target interest rate **********
Figure 1 shows the path of inflation and monetary policy. As late as Sep/2008, with concerns
about an overheated domestic demand feeding into inflation, the central bank increased the policy rate
to 13.75%, the highest rate in 2 years. It began to retreat only in Jan/2009, one year after the US Fed
brought its rate to the zero lower bound (ZLB). The rate reached 8.75%, the trough of the rate cycle, in
July 2009, once 12mo ahead inflation expectations were firmly below the midpoint of the year-ahead
target. By that time, the Fed had in place a plethora of emergency liquidity assistance programs, had
added quantitively easing (QE) to its arsenal, and had implemented a swap program with the central
bank of Brazil, among others, to supply it with emergency dollar funding.
4
Brazilian markets were slow to gauge the magnitude of the global crisis. In the central bank’s
survey of market expectations, as late as yearend 2008, the median forecast for growth in the year
ahead was 2.4%. This was 2.7pp lower than the growth rate registered in 2008, but about the average it
had been during the Cardoso years. In the event, growth in 2009 clocked at -0.1%yoy. The trough of the
cycle was in Q1/2009, a contraction of -2.4% in the seasonally adjusted annualized rate (saar). By
Q4/2009 the economy was expanding at 5.3%saar, and by Q1/2010 it grew at all-time peak rate of
9.2%saar. The downturn was short and the recovery remarkable.
What happened? The external environment helped: China’s policy stimulus spilled over into
Brazil, and the effect was large.ii The Fed’s expansionary overdrive helped calm Brazilian capital markets.
The domestic policy stimulus, meanwhile, was even more remarkable. Spillover from China peaked in
Q1/2010. By then, Lula and his administration had put in place their own set of measures. For a country
used to react to external crises with pro-cyclical, belt-tightening, measures to guard its foreign exchange
reserves, the measures were nothing short of revolutionary. They brought forth a coordinated counter-
cyclical response from fiscal, quasi-fiscal (the state-owned banks and corporations) and monetary
policies that created 2.14 million formal jobs, increased average real incomes by close to 4%, and the
minimum wage by 16.4%, all during 2010.iii
The response was disproportional. In retrospect, from a counter-cyclical perspective, excessive
in all aspects. Maybe Lula and his policymakers did not know about the unprecedented scale of the
China stimulus. Perhaps they underestimated the global reach of Fed action. But, then, the reason for
the policies was not strictly countercyclical. They were aimed at the forthcoming 2010 Presidential
election, and winning them demanded more. Twice incumbent, Lula was ineligible. He had to choose a
successor who would maintain his party’s grip to power, someone who not only would be beholden to
him. The task was to find a candidate who would be perceived to be so by all, and unmistakably. Hence,
the bizarre choice of Dilma Rousseff. She had never campaigned for or held an elected position; was
5
largely unknown to voters; a latecomer to the PT. To insiders, she was known for her technocratic, not
political, skills, and, also, for her fierce loyalty to Lula and to the leftist wing of his entourage. It was said
at the time that Lula could have elected “a lamp post,” and he did. The “counter-cyclical” offense paid
off.
Because they elected “a lamp post,” at the time, the local elites, who overwhelmingly supported
Dilma, argued, and believed, that the election-year overindulgence would not carry through to the new
administration. It was to have been a temporary fault, to some extent expected and justified by the
“political realities.” There would not be a discontinuity in the “deeper” policy view and political strategy
of the ruling powers. Lula, the PT, and their allies, after all, won the election. They had at their command
an unparalleled large base of support in Congress. And Lula was now more than a pious convert. He was
seen a master in pragmatic policy management, delivering macroeconomic stability and a pro-growth
environment. He had brought his party along.
What this reasoning missed, however, was that there had been something different in Lula’s
post-GFC response, something more than a combination of political opportunism and countercyclical
farsightedness. Given the re-composition of the inner circle around him, his response to the crisis looked
back to the PT’s playbook of the years in the opposition, before the moderating shift that had led the PT
to power in 2002.iv Among the faithful in the left, the GFC “proved” the failure of the minimal state, of
the “Washington consensus,” of the dogma that “markets know best.” And this thinking would carry
through to the new administration.
Dilma Rousseff, desenvolvimentismo and the NEM.v When Rousseff came to power in 2011 a
cyclical correction was in course. Real growth in public expenditures could not be sustained at near
18%yoy! (See Figure 2.) The new administration trimmed the budget (“contigenciou”) and acted to
6
correct some excesses.vi The central bank accelerated its re-tightening cycle. The Rousseff team,
however, had a different personality, and thought differently about macroeconomic policy.
********* Figure 2. Primary (non-interest) expenditures of the Treasury **********
As a policy-maker, Lula was self-taught; a pragmatic union leader who learned his economics
from wage negotiations with multinational corporations and from close ties to the centrist labor
movements in the US (AFL/CIO) and Germany (IG Metall). In office, he listened closely to his advisors
and chose the course of action. His policy approach drifted as his political acumen dictated, and as his
advisers changed their tune. His actions were pragmatic not doctrinaire, aimed at the protection and
enlargement of his political power.
Dilma Rousseff, in contrast, was a trained economist who entertained academic ambitions and
pursued graduate degrees. A woman of convictions, and a history of ideological confrontations for
which she once had been imprisoned and tortured by the military dictatorship, she is said to have
relished the minutia of technical discussions, and even broad intellectual debates. In a discipline, such as
economics, subject to fashions, dogmas and “…isms,” hers was a peculiar brand, desenvolvimentismo
(“developmentalism”), or more pejoratively, to critics, (mis)guided “Keynesianism in the Tropics.”vii
For Rousseff, and her team, the main challenge in 2011 was not the end of the commodity
super-cycle. It was not the aftereffects of the GFC and the then looming crisis in Europe, or even the
slowdown in productivity growth. These issues counted, but the main problem, in their view, was that
domestic demand was not growing rapidly enough. The pace was not sufficient to compensate the drop
in external demand and the loss in the terms-of-trade. And domestic demand, real not nominal demand,
was something that, in their chartbooks, could be created through government policy, even in the short-
run.viii
7
In Q1/2011, domestic absorption grew 7.7%yoy in real terms, and imports, 26.2%yoy. (See
Figure 3.) Nevertheless, the pace of formal job creation was at a turning point, from expanding at the
torrid pace of 18.7% in the previous 12-months to a still respectable, but much slower, 7.1% by year-
end. Moreover, real wages and the real minimum wage traced a similar pattern. (See Figure 4.) A
slowdown in consumption was imminent. The focus, therefore, had to be on measures to further
stimulate demand. By mid-2011 these ideas coalesced into the NEM.
********* Figure 3. Domestic absorption, investment and imports **********
********* Figure 4. Job growth and the real minimum wage ***************
There was no seminal document or comprehensive presentation.ix Rather, a coming together of
long-simmering ideas debated between economists holding important positions in the administration,
and discontent, from the beginning, with the carryover of Cardoso-era policies. Chief among them was
Nelson Barbosa, who oversaw macroeconomic policy at the Ministry of Finance (2008-2011), was
Deputy Minister of Finance (2011-2013), Minister of Planning and Budget (2014-1015), and then, briefly,
Minister of Finance (2015-2016). In a paper co-authored with José Antonio Pereira de Souza, and
debated in 2010 at Columbia University in New York, among other places, Barbosa contrasted the
“neoliberal” period of the Lula administration (2003-2005) with the subsequent “developmentalist”
stage starting in 2006, emphasizing that while “neoliberal” policies delivered stability they failed to
promote growth. The cornerstone, starting in 2006, was a much more active use of state policy,
institutions, public credit through state-owned banks, and state-owned-enterprises (SOEs) to produce
short-term growth.
8
Três iniciativas tomadas na execução da política fiscal, ainda em 2006, marcaram a inflexão
econômica: elevação substancial no salário mínimo; aumento no investimento público; e
reestruturação de carreiras e salários dos servidores públicos.x
Barbosa and Souza then list the actions taken during the GFC and, summing up the post 2005 period,
note that,
Fundamental para qualquer análise do período é a recuperação da postura mais ativa do Estado
na promoção do desenvolvimento econômico. O desequilíbrio e a incerteza, inerentes ao
crescimento econômico, demandaram um papel indutor e regulador mais consciente do Estado,
especialmente na formatação das expectativas de investimento para o longo prazo. O
reconhecimento da necessidade de um papel mais ativo do Estado, com a recuperação
progressiva da capacidade de investir em áreas estratégicas foi, e continua a ser, imprescindível.
Isso implicou o Estado assumir responsabilidades que se julgavam, durante a hegemonia
neoliberal recente, alheias a suas esferas de atuação.xi
It is foolhardy to ascribe Lula’s turning point in 2006 to a reawakening of his leftist ideological
sympathies, least to a carefully chosen preference for “developmentalism” as policy. The cause was
political, the first of the two large-scale scandals that plagued his administrations. This one was the vote-
buying scheme that he, and his closest advisors, put into effect to build a majority in Congress during his
first administration (2003-2006). Faced with the upheaval of the “mensalão,” that grew into a full-force
political disaster by mid-2005, and fearing a loss at the 2006 presidential election, Lula turned to his old-
time supporters in the union movement, and to the more expedite advise of those who had no
compunction to use the state for parochial political interest, principal among them, Dilma Rousseff and
her team of economists. Public expenditures grew at an accelerated pace and even more so the
combined impact of expenditures, credit allocations and SOE spending.
9
Five years later, in 2011, when Rousseff took power, this team continued to deliver. What
followed was a swarm of Presidential decrees, activism and control over the main levers of economic
policy, including the central bank. It was not as simple as telling the bank what to do. The new economic
team, headed by the President herself, developed a common diagnostic and, if not a consensual, at least
a workable course of action encompassing the Ministry of Finance, The Ministry of Planning and Budget,
The National Development Bank, the government-owned commercial banks, SOEs, and the central bank.
In this simple act of building, or demanding, a consensus within her team, Dilma differed markedly from
her predecessor.
Lula feared and trusted the central bank. He assumed the Presidency in 2003 with an economy
in disarray and under a cloud of adverse and outright antagonistic business expectations. His first days in
office, punctuated by a currency crisis and preceded by a return to the IMF for emergency assistance,
revived the threat of rampart inflation and the fear that the first leftist government in Brazilian history
would end in debacle. He owed his election in part to the centrist approach of his soon-to-be finance
minister, Antonio Palocci. Palocci established his own credentials. He supported and helped negotiate
the agreement with the IMF; established a close working relationship with the outgoing Cardoso team;
and subsequently staffed his Ministry with personnel from the Cardoso administration, and from
“liberal” think-tanks.
Palocci was instrumental in bringing Henrique Meirelles to the central bank, an odd choice since
Meirelles had just won a mandate to the Lower House representing an opposition party. To underscore
this position, the new Governor used his confirmation hearings to make clear that his administration
would be of continuity with previous central bank practices—a clear salvo against the PT bulwarks who
had condemned the previous management of monetary policy. To the applause of non-PT politicians,
and of business interests, in due course, Meirelles stepped beyond his ties to Palocci and became a key
advisor to Lula. He did so while contending with fierce opposition from within the PT-dominated
10
cabinet, and from close allies of the president, the more so when Guido Mantega, a card-carrying
desenvolvimentista, ascended to the upper echelons of economic policy, replacing Palocci at Finance.
Meirelles’ strategy was to isolate the central bank from the rest of the government; to hold
strictly bilateral meetings with the President. The keyword was “operational independence” but, to all
effects, it was autarchy except for contact at the very top of the axis: The Meirelles central bank
preserved its autonomy. The gain in credibility helped in the implementation of policy, but there were
costs. Monetary policy was too tight around 2005-2006,xii and there were other, more fundamental,
underlying problems. The fiscal-monetary policy mix was incoherent.
At a time when fiscal primary surpluses should have increased to help neutralize the
destabilizing effects of a sudden rush of external income, prompted by an extraordinary gain in terms-
of-trade, what Edmar Bacha appropriately termed the mana not from heaven but from commodities,
and that transferred, in his estimates, near 10pp of GDP annually to Brazil in the period 2014-2011, the
Lula administration chose, instead, to spend the external gain—not in investment but mainly in
consumption.xiii There were improvements in living standards. Unfortunately, however, many of them
proved to be temporary. The mistakes in policy in 2006-2010 brought down Brazil’s capacity to grow in
future years.
Towards the end of the Lula administrations, productivity growth had ground to a halt
threatened by an extraordinary jump in real wages and in the share of wages in output, by a serious loss
in external competitiveness. A measure of unit labor costs estimated by the central bank increased from
near 100 in January 2007 to 141 four years later. (See Figure 5.) The management of the exchange rate,
and of exchange rate expectations, played an active role in monetary policy—more so than
conventionally admitted in “flexible” IT regimes.
********* Figure 5. Wage exchange ratio adjusted for productivity **********
11
Starting in 2005, the Central Bank accumulated reserves, colossally: from $53.8bn ate end-2005
to $180.3bn at end 2007, and $288.6bn at end-2010. It did so, at first, not because of concerns about
the level of the exchange rate but out of fears that the additional external stimulus would overheat the
economy and credit markets. (The unanticipated appreciation of the BRL/USD rate was one of the
reasons why monetary policy proved to be, in retrospect, too tight around 2005-2006.) The
accumulation was sterilized through open market operations collateralized with Treasury bonds.
Eventually, this buildup of Treasury debt held by the central bank, and the corresponding outstanding
public debt held under the so-called operações compromissadas, would emerge as a key challenge for
monetary policy. So, would concerns about the cost of holding reserves, and about the level of the real
exchange rate. But these were not concerns of the Meirelles central bank.
During the eight years of Lula/Meirelles, notwithstanding the buildup in reserves, the real
exchange rate appreciated 44% (based on the average level in 2003), while the terms-of-trade gained
28%, and the wage/exchange rate ratio, 65%. (See Figure 6). It may be too much to say that a judicious
course of fiscal and incomes policy would have sufficed to neutralize these effects. It may also be argued
that some of the gains were payback to earlier periods of excessively low real wages. Nevertheless,
there were long term costs to the policy mix that evolved under Lula. The markets liked the “orthodox”
central bank and, at first, turned a blind eye to the fiscal abuses. The business class, coddled by years of
protectionism and easy access to government favors—and, now we know, outright corruption—
supported the expansionary policies of 2005-2008 and, wholeheartedly, the “countercyclical” policies of
2009-2010. No one seemed to be troubled by the inconsistencies in policy and, yet, the negative
consequences were becoming ever more obvious. A more coordinated policy under Dilma could have
been a welcomed turn.
12
********* Figure 6. Terms of trade and real effective exchange rate ***********
Instead, the NEM was a disaster. Coordination of policy led to a tighter embrace of the mistaken
diagnostic. The common mantra was insufficient domestic demand. At a moment when potential GDP
was falling, and probably close to 2-2.5%, central bank officials spoke privately of potential at 4.5-5%.
That was the growth target. To achieved it, the NEM prescribed an expansion in public spending without
an increase in taxes, thus, funded by larger fiscal deficits.
The Treasury’s debt and capital funding requirement increased to R$515.3bn at yearend 2012
(10.7% of GDP), from R$277.3bn a year earlier (6.3% of GDP).xiv They were so large (see Figure 7) that
the alarm bell sounded at the Treasury. In a daring move, the technical staff prepared a frightening
report for then Secretary of Treasury, Arno Augustin. The staff predicted, in the event, correctly, that a
continuation of the course of action would lead to unsustainable deficits; to increasing funding costs to
the Treasury; to a downgrade of the sovereign by the ratings agencies, with loss of the investment
grade. Arno Augustin, however, was a true believer. He was convinced that the deficits and associated
spending would have a positive impact, with the sought-after short-term political returns. He refused to
change the course, got rid of the messengers and decided that, if the problem was with the numbers,
they—not the policies—should be changed.xv From then on, the NEM team used accounting gimmicks to
manipulate how the numbers would appear in the budget. For example, the Treasury capitalized BNDES
and Petrobras through special, off-the-market emissions of Treasury bonds not registered in the “net
debt” concept, which was then current with the market. In accounting terms, the transaction was an
investment of the Treasury, an increase in assets, below the line of the fiscal accounts. Simultaneously,
the administration required BNDES and Petrobras to pay larger dividends to the Treasury, generating a
non-debt financed increase in funding for the deficit, above the line.xvi
13
********* Figure 7. Treasury gross funding requirements ***********
Through this and other tricks, and because the spending failed to spur growth, and thus led to a
deceleration in the growth of revenues, the fiscal deficit reached 10.2% of GDP in 2015. Gross public
debt increased from 55.8% of GDP in December 2010, the month before Rousseff took office, to 61.4%
at end-2015, her last year in office, and to 65.3% in June 2016, when she was ousted. (See Figure 8.) In
the Rousseff years expenditure increased relentlessly. In 2015, the drive to spend more even as revenue
collapsed, finally produced the most feared outcome, a large primary deficit (1.9% of GDP) with a surge
in debt-financing.
*********** Figure 8. Public debt and interest rates *************
A large part of the expansion in spending went through the public banks. In search of “national
champions,” and willing to step-in where private commercial banks would not thread, the development
bank (BNDES) doubled its balance sheet from 7.4% of GDP in 2007 (US$114.4bn) to over 14.3% of GDP in
2011, and 15.2% by 2014 (US$330.3bn). In parallel, the national housing bank (Caixa Econômica Federal-
CEF) initiated an ambitious program of subsidized mortgage lending. Tax and credit concessions to
targeted sectors were added to the mix of industrial policies. When all else failed, and inflation became
a problem, price and exchange rate controls were tossed into the lethal NEM blend.
Part of the increase in the fiscal deficit was the added burden on the interest bill, as the central
bank hiked rates in 2015 to avoid a wholesale outflow of moneys from financial markets. The interest
bill on the public debt summed to 8.3% of GDP in 2015. As shown in Figure 8, in December 2015, the
implicit interest rate on the debt was 23.5%.xvii The bank was attempting to reign-in wildly disparaging
expectations. After Rousseff’s reelection, in November 2014, short-term interest rates bulged as
14
business and consumer confidence plummeted. The bellwether 6-months swaps rate gained 173bp in
the last four months of 2014. The BRL/USD rate lost 63% in the year to August-2015. Moreover, without
a credible monetary anchor, the weaker BRL fed quickly into higher inflation, which increased the
implicit subsidies on controlled prices. In the end, they had to be let go. The added shock brought
inflation to 10.7%yoy at the close of the year, notwithstanding a -3.9%yoy drop in real consumption, and
a -13.9% drop in investment.
The set of policies, increasingly a hodge-podge of ad-hoc measures, failed to stimulate output.
Driven by adverse expectations, new spending in business investment begun to contract in Q3/2014 and
lost 21.5% of its real value in the six quarters to end-2015. Leading segments of the corporate sector
turned to imports to defended their market shares. In part moved by China’s policy of import
penetration into Brazil, imports replaced domestic production of finished goods and increased at a
faster clip that consumption. In the heyday of the NEM, from 2011 to 2014, the real volume (quantum)
of imports increased at an average annual rate of 7.5%, whilst real retail sales, 6.5%. The irony is that
this was happening as the administration expanded policies to protect “national content” and increase
protectionism. Protectionism was at the core of the NEM ideology. However, given the fiscal largesse, it
was not based on import tariffs. Rather, it was implemented through a colossal expansion of public
investment in the state-owned oil company, Petrobras, and through changes in the rules and existing
contracts for the private provision of electricity.
The momentum of imports turned negative only in Q3/2014 and then, of course, it tumbled
rapidly in 2015 hit by the depreciation of the currency and the collapse in demand. Meanwhile, with the
end of the commodity super-cycle, and given the erosion of export competitiveness in manufacturing,
exports growth decelerated and fell in quantum terms. In 2011, the average annual growth rate of
export quantum was 6.8%yoy; in 2015 it was 0.9%yoy. As Dilma Rousseff was being reelected at end-
15
2014, the year sum of the trade account turned negative to -$4 billion dollars, a quick reversion from the
near $30 billion surplus registered in her first year in office, in 2011.
In addition to the corrupt practices that stretched back to the earlier Lula administrations and
that led to the Lava-Jato investigations, the NEM introduced new distortions in the allocation of
resources.xviii In an economy struggling with inefficiencies, the new ones were overwhelming.xix
Productivity growth stagnated and the efficiency gains measured from total factor productivity (TFP)
turned negative.xx Bad policies, and renewed attempts to redouble their impact through the ever-larger
use of fiscal resources, drained investors’ confidence. The political outcome of the contested 2014
presidential election, which Dilma won with a campaign of disinformation and false promises; the
widening corruption and bribery scandals; her own political incompetency; and the after-effects of the
deadly policy mix; led, in 2015, to a distressing cycle of adverse expectations, a collapse in investment,
and deep recession.xxi
Monetary policy.xxii The role of monetary policy in this process is secondary but far from
irrelevant. More so than central bank administrations of the recent past, the NEM central bank
privileged external events. Not because they were constrained by external funding. On the contrary,
capital flows were overabundant and Brazil was, comparatively, an island of tranquility surrounded by a
turbulent sea of external events.xxiii Thus, external sources of contagion were dominant. Unconventional
policies by the main global central banks, and events such as the European crisis of 2012, or the “taper
tantrum” of 2013, accelerated the transmission of external shocks. It was vital, therefore, to address and
intervene in those channels of transmission. The logic behind their actions may best be understood by
focusing on three aspects.
The first is the use of IT as a tool of policy. As the name implies, IT privileges inflation as the
main, if not the single, objective of monetary policy. The aim is to control future inflation by influencing
16
short-term expectations embedded in a framework where the inflation objective is conditional on the
output gap (a measure of current output as a ratio to the economy’s long-run capacity to produce with
the given resources and technology, and without changing the rate of inflation). While monetary policy
may change the gap, it takes as given the standard against which the gap is measured, i.e., the
underlying longer-term output potential of the economy. Thus, monetary policy, an IT within it, does not
aim to change the causes of economic growth, only their short-term fluctuations. The priority of the
inflation objective has consequences, nonetheless, and in the aftermath of the GFC it was important to
address them directly. The ensuing debate led to calls for a “flexibilization” of IT.xxiv It was important to
understand why a central bank, constrained by the ZLB, would accept an undershooting of its inflation
target for a relatively long period; why it could, after, accept a transitory overshooting of the target as
the economy travelled back to its normal conditions.
As Lars Svensson, one of the “father’s” of IT theory in the 1990s, noted in 2010, “flexible IT
means that monetary policy aims at stabilizing both inflation around the inflation target and the real
economy, whereas strict inflation targeting aims at stabilizing inflation only, without regard to the
stability of the real economy.”xxv Deviations from targets are tolerated if they don’t persist (i.e.: if they
are credibly seen as transitory) and only if the objectives, and duration, of the deviation are clearly
stated. In the “flexible” regime, IT central banks must make explicit their policy horizon; i.e., define
(forecast) the timeline for inflation to return to the target, conditional on the current policy rate, and its
future path. In other words, a pre-commitment of future policy.
Curiously, the Brazilian central bank used a somewhat similar scheme in 2003, although,
admittedly, without the theoretical underpinnings. After the exchange rate overshot in 2002 and the
new administration took over, the bank defined, and published, “intermediary” targets for convergence
to the target over the 2003-2005 period. At the time, “flexible” IT was not a theoretical innovation.
Rather, it was a pragmatic response of monetary policy at a moment when, in January 2003, with a new
17
government in place after a difficult political transition, and with the aftereffects of the exchange rate
devaluation still incomplete, inflation hit 14.5%yoy. Inflation expectations, 12-months forward, were at
11% against a target of 3%, and the committee had just raised its policy rate to 22.50%. In those
circumstances, the central bank adopted intermediary date-specific targets, 8.50% for yearend with a
two-year path of convergence to a new target of 4.50%.
What the NEM central bank did in mid-2011 was something entirely different. Echoing
sentiments abroad, it incorporated in its minutes’ language about the limitations of “pure” IT. It hinted
at a strategy with flexible targets, consistent with the NEM’s objective of revitalizing domestic demand.
It did not make the change explicit. Rather, in August 2011, the central bank ventured on an experiment,
a stealth change in regime executed through a succession of rate cuts that brought the policy rate down
525 basis points, from 12.50% to 7.25%. It took 14 months to do it, and the rate would stay at 7.25% —
the lowest ever level since the introduction of IT— from October 2012 to April 2013. What was
remarkable is that this was done regardless of what was happening to either expected or actual
inflation. Barely four months after the experiment began, with the yearend target set at 4.5%, inflation
neared 7.5%yoy, with limited signs of rapid deceleration. Though the economy had started to
slowdown, the labor market was insulated, still red-hot, and, inflation unrelenting.
Months back, in July 2009, the unemployment rate had peaked at 8%. By August 2011, it was
down to 6%, and the 12-month average of the real minimum wage was up nearly 10% in the year. Real
average earnings in private formal employment was up close to 4%yoy. Meanwhile, inflation
expectations were intractable: 12-month ahead expectations stood at 5.5%, and would accelerate to
near 6.5%, the ceiling of the IT target band.
This was not a central bank that aimed to reach its target. Instead, it was a central bank that
had, implicitly, traded the midpoint for the ceiling of the band (6.5%) as its target, using the sophistry of
“flexibility” as an excuse. That was hoping, in the process, to produce that old stand-by, a short-term
18
tradeoff between inflation and growth. Only, it did not work. Markets saw through it, reacted by raising
longer-term rates, and short-circuited the stimulant surge.
There was, however, a second goal behind the “flexibilization” experiment. Post the GFC, critics
blamed IT not only for its lack of flexibility in accepting temporary deviations from the target. There was
also concern about its value when addressing changes in financial conditions, when responding to
“bubbles” in asset prices. The criticism was not against IT as a tool, it was against “the philosophy” of IT-
using central banks. Consider, for example, Alan Greespan’s Fed. Calmed by the long years of the “great
moderation,” it disregarded growing financial imbalances. It missed the onset of the GFC.xxvi There were
failures in regulation and in financial supervision. There was a failure in communications, in addressing
the growth of shadow-banks, and too much coddling up to the interests of the financial industry. There
had been a debate about the use of interest rate policy to burst financial bubbles. The conclusion,
before and after the crisis, was that it would not have worked. To deal with financial instability of such a
proportion what was called for is better and stronger regulation; measures to limit risk and address the
incentives structures within regulated entities; for central banks to give greater, indeed equal, priority to
supervision; for them to develop adequate tools of macroprudential policy.xxvii In short, the issue was
not an incompatibility between IT and financial stability. Rather, it was the balancing of responsibilities
within central banks aiming at both the inflation and financial objectives, and the proper assignment of
instruments for each.
The Brazilian NEM central bank took an active part in this international debate, and welcomed
its conclusions. With a history of financial crises, the issues were familiar. Since the 1980s, financial
stability had been added as mission and a goal. In marked contrast to the US Fed, the Brazilian central
bank had, and has, control over all aspects of supervision and the enforcement of regulation. The
arrangements worked well. Notwithstanding its close integration to global finance, the Brazilian financial
system came out relatively unscathed from the GFC. Credit was due, rightly, to the strength of
19
supervisionxxviii. Moreover, while other central banks faced the challenge of developing ex-novo their
macroprudential toolkits, the Brazilian central bank had it onboard. Admittedly, it had been developed
for a different purpose, not as a prudential regulation but as an instrument for financial repression
through which to finance the fiscal deficit. Even so, by 2011, the NEM central bank had at its disposal a
wide array of instruments for macroprudential policy. It was proficient with the practices of quantitative
restraints on credit and had long-since operated with selective reserve requirements, credit ceilings,
“dynamic” provisioning, etc., so much so that, in earlier administrations, there had been conscientious
efforts to reduce their scope and intent.
Not so the NEM central bank. By 2012, the credit market was very much segmented. Subsidized,
policy-driven “long-term” lending by the national development bank and other public banks accorded
for over half of all corporate lending. The NEM central bank was only happy to let that go through
unhinged. It focused on external capital flows and the active management of the exchange rate through
a rebranding of some of the discredited, and recently discarded “macroprudential tools.”
Post the GFC, unconventional monetary policy in the advanced economies, mainly in the US,
was the central driver of cross-border capital flows.xxix Short-term portfolio flows responded to interest
rate differentials, with the US at the ZLB, to changes in risk perception, with the US downgraded from its
AAA rating, and to changes in the exchange rate, with the USD subject to rounds of depreciation as
capital moved abroad. Moreover, Brazil was peculiar in that it operated (still does) with a high real
interest rate regime.xxx As such, it was prone to both sudden floods (large inflows leading to excessive
growth in consumption and in foreign liabilities, with disruptive bouts of real exchange rate appreciation
when risk perception is low) and sudden stops, typical of the 1990s and early 2000s. QE in the US caused
one such flood in Brazil in mid-to-late 2010, with a sudden reversal in 2011 and brief net outflows (from
US sources) in early 2012. The central bank, together with the Ministry of Finance, reacted by imposing,
tightening and then loosening taxes on inflows; by raising and then decreasing reserve requirements; by
20
accelerating the pace of reserve purchases and then temporarily lending them to the private sector;
more controversially, by selling derivatives to offer foreign exchange hedging to the private sector.xxxi
The policies had the intended effects: intervention changed the actual and expected level of the
exchange rate; the change in reserve requirements changed the overall availability and composition of
credit; the tax on inflows impacted on investors decisions.
The policies also changed investors’ perceptions about the central bank. Here was a central bank
that no longer followed a single pursuit. A monetary authority that was intervening through price and
quantity targets, acting in several simultaneous directions and through several overlapping and non-
transparent instruments. The challenge was communications and, yet, the NEM central bank was quiet;
indeed, as it changed policy more frequently, it communicated even less. Credibility took a big hit. The
two parts of “flexibilization,” namely, a diminished commitment to the inflation target, and the abuse of
“macroprudential tools,” heralded a changed central bank, one more attuned to the NEM goals of
stimulating domestic demand and using price and exchange controls to manage inflation.
There was a third mistake, in our view, in how the NEM central bank dealt, or not, with inflation.
At issue is not the actions taken, but the ideas behind them. What we discuss is speculative. But it may
help us understand why the NEM central bank claims that it was not “flexibilizing” or denigrating the IT
regime but, more properly, improving it.
The background here stretches back to the “heterodox” stabilization plans of the 1980s and
1990s, based on a fixed foreign exchange anchor of some kind, such as the Real Plan of 1994. With its
innovative design, the Real Plan succeeded spectacularly—in no small part through the work of Edmar
Bacha who was brought in to make the design fiscally appropriate and manage it implementation.
However, regrettably, its fiscal anchor was short-lived and, some would argue, as time wore on, it lacked
the trust of investors. The result, towards the end, was a distorted monetary regime with one overriding
purpose, to entice enough foreign capital to sustain the peg on the exchange rate. The consequence,
21
was a regimen of high real interest rates that asphyxiated the domestic economy, waiting for the
normalization of capital flows and/or a draconian-enough fiscal adjustment. The regimen collapsed with
the shock of Russia’s default at end-1998.
To Brazil’s fortune, by mid-1999 it had been replaced. In came the tripod, still standing: a
floating exchange rate with a soon-to-be credible inflation target and, at the core, a fiscal anchor
supported by the new Fiscal Responsibility Law. At the time, no one would have guessed that the fiscal
anchor would be in the form of an overperformance of revenues over expenditures, thus with large-
enough primary surpluses masquerading for a, de facto, progressive worsening of the structural fiscal
balance with unsustainable increases in real expenditure that would prolong to this date. At the time,
the external measure of Brazil risk improved and the real interest rate fell.xxxii However, in retrospect,
perhaps not entirely surprising, the regime of high real interest rates survived, a structural qualifier to
the Brazilian tripod.
It is hard to find convincing, parsimonious explanations for this feature. It is not, however,
entirely a marvel, or even an “abnormality.”xxxiii Although it is unique to Brazil among the successful IT
adopters, the outcome was foreseen in the literature about heterodox stabilizations, in the early
theoretical papers by Obsfeltd, by Calvo and by Bruno.xxxiv The underlying theoretical issue is multiple
equilibria outcomes: the post-stabilization revenue from the inflation tax (seignorage) could be the same
if stabilization produced either a high or low interest rate regime. Both outcomes were possible, and the
challenge was to produce the good one—the one with low inflation for the given fiscal deficit or,
alternatively, with a lower real interest rate for a given rate of inflation and fiscal deficit.
As Michael Bruno observed, reflecting on his experience with Israel’s 1985 exchange-based
stabilization, "Which is the relevant equilibrium depends on how economic agents form expectations
and adjust prices and other nominal magnitudes (wages, money and/or exchange rates) while learning
about the system".xxxv With adverse expectations, post-adjustment, the economy could be stuck in the
22
bad equilibrium with high interest rate/ high expected inflation. The literature isn’t clear on what causes
the bad outcome. Intuitively, it has something to do with the intertemporal consistency of the promises
made. Does the central bank have the credibility to promise the targeted level of inflation? Does the
fiscal authority have the means to promise the fiscal targets? Is the regulatory structure strong enough
to make bond markets believe in the promise of no default? Is the incentive structure for the economy
compatible with the promise of longer run growth needed to stabilize the ratio of public debt-to-GDP?
For Brazil, the presumption had always been that none of these questions could be answered
affirmatively.xxxvi On the contrary, it was always easier to argue why the economy remained stuck in the
bad equilibrium. An obvious culprit was the fiscal stance and the underlying structural weakness of the
public sector. The NEM central bank, however, possibly prodded by the ideological bias of Rousseff’s
inner circle of advisors, seemed to have decided that it was time to act.
For most policy makers, multiple equilibria, was (and still is) a didactical exercise. Something to
be used when explaining different outcomes, for example, low-inflation/interest rate stabilization in
Chile and high-inflation/interest rate stabilization in Brazil. Useful to hammer down the message of
structural constraints to the level of the interest rate and, hence, of the need for structural reforms in
other, non-monetary, policy areas. For the NEM central bank, however, it seems that it was more. In
mid-2011, the central bank started a public discussion about structural change, not the need for it,
rather, about supposed outcomes of already accomplished change. Change of the kind that would
somehow enable a movement from a “bad” equilibrium to a better one—to a permanently lower
neutral real interest rate. Indeed, starting with the meeting of September 2010, the monetary
committee had added the following paragraph to its minutes:xxxvii
Como consequência da estabilização e da correção de desequilíbrios, as quais
determinaram mudanças estruturais importantes, o processo de amadurecimento do
regime de metas se encontra em estágio avançado, e isso se reflete favoravelmente na
23
dinâmica da taxa de juros neutra e na potência da política monetária. ... Apesar de
reconhecer que um elevado grau de incerteza envolve o dimensionamento de variáveis
não observáveis, o Copom considera que as estimativas mais pessimistas sobre o nível
atual da taxa de juro real neutra tendem, com probabilidade significativa, a não
encontrar amparo nos fundamentos. O Comitê também pondera que há evidências de
que a tração da política monetária aumentou no passado recente e, comparativamente
ao que se observava há alguns anos, atualmente pressões inflacionárias são contidas
com mais eficiência por meio de ações de política monetária.
On a different vein, celebrating the first year of the NEM, then Minister of Finance Guido
Mantega wrote in December 2012,xxxviii
O Brasil vive um momento de mudança estrutural em sua economia. Depois da
estabilização de preços promovida pelo Plano Real, da revolução inclusiva e distributiva
a partir de 2003 e da mudança de patamar de crescimento econômico a partir de 2006,
o país agora passa por nova mudança fundamental: a colocação das taxas de juros em
níveis normais para uma economia sólida e com baixo risco.
Whether influenced by these ideas, or not, the fact is that, as we have seen, the bank took
radical action: the 525bp cut in the policy rate from August 2011 to October 2012, bringing the Selic
target rate to the lowest level ever. No COPOM had dared this before, although, possibly, others also
had thought about it at some point. Here was a deliberate, policy-induced attempt to nudge the price
system to the good equilibrium by manipulating the nominal interest rate—and, regrettably, it failed
miserably.xxxix
One may ask how did they dare do it? But, then, in mid-2011, Brazilian policy-makers were
riding a wave of optimism and vainglory. Post the GFC, together and in tandem with China, the country
arose as “the darling” of foreign investors and markets. Respected international observers applauded
24
the set of policies incorporated in the NEM, confusing, for example, the appropriateness of fiscal
stimulus in Europe with that of Brazil. The IMF, a perennial critic, lauded Brazilian policy-making. In its
“rethinking of macroeconomic policy,” it agreed with several if not all theoretical underpinnings for the
new policies.xl The sophistry of government pronouncements helped. And the NEM central bank never
looked back.xli It did not recognize the failure. While it could not claim success, it accepted implicitly that
from thereon the target for inflation was, de facto, the ceiling and not the midpoint of the target band.
And soon it lost control of that as well, depending ever-more on price controls to paper over an
inflationary momentum that inevitably erupted into full blown double-digit and inertial inflation. It
failed and could not recover.
In sum, the three “innovations” in policy were all mistakes. The “flexibilization” of the inflation
objective without a clear communication of policy, and in pursuit of the mistaken belief that activity was
lagging due to insufficient demand. The misuse of macroprudential tools and price controls as a
substitute for interest rate policy to control inflation. The disastrous attempt to lower a fortiori the
equilibrium neutral policy rate, in pursue of a mythical “good” equilibrium. With the mistakes, the
political and economic challenges of reestablishing the target was something it could not face.
Ultimately, the economic cost of three years of policy mismanagement, and the difficult legacies left for
the successor regime, were written off, filed away as another failed policy experiment without blame or
accountability.
25
3. The Role of Fiscal Policy
Brazil did not have a proper central bank until 1964, and only in 1986 the functions of Banco do
Brasil, a publicly-owned commercial bank, were isolated from those of the central bank. It was only in
1988 that the central bank began to conduct open-market operations. Formal limits to the central bank
funding of the Treasury emerged only in the late 1980s, and implemented in the 1990s, a period of near
hyper-inflation with, progressively, near-complete indexation of the financial system. The monetary
authority did not in fact exist, subjected as it was to the funding needs of the fiscal and quasi-fiscal
system (including the public banks) and without a Congressional constraint on its capacity to create
debt. It was only in the post Real Plan period, and in fact, only after the floating of the exchange rate
and introduction of IT in 1999, that the concept of an independent monetary authority began to take
shape. For all this, and given the ideological confrontations, the concept of an autonomous monetary
policy is slippery and controversial.
From the beginning, even post-IT, the idea of independence was questioned. Not only in the
discussion about separation of powers (to whom does the monetary authority report to?) but also in
concerns about fiscal dominance. As discussed, monetary policy in Brazil operates, and emerged from, a
high real interest rate regime. It also operates with largely unpredictable fiscal outcomes and, for
extended periods, under threats of external insolvency. It is a prime candidate for fiscal dominance. The
standard reference is Blanchard’s 2004 paper:
A standard proposition in open-economy macroeconomics is that a central-bank-
engineered increase in the real interest rate makes domestic government debt more
attractive and leads to a real appreciation. If, however, the increase in the real interest
rate also increases the probability of default on the debt, the effect may be instead to
26
make domestic government debt less attractive, and to lead to a real depreciation. That
outcome is more likely the higher the initial level of debt, the higher the proportion of
foreign-currency-denominated debt, and the higher the price of risk. Under that
outcome, inflation targeting can clearly have perverse effects: An increase in the real
interest in response to higher inflation leads to a real depreciation. The real depreciation
leads in turn to a further increase in inflation. In this case, fiscal policy, not monetary
policy, is the right instrument to decrease inflation.xlii
Indeed, Blanchard was writing about Brazil. His concern was the situation in 2003, post the
politically induced overshooting of the currency in the fall of 2002. As it turned out, his prediction was
proven wrong, and early critics explained why some of the hypotheses were not applicable.xliii The
concept, however, captured the discourse. Analysts argue today about fiscal dominance, and not only of
the past, also in the current setting. Many thought, emphatically, that the regime in 2015 was of fiscal
dominance.
The motive for this appeal is simple. For at least the last three decades, since the Constitution of
1988, fiscal policy has been wrong. And this was after a twenty years long dictatorial regime, where
fiscal policy was subordinate to the goals of nationalism and militarism. It may not be an exaggeration to
say that, in Brazil’s twelve decades of Republican history, it has hardly ever been right. It is
commonplace to note that, in Brazil, the weak link in policy is, and has always been, fiscal. Hence, the
appeal of Blanchard’s fundamental insight: “fiscal policy, not monetary policy, is the right instrument to
decrease inflation.” Largely, in the post-1998 period of IT, monetary policy has been effective. It is
empirically the case that future inflation and activity respond in the direction expected to present
changes in the real interest rate. Nevertheless, in most periods, the fiscal stance worked against the
27
effectiveness of monetary policy. What we observe, therefore, is an unusual pattern of extreme and
frequent monetary policy activism.
A mark of recent policy, post-Rousseff’s impeachment, is the recognition that the fiscal
imbalance is structural and not cyclical. Arguably, this is an argument to buttress the credibility of
monetary policy. But it was not so during the NEM period, on the contrary. Not only were budgetary
policies lax but, as discussed, the actions of public banks and state corporations, of tax and price
controls, diminished the impact of a, consequently, enfeebled monetary response.
Research has shown that, unsurprisingly, monetary policy is less effective for firms with access
to government-driven loans of one kind or another. It has shown that this form of market segmentation
helps isolate the level of employment from the impact of monetary policy, and to attenuate the impact
of external shocks. Thus, segmentation drives a wedge on the normal operation of macroeconomic
transmission channels. It renders them less effective and its impact is large, persistent and pervasive.xliv
In Brazil, the development bank is often championed as the “only viable instrument for capital
formation,” as a necessary antidote to market failures that impede the development of long-term
lending. The reality is otherwise. Its lending may have led to lower productivity growth.
Its actions do not have any consistent effect on firm-level performance and investment,
except for a reduction in financial expenditures due to the subsidies accompanying loans.
However, BNDES does not systematically lend to underperforming firms. Our results
indicate that BNDES subsidizes firms that could fund their projects with other sources of
capital.xlv
28
Furthermore, there was yet another channel through which fiscal policy affected the NEM
monetary regime, a financial link between the operations of the Treasury and the Central Bank that
made monetary policy, in fact, nearly always, less restrictive than what it seemed to be.
“Creative accounting,” Central Bank-Treasury relations, and Monetary Policy. Before the GFC,
“normal” central banks had small balance sheets. Their main liability was the money base and the main
asset, a stock of Treasury paper typically with long maturity. For the US Fed, for example, in 2006, the
money base was 90.2% of total liabilities, and the stock of Treasuries, 90.3% of total assets. The money
base paid no interest, and the Treasuries did; hence, central banks were typically profitable, with profits
transferred to the Treasury. Because everything was small, the transfers were an unimportant part of
total fiscal revenue. All this changed after the GFC. By 2015, the Fed’s balance sheet was $4,489 billion,
24.6% of GDP, and its structure had changed considerably. It held $2,462 billion in Treasury securities;
interests paid to the Treasury were $28.1 billion or close to 1% of total fiscal revenue, and because the
post-GFC Fed pays interest on the reserves commercial banks deposit at the central bank, and reserves
are a large portion of its liabilities, the possibility of future large potential losses, hence a drain on the
fisc, developed into a contentious political issue.
The same set of issues are germane to the Brazilian central bank. Indeed, the size of its balance
sheet is proportionally larger than the Fed’s, 48.2% of GDP in 2016, and it was already large before the
GFC. The composition is dramatically different, however. As shown in Annex Table 2, base money is only
8.9% of the total balance sheet; deposits from commercial banks, 12.2%; Treasury accounts, 34.6%. The
largest liability, 35.8% of the total, is “operações compromissadas,” reverse repo operations
collateralized by Treasury paper conducted through the local derivatives market. In counterpart, the
central bank holds one-third of the total outstanding stock of domestic Treasury paper (see Figure 9).
29
Compromissadas are the preferred instrument for liquidity management in open-market
operations, the counterpart to the Fed’s interventions in short-term money-markets for the same
purpose: To keep overnight interbank borrowing rates close the monetary policy rate. The puzzle is why,
in Brazil, the stock of compromissadas grew to be so large. By end-2012, would the central bank need
one-third of its balance sheet (12.4% of GDP) to intervene in money-markets, if the only objective was to
stabilize day-to-day changes in market liquidity? Not likely; the expansion in compromissadas was,
rather, an outgrowth of the accumulation of foreign exchange reserves.
********* Figure 9. Central bank – balance sheet and holding of treasuries ***********
The central bank could not issue its own paper. To have instruments with which to sterilize its
purchases of foreign exchange (to buy back the reais it spent) it first bought securities (treasuries) from
the Treasury, using as “cash” deposits at the Treasury account in the central bank. It then sold those
treasuries to the market, draining the liquidity it had created by purchasing dollars. Only, it could not do
this in the secondary market. In Brazil, the secondary market is small, and does not work well. What was
available were repo and reverse repo operations between the central bank and agents with accounts at
the central bank. And, over time, this arrangement continued to expand (see Figures 10a and 10b),
producing two critical outcomes.
*********** Figure 10a. Compromissadas and net foreign assets *************
** Figure 10b. Compromissadas – share of central bank balance sheet and GDP**
• First, since the cash used by the central bank to buy the treasuries was deposited in the
Treasury account at the central bank, as the stock of foreign reserves increased, so did
30
the size of the account. The volume grew to be so large that, irrespective of sudden
changes in reserves, the account of the Treasury at the central bank was always in
surplus—a large surplus. Legally, the Treasury could use this surplus to buy back its own
debt. In practice, during the NEM years, it chose not to do so. It had an incentive: The
account was remunerated at an interest rate equal to the average interest rate of the
treasuries the central bank had bought. Thus, it produced a steady stream of income for
the Treasury, paid by the central bank, which could be used interchangeably with other
current receipts to meet any Treasury obligation—for example, funding the deficit. The
quantities involved were large: The central bank estimates that between December
2006 and November 2015, interest paid on compromissadas summed to 10.1% of
GDP!xlvi To be sure, there was a counterbalancing flow: The Treasury paid interest on the
treasuries owned by the central bank. The difference is that this stream was excluded
from the total in the primary (non-interest) expenditure account of the government.
This is the account for which Congress, in conformity with the Fiscal Responsibility Law,
sets a limit for current year spending. Thus, the expedient between the NEM central
bank and the Treasury worked as a political subterfuge to meet Congressionally set
requirements, without really meeting them.
• Second, the conversion of treasuries into compromissadas produced a shortening in the
maturity of the combined Treasury plus central bank debt. Time and again, during the
NEM period, the Treasury walked away from an auction without placing the securities it
had wished to sell. In times of uncertainty, buyers shy away from longer-duration
(maturity), fixed rate paper. They prefer zero-duration (overnight) floating rate paper
indexed to the central bank rate.xlvii And yes, in Brazil, the Treasury offers this paper, a
31
legacy from the times of near hyper-inflation. If buyers could not get it, they would
settle for the compromissadas. They bought the longer-dated Treasury bond, but did
not keep it. Instead they would repo it with the central bank for 30 or 60 days,
sometimes for even shorter maturities. And in the accounting of the mutual funds (the
main buyers of Treasury paper) it is the original structure, not the repo’ed
transformation, that counts for meeting regulatory requirements. Thus, de facto,
though not from a regulatory point of view, there was a shortening in the maturity of
treasuries with the market. In January 2015, the mutual fund industry, the largest fixed
income investment vehicle in Brazil, had 24.4% of its assets invested in compromissadas.
The net result was an effective reduction in the average interest rate paid by the
Treasury on its total stock of outstanding debt, a measure of monetary stimulus.xlviii
Compromissadas are used also to manage valuation changes in the stock of foreign reserves,
again, with consequence for the effects of monetary policy during the NEM period. Since the BRL floats,
expressed in reais, the value of the stock of foreign reserves varies even when there are no transactions
in foreign reserves. On a cash basis, these valuation changes have no impact on the balance sheet.
However, if the values in the balance sheet are priced to market, marked-to-market, the valuation
change impacts directly the balance sheet. Central banks have dealt variously with this problem.xlix A
simple way is to create a valuation account, below the line, adjusted only when there are actual
transactions in foreign exchange. The Brazilian arrangement is more complex, and since the approval of
Law 11.803/2008 asymmetric and perverse.l
For the Law says that when there are gains in valuation (i.e., when there is a depreciation of the
BRL vis-à-vis the currencies in which the reserves are invested) the central bank transfers cash to the
Treasury, almost immediately (typically with a lag of at most two months). However, when there are
losses, the Treasury makes the central bank whole by a special emission of Treasury bonds. This means
32
that gains in valuation are deposited in the general government account, but losses in valuation are not
debited from it, another reason why the surplus in the general government account is so large.
To keep market liquidity under control, and thus achieve its interest rate target, the central bank
must intervene if the Treasury draws and spends from its resources in this account. Once again, the
preferred instrument are compromissadas, and the consequences are as above. The volume of
compromissadas grows, the central bank transfers net interests received to the Treasury, and there is,
potentially, an implicit financing of the Treasury by the central bank if the Treasury draws on the
account to finance the deficit, as it did during the NEM period, notwithstanding the Constitutional
prohibition. For all these reasons, monetary policy may be, and was during the NEM period, laxer than
indicated by the posture on interest rates alone.
The implications are clear. Had fiscal deficits led to transparent measures of debt accumulation,
interest rates, market conditions, and monetary policy would have been different in the NEM period.
The capacity of the government to finance itself would have been smaller, with an impact on desired
policy. The stance of monetary policy, and the subterfuges used, created fiscal space. That it was
misused only completes the tragedy of the NEM period.
33
4. Conclusion
The NEM central bank became an institution with compromised credibility that reinforced
inertial elements in inflation, and weakened the institutions governing Treasury/central bank relations.
A return to more credible IT can deliver inflation at the target. In fact, it already has, riding on the effects
of a recession of unprecedented depth, the legacy of NEM policies. Self-discipline by the Treasury can
reestablish clear limits for the central bank and, again, the new administration has done so already. The
example of the NEM central bank shows, however, that it was relatively easy to subvert principles. What
was done was done within the institutional framework. There was no need for new legislation or major
regulation. The was room for deviation, and the impetus was the demands of fiscal policy. On balance,
the key failure was the failure of the broader macroeconomic regime, and this has been a constant in
Brazilian history. To this day, the main challenge is to build lasting fiscal support for effective monetary
policy. In Brazil, the probability of a fiscal failure constrains and reduces the scope of monetary policy.
Given the tools its uses, the success of monetary policy depends on expectations. In the
canonical IT model, and in most real-world applications, the reference is to future inflation. There are
other elements, the usual economic arsenal of general equilibrium relations. Exchange rate forecasts
influence inflation expectations; the stance of fiscal policy works itself indirectly onto forecasts of the
output gap. This is the norm. Brazil, however, is outside this norm: Inflation expectations, and thus the
impact of monetary policy, are conditioned by expectations about fiscal outcomes, for good reasons.
During the NEM it was because the pursuit of political objectives found no constraint on monetary
policy. Presently, it is because the forecasted trajectory of the ratio of domestic public debt to GDP is
unstable and could slip into insolvency.li
This said, throughout, debt markets functioned and function normally. Crises were overcome
and asset values moved accordingly, very much in response to the foreign-to-domestic interest rate
34
differential and changes in perceptions about country risk and the stability of the exchange rate. That
the next step could be a monetization or repudiation of the public debt, precipitating an end-game
crisis, was a scenario considered and dismissed. Investors admit that they is a probable outcome.
Somehow, however, the belief is that the fiscal stance will change, in years past, because GDP growth
would unshackle the constraints, now, because there is some confidence that the government will
implement, at long last, structural change. It is this belief that allows monetary policy to operate. It is
not a situation of fiscal dominance, as technically conceived. It is, nonetheless, an instance where fiscal
constraints are dominant. This helps explain the behavior of markets during the NEM period, when the
authorities resorted to subterfuges to try, somewhat successfully, to fool the market. Since then, shocks
to inflation abated, and inflation expectations improved. Yet fiscal developments are, once again, the
critical obstacle in the implementation of monetary policy. Despite soaring unemployment and a gaping
output gap the central bank waited for the outcomes of the political process before beginning the latest
easing cycle in December, 2016. It waited for confirmation that Congress delivered on the promised
fiscal measure. And likely it will continue to do so. The central bank’s policy statements say so, and they
are convincing—for otherwise debt markets would respond alarmingly to the incongruity between
current policy and expected debt outcomes.
The measure of what politicians and/or technocrats deliver is subjective, to be sure, and
expectations—also about inflation—express a political judgement. A government with strong political
backing can get by delivering less. It may produce positive expectations when results are, in fact,
mediocre, compromising future outcomes. The period of the NEM is a case in point.
But not so today. The fiscal outlook for next decade is extreme by Brazil’s own standards. It is
challenging beyond the challenges of the crises of the 1990s and the early 2000s.lii By most accounts, the
Debt/GDP ratio will keep climbing until 2020 or thereabouts, when it will reach, possibly, 90-100%.liii The
just approved constitutional mandate to cap the real growth in (primary) public spending, the current
35
tool, and the very measure that unlocked the central bank, is not enough.liv The next hurdle is the
reform of the social security system. Expected in the second half of this year, it would be a
consequential milestone—and we expect it will be. For, even with limited initial fiscal effect, it would
change constitutional practices stretching back to 1943, if not earlier.lv It would impact directly and
adversely broad constituencies such as unionized labor and the civil service, with large political clout. If
there are turning points in the road to a new fiscal regime, this may very well be it.
But it also would not be enough. First, because the reform will be, likely, “sliced” or diluted to
make it more “palatable,” thus in need of subsequent attempts. Second, because other things would
have to be done to shift the course of deficits to surpluses in the primary fiscal accounts, the
precondition for debt sustainability. A reform of the broader tax regime will not be possible before the
next administration in 2018-2022. It may not happen even then. Several subnational governments are
practically bankrupt. A third consecutive rescheduling of their debts was announced including debt relief
at the expense of the central government, and it may not be enough. The idea that a cap to real
expenditure may lead to a reduction in the share of public expenditure in GDP makes sense if growth is
fast. In this scenario, fiscal deficits would turn to surpluses and the trajectory of debt growth change.
The path of Debt/GDP would stabilize, waiting for the decade-ahead fiscal dividends of the social
security reform. But, post the excesses of the NEM and the generally weak global forecasts post-GFC,
with a decade-long drop in productivity, growth is likely to be anemic. One would have to expect that
politicians will turn to cutbacks in real public expenditure, beyond those now envisaged.
The question is, what do investors who hold Brazilian debt expect? Seemingly, very little. It is
surprising that time and again, the fiscal authorities have the benefit of the doubt. During the NEM it
was the promise of growth even when, patently, it was disappointing. And what about events so far in
2016/17? Expectedly, investors react to events, a ratings downgrade, a political fiasco, breakdowns in
budget negotiations. But soon enough, they accept the status quo with its inconsistencies. There is a
36
fatalism about politics and the political system, about what can be done, and about the debt. This
fatalism supports inaction, until the next crisis.
This of course matters for monetary policy, where expectations play a critical role and the future
must be anticipated. The implication is that, over time, monetary policy in Brazil is likely to fail. Quite
aside from domestic and external shocks, fiscal uncertainty undermines its function. An expert handling
of the tools helps but cannot neutralize the uncertainty. The tools are effective. However, no sensible
set of policy makers would use the tools of monetary policy to fully counter the impact of fiscal policy. If
the fiscal side is as unyielding as it is, and will continue to be, the easier solution is to give up,
periodically; of course, making things worse for the future.
Giving up on a policy course, regulatory forbearance, partial debt amnesties, periodic
forgiveness and/or rescheduling of taxes and other obligations due, re-working of contracts, an
impeachment proceeding that ends without the Constitutionally mandated punishment, tolerance with
broken political programs, all are expressions of a jurisdictional mix-up that, ultimately, reflects on asset
prices. As Edmar Bacha has long since observed, this may help explain the puzzle of why, even in times
of good monetary policy, Brazil operates within a high real interest rate regime that feeds back into low
growth and a compromising fiscal outlook. It also helps explain why, in Brazil, there are fiscal limits to
monetary policy.
37
i The target is set for the central bank by the National Monetary Council that has left it at 4.5% since 2005, with a tolerance band of +/- 2%, in principle, to accommodate exceptional circumstances, only. ii Ref. to China’s stimulus = unexpected 2pp equivalent of global GDP. iii As emphasized in documents and speeches at the time, this was the first time that foreign crises could be met with counter- and not pro-cyclical responses. The first time the crisis was not first and foremost a balance of payments crisis that called for contractionary policies aimed at safeguarding dwindling foreign reserves at a moment of exchange rate panic. It was, instead, a moment for celebration. Yes, amidst the global pain, a “conquest” for Brazilian policy. As the then Governor of the Central Bank noted, “this clearly demonstrates the consolidation and maturity of the regime of [inflation] targets in Brazil.” H. Meirelles (2009) “Pronunciamento do Presidente do Banco Central do Brasil” IX Seminário Anual de Metas para a Inflação, May 15, 2009, Par. 9 iv “Carta aos brasileiros”, etc. (Do I need this?) v A superb, detailed, and highly readable account of the thirteen years of economic policy under the PT may be found in, Safatle, C., J. Borges and R. Oliveira (2016): Anatomia de um Desastre. São Paulo, S.P., Portfolio-Penguin. Written by three economic journalists at the newspaper Valor, the book presents a chronology of the main events and their principal actors. vi The underlying statistic is the 12 months’ sum of monthly Treasury primary expenditure, deflated by the monthly CPI index (IPCA). The budget numbers approved by Congress are an “authorization,” interpreted as a ceiling for expenditure in the budget year. The administration may choose to spend less, by issuing a decree of “contingenciamento” of expenditures. It typically does so at the start of the year, to remove many of the vanity projects added to the budget by members of Congress. vii A central tenet of desenvolvimentismo, is the negation, in fact, a naive inversion of Say’s law. It is not supply that creates its own demand, it is demand that creates supply—not only during recessions, always. Moreover, desenvolvimentismo, abjures underconsumption theories. Recessions and stagnation are not a reflection of inadequate consumer demand and/or private investment linked to future consumption. Recessions are caused by misguided policies of public spending; by wrong-headed regulation; and by insufficient/misdirected incentives through public banks and corporations. Most versions of desenvolvimentismo forgive and forget fiscal deficits. They are not a financial restriction; they do cause misallocations; they do not substitute public for private spending, not today or in the future. Rather, they are “self-imposed constraints on government spending [and] should be removed.” Rezende, F. (2009) “The Nature of Government Finance in Brazil.” International Journal of Political Economy, 38 (1), p.95. viii See, for example, Bresser‑Pereira, L. C. and P. Gala. (2010) Macroeconomia estruturalista do desenvolvimento. Revista de Economia Política, vol. 30, nº 4 (120), pp. 663-686, outubro-dezembro. For current updates on developmentalism, see Centro de Estudos do Novo Desenvolvimentismo, FGV-EESP, http://cnd.fgv.br/ ix Safatle, Borges and R. Oliveira, op. cit., p. 93, note that term appeared first in the preamble to the December 2012 issue (17th edition) of the series “Economia brasileira em perspectiva” published by the Ministry of Finance, penned by the then Secretary of Economic Policy, Márcio Holland. x Barbosa, N. and J. Souza. (2010) “A inflexão do governo Lula: Política econômica, crescimento e distribuição de renda. ” Brasília, D.F.: Ministério da Fazenda – Secretaria de Política Econômica, p.14. xi Ibid., p.31. xii “Does inflation target pin down the monetary regime? Evidence from Brazil.” Washington DC: International Monetary Fund, October 2015. xiii Edmar Bacha, “Integrar para crescer: O Brasil na economia mundial. ” Rio de Janeiro, Instituto de Estudos de Política Econômica - Casa das Garças, December, 2013. Safatle, Borges & Oliveira (2016), op.cit., pp. 19-25, date “the turn” in economic policy, away from the more sensible policies of then Minister, Antônio Palocci, to a meeting that took place in the second-half of 2005 under the leadership of Dilma Rousseff. At this meeting, Rousseff criticized vehemently Palocci’s proposal to limit the real growth of public expenditures to 1%pa. xiv Defined as the primary balance (current receipts less current outlays, excluding interest costs on the public debt) plus capital costs (debt amortization, financial and physical investment costs) plus the interest costs on the public debt. Source: Secretaria do Tesouro Nacional. Séries Temporais. Execução Orçamentária – União. (http://www3.tesouro.fazenda.gov.br/series_temporais/principal.aspx?tema=4#ancora_consulta)
38
xv The staff report was made public in November, 2015, once Arno Augustin was removed as Secretary of the Treasury. It was used in the impeachment proceedings against President Rousseff. A full account of the episode, with details of the so-called “pedaladas fiscais” appeared on the November 12th 2015 issue of O Valor: “O aviso foi dado: pedalar faz mal,” by Leandra Peres. xvi For a description of how the BNDES-Treasury operation was implemented, see Safatle, Borges and Oliveira (2016), Chapter 8, “A operação quadrangular’”. xvii The implicit rate is the ratio of total interest paid by the central government (Treasury plus central bank) to the net stock of outstanding domestic central government debt. In 2015, following the devaluation of the BRL/USD exchange rate, the central bank had large losses in its outstanding stock of swaps sold as USD hedges to the market, a form of public debt operation. In the swap operation, the central bank pays the rate of devaluation and receives the overnight market rate, settled at the end of the contract. It has a net loss if the rate of devaluation exceeds the interest rate, and vice-versa. The loss is debited to the interest balance of the central bank. xviii References re: Lava-Jato. xix References to “Custo Brasil” and historical low productivity (Bacha/Bonelli and World Bank recent report). xx Reference to recent drop in TFP. xxi In 2015 total investment contracted 14.1%yoy. Starting in 2012, arguably, new investment in machines and equipment grew at a lower rate than depreciation (thus with a partial destruction of the capital stock). xxii For a journalistic account of the NEM central bank, see Chapter 6 of Safatle, C., J. Borges and R. Oliveira (2016), op.cit. xxiii They were not alone. Speaking in Brasilia on December 1, 2011, the IMF’s Managing Director, Christine Lagarde said, “The marked resilience of the Brazilian economy is the product of a strong track record of competent macroeconomic management… [and] has also benefited from a solid and well-capitalized banking sector, which has so far softened the impact of one important channel of contagion from the global financial crisis.” xxiv Reference to the debate (“is IT dead?”) + why the priority? = Taylor’s b>1. xxv Svensson, L. (2010) "Inflation Targeting." In: B. Friedman and M. Woodford (eds.): Handbook of Monetary Economics. Elsevier. xxvi In 2000, eight years before the onset of the crisis, Fed Governor Edward Gramlich became concerned about the spread of unsecured mortgage lending and urged Greenspan to act; in 2007 he published a book warning of the coming mortgage crisis entitled Subprime Mortgages: America’s Latest Boom and Bust (Washington DC: The Urban Institute Press). Greenspan’s ideological aversion to regulations, his beliefs that markets would self-correct, and his political imperative to sustain the recovery in output to favor the Republican candidate ahead of the US Presidential election, led him to dismiss all warnings. xxvii Reference xxviii Brazil had, however, its own “derivatives failure,” and very much a function of inadequate reporting and supervision. Explain. xxix Reference to Rey (Kansas City Fed). See also, Ribeiro Blanco Barroso, J. (2016) Capital Flows to Emerging Markets: Causes, Consequences and Policy Options. Rio de Janeiro, RJ. XVIII Annual Inflation Targeting Seminar of the Banco Central do Brasil. xxx Reference to high real interest rate regime. xxxi For a discussion and survey see, xxxii In Oct/1998 the overnight (SELIC) rate averaged 41.6% as inflation (backward looking) dropped to 2.1%yoy. External funding was reestablished, in part, through an emergency IMF agreement and by yearend the rate dropped to 32.9% with inflation falling farther to 1.7%yoy. By Jan/2000 the rate was at 18.9% and inflation at 8.9%yoy, for a real rate (backward looking) of 9.3%. For the next several years, the real rate would hover at around this value only falling substantially after mid-2007. xxxiii Why are Brazili’s real rates so high? Literature. xxxiv Obsfeld, M. (1986) “Rational and self-fulfilling balance-of-payments crises.” American Economic Review 76 (1). Calvo, G. (1988) “Servicing the Public Debt: The Role of Expectations”. American Economic Review 78 (4). Bruno, M. (1989) "Econometrics and the Design of Economic Reform." Econometrica, Vol. 57, No. 2. See also, Bruno, Michael and S. Fischer (1990) “Seigniorage, operating rules and the high inflation trap”, Quarterly Journal of Economics 105: 353-74. xxxv Bruno (1989), op.cit, p.3.
39
xxxvi See, for example, Garcia, M. (2004) "Brazil in the 21st Century: How to Escape the High Interest Trap?" Rio de Janeiro: PUC, Texto para Discussão No. 466, or the more recent discussion about the post-crisis Eurozone: De Grauwe, P. (2011) “The Governance of a Fragile Eurozone.” CEPS Working Document No. 346. xxxvii Banco Central do Brasil: Notas do COPOM, 153a Reunião, Published on the website on September 9, 2010, Par. 19. xxxviii Mantega, G. (2012) “O primeiro ano da nova matriz econômica. ” Valor Econômico - 19/12/2012 xxxix Comments on Andre Lara Rezende? The Fischer equation and causality interest rate – prices. xl Blanchard, O., G. Dell’Ariccia and P. Mauro (2010) “Rethinking Macroeconomic Policy.” IMF Staff Position Note. xli Several econometric studies point to a break in the central bank’s reaction function somewhere near the introduction of NEM. See Vieira da Cunha (2015) and the literature cited therein. xlii Blanchard, O. (2004). Fiscal Dominance and Inflation Targeting: Lessons from Brazil. Cambridge, MA, NATIONAL BUREAU OF ECONOMIC RESEARCH, Working Paper 10389. xliii Goldfajn, I. (2002). Há Razões para Duvidar de Que a Dívida Pública no Brasil é Sustentável? Brasília, DF, Notas Técnicas do Banco Central do Brasil Notas Técnicas do Banco Central do Brasil. See also, Goldfajn, I. and E. R. Guardia. (2003) Regras Fiscais e Sustentabilidade da Dívida no Brasil. Brasília, DF, Notas Técnicas do Banco Central do Brasil; Fraga, A., I. Goldfajn and A. Minella (2003) “Inflation Targeting in Emerging Market Economies.” NBER, Working Paper 10019. xliv See, among others: Bonomo, M., & Martins, B. (2016). The Impact of Government-Driven Loans in the Monetary Transmission Mechanism: what can we learn from firm-level data? Banco Central do Brasil, Texto para discussão nº 419. Takeda, T., Rocha, F., & Nakane, M. I. (2005). The reaction of bank lending to monetary policy in Brazil. Revista Brasileira de Economia, 59(1), 107-126. de Mello, L., & Pisu, M. (2010). The bank lending channel of monetary transmission in Brazil: A VECM approach. The Quarterly Review of Economics and Finance, 50(1), 50-60. xlv Reference xlvi DEPEC (2015) “Fatores condicionantes da evolução das operações compromissadas e eventos correlatos. ” Nota DEPEC/BACEN. The same procedures would be used again, in December 2015, when the Treasury decided to pay off the remaining “pedaladas” from Rousseff’s first term. As Márcio Garcia e José R. Afonso explained in article O Valor newspaper (“Despedalar repedalando? ” January 15, 2016), “As pedaladas, recorrentes desde 2011, ocorreram para esconder gasto e déficit, assim evitando explicitar que se descumpria a meta fiscal do ano. Se as pedaladas foram gastos excessivos no passado, o correto seria que as "despedaladas" constituíssem redução de gasto ou aumento de receita no futuro. Assim, evitar-se-ia que a dívida bruta saísse de controle. Mas tal compensação não ocorreu. Foram quitados R$ 72,4 bilhões das pedaladas sem cortar um só centavo dos gastos públicos ou criar um só centavo de receita. Apesar disso, o TN ainda fechou 2015 com um caixa acima de R$ 800 bilhões! ... Duas fontes principais explicam o aumento do caixa do TN apesar do pagamento das pedaladas. O TN endividou-se muito (mais R$ 493 bilhões em títulos emitidos só até novembro) e o BC lhe repassou recursos monumentais (R$ 250 bilhões entre resultado e remuneração de caixa). ” xlvii See, Calvo, G. and P. Guidotti (1990), “Indexation and Maturity of Government Bonds: An Exploratory Model”, in Dornbusch, R. e Draghi, M. (eds.) Public Debt Management: Theory and History, Cambridge: Cambridge University Press, 52-93; and, Alfaro, L. and F. Kanczuk (2006) ‘Sovereign debt: indexation and maturity.’ Inter-American Development Bank, Research Department working paper series, No. 560 xlviii In the repo operation, the central bank receives the Treasury as collateral. Thus, it receives the interest due on this paper, usually of longer duration than the compromissadas. Because of this mismatch in duration, usually, the central bank would receive a higher rate than it paid. The procedure may be compared with the Fed’s “operation twist.” Only, the Fed buys and sells paper outright in the secondary market. For example, in September 2011, to lower long-term interest rates, the Fed sold short-term Treasuries and bought long, pressuring their yields downward. xlix Reference to Stella, etc in Mendes l For an exhaustive and excellent discussion of these issues, see: Mendes, M. (2015) “Lei 11.803/2008 e a Relação Financeira Tesouro – Banco Central” in, li Domestic not foreign debt lii Reference.
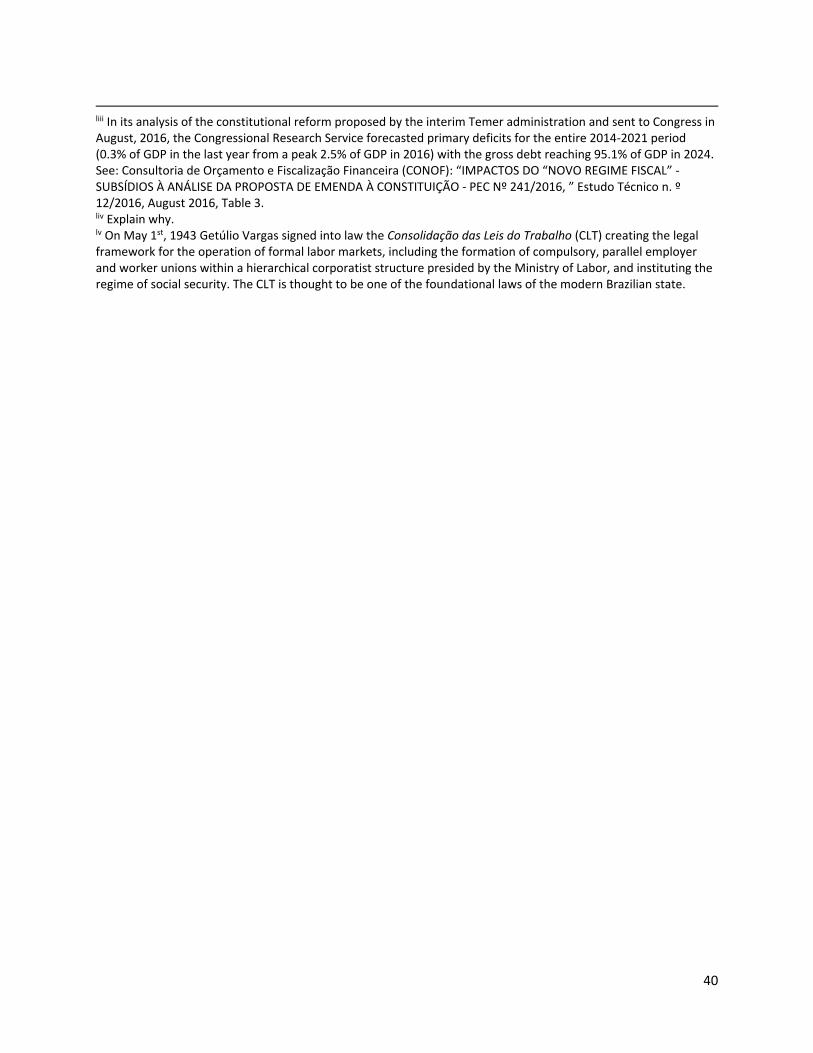
40
liii In its analysis of the constitutional reform proposed by the interim Temer administration and sent to Congress in August, 2016, the Congressional Research Service forecasted primary deficits for the entire 2014-2021 period (0.3% of GDP in the last year from a peak 2.5% of GDP in 2016) with the gross debt reaching 95.1% of GDP in 2024. See: Consultoria de Orçamento e Fiscalização Financeira (CONOF): “IMPACTOS DO “NOVO REGIME FISCAL” - SUBSÍDIOS À ANÁLISE DA PROPOSTA DE EMENDA À CONSTITUIÇÃO - PEC Nº 241/2016, ” Estudo Técnico n. º 12/2016, August 2016, Table 3. liv Explain why. lv On May 1st, 1943 Getúlio Vargas signed into law the Consolidação das Leis do Trabalho (CLT) creating the legal framework for the operation of formal labor markets, including the formation of compulsory, parallel employer and worker unions within a hierarchical corporatist structure presided by the Ministry of Labor, and instituting the regime of social security. The CLT is thought to be one of the foundational laws of the modern Brazilian state.
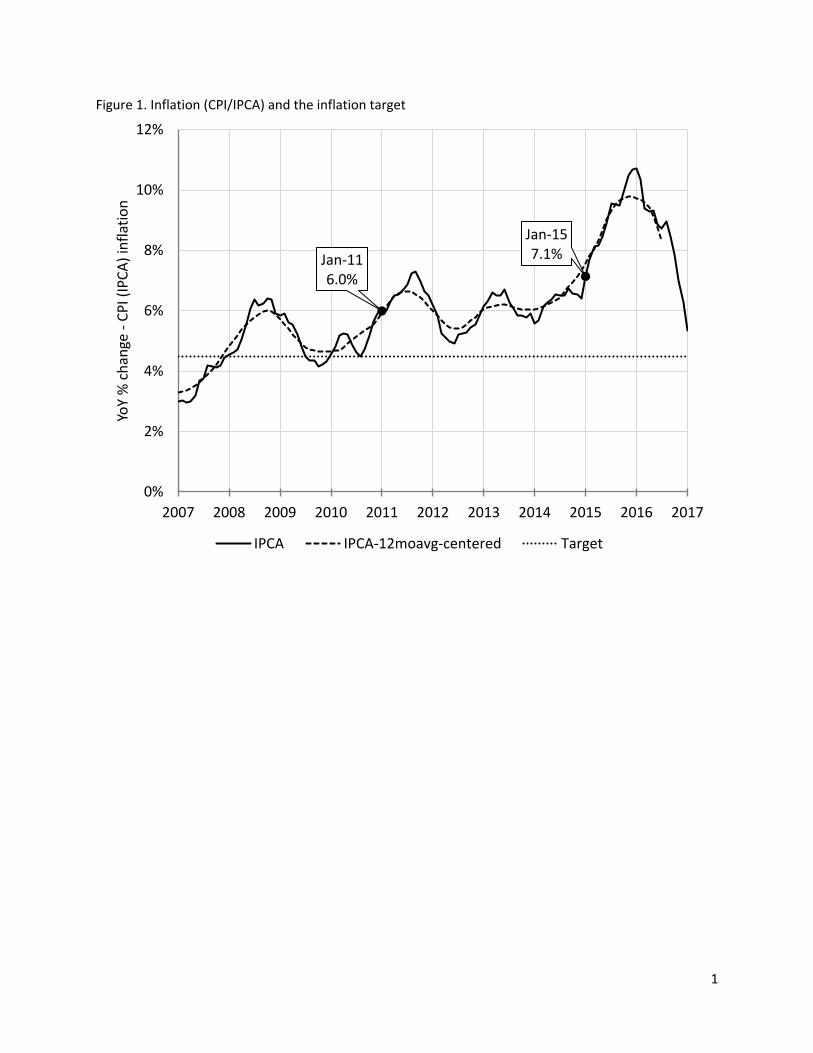
1
Figure 1. Inflation (CPI/IPCA) and the inflation target
Jan-116.0%
Jan-157.1%
0%
2%
4%
6%
8%
10%
12%
2007 2008 2009 2010 2011 2012 2013 2014 2015 2016 2017
YoY
% c
han
ge -
CP
I (IP
CA
) in
flat
ion
IPCA IPCA-12moavg-centered Target
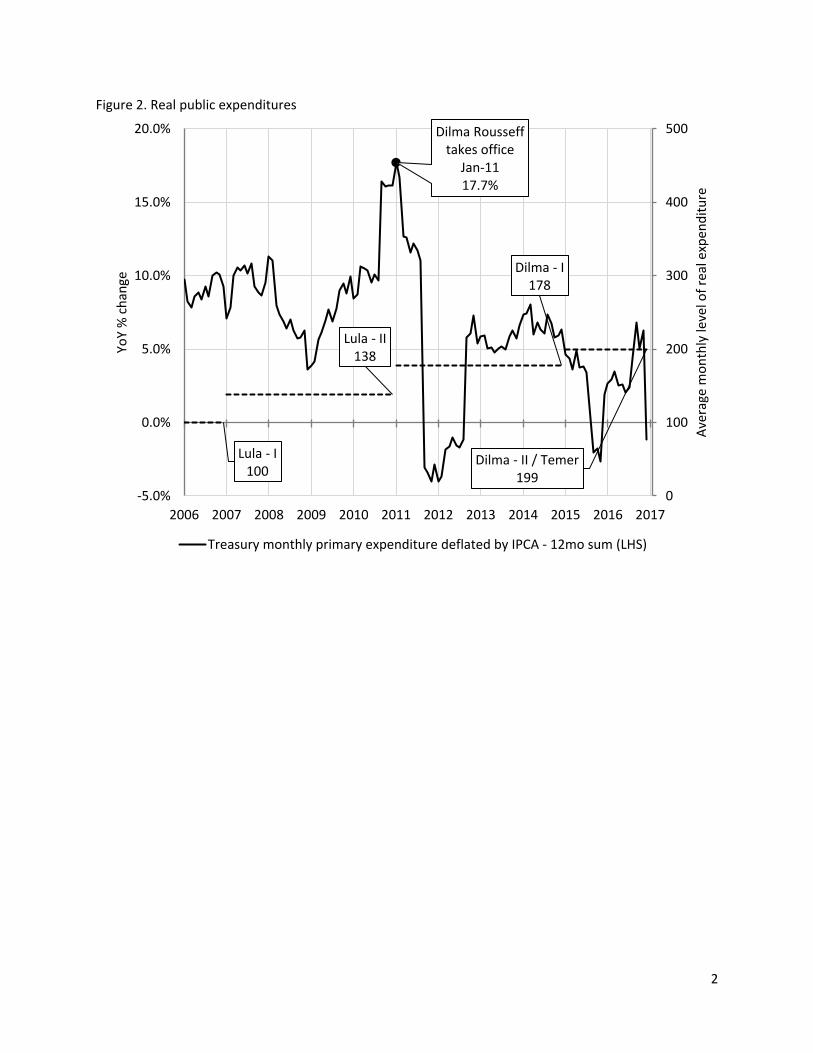
2
Figure 2. Real public expenditures
Dilma Rousseff takes office
Jan-1117.7%
Lula - I100
Lula - II138
Dilma - I178
Dilma - II / Temer199
0
100
200
300
400
500
-5.0%
0.0%
5.0%
10.0%
15.0%
20.0%
2006 2007 2008 2009 2010 2011 2012 2013 2014 2015 2016 2017
Ave
rage
mo
nth
ly le
vel o
f re
al e
xpen
dit
ure
YoY
% c
han
ge
Treasury monthly primary expenditure deflated by IPCA - 12mo sum (LHS)
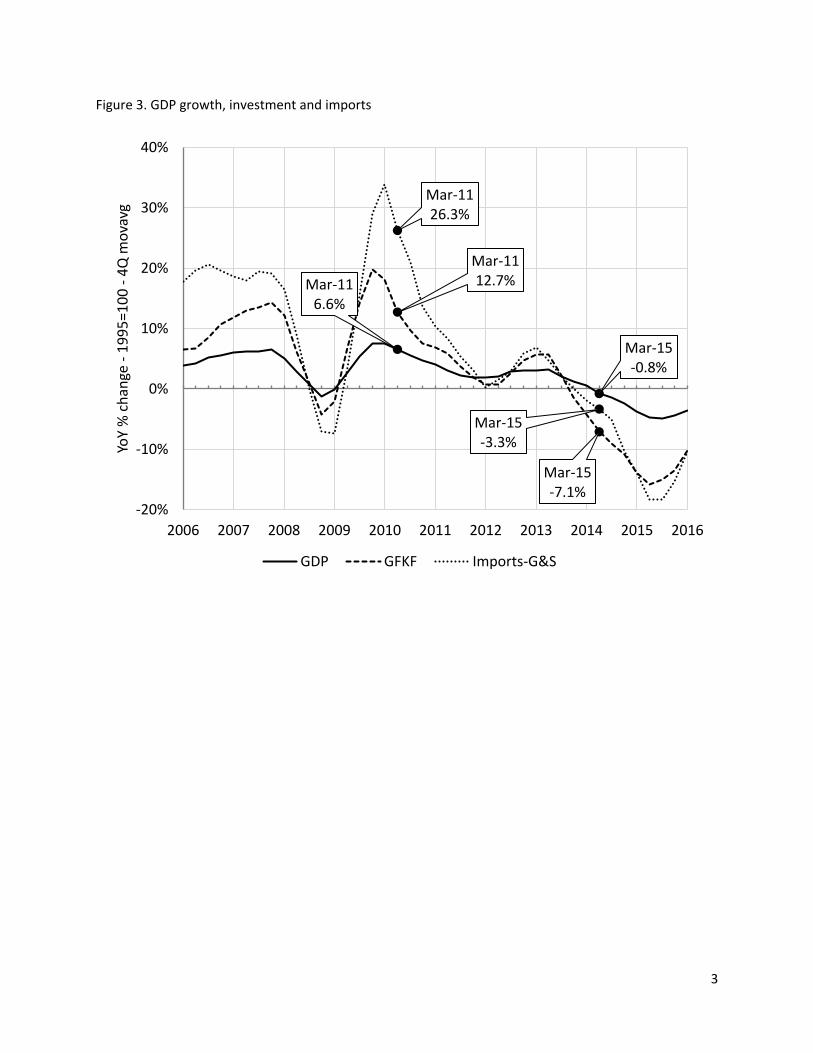
3
Figure 3. GDP growth, investment and imports
Mar-116.6%
Mar-15-0.8%
Mar-1112.7%
Mar-15-7.1%
Mar-1126.3%
Mar-15-3.3%
-20%
-10%
0%
10%
20%
30%
40%
2006 2007 2008 2009 2010 2011 2012 2013 2014 2015 2016
YoY
% c
han
ge -
19
95
=10
0 -
4Q
mo
vavg
GDP GFKF Imports-G&S
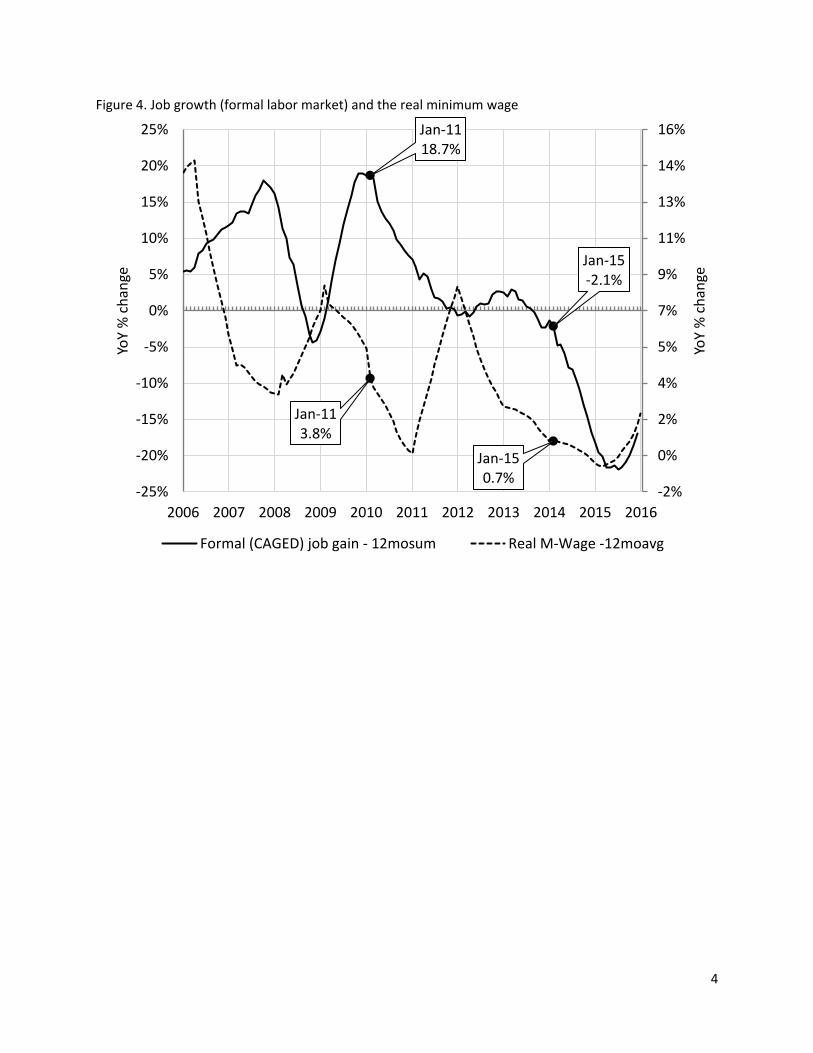
4
Figure 4. Job growth (formal labor market) and the real minimum wage
Jan-1118.7%
Jan-15-2.1%
Jan-113.8%
Jan-150.7%
-2%
0%
2%
4%
5%
7%
9%
11%
13%
14%
16%
-25%
-20%
-15%
-10%
-5%
0%
5%
10%
15%
20%
25%
2006 2007 2008 2009 2010 2011 2012 2013 2014 2015 2016
YoY
% c
han
ge
YoY
% c
han
ge
Formal (CAGED) job gain - 12mosum Real M-Wage -12moavg
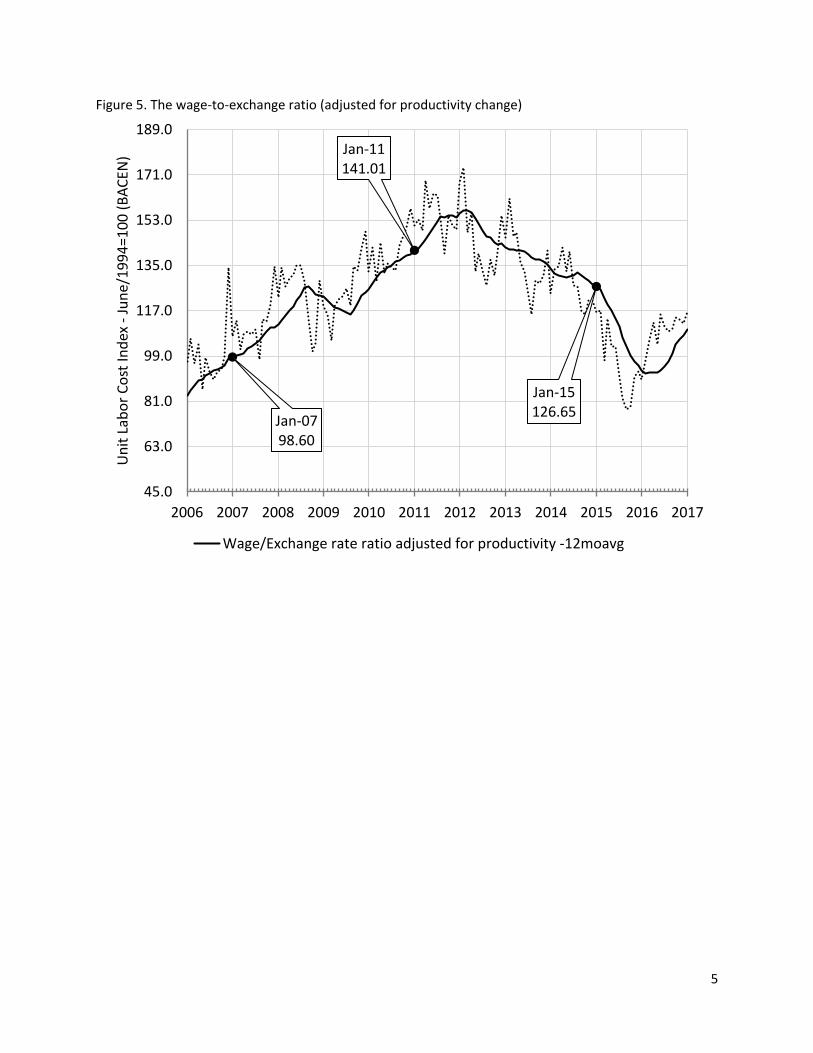
5
Figure 5. The wage-to-exchange ratio (adjusted for productivity change)
Jan-0798.60
Jan-11141.01
Jan-15126.65
45.0
63.0
81.0
99.0
117.0
135.0
153.0
171.0
189.0
2006 2007 2008 2009 2010 2011 2012 2013 2014 2015 2016 2017
Un
it L
abo
r C
ost
Ind
ex -
Jun
e/1
99
4=1
00
(B
AC
EN)
Wage/Exchange rate ratio adjusted for productivity -12moavg
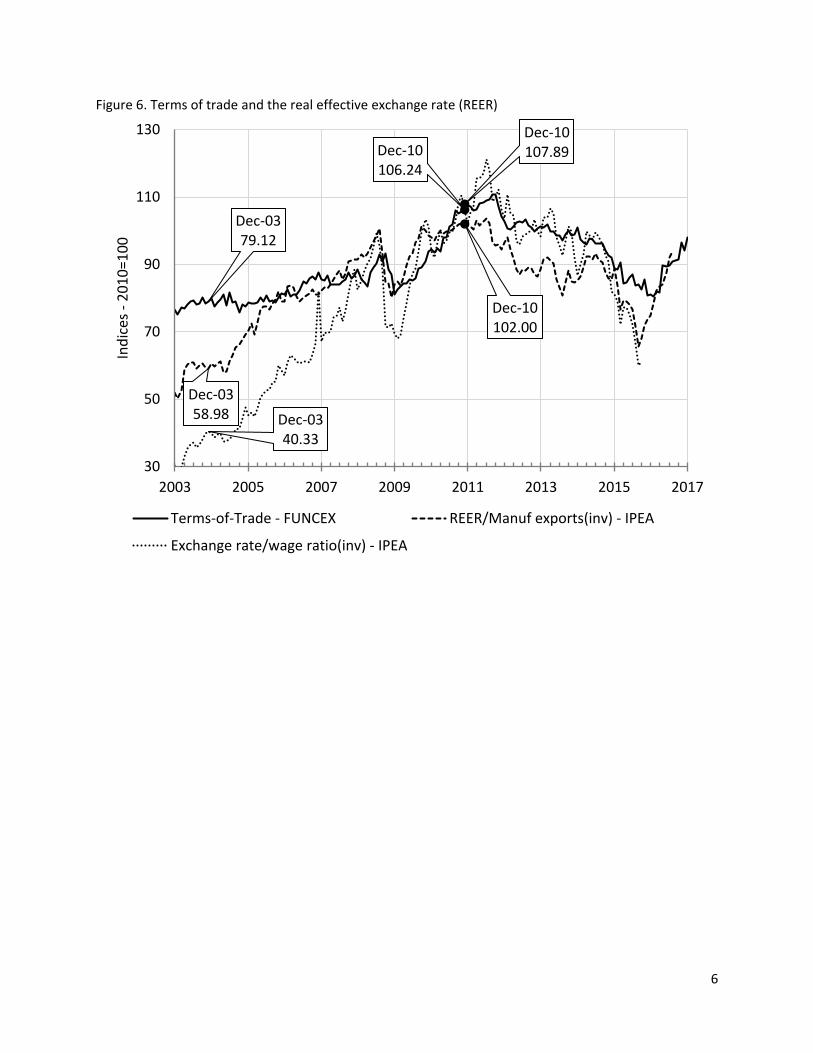
6
Figure 6. Terms of trade and the real effective exchange rate (REER)
Dec-0379.12
Dec-10107.89
Dec-0358.98
Dec-10102.00
Dec-0340.33
Dec-10106.24
30
50
70
90
110
130
2003 2005 2007 2009 2011 2013 2015 2017
Ind
ices
-2
01
0=1
00
Terms-of-Trade - FUNCEX REER/Manuf exports(inv) - IPEA
Exchange rate/wage ratio(inv) - IPEA
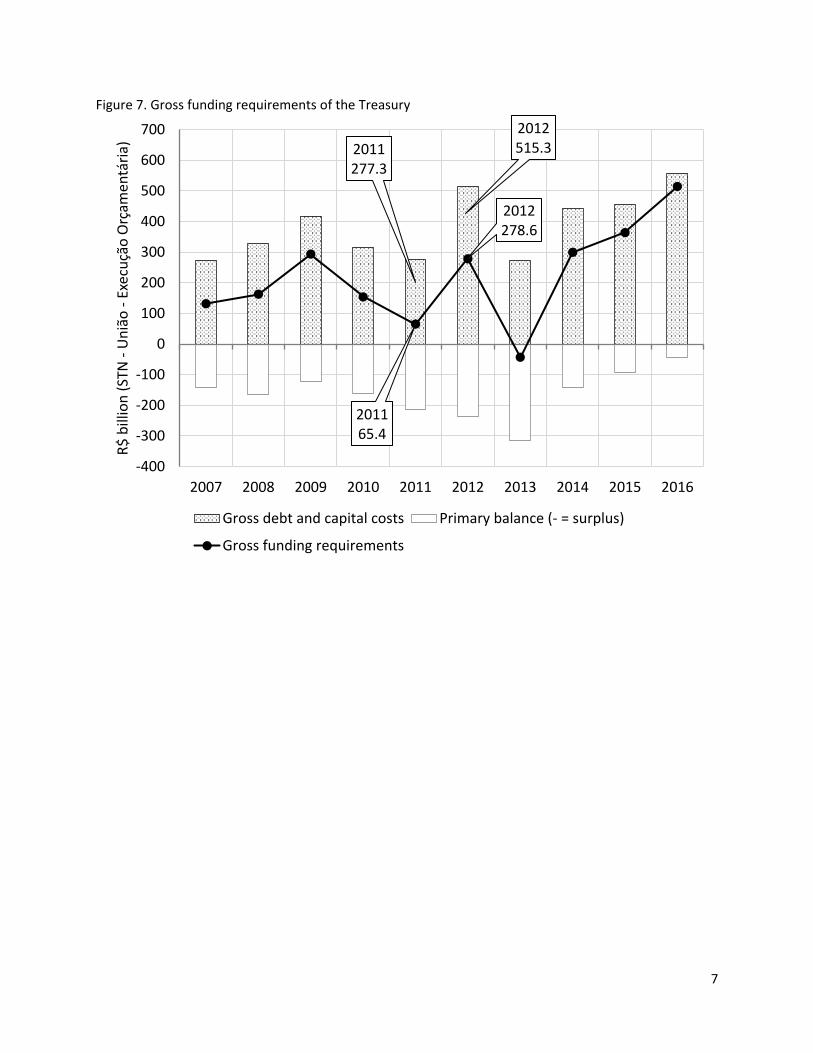
7
Figure 7. Gross funding requirements of the Treasury
2011277.3
2012515.3
201165.4
2012278.6
-400
-300
-200
-100
0
100
200
300
400
500
600
700
2007 2008 2009 2010 2011 2012 2013 2014 2015 2016
R$
bill
ion
(ST
N -
Un
ião
-Ex
ecu
ção
Orç
ame
ntá
ria)
Gross debt and capital costs Primary balance (- = surplus)
Gross funding requirements
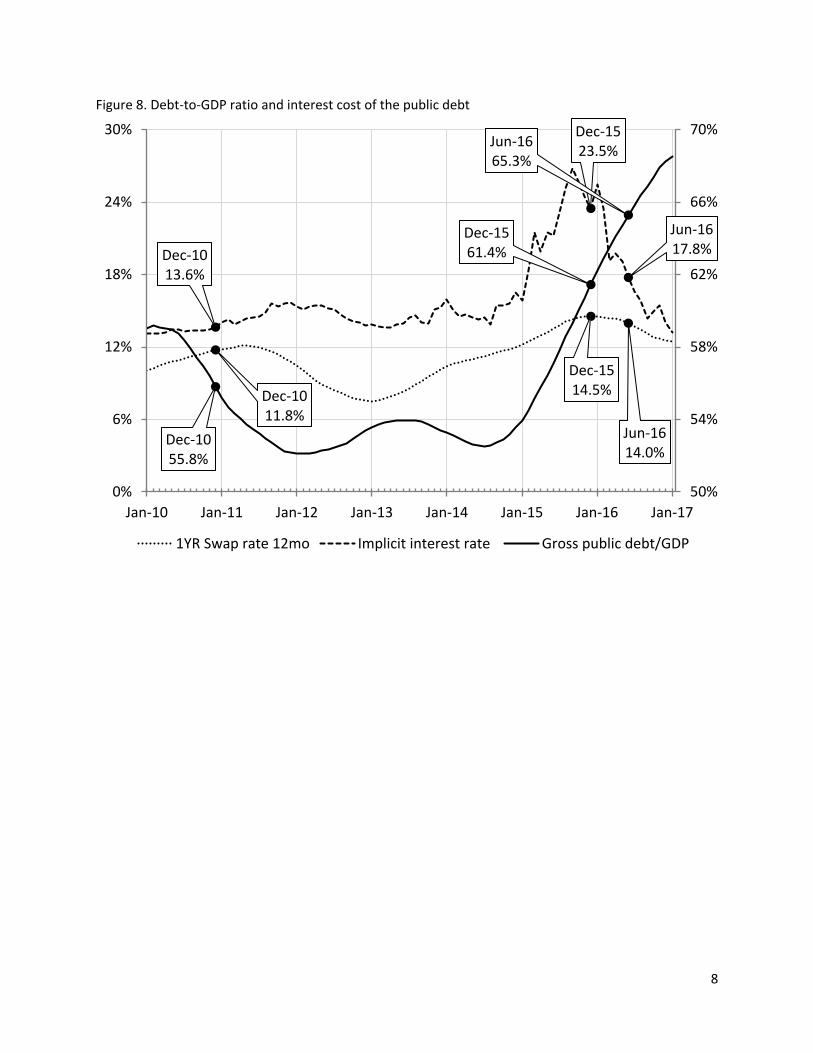
8
Figure 8. Debt-to-GDP ratio and interest cost of the public debt
Dec-1011.8%
Dec-1514.5%
Jun-1614.0%
Dec-1013.6%
Dec-1523.5%
Jun-1617.8%
Dec-1055.8%
Dec-1561.4%
Jun-1665.3%
50%
54%
58%
62%
66%
70%
Jan-10 Jan-11 Jan-12 Jan-13 Jan-14 Jan-15 Jan-16 Jan-17
0%
6%
12%
18%
24%
30%
1YR Swap rate 12mo Implicit interest rate Gross public debt/GDP
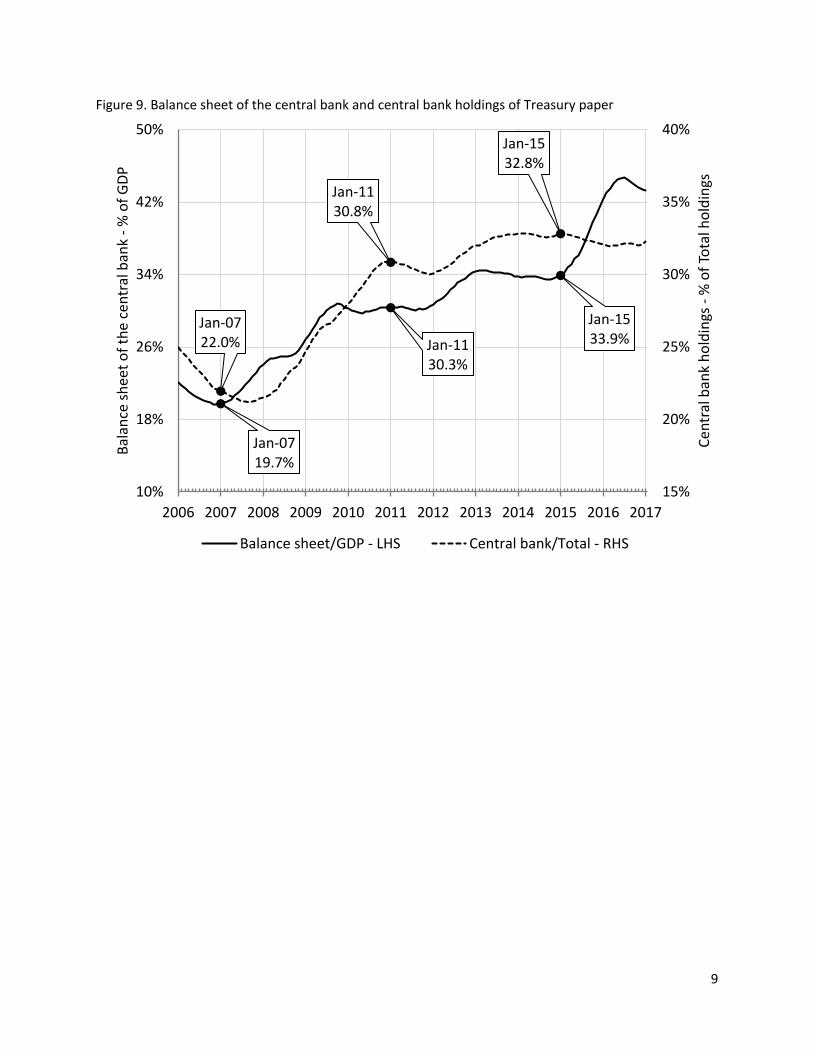
9
Figure 9. Balance sheet of the central bank and central bank holdings of Treasury paper
Jan-0719.7%
Jan-1130.3%
Jan-1533.9%
Jan-0722.0%
Jan-1130.8%
Jan-1532.8%
15%
20%
25%
30%
35%
40%
10%
18%
26%
34%
42%
50%
2006 2007 2008 2009 2010 2011 2012 2013 2014 2015 2016 2017
Ce
ntr
al b
ank
ho
ldin
gs -
% o
f To
tal h
old
ings
Bal
ance
sh
eet
of
the
cen
tral
ban
k -
% o
f G
DP
Balance sheet/GDP - LHS Central bank/Total - RHS
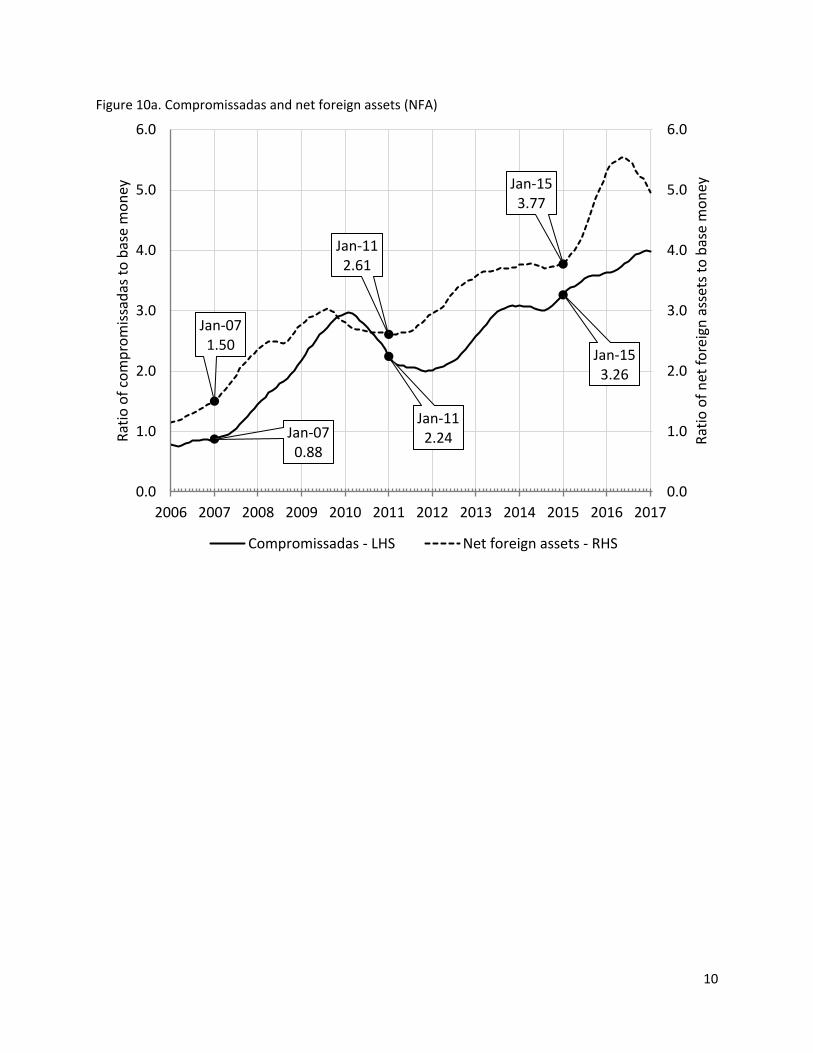
10
Figure 10a. Compromissadas and net foreign assets (NFA)
Jan-070.88
Jan-112.24
Jan-153.26
Jan-071.50
Jan-112.61
Jan-153.77
0.0
1.0
2.0
3.0
4.0
5.0
6.0
0.0
1.0
2.0
3.0
4.0
5.0
6.0
2006 2007 2008 2009 2010 2011 2012 2013 2014 2015 2016 2017
Rat
io o
f n
et f
ore
ign
ass
ets
to b
ase
mo
ney
Rat
io o
f co
mp
rom
issa
das
to
bas
e m
on
ey
Compromissadas - LHS Net foreign assets - RHS
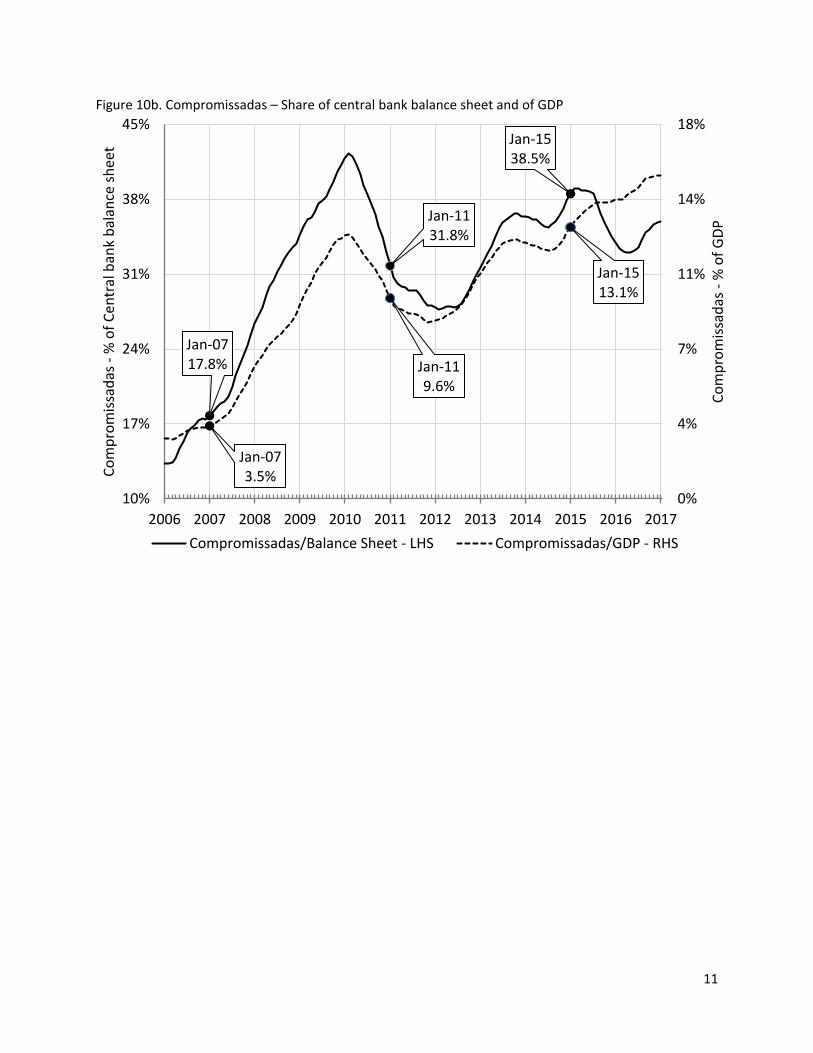
11
Figure 10b. Compromissadas – Share of central bank balance sheet and of GDP
Jan-0717.8%
Jan-1131.8%
Jan-1538.5%
Jan-073.5%
Jan-119.6%
Jan-1513.1%
0%
4%
7%
11%
14%
18%
10%
17%
24%
31%
38%
45%
2006 2007 2008 2009 2010 2011 2012 2013 2014 2015 2016 2017
Co
mp
rom
issa
das
-%
of
GD
P
Co
mp
rom
issa
das
-%
of
Ce
ntr
al b
ank
bal
ance
sh
eet
Compromissadas/Balance Sheet - LHS Compromissadas/GDP - RHS
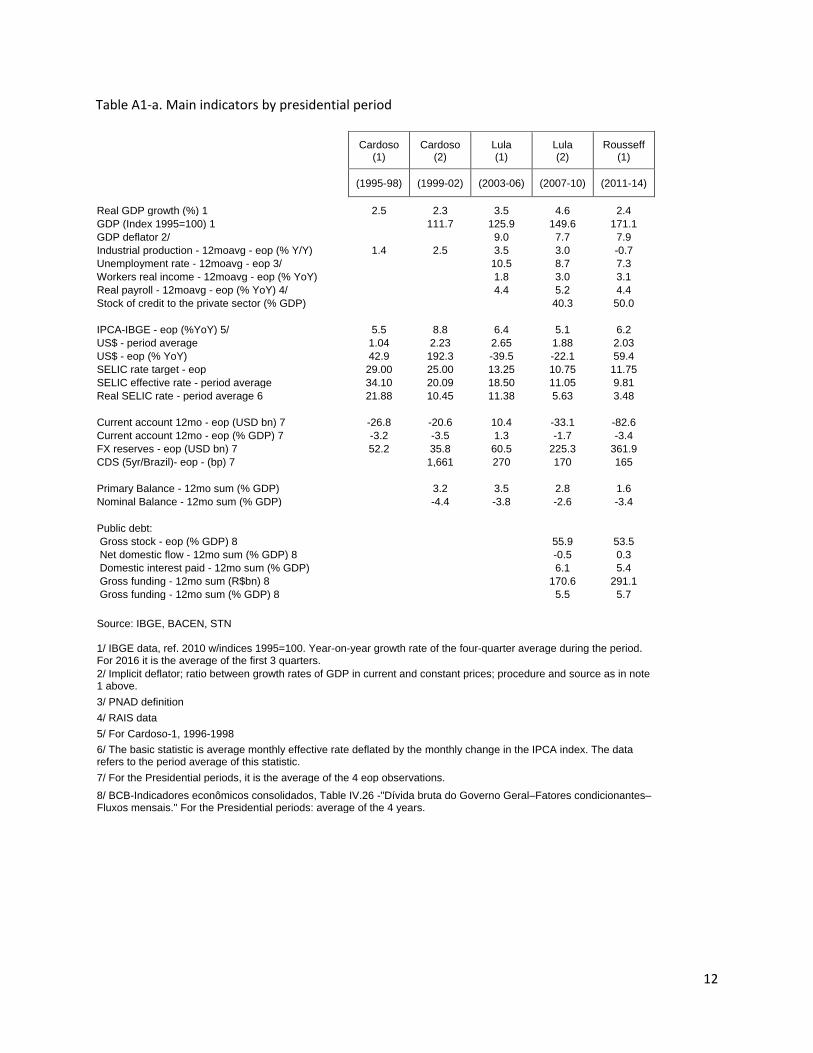
12
Table A1-a. Main indicators by presidential period
Cardoso
(1) Cardoso
(2) Lula (1)
Lula (2)
Rousseff (1)
(1995-98) (1999-02) (2003-06) (2007-10) (2011-14)
Real GDP growth (%) 1 2.5 2.3 3.5 4.6 2.4
GDP (Index 1995=100) 1 111.7 125.9 149.6 171.1
GDP deflator 2/ 9.0 7.7 7.9
Industrial production - 12moavg - eop (% Y/Y) 1.4 2.5 3.5 3.0 -0.7
Unemployment rate - 12moavg - eop 3/ 10.5 8.7 7.3
Workers real income - 12moavg - eop (% YoY) 1.8 3.0 3.1
Real payroll - 12moavg - eop (% YoY) 4/ 4.4 5.2 4.4
Stock of credit to the private sector (% GDP) 40.3 50.0
IPCA-IBGE - eop (%YoY) 5/ 5.5 8.8 6.4 5.1 6.2
US$ - period average 1.04 2.23 2.65 1.88 2.03
US$ - eop (% YoY) 42.9 192.3 -39.5 -22.1 59.4
SELIC rate target - eop 29.00 25.00 13.25 10.75 11.75
SELIC effective rate - period average 34.10 20.09 18.50 11.05 9.81
Real SELIC rate - period average 6 21.88 10.45 11.38 5.63 3.48
Current account 12mo - eop (USD bn) 7 -26.8 -20.6 10.4 -33.1 -82.6
Current account 12mo - eop (% GDP) 7 -3.2 -3.5 1.3 -1.7 -3.4
FX reserves - eop (USD bn) 7 52.2 35.8 60.5 225.3 361.9
CDS (5yr/Brazil)- eop - (bp) 7 1,661 270 170 165
Primary Balance - 12mo sum (% GDP) 3.2 3.5 2.8 1.6
Nominal Balance - 12mo sum (% GDP) -4.4 -3.8 -2.6 -3.4
Public debt:
Gross stock - eop (% GDP) 8 55.9 53.5
Net domestic flow - 12mo sum (% GDP) 8 -0.5 0.3
Domestic interest paid - 12mo sum (% GDP) 6.1 5.4
Gross funding - 12mo sum (R$bn) 8 170.6 291.1
Gross funding - 12mo sum (% GDP) 8 5.5 5.7
Source: IBGE, BACEN, STN
1/ IBGE data, ref. 2010 w/indices 1995=100. Year-on-year growth rate of the four-quarter average during the period. For 2016 it is the average of the first 3 quarters.
2/ Implicit deflator; ratio between growth rates of GDP in current and constant prices; procedure and source as in note 1 above.
3/ PNAD definition
4/ RAIS data
5/ For Cardoso-1, 1996-1998
6/ The basic statistic is average monthly effective rate deflated by the monthly change in the IPCA index. The data refers to the period average of this statistic.
7/ For the Presidential periods, it is the average of the 4 eop observations.
8/ BCB-Indicadores econômicos consolidados, Table IV.26 -"Dívida bruta do Governo Geral–Fatores condicionantes–Fluxos mensais." For the Presidential periods: average of the 4 years.
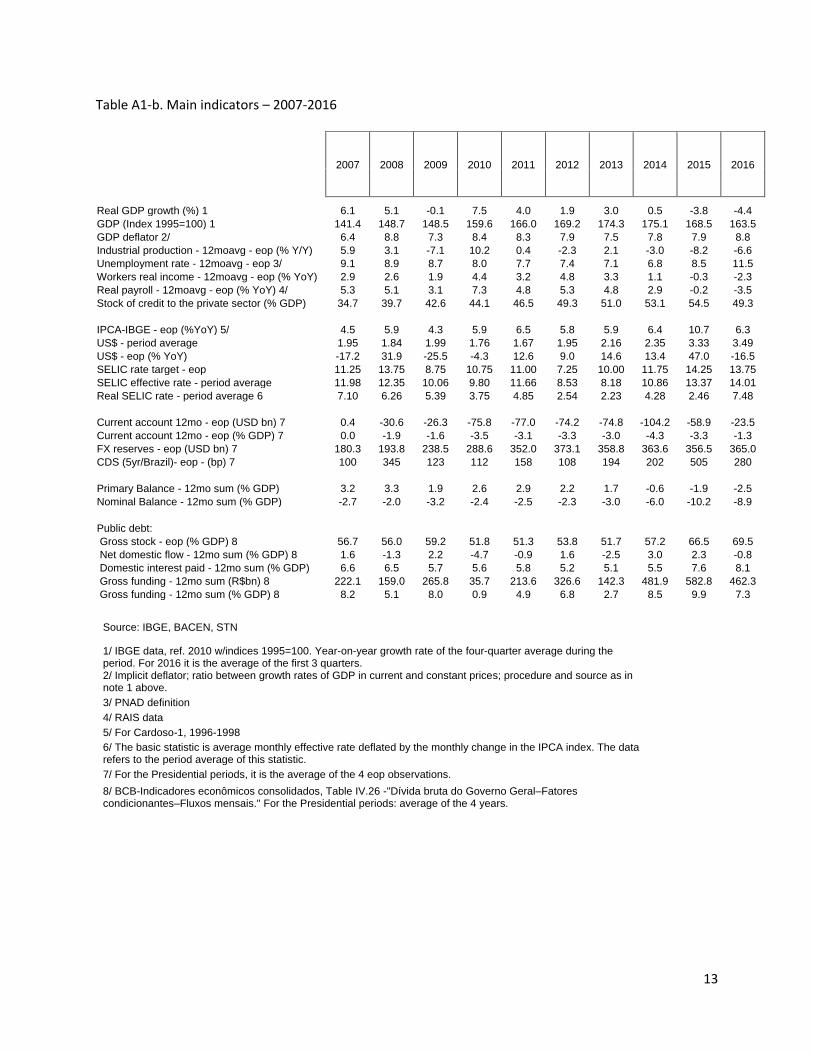
13
Table A1-b. Main indicators – 2007-2016
2007 2008 2009 2010 2011 2012 2013 2014 2015 2016
Real GDP growth (%) 1 6.1 5.1 -0.1 7.5 4.0 1.9 3.0 0.5 -3.8 -4.4
GDP (Index 1995=100) 1 141.4 148.7 148.5 159.6 166.0 169.2 174.3 175.1 168.5 163.5
GDP deflator 2/ 6.4 8.8 7.3 8.4 8.3 7.9 7.5 7.8 7.9 8.8
Industrial production - 12moavg - eop (% Y/Y) 5.9 3.1 -7.1 10.2 0.4 -2.3 2.1 -3.0 -8.2 -6.6
Unemployment rate - 12moavg - eop 3/ 9.1 8.9 8.7 8.0 7.7 7.4 7.1 6.8 8.5 11.5
Workers real income - 12moavg - eop (% YoY) 2.9 2.6 1.9 4.4 3.2 4.8 3.3 1.1 -0.3 -2.3
Real payroll - 12moavg - eop (% YoY) 4/ 5.3 5.1 3.1 7.3 4.8 5.3 4.8 2.9 -0.2 -3.5
Stock of credit to the private sector (% GDP) 34.7 39.7 42.6 44.1 46.5 49.3 51.0 53.1 54.5 49.3
IPCA-IBGE - eop (%YoY) 5/ 4.5 5.9 4.3 5.9 6.5 5.8 5.9 6.4 10.7 6.3
US$ - period average 1.95 1.84 1.99 1.76 1.67 1.95 2.16 2.35 3.33 3.49
US$ - eop (% YoY) -17.2 31.9 -25.5 -4.3 12.6 9.0 14.6 13.4 47.0 -16.5
SELIC rate target - eop 11.25 13.75 8.75 10.75 11.00 7.25 10.00 11.75 14.25 13.75
SELIC effective rate - period average 11.98 12.35 10.06 9.80 11.66 8.53 8.18 10.86 13.37 14.01
Real SELIC rate - period average 6 7.10 6.26 5.39 3.75 4.85 2.54 2.23 4.28 2.46 7.48
Current account 12mo - eop (USD bn) 7 0.4 -30.6 -26.3 -75.8 -77.0 -74.2 -74.8 -104.2 -58.9 -23.5
Current account 12mo - eop (% GDP) 7 0.0 -1.9 -1.6 -3.5 -3.1 -3.3 -3.0 -4.3 -3.3 -1.3
FX reserves - eop (USD bn) 7 180.3 193.8 238.5 288.6 352.0 373.1 358.8 363.6 356.5 365.0
CDS (5yr/Brazil)- eop - (bp) 7 100 345 123 112 158 108 194 202 505 280
Primary Balance - 12mo sum (% GDP) 3.2 3.3 1.9 2.6 2.9 2.2 1.7 -0.6 -1.9 -2.5
Nominal Balance - 12mo sum (% GDP) -2.7 -2.0 -3.2 -2.4 -2.5 -2.3 -3.0 -6.0 -10.2 -8.9
Public debt:
Gross stock - eop (% GDP) 8 56.7 56.0 59.2 51.8 51.3 53.8 51.7 57.2 66.5 69.5
Net domestic flow - 12mo sum (% GDP) 8 1.6 -1.3 2.2 -4.7 -0.9 1.6 -2.5 3.0 2.3 -0.8
Domestic interest paid - 12mo sum (% GDP) 6.6 6.5 5.7 5.6 5.8 5.2 5.1 5.5 7.6 8.1
Gross funding - 12mo sum (R$bn) 8 222.1 159.0 265.8 35.7 213.6 326.6 142.3 481.9 582.8 462.3
Gross funding - 12mo sum (% GDP) 8 8.2 5.1 8.0 0.9 4.9 6.8 2.7 8.5 9.9 7.3
Source: IBGE, BACEN, STN
1/ IBGE data, ref. 2010 w/indices 1995=100. Year-on-year growth rate of the four-quarter average during the period. For 2016 it is the average of the first 3 quarters. 2/ Implicit deflator; ratio between growth rates of GDP in current and constant prices; procedure and source as in note 1 above.
3/ PNAD definition
4/ RAIS data
5/ For Cardoso-1, 1996-1998
6/ The basic statistic is average monthly effective rate deflated by the monthly change in the IPCA index. The data refers to the period average of this statistic.
7/ For the Presidential periods, it is the average of the 4 eop observations.
8/ BCB-Indicadores econômicos consolidados, Table IV.26 -"Dívida bruta do Governo Geral–Fatores condicionantes–Fluxos mensais." For the Presidential periods: average of the 4 years.
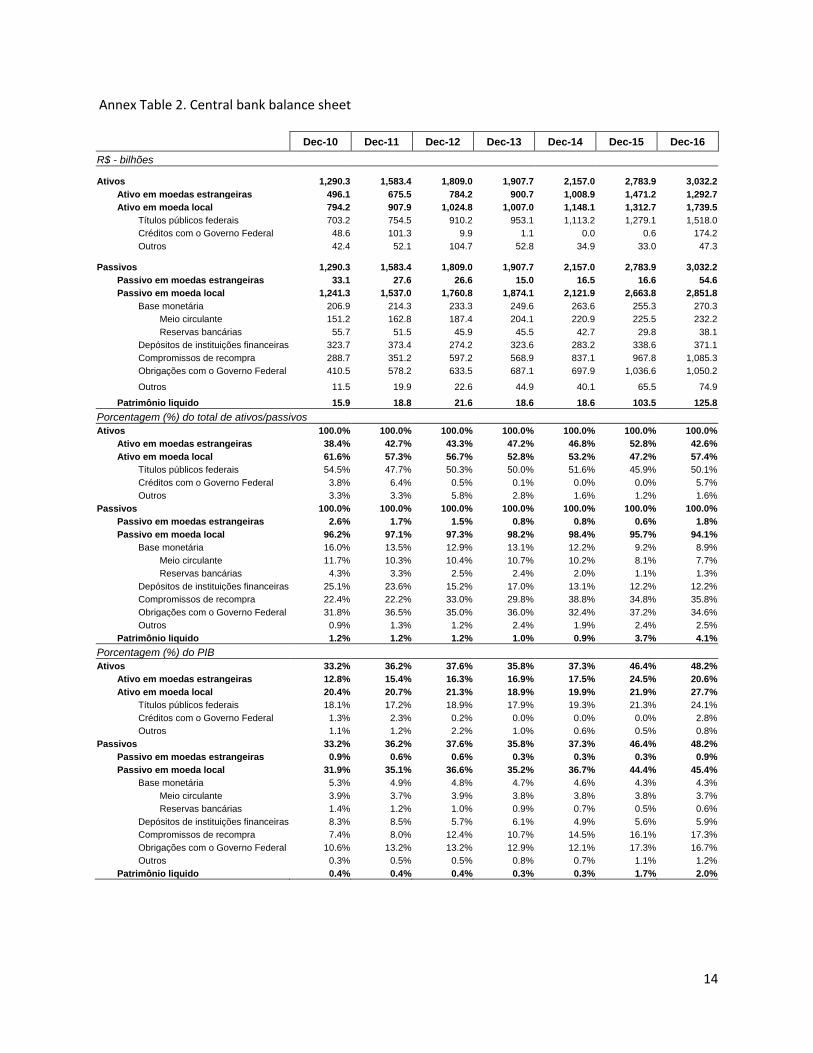
14
Annex Table 2. Central bank balance sheet
Dec-10 Dec-11 Dec-12 Dec-13 Dec-14 Dec-15 Dec-16
R$ - bilhões
Ativos 1,290.3 1,583.4 1,809.0 1,907.7 2,157.0 2,783.9 3,032.2
Ativo em moedas estrangeiras 496.1 675.5 784.2 900.7 1,008.9 1,471.2 1,292.7
Ativo em moeda local 794.2 907.9 1,024.8 1,007.0 1,148.1 1,312.7 1,739.5
Títulos públicos federais 703.2 754.5 910.2 953.1 1,113.2 1,279.1 1,518.0
Créditos com o Governo Federal 48.6 101.3 9.9 1.1 0.0 0.6 174.2
Outros 42.4 52.1 104.7 52.8 34.9 33.0 47.3
Passivos 1,290.3 1,583.4 1,809.0 1,907.7 2,157.0 2,783.9 3,032.2
Passivo em moedas estrangeiras 33.1 27.6 26.6 15.0 16.5 16.6 54.6
Passivo em moeda local 1,241.3 1,537.0 1,760.8 1,874.1 2,121.9 2,663.8 2,851.8
Base monetária 206.9 214.3 233.3 249.6 263.6 255.3 270.3
Meio circulante 151.2 162.8 187.4 204.1 220.9 225.5 232.2
Reservas bancárias 55.7 51.5 45.9 45.5 42.7 29.8 38.1
Depósitos de instituições financeiras 323.7 373.4 274.2 323.6 283.2 338.6 371.1
Compromissos de recompra 288.7 351.2 597.2 568.9 837.1 967.8 1,085.3
Obrigações com o Governo Federal 410.5 578.2 633.5 687.1 697.9 1,036.6 1,050.2
Outros 11.5 19.9 22.6 44.9 40.1 65.5 74.9
Patrimônio liquido 15.9 18.8 21.6 18.6 18.6 103.5 125.8
Porcentagem (%) do total de ativos/passivos
Ativos 100.0% 100.0% 100.0% 100.0% 100.0% 100.0% 100.0%
Ativo em moedas estrangeiras 38.4% 42.7% 43.3% 47.2% 46.8% 52.8% 42.6%
Ativo em moeda local 61.6% 57.3% 56.7% 52.8% 53.2% 47.2% 57.4%
Títulos públicos federais 54.5% 47.7% 50.3% 50.0% 51.6% 45.9% 50.1%
Créditos com o Governo Federal 3.8% 6.4% 0.5% 0.1% 0.0% 0.0% 5.7%
Outros 3.3% 3.3% 5.8% 2.8% 1.6% 1.2% 1.6%
Passivos 100.0% 100.0% 100.0% 100.0% 100.0% 100.0% 100.0%
Passivo em moedas estrangeiras 2.6% 1.7% 1.5% 0.8% 0.8% 0.6% 1.8%
Passivo em moeda local 96.2% 97.1% 97.3% 98.2% 98.4% 95.7% 94.1%
Base monetária 16.0% 13.5% 12.9% 13.1% 12.2% 9.2% 8.9%
Meio circulante 11.7% 10.3% 10.4% 10.7% 10.2% 8.1% 7.7%
Reservas bancárias 4.3% 3.3% 2.5% 2.4% 2.0% 1.1% 1.3%
Depósitos de instituições financeiras 25.1% 23.6% 15.2% 17.0% 13.1% 12.2% 12.2%
Compromissos de recompra 22.4% 22.2% 33.0% 29.8% 38.8% 34.8% 35.8%
Obrigações com o Governo Federal 31.8% 36.5% 35.0% 36.0% 32.4% 37.2% 34.6%
Outros 0.9% 1.3% 1.2% 2.4% 1.9% 2.4% 2.5%
Patrimônio liquido 1.2% 1.2% 1.2% 1.0% 0.9% 3.7% 4.1%
Porcentagem (%) do PIB
Ativos 33.2% 36.2% 37.6% 35.8% 37.3% 46.4% 48.2%
Ativo em moedas estrangeiras 12.8% 15.4% 16.3% 16.9% 17.5% 24.5% 20.6%
Ativo em moeda local 20.4% 20.7% 21.3% 18.9% 19.9% 21.9% 27.7%
Títulos públicos federais 18.1% 17.2% 18.9% 17.9% 19.3% 21.3% 24.1%
Créditos com o Governo Federal 1.3% 2.3% 0.2% 0.0% 0.0% 0.0% 2.8%
Outros 1.1% 1.2% 2.2% 1.0% 0.6% 0.5% 0.8%
Passivos 33.2% 36.2% 37.6% 35.8% 37.3% 46.4% 48.2%
Passivo em moedas estrangeiras 0.9% 0.6% 0.6% 0.3% 0.3% 0.3% 0.9%
Passivo em moeda local 31.9% 35.1% 36.6% 35.2% 36.7% 44.4% 45.4%
Base monetária 5.3% 4.9% 4.8% 4.7% 4.6% 4.3% 4.3%
Meio circulante 3.9% 3.7% 3.9% 3.8% 3.8% 3.8% 3.7%
Reservas bancárias 1.4% 1.2% 1.0% 0.9% 0.7% 0.5% 0.6%
Depósitos de instituições financeiras 8.3% 8.5% 5.7% 6.1% 4.9% 5.6% 5.9%
Compromissos de recompra 7.4% 8.0% 12.4% 10.7% 14.5% 16.1% 17.3%
Obrigações com o Governo Federal 10.6% 13.2% 13.2% 12.9% 12.1% 17.3% 16.7%
Outros 0.3% 0.5% 0.5% 0.8% 0.7% 1.1% 1.2%
Patrimônio liquido 0.4% 0.4% 0.4% 0.3% 0.3% 1.7% 2.0%