Embed Size (px)
Citation preview

1
The New Danone
Groupe DANONE
Premium Review Conference December 6th, 2007

2
•Danone’s Profitable Growth Model
•Vision for the New Danone
•Baby Food Business
•Danone Business Results and New Profile
OVERVIEW
3
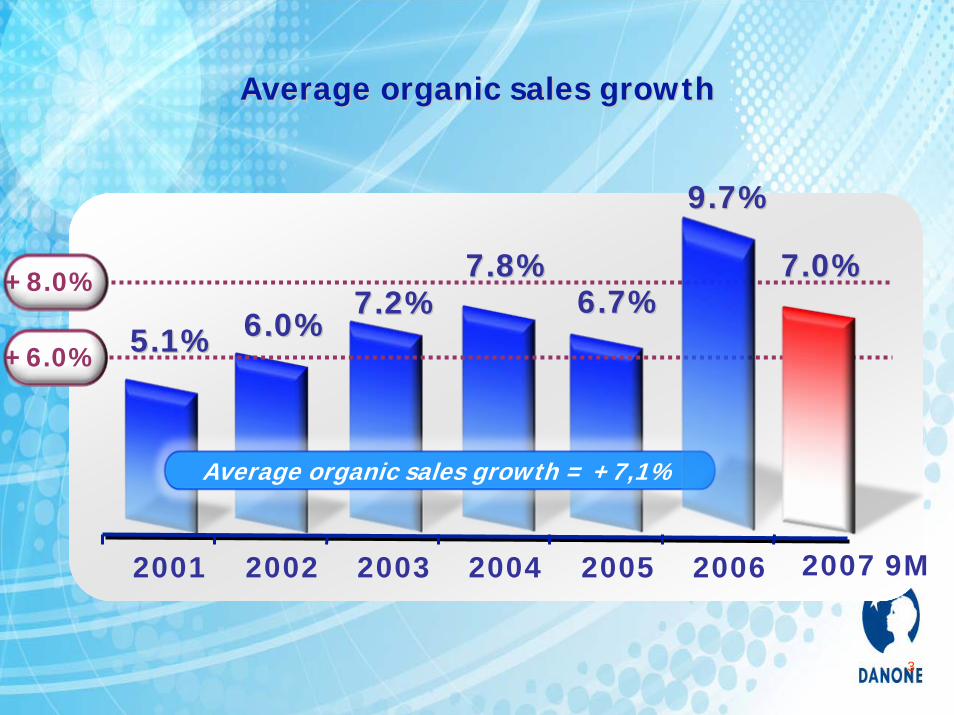
9.7%9.7%
6.7%6.7%7.8%7.8%
7.2%7.2%6.0%6.0%5.1%5.1%
2001 2002 2003 2004 2005 2006
AverageAverage organicorganic sales sales growthgrowth
+6.0%
+8.0%
Average organic sales growth = +7,1%
2007 9M
7.0%7.0%

4
2000
10.8%
2001
11.1%
2002
11.7%
2003
12.2%12.4%
13.35%
20052004IFRS
13.10%
2004
13.6%
2006 2007 H1
14.0%
AverageAverage operating operating marginmargin

5
Source: EuromonitorSource: Euromonitor
World Market CAGR 06-11 (volume) World Market CAGR 06-11 (volume)
0% 1% 2% 3% 4% 6%
0.9%1.9%
2.4%2.8%2.8%
3.0%3.2%
3.7%4.0%
4.4%4.6%
5.3%6.4%
6.6%
SoupSoupCarbonatesCarbonatesRTE cerealsRTE cereals
ConfectioneryConfectioneryCheeseCheese
Frozen processed foodFrozen processed foodSauces, dressings & condtsSauces, dressings & condts
Ice creamIce creamSweet biscuitsSweet biscuits
YogurtYogurtSavoury biscuits & crackersSavoury biscuits & crackers
Baby foodBaby foodFunctional drinksFunctional drinksStill bottled waterStill bottled water
5%
We play in the most attractive food segments

6
0
5
10
15
20
25
30
35
40
Nether
lands
Switz
erlan
dFr
ance
German
ySp
ainBe
lgium
Austri
aFin
land
Denmar
kS. A
rabia
Portug
alCZ R
ep.
Swed
enNor
wayBulga
riaArge
ntina
Irelan
d UKSlo
vakia
Hunga
ryJa
pan
Israe
lRu
ssia
Turk
eyAlge
riaAus
tralia
Poland
Greece
New Ze
aland
Tunis
iaS.
Korea
Canad
aChil
eMex
icoTaiw
an Italy
Ukrain
eBraz
ilRo
mania
South
Afri
ca USAHon
g Kong
Thail
and
Moroc
coCo
lombia
Singa
pore
Egypt
Vene
zuela
Malays
iaPhil
ippine
sChin
aViet
nam
Indon
esia
1 cup a day
1 cup every 2 days
1 cup a week
1 cup a month
Fresh Dairy Products Per Capita consumptionFrom 1 cup a month to 1 cup a day
Source: Euromonitor

7800 M€ 1000 M€ 1300 M€ 900 M€
GrowthGrowth TransitDigestion
TransitDigestion
WeightManagement
WeightManagementProtectionProtection
Our Fresh Dairy Blockbusters

8
2007200720002000Yogurt OnlyYogurt Only Yogurt, fermented milk and other
relevant supportsYogurt, fermented milk and other
relevant supports
The Activia Example: one health benefit, many extensions

9
Beauty ? ?Cardio
Preparing tomorrow’s Diamonds
7 countries 5 countries

10

11
Health = Survival
Health = No disease
Health = Well ageing
Source : Human Mortality Database, INSEE
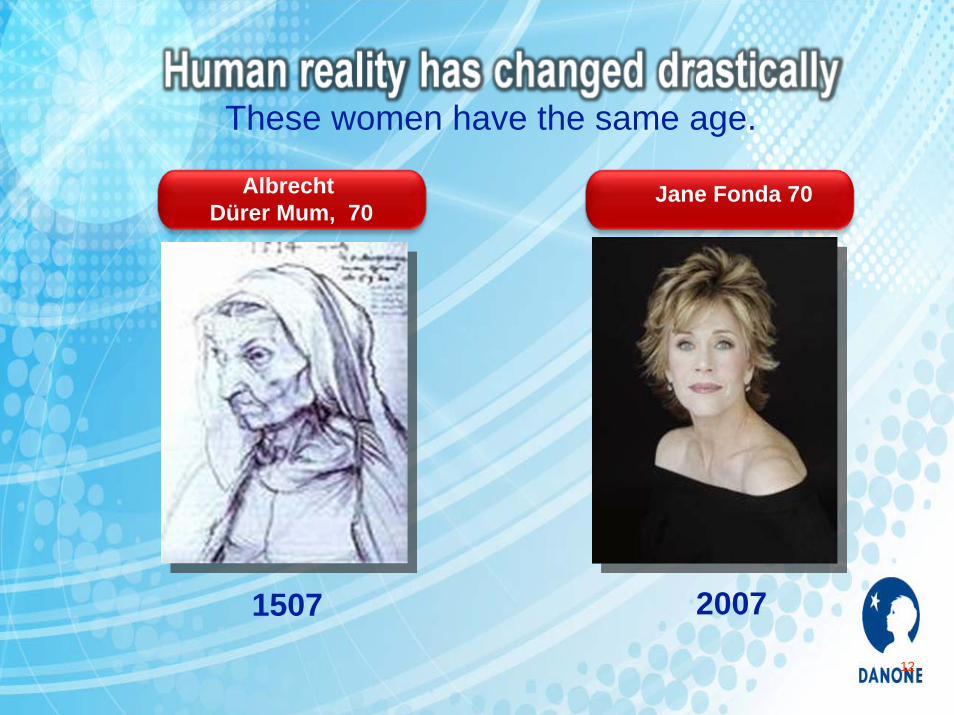
12
1507 2007
Albrecht Dürer Mum, 70
Jane Fonda 70
These women have the same age.

13
PreventionPrevention
FoodFood
CureCure
DrugsDrugs

14
Life stage
Spec
ific
nutr
ition
/ hea
th n
eeds
Babies/ Toddlers
Teenagers - Adulthood Elderly / pathology
Low
High
Clinical NutritionClinical
NutritionActive health
Food and drinks
Active health Food and
drinks Baby FoodBaby Food
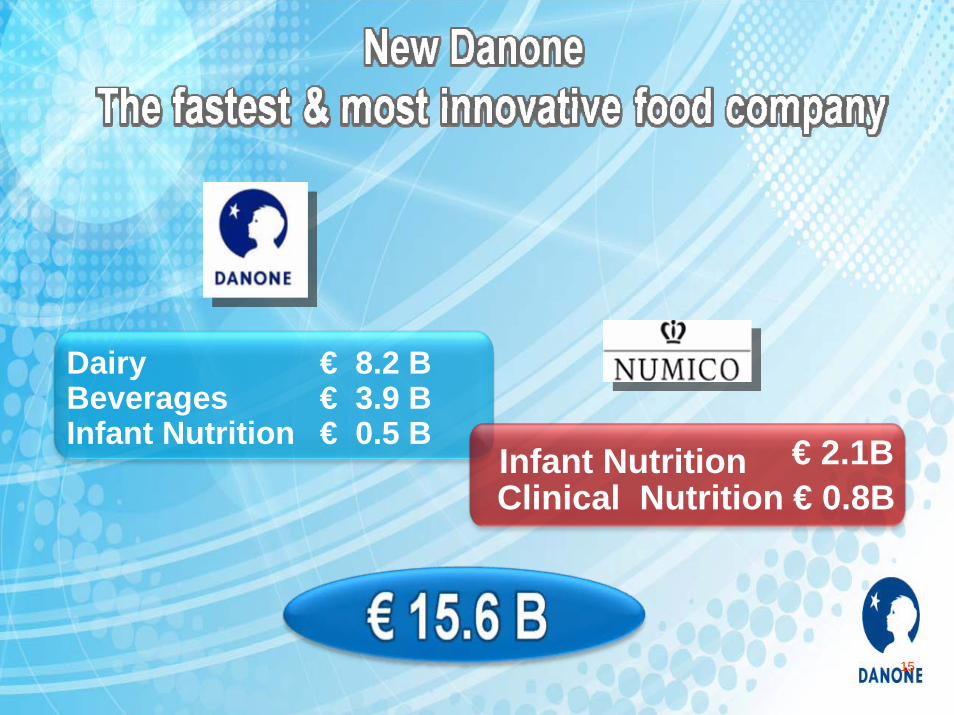
15
Beverages
Infant Nutrition € 2.1BClinical Nutrition € 0.8B
Dairy
Infant Nutrition € 3.9 B€ 8.2 B
€ 0.5 B
16
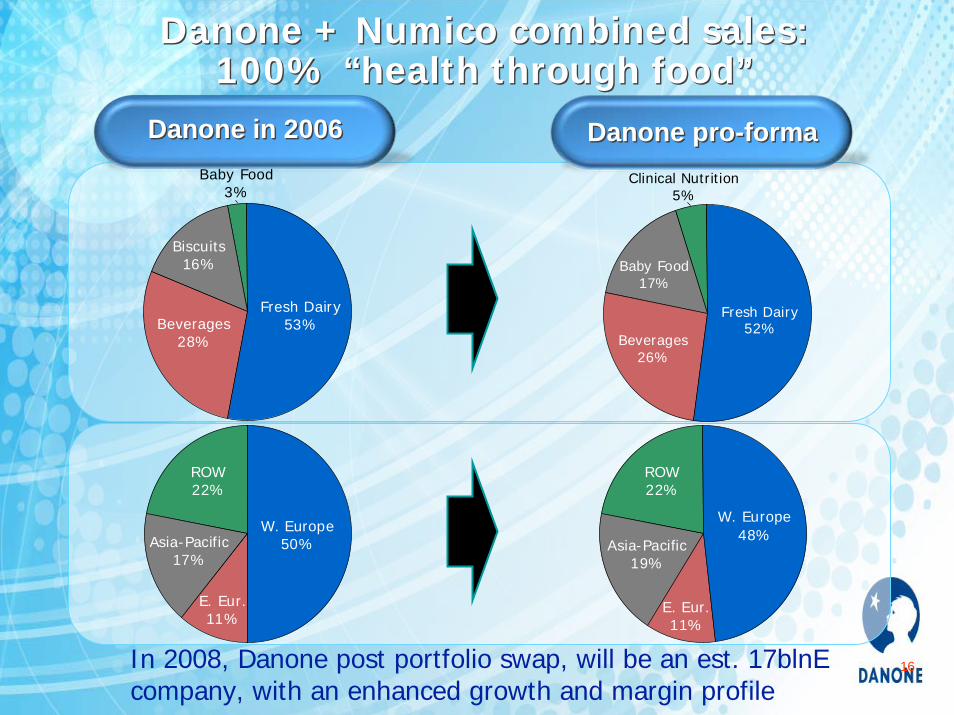
Baby Food3%
Biscuits16%
Beverages28%
Fresh Dairy53%
Clinical Nutrition5%
Baby Food17%
Beverages26%
Fresh Dairy52%
ROW22%
Asia-Pacific17%
E. Eur.11%
W. Europe50%
ROW22%
Asia-Pacific19%
E. Eur.11%
W. Europe48%
Danone in 2006 Danone in 2006 Danone pro-formaDanone pro-forma
In 2008, Danone post portfolio swap, will be an est. 17blnE company, with an enhanced growth and margin profile
Danone + Numico combined sales: 100% “health through food”
Danone + Numico combined sales: 100% “health through food”

17

18
06-11 growth
6% 2% 4% 7% 6% 3%
Bottled water Sauces,dressings, condiments
Fresh Dairy Functional drinks Baby Food Pasta
Market sizes (€B)
Note: Clinical Nutrition includes oral, tube and devices. Manufacturers’ sales valueSource: Euromonitor, external sources

19
Source: Euromonitor, internal data, Baby Food players public information
Australasia
2006
€18B
0
20
40
60
80
100%
Baby Food market
BabyFoodmarket
Blédina
BabyFoodmarket
Numico
France UK
2%
6%
2%
10%+
2006 Baby Food growth
AME
Especially in Asia and Eastern Europe…
Especially in Asia and Eastern Europe…
… With potential also in developed countries
… With potential also in developed countries

20
High profitability High profitability High entry barriersHigh entry barriers
Milk & Foodplayers
Milk players
Baby Food playermargin (%)
Source: Baby Food public information, brokers, Nielsen
2%Baby Food
Alcoholicbeverages
Confectionnery
Non alcoholicbeverages
Yogurt
Shelfstable food
Pet food
Frozen food
2%6%
9%12%
15%19%
21%25%
0 5 10 15 20 25 30%WW Private Labels market share
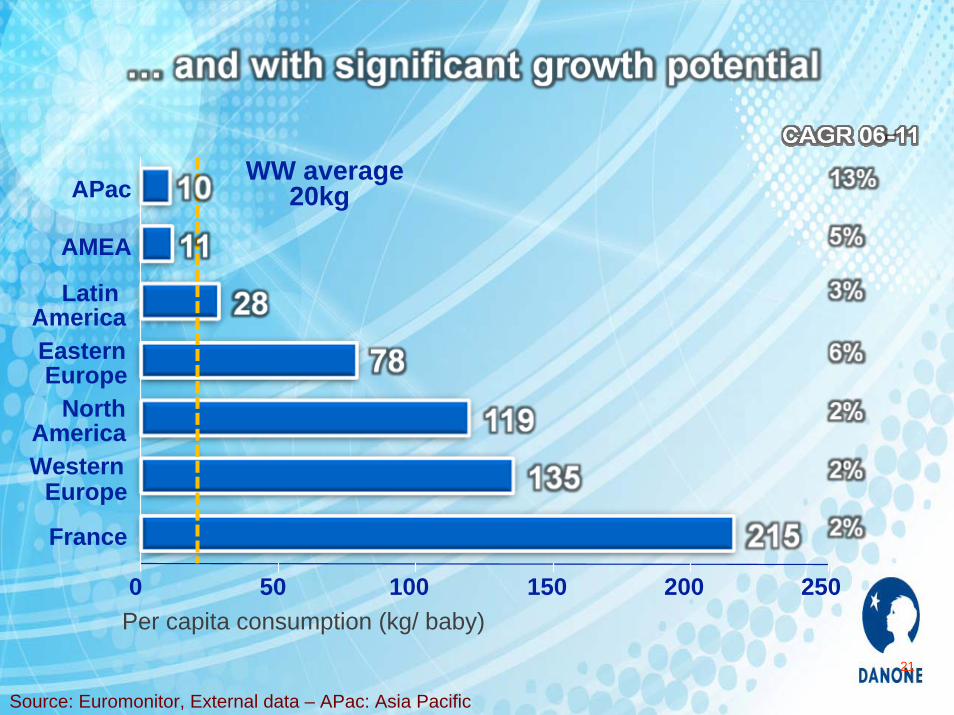
21
WW average20kg
France
WesternEurope
NorthAmerica
EasternEurope
Latin America
AMEA
APac
0 50 100 150 200 250Per capita consumption (kg/ baby)
Source: Euromonitor, External data – APac: Asia Pacific

22
Source consumption book RI Sept 2003
BBF
NS
Homemade food
Breastfeeding
45
42
10
9
82
9
16-36 months
3
6-15 months
Sha
reof
sto
mac
h(1
00%
)
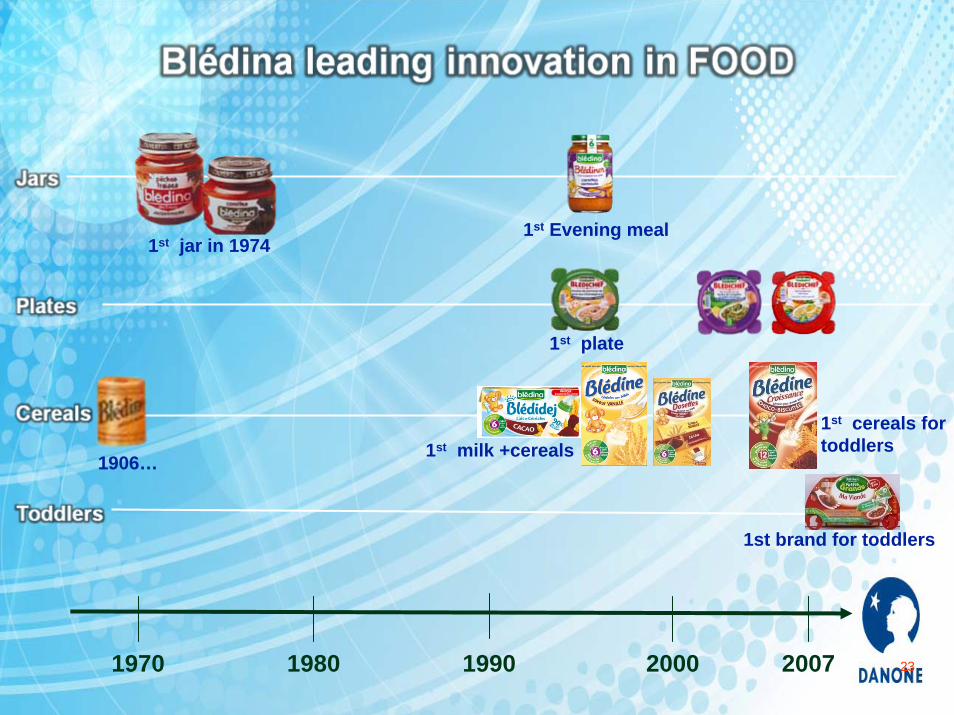
231970 1990 2000 20071980
1st Evening meal1st jar in 1974
1st plate
1st brand for toddlers
1906… 1st milk +cereals1st cereals for toddlers
24
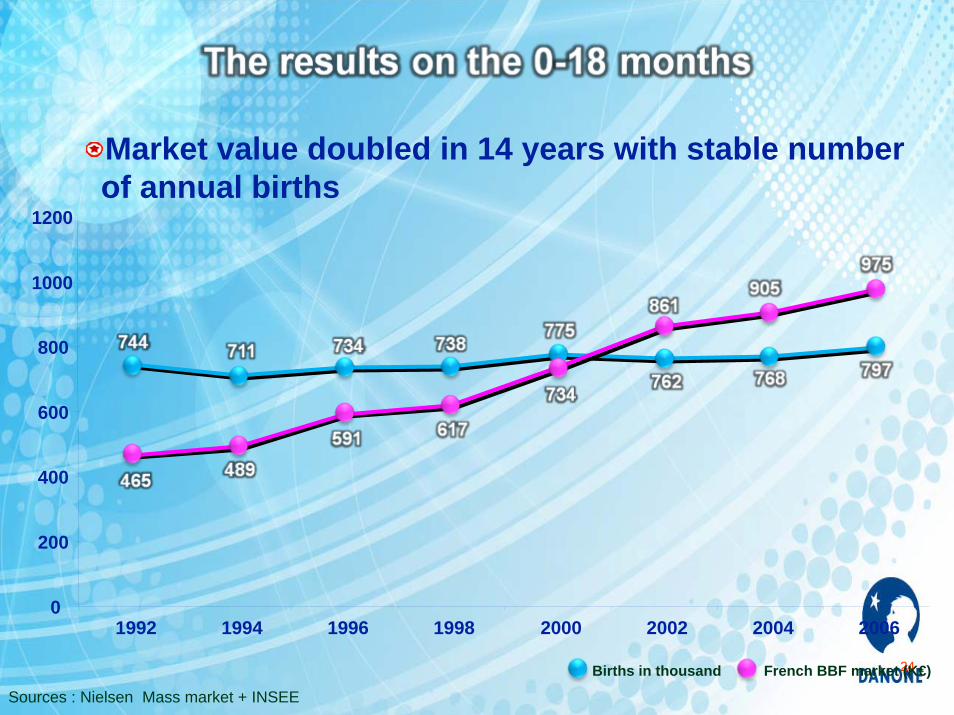
0
200
400
600
800
1000
1200
1992 1994 1996 1998 2000 2002 2004 2006
Sources : Nielsen Mass market + INSEE
Births in thousand French BBF market (K€)
Market value doubled in 14 years with stable number of annual births

25
Market share (val) - 100% AIE+UHT BB + toddlers
+6.4 +7.7 +10.1 +10.6 +13.2 +16.6 +18.3Deltain pt
B vs N+13.4
2002 2003 2004 2005 2006 éch 2006 census YTD 07 P9/07
Nielsen P9/07

26
W. EuropeW. Europe E. EuropeE. Europe AsiaAsia Africa Middle East
Africa Middle East
Numico + Blédina Baby Food positionsNumico + Blédina Baby Food positions

27

28
The Americas are a growth engine
- Very good success at Dannon US thanks to Blockbusters
- Latam on track with our ambitious objectives
Eastern Europe will have an outstanding year
Return to growth in mature home markets (including France) is confirmed (excluding weather impact)
And this despite loss of co-packed sales at Wahaha
29
Continued product mix improvement
Successful offsetting of input cost headwinds through selective price increases
Stepped-up productivities programs
Operational leverage on fixed costs and overheads
While continuously fuelling brand equity through increased A&P

30
Top Line
EBIT Margin Danone margin will be positively impacted by:
The 2007 portfolio swap between a low-growth mature business and a leading playerin nutrition, posting the highest growth in the industry, will increase our new growth profile
The continuous margin improvement of currentactivities
Favorable activity mix within Numico portfolio (Nutrition growing faster than Baby Food)
Group Mix: Numico more profitable thanDanone