Embed Size (px)
Citation preview
Autumn Conference 2008 Autumn Conference 2008 CA CA CheuvreuxCheuvreux
September 26th, 2008
The “New Danone”: A unique food company
2
This document contains certain forward-looking statements concerning Groupe DANONE. Although Groupe DANONE believes its expectations are based on reasonable assumptions, these forward-looking statements are subject to numerous risks and uncertainties, which could cause actual results to differ materially from those anticipated in these forward-looking statements. For a detailed description of these risks and uncertainties, please refer to the sections “Risks Factors” in Groupe DANONE’s Annual Report (which is available on www.danone.com). Groupe DANONE undertakes no obligation to publicly update or revise any of these forward-looking statements. This document does not constitute an offer to sell, or a solicitation of an offer to buy, Danone shares
Disclaimer
3
To bring health through To bring health through food to the largest number food to the largest number
of peopleof people
A powerful mission for sustainable, profitable long-term growth
4
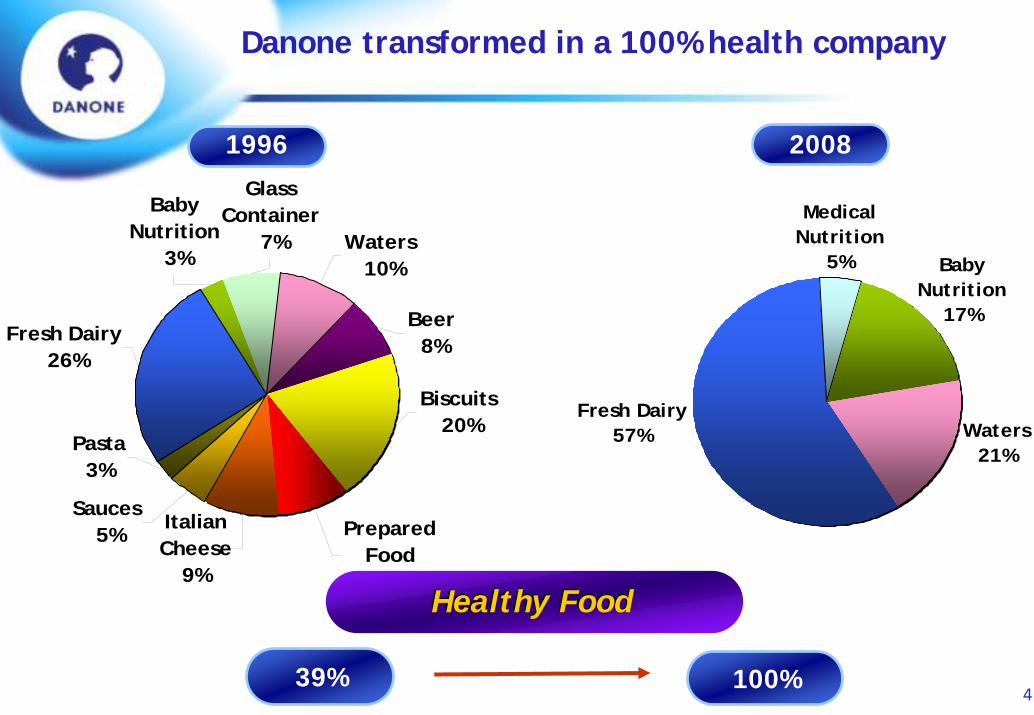
1996 2008
Fresh Dairy 26%
Prepared Food 9%
Biscuits 20%
Beer 8%
Waters 10%
Glass Container
7%
Baby Nutrition
3%
Italian Cheese
9%
Pasta3%
Sauces 5%
Danone transformed in a 100% health company
Waters21%
Fresh Dairy 57%
Medical Nutrition
5% Baby Nutrition
17%
Healthy FoodHealthy Food
39% 100%
5
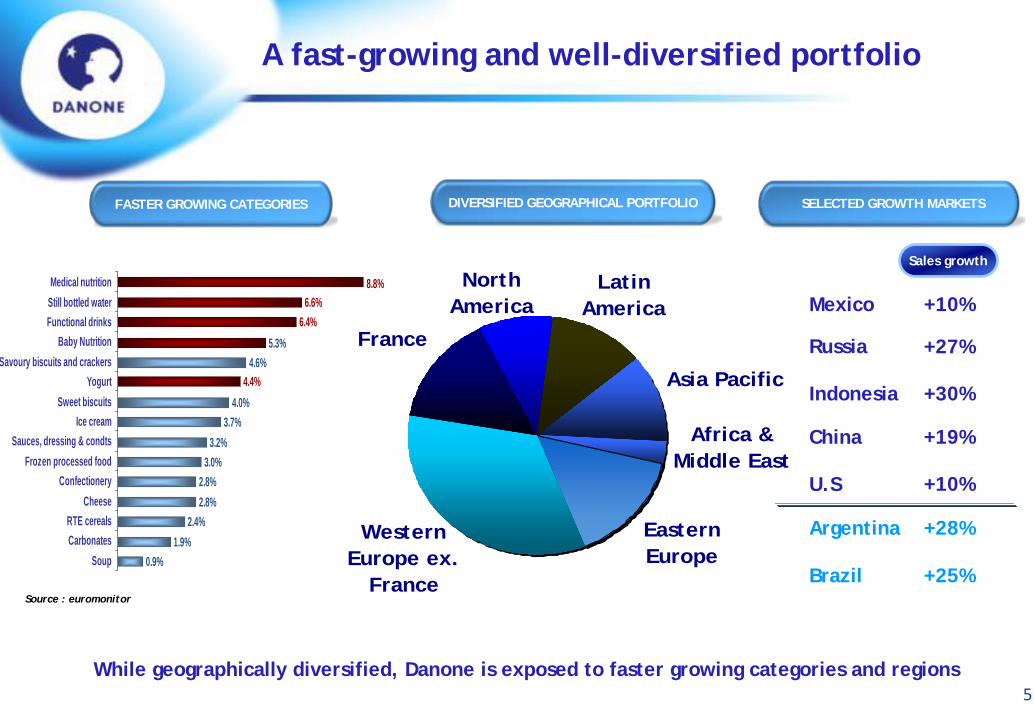
A fast-growing and well-diversified portfolio
FASTER GROWING CATEGORIES DIVERSIFIED GEOGRAPHICAL PORTFOLIO
While geographically diversified, Danone is exposed to faster growing categories and regions
Source : euromonitor
SELECTED GROWTH MARKETS
Sales growth
+10%
+27%
+30%
+19%
+10%U.S
China
Indonesia
Russia
Mexico
+28%
+25%Brazil
Argentina
0.9%1.9%
2.4%2.8%2.8%
3.0%3.2%
3.7%4.0%
4.6%5.3%
4.4%
6.4%6.6%
8.8%
SoupCarbonatesRTE cereals
CheeseConfectionery
Frozen processed foodSauces, dressing & condts
Ice creamSweet biscuits
YogurtSavoury biscuits and crackers
Baby NutritionFunctional drinksStill bottled waterMedical nutrition North
America
France
Western Europe ex.
France
Eastern Europe
Africa & Middle East
Asia Pacific
Latin America
6
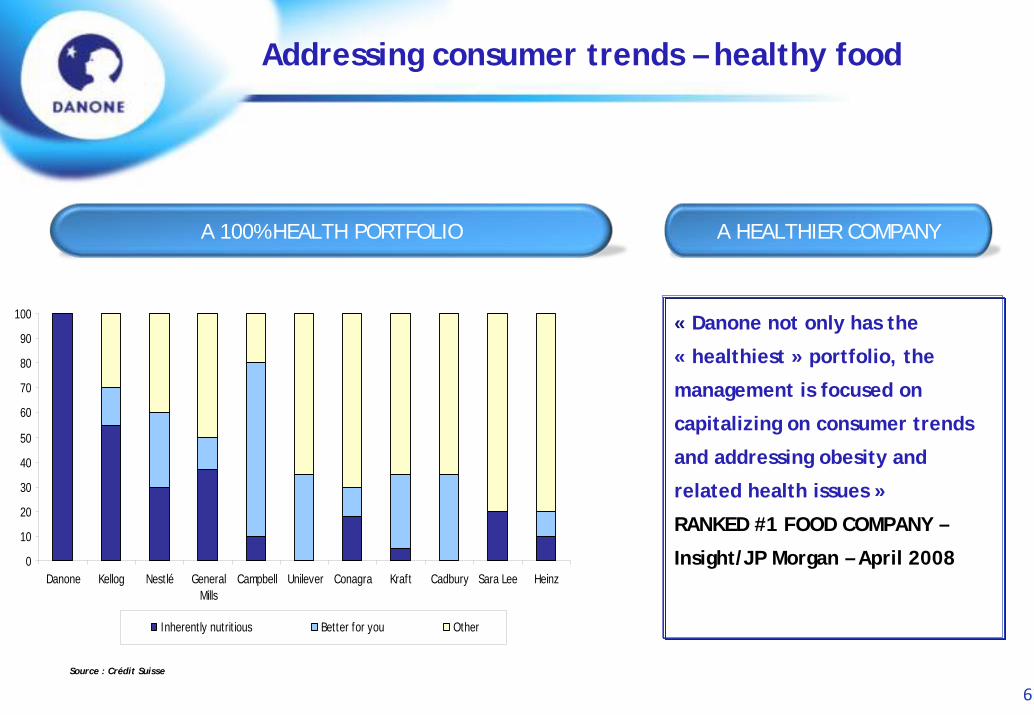
Addressing consumer trends – healthy food
0
10
20
30
40
50
60
70
80
90
100
Danone Kellog Nestlé GeneralMills
Campbell Unilever Conagra Kraft Cadbury Sara Lee Heinz
Inherently nutritious Better for you Other
A 100% HEALTH PORTFOLIO
« Danone not only has the
« healthiest » portfolio, the
management is focused on
capitalizing on consumer trends
and addressing obesity and
related health issues »
RANKED #1 FOOD COMPANY –
Insight/JP Morgan – April 2008
A HEALTHIER COMPANY
Source : Crédit Suisse
7
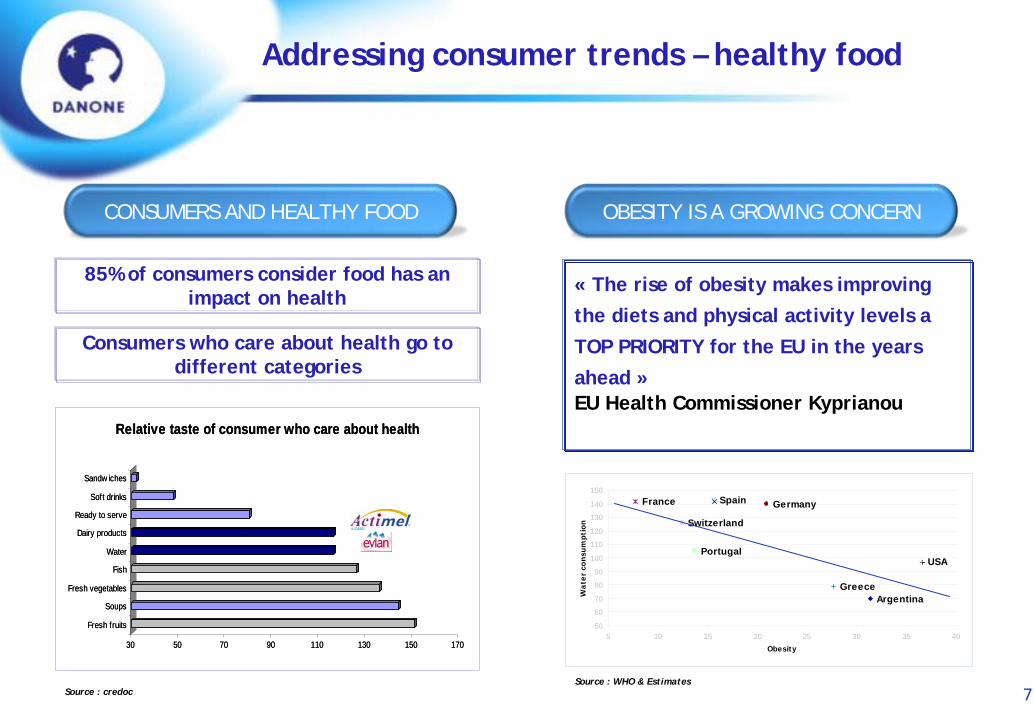
Addressing consumer trends – healthy food
USA
Argentina
France Germany
Greece
Portugal
Spain
Switzerland
50
60
70
80
90
100
110
120
130
140
150
5 10 15 20 25 30 35 40
Obesity
Wa
ter
con
sum
ptio
n
OBESITY IS A GROWING CONCERN
« The rise of obesity makes improving the diets and physical activity levels a TOP PRIORITY for the EU in the years ahead »EU Health Commissioner Kyprianou
CONSUMERS AND HEALTHY FOOD
85% of consumers consider food has an impact on health
30 50 70 90 110 130 150 170
Fresh fruits
Soups
Fresh vegetables
Fish
Water
Dairy products
Ready to serve
Soft drinks
Sandw iches
Relative taste of consumer who care about health
Source : WHO & Estimates
Consumers who care about health go to different categories
Source : credoc
30 50 70 90 110 130 150 170
Fresh fruits
Soups
Fresh vegetables
Fish
Water
Dairy products
Ready to serve
Soft drinks
Sandw iches
Relative taste of consumer who care about health
8
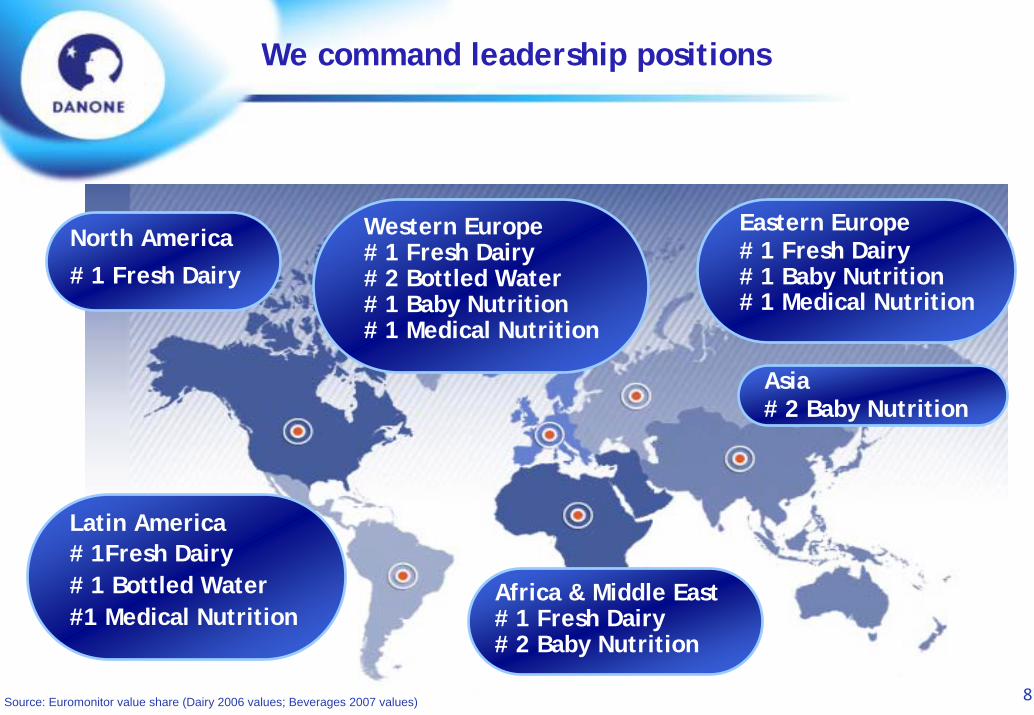
Eastern Europe# 1 Fresh Dairy# 1 Baby Nutrition# 1 Medical Nutrition
Africa & Middle East# 1 Fresh Dairy# 2 Baby Nutrition
Latin America# 1Fresh Dairy# 1 Bottled Water#1 Medical Nutrition
North America
# 1 Fresh Dairy
Western Europe# 1 Fresh Dairy# 2 Bottled Water# 1 Baby Nutrition# 1 Medical Nutrition
Source: Euromonitor value share (Dairy 2006 values; Beverages 2007 values)
Asia# 2 Baby Nutrition
We command leadership positions
9
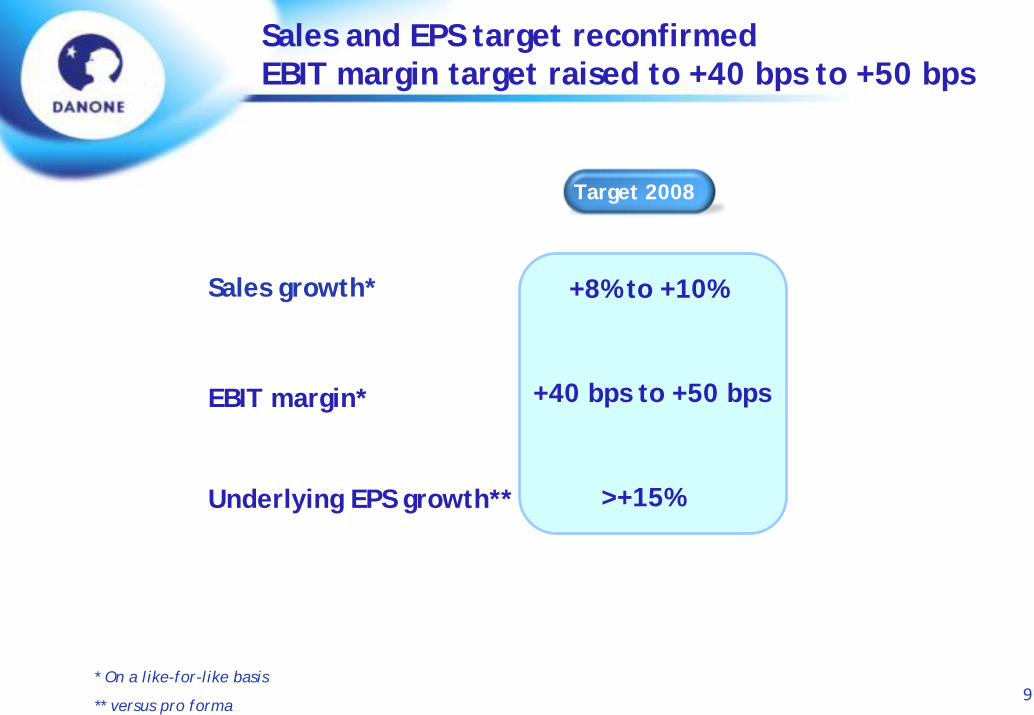
Sales and EPS target reconfirmedEBIT margin target raised to +40 bps to +50 bps
Target 2008
+8% to +10%
EBIT margin* +40 bps to +50 bps
Underlying EPS growth** >+15%
* On a like-for-like basis
** versus pro forma
Target 2008
Sales growth*
10
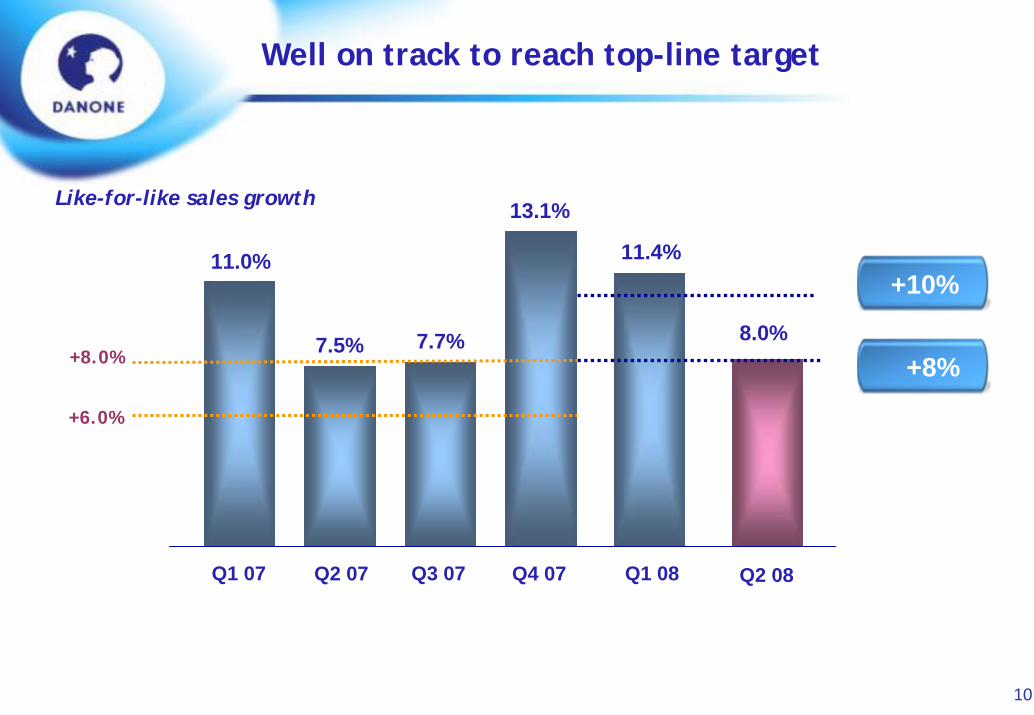
+6.0%
+8.0%8.0%
11.0%
7.5% 7.7%
Q1 08
+10%
+8%
Q4 07Q3 07Q2 07Q1 07 Q2 08
Like-for-like sales growth 13.1%
11.4%
Well on track to reach top-line target
11
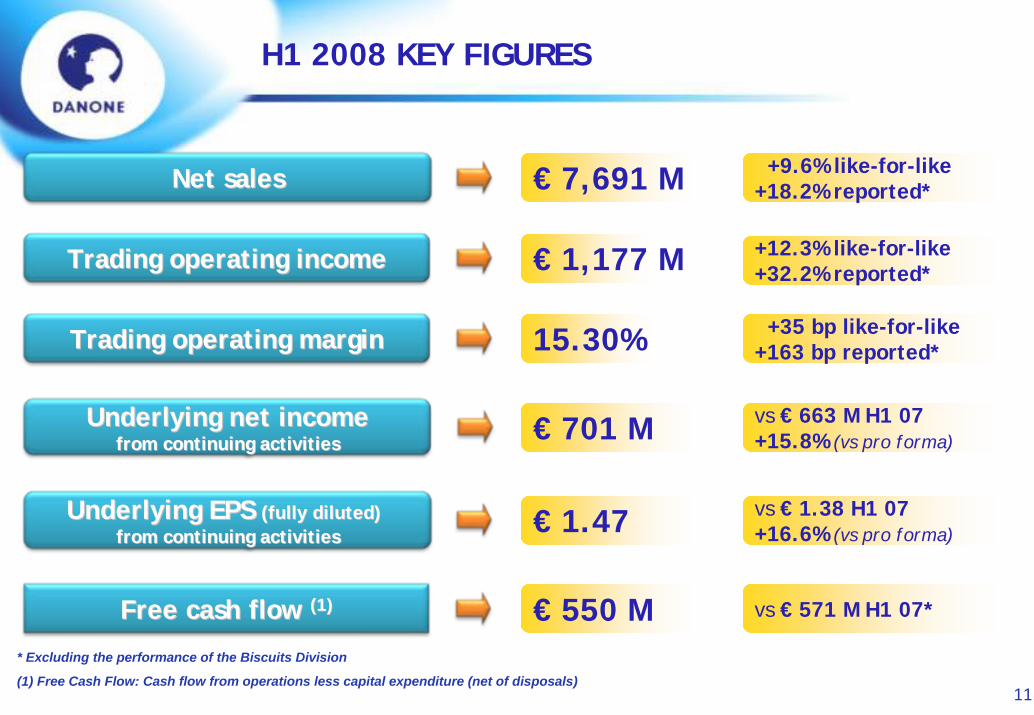
+9.6% like-for-like+18.2% reported*Net salesNet sales € 7,691 M
Trading operating incomeTrading operating income € 1,177 M
Trading operating marginTrading operating margin +35 bp like-for-like+163 bp reported*15.30%
Underlying net incomeUnderlying net incomefrom continuing activitiesfrom continuing activities
vs € 663 M H1 07+15.8% (vs pro forma)€ 701 M
Underlying EPS Underlying EPS (fully diluted)(fully diluted)from continuing activitiesfrom continuing activities
vs € 1.38 H1 07+16.6% (vs pro forma)€ 1.47
Free cash flow Free cash flow (1)(1) € 550 M vs € 571 M H1 07*
* Excluding the performance of the Biscuits Division
(1) Free Cash Flow: Cash flow from operations less capital expenditure (net of disposals)
+12.3% like-for-like+32.2% reported*
H1 2008 KEY FIGURES
12
Fresh Dairy Fresh Dairy DivisionDivision
13
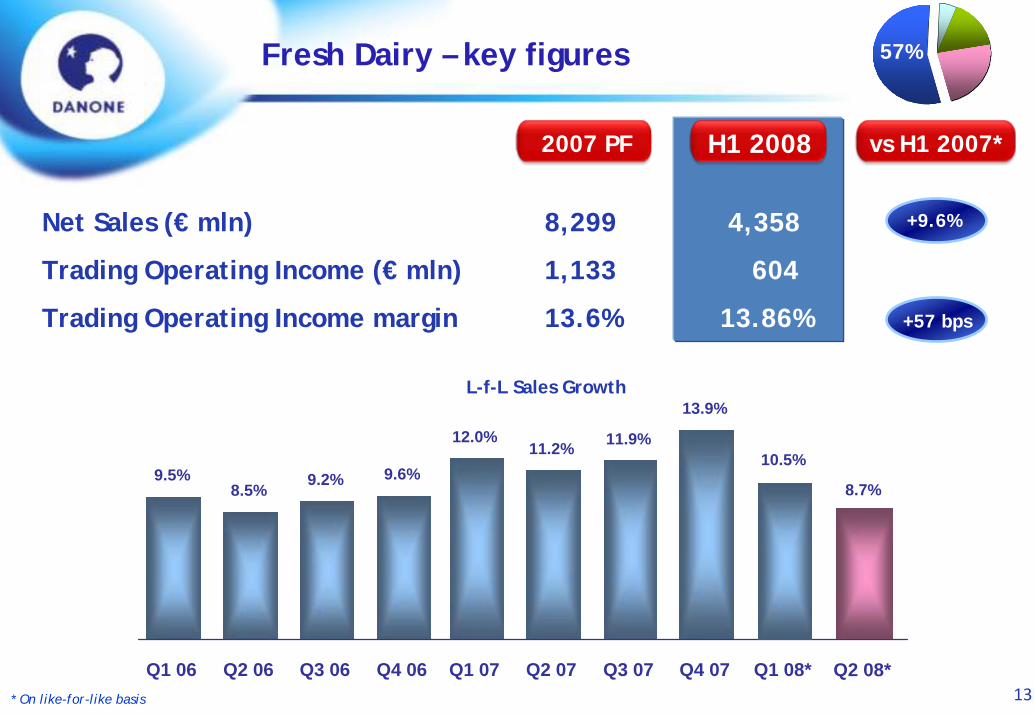
2007 PF H1 2008
Net Sales (€ mln) 8,299 4,358
Trading Operating Income (€ mln) 1,133 604
Trading Operating Income margin 13.6% 13.86%
L-f-L Sales Growth
* On like-for-like basis
57%Fresh Dairy – key figures
12.0%
9.5%8.5% 9.2% 9.6%
11.2% 11.9%10.5%
13.9%
Q1 08*Q4 06Q3 06Q2 06Q1 06 Q4 07Q3 07Q2 07Q1 07 Q2 08*
8.7%
+9.6%
+57 bps
vs H1 2007*
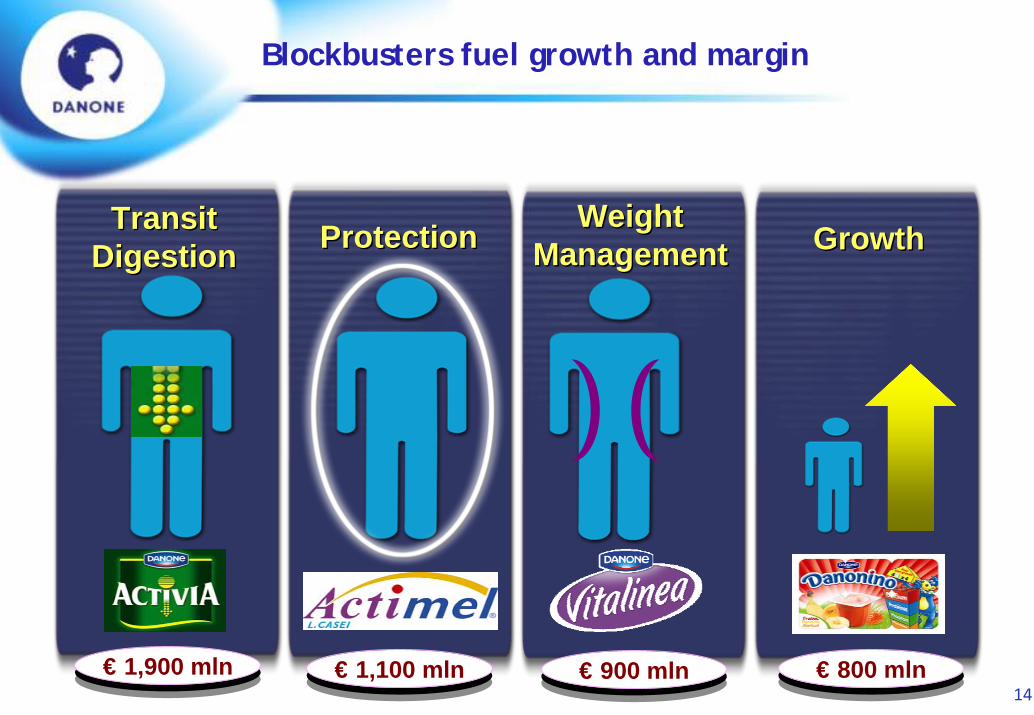
14€ 800 mln€ 1,100 mln€ 1,900 mln € 900 mln
GrowthGrowthTransitDigestion
TransitDigestion
WeightManagement
WeightManagementProtectionProtection
Blockbusters fuel growth and margin
15
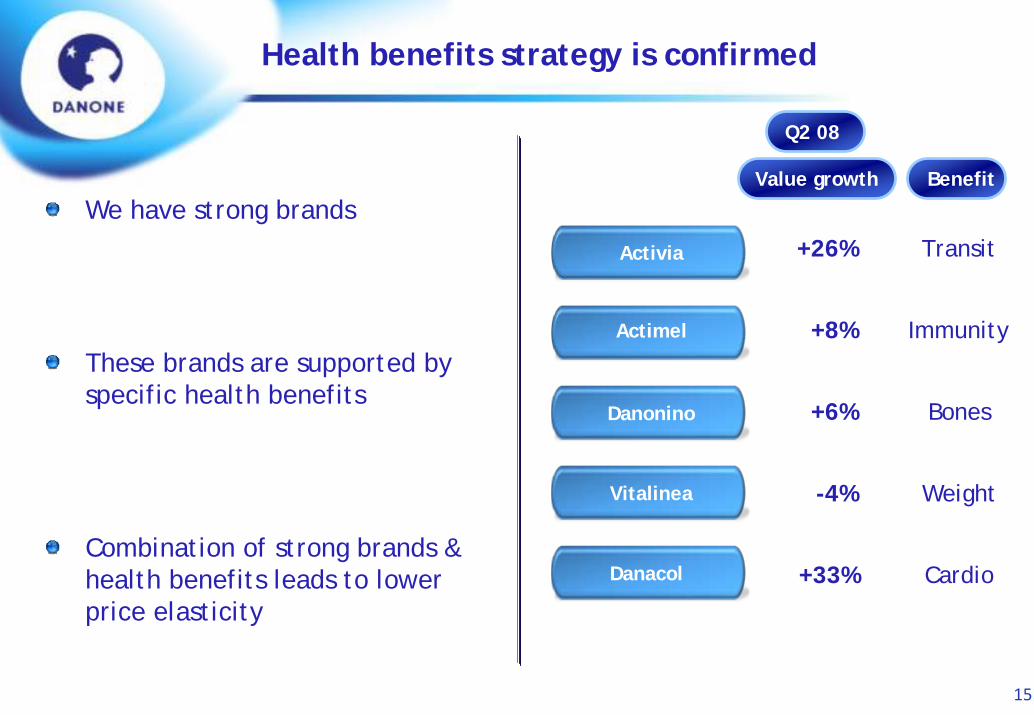
Health benefits strategy is confirmed
We have strong brands
These brands are supported by specific health benefits
Combination of strong brands & health benefits leads to lower price elasticity
Activia
Actimel
Danonino
Value growth
+26%
+8%
+6%
Vitalinea -4%
Danacol +33%
Benefit
Transit
Immunity
Bones
Weight
Cardio
Q2 08
16
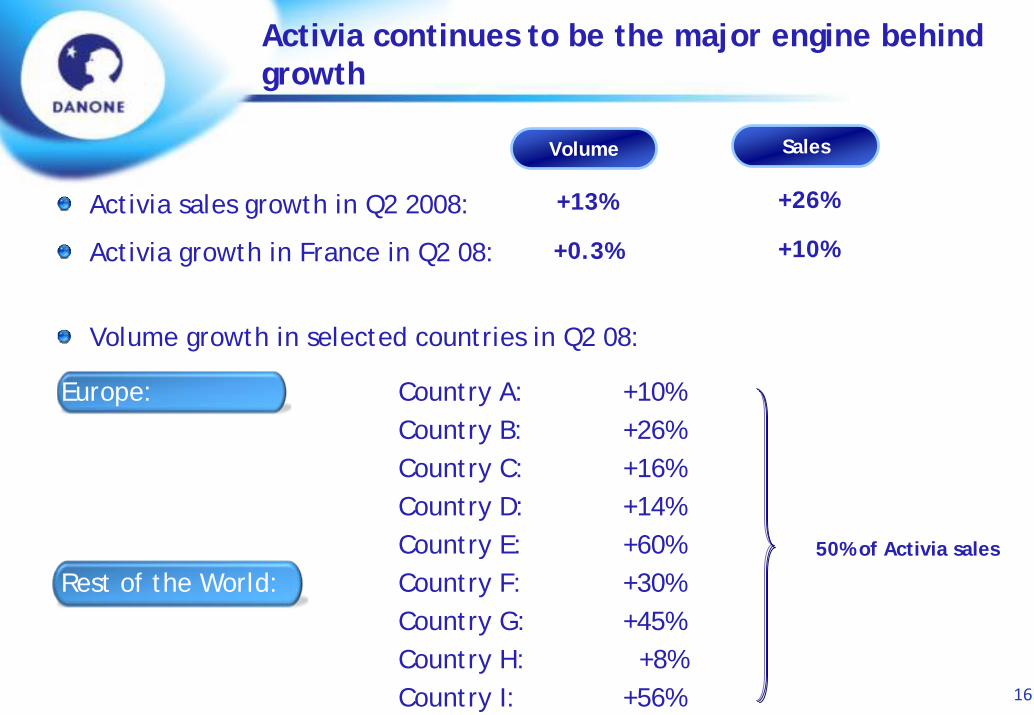
Activia continues to be the major engine behind growth
Activia sales growth in Q2 2008:
Activia growth in France in Q2 08:
Sales
+26%
Volume
+13%
Volume growth in selected countries in Q2 08:
Europe: Country A: +10%Country B: +26%Country C: +16%Country D: +14%Country E: +60%
Rest of the World: Country F: +30%Country G: +45%Country H: +8%Country I: +56%
50% of Activia sales
+10%+0.3%
17
A large part of the Dairy markets shows resilience and success
When isolating the specific situation in France, the volume growth of the rest of the division improves to +0.7% in Q2 08
Eastern Europe, Latin America and Asia continue to have single-digit volume growth, despite a softening in selected markets
Certain countries are witnessing a rebound in volumes- Brazil, Stonyfield, Saudi Arabia, Italy
Market shares have remained relatively stable or improved in the majority of our Dairy markets - 16 countries improved their market shares- 4 markets in W-Eur lost more than 1%pt ms- 3 markets in RoW lost more than 1%pt ms
18
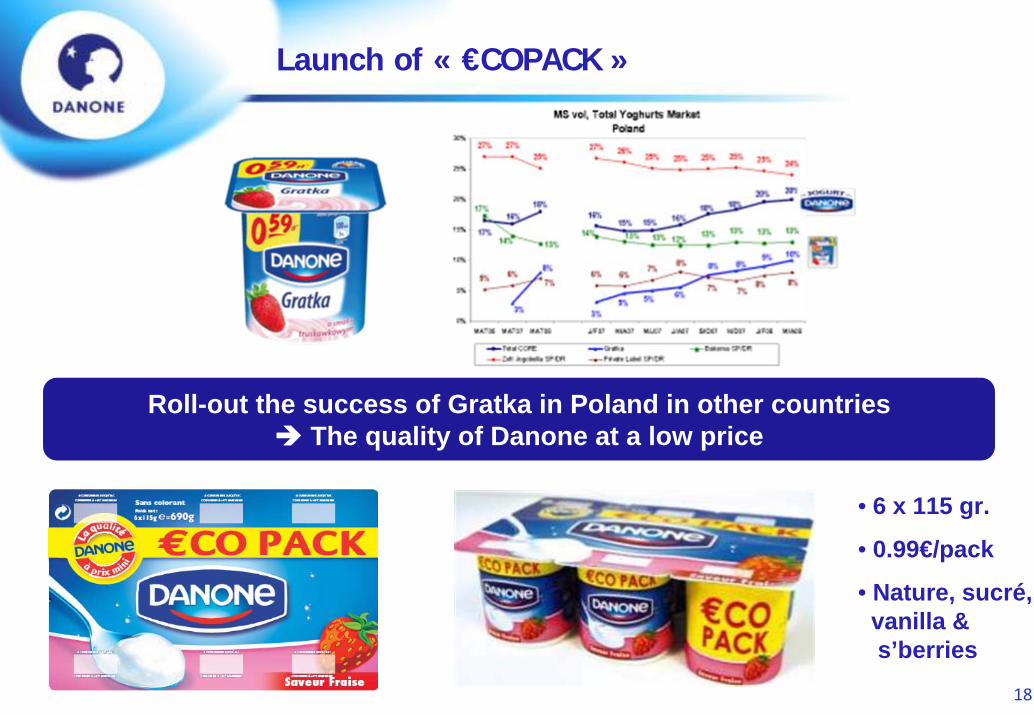
Roll-out the success of Gratka in Poland in other countriesThe quality of Danone at a low price
• 6 x 115 gr.
• 0.99€/pack
• Nature, sucré,vanilla &s’berries
Launch of « €COPACK »
19
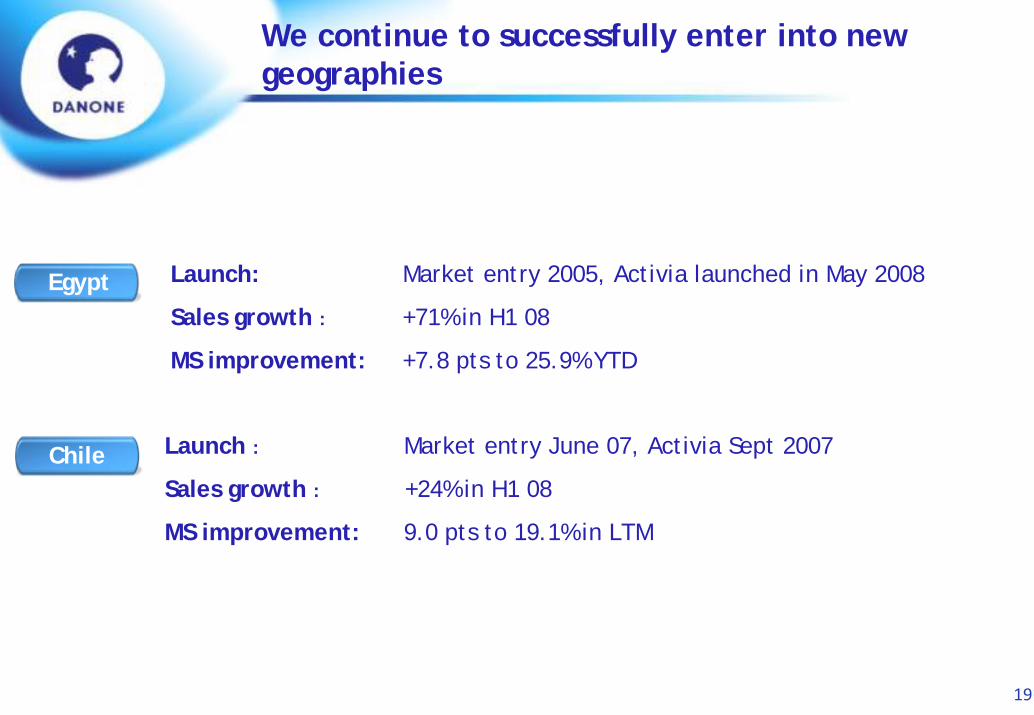
We continue to successfully enter into new geographies
Egypt Launch: Market entry 2005, Activia launched in May 2008
Sales growth : +71% in H1 08
MS improvement: +7.8 pts to 25.9% YTD
Chile Launch : Market entry June 07, Activia Sept 2007
Sales growth : +24% in H1 08
MS improvement: 9.0 pts to 19.1% in LTM
20
WatersWatersDivisionDivision
21
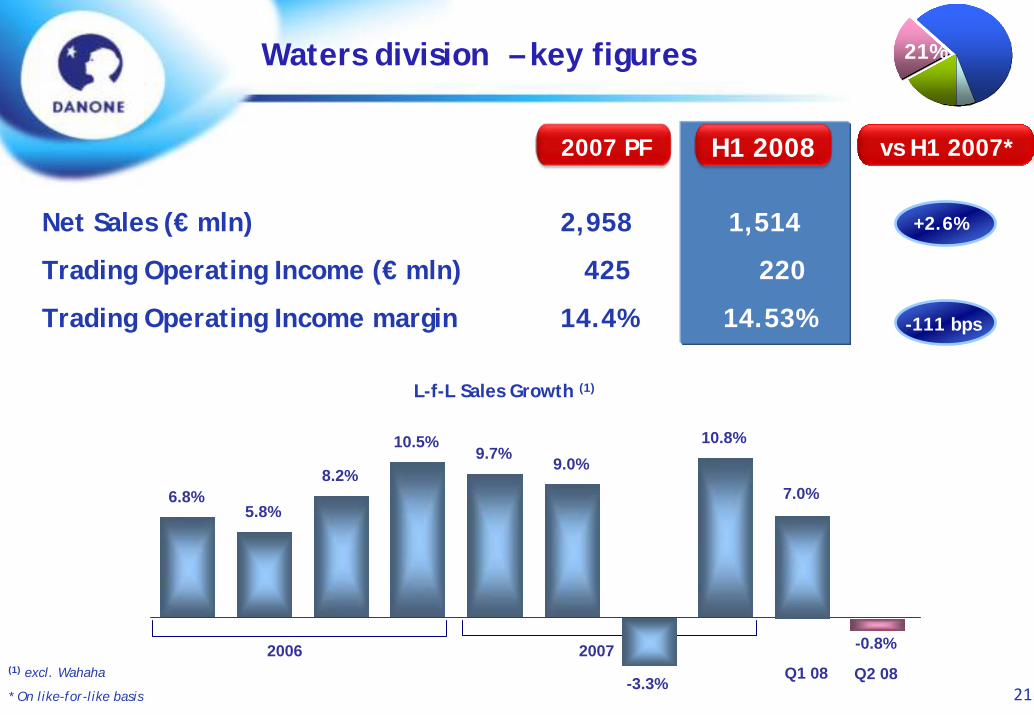
2007 PF H1 2008
Net Sales (€ mln) 2,958 1,514
Trading Operating Income (€ mln) 425 220
Trading Operating Income margin 14.4% 14.53%
21%
(1) excl. Wahaha
* On like-for-like basis
L-f-L Sales Growth (1)
Waters division – key figures 21%
2006 2007
6.8%5.8%
8.2%
10.5%9.7% 9.0%
-3.3%
10.8%
7.0%
Q2 08
-0.8%
Q1 08
+2.6%
-111 bps
-4.7%
vs H1 2007*2007 PF
22
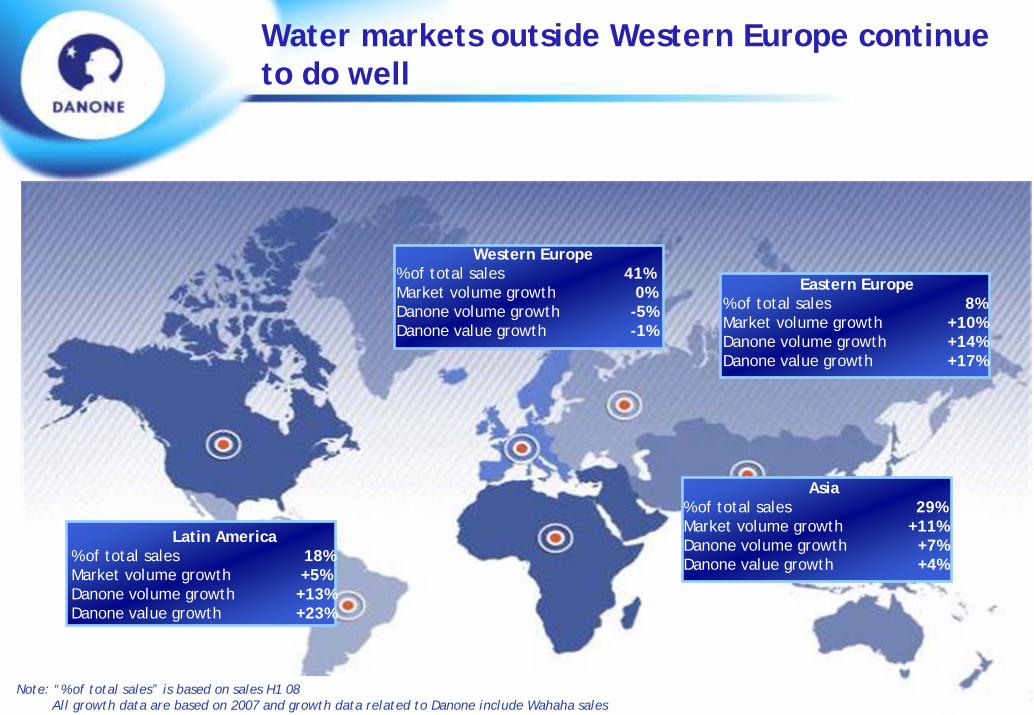
Western Europe% of total sales 41%Market volume growth 0%Danone volume growth -5%Danone value growth -1%
Eastern Europe% of total sales 8%Market volume growth +10%Danone volume growth +14%Danone value growth +17%
Asia% of total sales 29%Market volume growth +11%Danone volume growth +7%Danone value growth +4%
Latin America% of total sales 18%Market volume growth +5%Danone volume growth +13%Danone value growth +23%
Water markets outside Western Europe continue to do well
Note: “% of total sales” is based on sales H1 08All growth data are based on 2007 and growth data related to Danone include Wahaha sales
23
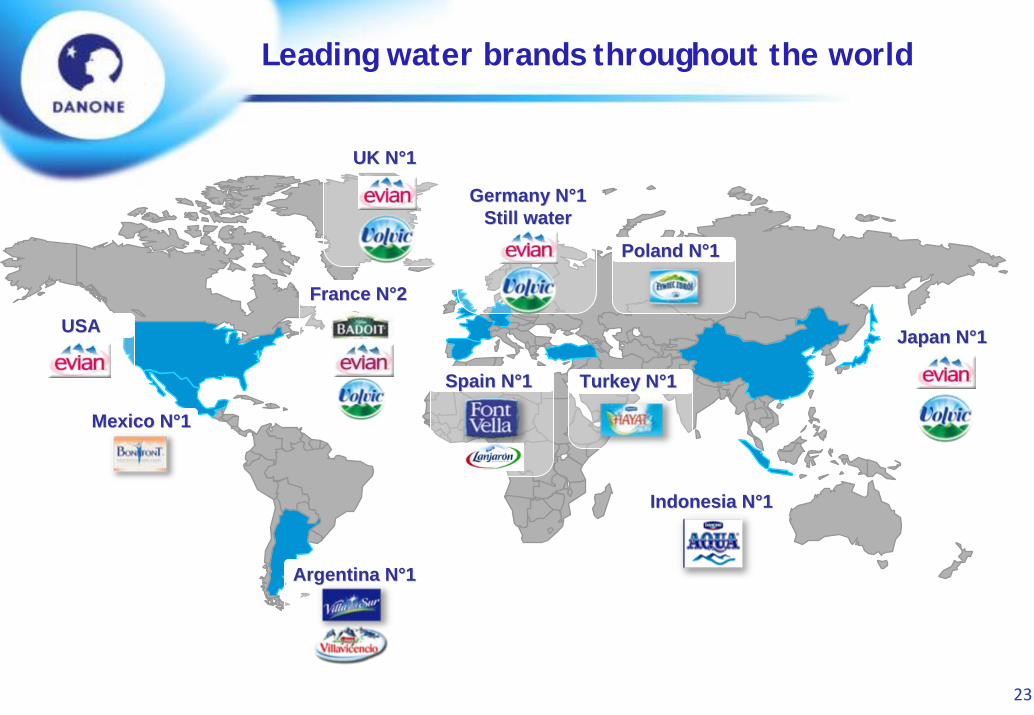
USAUSA
Mexico NMexico N°°11
Argentina NArgentina N°°11
IndonesiaIndonesia NN°°11
Spain NSpain N°°11
France NFrance N°°22
TurkeyTurkey NN°°11
Germany NGermany N°°11StillStill waterwater
UK NUK N°°11
PolandPoland NN°°11
JapanJapan NN°°11
Leading water brands throughout the world
24
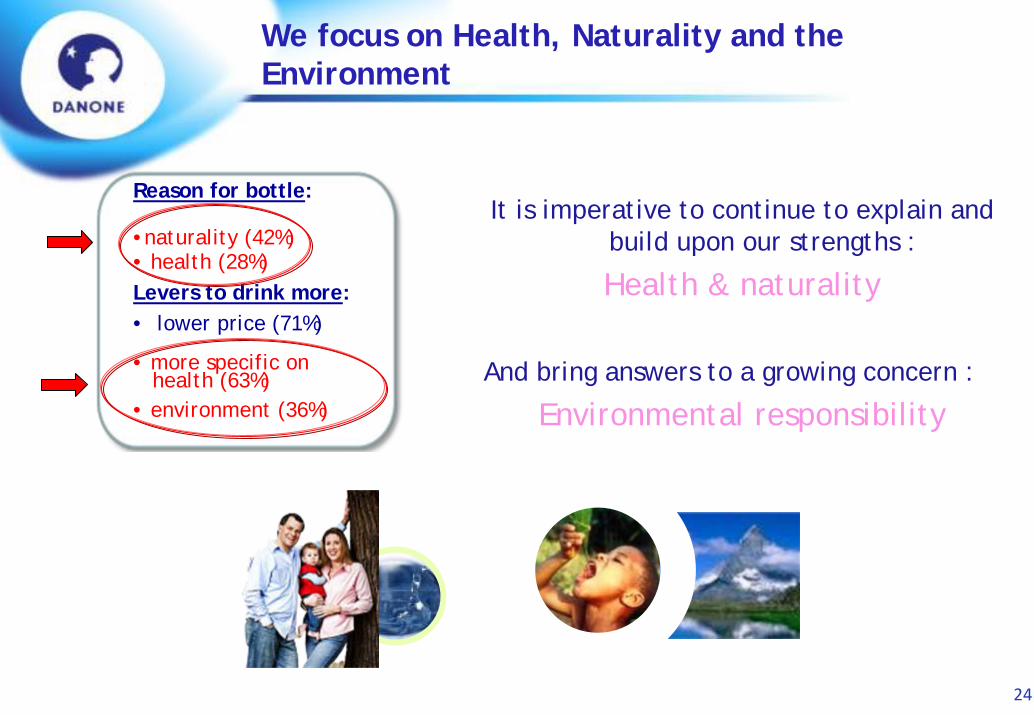
We focus on Health, Naturality and the Environment
It is imperative to continue to explain and build upon our strengths :
Health & naturality
And bring answers to a growing concern :
Environmental responsibility
Reason for bottle:
•naturality (42%)• health (28%)Levers to drink more:• lower price (71%)
• more specific on health (63%)
• environment (36%)
25
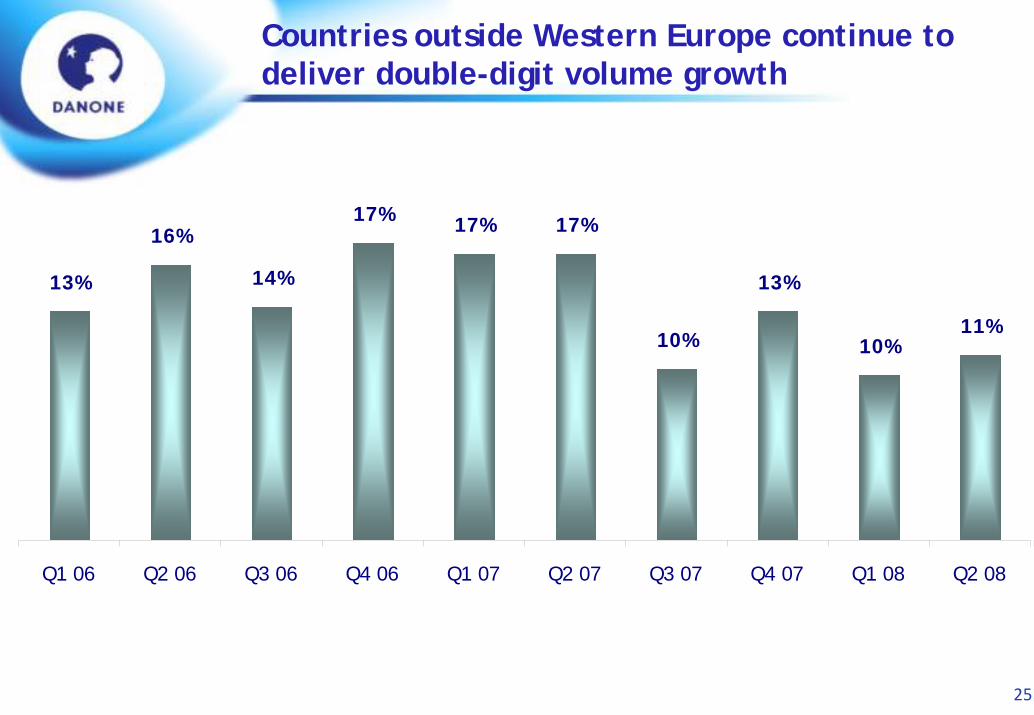
Countries outside Western Europe continue to deliver double-digit volume growth
11%10%
13%
10%
17%17%17%
14%
16%
13%
Q2 08Q1 08Q4 07Q3 07Q2 07Q1 07Q4 06Q3 06Q2 06Q1 06
26
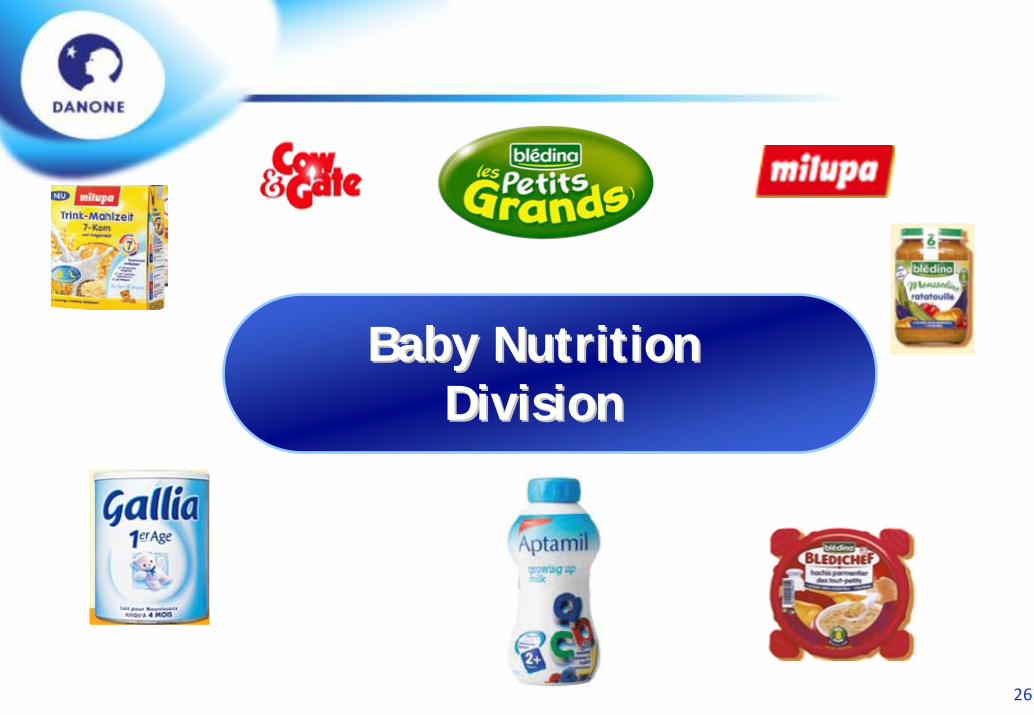
Baby NutritionBaby NutritionDivisionDivision
27
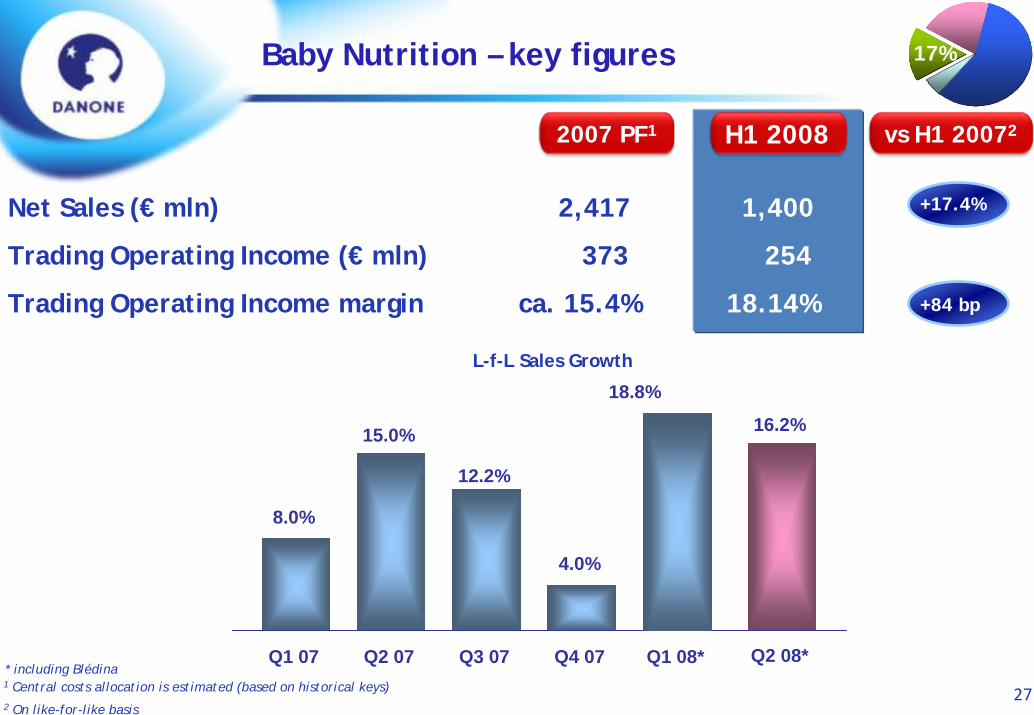
Net Sales (€ mln) 2,417 1,400
Trading Operating Income (€ mln) 373 254
Trading Operating Income margin ca. 15.4% 18.14%
L-f-L Sales Growth
2007 PF1
1 Central costs allocation is estimated (based on historical keys)
17%Baby Nutrition – key figures
18.8%
4.0%
12.2%
15.0%
8.0%
Q1 08*Q4 07Q3 07Q2 07Q1 07
16.2%
Q2 08** including Blédina
H1 2008
+17.4%
+84 bp
vs H1 20072
2 On like-for-like basis
28
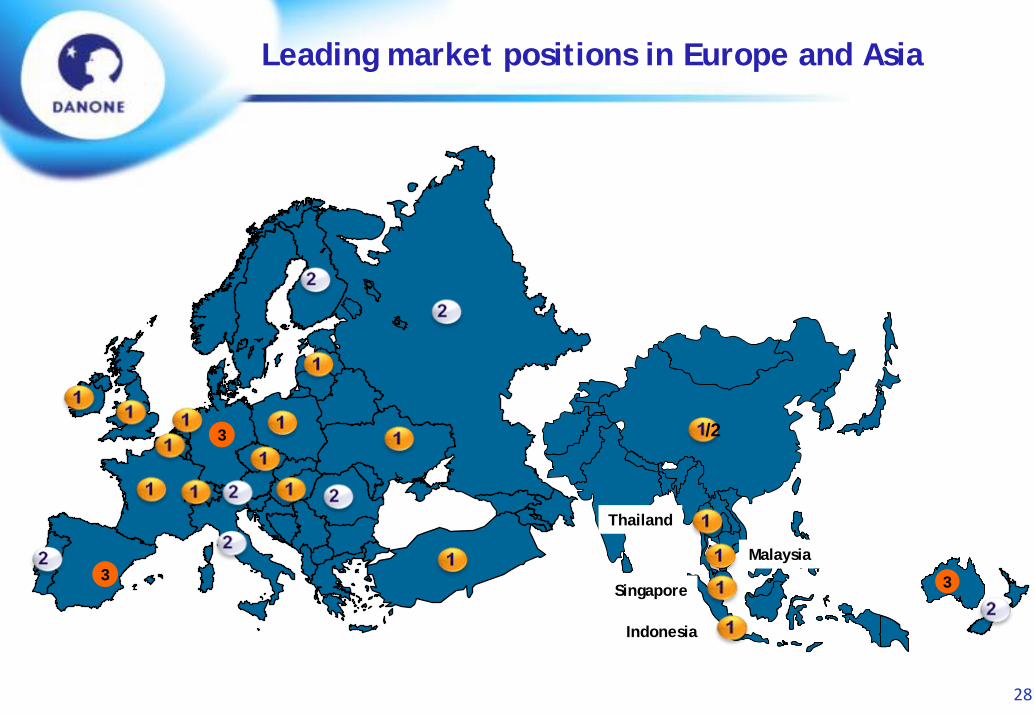
1
Leading market positions in Europe and Asia
Singapore
Malaysia
Indonesia
Thailand
3
3
3
/2
29Source: Baby Food public information, brokers, Nielsen
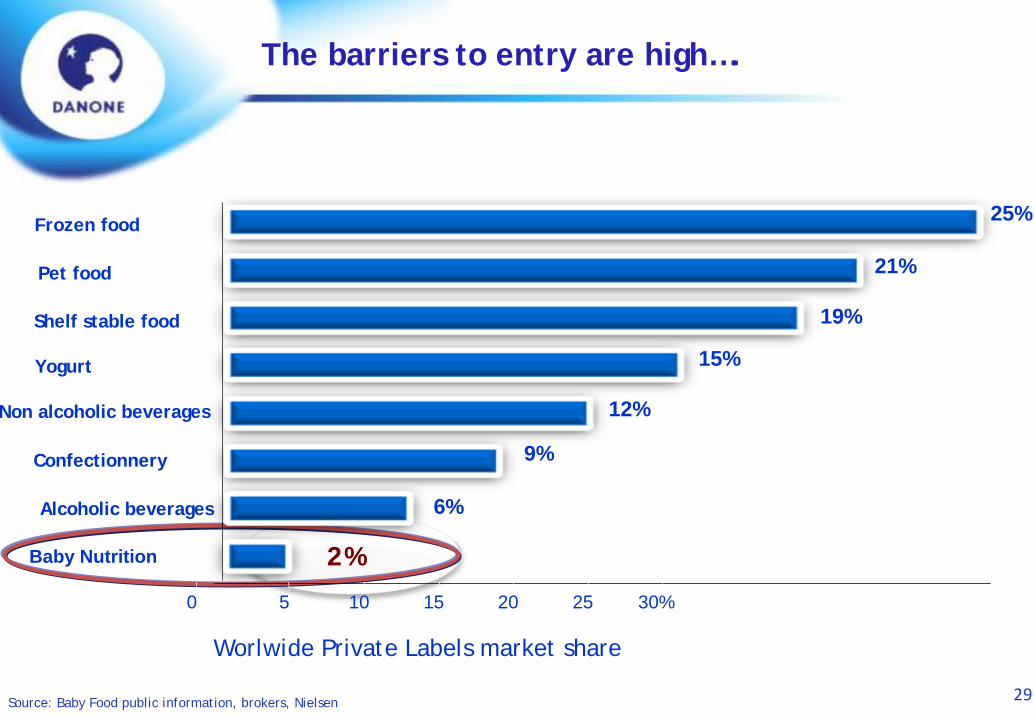
2%Baby Nutrition
Alcoholic beverages
Confectionnery
Non alcoholic beverages
Yogurt
Shelf stable food
Pet food
Frozen food
6%
9%
12%
15%
19%
21%
25%
0 5 10 15 20 25 30%
Worlwide Private Labels market share
The barriers to entry are high….
30
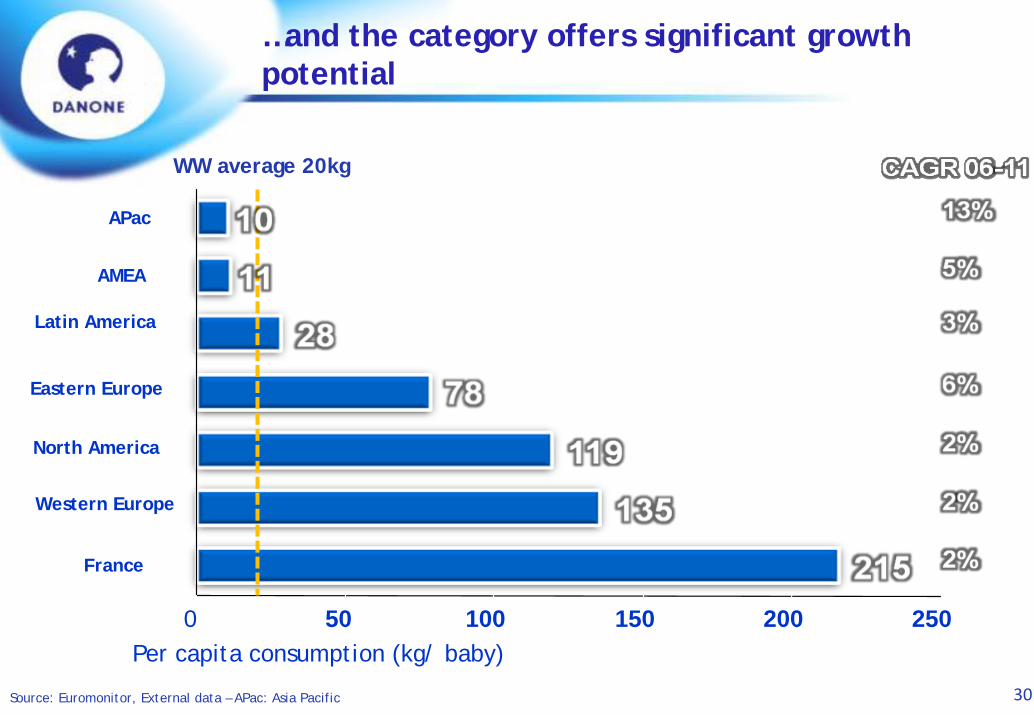
WW average 20kg
France
Western Europe
North America
Eastern Europe
Latin America
AMEA
APac
0 50 100 150 200 250Per capita consumption (kg/ baby)
Source: Euromonitor, External data – APac: Asia Pacific
…and the category offers significant growth potential
31
Medical NutritionMedical NutritionDivisionDivision
32
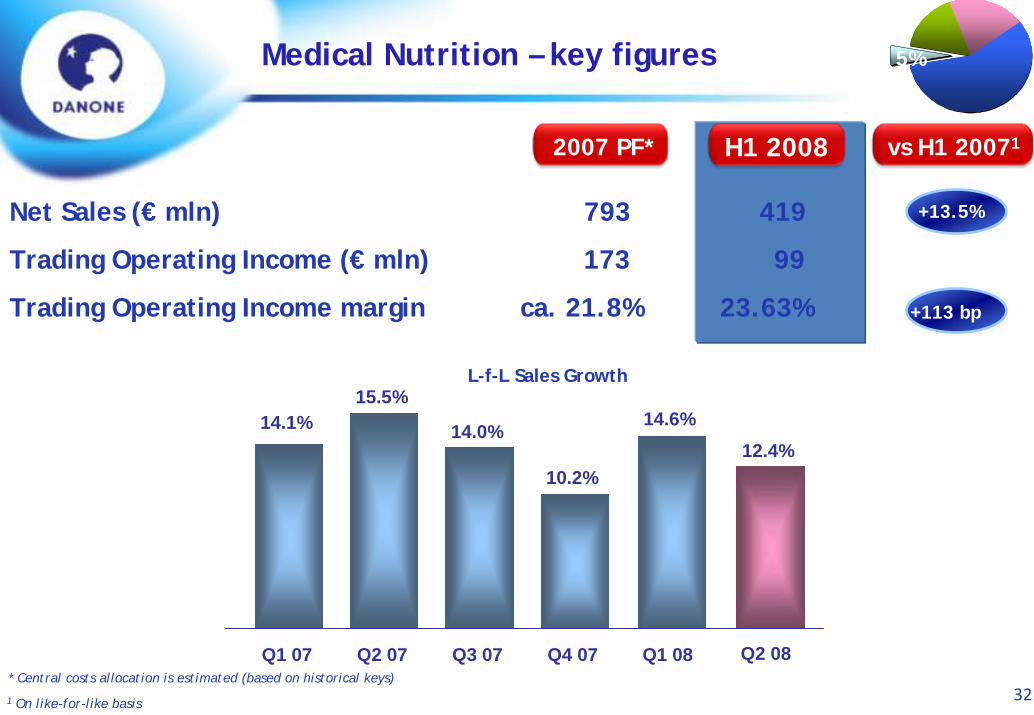
Net Sales (€ mln) 793 419
Trading Operating Income (€ mln) 173 99
Trading Operating Income margin ca. 21.8% 23.63%
2007 PF*
* Central costs allocation is estimated (based on historical keys)
5%Medical Nutrition – key figures
14.6%
10.2%
14.0%
15.5%14.1%
Q1 08Q4 07Q3 07Q2 07Q1 07
12.4%
Q2 08
H1 2008
+13.5%
+113 bp
vs H1 20071
L-f-L Sales Growth
1 On like-for-like basis
33
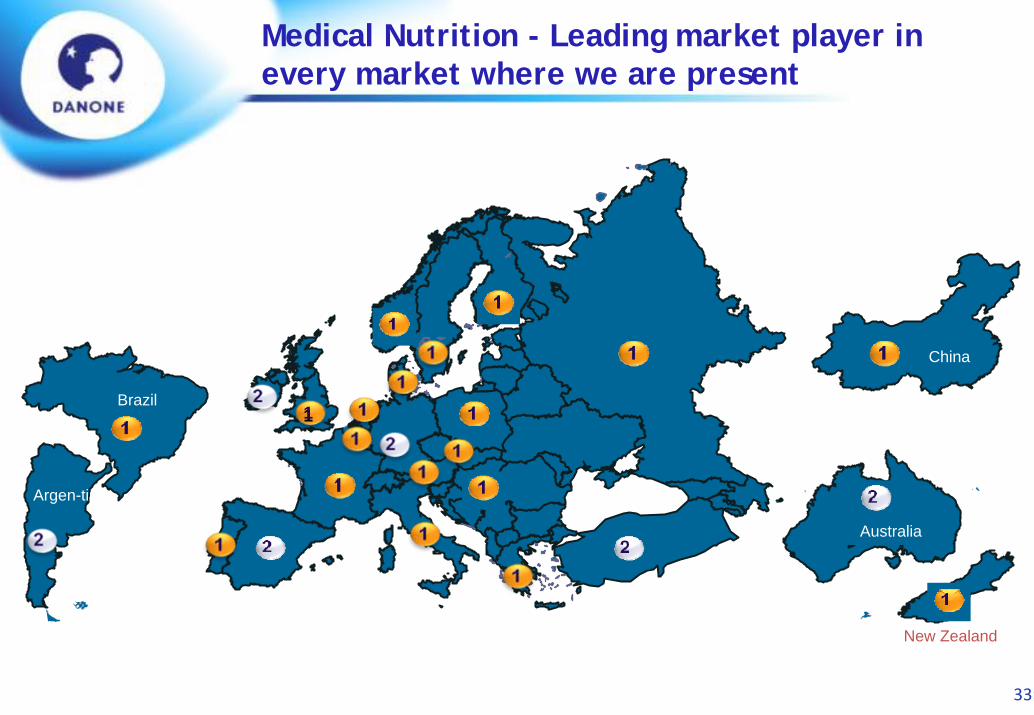
Brazil
Argen-tina
China
Australia
New Zealand
11
Medical Nutrition - Leading market player in every market where we are present
34
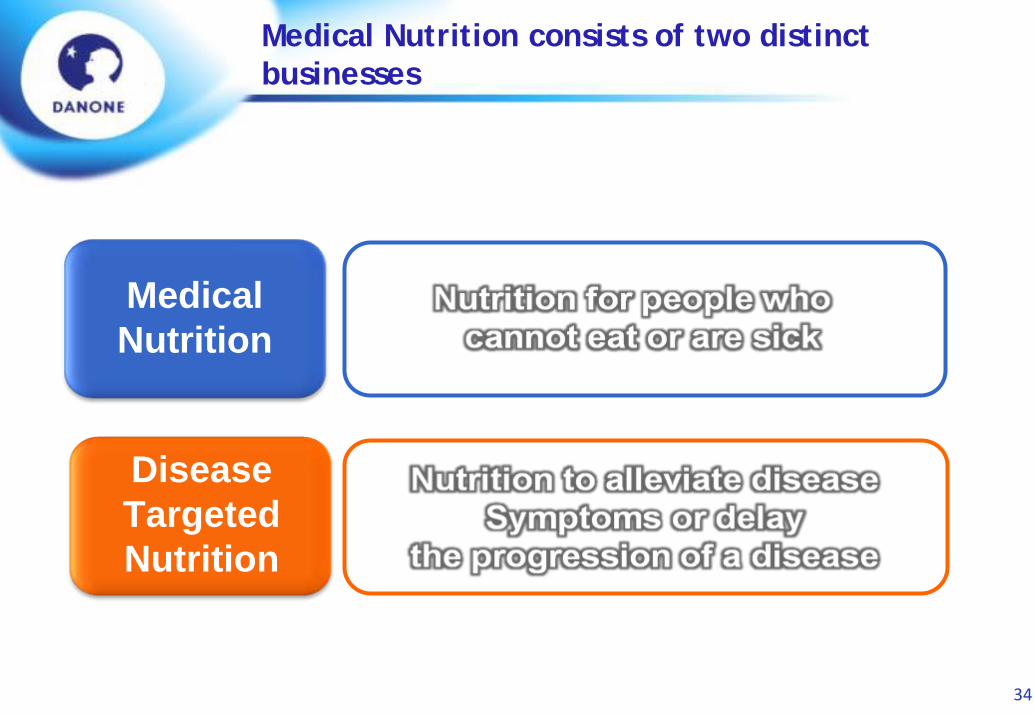
Disease Targeted Nutrition
Medical Nutrition
Medical Nutrition consists of two distinct businesses
35
A unique food company focused 100% on Health
The New Danone

36
Notes

37
Notes

38
Notes

39
Notes