Embed Size (px)
Citation preview
Emmanuel Faber
Deutsche Bank Global Consumer Conference
Paris - June 20th, 2012
2
Disclaimer
This document contains certain forward-looking statements concerning DANONE. Although
DANONE believes its expectations are based on reasonable assumptions, these forward-looking
statements are subject to numerous risks and uncertainties, which could cause actual results to
differ materially from those anticipated in these forward-looking statements. For a detailed
description of these risks and uncertainties, please refer to the section “Risk Factors” in
DANONE’s Annual Report (which is available on www.danone.com). DANONE undertakes no
obligation to publicly update or revise any of these forward-looking statements. This document
does not constitute an offer to sell, or a solicitation of an offer to buy, Danone shares.
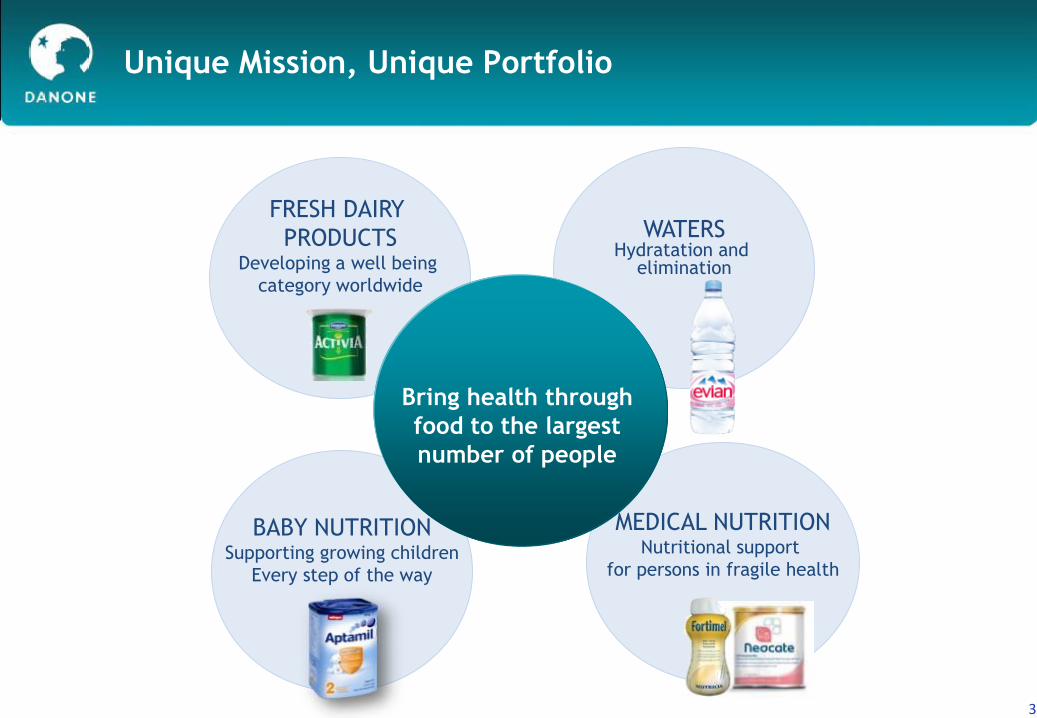
Unique Mission, Unique Portfolio
3
BABY NUTRITION Supporting growing children
Every step of the way
MEDICAL NUTRITION Nutritional support
for persons in fragile health
FRESH DAIRY
PRODUCTS Developing a well being
category worldwide
WATERS Hydratation and
elimination
Bring health through
food to the largest
number of people
3
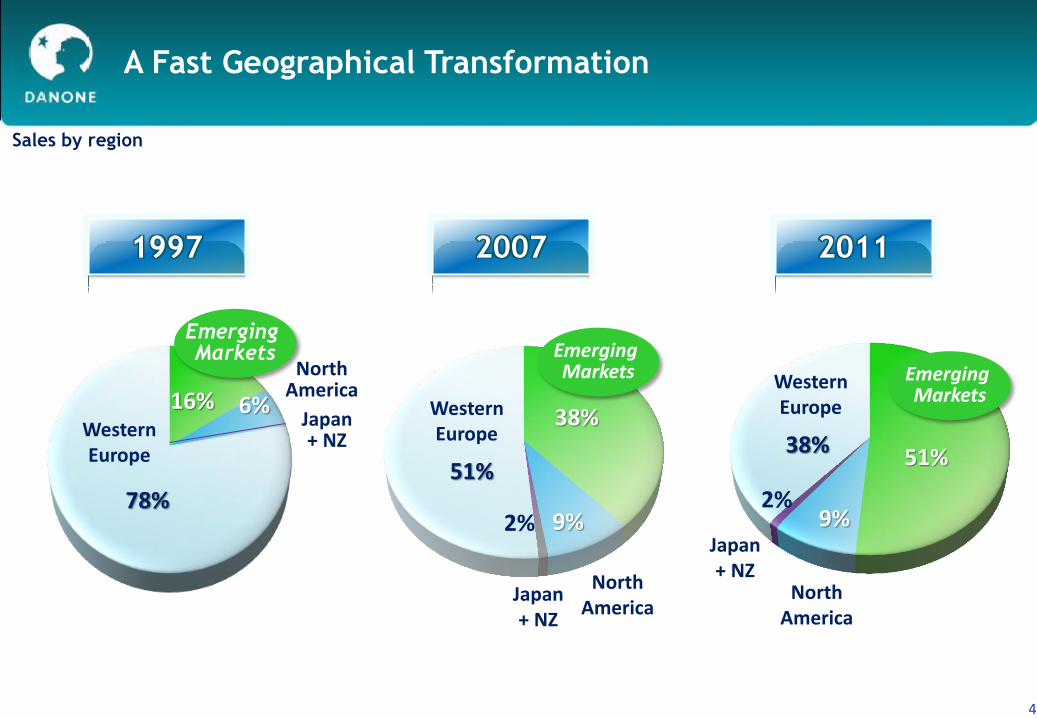
A Fast Geographical Transformation
Sales by region
4
2007 2011 1997
North America
Emerging Markets
51%
9%
38%
Japan + NZ
Western Europe
2%
North America
Emerging Markets
38%
9%
51%
Japan + NZ
Western Europe
4
Emerging Markets
16% 6%
78%
Western Europe
North America
Japan + NZ
2%
4
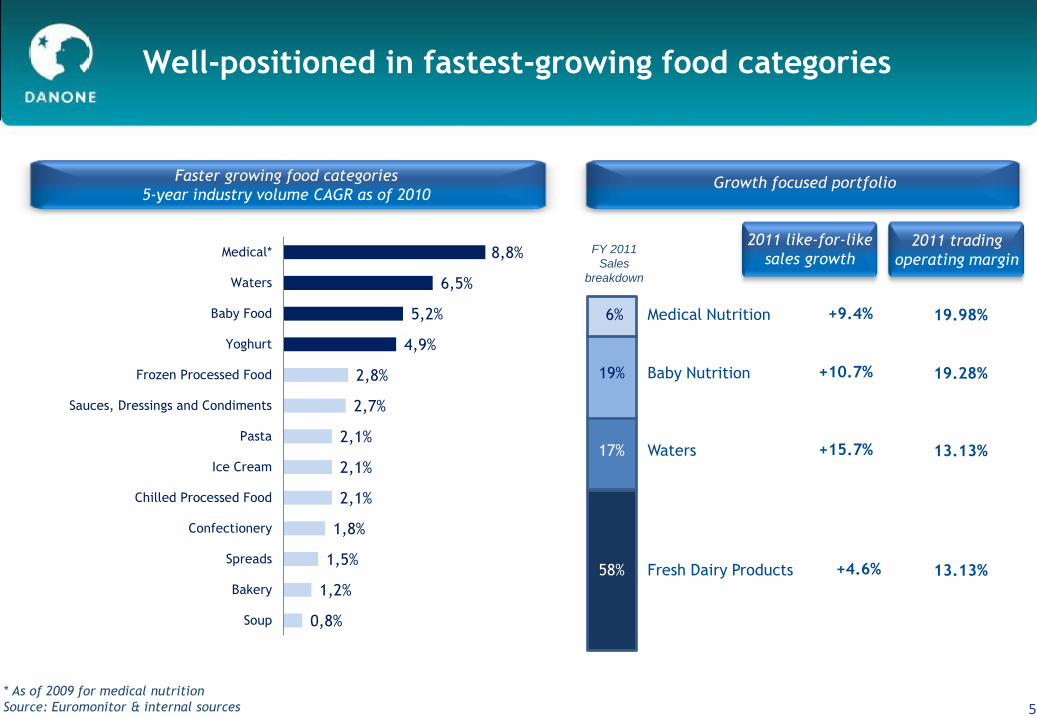
Well-positioned in fastest-growing food categories
Faster growing food categories
5-year industry volume CAGR as of 2010 Growth focused portfolio
* As of 2009 for medical nutrition
Source: Euromonitor & internal sources
5
Fresh Dairy Products
Waters
Baby Nutrition
Medical Nutrition
17%
6%
19%
58%
+15.7%
+9.4%
+10.7%
+4.6%
13.13%
19.98%
19.28%
13.13%
2011 like-for-like
sales growth
2011 trading
operating margin FY 2011
Sales
breakdown
0,8%
1,2%
1,5%
1,8%
2,1%
2,1%
2,1%
2,7%
2,8%
4,9%
5,2%
6,5%
8,8%
Soup
Bakery
Spreads
Confectionery
Chilled Processed Food
Ice Cream
Pasta
Sauces, Dressings and Condiments
Frozen Processed Food
Yoghurt
Baby Food
Waters
Medical*
5
6
Managing a complex environment
since 2008
6
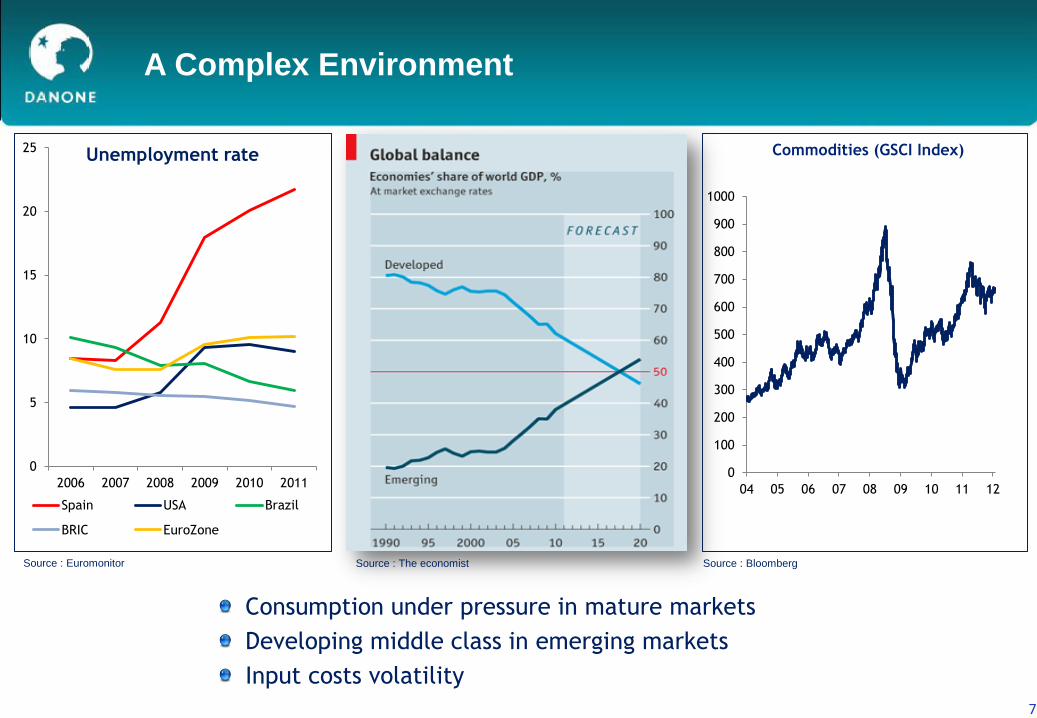
A Complex Environment
7
0
100
200
300
400
500
600
700
800
900
1000
04 05 06 07 08 09 10 11 12
Commodities (GSCI Index)
Consumption under pressure in mature markets
Developing middle class in emerging markets
Input costs volatility
0
5
10
15
20
25
2006 2007 2008 2009 2010 2011
Unemployment rate
Spain USA Brazil
BRIC EuroZone
Source : The economist Source : Euromonitor Source : Bloomberg
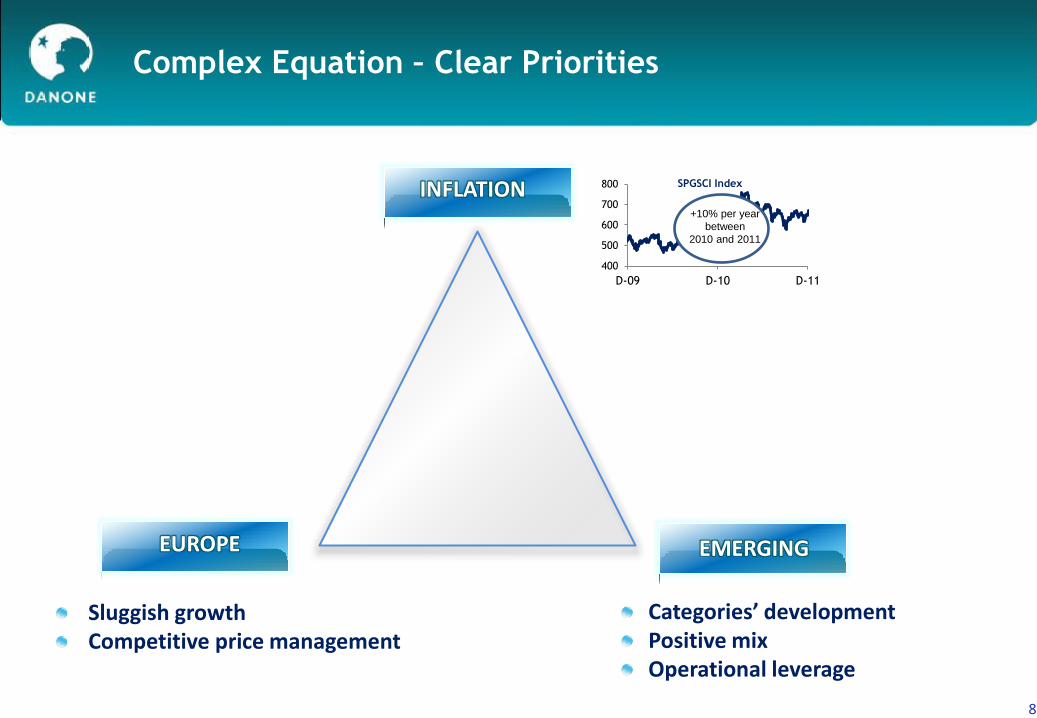
EUROPE
INFLATION
EMERGING
Complex Equation – Clear Priorities
Sluggish growth Competitive price management
Categories’ development Positive mix Operational leverage
400
500
600
700
800
D-09 D-10 D-11
SPGSCI Index
+10% per year
between
2010 and 2011
8
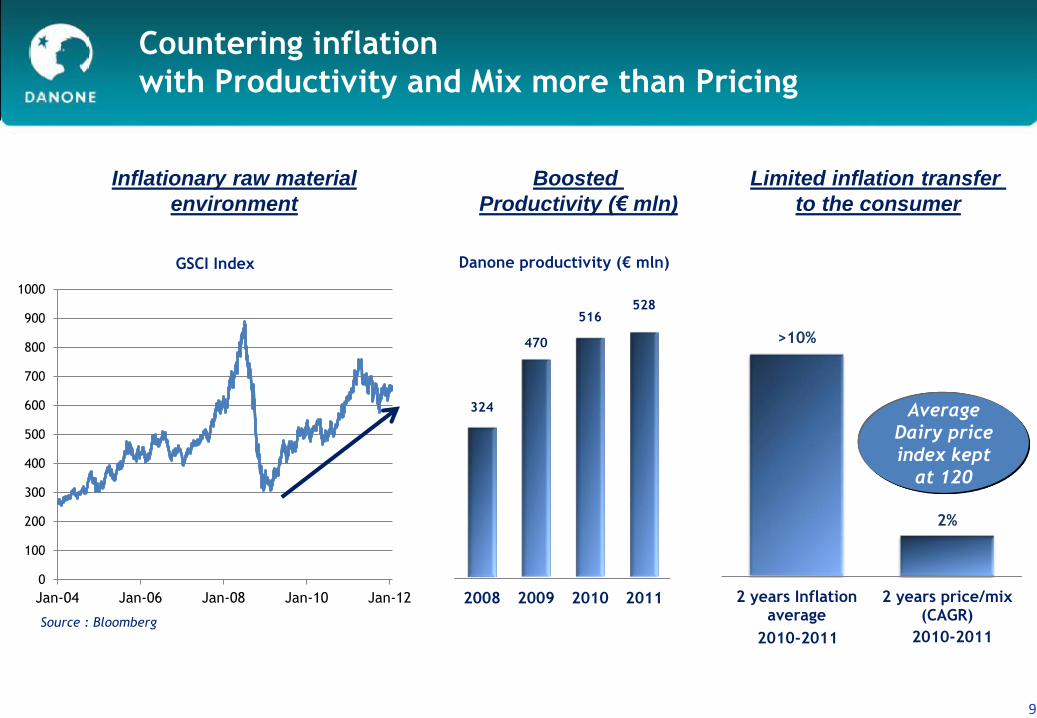
Countering inflation
with Productivity and Mix more than Pricing
9
0
100
200
300
400
500
600
700
800
900
1000
Jan-04 Jan-06 Jan-08 Jan-10 Jan-12
324
470
516 528
2008 2009 2010 2011
Boosted
Productivity (€ mln)
Limited inflation transfer
to the consumer
Inflationary raw material
environment
>10%
2%
2 years Inflationaverage
2 years price/mix(CAGR)
Source : Bloomberg
GSCI Index Danone productivity (€ mln)
Average
Dairy price
index kept
at 120
2010-2011 2010-2011
10
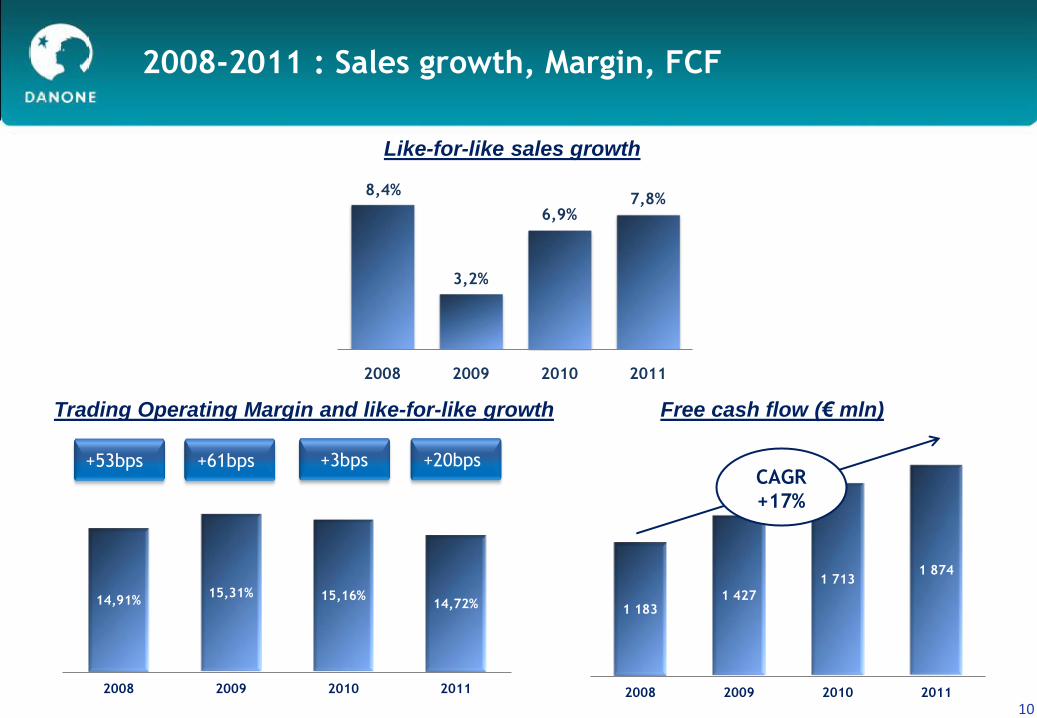
2008-2011 : Sales growth, Margin, FCF
Like-for-like sales growth
+20bps +3bps
Trading Operating Margin and like-for-like growth Free cash flow (€ mln)
+9.4%
8,4%
3,2%
6,9% 7,8%
2008 2009 2010 2011
14,91% 15,31% 15,16%
14,72%
2008 2009 2010 2011
+61bps +53bps
1 183 1 427
1 713 1 874
2008 2009 2010 2011
CAGR
+17%
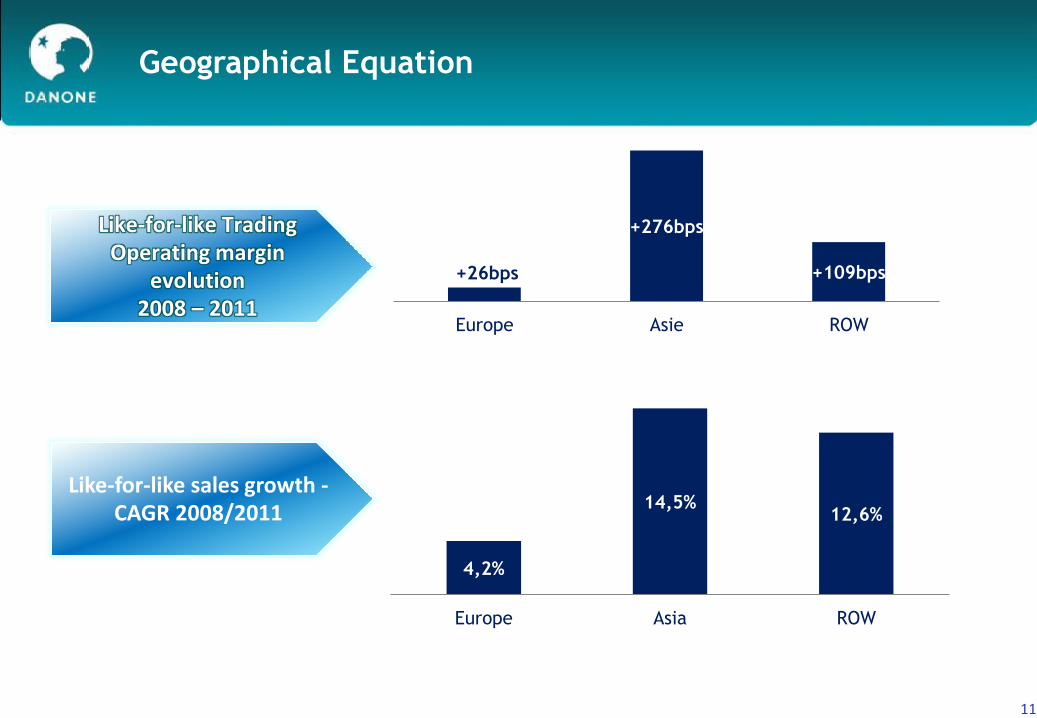
Like-for-like Trading Operating margin
evolution 2008 – 2011
Like-for-like sales growth - CAGR 2008/2011
4,2%
14,5% 12,6%
Europe Asia ROW
Geographical Equation
+26bps
+276bps
+109bps
Europe Asie ROW
11

12
Managing 2012
12
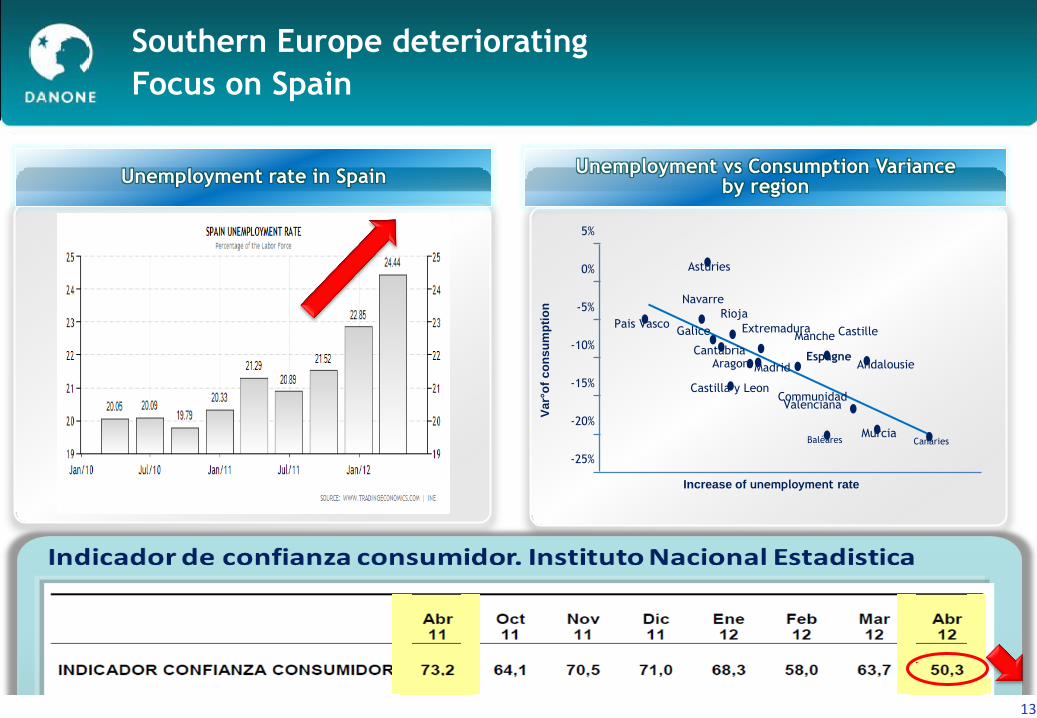
Unemployment rate in Spain
Pais Vasco
-15%
-10%
0%
5%
-5%
-25%
-20%
Va
r°o
f c
on
su
mp
tio
n
Asturies
Navarre
Rioja
Extremadura
Espagne
Castille Manche
Andalousie
Galice
Cantabria Aragon Madrid
Castilla y Leon Communidad Valenciana
Murcia Baléares Canaries
Increase of unemployment rate
Unemployment vs Consumption Variance by region
Southern Europe deteriorating
Focus on Spain
13
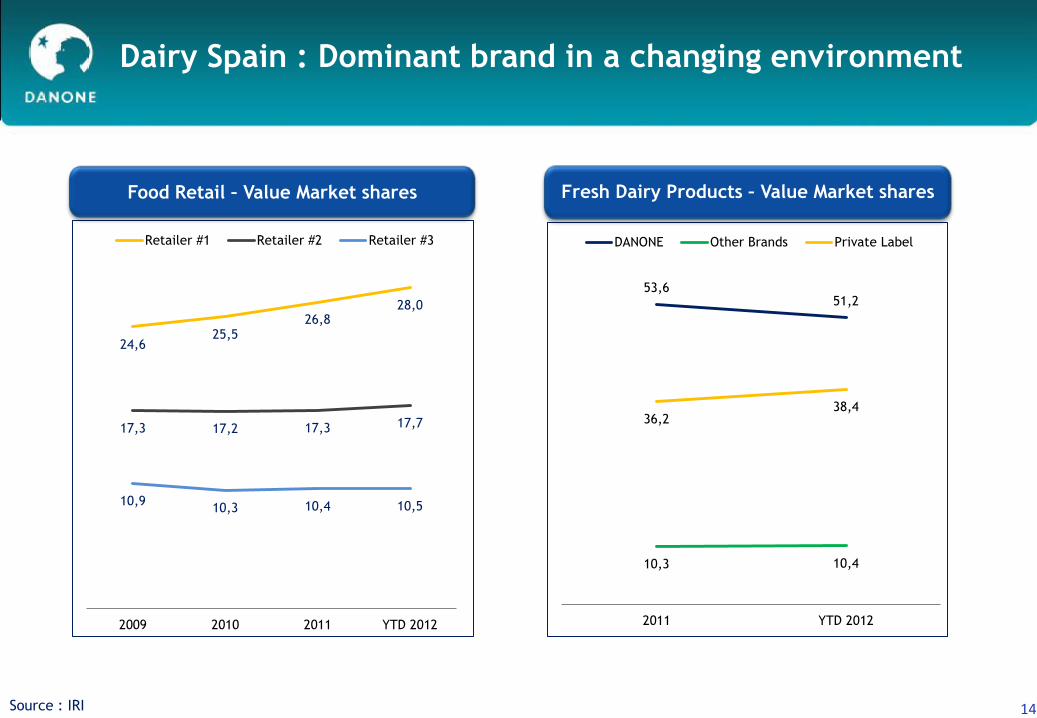
Dairy Spain : Dominant brand in a changing environment
24,6 25,5
26,8 28,0
17,3 17,2 17,3 17,7
10,9 10,3 10,4 10,5
2009 2010 2011 YTD 2012
Retailer #1 Retailer #2 Retailer #3
53,6 51,2
10,3 10,4
36,2 38,4
2011 YTD 2012
DANONE Other Brands Private Label
Source : IRI
Fresh Dairy Products – Value Market shares Food Retail – Value Market shares
14
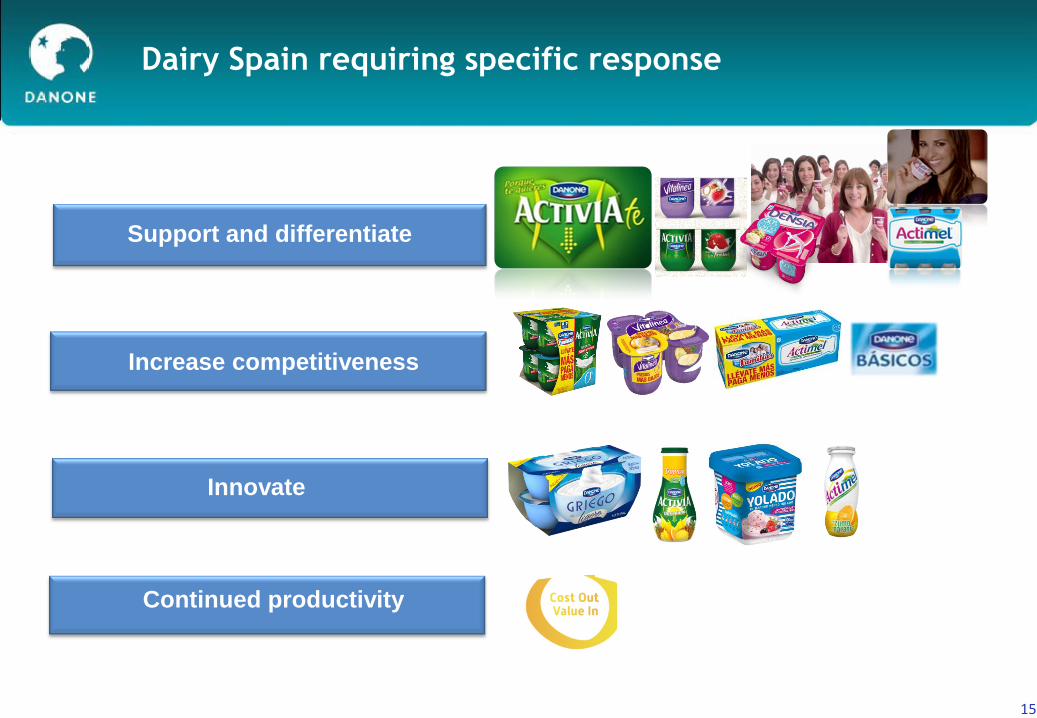
Dairy Spain requiring specific response
Support and differentiate
Innovate
Continued productivity
Increase competitiveness
15
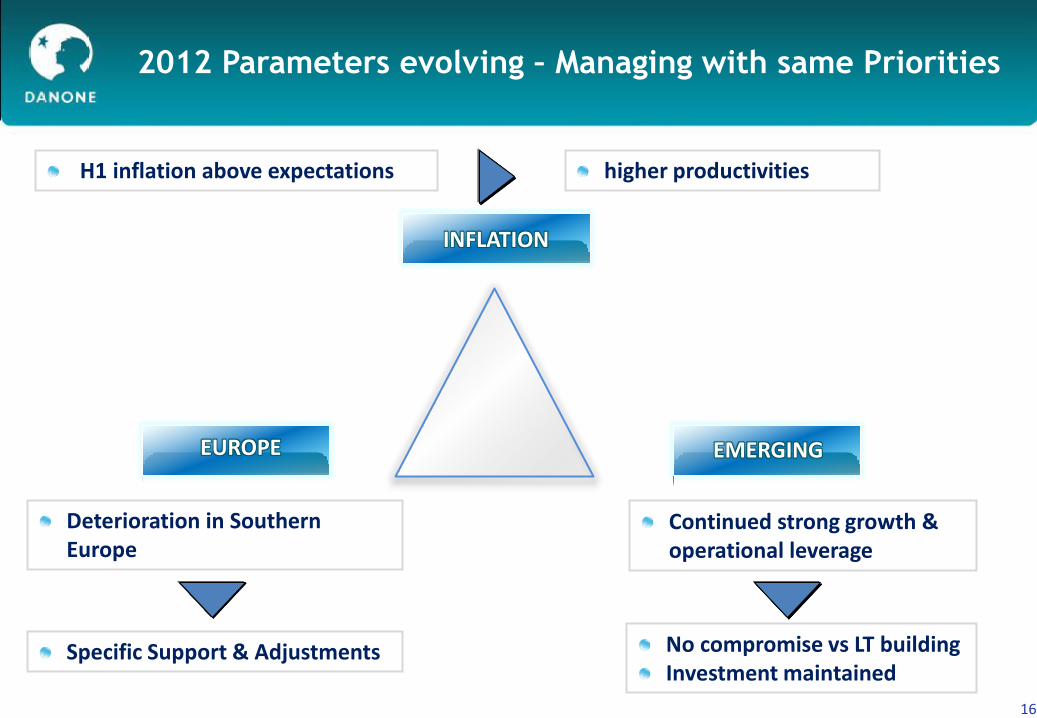
EUROPE
INFLATION
EMERGING
Specific Support & Adjustments No compromise vs LT building Investment maintained
2012 Parameters evolving – Managing with same Priorities
higher productivities H1 inflation above expectations
Deterioration in Southern Europe
Continued strong growth & operational leverage
16
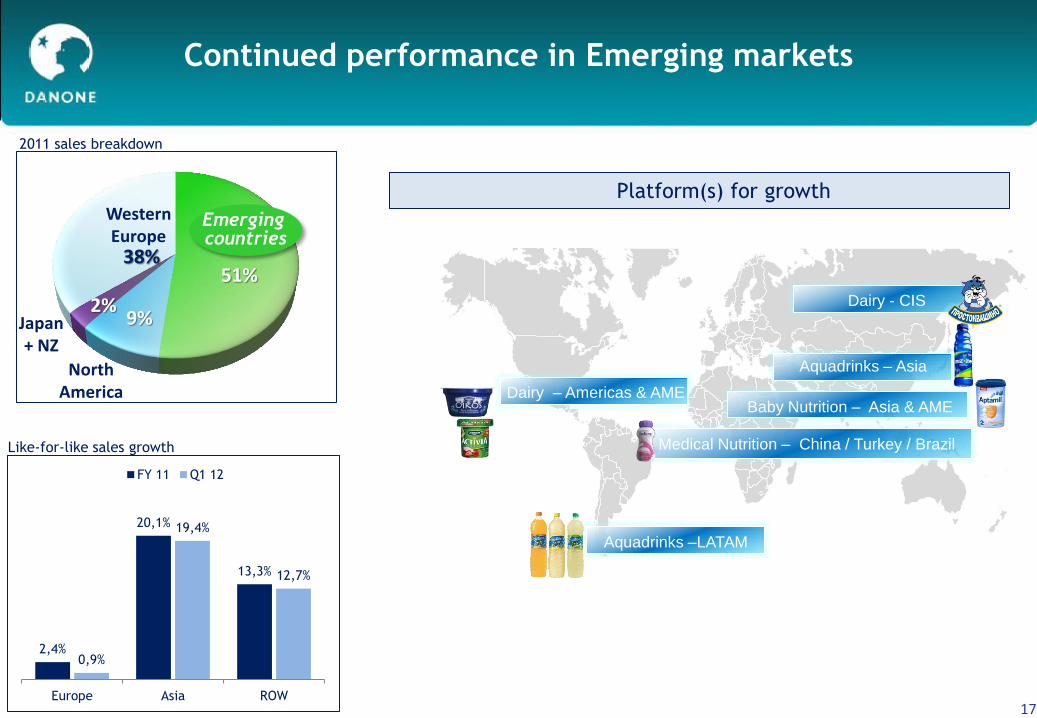
Continued performance in Emerging markets
Like-for-like sales growth
17
North America
Emerging countries
51%
9%
38%
Japan + NZ
Western Europe
2%
Aquadrinks – Asia
Aquadrinks –LATAM
Baby Nutrition – Asia & AME Dairy – Americas & AME
Medical Nutrition – China / Turkey / Brazil
Platform(s) for growth
Dairy - CIS
2,4%
20,1%
13,3%
0,9%
19,4%
12,7%
Europe Asia ROW
FY 11 Q1 12
2011 sales breakdown
17
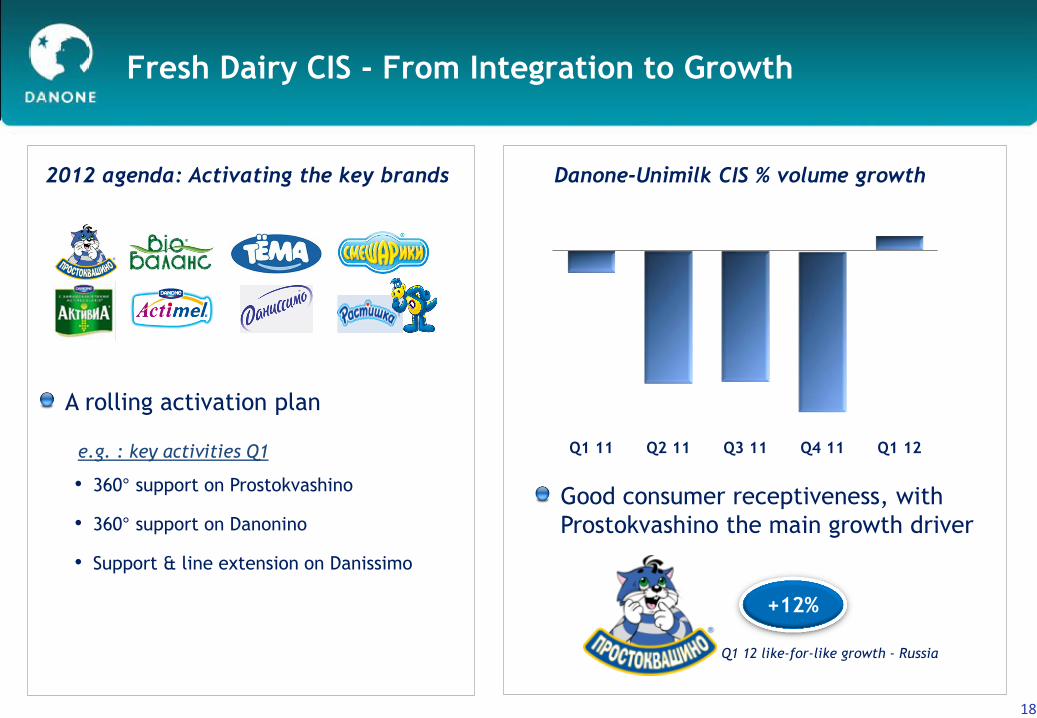
Fresh Dairy CIS - From Integration to Growth
Good consumer receptiveness, with
Prostokvashino the main growth driver
14%
+12%
e.g. : key activities Q1 Q1 11 Q2 11 Q3 11 Q4 11 Q1 12
Danone-Unimilk CIS % volume growth
• 360° support on Prostokvashino
• 360° support on Danonino
• Support & line extension on Danissimo
2012 agenda: Activating the key brands
A rolling activation plan
Q1 12 like-for-like growth - Russia
18
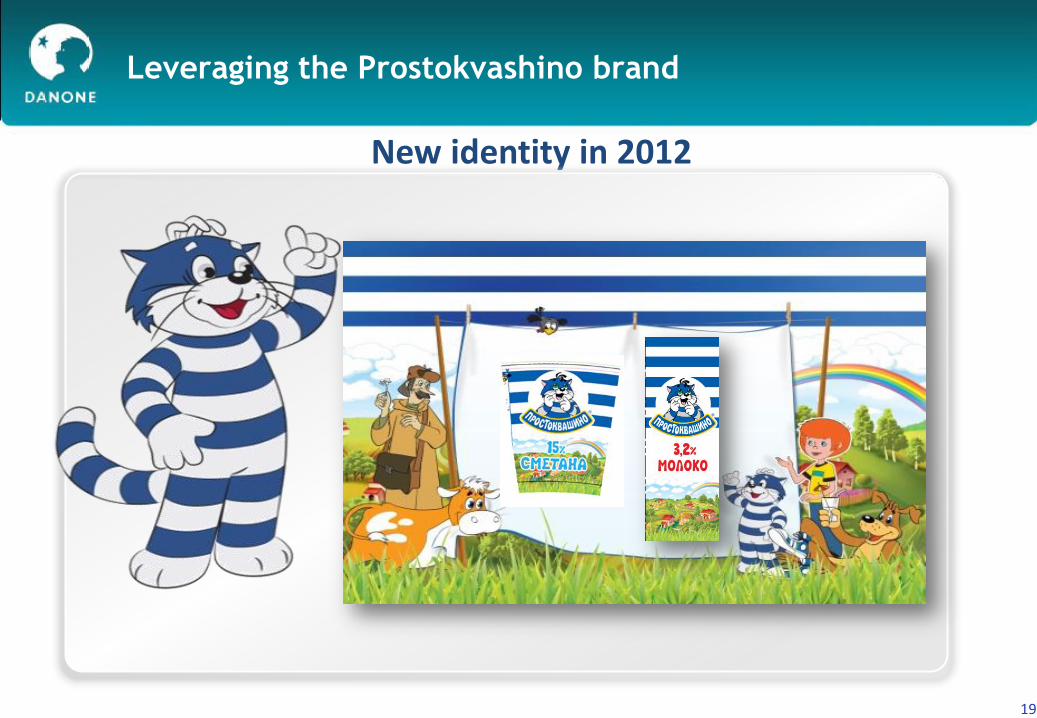
Leveraging the Prostokvashino brand
New identity in 2012
19
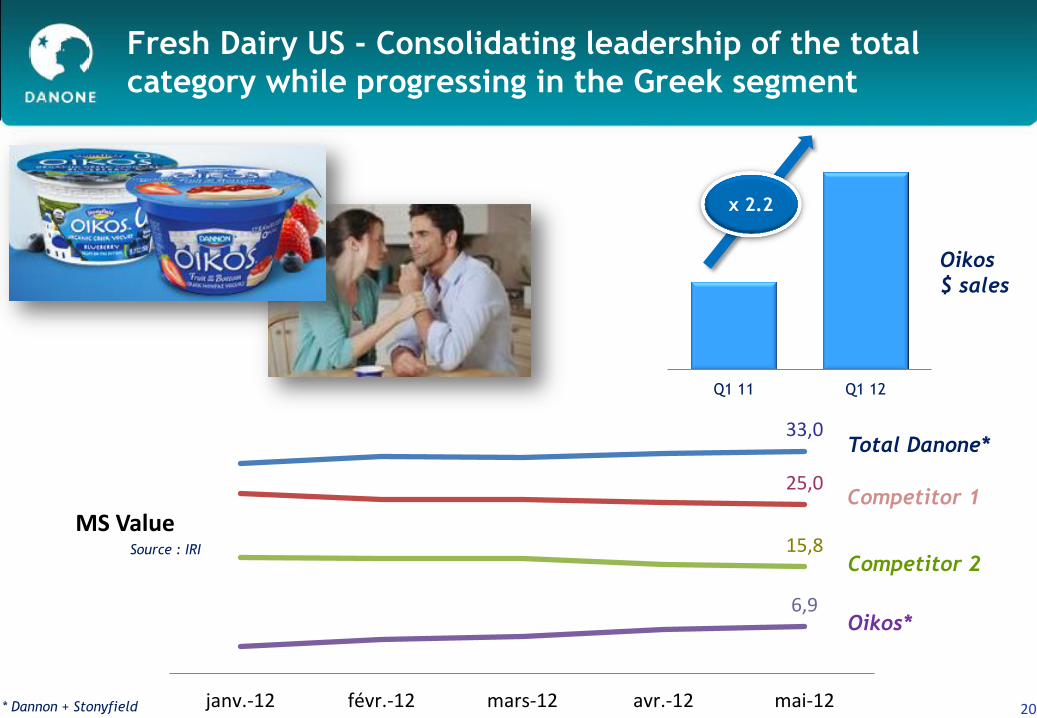
Fresh Dairy US - Consolidating leadership of the total
category while progressing in the Greek segment
Oikos
$ sales
x 2.2
20
Q1 11 Q1 12
Source : IRI
33,0
25,0
15,8
6,9
janv.-12 févr.-12 mars-12 avr.-12 mai-12
MS Value
Total Danone*
Competitor 1
Competitor 2
Oikos*
* Dannon + Stonyfield
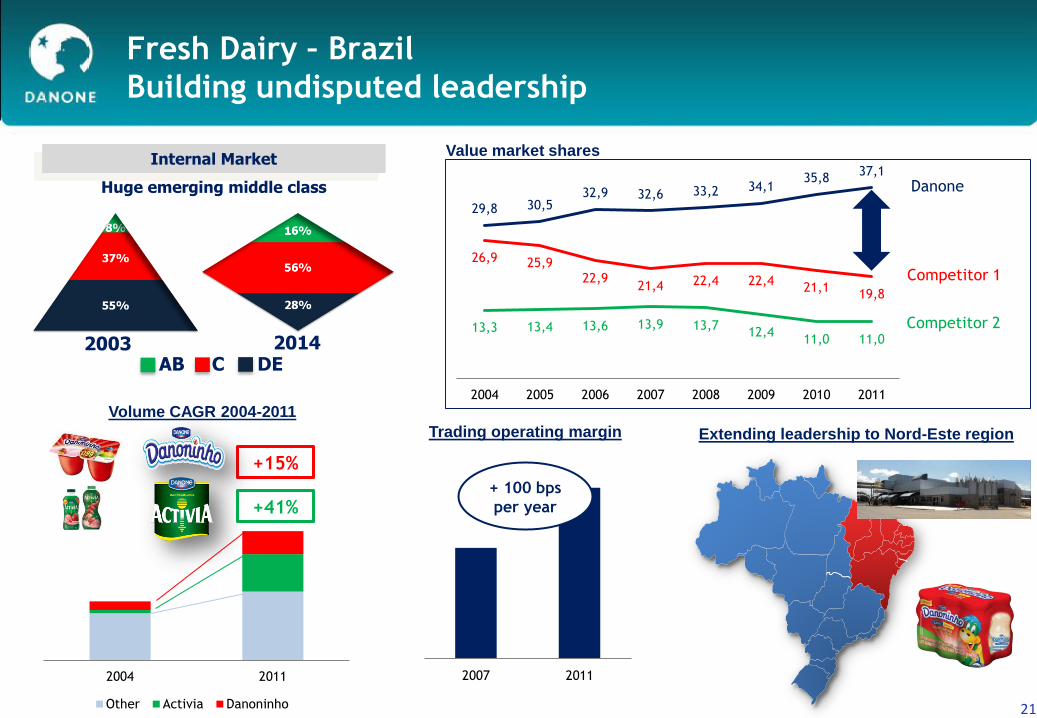
Fresh Dairy – Brazil
Building undisputed leadership
Extending leadership to Nord-Este region
Volume CAGR 2004-2011
+15%
+41%
2007 2011
Trading operating margin
+ 100 bps
per year
29,8 30,5 32,9 32,6 33,2 34,1
35,8 37,1
26,9 25,9 22,9
21,4 22,4 22,4 21,1
19,8
13,3 13,4 13,6 13,9 13,7 12,4
11,0 11,0
2004 2005 2006 2007 2008 2009 2010 2011
Danone
Competitor 1
Competitor 2
Value market shares Internal Market
Huge emerging middle class
2003 2014 AB C DE
21
2004 2011
Other Activia Danoninho
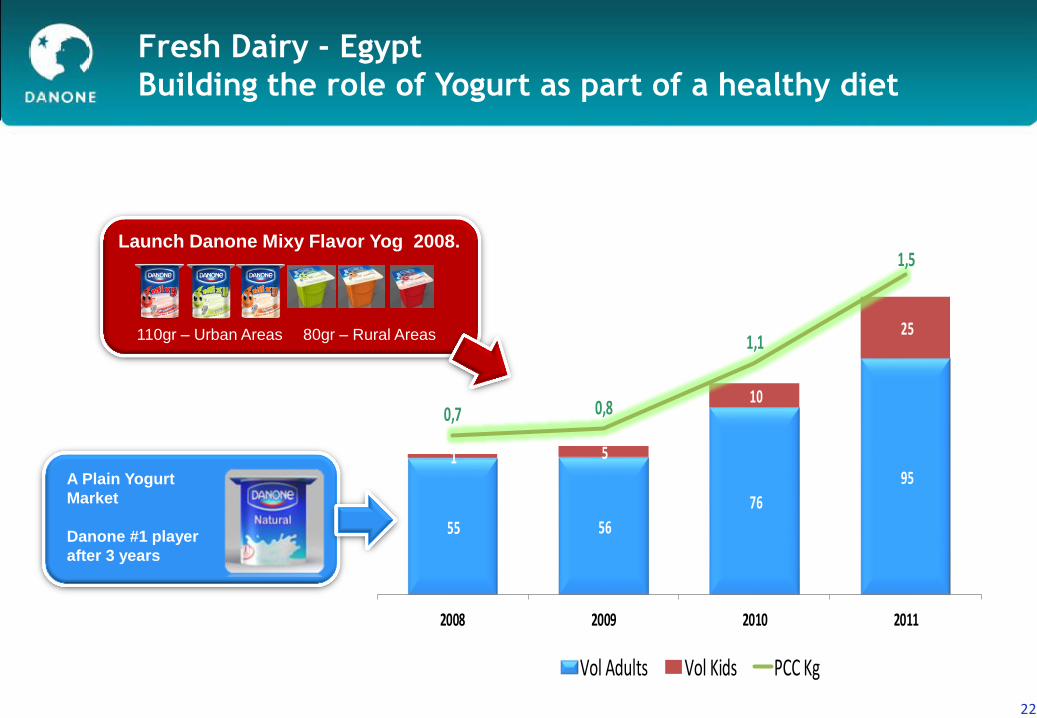
55 56
76
95 1 5
10
25
0,7 0,8
1,1
1,5
2008 2009 2010 2011
Vol Adults Vol Kids PCC Kg
Fresh Dairy - Egypt
Building the role of Yogurt as part of a healthy diet
22
Launch Danone Mixy Flavor Yog 2008.
110gr – Urban Areas
A Plain Yogurt
Market
Danone #1 player
after 3 years
80gr – Rural Areas
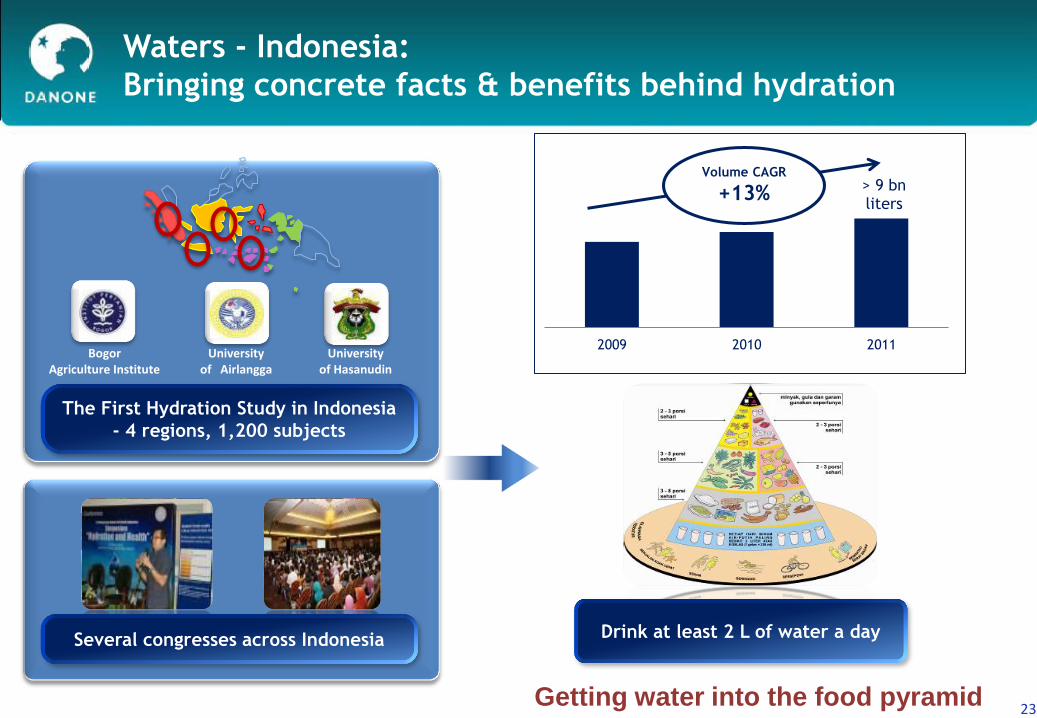
Waters - Indonesia:
Bringing concrete facts & benefits behind hydration
23
Drink at least 2 L of water a day
The First Hydration Study in Indonesia
- 4 regions, 1,200 subjects
Bogor Agriculture Institute
University of Hasanudin
University of Airlangga
Several congresses across Indonesia
Getting water into the food pyramid
> 9 bn liters
2009 2010 2011
Volume CAGR
+13%
2008 2009 2010 2011
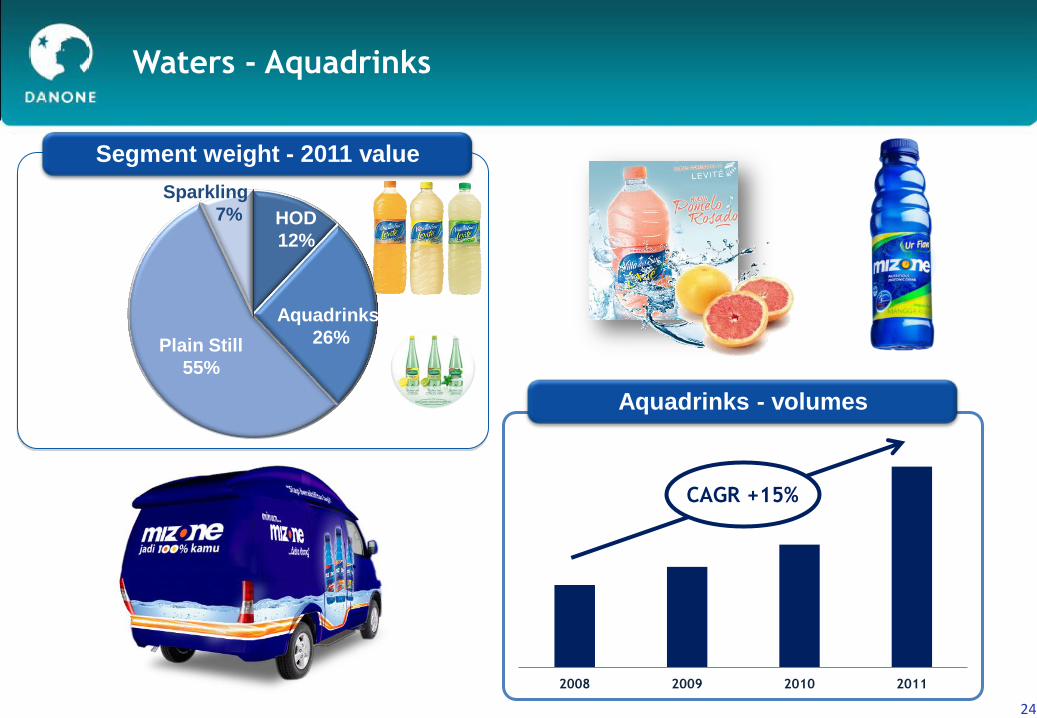
Waters - Aquadrinks
24
Segment weight - 2011 value
Plain Still
55%
HOD
12%
Sparkling
7%
Aquadrinks
26%
Aquadrinks - volumes
CAGR +15%
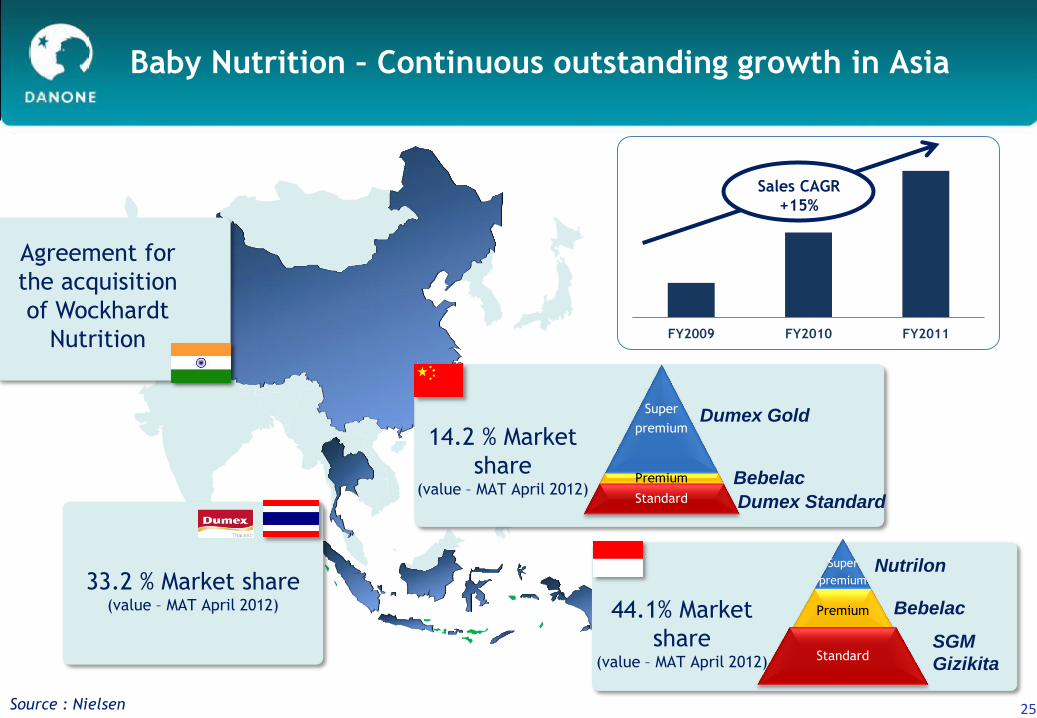
Baby Nutrition – Continuous outstanding growth in Asia
33.2 % Market share (value – MAT April 2012)
Agreement for
the acquisition
of Wockhardt
Nutrition
14.2 % Market
share (value – MAT April 2012)
Super
premium
Premium
Standard
Dumex Gold
Bebelac
Dumex Standard
44.1% Market
share (value – MAT April 2012)
Super
premium
Premium
Standard
Nutrilon
Bebelac
Source : Nielsen
FY2009 FY2010 FY2011
Sales CAGR
+15%
SGM
Gizikita
25
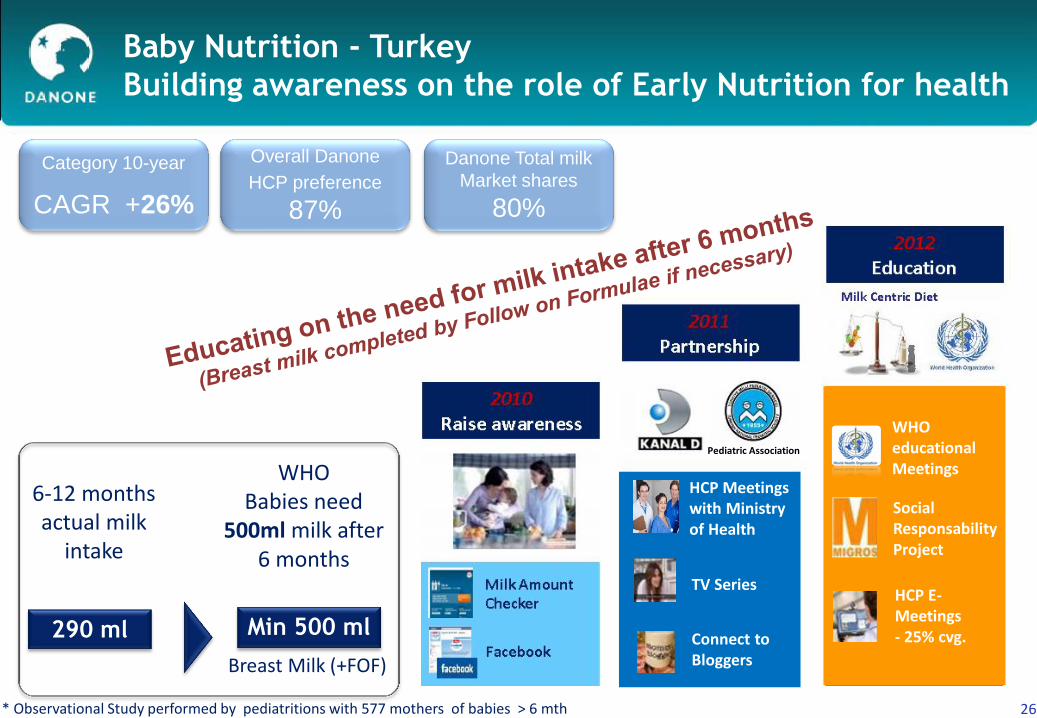
Baby Nutrition - Turkey
Building awareness on the role of Early Nutrition for health
26
WHO Babies need
500ml milk after 6 months
290 ml Min 500 ml
6-12 months actual milk
intake
Breast Milk (+FOF)
* Observational Study performed by pediatritions with 577 mothers of babies > 6 mth
HCP Meetings with Ministry of Health
Connect to Bloggers
TV Series
WHO educational Meetings
Social Responsability Project
HCP E- Meetings - 25% cvg.
Pediatric Association
Category 10-year
CAGR +26%
Overall Danone
HCP preference
87%
Danone Total milk
Market shares
80%
Call center Social Media Website
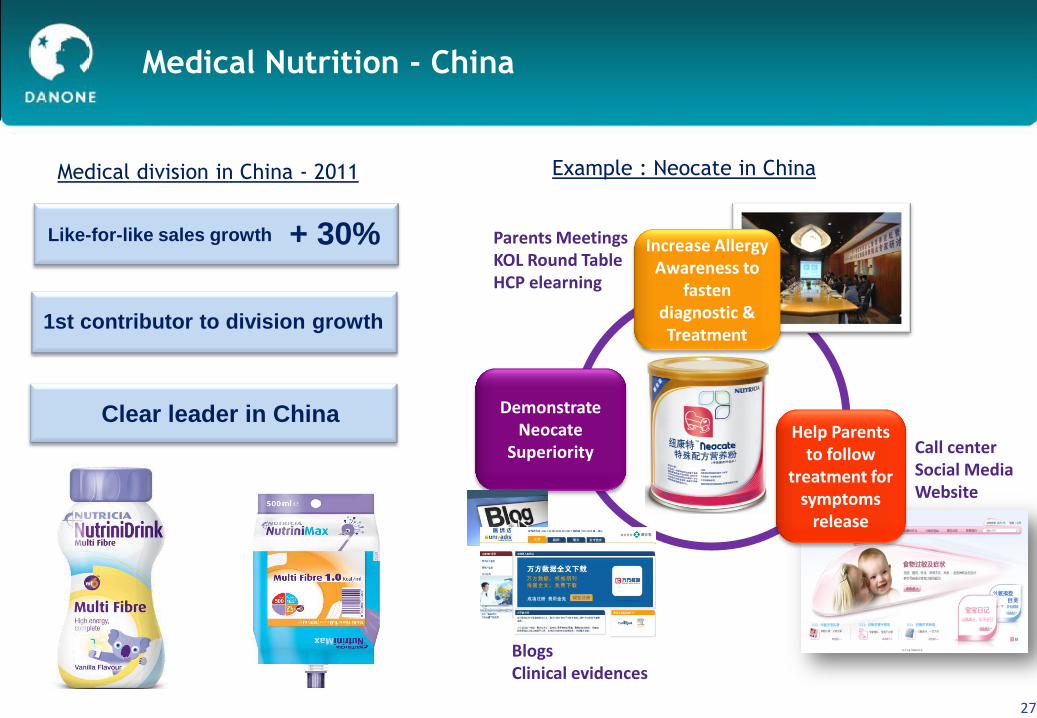
Medical Nutrition - China
Demonstrate Neocate
Superiority
Parents Meetings KOL Round Table HCP elearning
Blogs Clinical evidences
Increase Allergy Awareness to
fasten diagnostic & Treatment
Help Parents to follow
treatment for symptoms
release
Medical division in China - 2011 Example : Neocate in China
Like-for-like sales growth
Clear leader in China
1st contributor to division growth
+ 30%
27
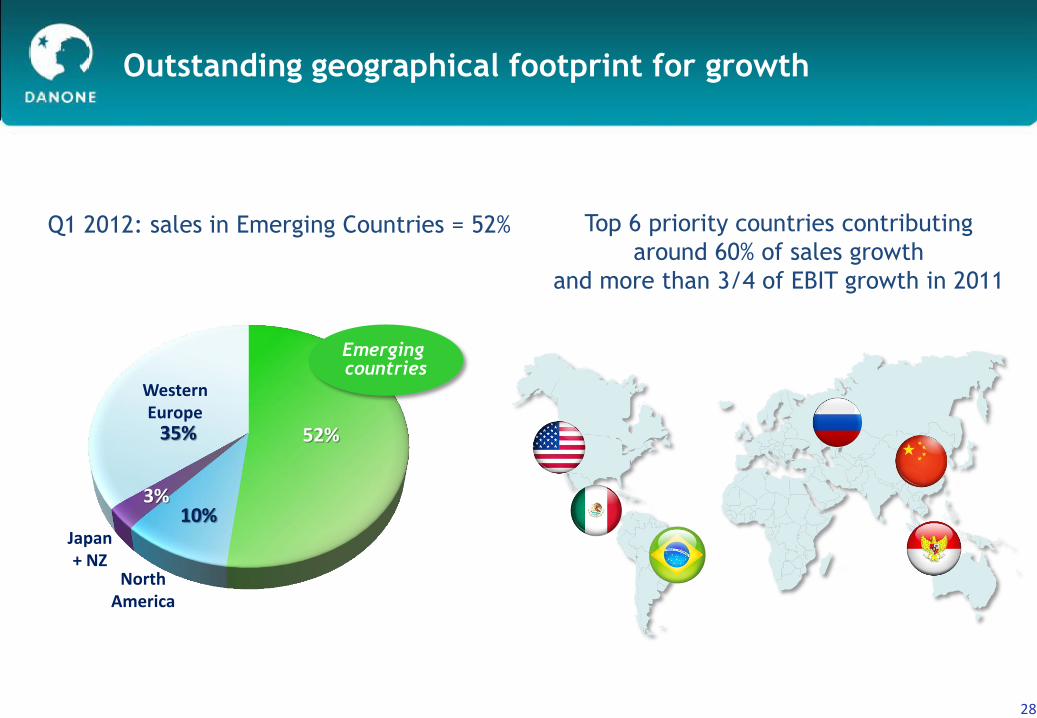
Outstanding geographical footprint for growth
28
Q1 2012: sales in Emerging Countries = 52% Top 6 priority countries contributing
around 60% of sales growth
and more than 3/4 of EBIT growth in 2011
28
North America
Emerging countries
52%
10%
35%
Japan + NZ
Western Europe
3%
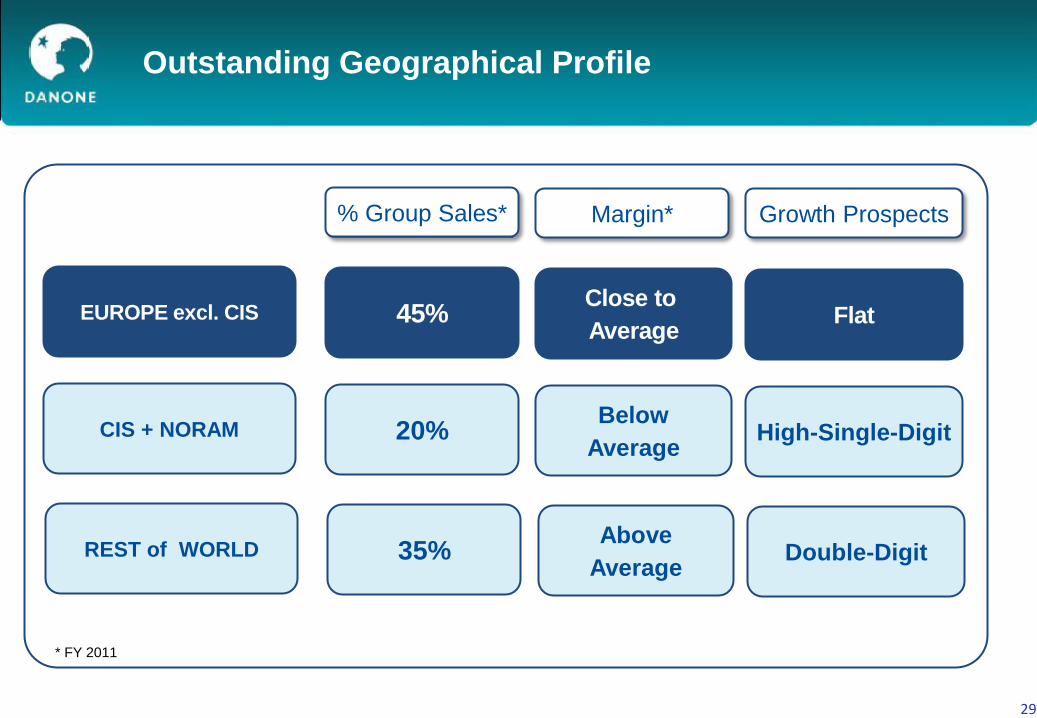
Outstanding Geographical Profile
EUROPE excl. CIS
CIS + NORAM
% Group Sales*
REST of WORLD
Margin* Growth Prospects
45%
20%
35%
Close to
Average
Below
Average
Above
Average
Flat
High-Single-Digit
Double-Digit
* FY 2011
29
Conclusion
30
• Continuous investment in the well-performing growth markets
• Specific situation addressed in Southern Europe
• 2012: Sales growth & FCF target reiterated / Margin target adjusted
• Value creation agenda adapted to the current environment
• Danone Vision & Strategic priorities unchanged
30