Embed Size (px)
Citation preview

ISSN 1518-3548 CGC 00.038.166/0001-05
Working Paper Series Brasília n. 212 Sep. 2010 p. 1-44

Working Paper Series Edited by Research Department (Depep) – E-mail: [email protected] Editor: Benjamin Miranda Tabak – E-mail: [email protected] Editorial Assistant: Jane Sofia Moita – E-mail: [email protected] Head of Research Department: Adriana Soares Sales – E-mail: [email protected] The Banco Central do Brasil Working Papers are all evaluated in double blind referee process. Reproduction is permitted only if source is stated as follows: Working Paper n. 212. Authorized by Carlos Hamilton Vasconcelos Araújo, Deputy Governor for Economic Policy. General Control of Publications Banco Central do Brasil
Secre/Surel/Cogiv
SBS – Quadra 3 – Bloco B – Edifício-Sede – 1º andar
Caixa Postal 8.670
70074-900 Brasília – DF – Brazil
Phones: +55 (61) 3414-3710 and 3414-3565
Fax: +55 (61) 3414-3626
E-mail: [email protected]
The views expressed in this work are those of the authors and do not necessarily reflect those of the Banco Central or its members. Although these Working Papers often represent preliminary work, citation of source is required when used or reproduced. As opiniões expressas neste trabalho são exclusivamente do(s) autor(es) e não refletem, necessariamente, a visão do Banco Central do Brasil. Ainda que este artigo represente trabalho preliminar, é requerida a citação da fonte, mesmo quando reproduzido parcialmente. Consumer Complaints and Public Enquiries Center Banco Central do Brasil
Secre/Surel/Diate
SBS – Quadra 3 – Bloco B – Edifício-Sede – 2º subsolo
70074-900 Brasília – DF – Brazil
Fax: +55 (61) 3414-2553
Internet: http//www.bcb.gov.br/?english
The Natural Rate of Unemployment in Brazil, Chile,
Colombia and Venezuela: some results and challenges*
Tito Nícias Teixeira da Silva Filho**
Abstract
The Working Papers should not be reported as representing the views of the Banco Central
do Brasil. The views expressed in the papers are those of the author(s) and do not
necessarily reflect those of the Banco Central do Brasil.
This paper summarises the research results obtained by the group of central banks
(Brazil, Chile, Colombia and Venezuela) that joined the research program on the
Natural Rate of Unemployment – under the coordination of the Central Bank of
Brazil – within the Joint Investigation on Non Observable Variables Project, and
whose final results were presented at the XII Meeting of the Network of America
Central Bank Researchers (CEMLA) held at Madrid in November 2007. The
evidence obtained shows that the natural rate of unemployment is estimated with
great uncertainty: besides sizable parameter uncertainty, estimates are very
sensitive to the particular method used. This marked imprecision reflects the
difficulties and challenges involved in the natural rate’s estimation. Nonetheless,
the research also shows that there seems to be much room available for
improvement, especially those stemming from a more careful modelling process
and better care with the data, particularly regarding supply shocks proxies, given
their importance in inflation dynamics. Indeed, this “channel” seems to be the most
promising one to both narrow down the uncertainty about the NAIRU and improve
the reliability of inferences.
Keywords: Natural rate of unemployment, NAIRU, unemployment gap, Phillips
Curve, inflation.
JEL Classification: E24, E32, J60.
* I would like to thank Fabio Araujo. I am also grateful to Jorge Restrepo and León Bujanda for providing
the data for Chile and Venezuela, respectively. This paper is the original English version (with minor
changes), still unpublished, of the paper “La Tasa Natural de Desempleo en Brasil, Chile, Colombia y
Venezuela: Algunos resultados y Desafíos”, that was published in the book “Estimación y Uso de
Variables no Observables en la Región. Centro de Estudios Monetarios Latinoamericanos (CEMLA),
Mexico D. F., Abril 2008”. **
Central Bank of Brazil. E-mail: [email protected].
3
1 – Introduction
This paper summarises the research results obtained by the group of central
banks [see da Silva Filho (2008) for Brazil, Restrepo (2008) for Chile, Arango et al.
(2007) for Colombia and Bujanda (2008) for Venezuela] that joined the research
program on the Natural Rate of Unemployment – under the coordination of the Central
Bank of Brazil – within the project “Investigación Conjunta Sobre Variables No
Observables” (Joint Investigation on Non Observable Variables), and whose final
results were presented at the “XII Reunión de la Red de Investigadores de Bancos
Centrales del Continente Americano (CEMLA)” (XII Meeting of the Network of
America Central Bank Researchers) held at Madrid in November 2007.1 The project
proved to be highly beneficial to all participants not only due to the exchange of
valuable experiences and ideas between the central banks, but also for being a catalyst
for starting or deepening the research about the natural rate of unemployment within
each central bank.
The project also included joint investigation on three other non observable
variables: potential output, the real equilibrium exchange rate and the natural rate of
interest. Among the eleven central banks that joined the research project, the ones from
Brazil, Chile, Colombia and Venezuela were the ones who joined the program on the
natural rate of unemployment. The small number of participants in the natural rate of
unemployment group – the smallest group – especially in relation to the large number of
participants in the potential output group – the largest group – is the first issue to be
called to attention. This “observable gap” is puzzling since one crucial input in potential
output’s estimation – at least in the production function method – is precisely the
estimate of the natural rate of unemployment. This fact raises two possibilities: either
the popular production function method was not widely used to calculate potential
output – which was not actually the case – or some other simple, possibly mechanical,
easily obtainable, natural rate estimation method was used. Indeed, the method used in
those cases was the widely known HP filter. This state of affairs is worrisome, since the
HP filter has important limitations and drawbacks. Indeed, as argues da Silva Filho
(2008) “… the HP filter has frequently been much more of a curse than a solution to the
profession, often preventing economists to delve into the subject at hand.”
1 Evidently, the results are said to be “final” in the sense that the joint project formally ended in
November 2007. However, all the research efforts certainly continue within each central bank.
4
Despite the apparent low interest on the natural rate of unemployment estimation
(within the research project), it is hard to overstate its importance in macroeconomics,
whether theoretically or empirically. For example, the natural rate plays a crucial role in
two key macroeconomic concepts: money neutrality and potential output. Moreover,
despite much controversy (see Stock and Watson (1999) and Atkeson and Ohanian
(2001) for two opposing views), the Phillips Curve (PC) framework is considered by
many economists a precious tool for predicting inflation. Blinder (1997), for example,
has praised the reliability of the PC framework by stating that it is ‘[…] the “clean little
secret” of macroeconometrics.’ Also, thinking about the natural rate of unemployment
force us to think about the labour market structure, and labour-market-related indicators
such as wages and productivity.2
The paper is organised as follows: Section 2 defines the natural rate of
unemployment and provides a brief analysis of the debate on whether or not the natural
rate of unemployment and the NAIRU can be regarded as synonyms. Section 3 presents
the methods that were used by each central bank participant in order to estimate the
natural rate of unemployment for the respective countries. Section 4 summarizes the
estimation results for each country and looks if there are empirical regularities between
them from a labour market perspective. Section 5 provides a brief assessment on the
approaches used and results obtained. Section 6 concludes the paper.
2 – The Natural of Unemployment
The difficulties surrounding the natural rate of unemployment estimation go far
beyond the fact that not only is it a non observable variable but it is usually estimated
very imprecisely (see Staiger et al., 1996).3 Actually, economists are not even able to
agree on what it means and, thus, on the best estimation strategy. The concept of the
natural rate of unemployment was proposed by Friedman (1968) who – inspired by
2 Of course, there are other methods to calculate potential output that do not use the natural rate of
unemployment as an input (e.g. univariate methods). Similarly, besides the Phillips Curve, the literature
lists other methods to calculate the natural rate of unemployment. 3 In order to provide some idea on the degree of uncertainty surrounding NAIRU estimates, it is useful to
mention the confidence intervals obtained by Staiger et al. (1996) for the US – which could be considered
a lower bound for other countries. They found 95% confidence intervals for the NAIRU spanning almost
four percentage points (3.9%–7.6%) when inflation was measured by the CPI and nearly two and a half
points (4.5%–6.9%) when the core CPI was used instead. Moreover, note that the confidence intervals
found in the literature (including Staiger et al., 1996) are based on parameter uncertainty only. If model
uncertainty is also taken into consideration uncertainty will be even greater.
5
Wicksell’s concept of the natural rate of interest – stated in his presidential address to
the American Economic Association that “The natural rate of unemployment, in other
words, is the level which would be ground out by the Walrasian system of general
equilibrium equations, provided that there is embedded in them the actual structural
characteristics of the labour and commodity markets, including market imperfections,
stochastic variability in demands and supplies, the cost of gathering information about
job vacancies and labour availabilities, the costs of mobility, and so on.”4
Although (price or wage) inflation is not explicitly mentioned in this widely
cited definition – which highlights the natural rate’s structural determinants – it is
straightforward to infer that whenever real wages (adjusted for productivity) are
changing the labour market could not be in equilibrium. Indeed, the link (or its absence)
between the (natural) rate of unemployment and inflation was made explicit by
Friedman himself soon afterwards, as he stated “You will recognize the close similarity
between this statement [the above definition] and the celebrated Phillips Curve. The
similarity is not coincidental.”5 He then continued his speech so as to argue that in the
long run the PC is vertical at the natural rate of unemployment. Hence, it is not
surprising that many economists have been using the PC framework in order to estimate
the natural rate of unemployment. While the PC emphasizes wage rigidities and
inflation expectations, the above definition emphasizes the structural factors behind the
unemployment, including imperfections and rigidities of other nature as well.
However, some economists [e.g. Tobin (1998) and King (1998)] argue that this
approach does not provide estimates of the natural rate of unemployment, but rather
estimates of the non-accelerating inflation rate of unemployment – the so-called
NAIRU6 – a concept created by Modigliani and Papademos (1975).
7 More recently a
4 The same concept was concomitantly developed by Phelps (1968), although he called it the steady-state
equilibrium unemployment rate. 5 Actually, when explaining the concept of the natural rate of unemployment Friedman also emphasized
wage developments. Although this part of Friedman’s explanation is usually ignored, he had just said that
“At any moment in time, there is some level of unemployment which has the property that is consistent
with equilibrium in the structure of real wage rates. At that level of unemployment, real wages are
tending on the average to rise at a “normal” secular rate, i.e., at a rate that can be indefinitely maintained
so long as capital formation, technological improvements, etc, remain on their long-run trends. A lower
level of unemployment is an indication that there is an excess demand for labour that will produce upward
pressure on real wage rates. A higher level of unemployment is an indication that there is an excess
supply of labour that will produce downward pressure on real wage rates. The “natural rate of
unemployment,” in other words, is the level that would be grounded ...” 6 Note that this acronym is a misnomer. The correct one would be the non-increasing inflation rate of
unemployment (NIIRU). Another option could be non-accelerating price level of unemployment
(NAPLU).
6
taxonomy for the NAIRU has been proposed (see Richardson et al., 2000): the short-run
NAIRU, the NAIRU and long-run equilibrium rate of unemployment (i.e. akin to the
natural rate), which differ from each other according to the time frame they refer to and
to what kind of shocks are considered. On the other hand, many economists do consider
the concepts natural rate of unemployment and NAIRU as synonyms (e.g. Gordon,
1997; Staiger et al., 1997; Stiglitz, 1997; Mankiw, 2001; Ball and Mankiw, 2002). Here
as well both concepts are used interchangeably.
The major reason for that understating is that – in my point of view – when
interpreted literally, the NAIRU not only could be misleading but is a poor guide for
monetary policy. Several reasons concur for that. First, although the NAIRU concept
focuses exclusively on (short run) inflation stability, agents read it as a structural labour
market indicator, one which would reflect whether or not the labour market has some
spare capacity available at any given moment. However, since it is perfectly possible to
have, at the same time, the unemployment rate below the (literal) NAIRU and above its
equilibrium level, the concept could be misleading. Such a situation – which is actually
common – could arise due to adverse supply shocks, and would cause the wrong
impression that the labour market is overheated when, in fact, it is not. Second, since
inflation is likely to be volatile in the short and medium run, so will be the NAIRU.
Therefore, the NAIRU is unlikely to provide a good operational guide for monetary
policy. Indeed, a target that keeps moving cannot be seen as a useful benchmark, and
could end up providing more noise than signal.
Third, policy advices based on the (literally interpreted) NAIRU framework –
i.e. the policymaker counteracts any inflationary/deflationary episodes by changing the
unemployment rate – not only will not be optimal but is likely to produce undesirable
outcomes. For example, such a strategy will require frequent and large changes in the
interest rate, which will generate excess volatility in unemployment and output,
decreasing welfare. Moreover, if inflation increases because of adverse supply shocks,
then the best monetary policy strategy advises not to react to the first round inflationary
effects.8 Also, given that opposite shocks might hit the economy within a short time
interval, attempts to stabilise inflation might end up causing just the opposite result.
Fourth, if the policymaker does want to stabilise inflation using the “literal NAIRU
7 Actually, they called it the non-inflationary rate of unemployment (NIRU), which is also inadequate
since inflation need not be zero when unemployment coincides with its natural rate. 8 Moreover, many economists consider that interest rate smoothing is an important feature of optimal
monetary policy.
7
strategy” it probably won’t be well succeeded, given that the lags on the transmission
mechanism of monetary policy will prevent that.
Hence, the NAIRU would only be a useful and sensible guide for monetary
policy as long as it is likely to reflect structural unemployment. In that case it would be
a much more stable indicator, especially in the short-run. In other words, the NAIRU is
useful only if it is not understood literally. Put differently, it is useful only as it moves
towards the natural rate concept.9 And how can be that accomplished? Basically, to a
large extent, by taking into account those factors that could change the short-run trade
off between inflation and unemployment (e.g. supply shocks).
This assessment has direct consequences on the way the NAIRU is (or should
be) estimated, since those shocks must be included in the PC specification. As a matter
of fact, they always must be taken into account, otherwise NAIRU estimates will be
biased (and more volatile), unless the former are uncorrelated with unemployment,
which is unlikely. Furthermore, by identifying and incorporating relevant shocks into
the model – whether benign or adverse – one gets a better understanding of the inflation
dynamics, enhancing transparency and communication. For example, it becomes easier
for the central bank to explain increases in the interest rate in a scenario where the
economy is operating below its potential. Similarly, if, say, there is an increase in trend
productivity, the central bank can decrease interest rates allowing the unemployment
rate to fall – at least for a while – below what is thought to be the natural rate. Indeed,
such a situation reminds one of what occurred in the second half of the 1990s in the
U.S.
However, one might still argue that even taking shocks into account PC-based
NAIRU estimates are still unable to fully reflect structural unemployment, since the
natural rate determinants are not explicitly modelled. This is probably right, but
structural models are not a panacea as well. Not only is there no consensus about the
best structural model to use, but many factors that are thought to affect the natural rate
are very difficult to be accounted for, such as institutional features and policies. Hence,
there is no guarantee that a structural approach will deliver clear superior results than
the PC framework. Finally, even though the latter does not provide a framework that
explicitly models the natural rate determinants, if supply shocks are successful
accounted for, the resulting NAIRU estimate should provide a good approximation of
9 Note that the NAIRU concept converges to the natural rate concept if one thinks about it as the non-
increasing medium/long run inflation rate of unemployment.
8
the structural unemployment.
Anyway, it should be pointed out from the outset that all central banks that
joined the natural rate of unemployment research project used the PC framework
intensively – although other methods were also used – which means that they ended up
treating both concepts as synonyms.
3 – Methodologies
This section presents the methods that were used by the group of four central
banks that joined the natural rate of unemployment project. Although they are not
exhaustive, they encompass the main methods that have been used in the literature to
estimate the natural rate of unemployment.
3.1 – Reduced Form Methods: The Phillips Curve-Based Framework
The most popular method for estimating the natural rate of unemployment is the
Phillips Curve (PC) framework, which relates inflation to a measure of slackness in the
economy, usually either the output gap or the unemployment gap. This framework –
which despite its simplicity is very flexible – presents a very interesting balance
between a-theoretical approaches, like purely statistical filters, and structural methods.
Indeed, the Phillips Curve can be obtained as the reduced form of several types of
structural models. It is not surprising, therefore, that it has been widely used by
economists (e.g. Congressional Budget Office, 1994; Gordon, 1997; Staiger et al., 1996;
Stock and Watson, 1997; Ball and Mankiw, 2002), and policymakers.10
In its general specification the Phillips Curve could be stated as
( ) ( )( ) ( )t
n
tttt LuuLL εγβπαπ ++−+∆=∆ − tx1, tε ~ NID ( )2,0 εσ (1)
where ( ) ( ) , LL βα and ( )Lγ are lag polynomials, tt CPIln∆=π , tu is the (seasonally
adjusted) unemployment rate, ntu is the unobservable (and possibly time-varying)
natural rate of unemployment and xt is a vector of other inflation determinants, among
which supply shocks play a central role.
10
It is also the preferred method of the OECD.
9
Note that equation (1) implicitly assumes a vertical PC and random-walk
expectations (i.e. 1−= tet ππ ). Not only such an assumption has been widely used
elsewhere (e.g. Gordon, 1997; Staiger et al., 1996; Stock and Watson, 1997; Ball and
Mankiw, 2002), but random-walk inflation forecasts have proven to be a very tough
benchmark to beat (e.g. Stock and Watson, 1999; Gavin & Mandal, 2003).
One particular case of interest is obviously the one in which the NAIRU is
assumed to be constant. In that situation equation (1) simplifies to
( ) ( ) ( ) 1 tttt LγuLβLαc εππ +++∆+=∆ − tx (2)
and the NAIRU could be easily estimated by OLS, since it is simply the (negative) ratio
of the constant term to the sum of the coefficients on lagged unemployment (equation
3).
( )1βcu −= (3)
However, in such a case one difficulty comes from assessing how precise are
NAIRU’s estimates, given that it is a nonlinear function of regression coefficients. Two
methods have been used for calculating uncertainty about the NAIRU. The first is the
so-called Delta Method, which uses a first order Taylor series approximation to the non
linear estimator (3) in order to derive its asymptotic variance. The second one is the so-
called Gaussian Method, which uses the duality between hypothesis testing and
confidence intervals to calculate the latter at any desired significance level.11
Before proceeding, it is important to note that any supply shock that enter the PC
needs to be normalised so that it has a zero net effect on the NAIRU estimation,
otherwise the estimate will be biased whenever the shock does not have a zero mean.
As mentioned before, one appealing feature of the PC framework is its
flexibility. Indeed, it can be used, for example, together with the unobserved
components (UC) technology when one wants to allow for the possibility of a time-
varying NAIRU (TV-NAIRU). In this case instead of carrying out a non linear
estimation of (1), one can express the model in state space form and estimate it by
11
For more details on the two procedures – and evidence on which one seems to be the best – see Staiger
et al. (1996).
10
maximum likelihood using the Kalman Filter. One advantage of this approach is that the
NAIRU can be allowed to vary without having to specify its determinants. Yet, one
must specify a statistical model for the NAIRU.
One popular statistical assumption is that the NAIRU evolves according to a
random walk. Equations (4) and (5) illustrate this approach using the random walk
assumption. Note that if ( ) 0var =tξ then the model (4)–(5) collapses into model (2)–(3).
( ) ( )( ) ( ) tntttt LγuuLβLα εππ ++−+∆=∆ − tx1 ( )2
0~ εt ,σNIDε (4)
tnt
nt uu ξ+= −1 ( )2,0~ ξσξ NIDt , ( ) 0, =ttE ξε (5)
Other possibility for estimating a TV-NAIRU is to use the Ball and Mankiw
(2002) approach, which is a two-step procedure that starts from a version of the PC
without supply shocks, and that assumes a constant NAIRU. Equation (6) shows the
resulting PC specification in this case (dynamics are ignored for simplicity):
tt
n
t βuβu επ +−=∆ (6)
which could be rewritten as
β
π
β
ε tt
tnuu
∆+=+ (7)
Note that while the l.h.s. of (7) is non observable – since it contains the NAIRU
– the r.h.s. could be used as an estimate, since it can be calculated from the available
data on unemployment and inflation (given the OLS estimate of β). Then, in the second
step an HP filter – see equation (10) – is applied to the r.h.s. in order to extract the
underlying trend, which is considered to reflect the NAIRU.
Another possibility for estimating a TV-NAIRU within the PC framework is to
use a spline as the statistical model for the NAIRU. In such a setting the NAIRU is
assumed to vary slowly over time. Similarly to the B&M method, this method can be
easily implemented through OLS estimation. In this case the PC could be stated as
11
( ) ( ) ( ) ttttt LuLLS εγβπαφπ +++∆+′=∆ − tx1 (8)
( )LSu tnt βφ′−= (9)
where ( )φβφ ′−=′ L , tnt Su φ ′= and St is a vector of deterministic functions of time.
Usually a cubic spline is assumed.12
Yet, another possibility for calculating a TV-NAIRU using the PC framework is
to take into account demographic and structural changes in the labour force. For
example, in a situation in which the share of young workers – which are more
inexperienced and have a higher job turnover rate – in the labour force is increasing
over time, not only the unemployment rate is expected to rise but the natural rate of
unemployment is likely to increase as well. The same phenomenon happened in several
countries in recent decades as women began to join the labour force. More generally,
whenever the relative share of labour force groups change the natural rate of
unemployment is also likely to change. Consequently, this approach tries to estimate
(possibly different) natural unemployment rates for different labour force groups –
whether divided by gender, race, experience, qualifications, etc – and then aggregate
them so as to obtain an estimate of the overall natural rate of unemployment.
In order to implement this strategy a reference group is elected – usually the
most employable group, i.e. the one with the lowest and most stable unemployment
rates – and its natural rate is calculated using the PC method, assuming that within each
group it remains constant.13
Subsequently, all the other groups’ natural rates are
estimated based on regressions relating the reference group unemployment rate to each
group’s unemployment rate. Finally, the disaggregated natural rates are weighted by
their respective labour force group shares so as to come up with an estimate of the
aggregated natural rate.14
Note that all the above methods estimate the NAIRU taking explicitly into
account the link between inflation and unemployment. Moreover, as mentioned above,
despite its simplicity, the Phillips curve has a clear theoretical content, being a reduced
12 In the two knots case ( ) ( )[ ]3
223
1132
0 ttDttDtttSt −−= β , where 11
11
t tif 1
t tif 0
≥=
<=
D
D and
22
22
t tif 1
t tif 0
≥=
<=
D
D.
13 Hence, note that even assuming constant natural unemployment rates within each group, the overall
natural rate can change due to changes in the composition of the labour force. 14
For an example of this approach see Weiner (1993).
12
form compatible with several structural methods.
3.2 – Univariate Methods
Univariate methods aim at obtaining NAIRU estimates by focusing exclusively
on the unemployment series. That is, neither inflation nor any other information besides
the unemployment series itself is used. The key assumption behind those methods is
that the unemployment trend can be read as the potential level of the variable. The
disagreement lies precisely on what is considered being part of the trend and what it is
not.
Among the main univariate methods there are the so-called filters. Filters have
been extensively used to extract “potential” levels of economic variables. There are
many options available in the literature like the Kalman Filter, the Baxter and King
Filter, the Beveridge and Nelson decomposition, etc. Among those filters, the one that
has been most widely used, due mainly to its simplicity, is the Hodrick-Prescott filter,
which is given by the following minimization problem.
{ }( ) ( ) ( )[ ]
−−−+− ∑∑−
= −+==
21
2 11
2
1lnlnlnlnlnln
1
T
t
nt
nt
nt
nt
T
t
ntt
u
uuuuuuMinT
t
nt
λ (10)
Note that while the first term tries to maximise the fit (i.e. the maximum fit
would mean that the variable and the trend coincide) the second tries to maximise the
smoothness of the trend (or, in other words, impose a penalty for the goodness of the
fit). The lambda parameter gives the size of the volatility penalty. Hence if lambda is
large enough the resulting series will be a linear trend, while if the penalty is zero the
trend and the series will be indistinguishable.15
3.3 – Other Methods
Two other methods that have been used in the literature in order to estimate the
natural rate of unemployment are the (multivariate) unobserved components method –
15
Note that some of those filters also have their multivariate version as, for example, the multivariate HP
filter.
13
estimated with the Kalman Filter – and the structural VAR (SVAR).16
The rationale is
the same: both methods aim at separating the trend – the permanent component – from
the cycle – the transitory component, but now with the help of other variables.
4 – Country Results
This section summarizes the natural rate estimation results for each country
involved in the research project [see da Silva Filho (2008) for Brazil, Restrepo (2008)
for Chile, Arango et al. (2007) for Colombia and Bujanda (2008) for Venezuela]. It also
takes a brief look on whether there have been any empirical regularities between those
countries according to labour market developments.17
Although the actual estimation
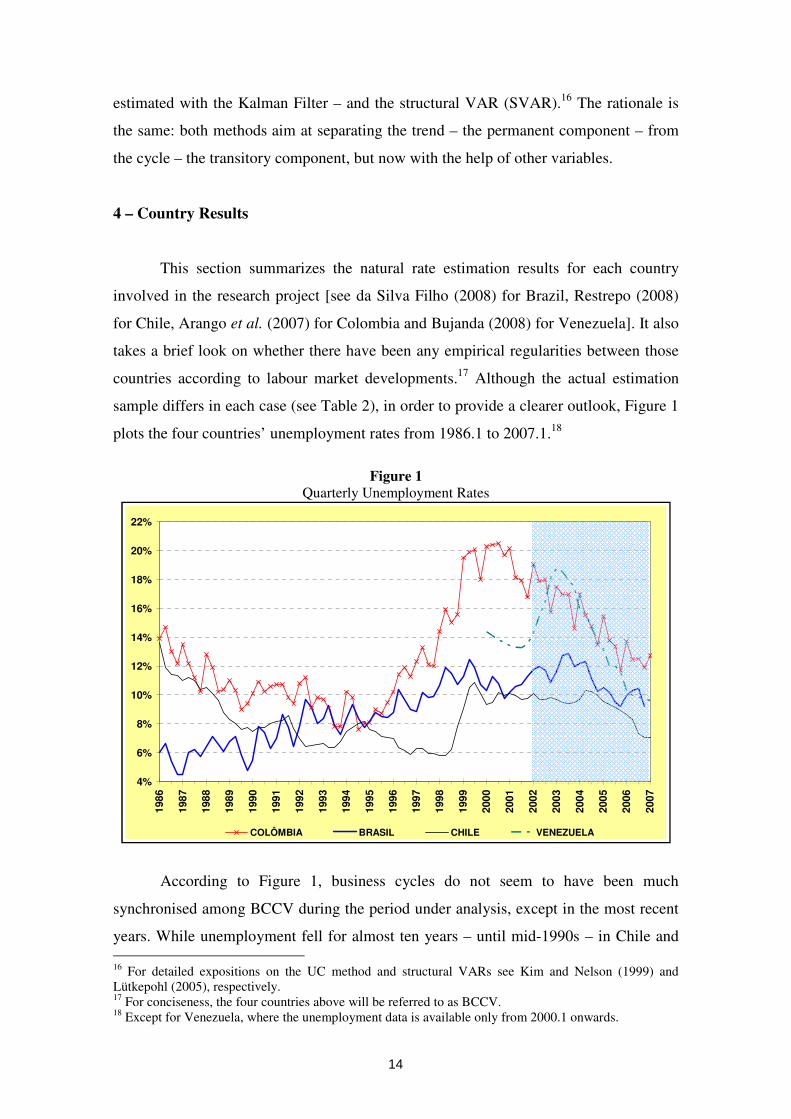
sample differs in each case (see Table 2), in order to provide a clearer outlook, Figure 1
plots the four countries’ unemployment rates from 1986.1 to 2007.1.18
Figure 1 Quarterly Unemployment Rates
According to Figure 1, business cycles do not seem to have been much
synchronised among BCCV during the period under analysis, except in the most recent
years. While unemployment fell for almost ten years – until mid-1990s – in Chile and
16
For detailed expositions on the UC method and structural VARs see Kim and Nelson (1999) and
Lütkepohl (2005), respectively. 17
For conciseness, the four countries above will be referred to as BCCV. 18
Except for Venezuela, where the unemployment data is available only from 2000.1 onwards.
4%
6%
8%
10%
12%
14%
16%
18%
20%
22%
1986
1987
1988
1989
1990
1991
1992
1993
1994
1995
1996
1997
1998
1999
2000
2001
2002
2003
2004
2005
2006
2007
COLÔMBIA BRASIL CHILE VENEZUELA
14
Colombia, it increased for at least twelve years in Brazil, until 1999. Moreover, around
mid-1995 there was a sharp reversal in the unemployment trend in Colombia, when it
began to rise very rapidly, while Chilean unemployment continued to decrease until
mid-1998, after a short-lived increase in 1994–95. Then, following the Russian crisis,
Chilean unemployment soared, increasing by more than five percentage points in just
one year, and remained close to its peak level for around six years. In its turn,
unemployment in Colombia – which had already begun to increase around 1995 –
soared too after the Russian crisis, and increased eight percentage points in just a two-
year interval (1998–99).19
However, note that since 2002/2003 BCCV’s business cycles
seem to have been well synchronised, as unemployment rates have begun to fall steadily
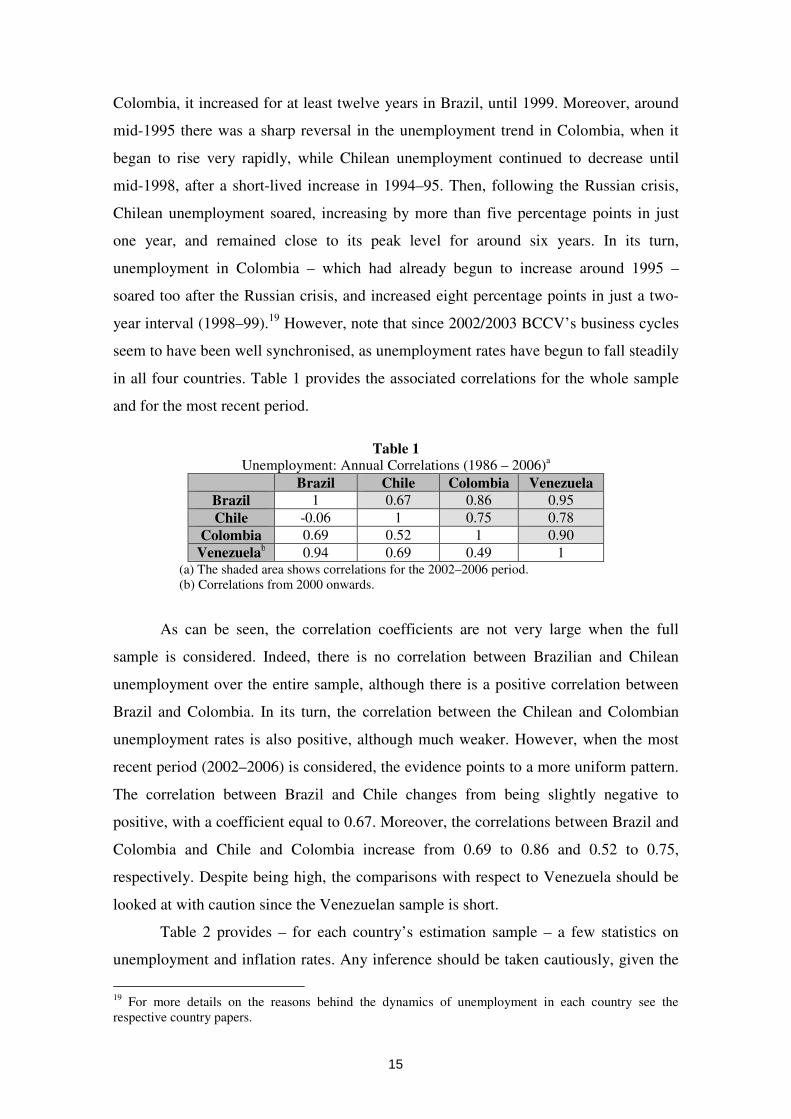
in all four countries. Table 1 provides the associated correlations for the whole sample
and for the most recent period.
Table 1 Unemployment: Annual Correlations (1986 – 2006)
a
Brazil Chile Colombia Venezuela
Brazil 1 0.67 0.86 0.95
Chile -0.06 1 0.75 0.78
Colombia 0.69 0.52 1 0.90
Venezuelab 0.94 0.69 0.49 1
(a) The shaded area shows correlations for the 2002–2006 period.
(b) Correlations from 2000 onwards.
As can be seen, the correlation coefficients are not very large when the full
sample is considered. Indeed, there is no correlation between Brazilian and Chilean
unemployment over the entire sample, although there is a positive correlation between
Brazil and Colombia. In its turn, the correlation between the Chilean and Colombian
unemployment rates is also positive, although much weaker. However, when the most
recent period (2002–2006) is considered, the evidence points to a more uniform pattern.
The correlation between Brazil and Chile changes from being slightly negative to
positive, with a coefficient equal to 0.67. Moreover, the correlations between Brazil and
Colombia and Chile and Colombia increase from 0.69 to 0.86 and 0.52 to 0.75,
respectively. Despite being high, the comparisons with respect to Venezuela should be
looked at with caution since the Venezuelan sample is short.
Table 2 provides – for each country’s estimation sample – a few statistics on
unemployment and inflation rates. Any inference should be taken cautiously, given the
19
For more details on the reasons behind the dynamics of unemployment in each country see the
respective country papers.
15
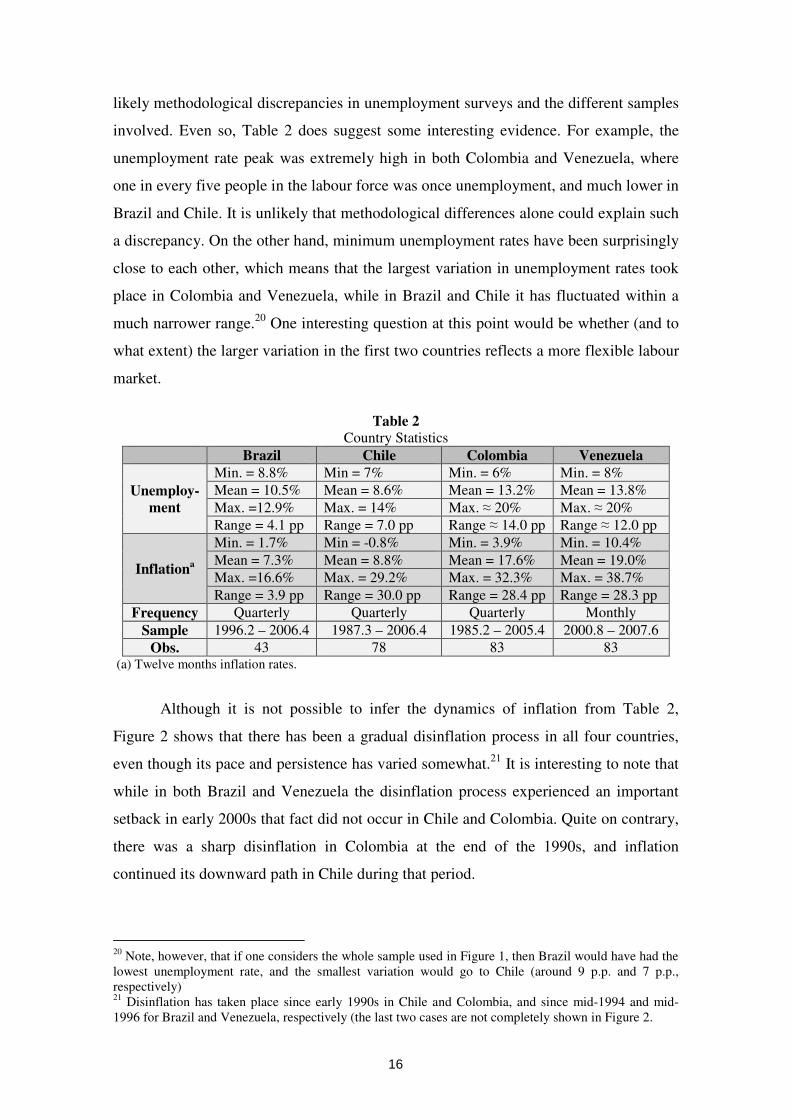
likely methodological discrepancies in unemployment surveys and the different samples
involved. Even so, Table 2 does suggest some interesting evidence. For example, the
unemployment rate peak was extremely high in both Colombia and Venezuela, where
one in every five people in the labour force was once unemployment, and much lower in
Brazil and Chile. It is unlikely that methodological differences alone could explain such
a discrepancy. On the other hand, minimum unemployment rates have been surprisingly
close to each other, which means that the largest variation in unemployment rates took
place in Colombia and Venezuela, while in Brazil and Chile it has fluctuated within a
much narrower range.20
One interesting question at this point would be whether (and to
what extent) the larger variation in the first two countries reflects a more flexible labour
market.
Table 2 Country Statistics
Brazil Chile Colombia Venezuela
Unemploy-
ment
Min. = 8.8% Min = 7% Min. = 6% Min. = 8%
Mean = 10.5% Mean = 8.6% Mean = 13.2% Mean = 13.8%
Max. =12.9% Max. = 14% Max. ≈ 20% Max. ≈ 20%
Range = 4.1 pp Range = 7.0 pp Range ≈ 14.0 pp Range ≈ 12.0 pp
Inflationa
Min. = 1.7% Min = -0.8% Min. = 3.9% Min. = 10.4%
Mean = 7.3% Mean = 8.8% Mean = 17.6% Mean = 19.0%
Max. =16.6% Max. = 29.2% Max. = 32.3% Max. = 38.7%
Range = 3.9 pp Range = 30.0 pp Range = 28.4 pp Range = 28.3 pp
Frequency Quarterly Quarterly Quarterly Monthly
Sample 1996.2 – 2006.4 1987.3 – 2006.4 1985.2 – 2005.4 2000.8 – 2007.6
Obs. 43 78 83 83 (a) Twelve months inflation rates.
Although it is not possible to infer the dynamics of inflation from Table 2,
Figure 2 shows that there has been a gradual disinflation process in all four countries,
even though its pace and persistence has varied somewhat.21
It is interesting to note that
while in both Brazil and Venezuela the disinflation process experienced an important
setback in early 2000s that fact did not occur in Chile and Colombia. Quite on contrary,
there was a sharp disinflation in Colombia at the end of the 1990s, and inflation
continued its downward path in Chile during that period.
20
Note, however, that if one considers the whole sample used in Figure 1, then Brazil would have had the
lowest unemployment rate, and the smallest variation would go to Chile (around 9 p.p. and 7 p.p.,
respectively) 21
Disinflation has taken place since early 1990s in Chile and Colombia, and since mid-1994 and mid-
1996 for Brazil and Venezuela, respectively (the last two cases are not completely shown in Figure 2.
16
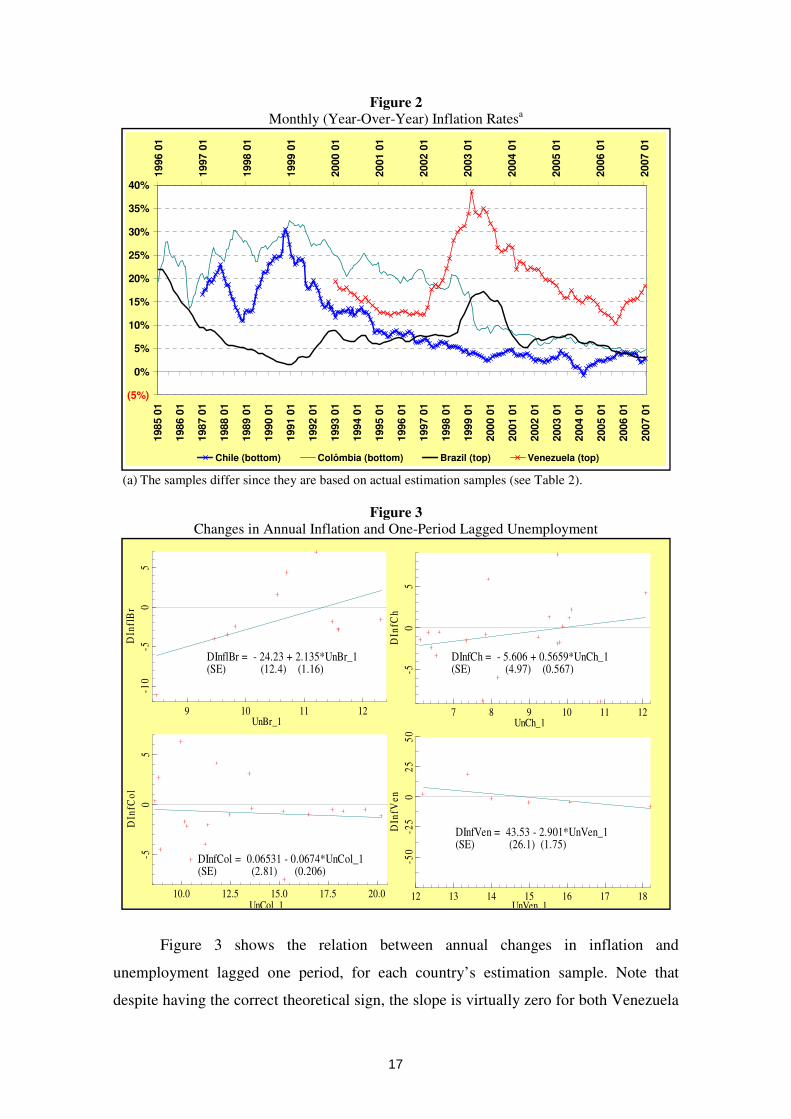
Figure 2 Monthly (Year-Over-Year) Inflation Rates
a
(a) The samples differ since they are based on actual estimation samples (see Table 2).
Figure 3 Changes in Annual Inflation and One-Period Lagged Unemployment
Figure 3 shows the relation between annual changes in inflation and
unemployment lagged one period, for each country’s estimation sample. Note that
despite having the correct theoretical sign, the slope is virtually zero for both Venezuela
(5%)
0%
5%
10%
15%
20%
25%
30%
35%
40%
1985
01
1986
01
1987
01
1988
01
1989
01
1990
01
1991
01
1992
01
1993
01
1994
01
1995
01
1996
01
1997
01
1998
01
1999
01
2000
01
2001
01
2002
01
2003
01
2004
01
2005
01
2006
01
2007
01
-0.05
0.00
0.05
0.10
0.15
0.20
0.25
0.30
0.35
0.40
1996
01
1997
01
1998
01
1999
01
2000
01
2001
01
2002
01
2003
01
2004
01
2005
01
2006
01
2007
01
Chile (bottom) Colômbia (bottom) Brazil (top) Venezuela (top)
9 10 11 12
-10
-50
5
UnBr_1
DIn
flB
r
DInflBr = - 24.23 + 2.135*UnBr_1(SE) (12.4) (1.16)
7 8 9 10 11 12
-50
5
UnCh_1
DIn
fCh
DInfCh = - 5.606 + 0.5659*UnCh_1(SE) (4.97) (0.567)
10.0 12.5 15.0 17.5 20.0
-50
5
UnCol_1
DIn
fCo
l
DInfCol = 0.06531 - 0.0674*UnCol_1(SE) (2.81) (0.206)
12 13 14 15 16 17 18
-50
-25
02
55
0
UnVen_1
DIn
fVe
n
DInfVen = 43.53 - 2.901*UnVen_1(SE) (26.1) (1.75)
17
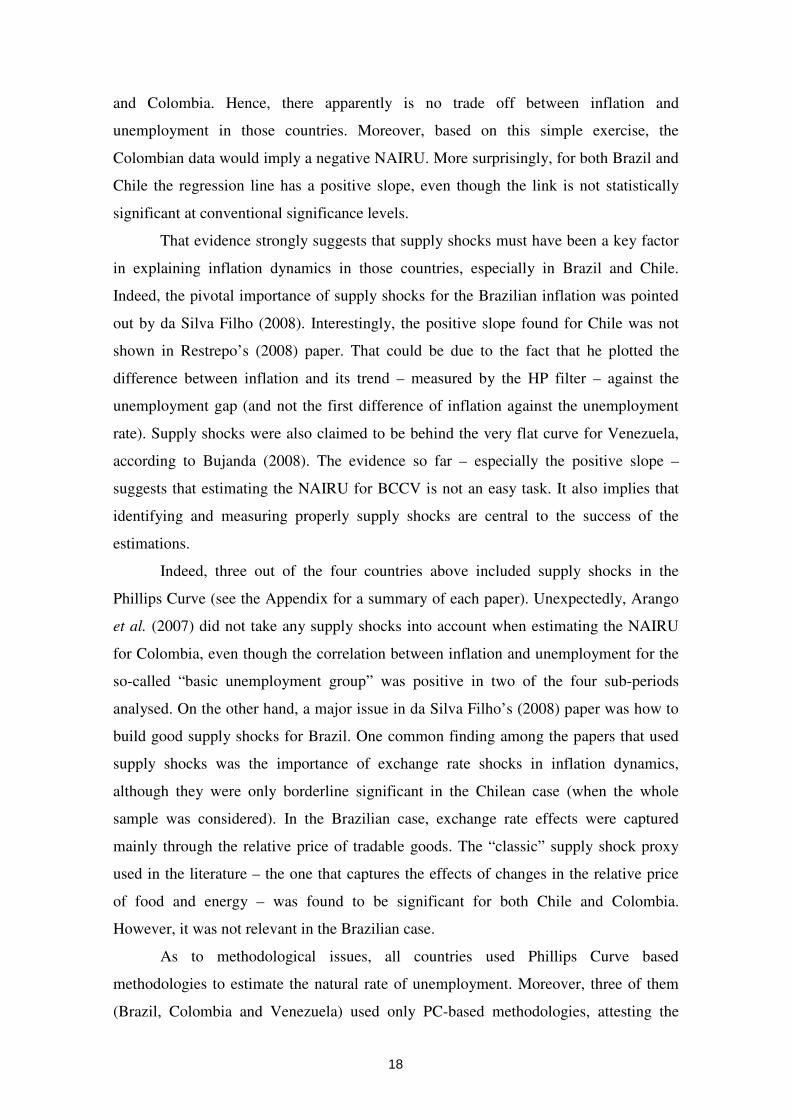
and Colombia. Hence, there apparently is no trade off between inflation and
unemployment in those countries. Moreover, based on this simple exercise, the
Colombian data would imply a negative NAIRU. More surprisingly, for both Brazil and
Chile the regression line has a positive slope, even though the link is not statistically
significant at conventional significance levels.
That evidence strongly suggests that supply shocks must have been a key factor
in explaining inflation dynamics in those countries, especially in Brazil and Chile.
Indeed, the pivotal importance of supply shocks for the Brazilian inflation was pointed
out by da Silva Filho (2008). Interestingly, the positive slope found for Chile was not
shown in Restrepo’s (2008) paper. That could be due to the fact that he plotted the
difference between inflation and its trend – measured by the HP filter – against the
unemployment gap (and not the first difference of inflation against the unemployment
rate). Supply shocks were also claimed to be behind the very flat curve for Venezuela,
according to Bujanda (2008). The evidence so far – especially the positive slope –
suggests that estimating the NAIRU for BCCV is not an easy task. It also implies that
identifying and measuring properly supply shocks are central to the success of the
estimations.
Indeed, three out of the four countries above included supply shocks in the
Phillips Curve (see the Appendix for a summary of each paper). Unexpectedly, Arango
et al. (2007) did not take any supply shocks into account when estimating the NAIRU
for Colombia, even though the correlation between inflation and unemployment for the
so-called “basic unemployment group” was positive in two of the four sub-periods
analysed. On the other hand, a major issue in da Silva Filho’s (2008) paper was how to
build good supply shocks for Brazil. One common finding among the papers that used
supply shocks was the importance of exchange rate shocks in inflation dynamics,
although they were only borderline significant in the Chilean case (when the whole
sample was considered). In the Brazilian case, exchange rate effects were captured
mainly through the relative price of tradable goods. The “classic” supply shock proxy
used in the literature – the one that captures the effects of changes in the relative price
of food and energy – was found to be significant for both Chile and Colombia.
However, it was not relevant in the Brazilian case.
As to methodological issues, all countries used Phillips Curve based
methodologies to estimate the natural rate of unemployment. Moreover, three of them
(Brazil, Colombia and Venezuela) used only PC-based methodologies, attesting the
18
popularity of such a framework. In the case of Chile besides the PC framework two
other methods were used: the unobserved components approach and the SVAR. See the
Appendix for details.
The difficulties involved in the NAIRU estimation could be seen in the large
degree of uncertainty surrounding point estimates. Although it is a well known fact in
the literature that the NAIRU is estimated with great imprecision, the case of Venezuela
stands out. Bujanda (2008) finds that the 90% confidence interval for the Venezuelan
NAIRU goes from 8.4% to 20.1%, which is an incredible wide interval. Not
surprisingly, except for the last two months of the sample, unemployment rates in
Venezuela fluctuated inside the above range. Restrepo estimated a 95% confidence
interval for the Chilean NAIRU going from 6.3% to 9.7%, a range within which the
Chilean unemployment rate fluctuated during most of the sample. Given the above
stylised fact da Silva Filho (2008) decided not to calculate parameter uncertainty, but
rather to focus on model uncertainty – which according to him would provide a useful
operational range – and provided NAIRU point estimates from five different models and
two different approaches. Indeed, the range of the estimates proved to be much smaller
than those above: around one percentage point (7.4%–8.5%). Nonetheless, he called to
attention that NAIRU estimates are very sensitive to the choice and inclusion of supply
shocks in the Phillips Curve.
Regarding the behaviour of the NAIRU the papers from Brazil and Colombia
found evidence of a constant NAIRU. Note that in Brazil’s case the evidence remained
unaltered when the TV-NAIRU framework was used. In the case of Colombia, although
the estimate is not rigorously constant, it fluctuates within such a narrow range that
from a statistical viewpoint it can easily be accepted as being constant. Indeed, during
the 22-year sample, different NAIRU estimates varied only from 0.4p.p. to 0.6p.p. For
both Chile and Venezuela results were dependent on the method used. For Chile,
besides the constant NAIRU estimate that comes out of the constant PC specification,
the unobserved components framework also produced a fairly constant NAIRU (apart
from the very beginning of the sample). On the other extreme the SVAR estimate was
extremely volatile. Cyclicality is also a trademark of the Ball & Mankiw approach,
which have been used by both Chile and Venezuela.
A common evidence among BCCV – regardless of which method is used –
concerns the pattern of unemployment gaps, which were decreasing, and even becoming
negative, towards the end of the samples. In the case of Venezuela, the unemployment
19
gap became increasingly negative since around 2005, and by the end of the sample
unemployment was well below the NAIRU, as one could have guessed by looking at
recent inflation rates (see Figure 2). In the case of Chile, the unemployment gap became
negative – in all methodologies – at the end of the sample, while in Colombia it reached
the NAIRU level at the very end of the sample. In its turn, the unemployment rate in
Brazil began to decrease at the end of the sample, towards the highest NAIRU estimate.
5 – A Brief Assessment
This section carries out a brief assessment on the approaches used and results
obtained by the four countries that joined the research project on the natural rate of
unemployment. General comments will be given emphasis; however, some specific
issues in the papers will be pinpointed as well. A good place to start is by assessing
some features of the methods that have been used.
It was pointed out in the introduction that one likely explanation behind the
small number of participants in the natural rate of unemployment group is the
widespread use of the HP filter by economists in order to estimate a variable’s potential
level. I will not discuss the shortcomings and drawbacks of the HP filter – which are
widely known – but it is worth mentioning the evidence found for Brazil on the relative
qualitative forecasting performance of the PC. Da Silva Filho (2008) compared the
qualitative forecasting accuracy of the PC framework under HP-based unemployment
gaps and gaps derived from assuming different constant NAIRU hypotheses. The
evidence showed not only that the HP-based forecasts had the second worst qualitative
forecasting accuracy, but also that the implied forecasting errors did not reveal one
crucial element in recent inflation dynamics in Brazil: the importance and pervasiveness
of supply shocks. On the contrary, those errors were the only ones suggesting that
excess demand was the main cause of inflation in Brazil during the period analysed, a
result that is sharply at odds with the evidence.
This lead us to the Ball & Mankiw approach, since one key step in their method
involves the use of the HP filter. NAIRU estimates from that approach showed a clear
cyclical pattern (see Chile’s paper in particular), which not only poses challenges for
understanding why it is so volatile, but hardly makes it a viable benchmark. More
importantly, since supply shocks – which are expected to be correlated with
unemployment – are ignored in that approach, NAIRU estimates are likely to be biased.
20
Cyclicality was also a major issue in Chile´s SVAR NAIRU estimate, which showed
amazing variability, almost overlapping with the unemployment series itself. Even
though it is not clear to what extent this feature was the outcome of the particular VAR
specification used, the above evidence call for caution about using such methods.
On the other extreme lay estimates from Phillips Curves that assume that the
NAIRU is constant [equation (2)]. Obviously, what comes out from those models is a
constant NAIRU estimate, by construction. Hence one could argue that the outcome is
not reliable, since it is imposed rather than tested. That argument is not necessarily true
and, therefore, does not invalidate the method. What it does imply is that it is crucial to
assess if the model is congruent with the data. Hence one needs to check whether the
model is well specified and, mainly, whether there is any evidence of structural breaks.
Parameter stability is a key evidence for the latter issue.
Note, however, that a similar type of argument applies equally to the opposite
case: one could claim that a TV-NAIRU estimate could actually be the result of mis-
specification, instead of reflecting a truly time-varying process. This point is extremely
important but has been largely ignored in the empirical literature, which has been “eager
for variability”. It fits perfectly to the increasingly use of the PC-UC framework
[equations (4) and (5)] in the NAIRU literature. Indeed, note that one key issue in this
approach is precisely the so-called “smoothness problem”, which is the “tendency” of
the non-observable variable estimate to show excess volatility. As puts Gordon (1997)
“If no limit were placed on the ability of the NAIRU to vary each time period, then the
time-varying NAIRU could jump up and down and soak up all the residual variation in
the inflation equation.” The literature has dealt with this problem by restricting the
extent by which the TV-NAIRU can vary [e.g. King et al. (1995) and Gordon (1997)].
However, as mentioned above, excess volatility could actually stem from mis-
specification, so when restricting variances one risks of not dealing with the true
problem. Therefore, even though smoother estimates make more sense, inference could
remain unreliable. Moreover, the issue of how volatile one should allow the NAIRU to
be remains open, since this decision bears a large degree of arbitrariness.
The next important issue – which reflects clearly how challenging the NAIRU
estimation is – refers to the uncertainty behind NAIRU estimates. Since Staiger et al’s.
(1996) remark that “...measures of the precision of these [NAIRU] estimates are
strikingly absent from this literature.” they have become more common, and today we
know that uncertainty about the NAIRU is much larger than one would like, to the point
21
that it is reasonable to question the usefulness of those estimates for policy.
Nonetheless, it is interesting to note that confidence intervals are often calculated just
for the constant NAIRU case.22
Indeed, both Chile and Venezuela calculated confidence
intervals for the constant NAIRU case only. To make things worse, note that so far we
have been talking about parameter uncertainty only, but not about model uncertainty,
which is an issue that remains largely overlooked in the literature. This is particularly
relevant given Stock and Watson’s (1996) finding that NAIRU estimates “... can be
sensitive to seemingly modest changes in specification of the estimating equation ...”
Indeed, da Silva Filho (2008) found for Brazil that NAIRU estimates are very sensitive
to the presence and choice of supply shocks. Hence, if model uncertainty is taken into
consideration the degree of uncertainty about the NAIRU will be even larger.
This is particularly relevant given the evidence presented by da Silva Filho
(2008) that NAIRU estimates for Brazil are very sensitive to the presence and choice of
supply shocks. Similarly, Stock and Watson (1996) mention evidence for Canada that
NAIRU estimates “... can be sensitive to seemingly modest changes in specification of
the estimating equation ...” Hence, if model uncertainty is taken into consideration the
degree of uncertainty about the NAIRU will be even larger.
Note that the lack of precision not only produces wide confidence intervals but
also makes structural break testing more difficult. For example, there is a clear break in
Chilean unemployment around 1999. Hence Restrepo (2008) estimated two PC: one up
to 1998 and another one using the whole sample. However, even though NAIRU
estimates seemed sufficiently different between them (7.4% and 8.3%) he was not able
to formally reject the hypothesis that the NAIRU before and after 1998 was the same.
Bujanda (2008) also found the same difficulty for Venezuela, even though NAIRU
estimates for the periods before and after the supposed break were almost three
percentage points apart (12.5% and 15.1%).
Another evidence that unveils the difficulties faced by BCCV to estimate the
NAIRU refers to the size of the unemployment coefficient in the Phillips Curve. The
sum of the coefficients on lagged unemployment [i.e. β(L)] amounted to just -0,001 in
the case of Chile, which implies an extremely large sacrifice ratio. Although that sum is
much higher for Venezuela (-0.05), it still implies very large sacrifice ratios. For Brazil,
22
One could raise the hypothesis that part of that wide uncertainty could stem from estimating a constant
NAIRU when it actually is time-varying. However, Stock and Watson (1996) show evidence that
uncertainty about the NAIRU remains large across methodologies.
22
estimates varied from -0.05 to -0.19. This timid role played by unemployment on
inflation dynamics suggests the existence of room for improvements in the specification
of the PC. More specifically, it could be that supply shocks were not properly accounted
for, leading to a bias in the unemployment coefficient.
With the exception of Brazil’s paper – where several supply shocks proxies were
built – the number of proxies used were very small, being usually restricted to the two
most used in the U.S. NAIRU literature (see the Appendix). Given the potential large
gains involved in properly capturing supply shocks effects, it is certainly worthwhile to
spend more time on this issue. Note that in Colombia’s paper supply shocks effects
were not controlled for, while in Venezuela’s shocks were apparently not demeaned. In
both cases this implies bias in the NAIRU estimates.
Perhaps the tiny unemployment coefficient in the Chilean case is related to the
choice of the dependent variable in the PC. Instead of using the first difference of
inflation Restrepo (2008) used the deviation of inflation from its HP trend. This poses
some problems. For example, how to interpret the implied “NAIRU”, since what comes
out of the model is not the unemployment rate consistent with stable inflation, but rather
that rate consistent with inflation being on its trend. Estimates could be very different in
both cases, especially if inflation is not stable along the sample.
The pattern of each country’s unemployment gap also deserves some comments.
For example, da Silva Filho (2008) found a positive unemployment gap throughout the
eleven-year sample for Brazil. This is an unusual result, especially when compared to
the results from those methods that read a variable’s potential level as some form of
averaging (i.e. do not allow persistent deviations from trend), such as the HP filter.
Note, however, that the unemployment gap was negative for around eleven years
(1987–1997) in Colombia as well, and positive in the following eight years (1988–
2005), according to Arango (2008). In Chile, the gap remained negative for around ten
years (1989–1998), and positive in the following six years – for both the constant
NAIRU and UC cases – according to Restrepo (2008). Hence, from that perspective,
Brazil’s results are not unusual. However, more important than the actual duration of
periods with one-sided unemployment gaps is to understand the results. In this regard
most of the papers could have gone deeper in confronting NAIRU estimates with the
country’s economic history, in order to provide some intuition and assess the
plausibility of the results. This is even more important in those cases where NAIRU
estimates are very volatile.
23
6 – Final Remarks
Blanchard and Katz (1997) said ten years ago that “Economists are a long way
from having a good quantitative understanding of the determinants of the natural rate,
either across time or across countries”. Their remark remains incredibly valid today.
The well-known difficulties behind the NAIRU estimation persist to challenge those
who join the quest. For example, it continues to be estimated with great imprecision,
which not only is a reflection of such difficulties but also raises questions about its
usefulness for monetary policy. Also, recent evidence has shown a widespread
flattening of the Phillips Curve across countries, perhaps revealing structural changes in
the economic environment. However, better policymaking – with the increasing
emphasis on controlling inflation – could also be behind that phenomenon.
As a matter of fact I think their remark was – and continues to be – a little bit
optimistic, since despite the important advances in the area a better understanding on the
qualitative determinants of the natural rate is still needed. An example that I found
particularly useful in this regard are Weiner’s (1993) predictions of the U.S. natural rate,
made just before the appearance of the “new economy” in the 1990s. After a careful
analysis of some structural determinants of the natural rate in the U.S. he predicted that
it was likely to rise in the following years and, therefore, that the inflation risk was
rising. However, what followed was just the opposite: both unemployment and inflation
fell sharply during the 1990s in the U.S.23
Hence, the numerous difficulties faced by Brazil, Chile, Colombia and
Venezuela when estimating the NAIRU were not a surprise. For example, the estimated
confidence intervals are very wide, especially in the Venezuelan case, where it reaches
almost twelve percentage points. Moreover, in most papers results proved to be highly
dependent on the particular method used, which adds to the parameter uncertainty. Also,
the unemployment coefficient in the Phillips Curve seems too low, implying incredible
large sacrifice ratios in some cases (e.g. Chile).
Another interesting finding is the importance of supply shocks for inflation
dynamics, especially in the case of Brazil. Indeed, Brazilian data showed an unexpected
positive relation between changes in inflation and unemployment, suggesting both the
23
Note that some of the factors claimed to explain the fall in the NAIRU during the 1990s not only are
not present anymore, but have become playing in the opposite direction (e.g. the deflationary effects of
globalisation). Even so the current rate of unemployment in the U.S. – which has recently increased due
to the sharp economic slowdown – lies well below the mid-1990s’ natural rate estimates.
24
relevance of supply shocks and the difficulties in uncovering the NAIRU. Among the
supply shocks used, exchange rate shocks seem to play a central role for most countries.
Moreover, besides the dependency on the particular methodology used, found in most
papers, the evidence for Brazil shows that NAIRU estimates are very sensitive to the
inclusion and choice of supply shocks.
Among the many methods available in the literature – and used in the papers –
the Phillips Curve framework proved to be the most popular, being adopted by all
countries. Some reasons behind such popularity are the appeal of modelling the link
between inflation and unemployment explicitly and its flexibility. For example, the PC
can be used together with the unobserved components technology in order to allow for a
time-varying NAIRU (TV-NAIRU).
Nonetheless, a frequent uncomfortable feature of those methods that allow the
NAIRU to vary is either a too volatile NAIRU or an estimate with marked cyclical
pattern. Those features pose great challenges for both explaining the rationale behind
such changes and using the NAIRU as a benchmark for policy. Moreover, it was called
to attention that a TV-NAIRU could mainly reflect mis-specification, and not a genuine
time-varying process. Hence, it is essential to check model’s adequacy in every way
possible in order to make reliable inferences. I would say that in more flexible
frameworks the care should be even greater. Worrisome evidence regards the widely
use by economists of the HP filter to estimate the NAIRU. The evidence from Brazil
shows that HP-based unemployment gaps provide very poor qualitative inflation
forecasts and completely miss the importance of supply shocks in recent Brazilian
inflation dynamics.
The main practical advice that comes out from this joint research project is that,
despite all the difficulties in estimating the NAIRU, there seems to be much room
available for improvement, especially those stemming from better modelling and better
care with the data. For example, many specifications retained insignificant variables and
showed signs of mis-specification. Also, given the importance of supply shocks in
inflation dynamics it will certainly pay off to spend some time trying to come up with
proxies that better capture those shocks. Such improvements are very likely to narrow
down the uncertainty about the NAIRU, as well as to reveal a greater role for
unemployment in inflation dynamics, among other benefits.
25
References
Arango, Luis E., Carlos E. Posada and Andrés F. Garcia (2007). “Inflación y desempleo en
Colombia: NAIRU y tasa de desempleo compatible con alcanzar la meta de inflación
(1984–2005). Borradores de Economía No 453, Banco de la Republica de Colombia.
Atkenson, A. and L.E. Ohanian (2001). “Are Phillips Curves Useful for Forecasting
Inflation?”, FRB of Minneapolis Quarterly Review (Winter).
Ball, Laurence and N. G. Mankiw (2002). “The NAIRU in Theory and Practice”. NBER
Working Paper 8940.
Blanchard, Olivier and L. F. Katz (1997). “What We Know and Do Not Know About the
Natural Rate of Unemployment”. Journal of Economic Perspectives, Vol. 11, No 1.
Blinder, Alan S. (1997). “Is There a Core of Practical Macroeconomics That We Should all
Believe?” The American Economic Review, Vol. 87, No 2.
Bujanda, León B. (2008). “Midiendo La Tasa Natural de Desempleo en Venezuela”. Non-
observable Variables, the Central Banking Perspective. CEMLA.
Congressional Budget Office, (1994). “Reestimating the NAIRU”.
Da Silva Filho (2008) “Searching for the Natural Rate of Unemployment in a Large Relative
Price Shocks’ Economy: the Brazilian Case”. Non-observable Variables, the Central
Banking Perspective. CEMLA.
Friedman, Milton (1968). "The Role of Monetary Policy". The American Economic Review
Vol. 58, No 1.
Gavin and Mandal (2003). “Evaluating FOMC Forecasts”, International Journal of
Forecasting 19.
Gordon, Robert J. (1997). “The Time-Varying NAIRU and its Implications for Economic
Policy”. Journal of Economic Perspectives, Vol. 11, No 1.
King, Mervin (1998). “Monetary policy and the Labour market”. Speech held at the
Employment Policy Institute’s Fourth Annual Lecture. Bank of England.
King, Robert G., J. H. Stock and M. W. Watson (1995). “Temporal Instability of the
Unemployment-Inflation Relationship”. Economic Perspectives, Federal Reserve Bank of
Chicago, May/June.
Kim, Chang-Jim and Charles R. Nelson (1999). State Space Models With Regime Switching.
The MIT Press.
Lütkepohl, Helmut (2005). New Introduction to Multiple Time Series Analysis. Springer-
Verlag.
Mankiw, N. Gregory (2001). “The Inexorable and Mysterious Tradeof between Inflation and
Unemployment”. The Economic Journal, Vol. 111, No 471.
Modigliani, F. and L. Papademos (1975). “Targets for Monetary Policy in the Coming Year”.
Brookings Papers on Economic Activity 1.
Phelps, E. (1968). “Money-Wage Dynamics and Labour Market Equilibrium”. Journal of
Political Economy 76, No 4.
Richardson, P., L. Boone, C. Giorno, M. Meacci, D. Rae and D. Turner (2000). “The
Concept, Policy Use and Measurement of Structural Unemployment: Estimating a Time
Varying NAIRU Across 21 OECD Countries”. OECD Economics Department Working
Paper, No 250.
Restrepo, Jorge E. (2008). “Estimaciones de NAIRU Para Chile”. Non-observable Variables,
the Central Banking Perspective. CEMLA.
26
Stock J. H. and M. W. Watson (1999). “Forecasting Inflation”. Journal of Monetary
Economics No 44.
Staiger, Douglas, J. H. Stock and M. W. Watson (1996). “How Precise are Estimates of the
Natural Rate of Unemployment”. NBER Working Paper, No 5477.
___________________________________________ (1997). “The NAIRU, Unemployment
and Monetary Policy”. Journal of Economic Perspectives, Vol. 11, No 1.
Stiglitz, Joseph (1997). “Reflections on the Natural Rate Hypothesis”. Journal of Economic
Perspectives, Vol. 11, No 1.
Tobin, James (1998). “Supply Constraints on Employment and Output: NAIRU versus Natural
Rate”. Cowles Foundation Paper 1150.
Weiner, Stuart E. (1993). “New Estimates of the Natural Rate of Unemployment”. Federal
Reserve Bank of Kansas City Economic Review, Fourth Quarter.
27
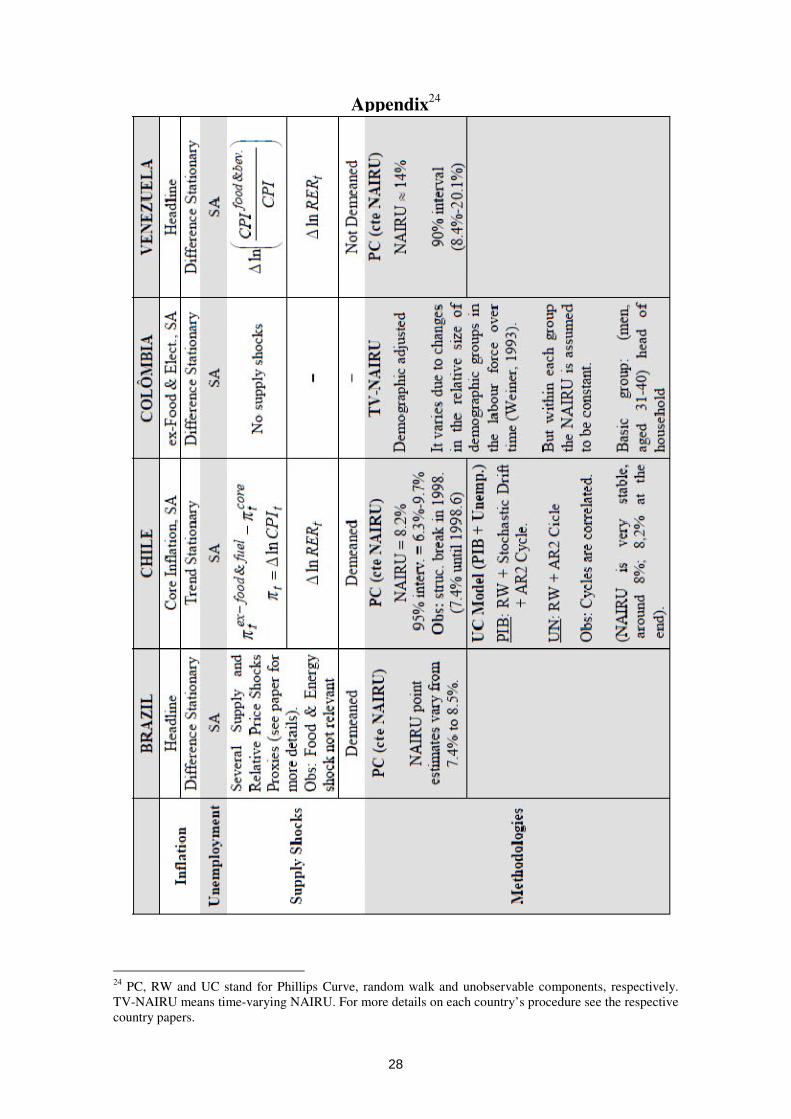
Appendix24
24
PC, RW and UC stand for Phillips Curve, random walk and unobservable components, respectively.
TV-NAIRU means time-varying NAIRU. For more details on each country’s procedure see the respective
country papers.
28

29
30
Banco Central do Brasil
Trabalhos para Discussão Os Trabalhos para Discussão podem ser acessados na internet, no formato PDF,
no endereço: http://www.bc.gov.br
Working Paper Series
Working Papers in PDF format can be downloaded from: http://www.bc.gov.br
1 Implementing Inflation Targeting in Brazil
Joel Bogdanski, Alexandre Antonio Tombini and Sérgio Ribeiro da Costa Werlang
Jul/2000
2 Política Monetária e Supervisão do Sistema Financeiro Nacional no Banco Central do Brasil Eduardo Lundberg Monetary Policy and Banking Supervision Functions on the Central Bank Eduardo Lundberg
Jul/2000
Jul/2000
3 Private Sector Participation: a Theoretical Justification of the Brazilian Position Sérgio Ribeiro da Costa Werlang
Jul/2000
4 An Information Theory Approach to the Aggregation of Log-Linear Models Pedro H. Albuquerque
Jul/2000
5 The Pass-Through from Depreciation to Inflation: a Panel Study Ilan Goldfajn and Sérgio Ribeiro da Costa Werlang
Jul/2000
6 Optimal Interest Rate Rules in Inflation Targeting Frameworks José Alvaro Rodrigues Neto, Fabio Araújo and Marta Baltar J. Moreira
Jul/2000
7 Leading Indicators of Inflation for Brazil Marcelle Chauvet
Sep/2000
8 The Correlation Matrix of the Brazilian Central Bank’s Standard Model for Interest Rate Market Risk José Alvaro Rodrigues Neto
Sep/2000
9 Estimating Exchange Market Pressure and Intervention Activity Emanuel-Werner Kohlscheen
Nov/2000
10 Análise do Financiamento Externo a uma Pequena Economia Aplicação da Teoria do Prêmio Monetário ao Caso Brasileiro: 1991–1998 Carlos Hamilton Vasconcelos Araújo e Renato Galvão Flôres Júnior
Mar/2001
11 A Note on the Efficient Estimation of Inflation in Brazil Michael F. Bryan and Stephen G. Cecchetti
Mar/2001
12 A Test of Competition in Brazilian Banking Márcio I. Nakane
Mar/2001
31
13 Modelos de Previsão de Insolvência Bancária no Brasil Marcio Magalhães Janot
Mar/2001
14 Evaluating Core Inflation Measures for Brazil Francisco Marcos Rodrigues Figueiredo
Mar/2001
15 Is It Worth Tracking Dollar/Real Implied Volatility? Sandro Canesso de Andrade and Benjamin Miranda Tabak
Mar/2001
16 Avaliação das Projeções do Modelo Estrutural do Banco Central do Brasil para a Taxa de Variação do IPCA Sergio Afonso Lago Alves Evaluation of the Central Bank of Brazil Structural Model’s Inflation Forecasts in an Inflation Targeting Framework Sergio Afonso Lago Alves
Mar/2001
Jul/2001
17 Estimando o Produto Potencial Brasileiro: uma Abordagem de Função de Produção Tito Nícias Teixeira da Silva Filho Estimating Brazilian Potential Output: a Production Function Approach Tito Nícias Teixeira da Silva Filho
Abr/2001
Aug/2002
18 A Simple Model for Inflation Targeting in Brazil Paulo Springer de Freitas and Marcelo Kfoury Muinhos
Apr/2001
19 Uncovered Interest Parity with Fundamentals: a Brazilian Exchange Rate Forecast Model Marcelo Kfoury Muinhos, Paulo Springer de Freitas and Fabio Araújo
May/2001
20 Credit Channel without the LM Curve Victorio Y. T. Chu and Márcio I. Nakane
May/2001
21 Os Impactos Econômicos da CPMF: Teoria e Evidência Pedro H. Albuquerque
Jun/2001
22 Decentralized Portfolio Management Paulo Coutinho and Benjamin Miranda Tabak
Jun/2001
23 Os Efeitos da CPMF sobre a Intermediação Financeira Sérgio Mikio Koyama e Márcio I. Nakane
Jul/2001
24 Inflation Targeting in Brazil: Shocks, Backward-Looking Prices, and IMF Conditionality Joel Bogdanski, Paulo Springer de Freitas, Ilan Goldfajn and Alexandre Antonio Tombini
Aug/2001
25 Inflation Targeting in Brazil: Reviewing Two Years of Monetary Policy 1999/00 Pedro Fachada
Aug/2001
26 Inflation Targeting in an Open Financially Integrated Emerging Economy: the Case of Brazil Marcelo Kfoury Muinhos
Aug/2001
27
Complementaridade e Fungibilidade dos Fluxos de Capitais Internacionais Carlos Hamilton Vasconcelos Araújo e Renato Galvão Flôres Júnior
Set/2001
32
28
Regras Monetárias e Dinâmica Macroeconômica no Brasil: uma Abordagem de Expectativas Racionais Marco Antonio Bonomo e Ricardo D. Brito
Nov/2001
29 Using a Money Demand Model to Evaluate Monetary Policies in Brazil Pedro H. Albuquerque and Solange Gouvêa
Nov/2001
30 Testing the Expectations Hypothesis in the Brazilian Term Structure of Interest Rates Benjamin Miranda Tabak and Sandro Canesso de Andrade
Nov/2001
31 Algumas Considerações sobre a Sazonalidade no IPCA Francisco Marcos R. Figueiredo e Roberta Blass Staub
Nov/2001
32 Crises Cambiais e Ataques Especulativos no Brasil Mauro Costa Miranda
Nov/2001
33 Monetary Policy and Inflation in Brazil (1975-2000): a VAR Estimation André Minella
Nov/2001
34 Constrained Discretion and Collective Action Problems: Reflections on the Resolution of International Financial Crises Arminio Fraga and Daniel Luiz Gleizer
Nov/2001
35 Uma Definição Operacional de Estabilidade de Preços Tito Nícias Teixeira da Silva Filho
Dez/2001
36 Can Emerging Markets Float? Should They Inflation Target? Barry Eichengreen
Feb/2002
37 Monetary Policy in Brazil: Remarks on the Inflation Targeting Regime, Public Debt Management and Open Market Operations Luiz Fernando Figueiredo, Pedro Fachada and Sérgio Goldenstein
Mar/2002
38 Volatilidade Implícita e Antecipação de Eventos de Stress: um Teste para o Mercado Brasileiro Frederico Pechir Gomes
Mar/2002
39 Opções sobre Dólar Comercial e Expectativas a Respeito do Comportamento da Taxa de Câmbio Paulo Castor de Castro
Mar/2002
40 Speculative Attacks on Debts, Dollarization and Optimum Currency Areas Aloisio Araujo and Márcia Leon
Apr/2002
41 Mudanças de Regime no Câmbio Brasileiro Carlos Hamilton V. Araújo e Getúlio B. da Silveira Filho
Jun/2002
42 Modelo Estrutural com Setor Externo: Endogenização do Prêmio de Risco e do Câmbio Marcelo Kfoury Muinhos, Sérgio Afonso Lago Alves e Gil Riella
Jun/2002
43 The Effects of the Brazilian ADRs Program on Domestic Market Efficiency Benjamin Miranda Tabak and Eduardo José Araújo Lima
Jun/2002
33
44 Estrutura Competitiva, Produtividade Industrial e Liberação Comercial no Brasil Pedro Cavalcanti Ferreira e Osmani Teixeira de Carvalho Guillén
Jun/2002
45 Optimal Monetary Policy, Gains from Commitment, and Inflation Persistence André Minella
Aug/2002
46 The Determinants of Bank Interest Spread in Brazil Tarsila Segalla Afanasieff, Priscilla Maria Villa Lhacer and Márcio I. Nakane
Aug/2002
47 Indicadores Derivados de Agregados Monetários Fernando de Aquino Fonseca Neto e José Albuquerque Júnior
Set/2002
48 Should Government Smooth Exchange Rate Risk? Ilan Goldfajn and Marcos Antonio Silveira
Sep/2002
49 Desenvolvimento do Sistema Financeiro e Crescimento Econômico no Brasil: Evidências de Causalidade Orlando Carneiro de Matos
Set/2002
50 Macroeconomic Coordination and Inflation Targeting in a Two-Country Model Eui Jung Chang, Marcelo Kfoury Muinhos and Joanílio Rodolpho Teixeira
Sep/2002
51 Credit Channel with Sovereign Credit Risk: an Empirical Test Victorio Yi Tson Chu
Sep/2002
52 Generalized Hyperbolic Distributions and Brazilian Data José Fajardo and Aquiles Farias
Sep/2002
53 Inflation Targeting in Brazil: Lessons and Challenges André Minella, Paulo Springer de Freitas, Ilan Goldfajn and Marcelo Kfoury Muinhos
Nov/2002
54 Stock Returns and Volatility Benjamin Miranda Tabak and Solange Maria Guerra
Nov/2002
55 Componentes de Curto e Longo Prazo das Taxas de Juros no Brasil Carlos Hamilton Vasconcelos Araújo e Osmani Teixeira de Carvalho de Guillén
Nov/2002
56 Causality and Cointegration in Stock Markets: the Case of Latin America Benjamin Miranda Tabak and Eduardo José Araújo Lima
Dec/2002
57 As Leis de Falência: uma Abordagem Econômica Aloisio Araujo
Dez/2002
58 The Random Walk Hypothesis and the Behavior of Foreign Capital Portfolio Flows: the Brazilian Stock Market Case Benjamin Miranda Tabak
Dec/2002
59 Os Preços Administrados e a Inflação no Brasil Francisco Marcos R. Figueiredo e Thaís Porto Ferreira
Dez/2002
60 Delegated Portfolio Management Paulo Coutinho and Benjamin Miranda Tabak
Dec/2002
34
61 O Uso de Dados de Alta Freqüência na Estimação da Volatilidade e do Valor em Risco para o Ibovespa João Maurício de Souza Moreira e Eduardo Facó Lemgruber
Dez/2002
62 Taxa de Juros e Concentração Bancária no Brasil Eduardo Kiyoshi Tonooka e Sérgio Mikio Koyama
Fev/2003
63 Optimal Monetary Rules: the Case of Brazil Charles Lima de Almeida, Marco Aurélio Peres, Geraldo da Silva e Souza and Benjamin Miranda Tabak
Feb/2003
64 Medium-Size Macroeconomic Model for the Brazilian Economy Marcelo Kfoury Muinhos and Sergio Afonso Lago Alves
Feb/2003
65 On the Information Content of Oil Future Prices Benjamin Miranda Tabak
Feb/2003
66 A Taxa de Juros de Equilíbrio: uma Abordagem Múltipla Pedro Calhman de Miranda e Marcelo Kfoury Muinhos
Fev/2003
67 Avaliação de Métodos de Cálculo de Exigência de Capital para Risco de Mercado de Carteiras de Ações no Brasil Gustavo S. Araújo, João Maurício S. Moreira e Ricardo S. Maia Clemente
Fev/2003
68 Real Balances in the Utility Function: Evidence for Brazil Leonardo Soriano de Alencar and Márcio I. Nakane
Feb/2003
69 r-filters: a Hodrick-Prescott Filter Generalization Fabio Araújo, Marta Baltar Moreira Areosa and José Alvaro Rodrigues Neto
Feb/2003
70 Monetary Policy Surprises and the Brazilian Term Structure of Interest Rates Benjamin Miranda Tabak
Feb/2003
71 On Shadow-Prices of Banks in Real-Time Gross Settlement Systems Rodrigo Penaloza
Apr/2003
72 O Prêmio pela Maturidade na Estrutura a Termo das Taxas de Juros Brasileiras Ricardo Dias de Oliveira Brito, Angelo J. Mont'Alverne Duarte e Osmani Teixeira de C. Guillen
Maio/2003
73 Análise de Componentes Principais de Dados Funcionais – uma Aplicação às Estruturas a Termo de Taxas de Juros Getúlio Borges da Silveira e Octavio Bessada
Maio/2003
74 Aplicação do Modelo de Black, Derman & Toy à Precificação de Opções Sobre Títulos de Renda Fixa
Octavio Manuel Bessada Lion, Carlos Alberto Nunes Cosenza e César das Neves
Maio/2003
75 Brazil’s Financial System: Resilience to Shocks, no Currency Substitution, but Struggling to Promote Growth Ilan Goldfajn, Katherine Hennings and Helio Mori
Jun/2003
35
76 Inflation Targeting in Emerging Market Economies Arminio Fraga, Ilan Goldfajn and André Minella
Jun/2003
77 Inflation Targeting in Brazil: Constructing Credibility under Exchange Rate Volatility André Minella, Paulo Springer de Freitas, Ilan Goldfajn and Marcelo Kfoury Muinhos
Jul/2003
78 Contornando os Pressupostos de Black & Scholes: Aplicação do Modelo de Precificação de Opções de Duan no Mercado Brasileiro Gustavo Silva Araújo, Claudio Henrique da Silveira Barbedo, Antonio Carlos Figueiredo, Eduardo Facó Lemgruber
Out/2003
79 Inclusão do Decaimento Temporal na Metodologia Delta-Gama para o Cálculo do VaR de Carteiras Compradas em Opções no Brasil Claudio Henrique da Silveira Barbedo, Gustavo Silva Araújo, Eduardo Facó Lemgruber
Out/2003
80 Diferenças e Semelhanças entre Países da América Latina: uma Análise de Markov Switching para os Ciclos Econômicos de Brasil e Argentina Arnildo da Silva Correa
Out/2003
81 Bank Competition, Agency Costs and the Performance of the Monetary Policy Leonardo Soriano de Alencar and Márcio I. Nakane
Jan/2004
82 Carteiras de Opções: Avaliação de Metodologias de Exigência de Capital no Mercado Brasileiro Cláudio Henrique da Silveira Barbedo e Gustavo Silva Araújo
Mar/2004
83 Does Inflation Targeting Reduce Inflation? An Analysis for the OECD Industrial Countries Thomas Y. Wu
May/2004
84 Speculative Attacks on Debts and Optimum Currency Area: a Welfare Analysis Aloisio Araujo and Marcia Leon
May/2004
85 Risk Premia for Emerging Markets Bonds: Evidence from Brazilian Government Debt, 1996-2002 André Soares Loureiro and Fernando de Holanda Barbosa
May/2004
86 Identificação do Fator Estocástico de Descontos e Algumas Implicações sobre Testes de Modelos de Consumo Fabio Araujo e João Victor Issler
Maio/2004
87 Mercado de Crédito: uma Análise Econométrica dos Volumes de Crédito Total e Habitacional no Brasil Ana Carla Abrão Costa
Dez/2004
88 Ciclos Internacionais de Negócios: uma Análise de Mudança de Regime Markoviano para Brasil, Argentina e Estados Unidos Arnildo da Silva Correa e Ronald Otto Hillbrecht
Dez/2004
89 O Mercado de Hedge Cambial no Brasil: Reação das Instituições Financeiras a Intervenções do Banco Central Fernando N. de Oliveira
Dez/2004
36
90 Bank Privatization and Productivity: Evidence for Brazil Márcio I. Nakane and Daniela B. Weintraub
Dec/2004
91 Credit Risk Measurement and the Regulation of Bank Capital and Provision Requirements in Brazil – a Corporate Analysis Ricardo Schechtman, Valéria Salomão Garcia, Sergio Mikio Koyama and Guilherme Cronemberger Parente
Dec/2004
92
Steady-State Analysis of an Open Economy General Equilibrium Model for Brazil Mirta Noemi Sataka Bugarin, Roberto de Goes Ellery Jr., Victor Gomes Silva, Marcelo Kfoury Muinhos
Apr/2005
93 Avaliação de Modelos de Cálculo de Exigência de Capital para Risco Cambial Claudio H. da S. Barbedo, Gustavo S. Araújo, João Maurício S. Moreira e Ricardo S. Maia Clemente
Abr/2005
94 Simulação Histórica Filtrada: Incorporação da Volatilidade ao Modelo Histórico de Cálculo de Risco para Ativos Não-Lineares Claudio Henrique da Silveira Barbedo, Gustavo Silva Araújo e Eduardo Facó Lemgruber
Abr/2005
95 Comment on Market Discipline and Monetary Policy by Carl Walsh Maurício S. Bugarin and Fábia A. de Carvalho
Apr/2005
96 O que É Estratégia: uma Abordagem Multiparadigmática para a Disciplina Anthero de Moraes Meirelles
Ago/2005
97 Finance and the Business Cycle: a Kalman Filter Approach with Markov Switching Ryan A. Compton and Jose Ricardo da Costa e Silva
Aug/2005
98 Capital Flows Cycle: Stylized Facts and Empirical Evidences for Emerging Market Economies Helio Mori e Marcelo Kfoury Muinhos
Aug/2005
99 Adequação das Medidas de Valor em Risco na Formulação da Exigência de Capital para Estratégias de Opções no Mercado Brasileiro Gustavo Silva Araújo, Claudio Henrique da Silveira Barbedo,e Eduardo Facó Lemgruber
Set/2005
100 Targets and Inflation Dynamics Sergio A. L. Alves and Waldyr D. Areosa
Oct/2005
101 Comparing Equilibrium Real Interest Rates: Different Approaches to Measure Brazilian Rates Marcelo Kfoury Muinhos and Márcio I. Nakane
Mar/2006
102 Judicial Risk and Credit Market Performance: Micro Evidence from Brazilian Payroll Loans Ana Carla A. Costa and João M. P. de Mello
Apr/2006
103 The Effect of Adverse Supply Shocks on Monetary Policy and Output Maria da Glória D. S. Araújo, Mirta Bugarin, Marcelo Kfoury Muinhos and Jose Ricardo C. Silva
Apr/2006
37
104 Extração de Informação de Opções Cambiais no Brasil Eui Jung Chang e Benjamin Miranda Tabak
Abr/2006
105 Representing Roommate’s Preferences with Symmetric Utilities José Alvaro Rodrigues Neto
Apr/2006
106 Testing Nonlinearities Between Brazilian Exchange Rates and Inflation Volatilities Cristiane R. Albuquerque and Marcelo Portugal
May/2006
107 Demand for Bank Services and Market Power in Brazilian Banking Márcio I. Nakane, Leonardo S. Alencar and Fabio Kanczuk
Jun/2006
108 O Efeito da Consignação em Folha nas Taxas de Juros dos Empréstimos Pessoais Eduardo A. S. Rodrigues, Victorio Chu, Leonardo S. Alencar e Tony Takeda
Jun/2006
109 The Recent Brazilian Disinflation Process and Costs Alexandre A. Tombini and Sergio A. Lago Alves
Jun/2006
110 Fatores de Risco e o Spread Bancário no Brasil Fernando G. Bignotto e Eduardo Augusto de Souza Rodrigues
Jul/2006
111 Avaliação de Modelos de Exigência de Capital para Risco de Mercado do Cupom Cambial Alan Cosme Rodrigues da Silva, João Maurício de Souza Moreira e Myrian Beatriz Eiras das Neves
Jul/2006
112 Interdependence and Contagion: an Analysis of Information Transmission in Latin America's Stock Markets Angelo Marsiglia Fasolo
Jul/2006
113 Investigação da Memória de Longo Prazo da Taxa de Câmbio no Brasil Sergio Rubens Stancato de Souza, Benjamin Miranda Tabak e Daniel O. Cajueiro
Ago/2006
114 The Inequality Channel of Monetary Transmission Marta Areosa and Waldyr Areosa
Aug/2006
115 Myopic Loss Aversion and House-Money Effect Overseas: an Experimental Approach José L. B. Fernandes, Juan Ignacio Peña and Benjamin M. Tabak
Sep/2006
116 Out-Of-The-Money Monte Carlo Simulation Option Pricing: the Join Use of Importance Sampling and Descriptive Sampling Jaqueline Terra Moura Marins, Eduardo Saliby and Joséte Florencio dos Santos
Sep/2006
117 An Analysis of Off-Site Supervision of Banks’ Profitability, Risk and Capital Adequacy: a Portfolio Simulation Approach Applied to Brazilian Banks Theodore M. Barnhill, Marcos R. Souto and Benjamin M. Tabak
Sep/2006
118 Contagion, Bankruptcy and Social Welfare Analysis in a Financial Economy with Risk Regulation Constraint Aloísio P. Araújo and José Valentim M. Vicente
Oct/2006
38
119 A Central de Risco de Crédito no Brasil: uma Análise de Utilidade de Informação Ricardo Schechtman
Out/2006
120 Forecasting Interest Rates: an Application for Brazil Eduardo J. A. Lima, Felipe Luduvice and Benjamin M. Tabak
Oct/2006
121 The Role of Consumer’s Risk Aversion on Price Rigidity Sergio A. Lago Alves and Mirta N. S. Bugarin
Nov/2006
122 Nonlinear Mechanisms of the Exchange Rate Pass-Through: a Phillips Curve Model With Threshold for Brazil Arnildo da Silva Correa and André Minella
Nov/2006
123 A Neoclassical Analysis of the Brazilian “Lost-Decades” Flávia Mourão Graminho
Nov/2006
124 The Dynamic Relations between Stock Prices and Exchange Rates: Evidence for Brazil Benjamin M. Tabak
Nov/2006
125 Herding Behavior by Equity Foreign Investors on Emerging Markets Barbara Alemanni and José Renato Haas Ornelas
Dec/2006
126 Risk Premium: Insights over the Threshold José L. B. Fernandes, Augusto Hasman and Juan Ignacio Peña
Dec/2006
127 Uma Investigação Baseada em Reamostragem sobre Requerimentos de Capital para Risco de Crédito no Brasil Ricardo Schechtman
Dec/2006
128 Term Structure Movements Implicit in Option Prices Caio Ibsen R. Almeida and José Valentim M. Vicente
Dec/2006
129 Brazil: Taming Inflation Expectations Afonso S. Bevilaqua, Mário Mesquita and André Minella
Jan/2007
130 The Role of Banks in the Brazilian Interbank Market: Does Bank Type Matter? Daniel O. Cajueiro and Benjamin M. Tabak
Jan/2007
131 Long-Range Dependence in Exchange Rates: the Case of the European Monetary System Sergio Rubens Stancato de Souza, Benjamin M. Tabak and Daniel O. Cajueiro
Mar/2007
132 Credit Risk Monte Carlo Simulation Using Simplified Creditmetrics’ Model: the Joint Use of Importance Sampling and Descriptive Sampling Jaqueline Terra Moura Marins and Eduardo Saliby
Mar/2007
133 A New Proposal for Collection and Generation of Information on Financial Institutions’ Risk: the Case of Derivatives Gilneu F. A. Vivan and Benjamin M. Tabak
Mar/2007
134 Amostragem Descritiva no Apreçamento de Opções Européias através de Simulação Monte Carlo: o Efeito da Dimensionalidade e da Probabilidade de Exercício no Ganho de Precisão Eduardo Saliby, Sergio Luiz Medeiros Proença de Gouvêa e Jaqueline Terra Moura Marins
Abr/2007
39
135 Evaluation of Default Risk for the Brazilian Banking Sector Marcelo Y. Takami and Benjamin M. Tabak
May/2007
136 Identifying Volatility Risk Premium from Fixed Income Asian Options Caio Ibsen R. Almeida and José Valentim M. Vicente
May/2007
137 Monetary Policy Design under Competing Models of Inflation Persistence Solange Gouvea e Abhijit Sen Gupta
May/2007
138 Forecasting Exchange Rate Density Using Parametric Models: the Case of Brazil Marcos M. Abe, Eui J. Chang and Benjamin M. Tabak
May/2007
139 Selection of Optimal Lag Length inCointegrated VAR Models with Weak Form of Common Cyclical Features Carlos Enrique Carrasco Gutiérrez, Reinaldo Castro Souza and Osmani Teixeira de Carvalho Guillén
Jun/2007
140 Inflation Targeting, Credibility and Confidence Crises Rafael Santos and Aloísio Araújo
Aug/2007
141 Forecasting Bonds Yields in the Brazilian Fixed income Market Jose Vicente and Benjamin M. Tabak
Aug/2007
142 Crises Análise da Coerência de Medidas de Risco no Mercado Brasileiro de Ações e Desenvolvimento de uma Metodologia Híbrida para o Expected Shortfall Alan Cosme Rodrigues da Silva, Eduardo Facó Lemgruber, José Alberto Rebello Baranowski e Renato da Silva Carvalho
Ago/2007
143 Price Rigidity in Brazil: Evidence from CPI Micro Data Solange Gouvea
Sep/2007
144 The Effect of Bid-Ask Prices on Brazilian Options Implied Volatility: a Case Study of Telemar Call Options Claudio Henrique da Silveira Barbedo and Eduardo Facó Lemgruber
Oct/2007
145 The Stability-Concentration Relationship in the Brazilian Banking System Benjamin Miranda Tabak, Solange Maria Guerra, Eduardo José Araújo Lima and Eui Jung Chang
Oct/2007
146 Movimentos da Estrutura a Termo e Critérios de Minimização do Erro de Previsão em um Modelo Paramétrico Exponencial Caio Almeida, Romeu Gomes, André Leite e José Vicente
Out/2007
147 Explaining Bank Failures in Brazil: Micro, Macro and Contagion Effects (1994-1998) Adriana Soares Sales and Maria Eduarda Tannuri-Pianto
Oct/2007
148 Um Modelo de Fatores Latentes com Variáveis Macroeconômicas para a Curva de Cupom Cambial Felipe Pinheiro, Caio Almeida e José Vicente
Out/2007
149 Joint Validation of Credit Rating PDs under Default Correlation Ricardo Schechtman
Oct/2007
40
150 A Probabilistic Approach for Assessing the Significance of Contextual Variables in Nonparametric Frontier Models: an Application for Brazilian Banks Roberta Blass Staub and Geraldo da Silva e Souza
Oct/2007
151 Building Confidence Intervals with Block Bootstraps for the Variance Ratio Test of Predictability
Nov/2007
Eduardo José Araújo Lima and Benjamin Miranda Tabak
152 Demand for Foreign Exchange Derivatives in Brazil: Hedge or Speculation? Fernando N. de Oliveira and Walter Novaes
Dec/2007
153 Aplicação da Amostragem por Importância à Simulação de Opções Asiáticas Fora do Dinheiro Jaqueline Terra Moura Marins
Dez/2007
154 Identification of Monetary Policy Shocks in the Brazilian Market for Bank Reserves Adriana Soares Sales and Maria Tannuri-Pianto
Dec/2007
155 Does Curvature Enhance Forecasting? Caio Almeida, Romeu Gomes, André Leite and José Vicente
Dec/2007
156 Escolha do Banco e Demanda por Empréstimos: um Modelo de Decisão em Duas Etapas Aplicado para o Brasil Sérgio Mikio Koyama e Márcio I. Nakane
Dez/2007
157 Is the Investment-Uncertainty Link Really Elusive? The Harmful Effects of Inflation Uncertainty in Brazil Tito Nícias Teixeira da Silva Filho
Jan/2008
158 Characterizing the Brazilian Term Structure of Interest Rates Osmani T. Guillen and Benjamin M. Tabak
Feb/2008
159 Behavior and Effects of Equity Foreign Investors on Emerging Markets Barbara Alemanni and José Renato Haas Ornelas
Feb/2008
160 The Incidence of Reserve Requirements in Brazil: Do Bank Stockholders Share the Burden? Fábia A. de Carvalho and Cyntia F. Azevedo
Feb/2008
161 Evaluating Value-at-Risk Models via Quantile Regressions Wagner P. Gaglianone, Luiz Renato Lima and Oliver Linton
Feb/2008
162 Balance Sheet Effects in Currency Crises: Evidence from Brazil Marcio M. Janot, Márcio G. P. Garcia and Walter Novaes
Apr/2008
163 Searching for the Natural Rate of Unemployment in a Large Relative Price Shocks’ Economy: the Brazilian Case Tito Nícias Teixeira da Silva Filho
May/2008
164 Foreign Banks’ Entry and Departure: the recent Brazilian experience (1996-2006) Pedro Fachada
Jun/2008
165 Avaliação de Opções de Troca e Opções de Spread Européias e Americanas Giuliano Carrozza Uzêda Iorio de Souza, Carlos Patrício Samanez e Gustavo Santos Raposo
Jul/2008
41
166 Testing Hyperinflation Theories Using the Inflation Tax Curve: a case study Fernando de Holanda Barbosa and Tito Nícias Teixeira da Silva Filho
Jul/2008
167 O Poder Discriminante das Operações de Crédito das Instituições Financeiras Brasileiras Clodoaldo Aparecido Annibal
Jul/2008
168 An Integrated Model for Liquidity Management and Short-Term Asset Allocation in Commercial Banks Wenersamy Ramos de Alcântara
Jul/2008
169 Mensuração do Risco Sistêmico no Setor Bancário com Variáveis Contábeis e Econômicas Lucio Rodrigues Capelletto, Eliseu Martins e Luiz João Corrar
Jul/2008
170 Política de Fechamento de Bancos com Regulador Não-Benevolente: Resumo e Aplicação Adriana Soares Sales
Jul/2008
171 Modelos para a Utilização das Operações de Redesconto pelos Bancos com Carteira Comercial no Brasil Sérgio Mikio Koyama e Márcio Issao Nakane
Ago/2008
172 Combining Hodrick-Prescott Filtering with a Production Function Approach to Estimate Output Gap Marta Areosa
Aug/2008
173 Exchange Rate Dynamics and the Relationship between the Random Walk Hypothesis and Official Interventions Eduardo José Araújo Lima and Benjamin Miranda Tabak
Aug/2008
174 Foreign Exchange Market Volatility Information: an investigation of real-dollar exchange rate Frederico Pechir Gomes, Marcelo Yoshio Takami and Vinicius Ratton Brandi
Aug/2008
175 Evaluating Asset Pricing Models in a Fama-French Framework Carlos Enrique Carrasco Gutierrez and Wagner Piazza Gaglianone
Dec/2008
176 Fiat Money and the Value of Binding Portfolio Constraints Mário R. Páscoa, Myrian Petrassi and Juan Pablo Torres-Martínez
Dec/2008
177 Preference for Flexibility and Bayesian Updating Gil Riella
Dec/2008
178 An Econometric Contribution to the Intertemporal Approach of the Current Account Wagner Piazza Gaglianone and João Victor Issler
Dec/2008
179 Are Interest Rate Options Important for the Assessment of Interest Rate Risk? Caio Almeida and José Vicente
Dec/2008
180 A Class of Incomplete and Ambiguity Averse Preferences Leandro Nascimento and Gil Riella
Dec/2008
181 Monetary Channels in Brazil through the Lens of a Semi-Structural Model André Minella and Nelson F. Souza-Sobrinho
Apr/2009
42
182 Avaliação de Opções Americanas com Barreiras Monitoradas de Forma Discreta Giuliano Carrozza Uzêda Iorio de Souza e Carlos Patrício Samanez
Abr/2009
183 Ganhos da Globalização do Capital Acionário em Crises Cambiais Marcio Janot e Walter Novaes
Abr/2009
184 Behavior Finance and Estimation Risk in Stochastic Portfolio Optimization José Luiz Barros Fernandes, Juan Ignacio Peña and Benjamin Miranda Tabak
Apr/2009
185 Market Forecasts in Brazil: performance and determinants Fabia A. de Carvalho and André Minella
Apr/2009
186 Previsão da Curva de Juros: um modelo estatístico com variáveis macroeconômicas André Luís Leite, Romeu Braz Pereira Gomes Filho e José Valentim Machado Vicente
Maio/2009
187 The Influence of Collateral on Capital Requirements in the Brazilian Financial System: an approach through historical average and logistic regression on probability of default Alan Cosme Rodrigues da Silva, Antônio Carlos Magalhães da Silva, Jaqueline Terra Moura Marins, Myrian Beatriz Eiras da Neves and Giovani Antonio Silva Brito
Jun/2009
188 Pricing Asian Interest Rate Options with a Three-Factor HJM Model Claudio Henrique da Silveira Barbedo, José Valentim Machado Vicente and Octávio Manuel Bessada Lion
Jun/2009
189 Linking Financial and Macroeconomic Factors to Credit Risk Indicators of Brazilian Banks Marcos Souto, Benjamin M. Tabak and Francisco Vazquez
Jul/2009
190 Concentração Bancária, Lucratividade e Risco Sistêmico: uma abordagem de contágio indireto Bruno Silva Martins e Leonardo S. Alencar
Set/2009
191 Concentração e Inadimplência nas Carteiras de Empréstimos dos Bancos Brasileiros Patricia L. Tecles, Benjamin M. Tabak e Roberta B. Staub
Set/2009
192 Inadimplência do Setor Bancário Brasileiro: uma avaliação de suas medidas Clodoaldo Aparecido Annibal
Set/2009
193 Loss Given Default: um estudo sobre perdas em operações prefixadas no mercado brasileiro Antonio Carlos Magalhães da Silva, Jaqueline Terra Moura Marins e Myrian Beatriz Eiras das Neves
Set/2009
194 Testes de Contágio entre Sistemas Bancários – A crise do subprime Benjamin M. Tabak e Manuela M. de Souza
Set/2009
195 From Default Rates to Default Matrices: a complete measurement of Brazilian banks' consumer credit delinquency Ricardo Schechtman
Oct/2009
43
196 The role of macroeconomic variables in sovereign risk Marco S. Matsumura and José Valentim Vicente
Oct/2009
197 Forecasting the Yield Curve for Brazil Daniel O. Cajueiro, Jose A. Divino and Benjamin M. Tabak
Nov/2009
198 Impacto dos Swaps Cambiais na Curva de Cupom Cambial: uma análise segundo a regressão de componentes principais Alessandra Pasqualina Viola, Margarida Sarmiento Gutierrez, Octávio Bessada Lion e Cláudio Henrique Barbedo
Nov/2009
199 Delegated Portfolio Management and Risk Taking Behavior José Luiz Barros Fernandes, Juan Ignacio Peña and Benjamin Miranda Tabak
Dec/2009
200 Evolution of Bank Efficiency in Brazil: A DEA Approach Roberta B. Staub, Geraldo Souza and Benjamin M. Tabak
Dec/2009
201 Efeitos da Globalização na Inflação Brasileira Rafael Santos e Márcia S. Leon
Jan/2010
202 Considerações sobre a Atuação do Banco Central na Crise de 2008 Mário Mesquita e Mario Torós
Mar/2010
203 Hiato do Produto e PIB no Brasil: uma Análise de Dados em Tempo Real Rafael Tiecher Cusinato, André Minella e Sabino da Silva Pôrto Júnior
Abr/2010
204 Fiscal and monetary policy interaction: a simulation based analysis of a two-country New Keynesian DSGE model with heterogeneous households Marcos Valli and Fabia A. de Carvalho
Apr/2010
205 Model selection, estimation and forecasting in VAR models with short-run and long-run restrictions George Athanasopoulos, Osmani Teixeira de Carvalho Guillén, João Victor Issler and Farshid Vahid
Apr/2010
206 Fluctuation Dynamics in US interest rates and the role of monetary policy Daniel Oliveira Cajueiro and Benjamin M. Tabak
Apr/2010
207 Brazilian Strategy for Managing the Risk of Foreign Exchange Rate Exposure During a Crisis Antonio Francisco A. Silva Jr.
Apr/2010
208 Correlação de default: uma investigação empírica de créditos de varejo no Brasil Antonio Carlos Magalhães da Silva, Arnildo da Silva Correa, Jaqueline Terra Moura Marins e Myrian Beatriz Eiras das Neves
Maio/2010
209 Produção Industrial no Brasil: uma análise de dados em tempo real Rafael Tiecher Cusinato, André Minella e Sabino da Silva Pôrto Júnior
Maio/2010
210 Determinants of Bank Efficiency: the case of Brazil Patricia Tecles and Benjamin M. Tabak
May/2010

44
211 Pessimistic Foreign Investors and Turmoil in Emerging Markets: the case of Brazil in 2002 Sandro C. Andrade and Emanuel Kohlscheen
Aug/2010