Embed Size (px)
Citation preview
Investor Presentation
March 2014
www.bice.cl
2
Presenters
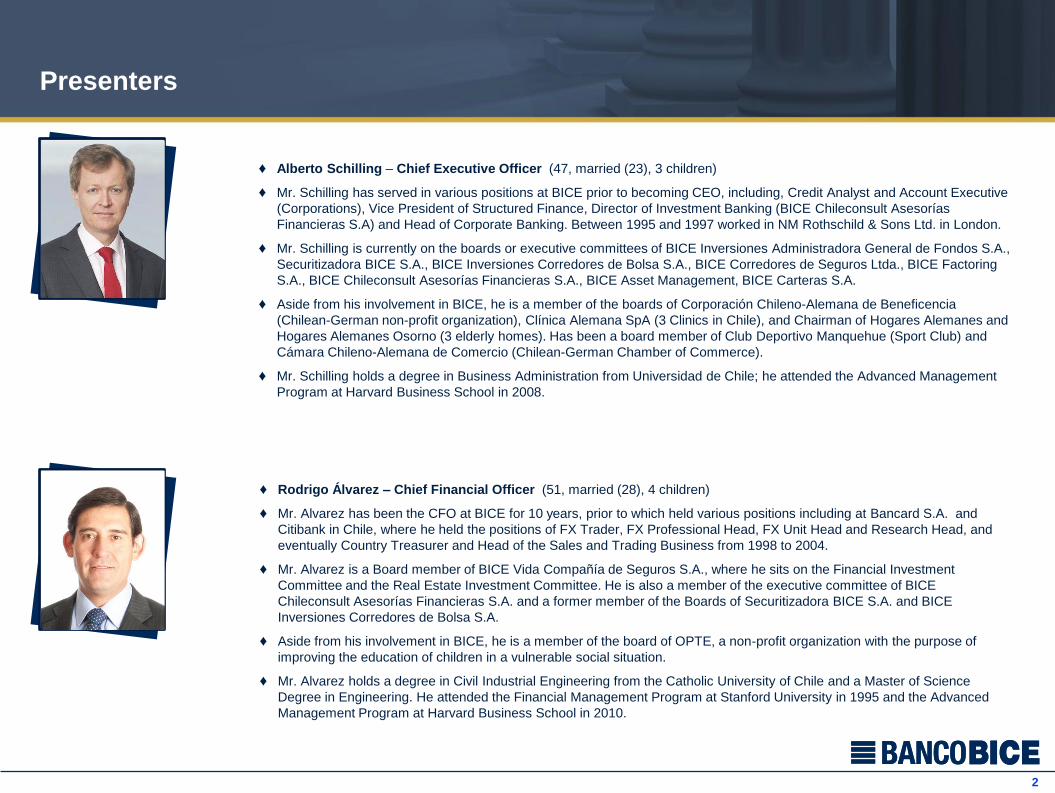
♦ Alberto Schilling – Chief Executive Officer (47, married (23), 3 children)
♦ Mr. Schilling has served in various positions at BICE prior to becoming CEO, including, Credit Analyst and Account Executive
(Corporations), Vice President of Structured Finance, Director of Investment Banking (BICE Chileconsult Asesorías
Financieras S.A) and Head of Corporate Banking. Between 1995 and 1997 worked in NM Rothschild & Sons Ltd. in London.
♦ Mr. Schilling is currently on the boards or executive committees of BICE Inversiones Administradora General de Fondos S.A.,
Securitizadora BICE S.A., BICE Inversiones Corredores de Bolsa S.A., BICE Corredores de Seguros Ltda., BICE Factoring
S.A., BICE Chileconsult Asesorías Financieras S.A., BICE Asset Management, BICE Carteras S.A.
♦ Aside from his involvement in BICE, he is a member of the boards of Corporación Chileno-Alemana de Beneficencia
(Chilean-German non-profit organization), Clínica Alemana SpA (3 Clinics in Chile), and Chairman of Hogares Alemanes and
Hogares Alemanes Osorno (3 elderly homes). Has been a board member of Club Deportivo Manquehue (Sport Club) and
Cámara Chileno-Alemana de Comercio (Chilean-German Chamber of Commerce).
♦ Mr. Schilling holds a degree in Business Administration from Universidad de Chile; he attended the Advanced Management
Program at Harvard Business School in 2008.
♦ Rodrigo Álvarez – Chief Financial Officer (51, married (28), 4 children)
♦ Mr. Alvarez has been the CFO at BICE for 10 years, prior to which held various positions including at Bancard S.A. and
Citibank in Chile, where he held the positions of FX Trader, FX Professional Head, FX Unit Head and Research Head, and
eventually Country Treasurer and Head of the Sales and Trading Business from 1998 to 2004.
♦ Mr. Alvarez is a Board member of BICE Vida Compañía de Seguros S.A., where he sits on the Financial Investment
Committee and the Real Estate Investment Committee. He is also a member of the executive committee of BICE
Chileconsult Asesorías Financieras S.A. and a former member of the Boards of Securitizadora BICE S.A. and BICE
Inversiones Corredores de Bolsa S.A.
♦ Aside from his involvement in BICE, he is a member of the board of OPTE, a non-profit organization with the purpose of
improving the education of children in a vulnerable social situation.
♦ Mr. Alvarez holds a degree in Civil Industrial Engineering from the Catholic University of Chile and a Master of Science
Degree in Engineering. He attended the Financial Management Program at Stanford University in 1995 and the Advanced
Management Program at Harvard Business School in 2010.
Section 1
Investor Highlights
www.bice.cl
4
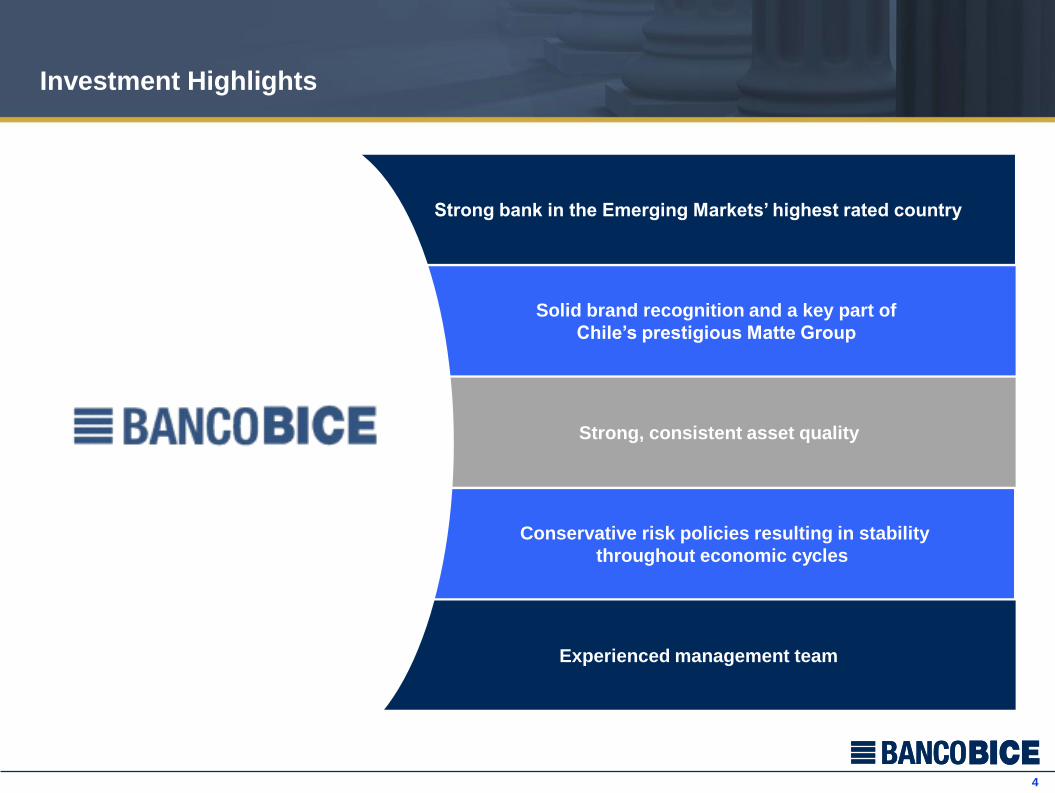
Investment Highlights
Strong bank in the Emerging Markets’ highest rated country
Strong, consistent asset quality
Conservative risk policies resulting in stability
throughout economic cycles
Experienced management team
Solid brand recognition and a key part of
Chile’s prestigious Matte Group
Section 2
Chilean Macroeconomic Highlights
www.bice.cl
6
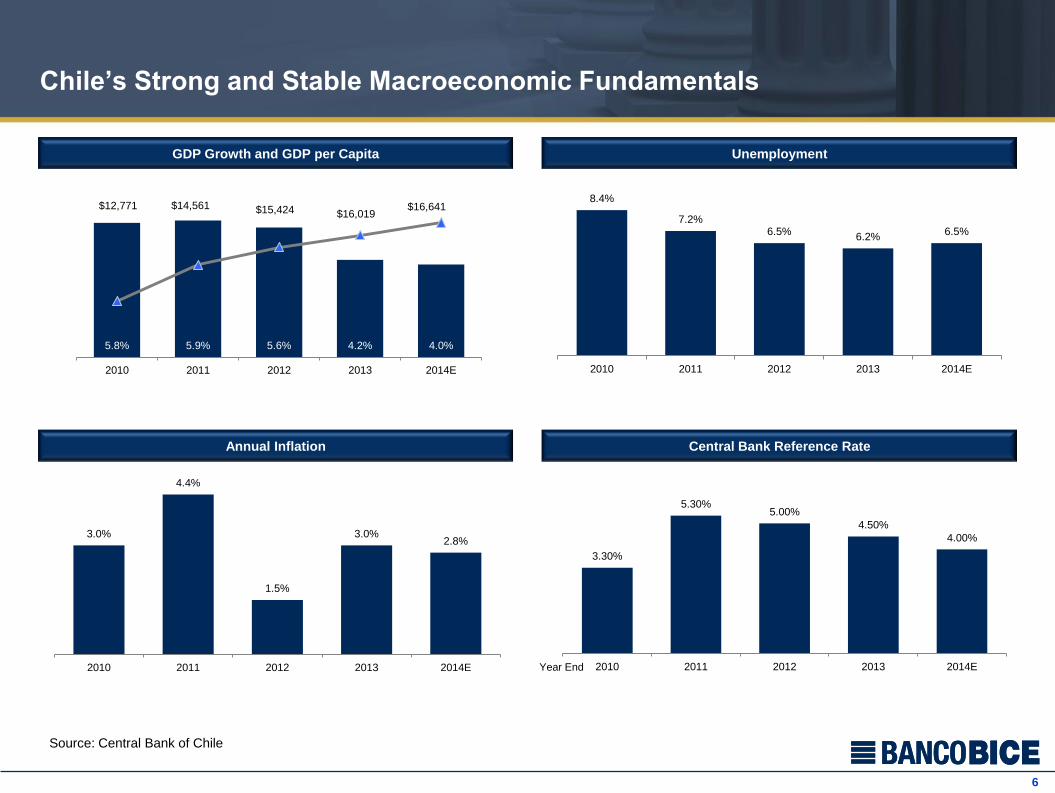
Chile’s Strong and Stable Macroeconomic Fundamentals
GDP Growth and GDP per Capita Unemployment
Annual Inflation Central Bank Reference Rate
8.4%
7.2% 6.5%
6.2% 6.5%
2010 2011 2012 2013 2014E
3.30%
5.30% 5.00%
4.50%
4.00%
2010 2011 2012 2013 2014E
Source: Central Bank of Chile
3.0%
4.4%
1.5%
3.0% 2.8%
2010 2011 2012 2013 2014E Year End
5.8% 5.9% 5.6% 4.2% 4.0%
$12,771 $14,561 $15,424 $16,019 $16,641
$10,000
$12,000
$14,000
$16,000
$18,000
0.0%
1.0%
2.0%
3.0%
4.0%
5.0%
6.0%
7.0%
2010 2011 2012 2013 2014E
7
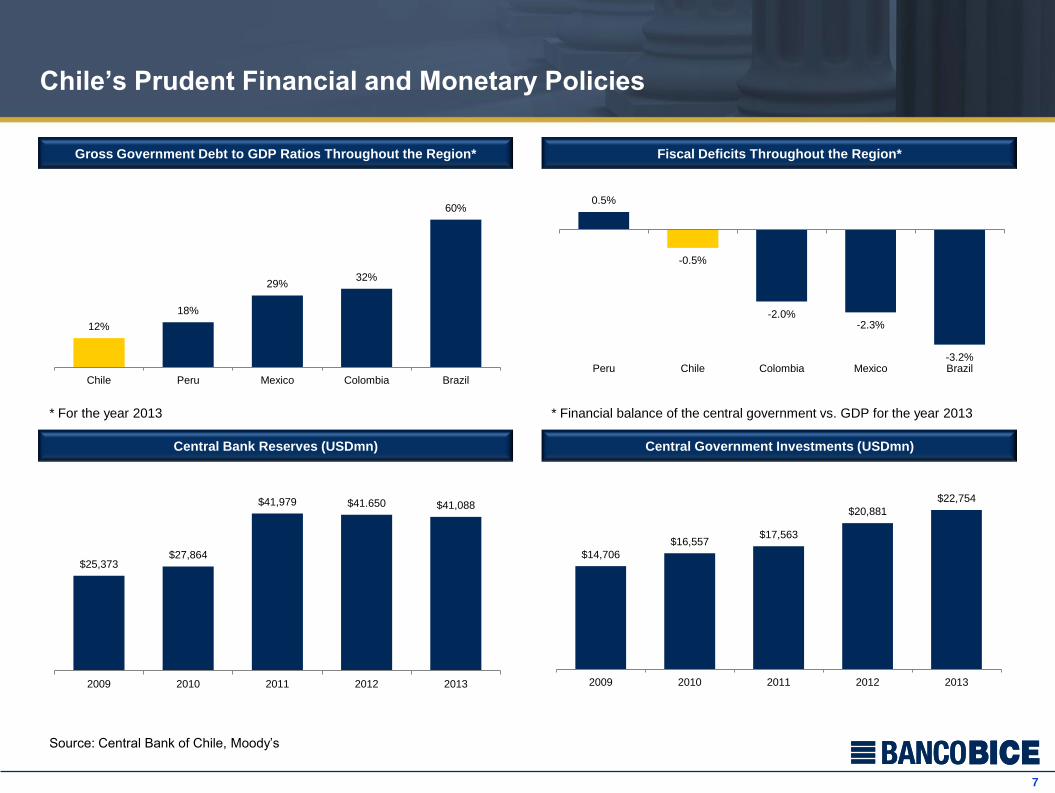
Chile’s Prudent Financial and Monetary Policies
Gross Government Debt to GDP Ratios Throughout the Region* Fiscal Deficits Throughout the Region*
Central Bank Reserves (USDmn) Central Government Investments (USDmn)
Source: Central Bank of Chile, Moody’s
$25,373 $27,864
$41,979 $41.650 $41,088
2009 2010 2011 2012 2013
12%
18%
29% 32%
60%
Chile Peru Mexico Colombia Brazil
0.5%
-0.5%
-2.0% -2.3%
-3.2% Peru Chile Colombia Mexico Brazil
* Financial balance of the central government vs. GDP for the year 2013
$14,706
$16,557 $17,563
$20,881
$22,754
2009 2010 2011 2012 2013
* For the year 2013
8
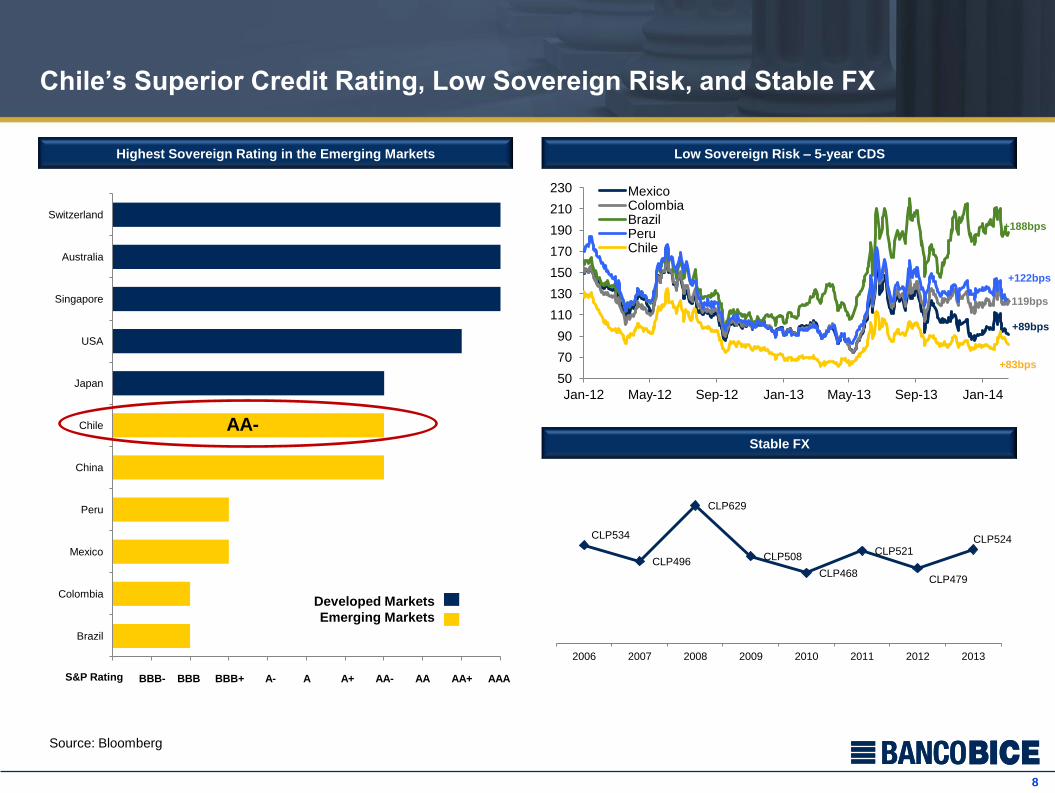
Chile’s Superior Credit Rating, Low Sovereign Risk, and Stable FX
Highest Sovereign Rating in the Emerging Markets Low Sovereign Risk – 5-year CDS
BBB- BBB BBB+ A- A A+ AA- AA AA+ AAA
Source: Bloomberg
50
70
90
110
130
150
170
190
210
230
Jan-12 May-12 Sep-12 Jan-13 May-13 Sep-13 Jan-14
Mexico Colombia Brazil Peru Chile
Brazil
Colombia
Mexico
Peru
China
Chile
Japan
USA
Singapore
Australia
Switzerland
Developed Markets
Emerging Markets
+188bps
+83bps
+89bps
+119bps
+122bps
Stable FX
CLP534
CLP496
CLP629
CLP508
CLP468
CLP521
CLP479
CLP524
2006 2007 2008 2009 2010 2011 2012 2013
AA-
S&P Rating
9
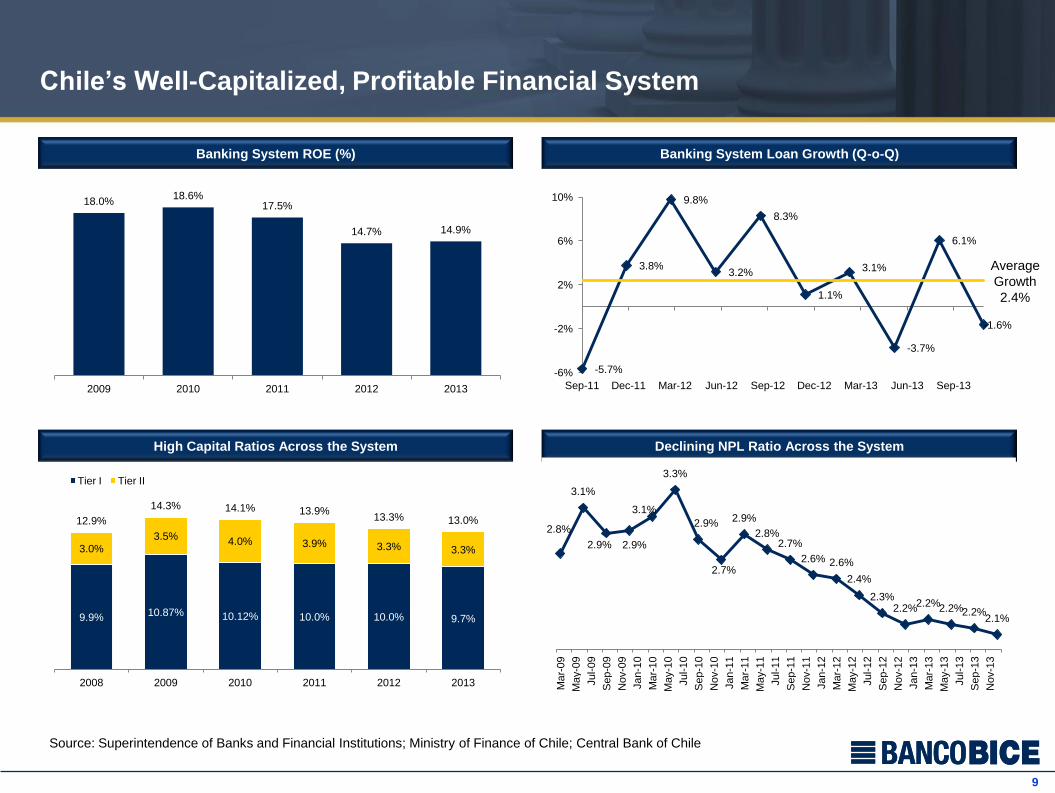
Chile’s Well-Capitalized, Profitable Financial System
Banking System ROE (%) Banking System Loan Growth (Q-o-Q)
High Capital Ratios Across the System Declining NPL Ratio Across the System
Source: Superintendence of Banks and Financial Institutions; Ministry of Finance of Chile; Central Bank of Chile
-5.7%
3.8%
9.8%
3.2%
8.3%
1.1%
3.1%
-3.7%
6.1%
-1.6%
-6%
-2%
2%
6%
10%
Sep-11 Dec-11 Mar-12 Jun-12 Sep-12 Dec-12 Mar-13 Jun-13 Sep-13
Average
Growth
2.4%
9.9% 10.87% 10.12% 10.0% 10.0% 9.7%
3.0% 3.5%
4.0% 3.9% 3.3% 3.3%
12.9%
14.3% 14.1% 13.9% 13.3% 13.0%
2008 2009 2010 2011 2012 2013
Tier I Tier II
2.8%
3.1%
2.9% 2.9%
3.1%
3.3%
2.9%
2.7%
2.9%
2.8% 2.7%
2.6% 2.6%
2.4%
2.3% 2.2%
2.2% 2.2% 2.2%
2.1%
Mar-
09
May-0
9
Jul-09
Sep-0
9
Nov-0
9
Jan-1
0
Mar-
10
May-1
0
Jul-10
Sep-1
0
Nov-1
0
Jan-1
1
Mar-
11
May-1
1
Jul-11
Sep-1
1
Nov-1
1
Jan-1
2
Mar-
12
May-1
2
Jul-12
Sep-1
2
Nov-1
2
Jan-1
3
Mar-
13
May-1
3
Jul-13
Sep-1
3
Nov-1
3
18.0% 18.6%
17.5%
14.7% 14.9%
2009 2010 2011 2012 2013
Section 3
Banco BICE Overview
www.bice.cl
11
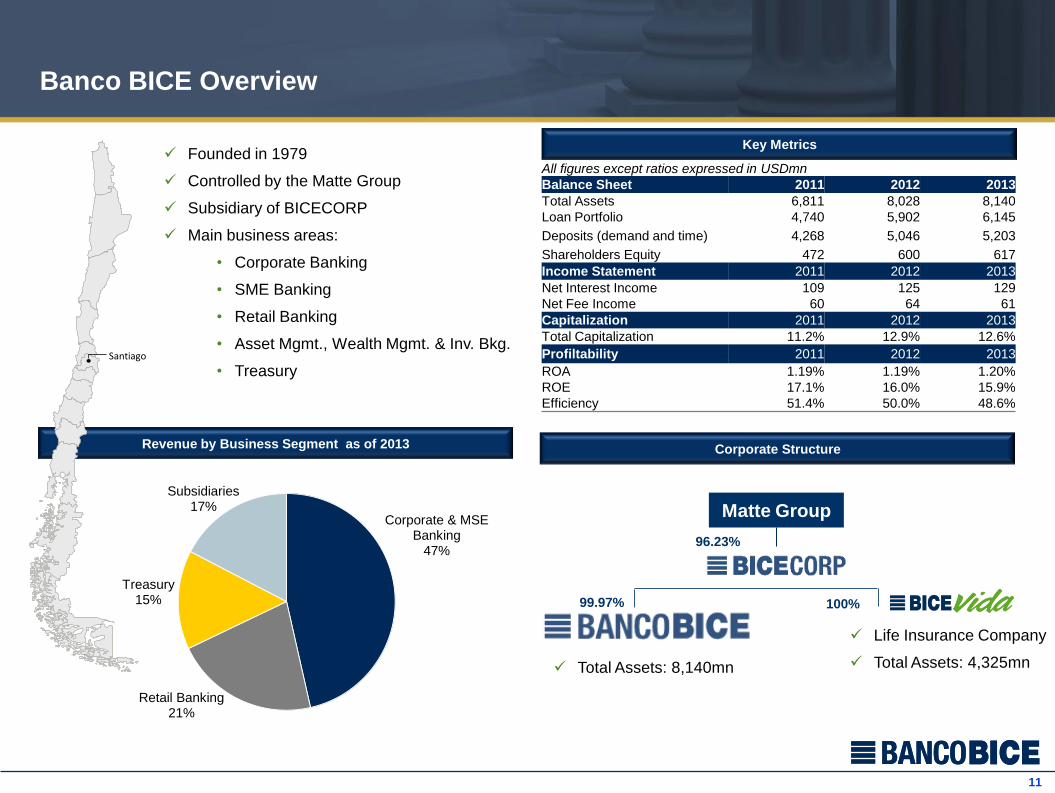
Corporate & MSE Banking
47%
Retail Banking 21%
Treasury 15%
Subsidiaries 17%
Banco BICE Overview
All figures except ratios expressed in USDmn
Balance Sheet 2011 2012 2013
Total Assets 6,811 8,028 8,140
Loan Portfolio 4,740 5,902 6,145
Deposits (demand and time) 4,268 5,046 5,203
Shareholders Equity 472 600 617
Income Statement 2011 2012 2013
Net Interest Income 109 125 129
Net Fee Income 60 64 61
Capitalization 2011 2012 2013
Total Capitalization 11.2% 12.9% 12.6%
Profiltability 2011 2012 2013
ROA 1.19% 1.19% 1.20%
ROE 17.1% 16.0% 15.9%
Efficiency 51.4% 50.0% 48.6%
99.97% 100%
Matte Group
96.23%
Corporate Structure
Key Metrics Founded in 1979
Controlled by the Matte Group
Subsidiary of BICECORP
Main business areas:
• Corporate Banking
• SME Banking
• Retail Banking
• Asset Mgmt., Wealth Mgmt. & Inv. Bkg.
• Treasury
Revenue by Business Segment as of 2013
Santiago
Life Insurance Company
Total Assets: 4,325mn
Total Assets: 8,140mn
12
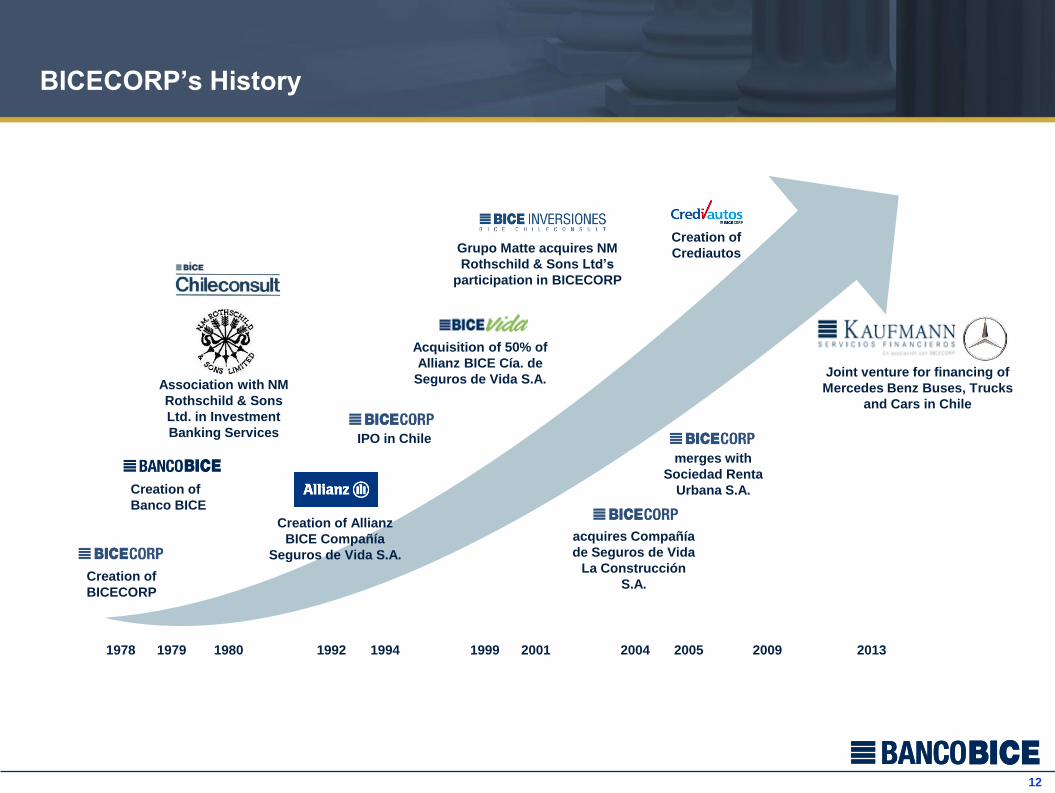
BICECORP’s History
1979
Creation of
Banco BICE
1992
Creation of Allianz
BICE Compañía
Seguros de Vida S.A.
IPO in Chile
2005
acquires Compañía
de Seguros de Vida
La Construcción
S.A.
1980
Association with NM
Rothschild & Sons
Ltd. in Investment
Banking Services
2001
Acquisition of 50% of
Allianz BICE Cía. de
Seguros de Vida S.A.
2004
Grupo Matte acquires NM
Rothschild & Sons Ltd’s
participation in BICECORP
1994
Creation of
BICECORP
1978
merges with
Sociedad Renta
Urbana S.A.
2013
Joint venture for financing of
Mercedes Benz Buses, Trucks
and Cars in Chile
2009
Creation of
Crediautos
1999
13
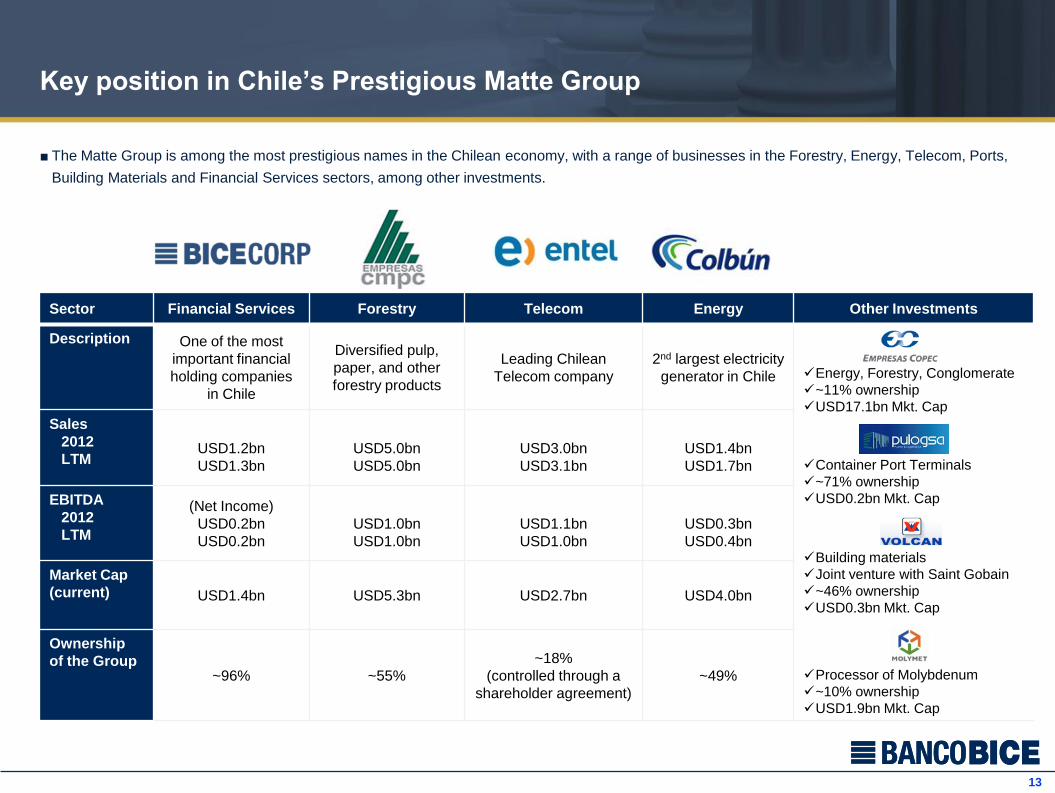
Key position in Chile’s Prestigious Matte Group
■ The Matte Group is among the most prestigious names in the Chilean economy, with a range of businesses in the Forestry, Energy, Telecom, Ports,
Building Materials and Financial Services sectors, among other investments.
Sector Financial Services Forestry Telecom Energy Other Investments
Description One of the most
important financial
holding companies
in Chile
Diversified pulp,
paper, and other
forestry products
Leading Chilean
Telecom company
2nd largest electricity
generator in Chile
Energy, Forestry, Conglomerate
~11% ownership
USD17.1bn Mkt. Cap
Container Port Terminals
~71% ownership
USD0.2bn Mkt. Cap
Building materials
Joint venture with Saint Gobain
~46% ownership
USD0.3bn Mkt. Cap
Processor of Molybdenum
~10% ownership
USD1.9bn Mkt. Cap
Sales
2012
LTM
USD1.2bn
USD1.3bn
USD5.0bn
USD5.0bn
USD3.0bn
USD3.1bn
USD1.4bn
USD1.7bn
EBITDA
2012
LTM
(Net Income)
USD0.2bn
USD0.2bn
USD1.0bn
USD1.0bn
USD1.1bn
USD1.0bn
USD0.3bn
USD0.4bn
Market Cap
(current) USD1.4bn USD5.3bn USD2.7bn USD4.0bn
Ownership
of the Group ~96% ~55%
~18%
(controlled through a
shareholder agreement)
~49%
14
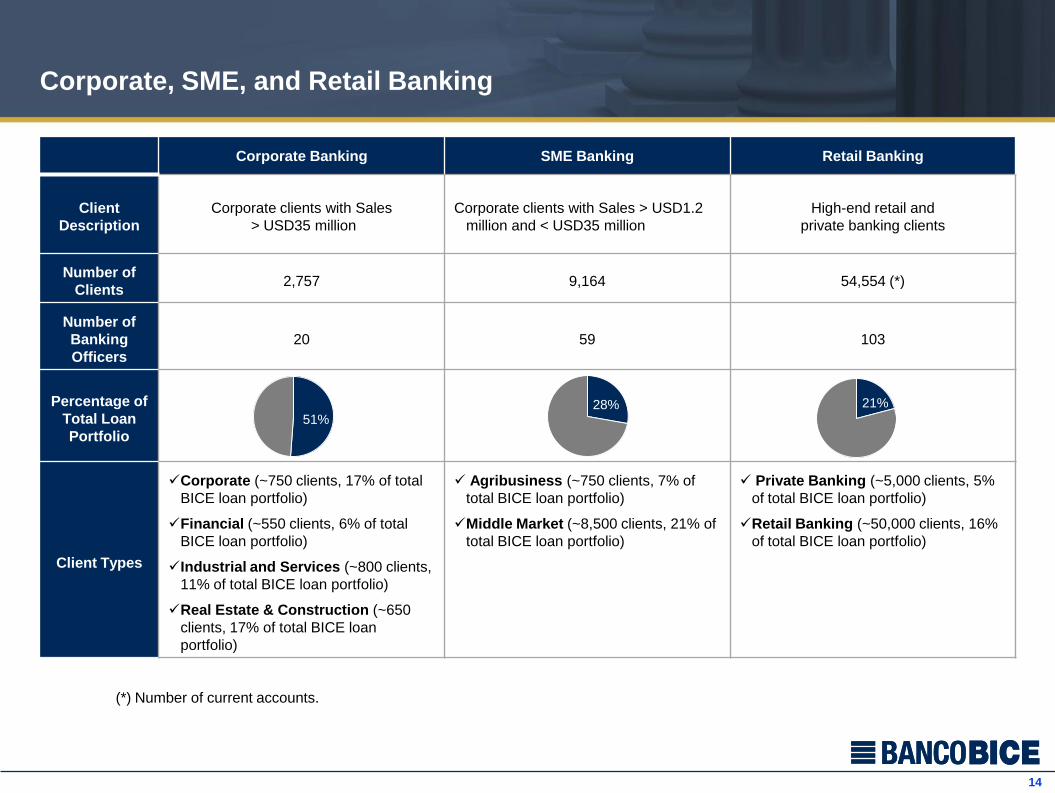
Corporate, SME, and Retail Banking
Corporate Banking SME Banking Retail Banking
Client
Description
Corporate clients with Sales
> USD35 million
Corporate clients with Sales > USD1.2
million and < USD35 million
High-end retail and
private banking clients
Number of
Clients 2,757 9,164 54,554 (*)
Number of
Banking
Officers
20 59 103
Percentage of
Total Loan
Portfolio
Client Types
Corporate (~750 clients, 17% of total
BICE loan portfolio)
Financial (~550 clients, 6% of total
BICE loan portfolio)
Industrial and Services (~800 clients,
11% of total BICE loan portfolio)
Real Estate & Construction (~650
clients, 17% of total BICE loan
portfolio)
Agribusiness (~750 clients, 7% of
total BICE loan portfolio)
Middle Market (~8,500 clients, 21% of
total BICE loan portfolio)
Private Banking (~5,000 clients, 5%
of total BICE loan portfolio)
Retail Banking (~50,000 clients, 16%
of total BICE loan portfolio)
51% 28% 21%
(*) Number of current accounts.
15
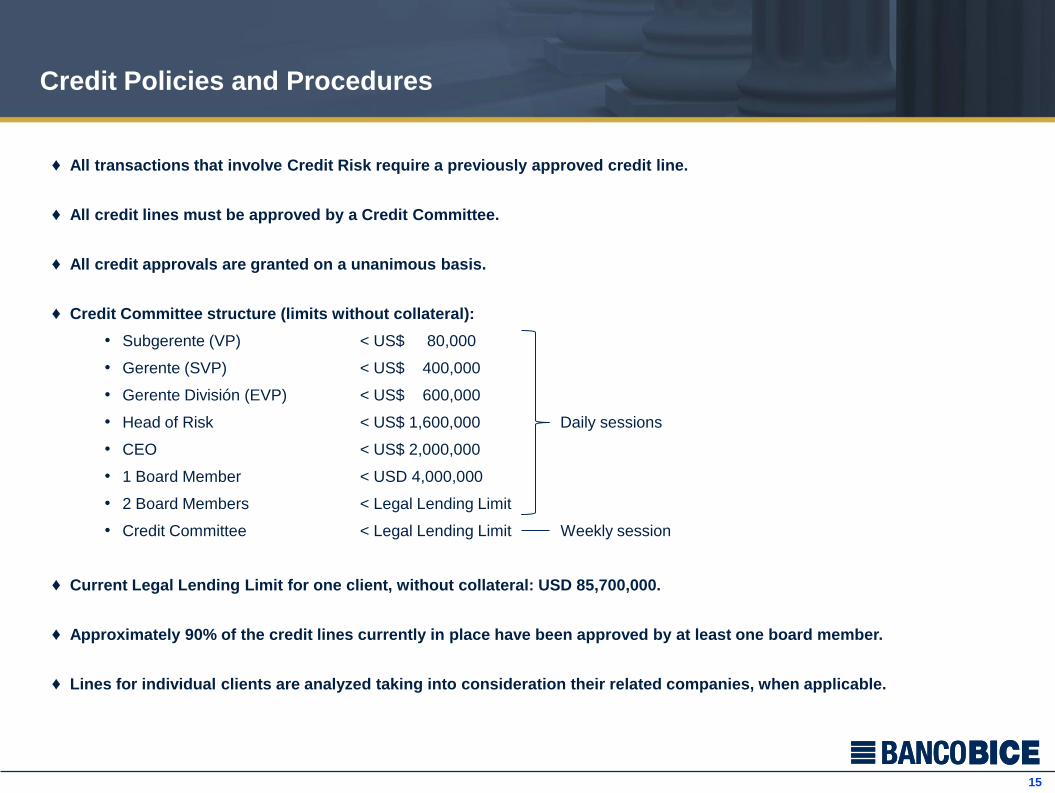
Credit Policies and Procedures
♦ All transactions that involve Credit Risk require a previously approved credit line.
♦ All credit lines must be approved by a Credit Committee.
♦ All credit approvals are granted on a unanimous basis.
♦ Credit Committee structure (limits without collateral):
• Subgerente (VP) < US$ 80,000
• Gerente (SVP) < US$ 400,000
• Gerente División (EVP) < US$ 600,000
• Head of Risk < US$ 1,600,000 Daily sessions
• CEO < US$ 2,000,000
• 1 Board Member < USD 4,000,000
• 2 Board Members < Legal Lending Limit
• Credit Committee < Legal Lending Limit Weekly session
♦ Current Legal Lending Limit for one client, without collateral: USD 85,700,000.
♦ Approximately 90% of the credit lines currently in place have been approved by at least one board member.
♦ Lines for individual clients are analyzed taking into consideration their related companies, when applicable.
16
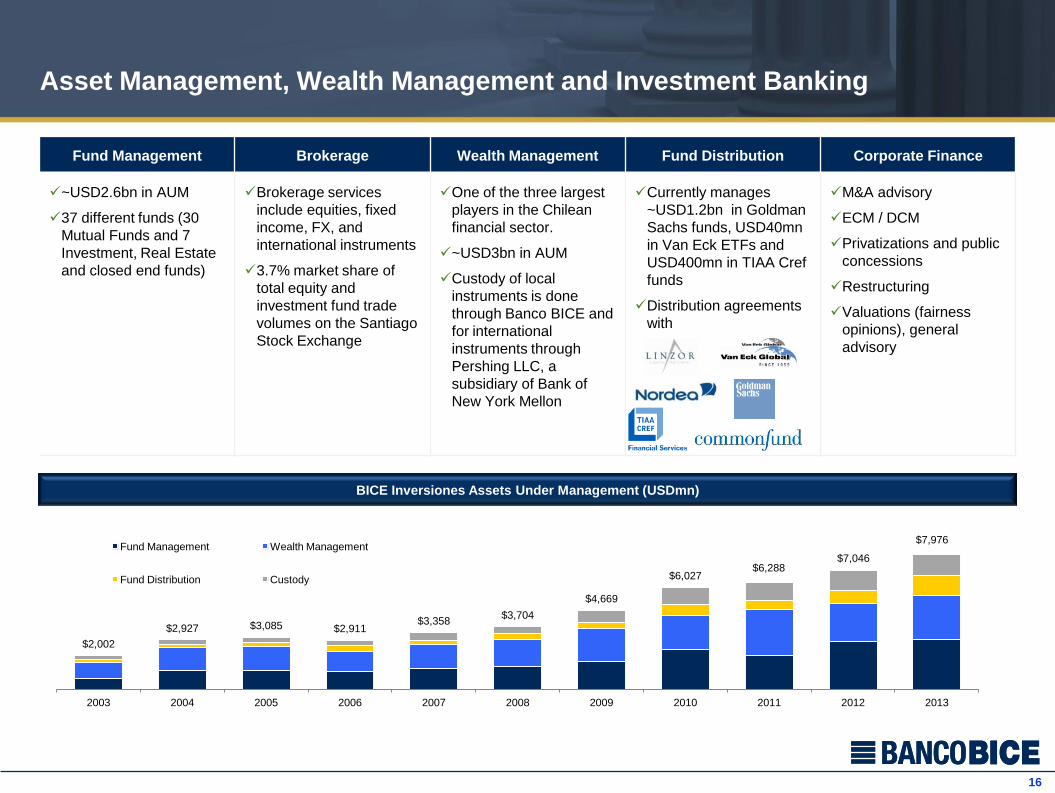
Fund Management Brokerage Wealth Management Fund Distribution Corporate Finance
~USD2.6bn in AUM
37 different funds (30
Mutual Funds and 7
Investment, Real Estate
and closed end funds)
Brokerage services
include equities, fixed
income, FX, and
international instruments
3.7% market share of
total equity and
investment fund trade
volumes on the Santiago
Stock Exchange
One of the three largest
players in the Chilean
financial sector.
~USD3bn in AUM
Custody of local
instruments is done
through Banco BICE and
for international
instruments through
Pershing LLC, a
subsidiary of Bank of
New York Mellon
Currently manages
~USD1.2bn in Goldman
Sachs funds, USD40mn
in Van Eck ETFs and
USD400mn in TIAA Cref
funds
Distribution agreements
with
M&A advisory
ECM / DCM
Privatizations and public
concessions
Restructuring
Valuations (fairness
opinions), general
advisory
Asset Management, Wealth Management and Investment Banking
BICE Inversiones Assets Under Management (USDmn)
$2,002
$2,927 $3,085 $2,911 $3,358
$3,704
$4,669
$6,027 $6,288
$7,046
$7,976
2003 2004 2005 2006 2007 2008 2009 2010 2011 2012 2013
Fund Management Wealth Management
Fund Distribution Custody
17
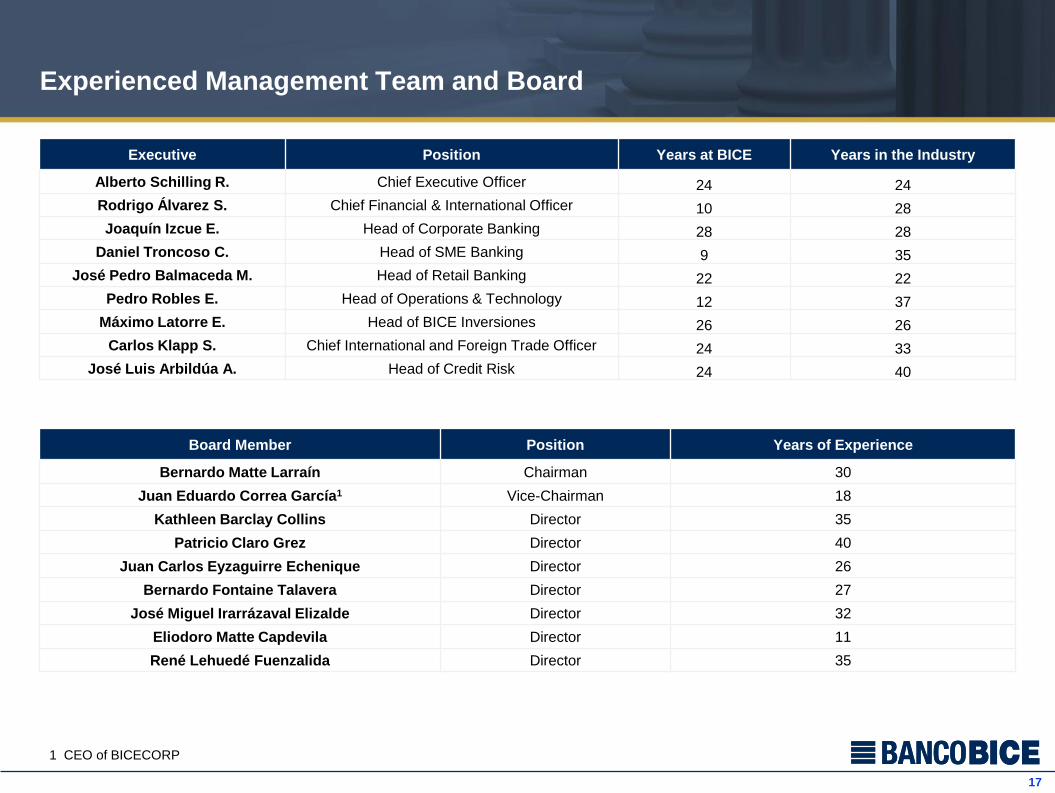
Experienced Management Team and Board
Board Member Position Years of Experience
Bernardo Matte Larraín Chairman 30
Juan Eduardo Correa García1 Vice-Chairman 18
Kathleen Barclay Collins Director 35
Patricio Claro Grez Director 40
Juan Carlos Eyzaguirre Echenique Director 26
Bernardo Fontaine Talavera Director 27
José Miguel Irarrázaval Elizalde Director 32
Eliodoro Matte Capdevila Director 11
René Lehuedé Fuenzalida Director 35
Executive Position Years at BICE Years in the Industry
Alberto Schilling R. Chief Executive Officer 24 24
Rodrigo Álvarez S. Chief Financial & International Officer 10 28
Joaquín Izcue E. Head of Corporate Banking 28 28
Daniel Troncoso C. Head of SME Banking 9 35
José Pedro Balmaceda M. Head of Retail Banking 22 22
Pedro Robles E. Head of Operations & Technology 12 37
Máximo Latorre E. Head of BICE Inversiones 26 26
Carlos Klapp S. Chief International and Foreign Trade Officer 24 33
José Luis Arbildúa A. Head of Credit Risk 24 40
1 CEO of BICECORP
Section 4
Financial Highlights
www.bice.cl
19
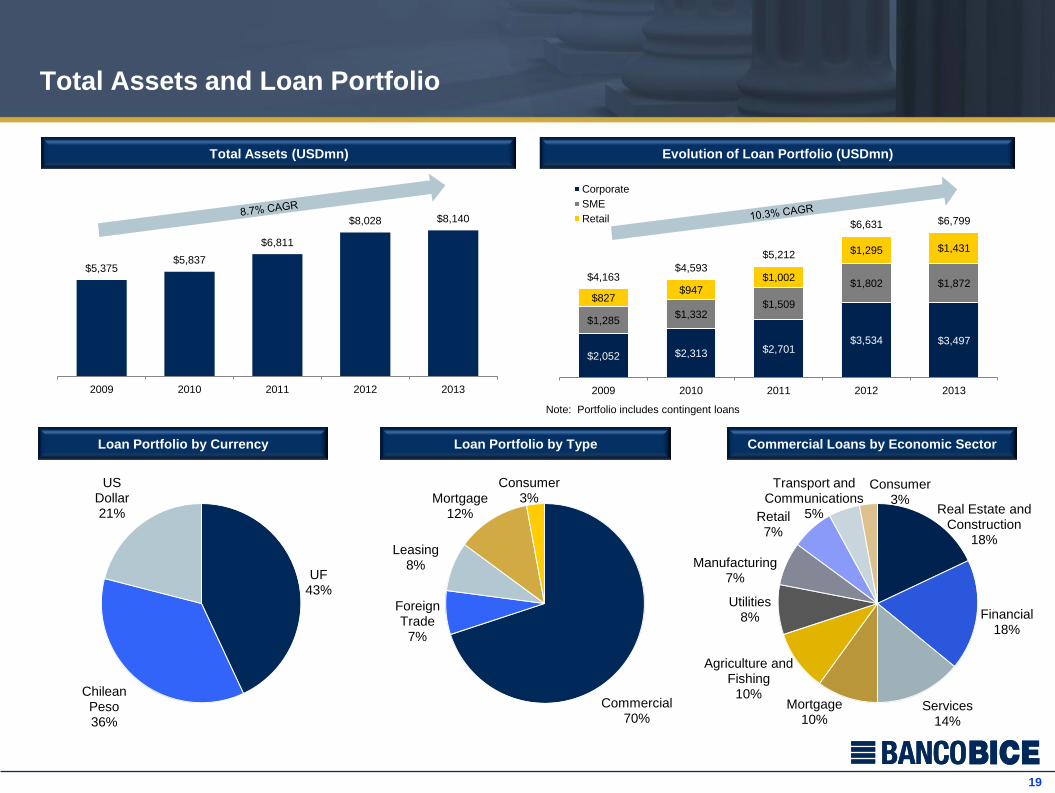
Total Assets and Loan Portfolio
Total Assets (USDmn) Evolution of Loan Portfolio (USDmn)
Real Estate and Construction
18%
Financial 18%
Services 14%
Mortgage 10%
Agriculture and Fishing
10%
Utilities 8%
Manufacturing 7%
Retail 7%
Transport and Communications
5%
Consumer 3%
Loan Portfolio by Currency Loan Portfolio by Type Commercial Loans by Economic Sector
Commercial 70%
Foreign Trade
7%
Leasing 8%
Mortgage 12%
Consumer 3%
UF 43%
Chilean Peso 36%
US Dollar 21%
$5,375 $5,837
$6,811
$8,028 $8,140
2009 2010 2011 2012 2013
$2,052 $2,313 $2,701 $3,534 $3,497
$1,285 $1,332
$1,509
$1,802 $1,872
$827 $947
$1,002
$1,295 $1,431
$4,163 $4,593
$5,212
$6,631 $6,799
2009 2010 2011 2012 2013
Corporate
SME
Retail
Note: Portfolio includes contingent loans
20
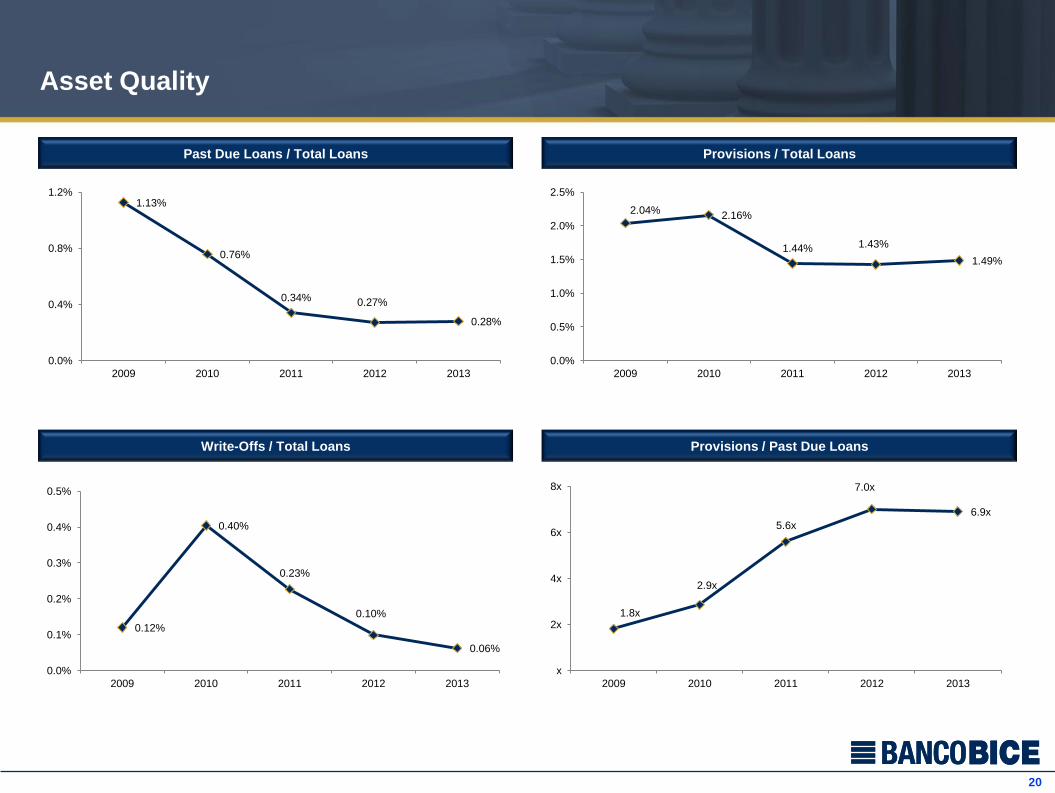
Asset Quality
Past Due Loans / Total Loans Provisions / Total Loans
Write-Offs / Total Loans Provisions / Past Due Loans
1.13%
0.76%
0.34% 0.27%
0.28%
0.0%
0.4%
0.8%
1.2%
2009 2010 2011 2012 2013
2.04% 2.16%
1.44% 1.43%
1.49%
0.0%
0.5%
1.0%
1.5%
2.0%
2.5%
2009 2010 2011 2012 2013
0.12%
0.40%
0.23%
0.10%
0.06%
0.0%
0.1%
0.2%
0.3%
0.4%
0.5%
2009 2010 2011 2012 2013
1.8x
2.9x
5.6x
7.0x
6.9x
x
2x
4x
6x
8x
2009 2010 2011 2012 2013
21
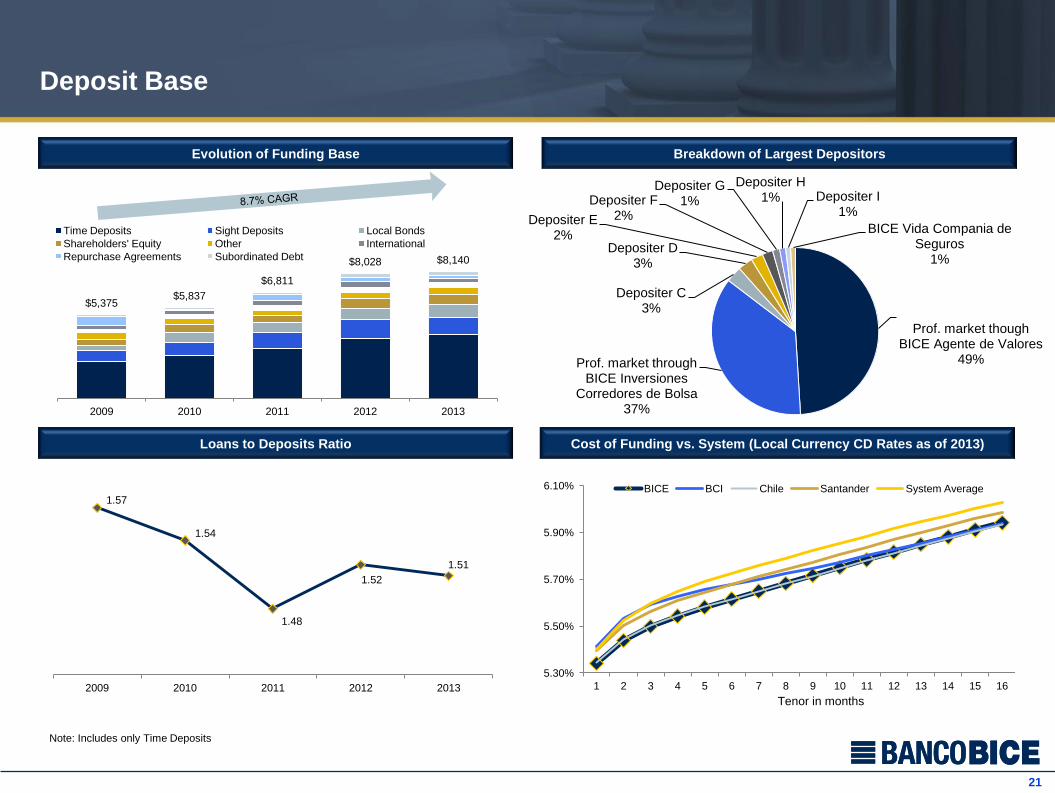
5.30%
5.50%
5.70%
5.90%
6.10%
1 2 3 4 5 6 7 8 9 10 11 12 13 14 15 16
BICE BCI Chile Santander System Average
$5,375 $5,837
$6,811
$8,028 $8,140
2009 2010 2011 2012 2013
Time Deposits Sight Deposits Local Bonds
Shareholders' Equity Other International
Repurchase Agreements Subordinated Debt
Deposit Base
Evolution of Funding Base Breakdown of Largest Depositors
Loans to Deposits Ratio Cost of Funding vs. System (Local Currency CD Rates as of 2013)
Prof. market though BICE Agente de Valores
49% Prof. market through BICE Inversiones
Corredores de Bolsa 37%
Depositer C 3%
Depositer D 3%
Depositer E 2%
Depositer F 2%
Depositer G 1%
Depositer H 1% Depositer I
1%
BICE Vida Compania de Seguros
1%
Tenor in months
Note: Includes only Time Deposits
1.57
1.54
1.48
1.52
1.51
2009 2010 2011 2012 2013
22
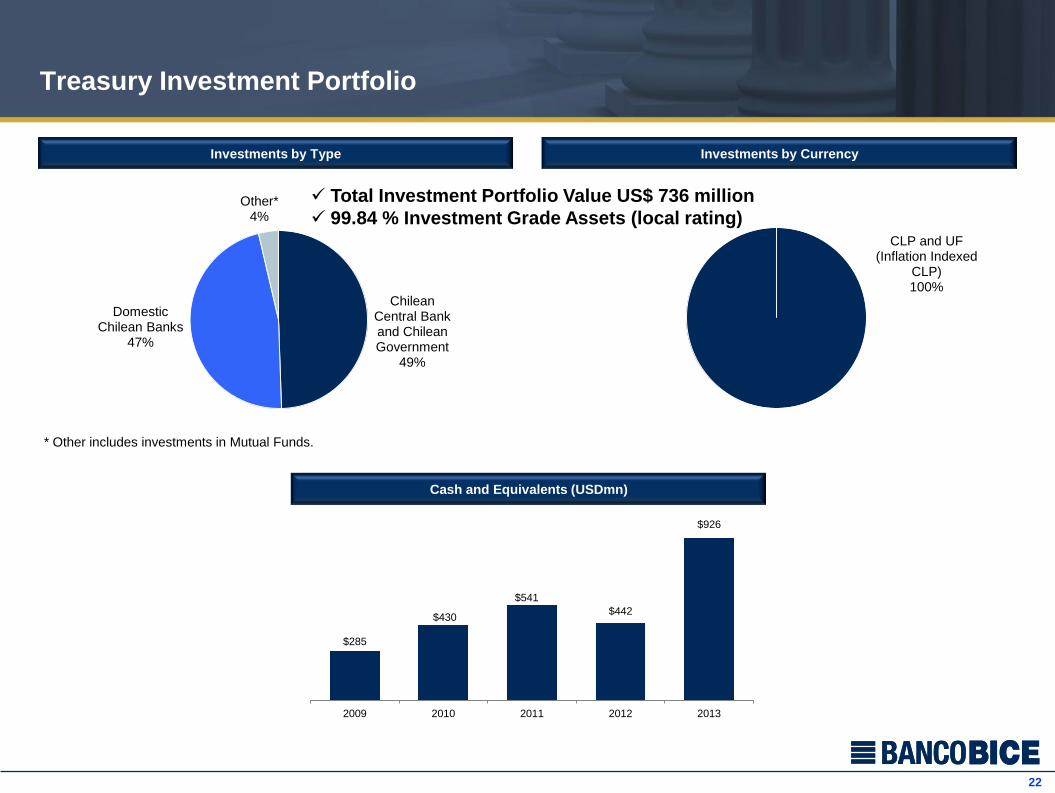
$285
$430
$541
$442
$926
2009 2010 2011 2012 2013
Treasury Investment Portfolio
Investments by Type Investments by Currency
Total Investment Portfolio Value US$ 736 million
99.84 % Investment Grade Assets (local rating)
Chilean Central Bank and Chilean Government
49%
Domestic Chilean Banks
47%
Other* 4%
* Other includes investments in Mutual Funds.
Cash and Equivalents (USDmn)
CLP and UF (Inflation Indexed
CLP) 100%
23
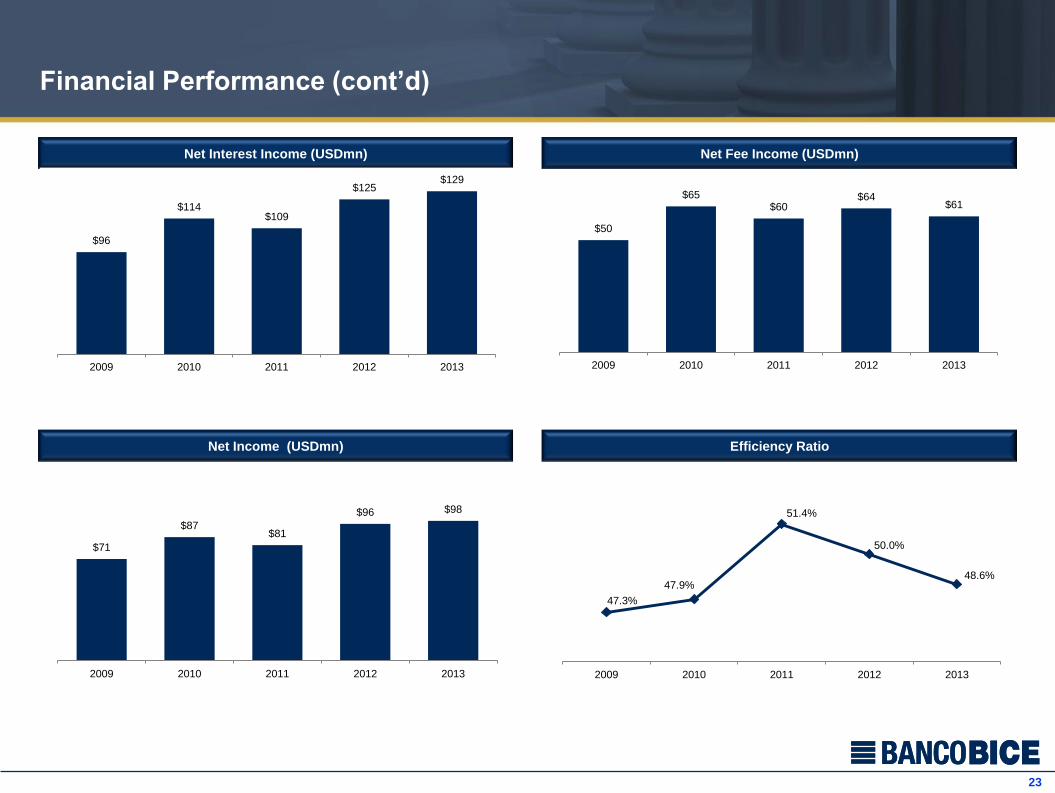
Financial Performance (cont’d)
Net Interest Income (USDmn) Net Fee Income (USDmn)
Net Income (USDmn) Efficiency Ratio
47.3%
47.9%
51.4%
50.0%
48.6%
2009 2010 2011 2012 2013
$50
$65 $60
$64 $61
2009 2010 2011 2012 2013
$96
$114 $109
$125 $129
2009 2010 2011 2012 2013
$71
$87 $81
$96 $98
2009 2010 2011 2012 2013
24
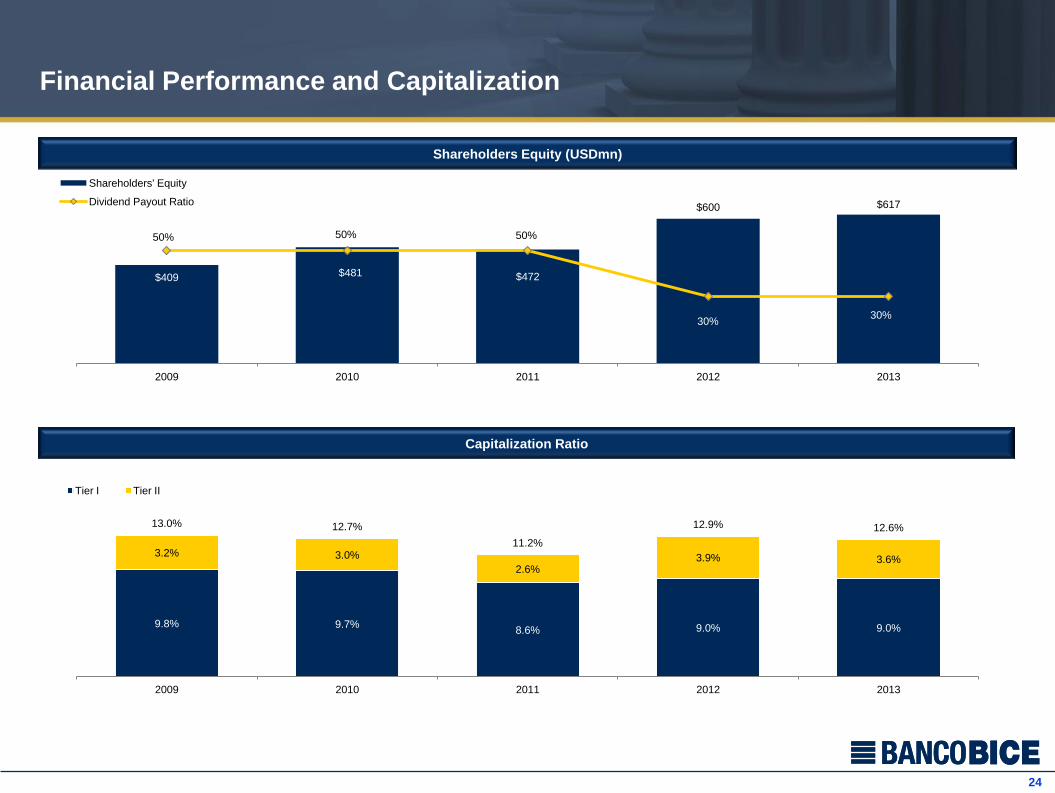
Financial Performance and Capitalization
Shareholders Equity (USDmn)
Capitalization Ratio
$409 $481 $472
$600 $617
50% 50% 50%
30% 30%
0%
25%
50%
75%
0
100
200
300
400
500
600
700
2009 2010 2011 2012 2013
Shareholders' Equity
Dividend Payout Ratio
9.8% 9.7% 8.6% 9.0% 9.0%
3.2% 3.0%
2.6% 3.9% 3.6%
13.0% 12.7%
11.2%
12.9% 12.6%
2009 2010 2011 2012 2013
Tier I Tier II
25
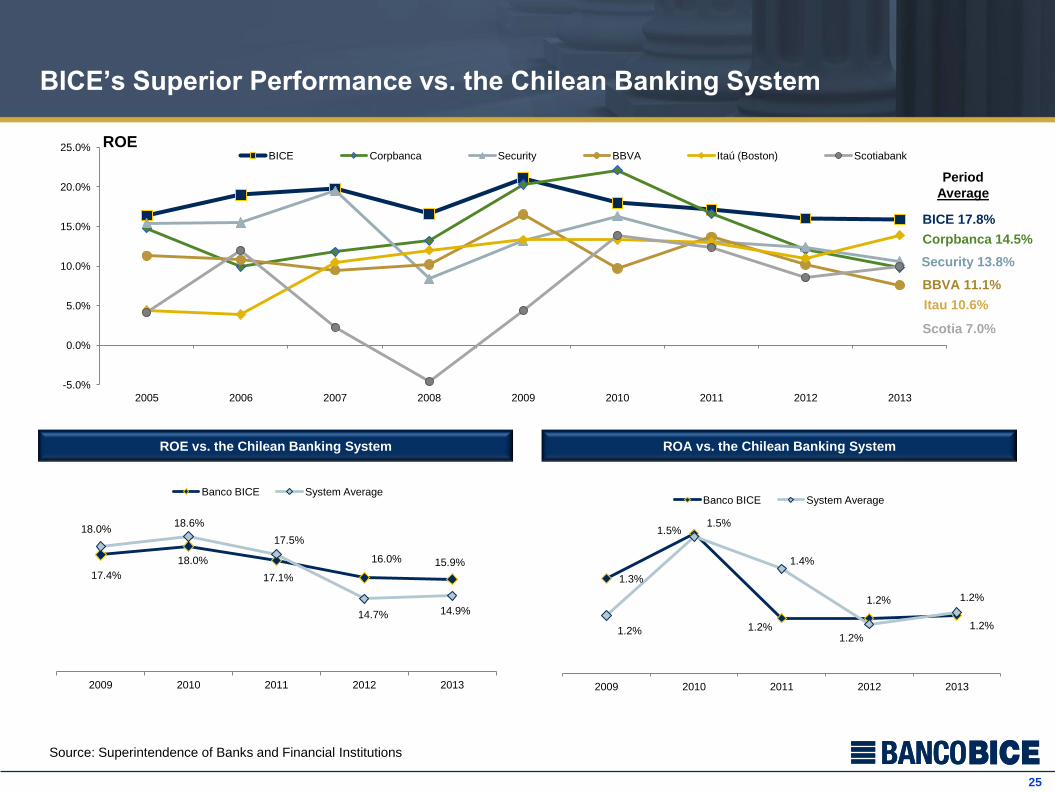
BICE’s Superior Performance vs. the Chilean Banking System
ROE vs. the Chilean Banking System ROA vs. the Chilean Banking System
-5.0%
0.0%
5.0%
10.0%
15.0%
20.0%
25.0%
2005 2006 2007 2008 2009 2010 2011 2012 2013
BICE Corpbanca Security BBVA Itaú (Boston) Scotiabank
Source: Superintendence of Banks and Financial Institutions
BICE 17.8%
Itau 10.6%
Security 13.8%
BBVA 11.1%
Scotia 7.0%
Corpbanca 14.5%
Period
Average
17.4%
18.0%
17.1%
16.0% 15.9%
18.0% 18.6%
17.5%
14.7% 14.9%
2009 2010 2011 2012 2013
Banco BICE System Average
ROE
1.3%
1.5%
1.2%
1.2%
1.2% 1.2%
1.5%
1.4%
1.2%
1.2%
2009 2010 2011 2012 2013
Banco BICE System Average
Thank You
www.bice.cl