Embed Size (px)
Citation preview
The National Evaluation of NASA’s
Science, Engineering, Mathematics
and Aerospace Academy (SEMAA)
Program
March 31, 2010
Cambridge, MA
Bethesda, MD
Chicago, IL
Durham, NC
Hadley, MA
Prepared for
National Aeronautics and Space Administration (NASA)
Office of Education
Prepared by
Alina Martinez, Abt Associates Inc.
Clemencia Cosentino de Cohen, The Urban Institute
Abt Associates Inc.
W. Carter Smith
Kenyon Maree
Amanda Parsad
Caroline Shlager
David Cook
The Urban Institute
Lisa Tsui
Education Development Center, Inc.
Abigail Jurist Levy

THIS PAGE INTENTIONALLY BLANK
Acknowledgements
This report is the result of the collaborative effort of numerous individuals. This study was
conducted with the assistance of Cristofer Price, Jennifer Carney, and Jan Nicholson of Abt
Associates Inc.; Beatriz Chu Clewell, Erin Mudd Gilfenbaum, and Alla Myrvoda of The Urban
Institute; Estella Sena, Kevin McMahon and Joe Cella of Abt‐SRBI; and Erica Fields and Barbara Berns
of the Education Development Center, Inc.
The SEMAA evaluation team would like to thank the students and parents at participating SEMAA
sites for their contributions in completing surveys for this study. We gratefully acknowledge the
cooperation and assistance received from the directors of former and active SEMAA sites who
participated in various aspects of this evaluation. Their thoughtful and detailed responses allowed
us to field the impact study, and collect a wealth of information on the experiences of SEMAA
programs across the country. Special thanks to the former SEMAA site directors and students and
parents, who gave generously of their time to assist us in pilot testing the study protocols.
Our work was much facilitated by the support and guidance of the staff at NASA. We would like to
thank the SEMAA Management Team and NASA Glenn Research Center (Educational Programs
Office) and the National SEMAA Office, Paragon TEC, Inc., who dug into their archives to search for
documentation we requested. We are grateful for the guidance and support of staff from the NASA
Office of Education, including Brian Yoder, Manager for Program Evaluation, and Patrick Murphy,
who served as the program officer for the evaluation, as well as Joyce Winterton, James Stofan,
Shelley Canright, and Bernice Alston.
Lastly, we also thank the reviewers of this report for the helpful feedback provided.
The data collection, analysis and reporting of this material was conducted in accordance with
OMB Control No. 2700‐0136 (expiration April 30, 2010).
Abt Associates Inc. National Evaluation of SEMAA i

THIS PAGE INTENTIONALLY BLANK
Abt Associates Inc. National Evaluation of SEMAA
Contents
Executive Summary ....................................................................................................................... v
Chapter 1: Introduction ................................................................................................................. 1 The SEMAA Program.................................................................................................................... 2 A National Evaluation of SEMAA.................................................................................................. 6 The Issue and Related Factors ..................................................................................................... 6
The importance of high school course‐taking ................................................................... 7 Affective factors influencing STEM persistence: Interest and self‐efficacy ...................... 8 The role of parents in children’s STEM outcomes...........................................................10 Out‐of‐school STEM enrichment activities......................................................................11
Conceptual Framework..............................................................................................................12 SEMAA’s theory of change ..............................................................................................12 How the SEMAA program theory informed the evaluation ............................................17
Chapter 2. Study Design............................................................................................................... 19 Research Questions ...................................................................................................................19 Implementation Study Methodology.........................................................................................19 Impact Study Methodology .......................................................................................................20
Sources of data ................................................................................................................20 Sample for the impact study ...........................................................................................21 Analytic approach for the impact study ..........................................................................23
Chapter 3: Implementation of the SEMAA Program ..................................................................... 25 SEMAA Elements........................................................................................................................25
Project goals ....................................................................................................................25 Project management and governance ............................................................................26 Project components and implementation ......................................................................27 Students served ...............................................................................................................30 SEMAA providers .............................................................................................................32 External support, partnerships and collaborations .........................................................33
SEMAA Implementation.............................................................................................................35 SEMAA models and model selection...............................................................................35 Facilitating implementation ............................................................................................38 Monitoring and evaluation..............................................................................................38 Sustainability ...................................................................................................................39
Chapter 4: Characteristics of SEMAA Participants ........................................................................ 41 Background of Participants ........................................................................................................41 Baseline Levels of Student Outcomes........................................................................................43
Desire to do science.........................................................................................................44 Participation in informal science‐related activities .........................................................44 Interest in informal science activities..............................................................................44
iii
iv National Evaluation of SEMAA Abt Associates Inc.
Change in interest in informal science activities ............................................................ 45 Engagement in school STEM activities............................................................................ 45 Anxiety toward science ................................................................................................... 45 Self‐confidence in science............................................................................................... 45 Interest in high school STEM coursework....................................................................... 46 Interest in college STEM coursework.............................................................................. 46 Interest in STEM careers ................................................................................................. 46 Value of science to society.............................................................................................. 46
Baseline Levels of Parental Outcomes ...................................................................................... 47 Parental support for students’ prior out‐of‐school science activities ............................ 47 Parental support for student’s future out‐of‐school science activities .......................... 48 Parental encouragement of high school STEM coursework ........................................... 48 Parental perception of student’s need to understand science/math as adult............... 48 Parental encouragement of STEM fields in college ........................................................ 48
Chapter 5: Outcomes of SEMAA................................................................................................... 51 Overall SEMAA Impacts ............................................................................................................. 51 Impacts for Prior SEMAA Participants and First‐time Participants ........................................... 53 Exploration of Variation in Participation ................................................................................... 53
Chapter 6: Conclusions and Implications ...................................................................................... 59 Conclusions................................................................................................................................ 59 Recommendations..................................................................................................................... 61 Future Directions for SEMAA..................................................................................................... 62
References................................................................................................................................... 65
Appendix A: Methodological Details ...........................................................................................A‐1 Implementation Study..............................................................................................................A‐1 Impact Study.............................................................................................................................A‐2
Approach to Estimating Impacts ....................................................................................A‐2 Tests for nonresponse bias ............................................................................................A‐4 Baseline Balance Testing................................................................................................A‐7 Study Minimum Detectable Effects ...............................................................................A‐7
Appendix B: Instruments.............................................................................................................B‐1
Abt Associates Inc. National Evaluation of SEMAA
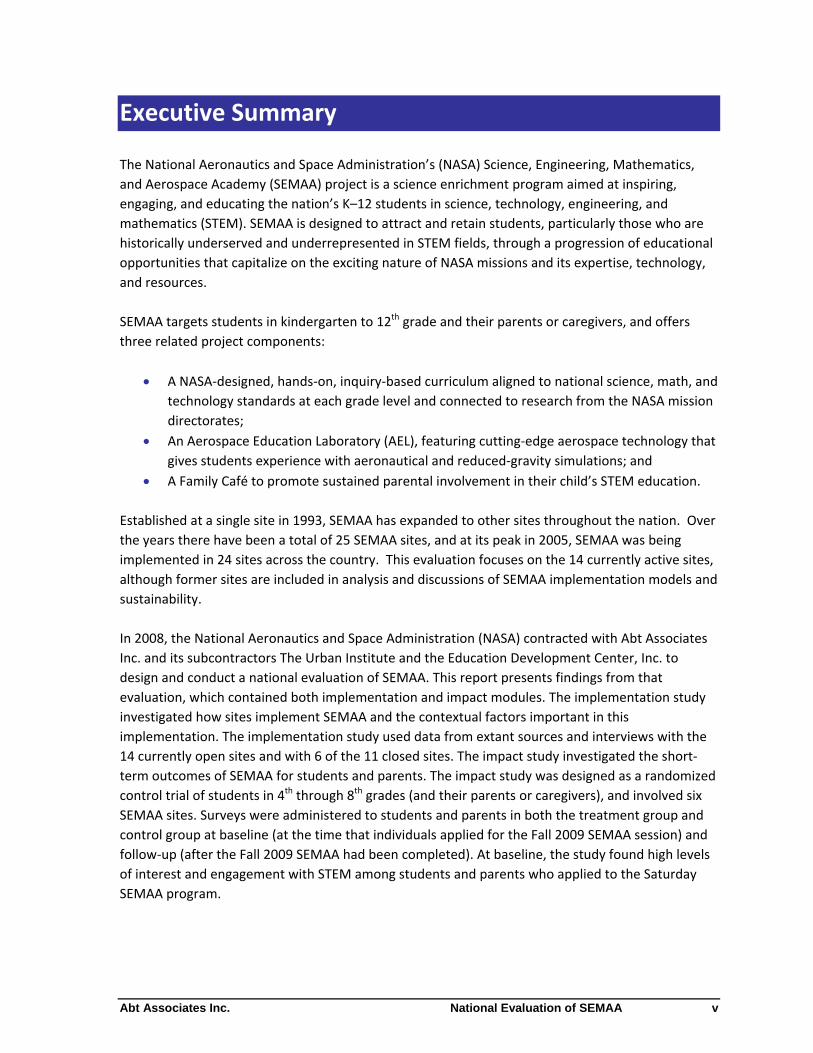
Executive Summary
The National Aeronautics and Space Administration’s (NASA) Science, Engineering, Mathematics,
and Aerospace Academy (SEMAA) project is a science enrichment program aimed at inspiring,
engaging, and educating the nation’s K–12 students in science, technology, engineering, and
mathematics (STEM). SEMAA is designed to attract and retain students, particularly those who are
historically underserved and underrepresented in STEM fields, through a progression of educational
opportunities that capitalize on the exciting nature of NASA missions and its expertise, technology,
and resources.
SEMAA targets students in kindergarten to 12th grade and their parents or caregivers, and offers
three related project components:
A NASA‐designed, hands‐on, inquiry‐based curriculum aligned to national science, math, and
technology standards at each grade level and connected to research from the NASA mission
directorates;
An Aerospace Education Laboratory (AEL), featuring cutting‐edge aerospace technology that
gives students experience with aeronautical and reduced‐gravity simulations; and
A Family Café to promote sustained parental involvement in their child’s STEM education.
Established at a single site in 1993, SEMAA has expanded to other sites throughout the nation. Over
the years there have been a total of 25 SEMAA sites, and at its peak in 2005, SEMAA was being
implemented in 24 sites across the country. This evaluation focuses on the 14 currently active sites,
although former sites are included in analysis and discussions of SEMAA implementation models and
sustainability.
In 2008, the National Aeronautics and Space Administration (NASA) contracted with Abt Associates
Inc. and its subcontractors The Urban Institute and the Education Development Center, Inc. to
design and conduct a national evaluation of SEMAA. This report presents findings from that
evaluation, which contained both implementation and impact modules. The implementation study
investigated how sites implement SEMAA and the contextual factors important in this
implementation. The implementation study used data from extant sources and interviews with the
14 currently open sites and with 6 of the 11 closed sites. The impact study investigated the short‐
term outcomes of SEMAA for students and parents. The impact study was designed as a randomized
control trial of students in 4th through 8th grades (and their parents or caregivers), and involved six
SEMAA sites. Surveys were administered to students and parents in both the treatment group and
control group at baseline (at the time that individuals applied for the Fall 2009 SEMAA session) and
follow‐up (after the Fall 2009 SEMAA had been completed). At baseline, the study found high levels
of interest and engagement with STEM among students and parents who applied to the Saturday
SEMAA program.
v
National Evaluation of SEMAA Abt Associates Inc.
The key findings of the study include:
The study did not reveal overall impacts of the SEMAA program on short‐term outcomes,
but among prior participants, SEMAA led to increased participation in informal science
activities. This impact of SEMAA on prior participants aligns with SEMAA’s longitudinal
approach to engaging students in STEM.
Student attendance had a positive relationship with a greater desire to engage in science‐
related activities, interest in high school STEM courses, interest in college STEM coursework
among students, and parental encouragement for students to pursue a STEM field in
college, as well as with students’ perception that their interest in informal science activities
had increased and with lessened anxiety toward science. Parent attendance in the Family
Café was also positively related to parent and child outcomes.
Sites engage students in SEMAA across multiple years. The recurring exposure is consistent
with SEMAA’s program theory that students should be engaged repeatedly to maintain and
further develop an interest in and engagement with science.
Three models of implementation coexist—two conducted out of school hours (Saturday
model and after‐school model) and one during school hours (in‐school model). The Saturday
model is the most prevalent, but the in‐school model is used to respond to increased
demand and fundraising needs.
Sustainability beyond NASA support requires funding, but site fundraising has been
insufficient to sustain the program without NASA funding, in part because of limited
experience in this area and competing demands.
Monitoring data are limited and would need to be augmented in order to investigate the
long‐term outcomes of SEMAA.
The following recommendations are made based on the findings of this study:
SEMAA sites should continue their existing efforts to engage students in STEM activities
from week to week and year to year, particularly in the out of school models where
attendance is not mandatory.
The SEMAA project should continue to encourage early and ongoing strategic planning at
the sites to establish viable sustainability plans given the particulars of the sites.
The SEMAA project should monitor the various SEMAA models to assess their prospects for
sustainability and to ensure that the intended science content is maintained.
The SEMAA project should continue to conduct grantee training and provide support related
to fundraising and partnerships.
SEMAA should conduct student monitoring data collection that would facilitate the
investigation of the long‐term outcomes of SEMAA.
vi
Abt Associates Inc. National Evaluation of SEMAA
Chapter 1: Introduction
The National Aeronautics and Space Administration’s (NASA) commitment to the nation’s science,
technology, engineering, and mathematics (STEM) education is demonstrated across its education
portfolio, which aims to strengthen the nation's future workforce, attract and retain students in
STEM disciplines, and engage Americans in STEM and in NASA’s mission (NASA, 2007a). As part of
this effort, the NASA Office of Education (OE) oversees education projects that span higher
education, informal education, and precollege (K–12) education. This portfolio augments the efforts
of the National Science Foundation and the U.S. Department of Education, which lead the nation’s
federal STEM education efforts.
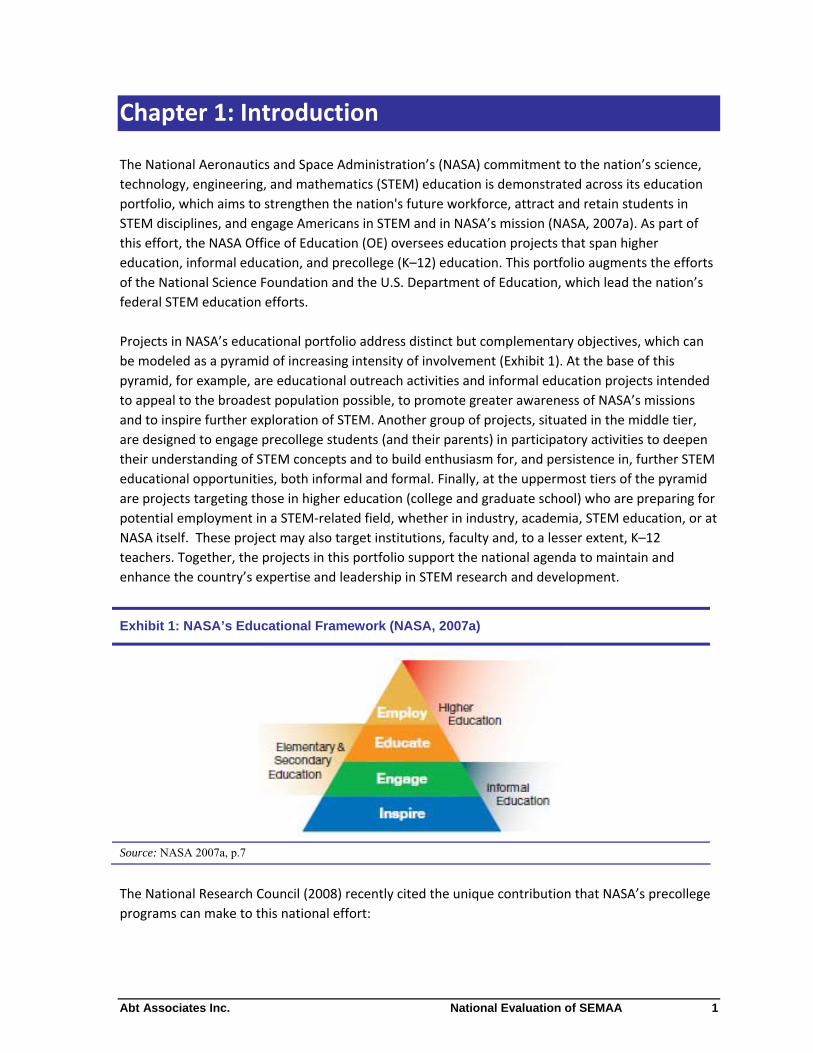
Projects in NASA’s educational portfolio address distinct but complementary objectives, which can
be modeled as a pyramid of increasing intensity of involvement (Exhibit 1). At the base of this
pyramid, for example, are educational outreach activities and informal education projects intended
to appeal to the broadest population possible, to promote greater awareness of NASA’s missions
and to inspire further exploration of STEM. Another group of projects, situated in the middle tier,
are designed to engage precollege students (and their parents) in participatory activities to deepen
their understanding of STEM concepts and to build enthusiasm for, and persistence in, further STEM
educational opportunities, both informal and formal. Finally, at the uppermost tiers of the pyramid
are projects targeting those in higher education (college and graduate school) who are preparing for
potential employment in a STEM‐related field, whether in industry, academia, STEM education, or at
NASA itself. These project may also target institutions, faculty and, to a lesser extent, K–12
teachers. Together, the projects in this portfolio support the national agenda to maintain and
enhance the country’s expertise and leadership in STEM research and development.
Exhibit 1: NASA’s Educational Framework (NASA, 2007a)
Source: NASA 2007a, p.7
The National Research Council (2008) recently cited the unique contribution that NASA’s precollege
programs can make to this national effort:
1
National Evaluation of SEMAA Abt Associates Inc.
The exciting nature of NASA’s mission gives particular value to projects whose primary
goal is to inspire and engage students’ interest in science and engineering, and NASA’s
education portfolio should include projects with these goals. Because engineering and
technology development are subjects that are not well covered in K–12 curricula,
projects aimed at inspiring and engaging students in these areas are particularly
important.1
The Science, Engineering, Mathematics, and Aerospace Academy (SEMAA) project exemplifies
NASA’s efforts to inspire, engage, and educate K–12 students throughout the nation. As part of
NASA’s precollege educational portfolio, the SEMAA program is situated in the middle tier of NASA’s
educational framework, where enhancing student interest and engagement in STEM learning is of
primary importance. Specifically, SEMAA is designed to attract and retain students through a
progression of educational opportunities by capitalizing on the exciting nature of NASA missions and
its expertise, technology, and resources. SEMAA, along with most of NASA’s K–12 efforts, aligns with
the national goal of engagement in STEM fields, as defined by the Academic Competiveness Council,
to “increase students’ engagement in STEM and their perception of its value to their lives.”2
In 2008, NASA contracted with Abt Associates Inc. and its subcontractors The Urban Institute and
the Education Development Center, Inc. (the Abt team) to design and conduct a national evaluation
of SEMAA. This report presents the findings from this evaluation. We begin with an overview of the
SEMAA program and its conceptual framework. Chapter Two describes the evaluation design, which
consisted of two components—an implementation study and an outcomes study. Chapter Three
presents the findings related to the implementation of the SEMAA program. Chapter Four describes
the students who participated in the Saturday sessions of SEMAA, and Chapter Five presents
findings related to outcomes associated with their participation in SEMAA. Finally, Chapter Six
presents the conclusions and implications drawn from this evaluation.
The SEMAA Program
NASA’s SEMAA program is a national science enrichment program, targeting students in
kindergarten to 12th grade and their parents (or other caregivers), that is intended to increase the
participation and retention of students in STEM, particularly those who are historically underserved
and underrepresented in science, technology, engineering, and mathematics fields. In the past three
years alone, over 200,000 students, parents/adult family members and teachers have been involved
in the SEMAA project. The goals of SEMAA are to:
Inspire a more diverse student population to pursue careers in STEM‐related fields;
Engage students, parents/adult family members and teachers by incorporating emerging
technologies; and
1 National Research Council (2008), p. 6.
2 U.S. Department of Education (2007), p. 18.
2
Abt Associates Inc. National Evaluation of SEMAA
Educate students utilizing rigorous STEM curricula, designed and implemented as only NASA
can.3
In 2007, SEMAA was recognized as one of the top 18 programs in the Innovations in the American
Government Awards competition by the Ash Institute for Democratic Governance and Innovation at
Harvard University’s John F. Kennedy School of Government.4
Established in 1993 at the Cuyahoga Community College in Cleveland, Ohio as a joint venture with
the NASA Glenn Research Center, SEMAA has since expanded to other sites throughout the nation.5
Institutions hosting SEMAA encompass a wide range of institutions including Historically Black
Colleges and Universities, Hispanic‐serving institutions, Tribal Colleges and Universities,
predominantly White institutions of higher education, science centers and museums, and
elementary and secondary school districts. Since its inception, there have been 25 SEMAA sites, and
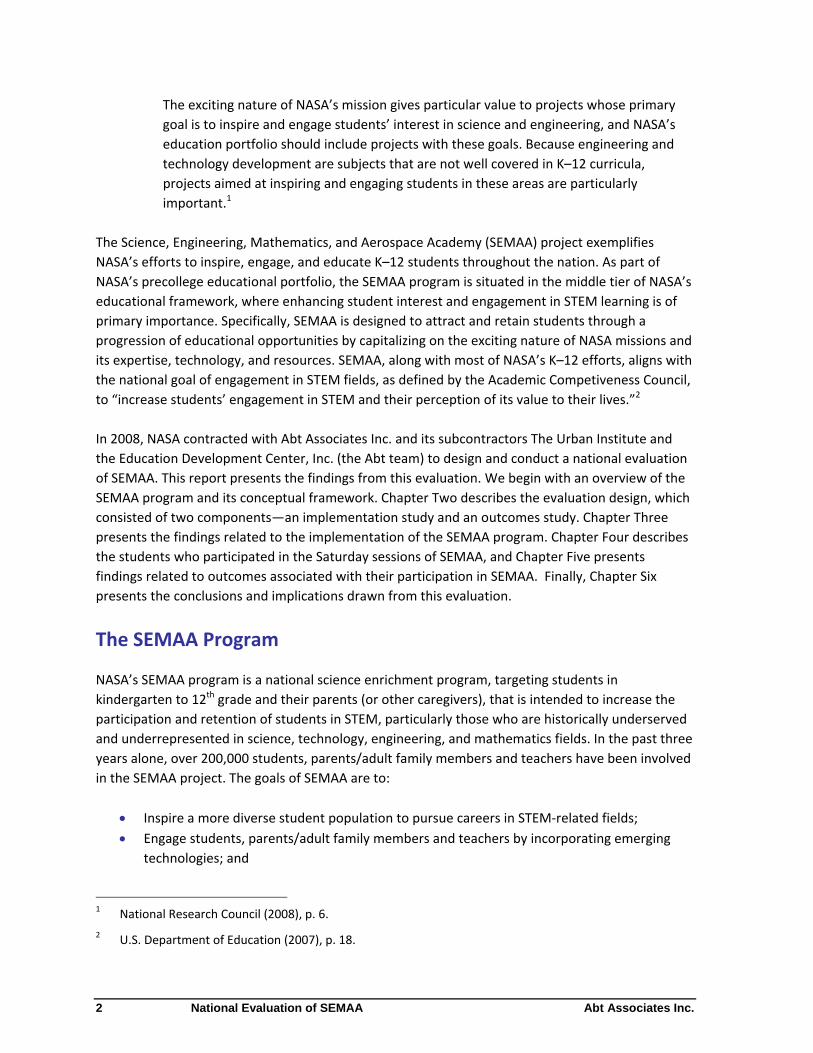
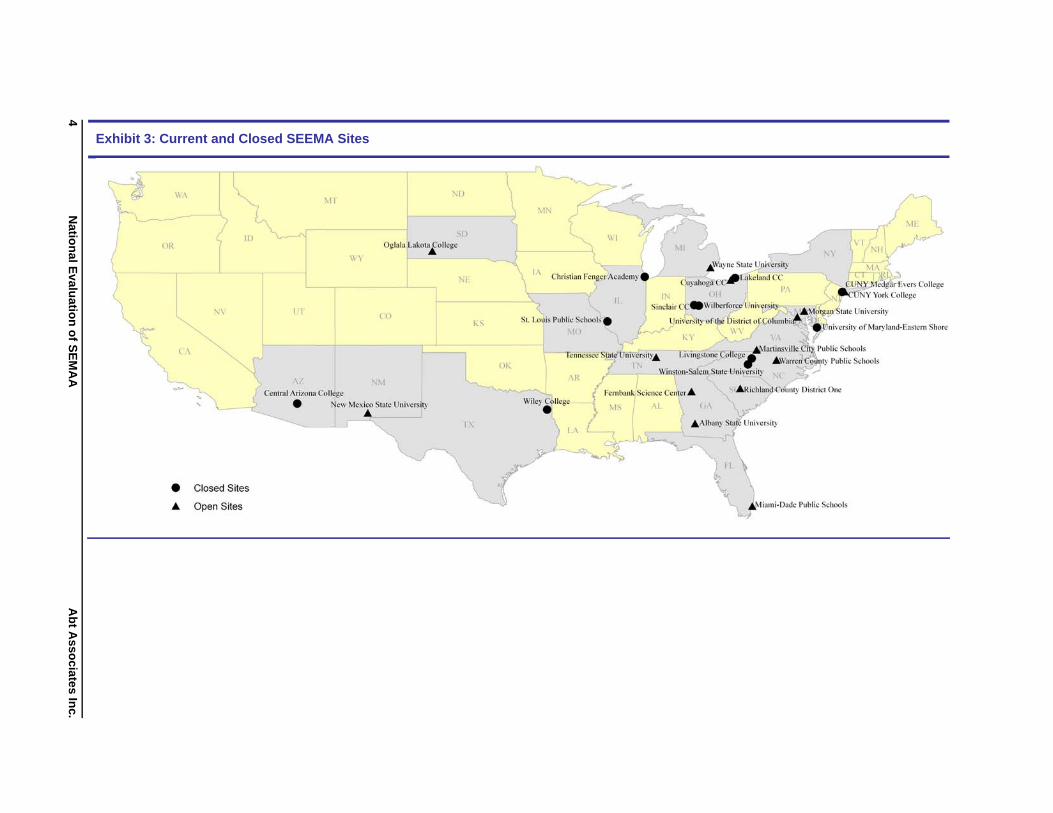
at its peak in 2005, SEMAA was being implemented in 24 sites across the nation. Exhibit 2 presents
the years in which sites were opened and, where appropriate, the years in which sites closed. As of
2009, there are 14 SEMAA sites located across 12 states and the District of Columbia. Exhibit 3 maps
the location of the current and closed sites.
Exhibit 2: Number of SEMAA Sites over Time
New Sites Opened
Total Number Open Year Sites Closed (Original Year Opened)
1993 1 1 1997 2 3 1999 8 11 2001 5 16 2002 3 19 2003 4 23 2004 1 23 1 (1997) 2005 1 24 2006 17 3 (1999), 4 (2001) 2007 14 2 (2003), 1 (2007) Total 25 11
3 http://www.nasa.gov/offices/education/programs/national/semaa/about/index.html
4 http://www.innovations.harvard.edu/awards.html?id=101441
5 The NASA SEMAA Project continues to be managed by the Educational Programs Office at NASA’s John H.
Glenn Research Center at Lewis Field in Cleveland, Ohio, with assistance from contractor Paragon TEC, Inc.
3
4 N
ation
al Evalu
ation
of S
EM
AA
A
bt A
ssociate
s Inc.
Exhibit 3: Current and Closed SEEMA Sites
Abt Associates Inc. National Evaluation of SEMAA
SEMAA sites throughout the nation rely on collaborations among partners (schools, colleges and
universities and/or research and science centers) to provide three related components:
A NASA‐designed, hands‐on, inquiry‐based curriculum aligned to national science, math, and
technology standards at each grade level and connected to research from the NASA mission
directorates;
An Aerospace Education Laboratory (AEL), featuring cutting‐edge aerospace technology that
gives students experience with aeronautical and reduced‐gravity simulations; and
A Family Café to promote sustained parental involvement in their child’s STEM education.
SEMAA activities were originally designed to be implemented in three‐hour sessions on Saturday
mornings for five to eight consecutive weeks—the kindergarten to 2nd grade sessions are five weeks,
and the 3rd to 12th grade sessions are eight weeks. The AEL, an electronics and computer‐equipped
facility including a flight simulator, research‐grade wind tunnel, short‐wave radio receiver and hand‐
held GPS (global positioning system) for aviation, is used both to engage students with technology
and real‐world problem‐solving and to train pre‐service and in‐service teachers. Parents are invited
to participate in an interactive Family Café that includes focus groups where parents can gain an
understanding about what their children are learning and discuss ways to support their children’s
engagement in science and mathematics learning both in and outside of school; family nights, where
parents and students come together to work on hands‐on STEM‐related projects; and home‐based
STEM‐linked activities for students and adult family members to share (National Research Council,
2008). Trained facilitators and invited speakers engage parents in a variety of activities, from
demonstrations of science‐related experiments, to hands‐on modeling projects, to interactive
discussions of STEM topics. For each grade level, SEMAA offers a distinct, age‐appropriate set of
curricular enhancements, with an emphasis on hands‐on projects and exposure to current
technology.
The Saturday session model was designed with up to three eight‐week sessions offered each
academic year, in addition to a one‐week session offered during the summer to help students
transition from the previous grade level of SEMAA activities to those anticipated for the following
grade level. In a given academic year, a student might enroll in an academic session and a summer
session. Students may enroll at any grade level as there are no prerequisites for participation in any
grade.
Although the Saturday model is the original and most common SEMAA model, some sites offer an
after‐school or in‐school program instead. In‐school SEMAA models typically expand the SEMAA
curriculum for integration into a school’s existing science curriculum. After‐school models are
sometimes used in areas where families have difficulty attending on Saturdays (e.g., because of
transportation barriers). The implementation of SEMAA is discussed further in Chapter Three.
5
National Evaluation of SEMAA Abt Associates Inc.
A National Evaluation of SEMAA
Consistent with the American Competitiveness Council’s recommendations for rigorous,
independent evaluations of federal STEM program and fostering knowledge of effective practices
through improved evaluations (U.S. Department of Education, 2007), the National Research Council
(2008) recommended that NASA develop a coherent plan for evaluating its K–12 STEM education
programs and use the evaluation findings to inform program implementation and design. The NRC
made specific recommendations for an evaluation of NASA’s SEMAA project, recommending that
the evaluation of SEMAA be based in the program’s theory of change, that the evaluation include an
appropriate comparison group, and that an external evaluator conduct the evaluation. To evaluate
SEMAA, the Abt team designed a comprehensive, mixed‐methods evaluation with two key modules
to study the implementation and impact of SEMAA. The design and implementation of the impact
and process study modules were led by Abt Associates and The Urban Institute, respectively.
The impact evaluation component was designed as a multi‐site, randomized control trial (RCT) to
determine the short‐term impacts of SEMAA on K–12 students and their families. It investigated the
impact of SEMAA on short‐term outcomes such as student interest and efficacy in STEM, student
engagement in STEM activities, and families’ engagement in students’ STEM‐related activities. The
process evaluation component utilized document review and telephone interviews with the SEMAA
sites’ project directors to investigate variation in how sites implement SEMAA and contextual factors
important in implementation.
This evaluation examined the implementation of SEMAA at the various sites, and found that three
models prevail—the original Saturday model, an after‐school model, and an in‐school model—
defined by when sites offer the SEMAA components. The impact study was conducted with
participants in the Saturday model only, and the report includes discussion of how the findings from
the impact study are particularly relevant given the pattern of model selection across sites. In
addition, findings from the current evaluation can inform the implementation of SEMAA in
continuing sites, as well as future evaluations that may explore the long‐term outcomes of SEMAA.
While short‐term outcomes are important in understanding how the SEMAA program may affect
participants, a longitudinal evaluation of SEMAA would be necessary to understand the longer‐term
impacts of the program. NASA has begun to develop and implement data tracking tools that will
track SEMAA participants—as well as participants in other NASA educational programs—over time,
which will facilitate any future efforts to investigate the long‐term outcomes of its programs.
The Issue and Related Factors
The STEM workforce depends on an educational pipeline that prepares students for postsecondary
STEM education and retains those students to degree completion. Unfortunately, the pipeline into
and through college‐level STEM preparation is weak, and has been described as “leaky,” particularly
for women, African‐Americans, and Hispanics—as they progress to successively higher levels of
education, members of these groups increasingly opt out of STEM fields (e.g., Oakes, 1990; Watt,
Eccles, and Durik, 2006). Between 1995 and 2001, less than one‐quarter of all post‐secondary
6
Abt Associates Inc. National Evaluation of SEMAA
students had—at one time—declared a major in a STEM field, and by 2001, only 27 percent of these
students had earned a bachelor’s degree in a STEM field. Women were less than half as likely as
men to declare a STEM major, but once having done so, they were equally likely as men to earn a
STEM bachelor’s degree. Asian/Pacific Islander students were almost twice as likely as members of
other racial and ethnic groups (Whites, Blacks, Hispanics) to declare a STEM college major. Among
declared STEM majors, Whites and Asians were more likely than Blacks, Hispanics, or others to
complete a STEM bachelor’s degree (NCES, 2009a).
SEMAA is designed to increase student participation and retention in STEM, particularly students
from groups traditionally underrepresented in STEM fields. There is a growing body of research that
links the intermediary outcomes of SEMAA—such as increasing student involvement in science
(including course taking) and affective outcomes— to important STEM educational and career
outcomes. In addition, there is some preliminary evidence that engagement in STEM enrichment
programs, such as SEMAA, is related to these intermediary outcomes. Below we discuss this
literature, and follow with a presentation of SEMAA’s program theory, which articulates how SEMAA
is intended to achieve its desired impacts.
The importance of high school course‐taking
Evidence points strongly to the importance of adequate preparation in high school science and
mathematics for more advanced, college‐level work in these fields. Course enrollment decisions in
high school, especially decisions about the number and rigor of mathematics courses, are strongly
related to college and earnings outcomes (e.g., Levine and Zimmerman, in press; Rose and Betts,
2004). Taking more math and science courses in high school was associated with an increased
likelihood of choosing a technical college major even when prior 8th grade achievement, interest in
math and science, and differences in state graduation requirements (number of years of
mathematics required) are taken into account (Federman, 2007). Mathematics preparation, in
particular, is a gateway to many other fields of study; students who complete rigorous mathematics
courses in high school outperform their peers in college‐level physics, chemistry, and biology (Sells,
1980; Sadler and Tai, 2007).
Although enrollments in high school science and mathematics courses improved nationally between
1982 and 2004, in terms of both number of courses completed and the level of the highest courses
completed, by 2004 only 18 percent of high school graduates had completed at least one advanced
science course (physics II, chemistry II, and/or advanced biology) and only 14 percent had completed
a calculus‐level mathematics course (NCES, 2007). Advanced course‐taking among girls was not
significantly different from that of boys, but racial disparities in the most advanced levels of math
and science course‐taking persisted: although nearly 40 percent of Asian/Pacific Islander and 20
percent of White students had completed at least one advanced science course (physics II,
chemistry II, and/or advanced biology), only 11 percent of Black students, 9 percent of Hispanic
students and 7 percent of American Indian students had completed such coursework. Data show a
similar pattern of racial disparities in completion of at least one calculus‐level mathematics course
(NCES, 2007).
7
National Evaluation of SEMAA Abt Associates Inc.
Even as educators and policy‐makers target improvements in high school courses and completion
rates, research suggests that there are additional factors impeding STEM persistence. Although
adequate achievement is needed to continue to progress through successively more advanced levels
of STEM education, achievement alone does not account for persistence in STEM learning or career
aspirations. For example, despite the fact that girls complete high school math and science courses
at similar rates and with similar levels of achievement as boys, women are half as likely as men to
ever declare a college major in a STEM field (NCES, 2009a). If actual achievement in a subject were
equally predictive of subsequent enrollment in that subject for boys and girls, then girls should be
just as likely, in the absence of other mediating factors, to pursue a college major in a STEM
discipline.
As described below, research suggests that students’ interests, the value they place on STEM
learning, their own and their parents’ perception of their ability, and their parents’ educational
expectations also play critical roles in STEM educational outcomes. Moreover, these types of
affective factors—interests, perceived ability, values—may be particularly important levers to
encourage STEM persistence for members of groups traditionally underrepresented in STEM fields.
Affective factors influencing STEM persistence: Interest and self‐efficacy
Interest in school subjects or activities related to such subjects is positively correlated with
enrollment and achievement in those subjects. A meta‐analysis of research on interest‐achievement
relationships for mathematics, physics, and science in general found statistically significant average
correlations of .31 or higher; for biology, the average correlation was .16 but still significantly
positive (Schiefele, Krapp, and Winteler, 1992). Longitudinal studies of student interest and
achievement in science and math support this evidence (e.g., Shernoff and Hoogstra, 2001; Watt,
Eccles, and Durik, 2006). For example, in one study, researchers compared students’ interest,
enjoyment, and level of concentration during high school science and math courses to their choice
of college major and college grades two years later. Controlling for high school math and science
grades, students’ prior interest, enjoyment, and level of concentration during high school science
classes positively predicted selection of a science major in college. Moreover, these same affective
factors predicted overall college academic performance, even controlling for prior high school
performance in math and science (Shernoff and Hoogstra, 2001).
Interest and enjoyment of science may be particularly important for girls’ desire to take science
courses. In a study of high‐ability 4th to 6th grade girls and boys enrolled in a gifted pull‐out program,
which used the Test Of Science Related Attitudes (TOSRA; Fraser, 1981), the number of science
courses girls selected was significantly correlated with their reported enjoyment of science lessons,
science leisure activities, and their perception of scientists as “normal”; no such significant
relationships were found for boys in the study (Ferenga and Joyce, 1998).
Although interest in math and science may support continued engagement and achievement, much
more research has focused on the role of self‐efficacy, namely, a person’s expectation that they
have the necessary abilities to carry out a task, in predicting academic and career outcomes in
general and STEM outcomes in particular (Bandura, 1993). Self‐efficacy is consistently found to
8
Abt Associates Inc. National Evaluation of SEMAA
correlate with course enrollment and career aspirations (Bandura, Barbaranelli, Caprara, and
Pastorelli, 2001; Betz and Hackett, 1983; Lent, Brown, and Larkin, 1986; Simpkins, Davis‐Kean, and
Eccles, 2006; Watt, Eccles, and Durik, 2006). Moreover, self‐efficacy for science and math may
predict continued interest in these fields. For the predominantly White students from high
socioeconomic status (SES) households in the Michigan Childhood and Beyond study, self‐concept of
science and math ability in 6th grade was positively correlated with their subsequent interest in
these subjects in 10th grade (Simpkins, Davis‐Kean, and Eccles, 2006). In the nationally
representative National Educational Longitudinal Study of 1988 (NELS: 88), self‐efficacy predicted
sustained interest in a STEM career more strongly than did academic proficiency (Mau, 2003).
Self‐efficacy emerges early in development as a predictor of subsequent educational choices and
occupational aspirations. Children who believed, in 6th grade, that they were skilled in math or
science subsequently completed more science and math courses in high school, even controlling for
parents’ educational and income levels and for students’ course grades in 5th and 10th grade
(Simpkins, Davis‐Kean, and Eccles, 2006). In a study with a socio‐economically diverse sample of
children 11 to 15 years of age, students’ self‐efficacy for occupational functions hinged on their self‐
efficacy for related academic coursework but not on their academic performance in related courses.
Children who perceived themselves as capable of performing scientific and technological job
functions favored professorial (i.e., academic), creative occupations as well as occupations requiring
technical but less cognitively demanding skills (e.g., mechanical manufacturing or repair) over
caretaking, educational or social service careers (Bandura et al., 2001). Gender disparities were
found, with boys having stronger self‐efficacy than girls for coursework in math and geography, and
for science and technological occupational functions.
Although gender disparities in self‐efficacy may emerge early and shape career aspirations (e.g.,
Bandura et al., 2001), their effect on actual STEM educational choices may depend on the context in
which students make such choices. For example, although girls in the Michigan Childhood and
Beyond Study had a lower perception of their math skill than boys, independent of their prior math
achievement, a difference that persisted from 6th to 10th grade (Simpkins, et al., 2006), they did not
complete fewer numbers of math or science high school courses. Girls were, however, less likely to
engage in math activities outside of school than boys. Simpkins et al. (2006) suggest that the high
school students in their sample may have been more restricted in opting out of mathematics and
science, due to their own and their parents’ college aspirations. Once enrolled in college, however,
where they can exercise more control over educational decisions, young women are less likely than
young men to declare a science or mathematics major (NCES, 2009a). Support for this notion comes
from data on a similar sample of Australian high school students, where the educational system
allows students to choose, after 10th grade, the difficulty level of their mathematics courses in 11th
and 12th grade. A smaller proportion of girls than boys in this sample chose the highest difficulty
courses, and a greater proportion of girls than boys opted for the lowest difficulty levels of
mathematics (Watt et al., 2006), despite no difference in grade 9 or grade 11 mathematical
achievement.
9
National Evaluation of SEMAA Abt Associates Inc.
The role of parents in children’s STEM outcomes
Among the most ubiquitous findings of the influence of family on children’s academic development
is the association between children’s educational outcomes and their parents’ SES and educational
attainment. Much of this evidence comes from studies of language and literacy development, in
which a large literature shows that more highly educated, higher income parents both read and talk
to their children more often, about a broader range of topics and using more complex sentence
structure than other parents (e.g., Hart and Risley, 1995). These parents also have higher aspirations
for their children’s education, may be more likely to provide children with supplemental educational
experiences outside of school (e.g., music lessons, academic tutoring, trips to science museums),
and may be more likely to model engagement in intellectual pursuits (e.g., reading, non‐
occupational hobbies) in the home (Eccles, 2005). Longitudinal data support some of these
hypothesized links. For example, data from the Child Development Supplement (CDS) to the Panel
Study of Income Dynamics (PSID) illustrate how educational attainment of parents and their children
are linked: more highly educated parents have higher expectations for their children’s education;
parents with these higher expectations invest more time at home in their children’s education; and
the more of this time parents invest, the higher children score on standardized achievement tests
(Davis‐Kean, 2005; cited in Eccles, 2005).
In addition, parental behaviors to encourage engagement in mathematics are associated with
children’s enduring interest and engagement in science and math over time. Researchers in one
study measured students’ interest in math in early elementary school and six years later after they
transitioned to middle school, and found that children’s interest in math was related to mothers’
(but not fathers’) purchase of math and science toys; further, the frequency of parents’ participation
in math and science activities with their children was positively related to children’s interest in math
six years later (Jacobs and Bleeker, 2004), controlling for gender, children’s prior interest and
parents’ conception of their child’s math ability.
A growing body of research suggests a more precise model of the way in which parental
expectations and behaviors affect children’s achievement. Rather than directly affecting math or
science achievement, parental expectations for their child’s engagement in math and science
learning, encouragement and shared involvement in math and science activities influence children’s
self‐efficacy for math and science; the more parents signal their belief in the child’s ability, the
greater the child’s own self‐efficacy, and in turn, children’s higher self‐efficacy is associated with
stronger achievement. Although children’s self‐efficacy for mathematics declines from 1st to 12th
grade, the rate of this decline is less steep for children whose parents have confidence in their
child’s mathematics ability, even when holding constant both children’s actual math performance
and teachers’ opinions about these students’ math abilities (Frederick and Eccles, 2002; cited in
Eccles, 2005).
Corroborating evidence about the effects of parental ratings of their children’s abilities and
children’s own self‐efficacy and STEM outcomes comes from other longitudinal studies (e.g.,
Bandura et al., 2001; Bleeker and Jacobs, 2004). Mothers’ perceptions of their children’s
mathematics ability, measured when children were in 6th grade, was significantly related to
10
Abt Associates Inc. National Evaluation of SEMAA
children’s self‐concept of their math ability measured four years later when these children had
reached 10th grade—this relationship was independent of children’s actual math ability in 6th grade
(Bleeker and Jacobs, 2004). Moreover, these same mothers’ predictions of the likelihood of their 7th
graders’ success in a math‐related career significantly predicted their children’s career self‐efficacy
in early adulthood (age 19–20) and career choices made in early adulthood (age 24–25), again
independently of children’s actual math ability. Among the young adult outcomes, mothers’
predicted likelihood of their children’s success in a math‐related career was positively related to
young adults actually working in a physical science or computing career versus a non‐science career,
regardless of their college attendance (Bleeker and Jacobs, 2004).
Out‐of‐school STEM enrichment activities
Parents, educators, and policy‐makers concerned with children’s educational and economic
outcomes have long looked for ways to supplement students’ formal schooling with additional
learning opportunities. A wide variety of public and private after‐school, weekend, and summer
programs targeting elementary and secondary students are now available to many families. As
concern about STEM education has grown, the number of these programs providing students with
math and science enrichment has risen.
Out‐of‐school science and math activities have the potential not only to reinforce students’ content
knowledge, but also to enhance their interest, improve their sense of self‐efficacy for science and
math‐related tasks, and illustrate the relevance of science and math in their daily lives and for their
career aspirations. In addition, out‐of‐school activities can provide parents an opportunity to jointly
engage in science or math activities with their children; through this shared engagement, parents
may signal that they see math and science as important endeavors and that they see their children
as competent agents in these fields.
Increasingly, policy‐makers seek evidence for the effectiveness of these programs. Non‐
experimental evaluations of the effectiveness of such “out‐of‐school‐time” (OST) programs have
suggested a host of positive outcomes for participants in such programs, including improved
achievement and stronger interest in, and more positive attitudes towards science and
mathematics. For example, an evaluation of 96 projects run by The After School Corporation (TASC)
over a four‐year period showed that math achievement scores for 3rd to 8th grade participants rose,
on average, after two years (Reisner, White, Russell, and Birmingham, 2004; cited in Levine and
Zimmerman, in press). A meta‐analysis of 33 studies of OST math enrichment programs suggests
that low‐achieving participants in such programs experience positive and statistically significant
gains in achievement (Lauer et al., 2004). Notably, however, both the TASC study and most of those
in Lauer’s (2004) meta‐analysis were non‐experimental evaluations that did not include an
appropriate comparison or control group.
In light of prior research (e.g. Mau, 2003; Shernoff and Hoogstra, 2001; Simpkins et al., 2006)
suggesting that improved STEM achievement in elementary and secondary school alone is
insufficient to produce long‐lasting, persistent engagement in STEM, it is important to examine the
11
National Evaluation of SEMAA Abt Associates Inc.
effects of STEM enrichment programs on student interest, self‐efficacy, and motivation to pursue
additional STEM education.
Many participants in STEM enrichment program report positive benefits of these programs,
including increased interest in and self‐efficacy for science, and enhanced interest in pursuing a
scientific career (e.g., Fadigan and Hammrich, 2004; Markowitz, 2004; Stakes and Mares, 2005).
Such assertions must be treated with caution. Although the majority of past participants in the
Women in Natural Sciences (WINS) program perceived the program as having influenced their
educational and career trajectories, what actually differentiated those who eventually pursued or
did not pursue a STEM career was the number of honors or advanced placement science and math
high school courses completed; total number of math and science courses, combined SAT scores,
type of school attended, number of out‐of‐school‐time activities and—notably—years in the WINS
program were not associated with girls’ subsequent career paths (Fadigan and Hammrich, 2004).
More rigorous studies of the effects of STEM enrichment programs are less common. In one random
assignment study, applicants to a summer inquiry‐based science camp for rising 7th and 8th graders
were randomly assigned to participation or nonparticipation (the control group). Both groups
showed a decline in interest two years after participation, but program participants showed smaller
declines than those in the control group. Individuals who had not applied to the program were also
followed, and they had lower interest at baseline and showed a decline in interest from middle to
high school (Gibson and Chase, 2002).
Other studies also suggest that the incorporation of such inquiry‐based or field‐based experiential
science or math experiences may increase interest in science (e.g., Barnett et al., 2006; Sikes and
Schwartz‐Bloom, 2009). Field‐based methods, even when students may not formulate their own
research questions, may have benefits for students’ interest in science. In a university‐school district
partnership to expose urban high school students to a hands‐on, field‐based urban ecology program,
researchers found suggestive evidence that such experiences may prevent declining interest in
science over the course of an academic year (Barnett et al., 2006).
The SEMAA project is grounded on these ideas that emerge from the existing literature. The
program’s theory of change and how this informed the current study are described in the next
section.
Conceptual Framework
SEMAA’s theory of change
To increase the number and diversity of students pursuing STEM education and careers, SEMAA is
designed to maintain and increase student interest in STEM activities and motivation to persist in
these activities. SEMAA seeks to build interest and motivation by engaging students and their
families in hands‐on, participatory activities that align with formal educational standards in science
and mathematics and enhance learning. The original SEMAA model was designed so that these
12
Abt Associates Inc. National Evaluation of SEMAA
activities would take place outside of school on Saturday mornings. As described in greater detail in
Chapter Three, sites are also implementing models wherein the SEMAA sessions are conducted after
school or within the school day.
The SEMAA model posits that effective engagement goes hand‐in‐hand with fostering a positive
attitude about STEM activities. The more students engage with the content, materials, and
processes of STEM inquiry in an informal, supportive context, the more positively they will feel
about STEM activities and their role in such inquiry; and vice versa, as students’ self‐efficacy
improves, the more they will be motivated to further engage in STEM activities and learning. In
addition, the more their parents share an interest in STEM activities, and the more support for
education parents can provide students, the more likely it is that students will participate in
additional STEM activities, and enroll and persist in school‐based science and mathematics courses.
The SEMAA model reflects an implicit theory of how to effect change in student behavior. According
to the theory of change, engaging students means providing them opportunities to participate
actively in STEM tasks and enlisting the support of their parents. Effective engagement builds
interest and motivation in STEM and enhances STEM learning. This greater motivation and
understanding increases the desire for further engagement, increases students’ involvement in
STEM activities, and improves the likelihood that they will persist in STEM learning, both informal
and formal. Ultimately, this persistence will lead to the more desired long‐term outcomes—
increased enrollment and achievement in STEM coursework, more undergraduates interested in and
adequately prepared to major in STEM disciplines, and a greater flow of individuals into STEM‐
related careers.
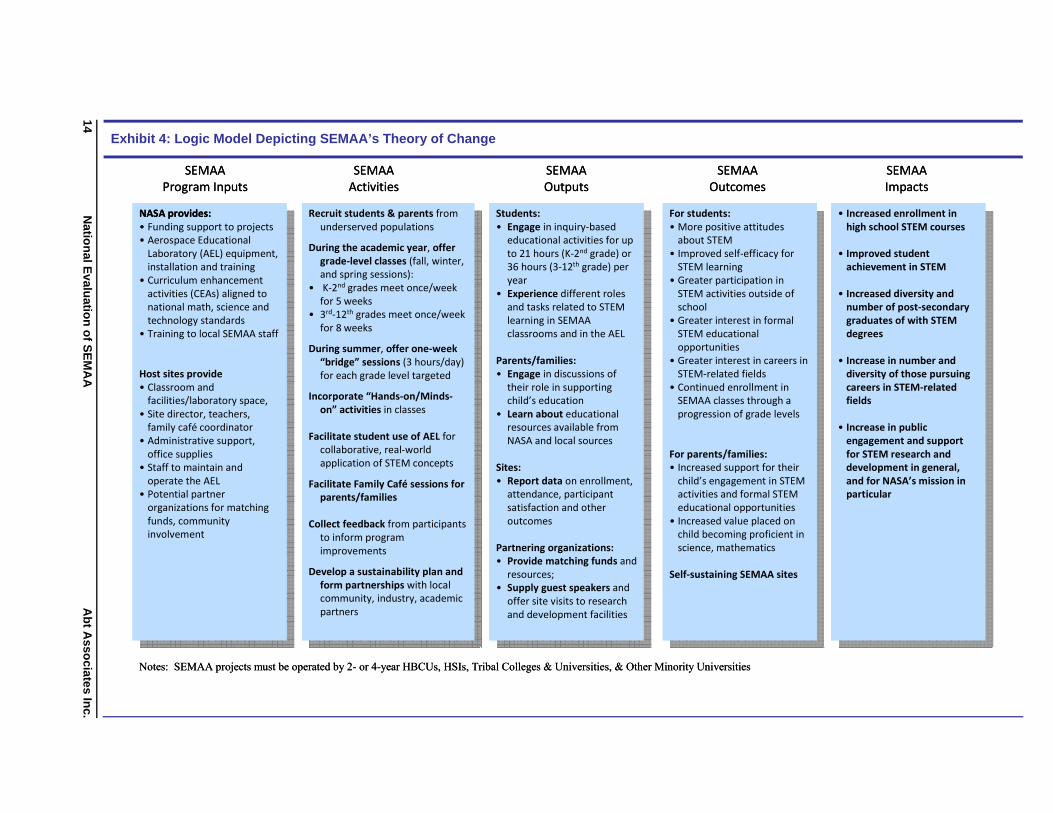
Exhibit 4 models SEMAA’s theory of change. Moving from left to right, the model makes explicit the
links between the project inputs—those elements necessary to enact the project at a site—through
the activities that SEMAA sites conduct, to the outputs of these activities, to intended short‐term
and long‐term outcomes that SEMAA is designed to effect ultimately. Each of these elements in the
logic model is described below.
13
14
Natio
nal E
valuatio
n o
f SE
MA
A
Ab
t Asso
ciates In
c.
Exhibit 4: Logic Model Depicting SEMAA’s Theory of Change
NASA provides:• Funding support to projects • Aerospace Educational Laboratory (AEL) equipment, installation and training
• Curriculum enhancement activities (CEAs) aligned to national math, science and technology standards
• Training to local SEMAA staff
Host sites provide• Classroom and facilities/laboratory space,
• Site director, teachers, family café coordinator
• Administrative support, office supplies
• Staff to maintain and operate the AEL
• Potential partner organizations for matching funds, community involvement
• Funding support to projects • Aerospace Educational Laboratory (AEL) equipment, installation and training
• Curriculum enhancement activities (CEAs) aligned to national math, science and technology standards
• Training to local SEMAA staff
Host sites provide• Classroom and facilities/laboratory space,
• Site director, teachers, family café coordinator
• Administrative support, office supplies
• Staff to maintain and operate the AEL
• Potential partner organizations for matching funds, community involvement
SESEMMAAAA PrProgogrraamm InpInpuutsts
SESEMMAAAA AActictivivitietiess
SEMAASEMAA OuOuttputputss
SESEMMAAAA OutOutccomeomess
SEMAASEMAA ImImppacacttss
NoNotetes: s: SE SEMAAMAA pprrojojeeccts mts muust be st be ooppeerraatedted bbyy 2 2-- oorr 4 4--yyeearar H HBBCUs,CUs, H HSSIIss, , TTrribibal al CoCollllegegeess & & UnUniviversersities, &ities, & OthOtheerr Mi Minnoorrityity U Unniivveerrsitisitieses
Recruit students & parents from underserved populations
During the academic year, offer grade‐level classes (fall, winter, and spring sessions):
• K‐2nd grades meet once/week for 5 weeks
• 3rd‐12th grades meet once/week for 8 weeks
During summer, offer one‐week “bridge” sessions (3 hours/day) for each grade level targeted
Incorporate “Hands‐on/Minds‐on” activities in classes
Facilitate student use of AEL for collaborative, real‐world application of STEM concepts
Facilitate Family Café sessions for parents/families
Collect feedback from participants to inform program improvements
Develop a sustainability plan and form partnerships with local community, industry, academic partners
Students:• Engage in inquiry‐based educational activities for up to 21 hours (K‐2nd grade) or 36 hours (3‐12th grade) per year
• Experience different roles and tasks related to STEM learning in SEMAA classrooms and in the AEL
Parents/families:• Engage in discussions of their role in supporting child’s education
• Learn about educational resources available from NASA and local sources
Sites:• Report data on enrollment, attendance, participant satisfaction and other outcomes
Partnering organizations:• Provide matching funds and resources;
• Supply guest speakers and offer site visits to research and development facilities
For students:• More positive attitudes about STEM
• Improved self‐efficacy for STEM learning
• Greater participation in STEM activities outside of school
• Greater interest in formal STEM educational opportunities
• Greater interest in careers in STEM‐related fields
• Continued enrollment in SEMAA classes through a progression of grade levels
For parents/families:• Increased support for their child’s engagement in STEM activities and formal STEM educational opportunities
• Increased value placed on child becoming proficient in science, mathematics
Self‐sustaining SEMAA sites
• Increased enrollment in high school STEM courses
• Improved student achievement in STEM
• Increased diversity and number of post‐secondary graduates of with STEM degrees
• Increase in number and diversity of those pursuing careers in STEM‐related fields
• Increase in public engagement and support for STEM research and development in general, and for NASA’s mission in particular
NASA provides:• Funding support to projects • Aerospace Educational Laboratory (AEL) equipment, installation and training
• Curriculum enhancement activities (CEAs) aligned to national math, science and technology standards
• Training to local SEMAA staff
Host sites provide• Classroom and facilities/laboratory space,
• Site director, teachers, family café coordinator
• Administrative support, office supplies
• Staff to maintain and operate the AEL
• Potential partner organizations for matching funds, community involvement
• Funding support to projects • Aerospace Educational Laboratory (AEL) equipment, installation and training
• Curriculum enhancement activities (CEAs) aligned to national math, science and technology standards
• Training to local SEMAA staff
Host sites provide• Classroom and facilities/laboratory space,
• Site director, teachers, family café coordinator
• Administrative support, office supplies
• Staff to maintain and operate the AEL
• Potential partner organizations for matching funds, community involvement
Recruit students & parents from underserved populations
During the academic year, offer grade‐level classes (fall, winter, and spring sessions):
• K‐2nd grades meet once/week for 5 weeks
• 3rd‐12th grades meet once/week for 8 weeks
During summer, offer one‐week “bridge” sessions (3 hours/day) for each grade level targeted
Incorporate “Hands‐on/Minds‐on” activities in classes
Facilitate student use of AEL for collaborative, real‐world application of STEM concepts
Facilitate Family Café sessions for parents/families
Collect feedback from participants to inform program improvements
Develop a sustainability plan and form partnerships with local community, industry, academic partners
Students:• Engage in inquiry‐based educational activities for up to 21 hours (K‐2nd grade) or 36 hours (3‐12th grade) per year
• Experience different roles and tasks related to STEM learning in SEMAA classrooms and in the AEL
Parents/families:• Engage in discussions of their role in supporting child’s education
• Learn about educational resources available from NASA and local sources
Sites:• Report data on enrollment, attendance, participant satisfaction and other outcomes
Partnering organizations:• Provide matching funds and resources;
• Supply guest speakers and offer site visits to research and development facilities
For students:• More positive attitudes about STEM
• Improved self‐efficacy for STEM learning
• Greater participation in STEM activities outside of school
• Greater interest in formal STEM educational opportunities
• Greater interest in careers in STEM‐related fields
• Continued enrollment in SEMAA classes through a progression of grade levels
For parents/families:• Increased support for their child’s engagement in STEM activities and formal STEM educational opportunities
• Increased value placed on child becoming proficient in science, mathematics
Self‐sustaining SEMAA sites
• Increased enrollment in high school STEM courses
• Improved student achievement in STEM
• Increased diversity and number of post‐secondary graduates of with STEM degrees
• Increase in number and diversity of those pursuing careers in STEM‐related fields
• Increase in public engagement and support for STEM research and development in general, and for NASA’s mission in particular
NASNASAA prprovoviiddes:es:
Abt Associates Inc. National Evaluation of SEMAA
SEMAA activities
Once they have secured funding and received approval for their standard operating procedures
(negotiated with NASA’s National SEMAA Office), sites then recruit students and their families from
area school districts to enroll in classes.6 SEMAA deliberately targets populations typically
underserved and underrepresented in STEM disciplines—local projects are often located at
minority‐serving institutions of higher education. To maximize enrollment, classes are offered when
students and parents are most likely able to participate. In many sites classes take place for three
hours on Saturday mornings, with Family Cafés running concurrently, but some sites offer courses as
after‐school extracurricular activities, while still others offer an in‐school model in which the
curriculum enhancement activities are incorporated school‐wide into the existing science or math
curriculum.
The curricular enhancement activities are designed to encourage persistence in SEMAA throughout
grades K–12. At each grade level, they are developmentally appropriate, and across grade levels,
activities are somewhat cumulative so that students learn new concepts and engage in novel STEM
activities. In addition, SEMAA projects use the AEL to expose students in secondary grades (grades 6
to 12) to real‐world applications of up‐to‐date technologies so that students see how STEM content
is actually used to solve problems like those NASA mission directorates encounter (e.g., how
microgravity in space presents challenges to be solved, how to design aircraft, how to navigate
aeronautical and aerospace vehicles over the large distances involved using GPS technologies, how
to coordinate communications, etc.).
Parent participation in SEMAA activities is optional. SEMAA offers parents (or other caregivers) a
chance to experience some of the activities their children are engaged in through family nights, field
trips to science museums, and showing parents STEM activities they can do together at home. In
addition, at Family Café sessions a SEMAA family coordinator organizes guest lectures by STEM
professionals and educational providers and facilitates discussions with parents about how to
support their children’s education, and solicits parents’ concerns about their children’s education
and development. Parents receive information about other NASA educational opportunities and
other resources available to families in the local community.
Beginning in the first year of implementation, each SEMAA site also actively develops a sustainability
plan, including partnerships with school districts, local industries, non‐profit and community youth
groups, and colleges and universities. These partnerships are necessary to ensure that the site can
continue to operate after the end of its NASA grant term. Recruitment of families and solicitation of
partners work together to build a broad base of stakeholders interested in the continuance of the
local SEMAA site.
6 Note that sites are not necessarily required to implement classes for all grade levels (K–12). Sites may
choose to target course offerings to a smaller range of grades (e.g., grades 6–8), and may expand to
include additional grades as student and parent interest, resources, and space allows.
15
National Evaluation of SEMAA Abt Associates Inc.
Finally, sites collect data on a range of indicators to inform program improvements and track
progress. Such data include enrollment, attendance at classes, number and types of NASA materials
used, topics covered, and feedback from participating students, parents, and teachers, including
satisfaction with project offerings and interest in STEM careers. These data were input to the NASA
Education Evaluation Information System (NEEIS) database and aggregated to assist sites and NASA
in monitoring SEMAA’s implementation and outcomes.7
SEMAA outputs
Each year, SEMAA should have provided 3rd to 12th grade students up to 36 hours of exposure to
SEMAA content (3 hours per week for 7 weeks of an 8‐week academic year session,8 plus 15 hours
during a 1‐week summer session), or up to 21 hours of exposure for students in kindergarten to 2nd
grade. Parents should have had the opportunity to participate in discussions of their role in
supporting their child’s education and to learn about resources available to encourage and assist
their child’s engagement in STEM learning (e.g., school or community mentoring/tutoring, summer
science camps, resources for low‐income families to participate in STEM activities). At the end of
each SEMAA session, staff should have accumulated administrative and participant feedback data
and entered these data into NEEIS for reporting and monitoring purposes. Finally, as a result of staff
outreach, the site should have established partnerships with local industries and agencies who have
given and pledged continued support in the form of matching funds, guest speakers, or hosting visits
by students and parents to their facilities.
SEMAA short‐term outcomes
If SEMAA is successful, then its activities and outputs should result in the anticipated outcomes for
students, parents, and the sites themselves. Students should feel more positive about engaging in
STEM activities and should increasingly view themselves as capable of engaging in such activities;
they should be more inclined to engage in STEM educational opportunities, both in and out of
school; they should express greater interest in the possibility of pursuing a STEM career; and they
should be more likely to enroll in future SEMAA sessions and in formal STEM coursework. As a result
of their exposure to SEMAA, parents should likewise have a more positive view of STEM, particularly
of the importance of STEM education for their children and their own role in supporting their child’s
learning; also, they should be more likely to engage in STEM activities with their child and encourage
their child to pursue STEM educational opportunities in and outside of school. SEMAA sites should
see direct benefits of student and parental participation and from their efforts to secure
partnerships; enrollments in subsequent sessions should increase; and external stakeholders should
be increasingly responsible for sustaining SEMAA long term.
SEMAA long‐term outcomes
The final premise underlying the SEMAA logic model is that the outcomes for precollege students
and their parents—increased student interest in STEM activities and improved self‐efficacy,
increased participation in out‐of‐school STEM activities, greater interest and enrollment in formal
7 NASA is currently implementing a new online data monitoring system to replace NEEIS.
8 The final week of the academic session does not introduce additional content.
16
Abt Associates Inc. National Evaluation of SEMAA
STEM coursework, increased parental engagement in STEM activities with their child and stronger
support for their child to enroll in formal STEM coursework—will result collectively in subsequent
impacts on the college‐level STEM pipeline and subsequent STEM labor force. That is, if SEMAA
helps increase precollege students’ interest and participation in informal and formal STEM activities,
a greater proportion of such students should persist through high school STEM coursework that
prepares them for college‐level STEM courses. In turn, a greater proportion of students should
pursue and complete undergraduate degrees in STEM disciplines. With more students trained in
college‐level STEM, a greater proportion will enter the STEM labor force, either directly or via
graduate level education. These impacts will help meet the national need for more individuals, and a
greater diversity of individuals, pursuing STEM careers and thus contributing to the research and
development needed for the U.S. to remain a global leader in such fields.
How the SEMAA program theory informed the evaluation
The design of the national evaluation of SEMAA was informed by SEMAA’s program theory.
Although NASA provides sites with materials and guidance to implement the SEMAA project—
originally envisioned as a Saturday program—there is variation in how sites implement components
in response to the particular needs of their student population, characteristics of the host and
partner institutions, and resource availability. The process study focused on this variation, and its
implications for successful implementation of SEMAA, with the specific aim of uncovering
alternative models of implementation of the SEMAA project and shedding light on issues
surrounding sustainability.
The outcomes of the impact evaluation follow directly from the SEMAA project logic model. The
evaluation design deliberately targeted the short‐term outcomes anticipated in the SEMAA program
theory (shown in the fourth panel of Exhibit 4)—including student attitudes, engagement in STEM
activities (both school‐based extracurricular and out‐of‐school activities), interest in science, specific
STEM courses, college majors, and STEM careers, and parental engagement in STEM activities and
support for their child’s enrollment in formal STEM courses. Although previous evaluations of
SEMAA had examined some of these same outcomes, they had not provided rigorous evidence that
SEMAA affected these anticipated outcomes. For example, measures were administered only post‐
participation (i.e., no baseline measures of these outcomes were collected prior to participation in
SEMAA) and only to SEMAA participants (there was no comparison group of nonparticipants).9
Because the SEMAA program theory anticipates that these short‐term outcomes are precursors to
longer‐term outcomes, it was important to first implement a rigorous design to look for the
intended effects of SEMAA on these more proximal outcomes. In addition, the program theory
suggests that cumulative and persistent exposure to SEMAA may enhance STEM knowledge and
improve learning. Therefore, we explored whether the effects of the program differed for
individuals who had previously participated and those who were participating for the first time.
9 Previous evaluations were either internal evaluations or conducted by the contractor operating the
National SEMAA Office (e.g., Bondurant, Davis, Davey and Davis, 2008; NASA, 2007b)
17
National Evaluation of SEMAA Abt Associates Inc.
To measure SEMAA’s impact on anticipated outcomes, the evaluation implemented a randomized
control trial, in which applicants to SEMAA—those with similar levels of interest in SEMAA
participation—were randomly assigned to a treatment (offer of enrollment in SEMAA) or a control
group (delayed offer to enroll in SEMAA after the conclusion of the study). Both baseline and follow‐
up data were collected from each group to provide a rigorous comparison of differences in
outcomes. Because the design precluded direct measures of student behaviors, such as actual
engagement in a range of out‐of‐school STEM‐related activities or actual enrollment in STEM
courses, the measures focused on self‐reported interest and frequency of engagement in such
activities and courses. In addition, because the program theory predicted that participation in
SEMAA would result in more positive attitudes about science and other STEM tasks, the survey
incorporated measures of self‐efficacy (anxiety about science, self‐confidence in science).
Because a key component of SEMAA is the engagement of parents (e.g., via the Family Café) in
STEM activities and in their children’s education, parent outcomes were also measured. These
included parents’ support for their children’s out‐of‐school science activities, the likelihood that
parents would encourage their children to enroll in particular high school and college‐level STEM
courses, and parents’ perception of the importance that their children reach proficiency in science
and mathematics. By exploring the short‐term outcomes, the results of this evaluation lay the
foundation for exploring the effect of SEMAA on the long‐term impacts shown in the final panel of
Exhibit 4.
18
Abt Associates Inc. National Evaluation of SEMAA
Chapter 2. Study Design
The evaluation was designed with two components, an implementation study and an impact study.
The implementation study documented the variation in implementation of SEMAA across sites and
the impact study assessed the effects of participation in the SEMAA program on short‐term
outcomes for student participants and their families.
Research Questions
The implementation and impacts components of the evaluation were designed to address the
following research questions:
Implementation Study
What are the main models of implementation represented among SEMAA grantees?
How do contextual factors affect implementation of programs?
How have individual sites used partnerships with other entities to implement the program?
Impact Study
What impact does SEMAA have on students and parents? Specifically:
What is the effect of SEMAA on students’ engagement, interest, and self‐efficacy in STEM
activities?
What is the effect of SEMAA on students’ interest in pursuing STEM coursework and career
opportunities?
What are the impacts of the program on first‐time SEMAA participants? On returning
SEMAA participants?
Does SEMAA enhance parental support for their child’s engagement in STEM learning?
Implementation Study Methodology
The implementation evaluation capitalized on existing data about local site implementation from
extant sources. To fill gaps in the extant data, structured interviews with site directors at each of the
14 active sites were conducted. While the main programmatic goal of the SEMAA project is to
succeed in engaging and educating students, another goal is to graduate successfully from NASA
funding, i.e., to become a self‐sustaining project. In light of the latter goal and the presence of sites
that no longer offer the program, we included an analysis of efforts towards institutionalization or
sustainability at both open and closed sites.
Documents reviewed included standard operating procedures (SOPs) that provide programmatic
details of each site, quarterly performance reports, and project websites. This review became the
basis of summaries of key information across sites and guided the development of the interview
protocol (included in Appendix B). Interviews were conducted with all open sites (14) and with 6 of
the 11 closed sites. (See Appendix A for a full list of site interviews conducted, representing a 100
19
National Evaluation of SEMAA Abt Associates Inc.
percent response rate for active sites and a 55 percent response rate for closed sites.) The project
directors for the remaining five closed sites did not refuse participation; rather, they were no longer
at the institutions that had hosted the SEMAA projects and, in spite of the use of tracking services,
could not be located to interview.
The telephone interviews with active site directors provided implementation data on such topics as
project goals and history, project management and governance, project components and activities,
student participation, teacher training, partnerships and collaborations, and facilitating and
inhibiting factors in implementation. Interviews with closed sites, which were designed shorter to
encourage participation, focused on questions about sustainability and problems encountered.
Telephone interviews were conducted between June and September 2009. Additional details about
the interviews can be found in Appendix A.
Impact Study Methodology
The impact study was designed as a randomized control trial (RCT) of students in 4th through 8th
grades (and their parents). The study was conducted across six SEMAA sites that implemented the
Saturday model in Fall 2009.10 In each site, student applicants were randomly assigned to a
treatment (participation in an eight‐week SEMAA curricular enhancement program in the Fall of
2009) or control (not participating in the Fall 2009 session) condition.11 Student and parent pre‐ and
post‐test surveys were administered to each group to measure both student outcomes (e.g., student
interest and engagement in school‐based and out‐of‐school STEM related activities; self‐efficacy in
science and mathematics; interest in STEM coursework and careers) and parent outcomes (e.g., co‐
participation with children in STEM‐based activities; perception of their child’s ability and
performance in science and mathematics; support for their child’s interest in pursuing STEM
coursework and/or careers). Program effects were measured by comparing the average outcomes
for the treatment group and comparison group at follow‐up, controlling for baseline measures and
demographic characteristics of students and parents.
The impact study required certain modification to sites’ recruitment and application processes.
Specifically, in addition to the standard SEMAA application, the application packet included baseline
surveys for students and parents to complete. Also, additional lead time was necessary to randomly
assign applicants into treatment and control groups for the study, thus necessitating that all
recruitment occur during the summer and prior to the school year.
Sources of data
To measure short‐term outcomes, the study team developed baseline and follow‐up student and
parent surveys for administration to treatment and control groups. To measure student engagement
10 One site was dropped from the study due to insufficient number of applicants for the Fall 2009 session.
11 These individuals were eligible to participate in SEMAA in the Winter or Spring 2010 session, after data
collection for the evaluation ended.
20
Abt Associates Inc. National Evaluation of SEMAA
in science activities and interest and self‐efficacy in science, survey items from two existing
instruments—the Modified Attitudes Towards Science Inventory (mATSI; see Weinburgh and Steele,
2000) and the Math and Science Interest Survey (Hulett, Williams, Twitty, Turner, Salamo, and
Hobson, 2004)—were modified (as needed) and incorporated into the study surveys. Remaining
items were developed, pilot‐tested, and revised by the study team. Baseline and follow‐up surveys
for students and parents appear in Appendix B.
The student and parent surveys were administered twice to both the treatment and control groups.
The first round of survey data collection (the baseline round) occurred prior to the beginning of the
Fall 2009 SEMAA session, at the time that individuals applied to the program. The baseline surveys
were distributed as part of the SEMAA application packet, and were returned by families via U.S.
mail.
The second round (the follow‐up round) occurred at the conclusion of the eight‐week Fall session at
each site, when families in both the treatment and control groups were mailed packets containing
the student and parent follow‐up surveys. Postcards and phone calls were used to prompt
nonrespondents to complete their surveys. Nonrespondents were also given the option to complete
the survey via an electronic form of the survey that was created to encourage participation.
Sample for the impact study
The impact study focused on the SEMAA sites using the Saturday model. Of the 14 active SEMAA
sites, 7 were implementing the Saturday model at the time of this study. In a Saturday model (versus
an in‐school or after‐school model), students typically attend a three‐hour morning session each
Saturday for eight consecutive weekends in classrooms located at a partnering university or other
community locations. Parents also have the option of participating in SEMAA activities at these
times. The Saturday model was chosen for two primary reasons. First, the SEMAA sites offering
Saturday sessions are implementing the SEMAA program in the manner that NASA intended and
prefers. Other models of implementation (after‐school or in‐school models) were adopted for local
reasons, which are further described in Chapter Three. The after‐school model differs from the
Saturday model, in part because of the timing of the Family Café, and is not representative of
SEMAA as a whole. Sites using in‐school models of implementation have expanded or altered the
SEMAA content materials for adoption as units in a school’s existing science courses. Second, at sites
using the after‐school or in‐school models, random assignment of students to treatment or control
would not have been possible. Because SEMAA in‐school models work by integrating the SEMAA
curricular enhancements into a school’s existing science curriculum, random assignment would have
resulted in some student being denied access to formal science courses or units that formed a part
of required instruction.
The universe of students in the impact study was the pool of 4th to 8th grade student applicants (and
their parents) to the Fall 2009 SEMAA session at each site participating in the impact module of the
study. Typically, SEMAA sites are oversubscribed for the Fall session: more students apply than can
be accommodated in the Fall eight‐week session. Assignment to the Fall session (rather than the
Winter or Spring session) is normally determined on a “first‐come, first‐serve” basis: those families
21
National Evaluation of SEMAA Abt Associates Inc.
whose applications are received first are more likely to receive their first choice of sessions for the
academic year. In many sites, prior participants receive information about upcoming enrollment
directly from the site; new participants hear about SEMAA via advertisements, brochures, and
SEMAA staff presentations at community or school events. Assignment in Fall 2009 was conducted
differently because of the impact study. All applications received by a site’s deadline were subject to
random assignment to either the treatment or control group.
The unit of assignment was the household. Each household (i.e., a student‐parent pair) was assigned
either to a treatment condition (enrollment in the Fall 2009 SEMAA session at their site) or a control
condition (embargoed enrollment until the Winter or Spring 2010 SEMAA session). Both prior
SEMAA participants and new SEMAA applicants were subject to random assignment. Those assigned
to the control group were free to enroll in other (i.e., non‐SEMAA) science and/or mathematics
enrichment activities.
Because some households included more than one eligible student applicant to the Fall 2009
session, student applicants from the same household were assigned to the same experimental
condition as follows:
Prior to random assignment, one sibling was selected at random to be the “target” student
for purposes of the study;
The target student was randomly assigned to treatment or control status;
Any siblings of the target child who also applied to SEMAA were assigned to this same
condition.
Although the SEMAA project targets students in all elementary and secondary school grades, the
study included students (and their parents) in the 4th through 8th grades. The 4th and 5th grades were
selected to represent students at the elementary school level from whom data could reasonably be
collected via paper and pencil survey, without requiring a one‐on‐one interview or a survey
proctor.12 Students in the 6th through 8th grades were targeted because they are an age group of
particular interest to STEM educational researchers, since the science and mathematics courses
taken in school during these middle school years may determine which types of courses are
available for students when they matriculate to high school, and algebra in middle school is a strong
predictor of subsequent STEM enrollment.
The evaluation recruited 662 families who were interested in participating in SEMAA across six sites.
Of these, 397 completed both the baseline survey that was administered prior to the Fall SEMAA
sessions and the follow‐up survey that was administered after the Fall SEMAA session. Because the
12 Students in kindergarten and 1st through 3rd grades were not included in the study because they would
typically need support completing a written survey and it would have been difficult to collect reliable
information on the outcome measures as proposed.
22
Abt Associates Inc. National Evaluation of SEMAA
response rate of 60 percent was lower than expected,13 we conducted several tests to investigate
potential nonresponse bias and found that there was no evidence to suggest nonresponse bias
among the outcomes of interest (see Appendix A).
Analytic approach for the impact study
Analyses were conducted to estimate the average impact of the SEMAA program on student and
parent outcomes. Because the SEMAA program theory postulates that the effect of SEMAA is
cumulative across years, and the SEMAA program is designed to offer new experiences to students
who return year after year, we also investigated whether the impact of the program on prior SEMAA
participants and new SEMAA participants differed.
We tested the impact of SEMAA on students separately from its impact on parents. Impacts were
tested by comparing outcomes for the treatment group and control groups, by fitting regression
models that accounted for the clustering of respondents within sites (multi‐level modeling) and key
covariates, including the baseline measures of each outcome and background characteristics.14 We
describe these models in more detail in Appendix A.
We also conducted exploratory analyses to examine hypotheses about whether the number of
Saturday classes or Family Café sessions attended was related to the outcomes of interest. Although
the study was not designed to provide a rigorous test of these relationships, the results of these
analyses provide suggestive evidence.
13 The target 75 percent response rate was set with a proposed incentive for participation; however, the
Office of Management and Budget did not approve the use of incentives for this study, and the actual
response rate for follow‐up surveys in the study was 60 percent.
14 In models investigating impacts on student outcomes, the background characteristics included as
covariates included prior participation in SEMAA, gender, race/ethnicity, grade, whether any family
member was employed in a STEM field, parental employment at NASA, parents’ highest education level,
family income level, amount of help received from adults on the baseline survey, and whether English was
the only language used in school; in addition, the baseline value on the outcome being investigated was
included. In the models that investigated parent outcomes, covariates included student’s prior
participation in SEMAA, parent's highest education, income level, whether the parent was working for
NASA, and whether the parent was working in a STEM field; in addition, the baseline value on the
outcome being investigated was included.
23

THIS PAGE INTENTIONALLY BLANK
Abt Associates Inc. National Evaluation of SEMAA
Chapter 3: Implementation of the SEMAA Program
The implementation study provides insights into how the sites implement the SEMAA components
and select a model for implementation in response to the characteristics of their host and partner
institutions, particular needs of their student population, and available resources. This chapter
describes the characteristics of the sites and provides the findings from the implementation study—
focusing on project goals, governance and structure, participant characteristics, SEMAA providers,
models of implementation, evaluation and monitoring, and factors that influence implementation.
SEMAA Elements
Project goals
The goals of individual sites are aligned with the goals of the SEMAA project and the individual host
institutions. These shared goals were important in the establishment of individual sites, as were
individual past experiences, and Congressional support in some cases.
Project site goals align with those of SEMAA. The main goal of the SEMAA project, as envisioned by
NASA, is to increase the STEM participation and retention of K–12 students traditionally
underrepresented in these fields. This aligns well with the goals reported by the directors of project
sites, who see their main goal as working with underrepresented children to inspire, engage and
educate them to remain in STEM areas. As one put it, they hope to “inspire a new generation of
explorers that are interested in STEM careers.” A number of interviewees added that they are
working with kids who would otherwise not have the opportunity to participate in this kind of
program or be exposed to the science content and hands‐on activities.
Project site goals align with those of their host institutions. Project leads also noted that their
project’s goals have remained the same over time and align well with those of the host site. Projects
based at postsecondary institutions tended to report that their SEMAA project goal aligns “closely”
with that of the host institution because the university/college values outreach and diversity in
higher education, and/or because SEMAA strengthens the school’s visibility and aids recruitment. In
contrast, projects based at public school districts/systems reported that their goals align well with
those of SEMAA because each seeks to advance student preparation, achievement, and success.
Shared goals were buttressed by past experience and Congressional support. Interviewees
reported that the establishment of the individual sites was motivated by common goals as well as
other factors. Specifically, some project directors mentioned that prior experience with related
initiatives supported the establishment of SEMAA at their site. For example, one site director
reported that SEMAA “built on some institutional precedents” because his college had a “successful
history of science education and science outreach” and in fact ran one of the first programs for
minority undergraduates in physics. Another site director noted that before establishing a SEMAA
project his organization had partnered with NASA on a number of projects including one similar to
25
National Evaluation of SEMAA Abt Associates Inc.
SEMAA. In contrast, other directors stated that they were motivated to establish a program because
nothing similar had existed for their target population. These sites had established a SEMAA project
precisely because no similar projects had ever existed at the school or in the area. Some spoke
about the dire need for the program given the poor math and science performance of local public
school students or the bleak economic conditions in the region. One interviewee reported that the
area unemployment rate is 20 percent and described, “we have a large workforce that were in
factory‐based jobs and many of these factories are gone leaving the uneducated population
unemployed. The hopes were that we could further STEM‐related lessons, activities, and projects
that would open our students’ eyes so that they would come back when they were done with
college to revitalize the area.” Finally, four site directors specifically mentioned the efforts of their
Congressional representative in helping to bring their SEMAA project to fruition.
Project management and governance
Most SEMAA sites are situated within the larger institutional structure of their sites, but there was
variation across projects in how they were structured, specifically with respect to the composition of
their central staff and their use of advisory boards.
SEMAA projects are managed by a small group of staff. SEMAA projects are managed, on average,
by four to five staff members. Typically, the management team consists of a site director, AEL
coordinator, Family Café coordinator, and an administrative assistant; the management team does
not include the set of instructors who teach the SEMAA sessions. Some projects also have additional
support staff such as a Family Café facilitator, office manager, and perhaps another administrative
assistant. In two sites, however, the director is the sole staff member who shoulders the
responsibilities of coordinating the AEL and Family Café.
Most SEMAA site directors hold other positions within their organizations. Project directors hold a
variety of responsibilities, including: overseeing project implementation; managing staff;
coordinating instruction, evaluation, and recruitment; maintaining an inventory of supplies;
fundraising; and reporting. For about a third of the interviewees (29 percent), their work as the
SEMAA site director or project manager is their sole position.15 Most of the SEMAA site directors (71
percent), however, hold other positions such as faculty member, director of a science center, or
university staff member (e.g., department coordinator, outreach director). For these directors, as
well as most of the other staff, SEMAA project positions tend to be part‐time rather than full‐time.
SEMAA projects report to a senior institutional administrator. SEMAA projects are situated in
various positions within the administrative structure of their grantee institutions. Within
postsecondary institutions, projects are found in academic units such as a college (e.g., liberal arts
and sciences college); a particular school (e.g., school of engineering, school of education) or
department (e.g., math and science, earth and physical sciences) within a college; or an
administrative unit or special program (e.g., office of research and sponsored programs, office of
15 Two directors at public school district sites, and two at institutions of higher education.
26
Abt Associates Inc. National Evaluation of SEMAA
precollege programs, office of academic and student affairs). As such, the site directors typically
report to a higher‐level administrator such as a vice president or dean. In the case where the
grantee is a public school district, three projects are situated in the central office and one at a
district science learning center; in all cases the site director reports to senior personnel such as an
executive director, county manager, or school board. Half of the active SEMAA projects have an advisory board, as did most closed sites. Of the 14
active SEMAA sites, 7 have an advisory board, and an additional site had an advisory board at the
beginning of their project, but it no longer meets; the closed sites interviewed had boards in place
while they were active. Boards are typically comprised of public (school officials, teachers,
state/district officials) and private (business, industry, parents) representatives. The frequency of
advisory board meetings, as well as the timing of the meetings, varies across sites. Several projects
reported that their advisory boards convened more frequently in earlier years, when the projects
were being established and needed guidance. In later years, meetings became less frequent; at least
one project, instead of holding regular meetings, calls upon individual board members for advice as
needed. Other projects, however, have continued to hold regular meetings, between one and three
times a year. One site reported holding advisory board meetings as frequently as two or three times
per session.
Projects where the advisory board helps with fundraising or resource procurement tended to rate
their boards as “extremely helpful” or “very helpful” (five out of seven). Of the remaining two sites
that had advisory boards, one mentioned that the board had provided guidance on project
implementation and serves as a resource to the project (as guest speakers, for example), and one
did not see its board as particularly helpful. One site director noted that their advisory board was
particularly helpful in terms of connecting the project with experts in the field of curriculum
development and increasing project visibility. This director explained, “what was important is that
these are people out in the community, part of Rotary Club, Lion’s Club, etc. and they helped get the
word out about SEMAA. And now probably every engineering professor and educator knows
SEMAA. And I have parents calling me, ‘I heard from so and so about SEMAA, can I get my child in?’
It really helped to get the word out faster.” SEMAA advisory boards assist with implementation of
activities and fundraising, but are not involved with setting policy, a common role of boards that
might not have been necessary given that SEMAA is a well‐defined program.
Project components and implementation
The three SEMAA project components are widely implemented across the sites, in one of three
academic‐year models—two out‐of‐school models (Saturday and after‐school) and an in‐school
model. Sites also offer summer sessions, which are sometimes held in a different location than the
academic year sessions.
The three project components are widely implemented. All projects offer the three core
components of SEMAA: (1) NASA SEMAA hands‐on curriculum; (2) Aerospace Education Laboratory
(AEL); and (3) Family Café. Please note that the impact study (see Chapters Four and Five) did not
study the relative contribution of each component to measured outcomes, but rather the combined
27
National Evaluation of SEMAA Abt Associates Inc.
effect of participation in the SEMAA program, which offers these components. The implementation
of each component is discussed below.
SEMAA curriculum. The SEMAA curriculum was developed to align with national standards. A
number of sites reviewed the lessons to confirm this and to verify whether the curriculum aligned
with state standards as well.16 Their site directors concluded that the SEMAA curriculum aligns well
with national, state, and even local standards. Many projects complement the SEMAA curriculum
with additional experiences designed to meet local needs or interests. For example, at least half of
the sites specifically cited the use of field trips (64 percent) and guest speakers (50 percent). A
smaller number mentioned incorporating robotics, in some cases through a club or competition (21
percent), mentorship (14 percent), and career exploration activities (14 percent). A few projects
offer enrichment activities through collaborations with other programs like Young Eagles, Women in
Aviation International, and university engineering clubs.
Aerospace Education Laboratory. AELs, which exist at every site, are predominantly located on
university and college campuses (64 percent), in such places as the library, science center, and
engineering school. Other locations for the AEL include a large classroom at a middle school, the
hosting science center/museum, and a school district facility. One project has two AEL sites, one
located at a public high school and another at a university. Half of the sites reported offering all or
nearly all 10 SEMAA simulations (wind tunnel, flight planning, flight simulator, GPS, remote sensing,
aeronautic interactive, aircraft design, etc.) as part of their core curriculum. One site explained that
not all grades they serve conduct every simulation because the site tailors offerings by age group.
Family Café. A Family Café is offered by all sites, typically at the same location where classes are
offered.17 Most of them offer the Family Café on a weekly basis (77 percent), while the remainder
offer less frequent sessions (e.g., once a month or once a quarter). Most sites run the Family Café
concurrently with the student academic sessions (69 percent) to encourage participation. Estimates
of the proportion of families that attend Family Café activities range from 15 to 85 percent, with a
mean of 48 and a median of 40 percent. Typical Family Café activities include guest speakers,
workshops, hands‐on activities, and field trips. Examples of topics covered include aviation and
astronomy, health care, financial management, parenting skills, high school course selection, college
applications, time management, testing standards, how to use the Internet, and locally available
resources and programs for students. One site director observed, “The parents love anything related
to technology. They also love anything related to helping their kids move further in school.” Another
described these meetings as “family festivals” because a student’s entire family may attend—
parents, grandparents, aunts, uncles, and siblings. Several sites deliberately work in some time for
parents and students to do hands‐on activities together. At one site during the last 20 minutes of
16 One site stated they hired a curriculum specialist to study alignment in an effort to achieve buy‐in from
local public school teachers.
17 One exception is a site that offers the Family Café in a building across the street from where the student
sessions are held.
28
Abt Associates Inc. National Evaluation of SEMAA
Family Café parents go to their child’s class where the teacher will provide an overview of that day’s
activities.
Three models of implementation prevail. SEMAA was designed as a Saturday program (Saturday
model), but in response to local needs, some projects adapted sessions to be offered during the
school day (in‐school model) or after school hours (after‐school model). The same site or location
may engage in more than one implementation model at different times within a year or different
years. The use of these models across sites is discussed in greater detail in the next section.
Currently, seven sites characterize themselves as being primarily a Saturday program (50 percent),
six provide in‐school services (43 percent), and one runs as an after‐school program.
Projects typically offer three academic sessions during the school year and a summer session. The
academic year sessions vary greatly in format, especially in the case of the in‐school model. For
example, of the sites that use an in‐school model, one site holds 55 classes of 120 minutes during
the course of a single academic session while another holds 4 classes of 480 minutes. Less variation
is found across the sites that use the Saturday model; these projects each hold 7 or 8 classes of 180
minutes. The one project that currently implements an after‐school model holds 8 sessions of 150
minutes. During the summer, half of the 14 active SEMAA sites offer four one‐week sessions, with
the remaining sites offering two to three one‐week sessions (3 sites), one five‐ to six‐week session (2
sites), and one or two two‐week sessions (4 sites).18
Academic sessions and summer sessions may be held at different locations. SEMAA projects
generally hold their academic‐year classes in public schools (50 percent), on the campuses of
postsecondary institutions (36 percent), both (7 percent, or 1 site), or at a science center/museum
(7 percent). In some cases the venue for classes changes during the summer months. For example,
one project usually delivers SEMAA classes in public school classrooms either during or after school
but in the summer SEMAA classes are held at the university. Similarly, at another site SEMAA is held
at a science center during the school year, but accommodates more students during the summer by
holding classes at a middle school.
Sites undertake multiple outreach efforts. SEMAA projects conduct outreach through a variety of
efforts. All but one of the sites are engaged in outreach through the AEL. Typically a site will target
K–12 students for outreach by hosting school field trips and campus tours at the AEL. Other sites
mentioned specifically serving teachers, parents, or the entire community. For example, one urban
site reported that teachers from surrounding school districts use the AEL after the school day
(approximately 480 non‐SEMAA teachers participate annually). Estimates of the number of
individuals reached annually through such activities ranged from 0 (rural site) to 5,500 (urban site),
with the median being 775 students. In addition, project staff make classroom visits—bringing
portable star lab, e‐planetarium, AEL laptops, space suit, etc.—and have made appearances at area
18 Counts add up to two more than the universe of current sites because two sites appear in two of the
categories listed.
29
National Evaluation of SEMAA Abt Associates Inc.
science fairs, career fairs, summer camps, Boys and Girls Club, hospitals, church daycare, and
homeless shelters. SEMAA projects also work with science clubs and robotics teams.
Students served
On average, SEMAA sites serve 1,495 students a year (median of 1,169), ranging from 431 to 3,100
depending on the site. 19 Collectively, during the 2007–2008 school year, the 14 SEMAA sites served
20,929 direct student participants from 205 school districts and enrolled at 551 elementary schools,
254 middle schools, and 141 high schools nationwide. These estimates, reported by site directors for
this study, are close to those reported in sites’ quarterly reports, which document that almost
19,000 students are served from 158 school districts and 576 elementary, 233 middle and 150 high
schools. The only notable discrepancy between the two different sources is in the number of school
districts reported.
Presentations and word of mouth are seen as the most effective recruitment strategies. Projects
recruit students through a number of means, most commonly through newspaper advertisements,
flyers, presentations at schools and other community venues, and word of mouth (parents and
teachers). In‐person presentations and word of mouth were the most frequently cited methods of
effective recruitment. Several sites noted that their project is so well known and in demand now
that they no longer need to recruit. Although projects usually use some sort of application or
registration form, there are no selection criteria and projects accept students on a first come, first
served basis. Projects only turn away students when they have reached capacity. Projects have
devised strategies to address capacity limitations. One project, facing overwhelming demand, has
limited student participation to one academic session and the summer session. Another one limits
summer session participation to those who did not participate in the regular school year sessions.
These approaches have limitations, however, to which projects are responding as well. Due to
budget cuts, a number of sites reported scaling back their summer offerings, and partnering with
various community groups to offer sessions at existing camps or programs.
Most projects serve students in all grades, but those located at colleges and universities are
somewhat less likely than public school districts to serve early elementary grades. Most projects
(10 out of 14, or 71 percent) serve students from kindergarten through 12th grade. The other sites,
however, serve a subset of these grades. Since all sites serve grades 2 to 8, variation was driven by
grades at the two extremes, at the beginning of elementary school (grades K and 1) and in high
school (grades 9 to 12) (see Exhibit 5). Kindergarten is the grade level least likely to be served,
followed by grades 11 and 12. Public school districts are somewhat more likely to serve kindergarten
and 1st grade than colleges and universities.
19 These figures refer to “direct student participants” and are based on a 12‐month period—including all
sessions offered during an academic year plus the summer sessions. Averages were calculated based on
the estimates provided by each site included in this study.
30
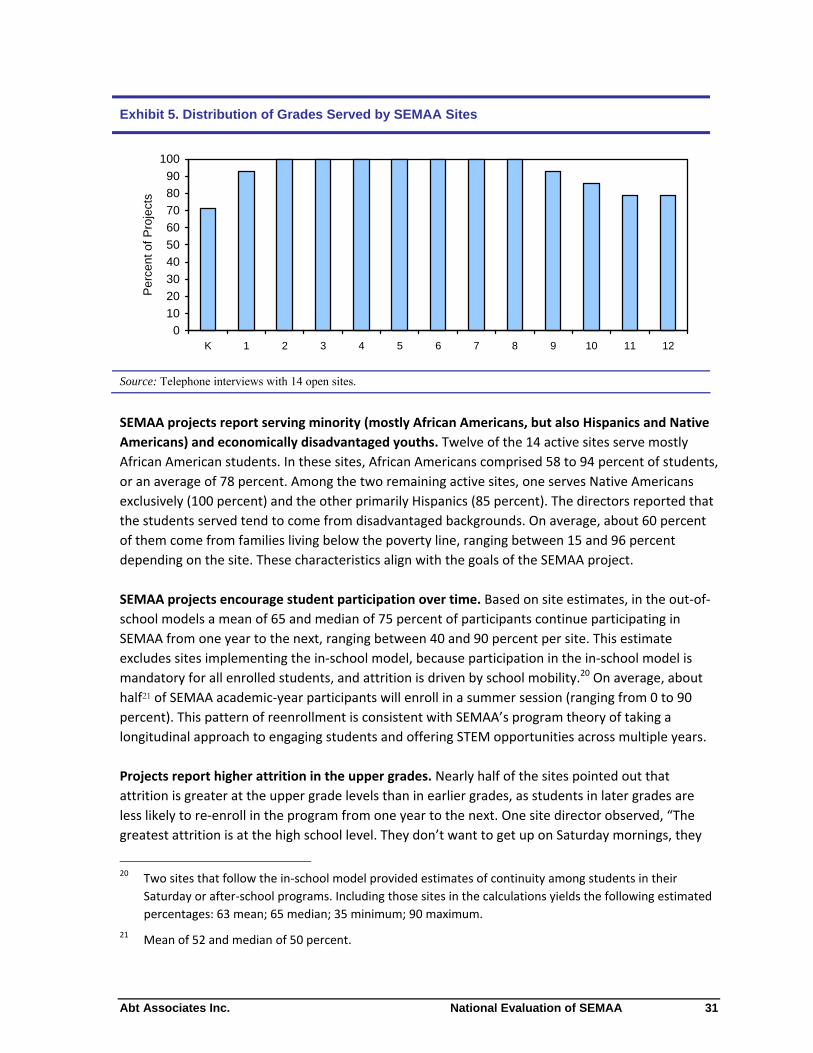
Abt Associates Inc. National Evaluation of SEMAA
Exhibit 5. Distribution of Grades Served by SEMAA Sites
0
10
20
30
40
50
60
70
80
90
100
K 1 2 3 4 5 6 7 8 9 10 11 12
Pe
rce
nt
of
Pro
ject
s
Source: Telephone interviews with 14 open sites.
SEMAA projects report serving minority (mostly African Americans, but also Hispanics and Native
Americans) and economically disadvantaged youths. Twelve of the 14 active sites serve mostly
African American students. In these sites, African Americans comprised 58 to 94 percent of students,
or an average of 78 percent. Among the two remaining active sites, one serves Native Americans
exclusively (100 percent) and the other primarily Hispanics (85 percent). The directors reported that
the students served tend to come from disadvantaged backgrounds. On average, about 60 percent
of them come from families living below the poverty line, ranging between 15 and 96 percent
depending on the site. These characteristics align with the goals of the SEMAA project.
SEMAA projects encourage student participation over time. Based on site estimates, in the out‐of‐
school models a mean of 65 and median of 75 percent of participants continue participating in
SEMAA from one year to the next, ranging between 40 and 90 percent per site. This estimate
excludes sites implementing the in‐school model, because participation in the in‐school model is
mandatory for all enrolled students, and attrition is driven by school mobility.20 On average, about
half21 of SEMAA academic‐year participants will enroll in a summer session (ranging from 0 to 90
percent). This pattern of reenrollment is consistent with SEMAA’s program theory of taking a
longitudinal approach to engaging students and offering STEM opportunities across multiple years.
Projects report higher attrition in the upper grades. Nearly half of the sites pointed out that
attrition is greater at the upper grade levels than in earlier grades, as students in later grades are
less likely to re‐enroll in the program from one year to the next. One site director observed, “The
greatest attrition is at the high school level. They don’t want to get up on Saturday mornings, they
20 Two sites that follow the in‐school model provided estimates of continuity among students in their
Saturday or after‐school programs. Including those sites in the calculations yields the following estimated
percentages: 63 mean; 65 median; 35 minimum; 90 maximum.
21 Mean of 52 and median of 50 percent.
31
National Evaluation of SEMAA Abt Associates Inc.
have a job, do sports, or are just not interested anymore.” Another explained that “we get lower
enrollment in the upper grades and that is why we target high schoolers more than lower grades.
After the middle school it starts slowing down.” Aside from seeking to put together sessions that are
interesting, fun, and stimulating, some things that projects are doing to ensure continued student
participation is calling parents to impress upon them the importance of participation, identifying
student role models and highlighting their success (internships, scholarship, college acceptance),
and offering a guaranteed spot for next year to those who achieve good attendance.
SEMAA providers
SEMAA provides training to instructors, often certified teachers, to implement the SEMAA
components. Trained SEMAA instructors generally continue with the SEMAA program from year to
year.
Sites have no difficulty recruiting teachers to lead classes. Projects reported they did not encounter
difficulties in recruiting enough qualified teachers to lead the SEMAA classes. The projects with an
in‐school model benefit from district assistance in hiring teachers, and those with an out‐of‐school
program rely on referrals from current teachers. In general, in‐school site directors work with a
school principal or liaison within the school system to select teachers who are hired by the district.
Most projects reported hiring only inservice teachers (64 percent), while the others rely mostly on
inservice teachers but also employ some preservice teachers. One site reported also using college
professors and graduate engineering students to teach sessions. In hiring SEMAA teachers, site
directors generally select teachers based on criteria such as whether they have a math or science
background, state certification, advanced degree or extensive teaching experience, and enthusiasm
for the subject matter and working with children.
Projects report low teacher turnover. Site directors indicated that teacher attrition from one year
to the next is low, as instructors tend to stay with the SEMAA project for a long time. Many directors
stated that they have largely the same group of teachers that they had at the start of the project. As
one put it, “The same teachers participate year after year.” If instructors leave, it is usually because
they move, get promoted, or face personal constraints (e.g., family, time). As the site director for a
Saturday project stated, “The same first group of teachers is still here. That is one of the things that
makes our program successful.”
Teachers across sites are trained to deliver the SEMAA curriculum. All sites engage existing
teachers to train new teachers, but the training varies in terms of size (group versus individual),
structure (highly structured versus informal review and questions/answers) and duration (one‐day
session, several days of shorter sessions, one‐year assistantship). For the majority of sites training
sessions are carried out by grade level and are held at the start of each quarterly session, but vary
greatly in duration. For example, one site conducts training in one full day, while another conducts it
in multiple meetings spread across three weeks. In some cases, training entails going through each
lesson of the curriculum, covering both content and pedagogy. In other instances it is less detail
oriented, and is structured as an opportunity to review the materials and to ask questions. A handful
of projects specifically mentioned adopting a “train the trainer model” (36 percent) in which the
32
Abt Associates Inc. National Evaluation of SEMAA
original set of instructors trained by the national SEMAA office now train the new instructors that
come on board. For a few sites this may be a one‐on‐one process where the new teacher observes
how a class operates and then meets with the teacher they are replacing for individual training. A
couple of sites complement basic training with a teaching assistantship, ensuring that new
instructors assist a SEMAA teacher in the classroom for a year before being assigned their own class
to teach in the second year.
External support, partnerships and collaborations
Sites were asked about the collaborations and partnerships that contributed, either financially or in
some material way, to the implementation of their projects. Naturally, site directors spoke about
the internal partnerships that they have formed at the host institution that provide in‐kind
contributions (e.g., physical space, material resources, administrative support). Of particular interest
are the external partnerships and collaborations that have been fostered beyond the financial and
in‐kind contributions provided by NASA and the host institution. On average, sites raised significant
sums to support the SEMAA project. These funds were needed, in conjunction with those provided
by NASA, to sustain the projects. None of the sites felt, however, that their fundraising was yet
sufficiently successful to allow them to become independent of NASA. Nonetheless, we report here
noteworthy information regarding fundraising sources and differences across sites.
SEMAA projects received support from multiple external sources—community groups, industry
and research centers. External sources of support for SEMAA projects come from school districts,
colleges and universities, research and science centers, laboratories, industry, and community
groups. Exhibit 6 shows the proportion of sites that developed such external collaborations. When
the host site is a university or college, a public school system becomes an “external” partner, and
vice versa when the host is a public school district. Excluding partnerships that constitute the
foundation of the SEMAA project,22 and focusing instead on “other” partners and collaborators,
reveals that sites at public school districts are more likely to develop collaborations with community
groups and museums/centers, whereas college and university sites are more likely to develop ties to
other institutions of higher education and industry.23 Specifically: all four public school districts that
run SEMAA projects developed collaborations with community groups; only three of the nine
colleges/universities partnered with community groups; most (five of eight) of the
college/university24 sites developed collaborations with industry, as did two of the four public school
districts; and two public school sites and two university sites developed collaborations with a
22 These partners are those that provide a resource or service that is an integral component of SEMAA.
23 Measured by the number of partnerships/collaborations established. Note that this general conclusion is
supported by data gathered from the telephone interviews and the quarterly reports prepared by
Paragon TEC, Inc. The more detailed information on specific collaborations and partnerships is drawn
from interviews, which yielded somewhat different distributions compared to the information contained
in the quarterly reports.
24 Excluding community colleges.
33
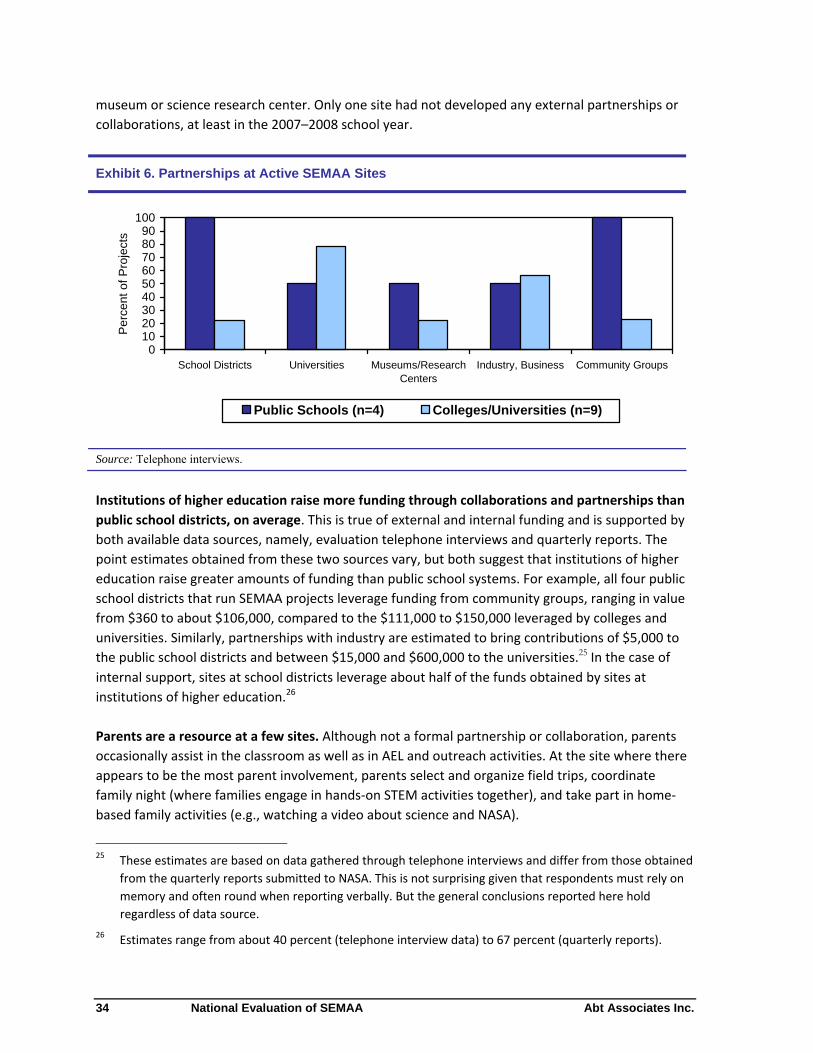
National Evaluation of SEMAA Abt Associates Inc.
museum or science research center. Only one site had not developed any external partnerships or
collaborations, at least in the 2007–2008 school year.
Exhibit 6. Partnerships at Active SEMAA Sites
0102030405060708090
100
School Districts Universities Museums/ResearchCenters
Industry, Business Community Groups
Pe
rce
nt
of
Pro
ject
s
Public Schools (n=4) Colleges/Universities (n=9)
Source: Telephone interviews.
Institutions of higher education raise more funding through collaborations and partnerships than
public school districts, on average. This is true of external and internal funding and is supported by
both available data sources, namely, evaluation telephone interviews and quarterly reports. The
point estimates obtained from these two sources vary, but both suggest that institutions of higher
education raise greater amounts of funding than public school systems. For example, all four public
school districts that run SEMAA projects leverage funding from community groups, ranging in value
from $360 to about $106,000, compared to the $111,000 to $150,000 leveraged by colleges and
universities. Similarly, partnerships with industry are estimated to bring contributions of $5,000 to
the public school districts and between $15,000 and $600,000 to the universities.25 In the case of
internal support, sites at school districts leverage about half of the funds obtained by sites at
institutions of higher education.26
Parents are a resource at a few sites. Although not a formal partnership or collaboration, parents
occasionally assist in the classroom as well as in AEL and outreach activities. At the site where there
appears to be the most parent involvement, parents select and organize field trips, coordinate
family night (where families engage in hands‐on STEM activities together), and take part in home‐
based family activities (e.g., watching a video about science and NASA).
25 These estimates are based on data gathered through telephone interviews and differ from those obtained
from the quarterly reports submitted to NASA. This is not surprising given that respondents must rely on
memory and often round when reporting verbally. But the general conclusions reported here hold
regardless of data source.
26 Estimates range from about 40 percent (telephone interview data) to 67 percent (quarterly reports).
34
Abt Associates Inc. National Evaluation of SEMAA
SEMAA Implementation
The use of the three academic implementation models introduced above—Saturday, after‐school,
and in‐school—varies across sites, both in which model they are currently using and in how the
models have been used over time.
SEMAA models and model selection
SEMAA sites can be classified into three models defined by the timing of when they offer the SEMAA
components—Saturday, after‐school, or in‐school. In addition sites can be characterized by the
constancy from year to year with which they have implemented a chosen model. Various contextual
factors drive sites’ decisions to select a model, and there is some evidence that the in‐school model
is used in response to student demand and sustainability.
Models of implementation are defined by when sites offer the SEMAA components. A research
question central to this study was whether distinct models of implementation could be identified.
Often in national programs, variation in implementation arises as program components are offered
at some sites but not at others. However, this was not the case with SEMAA, as all sites offer the
three SEMAA components. Instead, the variation—the different models—was grounded in the
timing of when sites offer the three SEMAA components as prescribed by the SEMAA project. In
other words, the main models are characterized by the type of session—Saturday, in‐school or after‐
school—which is partly related to resource availability and contextual factors (described below). The
Saturday and after‐school models are both out‐of‐school programs, which share key characteristics:
they are offered outside of regular school hours, have as their central goal the delivery of the
SEMAA content, are “special” programs (as opposed to part of a regular science class), require the
hiring of staff, and require special transportation (children must be picked up from school late for
after‐school programs, or driven on Saturday to the project’s location). These models differ from the
in‐school model in that they do not have a captive audience, and instead are attended by individuals
who choose to participate in the program. Conversely, the in‐school model includes both those
individuals who would have chosen to engage in SEMAA outside of school hours as well as
individuals who participate because it is part of the science curriculum at school.
A longitudinal perspective reveals within‐site changes in models implemented. The
implementation of these models over time reveals another dimension important to the
implementation of SEMAA—a dimension introduced by the passage of time and the desire to
institutionalize the projects (i.e., continue beyond NASA funding). The models selected and
implemented within sites over time suggest that project sites can be classified according to the
constancy of the model they implement into one of three types—constant, transitioned, and in
transition. This typology is based on whether sites have changed or are exploring changing their
model type. A “constant” site is one that has not changed its model type since its inception (e.g., has
only offered Saturday sessions); a “transitioned” site is one that originated in one type but has
shifted to a new model (e.g., began implementing a Saturday model and is now implementing an in‐
35
National Evaluation of SEMAA Abt Associates Inc.
school model); and a site “in transition” is one whose offerings indicate that they are exploring other
models, although still offering the original session type.
According to site directors’ characterizations, among the active sites six have remained constant,
four have transitioned to a different model type, and four are in transition status. Six sites are
classified as constant because they are still implementing the model they were implementing at
their origin; among these, three are implementing the Saturday model, two the in‐school model,
and one the after‐school model.27 Four sites belong in the in‐transition category, because they are
exploring alternate models; each of these started with the Saturday model. Three are exploring the
in‐school model to help with sustainability or respond to demand. Two are exploring the after‐
school model. Finally, four sites are classified as transitioned. Each of these has moved to the in‐
school model for issues of sustainability; in one case the transition was in the initial plans of the site.
Three of these sites began with the Saturday model, and the remaining site began with the after‐
school model.
This longitudinal look at model implementation revealed that sites tend to implement the program
as envisioned by the SEMAA project (as a Saturday model)—but in response to (a) student demand
for participation or (b) funding pressure (as they approach the end of their funding or need to
expand in response to student demand)—projects either transition to an in‐school model or close
(or both). A variant of these alternatives is found at the only site that successfully graduated from
NASA funding and that, to this day, continues offering a limited set of activities through outreach.
This site (a) originated as a Saturday model, (b) evolved into a pseudo in‐school program (as
teachers continued to seek activities offered by the center and to use the SEMAA materials and
applications after the site was no longer funded by NASA SEMAA), and (c) later focused on outreach
activities that they expect to be able to continue providing because these align with their mission. In
other words, by conducting AEL outreach, this center has been able to sustain some of the SEMAA
activities.
The inclusion of closed sites in this longitudinal analysis reinforces this observation. Exhibit 7 shows
the transition of the universe of SEMAA sites (25 closed and open projects) over time. Organized by
model type, the figure shows the model under which each site was established (18 Saturday, 2 in‐
school and 5 after‐school), and the predominant model they describe offering at present (if open) or
offered at the time they closed.28 Of the 18 sites that began as Saturday programs, only 7 continue
to offer Saturday sessions, 6 transitioned to in‐school programs,29 and 5 closed. Similarly, of the 5
sites that opened as after‐school programs, 1 remains, 1 transitioned to in‐school, and 3 closed. This
27 One site offering the in‐school model was at one point in transition (exploring after‐school offerings) but
due to resource constraints discontinued that model and continued with the original in‐school offerings.
28 Please note that sites may offer more than one model. This analysis focuses on the model that site
directors consider their predominant or most commonly offered model. These classifications differed only
in one instance from classifications made by the National SEMAA Office, which would classify one of these
in‐school sites as predominantly offering a Saturday model.
29 Three of them later closed, and one continued with more limited offerings (AEL outreach).
36
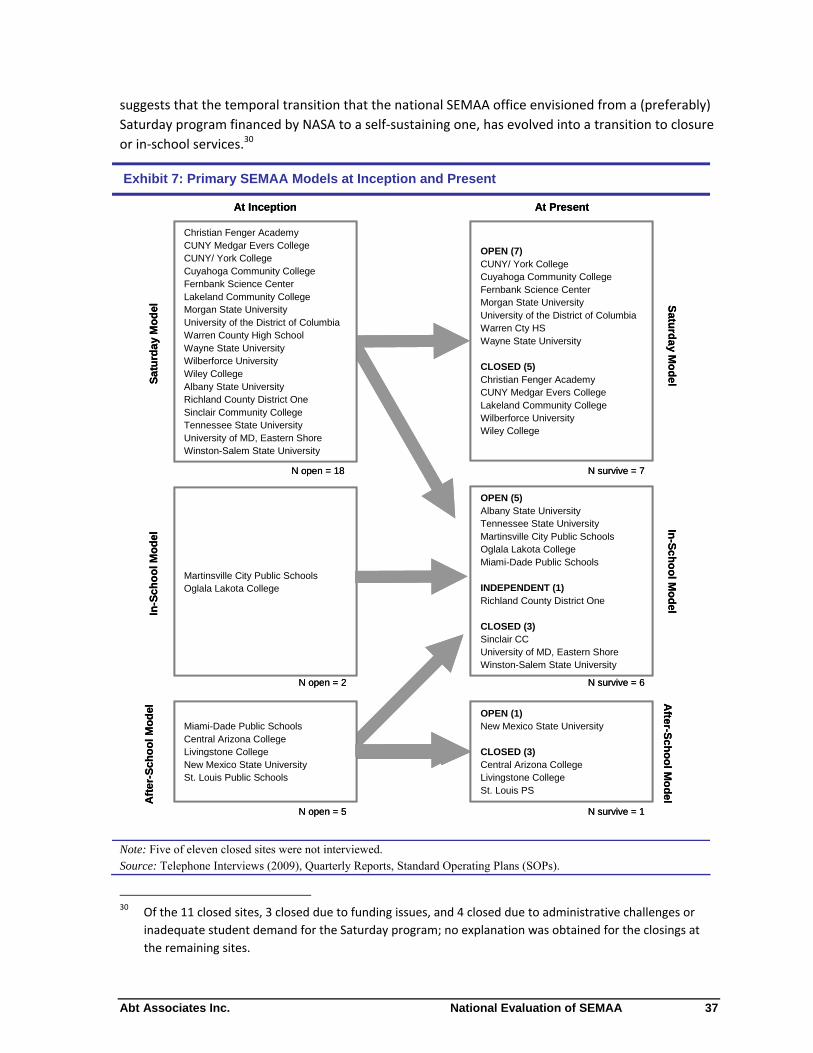
Abt Associates Inc. National Evaluation of SEMAA
suggests that the temporal transition that the national SEMAA office envisioned from a (preferably)
Saturday program financed by NASA to a self‐sustaining one, has evolved into a transition to closure
or in‐school services.30
Exhibit 7: Primary SEMAA Models at Inception and Present
Note: Five of eleven closed sites were not interviewed. Source: Telephone Interviews (2009), Quarterly Reports, Standard Operating Plans (SOPs).
30 Of the 11 closed sites, 3 closed due to funding issues, and 4 closed due to administrative challenges or
inadequate student demand for the Saturday program; no explanation was obtained for the closings at
the remaining sites.
Christian Fenger Academy CUNY Medgar Evers College CUNY/ York CollegeCuyahoga Community CollegeFernbank Science CenterLakeland Community CollegeMorgan State UniversityUniversity of the District of ColumbiaWarren County High SchoolWayne State UniversityWilberforce University Wiley College Albany State UniversityRichland County District OneSinclair Community CollegeTennessee State UniversityUniversity of MD, Eastern ShoreWinston-Salem State University
OPEN (7)CUNY/ York CollegeCuyahoga Community CollegeFernbank Science CenterMorgan State UniversityUniversity of the District of ColumbiaWarren Cty HSWayne State University
CLOSED (5)Christian Fenger Academy CUNY Medgar Evers College Lakeland Community College Wilberforce University Wiley College
OPEN (5)Albany State UniversityTennessee State UniversityMartinsville City Public SchoolsOglala Lakota CollegeMiami-Dade Public Schools
INDEPENDENT (1)Richland County District One
CLOSED (3)Sinclair CC University of MD, Eastern Shore Winston-Salem State University
OPEN (1)New Mexico State University
CLOSED (3)Central Arizona College Livingstone College St. Louis PS
Martinsville City Public SchoolsOglala Lakota College
Miami-Dade Public Schools Central Arizona College Livingstone CollegeNew Mexico State UniversitySt. Louis Public Schools
Aft
er-
Sc
ho
ol
Mo
del
In-S
ch
oo
l Mo
del
Sa
turd
ay
Mo
del
At Inception At Present
After-S
ch
oo
l Mo
del
In-S
ch
oo
l Mo
del
Satu
rda
y Mo
de
l
N open = 18
N open = 2
N survive = 7
N survive = 6
N open = 5 N survive = 1
37
National Evaluation of SEMAA Abt Associates Inc.
Facilitating implementation
Committed staff and institutional support were the most commonly cited factors facilitating general
implementation, whereas funding was the key barrier mentioned. One site director stated, “We
have an outstanding staff that is committed to the children and the parents. They are not making a
lot of money here. They are truly inspired to keep the program going.” Another site director who
reported having a “highly qualified” and “committed” staff noted that “screening your staff is
critical.” Similarly, a closed site mentioned specifically that lack of committed staff was a critical
barrier to implementation. Site directors also mentioned that having the support of the host
institution (school district or university) is critical, a comment echoed by a closed site that lacked
such support. But in terms of the biggest challenges to project implementation, site directors
overwhelmingly cited funding difficulties—whether directly (to maintain the project) or indirectly (to
staff it adequately given demand). They explained that funding cuts and lapses adversely affected
their projects, particularly given the lack of prospective financial partners to draw upon in their local
areas, and cited difficulties in fundraising (79 percent of the 14 current sites). Several spoke about
how inadequate staffing, stemming from funding constraints, impairs their ability to expand their
project to serve more students.
Sites also discussed the factors that influence their selection of model types, and explained the
transition to new models over time within sites. Most sites begin as Saturday models under NASA
sponsorship. Sites have mentioned, however, two types of constraints that have led to modifications
or adaptations of program offerings—namely, transportation and resources. The first limitation—
transportation—is faced by rural sites, where students may be spread across great distances and
parents may have difficulties coming to the sites to participate in the Family Café during the week,
or picking up children participating in after‐school programs. At these locations, Saturday offerings
provide the greatest probabilities of both student and parent participation. Similarly, site directors
mentioned that the additional costs associated with out‐of‐school programs (in particular teacher
salaries) make the provision of those programs without NASA funding difficult. Hence the high
incidence of site closings and transitions to in‐school models among sites. 31
Monitoring and evaluation
Projects tend to restrict evaluation activities to those required by NASA for reporting purposes.32
Projects gather basic data (such as participant demographics) to report to NASA and generally use
these data for their own planning and fundraising purposes. For example, some projects mentioned
that data guide the identification of populations to be targeted for recruitment or project growth
(e.g., if there are demographic groups that are not well represented), to seek external funding and
write proposals, and to improve project offerings.
31 Not all sites closed due to financial problems; lack of adequate student demand and administrative
difficulties were other reasons.
32 Exception for the monitoring of student progress, described below.
38
Abt Associates Inc. National Evaluation of SEMAA
Sites conduct monitoring of student progress only on a limited basis, with a few notable
exceptions. Student progress is not measured directly, but at some sites it is monitored indirectly
through regular school grades, and a couple of sites take more rigorous approaches. Twelve of the
14 active sites mentioned that they do not monitor student progress, but 3 of them (in‐school)
added that they do rely on student school grades to follow student progress and infer the impact of
program participation; this is also true of a Saturday program, but for the upper grades only. The
remaining two active sites take a more rigorous approach to progress monitoring. The project
directors at these Saturday sites stated that they conduct pre and post testing of students at the
beginning and end of each session, respectively, to measure knowledge growth. Lastly, four sites
mentioned other specific monitoring and evaluation efforts. One did a study of high school students
to measure changes in interest and achievement, and found improvements after students
participated in their eight‐week SEMAA session. Another takes advantage of regular standardized
testing to compare average achievement among participants and nonparticipants (e.g., in middle
school earth‐space).
Projects typically do not track their participants, with a couple of exceptions among institutions of
higher education. In general, projects have not followed their participants’ progress, an exercise
that requires funding and technical expertise that project staff might lack. One site has tracked their
12th grade participants into college, and another one stated that in the summer they contact parents
to find out the field and college into which 12th grade participants got accepted.33 A couple of others
made similar attempts by telephone or mail, but discontinued them because they lacked the staff to
conduct follow‐ups or did not obtain a good response rate in their mail inquiries. Not surprisingly,
reported attempts at tracking participants were all conducted by institutions of higher education,
which are likely better equipped to conduct such work than public school districts.34
Site directors perceive positive outcomes for students participating in SEMAA. Although projects
do not conduct outcome evaluations, they cited anecdotal evidence of increased student interest in
STEM, improved performance in math and science (over time and/or compared to their non‐SEMAA
peers), increased student exposure to the fields of and opportunities in STEM and in NASA,
enhanced parental education regarding these fields and opportunities, and greater resources and
training provided to teachers.
Sustainability
Interviews revealed that there are two related issues regarding sustainability—namely, financial and
mission sustainability. This section discusses both.
33 However, no estimate of the proportion of participants who go on to STEM in college was provided.
34 Only two sites could estimate the approximate share of their 12th graders who enroll in college in STEM
(45 percent in one, and 50 percent in the other), but in one case it was based on only one cohort because
they discontinued tracking.
39
National Evaluation of SEMAA Abt Associates Inc.
The in‐school model is perceived as a viable sustainability plan. As discussed earlier, most of the
sites still open today began as Saturday programs, but several of them transitioned to an in‐school
program and others are beginning to offer in‐school sessions. Site directors mentioned that they
shifted or are in the process of shifting to an in‐school model for cost reasons, to increase
participation, or to prepare to sustain the program post‐NASA funding. “One of the main concerns is
that SEMAA programs have no long‐term funding plan… So, if our funding is to stop, we would still
continue the in‐school model.”
Some projects combine offerings across models to leverage resources and reach more students.
For example, a self‐proclaimed successful Saturday program is offering in‐school sessions to reach
more students and because “it can be done pretty inexpensively, as teacher salaries are covered [by
the school district].” In contrast, an in‐school site discontinued its after‐school offerings which
required funding for staff salaries.
More isolated areas encounter greater difficulties in fundraising. Projects located in more remote
or rural areas do not have easy access to partners and potential resources, as might be the case in
sites located in more populated urban or suburban areas. As one director put it, “We are not a
hotbed of industry here, and we don’t have all the instant partners anywhere near us.”
Site directors assume the role of educator‐administrators versus fundraiser. Most site directors do
not see fundraising as one of their main responsibilities. Indeed, when asked to summarize their
responsibilities, only three of them mentioned fundraising. More to the point, one director pointed
out that “I cannot run the program and fundraise and teach and do everything else.” Clearly, the
projects directors, most of whom also hold other positions/responsibilities, find tension between
their role as administrators and academic leaders, and the expectation that they seek funding for
the future.
Some site directors fear that the science and NASA foci of the SEMAA program might be put in
jeopardy by the in‐school approach. One director worried that in‐school programs might not
dedicate the requisite time to the science curricula when pressured to focus on mathematics and
reading. This director stated, “Science is being put on the shelf in [district name deleted] because
they are looking at reading and mathematics.” This concern is unsurprising given that these are the
subjects tested for NCLB35 purposes. Another interviewee echoed this concern stating, “you’re
looking at schools…[not] adequately meeting AYP, most schools are in crisis, trying to improve math
and reading scores, so science is left out.”36
35 Refers to the No Child Left Behind Act, federal legislation enacted in 2002 that imposes strict testing
requirements in schools throughout the nation.
36 At this school, time dedicated to SEMAA has been mandated by the leadership in an attempt to prevent
the crowding out of science. AYP stands for Adequate Yearly Progress, a concept introduced in NCLB to
measure average school performance over time.
40
Abt Associates Inc. National Evaluation of SEMAA
Chapter 4: Characteristics of SEMAA Participants
The outcomes study was conducted to investigate the impact of the SEMAA program on participant
outcomes. As described earlier, this study module was conducted at SEMAA sites that implement
the original Saturday model. In this chapter, we discuss the characteristics of the students in grades
4 through 8 who applied for the Saturday model of SEMAA at 6 of the 14 active SEMAA sites in the
Fall of 2009. These sites comprised all but one of the eligible sites (i.e., those running a Saturday
model) and close to half of all active SEMAA sites. Although not all models or grades are included,
these data provide insight into the students who are attracted to and apply to the SEMAA program.
In this chapter, we present descriptive statistics on student and parent background characteristics,
and prior experiences with SEMAA. We end with a discussion of the study sample at baseline,
describing the outcomes used in the outcome study and discussing the baseline levels of these
outcomes.
Background of Participants
Overall, background characteristics were similar across the treatment and control groups. Appendix
A discusses the baseline balance tests conducted on the analytic sample to ensure that the
treatment and control groups, as well the pre‐test and post‐test samples, were similar.
Background characteristics of the baseline sample are presented in Exhibit 8. Slightly more than half
(55 percent) of the students were male. In line with SEMAA’s mission of serving groups traditionally
underrepresented in STEM, a majority of students (72 percent) identified themselves as belonging
to a racial or ethnic group traditionally underrepresented in STEM fields: 64 percent identified
themselves as Black or African American, 11 percent as Asian, 8 percent as Hispanic/Latino(a) and 6
percent as White. Applicants were predominantly English‐speaking—79 percent spoke only English
at home and an additional 19 percent spoke English and another language at home. Similarly, 87
percent spoke only English at school, with an additional 12 percent reporting they spoke both
English and another language at school; Spanish was the predominant other language spoken.
Finally, just under half (49 percent) of applicants reported an annual household income of over
$50,000. This is more than double the 2009 national poverty threshold of $22,050 for a family of
four living in the 48 contiguous states or the District of Columbia, 37 and differs slightly from sites’
reports of serving a majority of individuals from below the poverty line.
37 Federal Register, Vol. 74, No. 14, January 23, 2009, pp. 4199–4201
41
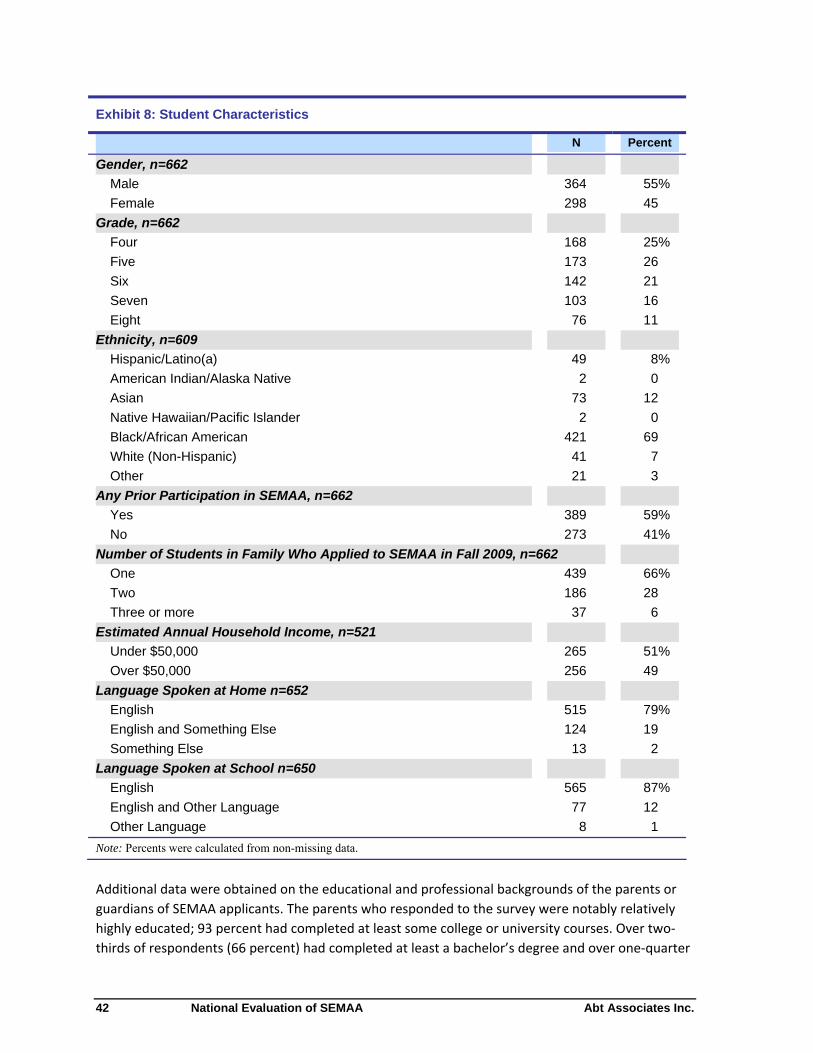
National Evaluation of SEMAA Abt Associates Inc.
Exhibit 8: Student Characteristics
N Percent
Gender, n=662
Male
Female
Grade, n=662
Four
Five
Six
Seven
Eight
Ethnicity, n=609
Hispanic/Latino(a)
American Indian/Alaska Native
Asian
Native Hawaiian/Pacific Islander
Black/African American
White (Non-Hispanic)
Other
Any Prior Participation in SEMAA, n=662
Yes
No
Number of Students in Family Who Applied to SEMAA in Fall 2009, n=662
One
Two
Three or more
Estimated Annual Household Income, n=521
Under $50,000
Over $50,000
Language Spoken at Home n=652
English
English and Something Else
Something Else
Language Spoken at School n=650
English
English and Other Language
Other Language
364
298
168
173
142
103
76
49
2
73
2
421
41
21
389
273
439
186
37
265
256
515
124
13
565 87%
77 12
8 1
55%
45
25%
26
21
16
11
8%
0
12
0
69
7
3
59%
41%
66%
28
6
51%
49
79%
19
2
Note: Percents were calculated from non-missing data.
Additional data were obtained on the educational and professional backgrounds of the parents or
guardians of SEMAA applicants. The parents who responded to the survey were notably relatively
highly educated; 93 percent had completed at least some college or university courses. Over two‐
thirds of respondents (66 percent) had completed at least a bachelor’s degree and over one‐quarter
42
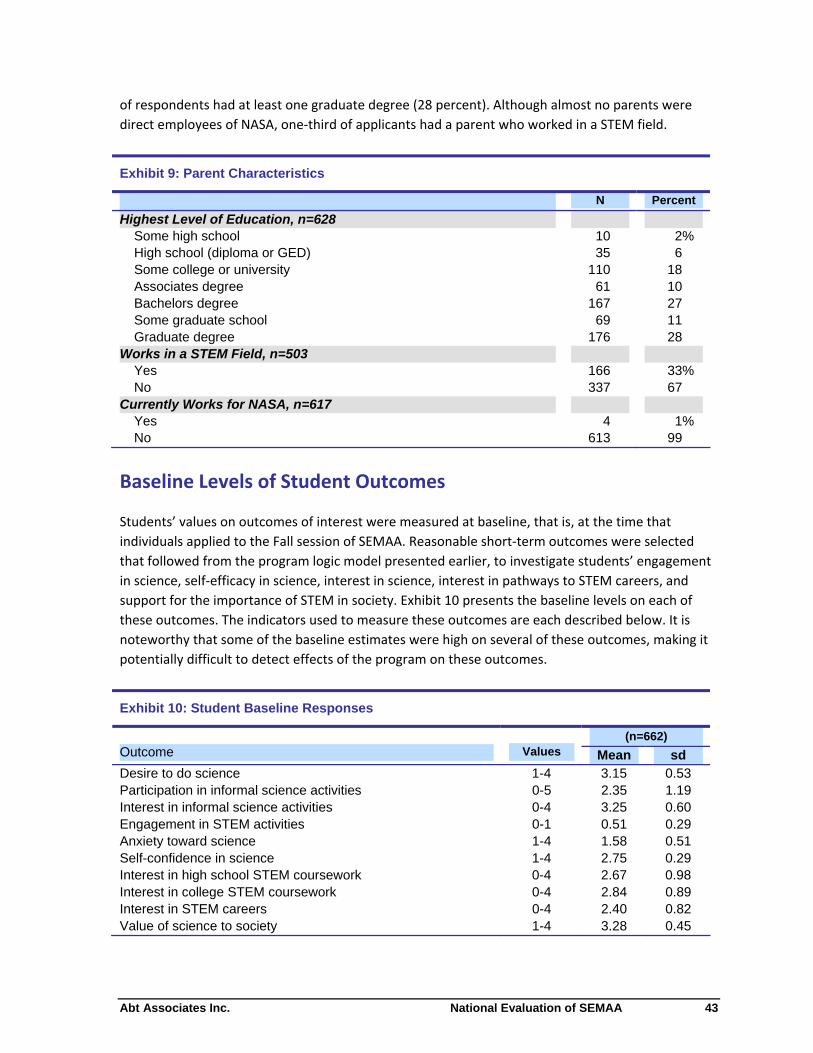
Abt Associates Inc. National Evaluation of SEMAA
of respondents had at least one graduate degree (28 percent). Although almost no parents were
direct employees of NASA, one‐third of applicants had a parent who worked in a STEM field.
Exhibit 9: Parent Characteristics
N Percent
Highest Level of Education, n=628 Some high school High school (diploma or GED) Some college or university Associates degree Bachelors degree Some graduate school Graduate degree
Works in a STEM Field, n=503 Yes No
Currently Works for NASA, n=617 Yes No
10 35
110 61
167 69
176
166 337
4
613
2% 6
18 10 27 11 28
33% 67
1%
99
Baseline Levels of Student Outcomes
Students’ values on outcomes of interest were measured at baseline, that is, at the time that
individuals applied to the Fall session of SEMAA. Reasonable short‐term outcomes were selected
that followed from the program logic model presented earlier, to investigate students’ engagement
in science, self‐efficacy in science, interest in science, interest in pathways to STEM careers, and
support for the importance of STEM in society. Exhibit 10 presents the baseline levels on each of
these outcomes. The indicators used to measure these outcomes are each described below. It is
noteworthy that some of the baseline estimates were high on several of these outcomes, making it
potentially difficult to detect effects of the program on these outcomes.
Exhibit 10: Student Baseline Responses
(n=662) Outcome Values Mean sd Desire to do science 1-4 3.15 0.53 Participation in informal science activities 0-5 2.35 1.19 Interest in informal science activities 0-4 3.25 0.60 Engagement in STEM activities 0-1 0.51 0.29 Anxiety toward science 1-4 1.58 0.51 Self-confidence in science 1-4 2.75 0.29 Interest in high school STEM coursework 0-4 2.67 0.98 Interest in college STEM coursework 0-4 2.84 0.89 Interest in STEM careers 0-4 2.40 0.82 Value of science to society 1-4 3.28 0.45
43
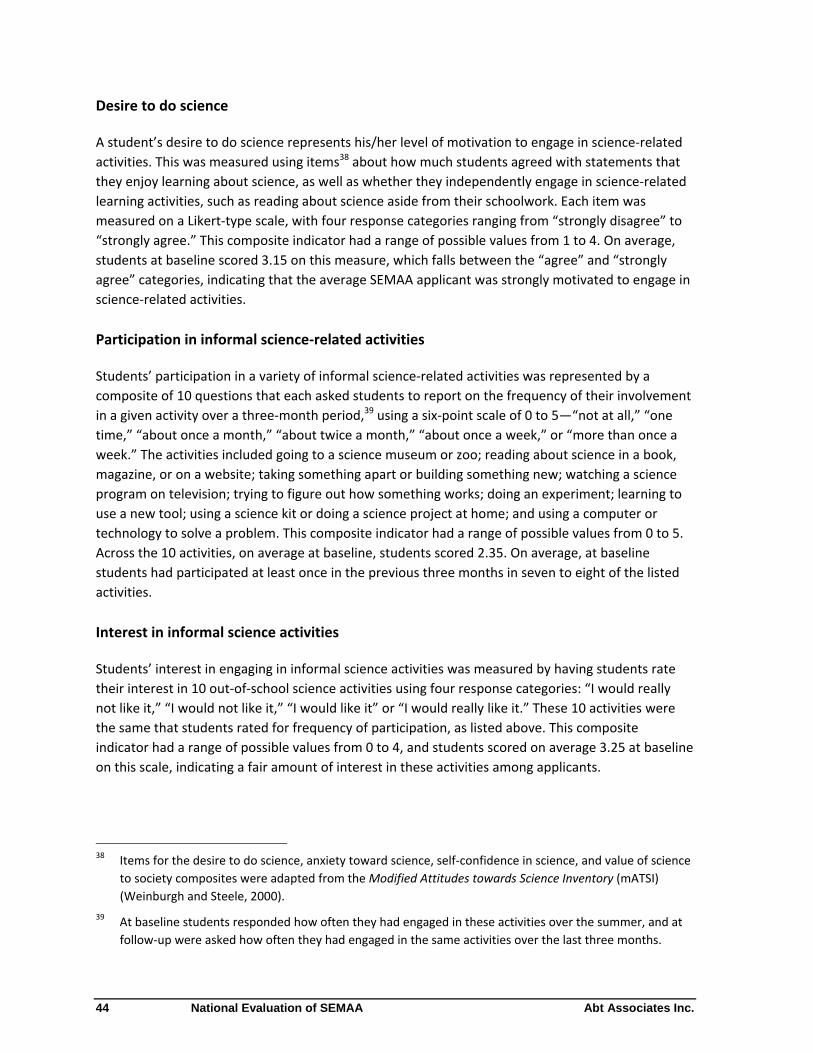
National Evaluation of SEMAA Abt Associates Inc.
Desire to do science
A student’s desire to do science represents his/her level of motivation to engage in science‐related
activities. This was measured using items38 about how much students agreed with statements that
they enjoy learning about science, as well as whether they independently engage in science‐related
learning activities, such as reading about science aside from their schoolwork. Each item was
measured on a Likert‐type scale, with four response categories ranging from “strongly disagree” to
“strongly agree.” This composite indicator had a range of possible values from 1 to 4. On average,
students at baseline scored 3.15 on this measure, which falls between the “agree” and “strongly
agree” categories, indicating that the average SEMAA applicant was strongly motivated to engage in
science‐related activities.
Participation in informal science‐related activities
Students’ participation in a variety of informal science‐related activities was represented by a
composite of 10 questions that each asked students to report on the frequency of their involvement
in a given activity over a three‐month period,39 using a six‐point scale of 0 to 5—“not at all,” “one
time,” “about once a month,” “about twice a month,” “about once a week,” or “more than once a
week.” The activities included going to a science museum or zoo; reading about science in a book,
magazine, or on a website; taking something apart or building something new; watching a science
program on television; trying to figure out how something works; doing an experiment; learning to
use a new tool; using a science kit or doing a science project at home; and using a computer or
technology to solve a problem. This composite indicator had a range of possible values from 0 to 5.
Across the 10 activities, on average at baseline, students scored 2.35. On average, at baseline
students had participated at least once in the previous three months in seven to eight of the listed
activities.
Interest in informal science activities
Students’ interest in engaging in informal science activities was measured by having students rate
their interest in 10 out‐of‐school science activities using four response categories: “I would really
not like it,” “I would not like it,” “I would like it” or “I would really like it.” These 10 activities were
the same that students rated for frequency of participation, as listed above. This composite
indicator had a range of possible values from 0 to 4, and students scored on average 3.25 at baseline
on this scale, indicating a fair amount of interest in these activities among applicants.
38 Items for the desire to do science, anxiety toward science, self‐confidence in science, and value of science
to society composites were adapted from the Modified Attitudes towards Science Inventory (mATSI)
(Weinburgh and Steele, 2000).
39 At baseline students responded how often they had engaged in these activities over the summer, and at
follow‐up were asked how often they had engaged in the same activities over the last three months.
44
Abt Associates Inc. National Evaluation of SEMAA
Change in interest in informal science activities
In addition to measuring levels of interest in informal science activities, the follow‐up survey asked
students directly about changes in their interest in these activities compared to how they felt over
the summer. This indicator was designed to measure self‐perceived changes among students in the
study, and was included to guard against the possibility of a ceiling effect. This was a potential
concern, since it was possible that the students applying to SEMAA would already have high baseline
levels of interest in these activities. If baseline interest in informal science activities was too close to
the highest possible value, then a change between baseline and follow‐up values would be more
difficult to detect. This indicator provided an alternate measure of the change in interest in informal
science activities between baseline and follow‐up. Students rated the same 10 activities in this
measure that they rated both for interest and frequency of participation. This composite indicator
had a range of possible values from 1 to 5. At follow‐up, students scored, on average, 3.28 on this
scale, indicating a moderating change in interesting in these activities.40
Engagement in school STEM activities
Students’ level of engagement in STEM activities was measured by whether students currently
participated in science or engineering clubs at school, fair, and camp, and whether they expressed
interest in participating in science or engineering clubs or doing a project for a science or
engineering fair in the future. The individual items were scored as a 0 or 1, and the composite
indicator, which averaged cross the individual items, had a range of possible values from 0 to 1. On
average, students’ baseline score was 0.5 on this scale, suggesting a moderate level of engagement
in school STEM activities.
Anxiety toward science
A student’s anxiety toward science represents the amount of negative feelings that arise when a
student thinks about science. This was measured using items about how anxious or nervous
respondents feel when they think about science or when someone discusses science with them.
Respondents rated statements on a Likert‐type scale with four response categories ranging from
“strongly disagree” to “strongly agree.” This composite indicator had a range of possible values from
1 to 4, and was the only indicator where higher values were less desirable (i.e., higher values
represented greater anxiety toward science). The average baseline score on this construct was 1.58,
reflecting that applicants generally did not feel anxious about STEM.
Self‐confidence in science
A student’s self‐confidence in science represents his or her academic self‐efficacy in this area (i.e.,
the sense that they can master the material or skills). This was measured using items regarding how
students perceive their own understanding of science, as well as how easily students lose
40 This number is not directly comparable with the other figures in this section, as this indicator was only
measured at follow‐up. All other figures in this chapter correspond to baseline values.
45
National Evaluation of SEMAA Abt Associates Inc.
confidence when they have trouble understanding their science schoolwork. Each item was
measured on a Likert‐type scale with four response categories ranging from “strongly disagree” to
“strongly agree.” This composite indicator had a range of possible values from 1 to 4. On average,
students scored 2.75 at baseline, reflecting somewhat positive self‐efficacy in STEM.
Interest in high school STEM coursework
Students’ interest in high school STEM coursework was measured by their intention to enroll in
STEM‐related courses in high school. Respondents rated their likelihood of taking classes in 13
STEM‐related subjects: earth science, life science, physical science, biology, chemistry, physics,
anatomy and physiology, computer science, algebra, geometry, statistics, calculus and astronomy.
Each item was measured on a Likert‐type scale with four response categories ranging from “I would
definitely not take this in high school” to “I would definitely take this in high school.” This composite
indicator had a range of possible values from 0 to 4. On average, students scored 2.67 at baseline,
reflecting a general inclination toward taking STEM‐related courses in high school.
Interest in college STEM coursework
Students’ interest in college STEM coursework was measured by their intention to enroll in STEM‐
related courses in college. Respondents rated their interest in taking courses in eight STEM‐related
areas while in college: astronomy, biology, chemistry, computer science, engineering, math,
medicine and physics. Each item was rated on a Likert‐type scale with four response categories
ranging from “I would definitely not take this in college” to “I would definitely take this in college.”
This composite indicator had a range of possible values from 0 to 4. On average, students scored
2.84 at baseline, reflecting a general inclination toward taking STEM‐related courses in college,
similar to their intentions for high school.
Interest in STEM careers
Students’ interest in STEM careers was measured by their perceived potential enjoyment of eight
STEM‐related careers: scientist, college professor, engineer, computer scientist, math teacher,
science teacher, doctor or astronaut. Each item was rated on a Likert‐type scale with four response
categories ranging from “I would really not like this job” to “I would really like this job.” This
composite indicator had a range of possible values from 0 to 4, with students scoring 2.4 at baseline,
on average.
Value of science to society
A student’s sense of the value of science to society measures how much global importance a
student associates with science, or the strength of a student’s perceived external motivation to
study science. This indicator was measured using items regarding how respondents view the utility
of science and the importance of learning science in today’s world. Each item was measured on a
Likert‐type scale with four response categories ranging from “strongly disagree” to “strongly agree.”
46
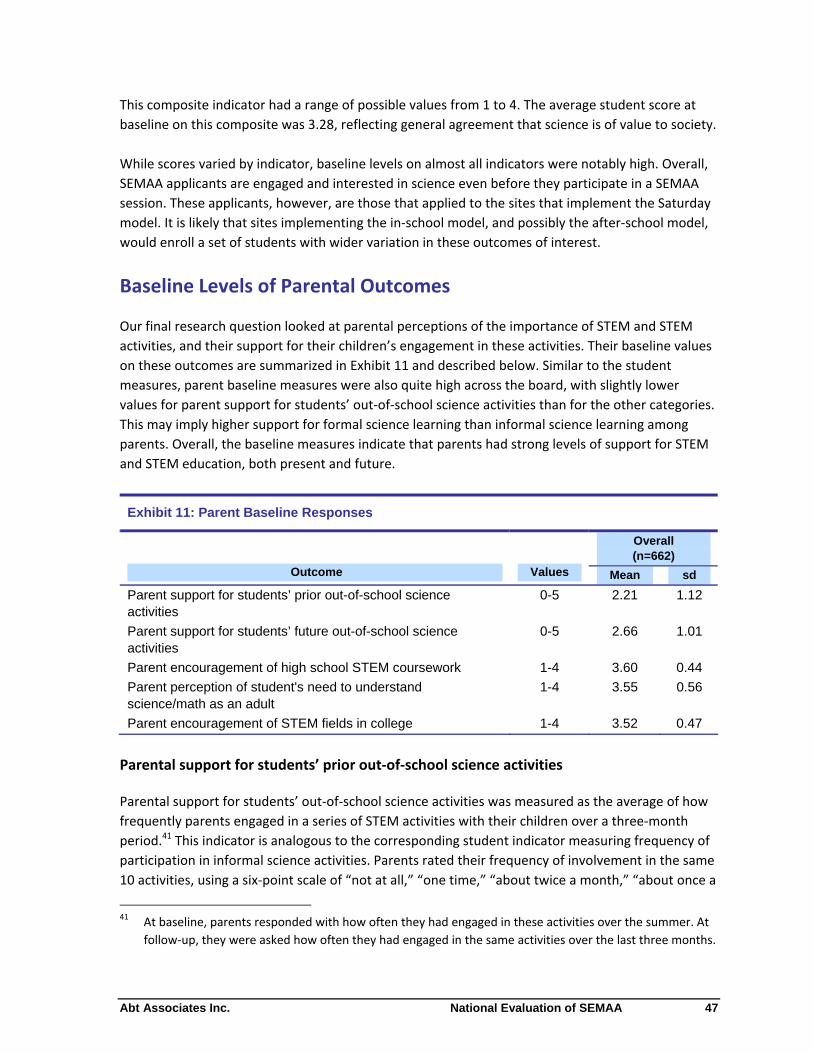
Abt Associates Inc. National Evaluation of SEMAA
This composite indicator had a range of possible values from 1 to 4. The average student score at
baseline on this composite was 3.28, reflecting general agreement that science is of value to society.
While scores varied by indicator, baseline levels on almost all indicators were notably high. Overall,
SEMAA applicants are engaged and interested in science even before they participate in a SEMAA
session. These applicants, however, are those that applied to the sites that implement the Saturday
model. It is likely that sites implementing the in‐school model, and possibly the after‐school model,
would enroll a set of students with wider variation in these outcomes of interest.
Baseline Levels of Parental Outcomes
Our final research question looked at parental perceptions of the importance of STEM and STEM
activities, and their support for their children’s engagement in these activities. Their baseline values
on these outcomes are summarized in Exhibit 11 and described below. Similar to the student
measures, parent baseline measures were also quite high across the board, with slightly lower
values for parent support for students’ out‐of‐school science activities than for the other categories.
This may imply higher support for formal science learning than informal science learning among
parents. Overall, the baseline measures indicate that parents had strong levels of support for STEM
and STEM education, both present and future.
Exhibit 11: Parent Baseline Responses
Overall (n=662)
Outcome Values Mean sd
Parent support for students’ prior out-of-school science activities
0-5 2.21 1.12
Parent support for students’ future out-of-school science activities
0-5 2.66 1.01
Parent encouragement of high school STEM coursework 1-4 3.60 0.44
Parent perception of student's need to understand science/math as an adult
1-4 3.55 0.56
Parent encouragement of STEM fields in college 1-4 3.52 0.47
Parental support for students’ prior out‐of‐school science activities
Parental support for students’ out‐of‐school science activities was measured as the average of how
frequently parents engaged in a series of STEM activities with their children over a three‐month
period.41 This indicator is analogous to the corresponding student indicator measuring frequency of
participation in informal science activities. Parents rated their frequency of involvement in the same
10 activities, using a six‐point scale of “not at all,” “one time,” “about twice a month,” “about once a
41 At baseline, parents responded with how often they had engaged in these activities over the summer. At
follow‐up, they were asked how often they had engaged in the same activities over the last three months.
47
National Evaluation of SEMAA Abt Associates Inc.
week” or “more than once a week.” This composite indicator had a range of possible values from 0
to 5. Across the 10 activities, on average at baseline, parents scored 2.21.
Parental support for student’s future out‐of‐school science activities
Future parental support for students’ out‐of‐school science activities was measured as the average
of how frequently parents plan to engage in these activities with their children over the three‐
month period following the administration of each survey. Parents rated how frequently they plan
to participate in the same 10 activities that they rated for past participation, using the same six‐
point scale used to describe the frequency with which they had previously engaged in these
activities. This composite indicator had a range of possible values from 0 to 5, and parents scored,
on average, 2.66 at baseline, suggesting they planned to engage in STEM activities more frequently
than they had in the past three months.
Parental encouragement of high school STEM coursework
Parental encouragement of high school STEM coursework was measured as the average of how
likely parents would be to encourage their children to take a series of STEM‐related classes in high
school. Respondents rated their likelihood of encouraging their child to take classes in 15 STEM‐
related areas: physics, biology, chemistry, earth science, astronomy, computer science, anatomy
and physiology, advanced physics, advanced biology, advanced chemistry, algebra, geometry,
trigonometry, calculus and statistics. This composite indicator had a range of possible values from 1
to 4, ranging from “would definitely not encourage” to “would definitely encourage.” On average,
parents scored 3.6 on this construct at baseline, suggesting a high level of encouragement for
students to take STEM classes in high school.
Parental perception of student’s need to understand science/math as adult
Parental perception of students’ need to understand science and mathematics as an adult was
measured as an average of four items, asking parents if their children would need to have a good
understanding of basic and advanced science and mathematics as an adult. Parents rated each item
on a Likert‐type scale with four response categories ranging from “strongly disagree” to “strongly
agree.” This composite indicator had a range of possible values from 1 to 4, and parents scored an
average of 3.5 at baseline, suggesting that parents generally perceived a strong need for their
children to understand science and math as adults.
Parental encouragement of STEM fields in college
Parental encouragement of pursuing STEM fields in college was measured by how likely parents
would be to encourage their children to earn a college degree in a variety of fields. Respondents
rated their likelihood of encouraging their child to major in eight STEM‐related areas: physics,
biology, computer science, chemistry, engineering, mathematics, medicine and astronomy.
Respondents rated each item on a Likert‐type scale with four response categories ranging from
“would definitely not encourage” to “would definitely encourage.” This composite indicator had a
48
Abt Associates Inc. National Evaluation of SEMAA
range of possible values from 1 to 4, and parents had an average score of 3.52, reflecting a high level
of encouragement by parents for students to pursue STEM coursework.
Overall, baseline levels on the outcomes that were investigated in the impact study showed an
applicant pool that entered the SEMAA program with high levels of interest in science and parental
support for their interest and engagement in STEM.
49

THIS PAGE INTENTIONALLY BLANK
Abt Associates Inc. National Evaluation of SEMAA
Chapter 5: Outcomes of SEMAA
In this chapter, we present findings that address the research questions about the effect of SEMAA
on the interests and attitudes of students and parents. First, we provide a brief summary of analysis
results. Then, in the sections that follow we present the results from models that test the overall
effect of the program—across both previous participants and new participants—followed by a
presentation of the results of models that tested whether the impacts of SEMAA differed for
students with prior experience in the SEMAA program. Finally, we present results from exploratory
analyses that investigated the relationship between the level of participation in SEMAA classes
during the current session and the outcomes being investigated.
The study found no overall impacts on the measures of students’ interest, attitudes, or participation
in STEM activities, and no significant impacts on parent support or encouragement of STEM
activities. Analysis of the same outcomes measured at baseline indicated that in both treatment and
control groups, students’ interest, attitudes and participation, and parents’ support and
encouragement were high. In both the treatment and control groups, student interest, attitudes,
participation in STEM activities tended to increase from the baseline to follow‐up, but the increase
was not significantly greater for the treatment group.
Although no overall effects of the program were found, SEMAA did have an impact among returning
students on their frequency of participation in informal science activities. This finding is consistent
with the longitudinal structure of SEMAA, which provides new learning experiences for students in
each succeeding grade, and with the program theory that SEMAA has a cumulative effect on
participants. Further, exploratory analyses suggest that students who attend more SEMAA classes
within a session have higher levels on the outcomes of interest at the end of the session. Similarly,
parent attendance in more Family Café sessions in positively related to some outcomes of interest.
Overall SEMAA Impacts
The first series of analyses tested for an overall impact of the SEMAA program on student and
parent outcomes of interest. Notably, the study found no impacts of SEMAA on participants. Exhibit
12 presents the specific findings for each outcome measure. The means and standard deviations of
the outcome measures for the control group are presented, followed by the treatment group mean.
The treatment effect is the estimated effect of SEMAA, in the units of the original scale for each
measure. In comparison both to the overall range of values and the control group means and
standard deviations, the magnitudes of the estimated treatment effects were all practically small,
and statistically indistinguishable from zero.
Not all individuals who were assigned to the treatment group actually attended the SEMAA program
sessions; 19 percent of the individuals in the treatment group attended zero sessions. Therefore, an
exploration of the relationship between outcomes and number of sessions attended is presented
later in this chapter.
51
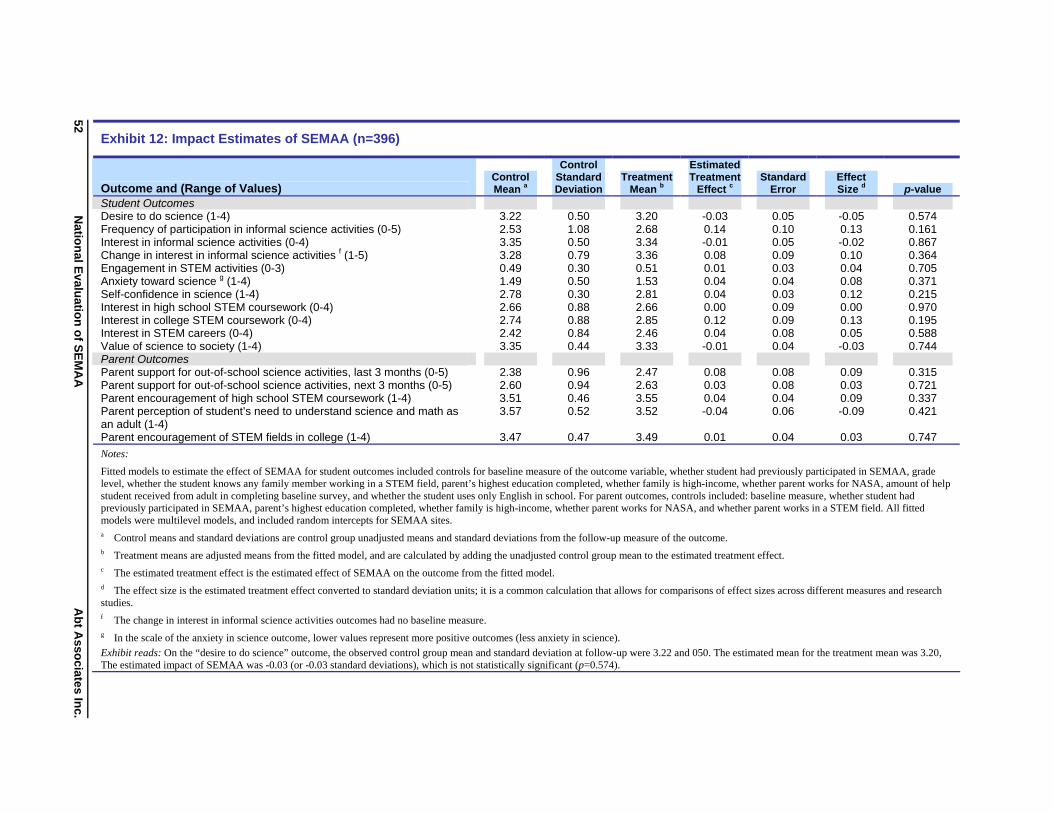
52
Natio
nal E
valuatio
n o
f SE
MA
A
Ab
t Asso
ciates In
c.
Exhibit 12: Impact Estimates of SEMAA (n=396)
Control Standard Deviation
Estimated Treatment
Effect c Control Mean a
Treatment Mean b
Standard Error
Effect Size d Outcome and (Range of Values)
Student Outcomes Desire to do science (1-4)
p-value
3.22 0.50 3.20 -0.03 0.05 -0.05 0.574Frequency of participation in informal science activities (0-5) 2.53 1.08 2.68 0.14 0.10 0.13 0.161Interest in informal science activities (0-4)
fChange in interest in informal science activities (1-5) 3.35 3.28
0.50 0.79
3.34 3.36
-0.01 0.08
0.05 0.09
-0.02 0.8670.10 0.364
Engagement in STEM activities (0-3) 0.49 0.30 0.51 0.01 0.03 0.04 0.705gAnxiety toward science (1-4) 1.49 0.50 1.53 0.04 0.04 0.08 0.371
Self-confidence in science (1-4) 2.78 0.30 2.81 0.04 0.03 0.12 0.215Interest in high school STEM coursework (0-4) 2.66 0.88 2.66 0.00 0.09 0.00 0.970Interest in college STEM coursework (0-4) 2.74 0.88 2.85 0.12 0.09 0.13 0.195Interest in STEM careers (0-4) 2.42 0.84 2.46 0.04 0.08 0.05 0.588Value of science to society (1-4) 3.35 0.44 3.33 -0.01 0.04 -0.03 0.744Parent Outcomes Parent support for out-of-school science activities, last 3 months (0-5) 2.38 0.96 2.47 0.08 0.08 0.09 0.315Parent support for out-of-school science activities, next 3 months (0-5) 2.60 0.94 2.63 0.03 0.08 0.03 0.721 Parent encouragement of high school STEM coursework (1-4) 3.51 0.46 3.55 0.04 0.04 0.09 0.337Parent perception of student’s need to understand science and math as 3.57 0.52 3.52 -0.04 0.06 -0.09 0.421
0.747an adult (1-4) Parent encouragement of STEM fields in college (1-4) 3.47 0.47 3.49 0.01 0.04 0.03
Notes:
Fitted models to estimate the effect of SEMAA for student outcomes included controls for baseline measure of the outcome variable, whether student had previously participated in SEMAA, grade level, whether the student knows any family member working in a STEM field, parent’s highest education completed, whether family is high-income, whether parent works for NASA, amount of help student received from adult in completing baseline survey, and whether the student uses only English in school. For parent outcomes, controls included: baseline measure, whether student had previously participated in SEMAA, parent’s highest education completed, whether family is high-income, whether parent works for NASA, and whether parent works in a STEM field. All fitted models were multilevel models, and included random intercepts for SEMAA sites. a Control means and standard deviations are control group unadjusted means and standard deviations from the follow-up measure of the outcome. b Treatment means are adjusted means from the fitted model, and are calculated by adding the unadjusted control group mean to the estimated treatment effect. c The estimated treatment effect is the estimated effect of SEMAA on the outcome from the fitted model. d The effect size is the estimated treatment effect converted to standard deviation units; it is a common calculation that allows for comparisons of effect sizes across different measures and research studies. f The change in interest in informal science activities outcomes had no baseline measure. g In the scale of the anxiety in science outcome, lower values represent more positive outcomes (less anxiety in science).
Exhibit reads: On the “desire to do science” outcome, the observed control group mean and standard deviation at follow-up were 3.22 and 050. The estimated mean for the treatment mean was 3.20, The estimated impact of SEMAA was -0.03 (or -0.03 standard deviations), which is not statistically significant (p=0.574).
Abt Associates Inc. National Evaluation of SEMAA
As discussed in Chapter Four, both students and parents entered the study with relatively high
interests and attitudes. Since the students and parents interested in and willing to apply to the
program appear to have already been highly motivated, there was limited room for improvement in
these measures. Nonetheless, the measures of student interest and attitudes moved in a positive
direction between baseline and follow‐up for the treatment group students, and there were
statistically significant baseline to follow‐up gains in the measures of frequency in participation of
informal science activities, number of informal science activities, self‐confidence in science, and
value of science to society. However, the control group students also showed baseline to follow‐up
improvements. Thus, there were no significant impacts of treatment because the improvement in
the treatment group was not significantly different from the improvement in the control group.
Therefore, we cannot conclude that the improvements in the treatment group's interest and
attitudes toward STEM are greater than what they would have experienced in the absence of the
program. It is worth noting that in another model of SEMAA that may not necessarily rely on
recruiting highly motivated students, particularly the in‐school model, baseline values for the
outcomes of interest may be lower, allowing greater room for the program to exert an influence.
However, it may be equally likely that SEMAA helps maintain the high levels of interest and
motivation exhibited by participants in the Saturday model.
Impacts for Prior SEMAA Participants and First‐time Participants
An important component of this evaluation was to test the program theory that SEMAA is a
longitudinal program that has a cumulative effect on participants over time. Therefore, an additional
research question for each outcome was whether SEMAA had differential effects for students with
prior experience in SEMAA and those in the program for the first time. Tests for differential impacts
of treatment were conducted for the student and parent outcomes.42 For the measure of frequency
of participation in informal science activities, the effect of SEMAA participation was different among
students with prior SEMAA participation than it was among those without prior SEMAA participation
(p=0.049). Specifically, among students with prior SEMAA participation, there was a significant and
positive effect of SEMAA on the frequency of participation in informal science activities
(estimate=0.31, p=0.019). There was not a significant treatment effect among first time SEMAA
participants. This finding suggests that cumulative exposure to SEMAA over time is more important
in producing change within student behaviors on this outcome than the first‐time experience.
Exploration of Variation in Participation
In this study, students who were randomly assigned to the treatment group had the opportunity to
participate in the Fall 2009 SEMAA session, while those in the control group were not accepted in
the Fall 2009 session. Under the random assignment research design, the estimate of the impact of
SEMAA, presented above, compares the outcomes for students assigned to those two groups.
42 Tests for differential impacts were conducted on 11 outcomes for the student sample, and 5 outcomes for
the parent sample. Using a p<0.05 criterion for statistical significance, 1 in 20 tests would be expected to
be significant by chance.
53
National Evaluation of SEMAA Abt Associates Inc.
However, within the treatment group there were students who did not participate in any SEMAA
classes (“no‐shows”); conversely, there were also students assigned to the control group who did
attend SEMAA (“crossovers”). Since the presence of these groups can reduce the estimated impact
of the program,43 we conducted some exploratory analyses to investigate the relationship between
the level of participation in a SEMAA session and the outcomes of interest. 44
Exhibit 13 displays information on program participation by treatment and control group, and the
number of sessions attended by treatment students; it reveals the presence of both no‐shows and
crossovers in the study. Specifically, nearly one‐fifth of students assigned to the treatment group did
not attend any SEMAA sessions, while over one‐tenth of students assigned to the control group
attended at least one session.
We undertook a series of exploratory analyses to examine participation and program attendance.
First, we looked for possible relationships between program participation and baseline measures of
interests and attitudes, to determine whether students with greater baseline interest or motivation
were more likely to attend more sessions. There were no significant associations between baseline
measures and participation. We also found no relationship between baseline measures and the
number of sessions attended, by the treatment group. Both of these results suggest that, among
students offered the opportunity to attend the SEMAA session, participation and attendance were
not driven by baseline interests and attitudes.
43 For example, the score of treatment students who did not participate in the program might have reduced
the treatment group average on each outcome at follow‐up, or the if the program had a positive effect
among control students who attended the program, the control group average on each outcome at
follow‐up would be inflated. The combination of these factors, then, produces a smaller difference in
outcomes between the treatment and control groups, which is equivalent to a reduction in the estimated
impact of the program.
44 We estimated the effects of the program among those in the treatment group who actually participated
in SEMAA by adjusting the impact estimates, under the plausible assumption that SEMAA had no impact
on the no‐shows. While this adjustment alters the magnitude of the original impact estimate, it does not
change the statistical significance of findings (Bloom, 2005). These adjusted estimates were not
qualitatively different from the original estimates.
54
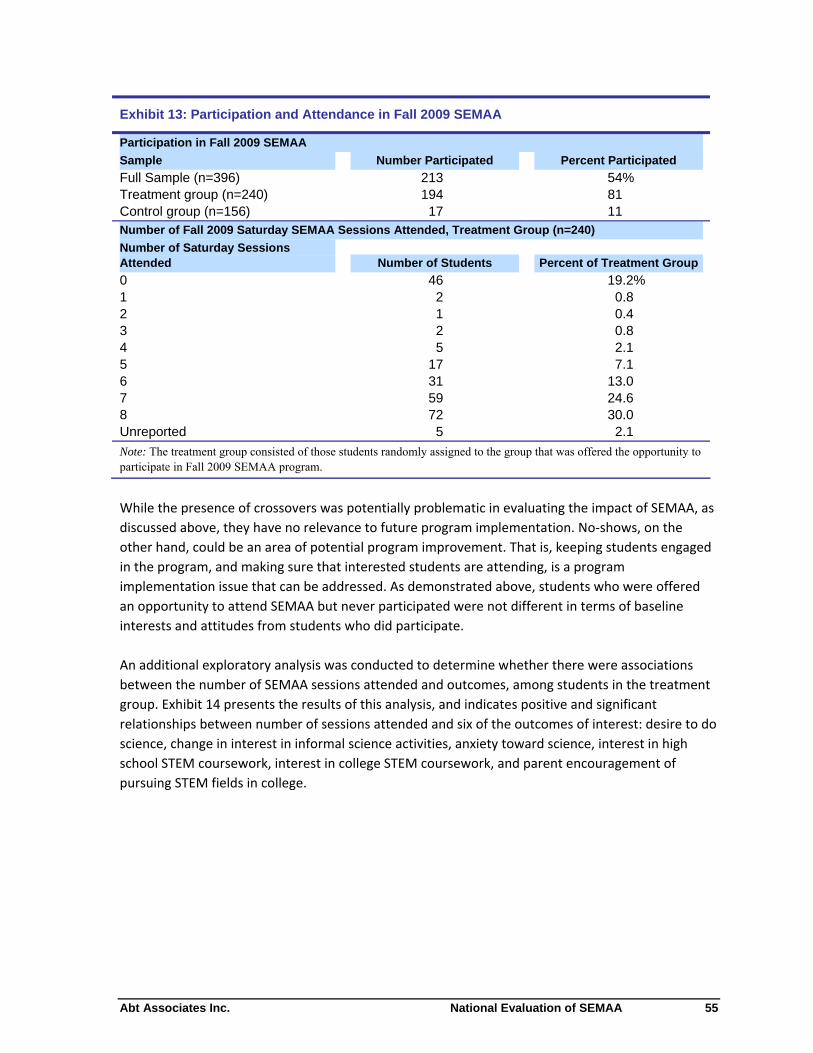
Abt Associates Inc. National Evaluation of SEMAA
Exhibit 13: Participation and Attendance in Fall 2009 SEMAA
Participation in Fall 2009 SEMAA
Sample
Full Sample (n=396) Treatment group (n=240) Control group (n=156)
Number Participated
213 194
17
Percent Participated
54% 81 11
Number of Fall 2009 Saturday SEMAA Sessions Attended, Treatment Group (n=240)
Number of Saturday Sessions Attended
012345678Unreported
Number of Students Percent of Treatment Group
46 19.2%2 0.81 0.42 0.85 2.1
17 7.131 13.059 24.672 30.0
2.15
Note: The treatment group consisted of those students randomly assigned to the group that was offered the opportunity to participate in Fall 2009 SEMAA program.
While the presence of crossovers was potentially problematic in evaluating the impact of SEMAA, as
discussed above, they have no relevance to future program implementation. No‐shows, on the
other hand, could be an area of potential program improvement. That is, keeping students engaged
in the program, and making sure that interested students are attending, is a program
implementation issue that can be addressed. As demonstrated above, students who were offered
an opportunity to attend SEMAA but never participated were not different in terms of baseline
interests and attitudes from students who did participate.
An additional exploratory analysis was conducted to determine whether there were associations
between the number of SEMAA sessions attended and outcomes, among students in the treatment
group. Exhibit 14 presents the results of this analysis, and indicates positive and significant
relationships between number of sessions attended and six of the outcomes of interest: desire to do
science, change in interest in informal science activities, anxiety toward science, interest in high
school STEM coursework, interest in college STEM coursework, and parent encouragement of
pursuing STEM fields in college.
55
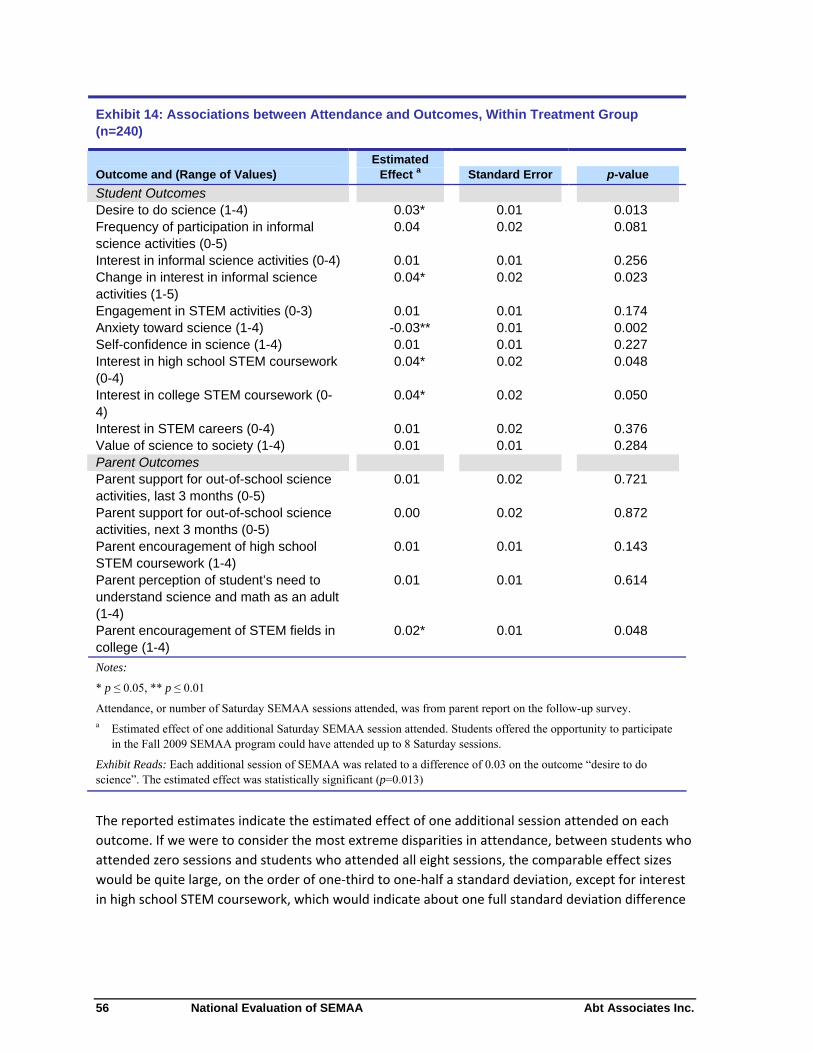
National Evaluation of SEMAA Abt Associates Inc.
Exhibit 14: Associations between Attendance and Outcomes, Within Treatment Group (n=240)
Estimated Effect a p-value Outcome and (Range of Values) Standard Error
Student Outcomes Desire to do science (1-4) Frequency of participation in informal science activities (0-5) Interest in informal science activities (0-4) Change in interest in informal science activities (1-5) Engagement in STEM activities (0-3) Anxiety toward science (1-4) Self-confidence in science (1-4) Interest in high school STEM coursework (0-4) Interest in college STEM coursework (0-4) Interest in STEM careers (0-4) Value of science to society (1-4) Parent Outcomes Parent support for out-of-school science activities, last 3 months (0-5) Parent support for out-of-school science activities, next 3 months (0-5) Parent encouragement of high school STEM coursework (1-4) Parent perception of student’s need to understand science and math as an adult (1-4) Parent encouragement of STEM fields in college (1-4)
0.03* 0.04
0.01 0.04*
0.01 -0.03** 0.01 0.04*
0.04*
0.01 0.01
0.01
0.00
0.01
0.01
0.02*
0.01 0.02
0.01 0.02
0.01 0.01 0.01 0.02
0.02
0.02 0.01
0.02
0.02
0.01
0.01
0.01
0.013 0.081
0.256 0.023
0.174 0.002 0.227 0.048
0.050
0.376 0.284
0.721
0.872
0.143
0.614
0.048
Notes:
* p ≤ 0.05, ** p ≤ 0.01
Attendance, or number of Saturday SEMAA sessions attended, was from parent report on the follow-up survey. a Estimated effect of one additional Saturday SEMAA session attended. Students offered the opportunity to participate
in the Fall 2009 SEMAA program could have attended up to 8 Saturday sessions.
Exhibit Reads: Each additional session of SEMAA was related to a difference of 0.03 on the outcome “desire to do science”. The estimated effect was statistically significant (p=0.013)
The reported estimates indicate the estimated effect of one additional session attended on each
outcome. If we were to consider the most extreme disparities in attendance, between students who
attended zero sessions and students who attended all eight sessions, the comparable effect sizes
would be quite large, on the order of one‐third to one‐half a standard deviation, except for interest
in high school STEM coursework, which would indicate about one full standard deviation difference
56
Abt Associates Inc. National Evaluation of SEMAA
in the outcome at follow‐up,45 even after controlling for the baseline measures of outcomes,
demographic characteristics, and prior SEMAA participation.
A final exploratory analysis was conducted to investigate whether there was a relationship between
the number of Family Café sessions attended by parents and any of the parent or student outcomes
among the treatment group. In the treatment group, 65 percent of parents reported attending at
least one Family Cafe session; the mean number attended was near three. Exhibit 15 presents the
results of the analysis that investigated the relationship between number of Family Cafe sessions
attended and the outcomes investigated. The number of Family Café sessions attended by the
parent was positively related to parent participation in informal science activities with their child.
Among student outcomes, parent attendance was positively related to desire to do science, change
in interest in informal science activities, lower anxiety toward science, and interest in collegiate
STEM majors/coursework.46
These results indicate several positive associations between the number of sessions attended and
outcomes at follow‐up levels of interest and attitudes regarding STEM. There were also positive
relationships between the number of Family Café sessions attended and outcomes at follow‐up.
Although the results of these exploratory analyses cannot be interpreted as program impacts, they
suggest potentially important factors to consider in ongoing implementation and planning for future
program implementation.
45 Except for interest in high school STEM coursework, in which there was about a full standard deviation
difference in the outcome.
46 When both student and parent participation were tested as predictors simultaneously, the number of
Family Café sessions attended by the parent was positively related to student desire to do science and
parent participation in informal science activities with their child over the last three months. The number
of Saturday SEMAA sessions attended by the student was positively associated with lower anxiety toward
science.
57
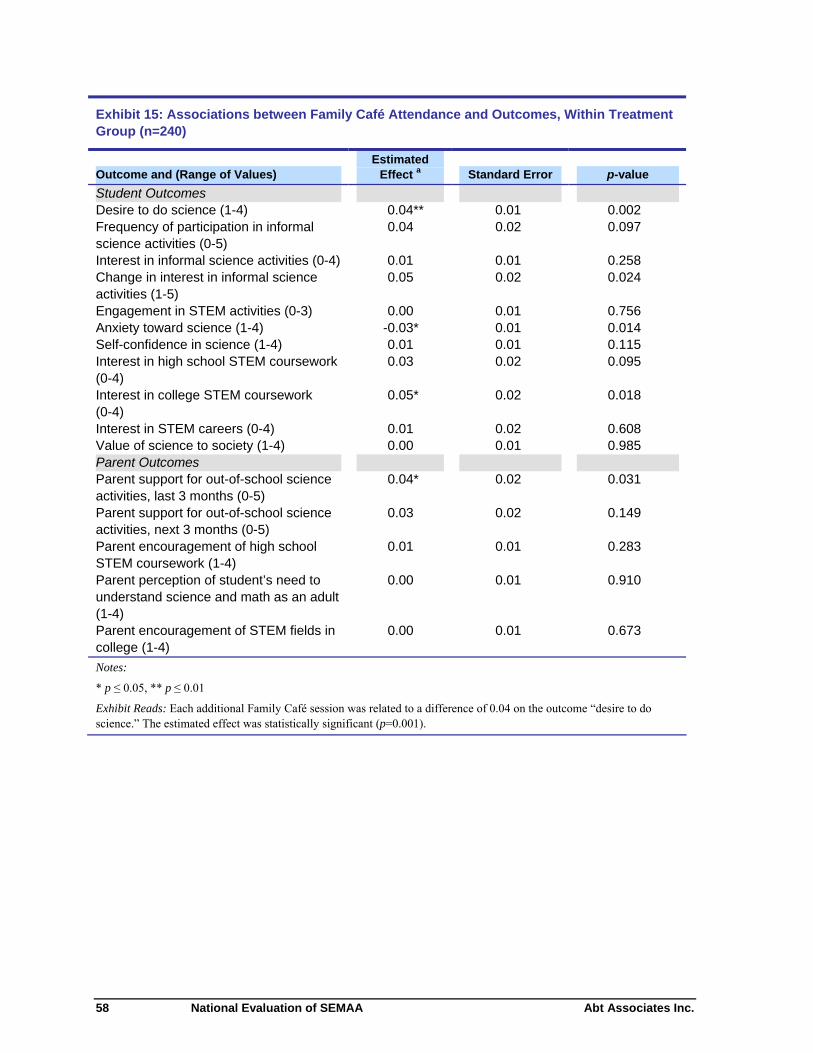
National Evaluation of SEMAA Abt Associates Inc.
Exhibit 15: Associations between Family Café Attendance and Outcomes, Within Treatment Group (n=240)
Outcome and (Range of Values) Estimated
Effect a Standard Error p-value
Student Outcomes Desire to do science (1-4) Frequency of participation in informal science activities (0-5) Interest in informal science activities (0-4) Change in interest in informal science activities (1-5) Engagement in STEM activities (0-3) Anxiety toward science (1-4) Self-confidence in science (1-4) Interest in high school STEM coursework (0-4) Interest in college STEM coursework (0-4) Interest in STEM careers (0-4) Value of science to society (1-4) Parent Outcomes Parent support for out-of-school science activities, last 3 months (0-5) Parent support for out-of-school science activities, next 3 months (0-5) Parent encouragement of high school STEM coursework (1-4) Parent perception of student’s need to understand science and math as an adult (1-4) Parent encouragement of STEM fields in college (1-4)
0.04** 0.04
0.01 0.05
0.00 -0.03* 0.01 0.03
0.05*
0.01 0.00
0.04*
0.03
0.01
0.00
0.00
0.01 0.02
0.01 0.02
0.01 0.01 0.01 0.02
0.02
0.02 0.01
0.02
0.02
0.01
0.01
0.01
0.002 0.097
0.258 0.024
0.756 0.014 0.115 0.095
0.018
0.608 0.985
0.031
0.149
0.283
0.910
0.673
Notes:
* p ≤ 0.05, ** p ≤ 0.01
Exhibit Reads: Each additional Family Café session was related to a difference of 0.04 on the outcome “desire to do science.” The estimated effect was statistically significant (p=0.001).
58
Abt Associates Inc. National Evaluation of SEMAA
Chapter 6: Conclusions and Implications
In this study, we examined the implementation of SEMAA across sites and investigated the
relationship between outcomes of interest (such as desire to study science and pursue a career in
STEM) and participation in the SEMAA Saturday program. As outlined in the logic model that depicts
SEMAA’s theory of change (see Exhibit 4), we focused on short‐term outcomes that could be
measured in the time available for evaluation activities. The implementation component provided
insights into the evolution of SEMAA over time, highlighted important barriers to
institutionalization, and yielded recommendations for future directions. The impact component
used a rigorous methodology to investigate the impact of program participation on 10 student and 5
parent short‐term outcomes of interest.
Summarized in detail below, results of the impact analysis are mixed, providing limited support for
the efficacy of the SEMAA program. The study found no overall impacts of the eight‐week SEMAA
Saturday program, but yielded two important findings: (1) increased participation in informal
science activities among repeat participants, and (2) a positive relationship between student
attendance and several outcomes of interest.
Given these mixed results, a natural question is why the study did not detect stronger effects. A
likely explanation involves the self‐selected nature of the population that is attracted to the
Saturday program—namely, students from families sufficiently interested in STEM to seek out or
respond to recruitment efforts for this STEM enrichment opportunity, and to do so repeatedly.
(Recall that about 40 percent of the students in our sample were repeat participants that by virtue
of their reenrollment demonstrate high interest.) This is confirmed by the high share of SEMAA
parents in the STEM workforce (33 percent). Not surprisingly, upon enrollment, these families
already display high average levels on several outcomes (see Exhibits 10 and 11), making it difficult
to detect increases in these areas. In these cases the program may hope to maintain this high level
of interest over the long term.
This evaluation has allowed us to see the (often high) estimated measures at the time of enrollment.
We were also able to confirm strong recurring participation in SEMAA, and reveal the important role
that an in‐school model may play in SEMAA’s future. As such, we urge the program to consider, as
recommended below, tracking participants and nonparticipants across models (not just Saturday
programs) to observe students’ educational trajectories and measure their long‐term educational
outcomes.
Conclusions
1. Results did not reveal overall impacts of the SEMAA program on short‐term outcomes, but
among prior participants, SEMAA led to increased participation in informal science activities. The
study found high levels of interest and engagement at baseline, and no overall effect of the Saturday
SEMAA model on short‐term outcomes. However, the program did find an impact on participation in
59
National Evaluation of SEMAA Abt Associates Inc.
informal science activities among individuals who had previously enrolled in the program. This
impact of SEMAA on prior participants aligns with SEMAA’s longitudinal approach to engage
students by offering STEM opportunities across multiple grades. It also signals increased student
engagement in science, which the SEMAA model links to increased future participation in STEM
education.
2. Student and parent attendance had a positive relationship with several outcomes of interest.
Exploratory analyses indicate that the number of Saturday classes students attended within a
session was related to a greater (a) desire to engage in science‐related activities, (b) interest in high
school STEM courses, (c) interest in college STEM coursework among students, and (d) parental
encouragement for students to pursue a STEM field in college; to a perception that (e) their interest
in informal science activities had increased; and finally to (f) lessened anxiety toward science. These
findings suggest that increased exposure to the SEMAA program may be associated with short‐term
outcomes that are important precursors to subsequent enrollment in a STEM baccalaureate
program. In addition, parent participation in Family Café session was positively related to (a) parent
participation in informal science activities with their child, (b) child’s desire to do science, (c) a
change in their child’s interest in informal science activities, (d) child’s lower anxiety toward science,
and (e) their child’s interest in collegiate STEM majors/coursework.
3. Sites report achieving continued student participation over time. Sites implementing out‐of‐
school models report that more than half of participants continue in SEMAA from one year to the
next.47 In sites implementing the in‐school model, participation is mandatory for all enrolled
students and attrition is driven by school mobility. This pattern of reenrollment (out‐of‐school) or
continued exposure (in‐school) is (a) consistent with SEMAA’s program theory that students should
be engaged repeatedly to maintain and further develop an interest in and engagement with science,
and (b) linked to the SEMAA and NASA Office of Education goal of attracting and retaining students.
4. In the short term, three models of implementation coexist; the Saturday model is the most
prevalent, but the in‐school model is being used or considered to sustain projects in the long term.
The SEMAA project is characterized by three models of implementation—two conducted out of
school hours (Saturday model and after‐school model) and one during school hours (in‐school
model). NASA encourages the Saturday model, but site selection of an implementation model
responds to the needs of the particular site. Sites in rural locations favor the Saturday or in‐school
over the after‐school model. Those in urban settings with greater student demand, though generally
starting out as Saturday programs, mentioned shifting to the in‐school program to serve more
students at a lower cost.
At some sites, the in‐school model—which does not need to cover teacher salaries and therefore
requires less funding than the out‐of‐school programs—is seen by site directors as a viable solution
47 This estimate is higher than the repeat participation observed among sampled students in part because
programs were asked to stop recruiting students six weeks prior to the beginning of the session in order
to randomly assign applicants into treatment and control groups for the study.
60
Abt Associates Inc. National Evaluation of SEMAA
to the need to raise funds to sustain the project after NASA funding ends or to expand the project in
response to increased demand, as evidenced by projects that cited overcoming funding constraints
by transitioning to in‐school. One potential drawback of in‐school programs is that, over time, the
content or science/NASA focus might be neglected or deemphasized as priority is given to NCLB‐
tested subjects and topics. But these programs—assuming checks are in place to ensure the
integrity of content and pedagogy—may reach greater numbers of students and facilitate the
institutionalization of the SEMAA program.
5. Site directors have not assumed responsibility for fundraising. In discussing fundraising, site
directors offered words of resistance. Most of them are either inexperienced with fundraising or
unable to carry out this task given multiple other responsibilities that compete for their time. Site
directors have developed partnerships and collaborations, but none have raised sufficient funds to
sustain the project as an out‐of‐school program.
6. Limited student monitoring makes investigating long‐term outcomes difficult. SEMAA’s program
theory posits that participation will have effects that extend well beyond the short‐term outcomes
investigated in this study. Some of these long‐term outcomes are increased enrollment in high
school mathematics and science courses, participation in post‐secondary STEM programs of studies,
and employment in STEM. But programs currently do not collect the data necessary to assess the
educational and career trajectories of participants.
Recommendations
1. Continue the existing emphasis on repeat participation. SEMAA’s longitudinal approach to
engaging students aligns with NASA’s education framework, which is modeled as continued and
increasing involvement with STEM. Although the in‐school model has attendance within a session
and repeat participation from year to year built into it by virtue of the model itself, in the out‐of‐
school models attendance and continued participation is not mandatory. Given the effect of SEMAA
on individuals who have previously participated in the program, ongoing project efforts to foster
repeat participation should be encouraged.
2. Encourage strategic planning. The in‐school model, though perceived by project directors as a
viable alternative, lacks some positive attributes that are characteristic of the Saturday and after‐
school models—namely, these are “special” programs with a clear science focus that form a
community of learners by engaging the students and their families. Project sites should be
encouraged to contemplate the alternatives and engage in strategic planning early on, so the
transition to an in‐school model, if carried out, is the result of a conscious and careful plan and not a
last‐minute response to lack of funding as was the case in some sites. That careful plan should
include periodic checks of adherence to the SEMAA content and pedagogy. Further, if the Saturday
model fits the needs of the population being served at a site, early strategic planning may allow the
Saturday model to be a sustainable option.
61
National Evaluation of SEMAA Abt Associates Inc.
3. Monitor the various models to understand prospects for sustainability and to prevent crowding
out of science content. The SEMAA project may be able to help sites transition beyond NASA
funding by gathering and sharing information about the challenges that have been faced and efforts
that have succeeded across the current and former sites. In addition, the SEMAA project should
ensure that in‐school model sites adhere to the programmatic requirements in terms of content,
methods and time coverage, especially given NCLB‐driven pressure to focus on mathematics and
reading.
4. Support continued grantee training on fundraising and partnerships. On average, sites have
raised significant support for their projects, but these efforts have not been sufficient for projects to
become independent of NASA funding. Consequently, sites need (a) assistance in developing a
sustainability plan based on existing capacity and mindful of local needs and constraints, and (b)
continued training and encouragement to develop fundraising skills, as most grantees are not
experienced in fundraising.
5. Encourage student monitoring data collection. The immediate goal of SEMAA is to inspire,
engage and educate K–12 students. The ultimate goal of this effort is to encourage students to
pursue STEM fields of study in college, thereby increasing the number of students who enroll in
STEM majors in college. Consequently, programs should be encouraged to collect information on
participating students to measure program exposure and to facilitate future tracking. Perhaps the
new NASA Office of Education Performance Measurement System (OEPM) could be used for
projects to submit individual participant data that could be retrieved at a later time to follow up on
past participants to determine whether they enrolled in college and in which field. If possible, data
on nonparticipants at the same schools should also be collected to facilitate comparisons and
establish, through a quasi‐experimental design, the success of the program.
Future Directions for SEMAA
There are two possible directions the SEMAA program could take; for simplicity, we call these NASA‐
dependent and NASA‐independent. The NASA‐ dependent path would require that NASA continue
to renew funding over time. Indeed, many sites have received funding beyond the initial award
period. Renewed funding would have the advantage of guaranteeing project continuity, assuming
adequate student demand, but would have the disadvantage of preventing the expansion of the
program to new sites, unless the program budget were to grow. As it stands, the program reaches
less than 21,000 (direct participants) of the more than 18 million minority or close to 20 million
economically disadvantaged students enrolled in K–12 public schools throughout the nation.48
The other alternative is for sites to fundraise to support continuation of the project after NASA
funding has ended. Becoming NASA‐independent reflects current program expectations. The
evidence uncovered in this study suggests that sites have been unable to raise the funds necessary
48 Figures correspond to the 2007–2008 school year. Poverty is measured as qualifying for free or reduced
lunch (NCES, 2009b).
62
Abt Associates Inc. National Evaluation of SEMAA
to outlive NASA funding as an out‐of‐school program. In fact, in order to continue offering services
post‐NASA funding, some sites have chosen (or are planning) to transition to an in‐school program,
which is much less expensive than an out‐of‐school program (whether Saturday or after‐school) and
avoids transportation barriers. We learned from sites that the national SEMAA office, through
contractor Paragon TEC, was planning to offer training on fundraising. The national SEMAA office
subsequently confirmed that such training has been offered to sites. Welcomed by site directors,
this training may be just what is needed to assist grantees in continuing the program post‐NASA
funding. It will be important to monitor site progress in fundraising post‐training to assess its
effectiveness.
63

THIS PAGE INTENTIONALLY BLANK
Abt Associates Inc. National Evaluation of SEMAA
References
Bandura, A. (1993). Perceived self‐efficacy in cognitive development and functioning. Educational
Psychologist, 28, 117‐148.
Bandura, A., Barbaranelli, C., Caprara, G.V., & Pastorelli, C. (2001). Self‐efficacy beliefs as shapers of
children’s aspirations and career trajectories. Child Development, 72, 187‐206.
Barnett, M., Lord, C., Strauss, E., Rosca, C., Langford, H., Chavez, D., & Deni, L. (2006). Using the
urban environment to engage youths in urban ecology field studies. The Journal of Environmental
Education, 37, 3‐11.
Betz, N.E., & Hackett, G. (1983). The relationship of mathematics self‐efficacy expectations to the
selection of science‐based college majors. Journal of Vocational Behavior, 23, 329‐345.
Bleeker, M.M., & Jacobs, J.E. (2004). Achievement in math and science: Do mothers’ beliefs matter
12 years later? Journal of Educational Psychology, 96, 97‐109.
Bloom, H. S. (ed.) (2005). Learning more from social experiments: Evolving analytic approaches.
New York: Russell Sage Foundation.
Bondurant, L., Davis, H., Davey, B., & Davis, R.M. (2008). SEMAA project evaluation analysis.
Unpublished manuscript. Cleveland, OH: Paragon TEC.
Eccles, J.S. (2005) Influence of parents’ education on their children’s educational attainment: The
role of parent and children’s perceptions. London Review of Education, 3, 191‐204.
Fadigan, K.A., & Hammrich, P.L. (2004). A longitudinal study of the educational and career
trajectories of female participants of an urban informal science education program. Journal of
Research in science Teaching, 1, 835‐860.
Farenga, S.J., & Joyce, B.A. (1998). Science‐related attitudes and science course selection: A study
of high‐ability boys and girls. Roeper Review, 20, 247
Federman, M. (2007). State graduation requirements, high school course taking, and choosing a
technical college major. Berkeley Electronic Journal of Economic Analysis and Policy, 7, 1‐32.
Fraser, B.L. (1981). Test of science‐related attitudes. Victoria, Australia: Australian Council for Educational Research.
Gibson, H., & Chase, C. (2002). Longitudinal impact of an inquiry‐based science program on middle
school students' attitudes toward science. Science Education, 86(5), 693.
Hart, B., & Risley, T.R. (1995). Meaningful differences in the everyday experiences of young American
children. Baltimore, MD: Paul H. Brooks.
65
National Evaluation of SEMAA Abt Associates Inc.
Hulett, L., Williams, T., Twitty, L., Turner, R., Salamo, G., & Hobson, A. (2004). Inquiry‐based
classrooms and middle school student perceptions about science and math. Paper presented at the
2004 Annual Meeting of the American Educational Research Association, San Diego, CA. April 15,
2004.
Jacobs, J.E., & Bleeker, M.M. (2004). Girls’ and boys’ developing interests in math and science: Do
parents matter? New Directions for Child and Adolescent Development, 106, 5–21.
Kane, T. (2004). The impact of after‐school programs: Interpreting the results of four recent
evaluations. Working Paper. New York: William T. Grant Foundation.
Lauer, P.A., Akiba, M., Wilkerson, S.B., Apthorp, H.S., Snow, D., & Martin‐Glenn, M. (2004). The
effectiveness of out‐of‐school‐time strategies in assisting low‐achieving students in reading and
mathematics: A research synthesis. (Updated ed.). Aurora, CO: Mid‐continent Research for
Education and Learning.
Lent, R.W., Brown, S.D., & Larkin, K.C. (1986). Self‐efficacy in the prediction of academic
performance and perceived career options. Journal of Counseling Psychology, 33, 265–269.
Levine, P.B., & Zimmerman, D.J. (in press). After school programs. In P.B. Levine & D.J. Zimmerman
(Eds.), Targeting investments in children: Fighting poverty when resources are limited. Chicago:
University of Chicago Press. Downloaded February 7, 2010 from
http://www.nber.org/chapters/c11725.
Markowitz, D.G. (2004). Evaluation of the long‐term impact of a university high school summer
science program on students’ interest and perceived abilities in science. Journal of Science
Education and Technology, 13, 395‐ 407.
Mau, W.C. (2003). Factors that influence persistence in science and engineering career aspiration.
Career Development Quarterly, 51, 234‐243.
National Aeronautics and Space Agency. (2007a). NASA Education Strategic Coordination
Framework: A portfolio approach (NP‐2007‐01‐456‐HQ). Washington, DC: Author.
National Aeronautics and Space Agency. (2007b). NASA SEMAA 2007 Annual Report. Cleveland, OH:
Paragon TEC.
National Center for Education Statistics. (1997). Reading and mathematics achievement growth in
high school (Issue Brief 98‐038). Washington: U.S. Department of Education.
National Center for Education Statistics. (2007). Advanced mathematics and science course taking in
the spring high school senior classes of 1982, 1992, and 2004 (NCES #2007‐312). Downloaded
February 8, 2010 from http://nces.ed.gov/pubs2007/2007312.pdf.
66
Abt Associates Inc. National Evaluation of SEMAA
National Center for Education Statistics. (2009a). Students who study science, technology,
engineering, and mathematics (STEM) in postsecondary education (NCES #2009‐161). Downloaded
February 8, 2010 from http://nces.ed.gov/pubs2009/2009161.pdf.
National Center for Education Statistics. (2009b). Schools and Staffing Survey (SASS), public school,
BIE School, and private school data files, 2007–2008 (NCES 2009‐321).
National Research Council. (2008). NASA's Elementary and Secondary Education Program: Review
and critique. Washington, DC: National Academies Press.
National Science and Technology Council. (2008). Finding out what works: Agency efforts to
strengthen the evaluation of federal science, technology, engineering and mathematics (STEM)
education programs. A Report of the National Science and Technology Council Subcommittee on
Education. Downloaded February 6, 2009 from
http://www.ostp.gov/galleries/NSTC%20Reports/NSTC_Education_Report_Complete.pdf.
Oakes, J. (1990). Opportunities, achievement, and choice: Women and minority students in science
and mathematics. Review of Research in Education, 16, 153‐339.
Rose, H., & Betts, J.R. (2004). The effect of high school courses on earnings. The Review of
Economics and Statistics, 86(2), 497‐513.
Sadler, P.M., & Tai, R.H. (2007). The two high‐school pillars supporting college science. Science,
317, 457‐458.
Schiefele, U., Krapp, A., & Winteler, A. (1992). Interest as a predictor of academic achievement: A
meta‐analysis of research. In K.A. Renninger, S. Hidi, and A. Krapp (Eds.), The role of interest in
learning and development (pp. 183‐212). Mahwah, NJ: Erlbaum.
Sells, L.W. (1980). Mathematics: The invisible filter. Engineering Education, 70, 340‐341.
Shernoff, D.J., & Hoogstra, L. (2001). Continuing motivation beyond the high school classroom. New
Directions for Child and Adolescent Development, 93, 73‐87.
Simpkins, S.D., Davis‐Kean, P.E., & Eccles, J.S. (2006). Math and science motivation: A longitudinal
examination of the links between choices and beliefs. Developmental Psychology, 42, 70‐83.
Stakes, J.E., & Mares, K.E. (2005). Evaluating the impact of science enrichment programs on
adolescents’ science motivation and confidence: The splashdown effect. Journal of Research in
Science Teaching, 42, 359‐375.
U.S. Department of Education. (2007). Report of the Academic Competitiveness Council. Washington,
DC.
67

National Evaluation of SEMAA Abt Associates Inc.
Watt, H.M.G., Eccles, J.S., & Durik, A.M. (2006). The leaky mathematics pipeline for girls: A
motivational analysis of high school enrollments in Australia and the USA. Equal Opportunities
International, 25, 642‐659.
Weinburgh, M.H., & Steele, D. (2000). The modified attitude toward science inventory: Developing
an instrument to be used with fifth grade urban students. Journal of Women and Minorities in
Science and Engineering, 6, 87‐94.
68
Abt Associates Inc. National Evaluation of SEMAA
Appendix A: Methodological Details
Implementation Study
Document reviews were conducted of standard operating procedures (SOPs) that provide
programmatic details of each site, quarterly performance reports, and project websites. This review
became the basis of summaries of key information across sites and guided the development of the
interview protocol. Interviews were conducted with all open sites (14) and with 6 of the 11 closed
sites.
In preparation for the interviews, senior staff conducted a telephone interview training session for
junior members of the evaluation team. Subsequently, evaluation team members reviewed the
project files and project websites to generate a project overview sheet outlining key statistics and a
description of project components and activities. Interviews with active sites on average lasted
about an hour, while those with closed sites generally lasted about 20 minutes. With permission of
the interviewee, interviews were tape recorded and later transcribed verbatim. A Microsoft Access
database was created so that interview data could be entered, stored, and retrieved for data
analysis.
Note that, to circumvent influential outliers, in some instances we opted to focus on the median
rather than the mean in reporting group average tendencies. Given the small sample sizes (N=14
active and 6 closed sites), outliers in both directions may skew group averages significantly. For
example, we report estimates of individuals served through AEL outreach activities. The range
reported by the active sites is from 0 to 5,500, with a mean of 1,165 but a median of 775. In this
instance the maximum value pulls the average estimate upward. Consequently, the median, which
provides the midpoint in the distribution, provides a more stable and informative estimate.
We also note that, for statistics reported for active sites, we technically count with a complete
census and, therefore, accurate information. But some uncertainty or “noise” in the data is
introduced by the means of data collection—namely, telephone interviews that require respondents
to recall facts from memory and encourage rough estimation if exact numbers are unavailable. In a
few instances where respondents could not recall some facts or statistics, we relied on the quarterly
reports submitted to NASA.
A-1
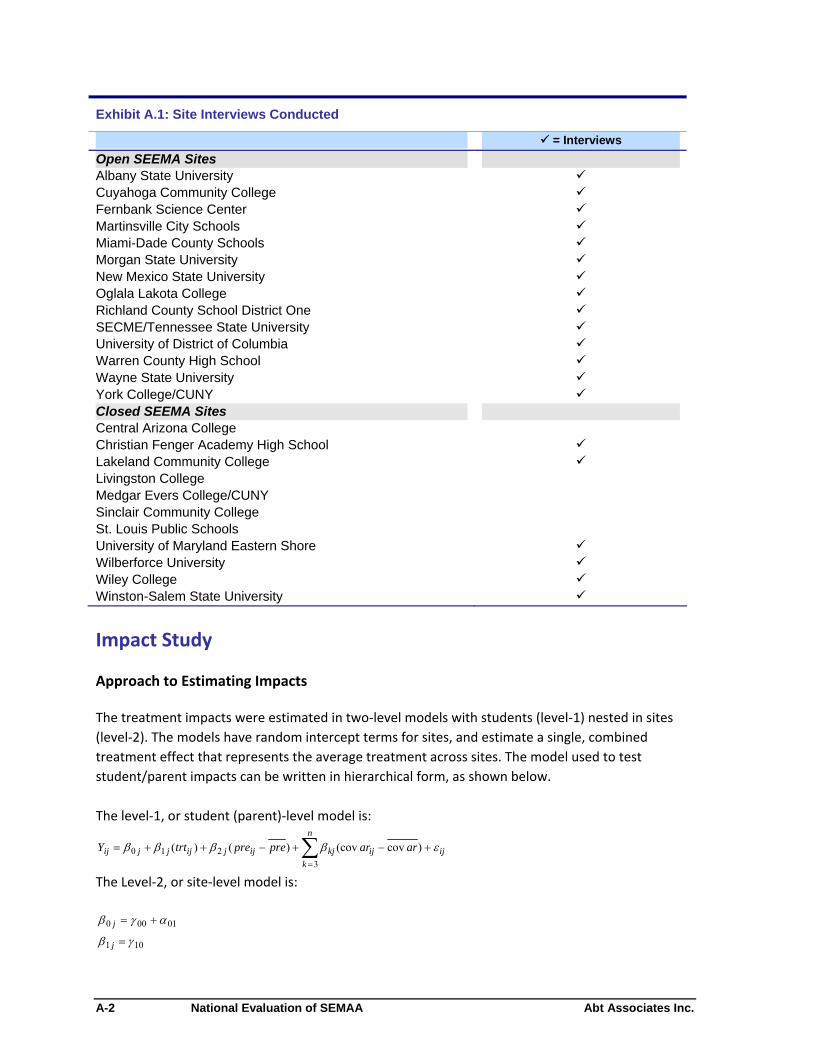
National Evaluation of SEMAA Abt Associates Inc.
Exhibit A.1: Site Interviews Conducted
= Interviews
Open SEEMA Sites Albany State University Cuyahoga Community College Fernbank Science Center Martinsville City Schools Miami-Dade County Schools Morgan State University New Mexico State University Oglala Lakota College Richland County School District One SECME/Tennessee State University University of District of Columbia Warren County High School Wayne State University York College/CUNY Closed SEEMA Sites Central Arizona College Christian Fenger Academy High School Lakeland Community College Livingston College Medgar Evers College/CUNY Sinclair Community College St. Louis Public Schools
University of Maryland Eastern Shore Wilberforce University Wiley College Winston-Salem State University
Impact Study
Approach to Estimating Impacts
The treatment impacts were estimated in two‐level models with students (level‐1) nested in sites
(level‐2). The models have random intercept terms for sites, and estimate a single, combined
treatment effect that represents the average treatment across sites. The model used to test
student/parent impacts can be written in hierarchical form, as shown below.
The level‐1, or student (parent)‐level model is: n
Yij 0 j 1 j (trtij ) 2 j ( preij pre) kj (cov arij cov ar) ij k 3
The Level‐2, or site‐level model is:
0 j 00 01
1 j 10
A-2
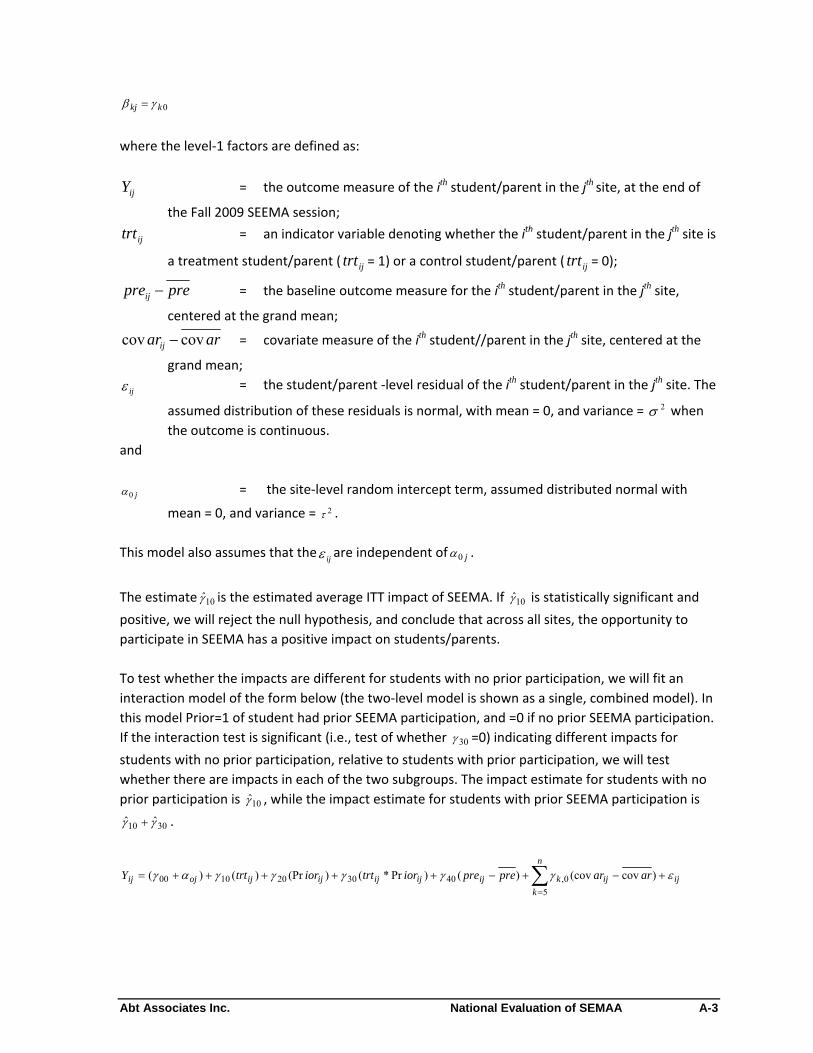
Abt Associates Inc. National Evaluation of SEMAA
kj k0
where the level‐1 factors are defined as:
Y th th ij = the outcome measure of the i student/parent in the j site, at the end of
the Fall 2009 SEEMA session;
trtij = an indicator variable denoting whether the ith student/parent in the jth site is
a treatment student/parent ( trtij = 1) or a control student/parent ( trtij = 0);
preij pre = the baseline outcome measure for the ith student/parent in the jth site,
centered at the grand mean;
cov arij cov ar = covariate measure of the ith student//parent in the jth site, centered at the
grand mean;
= the student/parent ‐level residual of the ith student/parent in the jth site. The ij
assumed distribution of these residuals is normal, with mean = 0, and variance = 2 when
the outcome is continuous.
and
0 j = the site‐level random intercept term, assumed distributed normal with
mean = 0, and variance = 2 .
This model also assumes that the are independent ofij 0 j .
The estimate 10 is the estimated average ITT impact of SEEMA. If 10 is statistically significant and
positive, we will reject the null hypothesis, and conclude that across all sites, the opportunity to
participate in SEEMA has a positive impact on students/parents.
To test whether the impacts are different for students with no prior participation, we will fit an
interaction model of the form below (the two‐level model is shown as a single, combined model). In
this model Prior=1 of student had prior SEEMA participation, and =0 if no prior SEEMA participation.
If the interaction test is significant (i.e., test of whether 30 =0) indicating different impacts for
students with no prior participation, relative to students with prior participation, we will test
whether there are impacts in each of the two subgroups. The impact estimate for students with no
prior participation is 10 , while the impact estimate for students with prior SEEMA participation is
10 30 .
n
Yij ( 00 oj ) 10 (trtij ) 20 (Pr iorij ) 30 (trtij * Pr iorij ) 40 ( preij pre) k ,0 (cov arij cov ar) ij k5
A-3
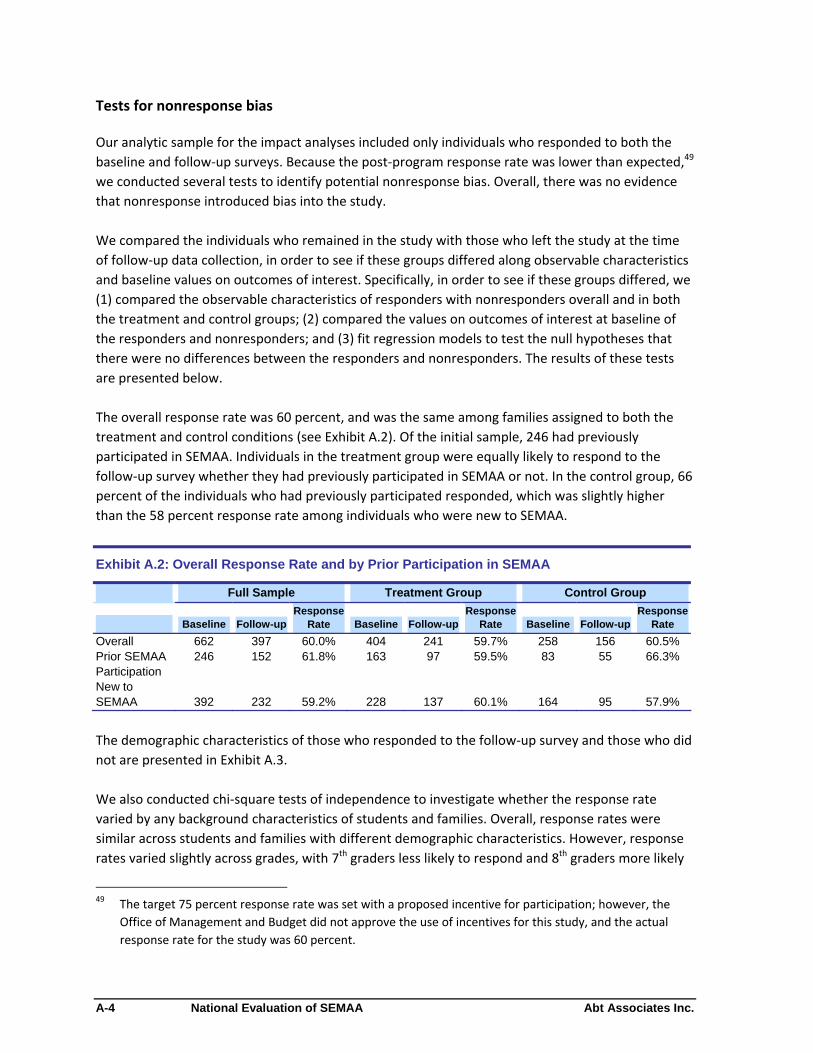
National Evaluation of SEMAA Abt Associates Inc.
Tests for nonresponse bias
Our analytic sample for the impact analyses included only individuals who responded to both the
baseline and follow‐up surveys. Because the post‐program response rate was lower than expected,49
we conducted several tests to identify potential nonresponse bias. Overall, there was no evidence
that nonresponse introduced bias into the study.
We compared the individuals who remained in the study with those who left the study at the time
of follow‐up data collection, in order to see if these groups differed along observable characteristics
and baseline values on outcomes of interest. Specifically, in order to see if these groups differed, we
(1) compared the observable characteristics of responders with nonresponders overall and in both
the treatment and control groups; (2) compared the values on outcomes of interest at baseline of
the responders and nonresponders; and (3) fit regression models to test the null hypotheses that
there were no differences between the responders and nonresponders. The results of these tests
are presented below.
The overall response rate was 60 percent, and was the same among families assigned to both the
treatment and control conditions (see Exhibit A.2). Of the initial sample, 246 had previously
participated in SEMAA. Individuals in the treatment group were equally likely to respond to the
follow‐up survey whether they had previously participated in SEMAA or not. In the control group, 66
percent of the individuals who had previously participated responded, which was slightly higher
than the 58 percent response rate among individuals who were new to SEMAA.
Exhibit A.2: Overall Response Rate and by Prior Participation in SEMAA
Full Sample Treatment Group Control Group
Response Rate
Response Rate
Response Rate Baseline Follow-up Baseline Follow-up Baseline Follow-up
Overall 662 397 60.0% 404 241 59.7% 258 156 60.5%Prior SEMAA Participation New to SEMAA
246 152 61.8% 163 97 59.5% 83 55 66.3%
392 232 59.2% 228 137 60.1% 164 95 57.9%
The demographic characteristics of those who responded to the follow‐up survey and those who did
not are presented in Exhibit A.3.
We also conducted chi‐square tests of independence to investigate whether the response rate
varied by any background characteristics of students and families. Overall, response rates were
similar across students and families with different demographic characteristics. However, response
rates varied slightly across grades, with 7th graders less likely to respond and 8th graders more likely
49 The target 75 percent response rate was set with a proposed incentive for participation; however, the
Office of Management and Budget did not approve the use of incentives for this study, and the actual
response rate for the study was 60 percent.
A-4
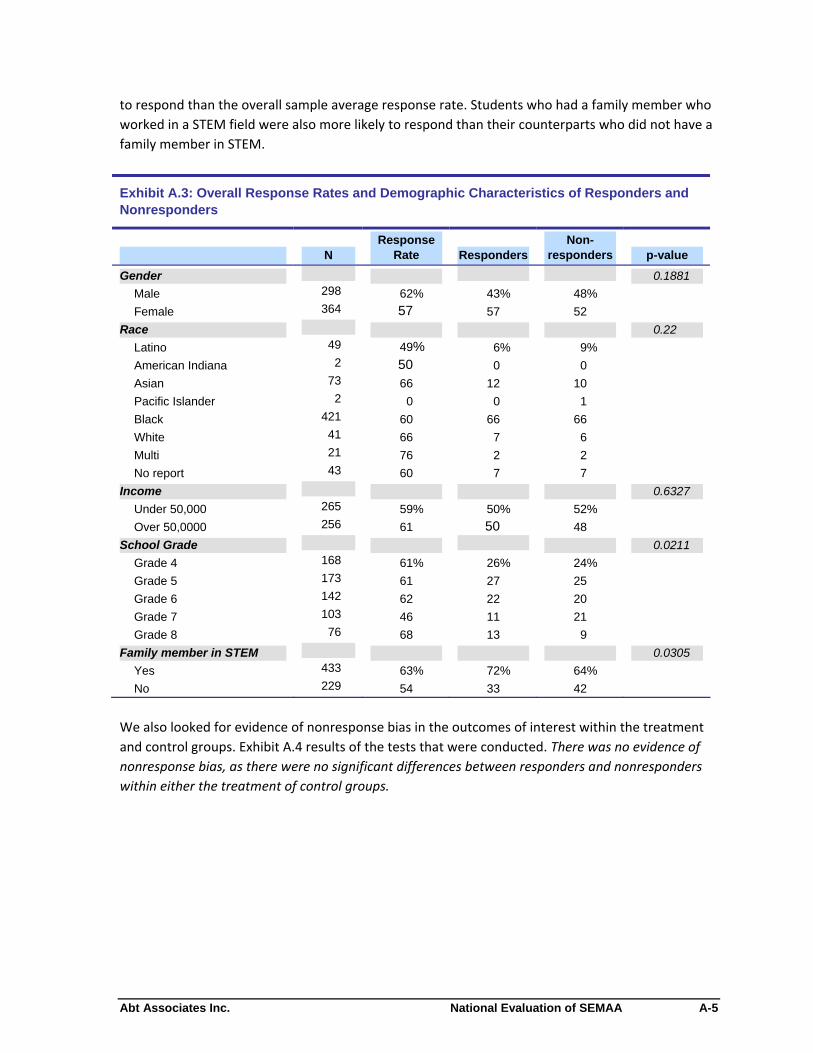
Abt Associates Inc. National Evaluation of SEMAA
to respond than the overall sample average response rate. Students who had a family member who
worked in a STEM field were also more likely to respond than their counterparts who did not have a
family member in STEM.
Exhibit A.3: Overall Response Rates and Demographic Characteristics of Responders and Nonresponders
N Response
Rate Responders Non-
responders p-value
Gender
Male
Female
Race
Latino
American Indiana
Asian
Pacific Islander
Black
White
Multi
No report
Income
Under 50,000
Over 50,0000
School Grade
Grade 4
Grade 5
Grade 6
Grade 7
Grade 8
Family member in STEM
Yes
No
298
364
49
2
73
2
421
41
21
43
265
256
168
173
142
103
76
433
229
62%
57
49%
50
66
0
60
66
76
60
59%
61
61%
61
62
46
68
63%
54
43%
57
6%
0
12
0
66
7
2
7
50%
50
26%
27
22
11
13
72%
33
48%
52
9%
0
10
1
66
6
2
7
52%
48
24%
25
20
21
9
64%
42
0.1881
0.22
0.6327
0.0211
0.0305
We also looked for evidence of nonresponse bias in the outcomes of interest within the treatment
and control groups. Exhibit A.4 results of the tests that were conducted. There was no evidence of
nonresponse bias, as there were no significant differences between responders and nonresponders
within either the treatment of control groups.
A-5
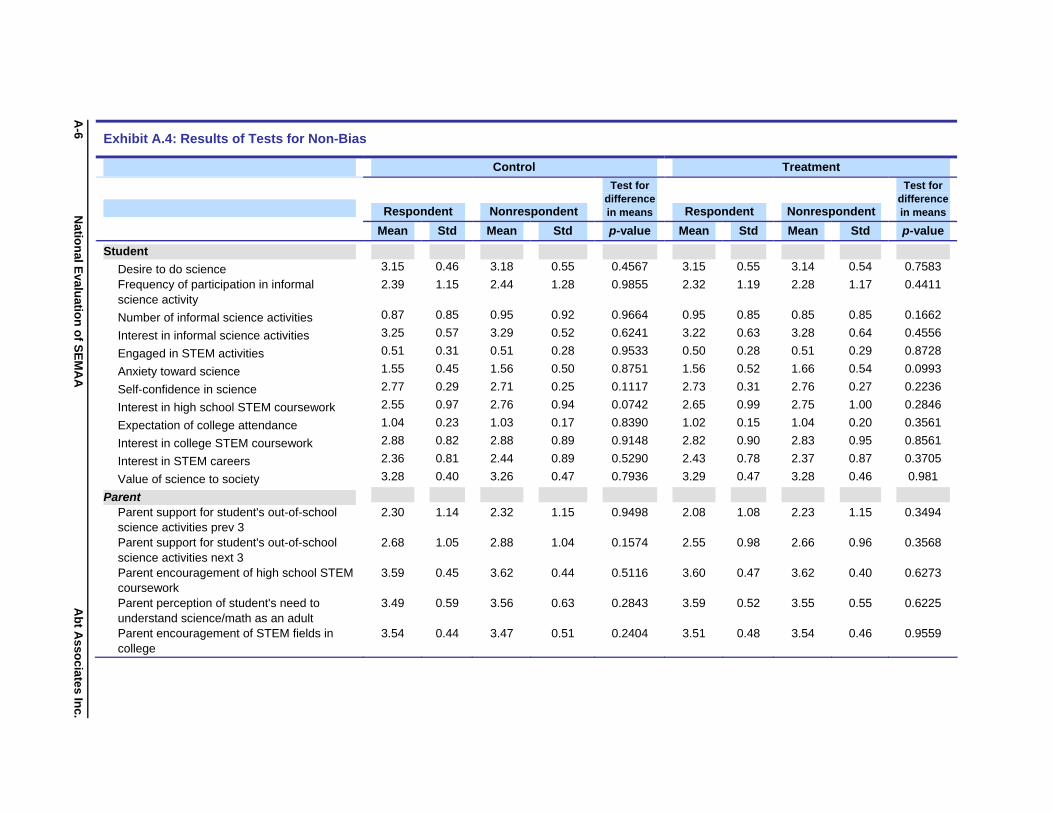
A-6
N
ation
al Evalu
ation
of S
EM
AA
A
bt A
ssociate
s Inc.
Exhibit A.4: Results of Tests for Non-Bias
Control Treatment
Respondent Nonrespondent
Test for difference in means Respondent Nonrespondent
Test for difference in means
Mean Std Mean Std p-value Mean Std Mean Std p-value
Student
Desire to do science Frequency of participation in informal science activity
Number of informal science activities
Interest in informal science activities
Engaged in STEM activities
Anxiety toward science
Self-confidence in science
Interest in high school STEM coursework
Expectation of college attendance
Interest in college STEM coursework
Interest in STEM careers
Value of science to society
Parent Parent support for student's out-of-school science activities prev 3 Parent support for student's out-of-school science activities next 3 Parent encouragement of high school STEM coursework Parent perception of student's need to understand science/math as an adult Parent encouragement of STEM fields in college
3.15
2.39
0.87
3.25
0.51
1.55
2.77
2.55
1.04
2.88
2.36
3.28
2.30
2.68
3.59
3.49
3.54
0.46
1.15
0.85
0.57
0.31
0.45
0.29
0.97
0.23
0.82
0.81
0.40
1.14
1.05
0.45
0.59
0.44
3.18
2.44
0.95
3.29
0.51
1.56
2.71
2.76
1.03
2.88
2.44
3.26
2.32
2.88
3.62
3.56
3.47
0.55
1.28
0.92
0.52
0.28
0.50
0.25
0.94
0.17
0.89
0.89
0.47
1.15
1.04
0.44
0.63
0.51
0.4567
0.9855
0.9664
0.6241
0.9533
0.8751
0.1117
0.0742
0.8390
0.9148
0.5290
0.7936
0.9498
0.1574
0.5116
0.2843
0.2404
3.15
2.32
0.95
3.22
0.50
1.56
2.73
2.65
1.02
2.82
2.43
3.29
2.08
2.55
3.60
3.59
3.51
0.55
1.19
0.85
0.63
0.28
0.52
0.31
0.99
0.15
0.90
0.78
0.47
1.08
0.98
0.47
0.52
0.48
3.14
2.28
0.85
3.28
0.51
1.66
2.76
2.75
1.04
2.83
2.37
3.28
2.23
2.66
3.62
3.55
3.54
0.54
1.17
0.85
0.64
0.29
0.54
0.27
1.00
0.20
0.95
0.87
0.46
1.15
0.96
0.40
0.55
0.46
0.7583
0.4411
0.1662
0.4556
0.8728
0.0993
0.2236
0.2846
0.3561
0.8561
0.3705
0.981
0.3494
0.3568
0.6273
0.6225
0.9559
Abt Associates Inc. National Evaluation of SEMAA
Baseline Balance Testing
Because the study randomly assigned families to treatment and control groups, we would expect
the groups to be equivalent on baseline measures of the outcomes. However, because of the
response rate, we conducted a series of tests to examine whether, among individuals in the final
analytic sample, the treatment and control groups were equivalent in their baseline measures. We
fit regression models to test for differences between the two groups at baseline on any outcome
measures. Exhibit A.5 presents the means and standard deviations, of the treatment and control
group members on the outcomes included in the study, and the results of the statistical tests for
differences between groups from the regression models. Across all outcomes included in the study
the characteristics of the treatment and control groups were similar.
Study Minimum Detectable Effects
The minimum detectable standardized effect size (MDSES) is the smallest effect size that could have
been detected by the study with 80 percent power. All of the MDSESs were of similar magnitude,
ranging from 0.24 to 0.31, indicating that detecting a statistically significant difference on any of the
outcomes would have required a treatment‐control difference of roughly one‐quarter to one‐third
of a standard deviation. By general standards in the educational evaluation literature, these would
represent quite large effects.50 Given the smaller than expected initial study sample, and the lower
than expected response rate at follow‐up, the resulting reduction in the final analytic sample size
(n=396) led to lower statistical power, lower precision than is necessary to detect smaller effect
sizes.
50 Kane (2004, cited in Bloom, 2005) calculated that a year of elementary school attendance increases
average test scores in reading and math by 0.25 standard deviations; the National Center for Education
Statistics (1997, cited in Bloom, 2005) estimated a 0.26 standard deviation improvement in math scores
from a year of high school. While useful as benchmarks, it should be noted that the standardized test
scores used in these calculations are fundamentally different measures from the interest and attitude
measures utilized in evaluating the impact of SEMAA.
A-7
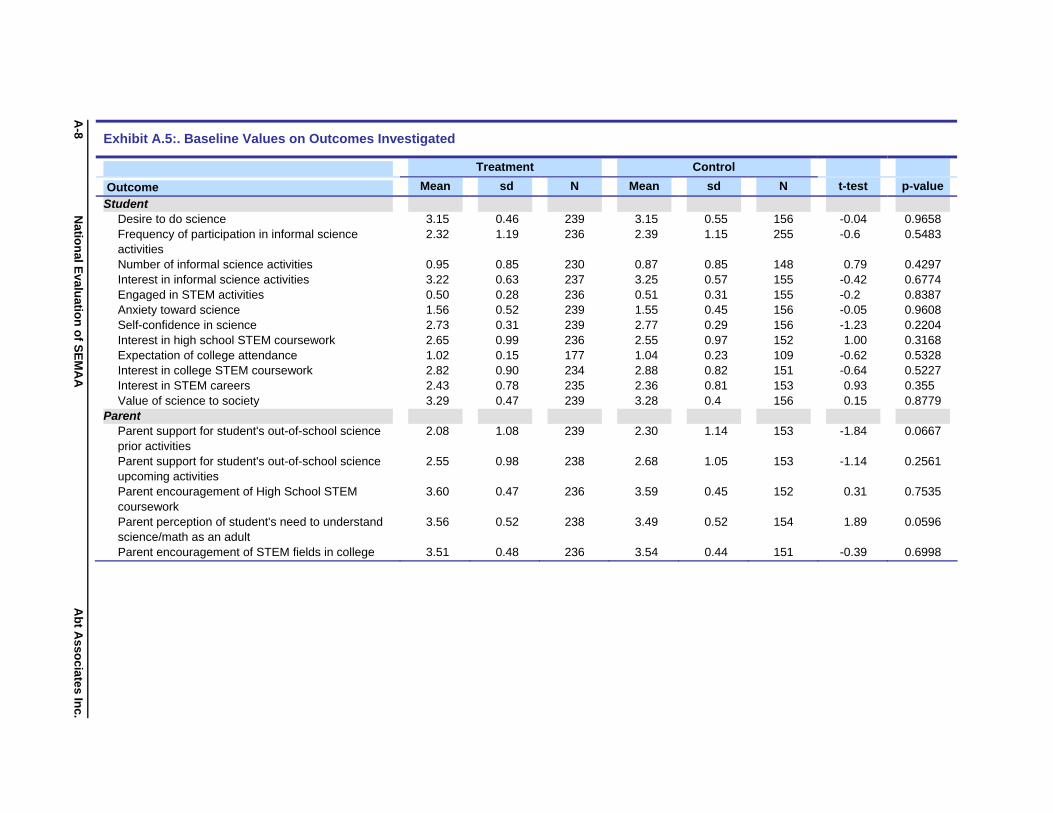
A-8
N
ation
al Evalu
ation
of S
EM
AA
A
bt A
ssociate
s Inc.
Exhibit A.5:. Baseline Values on Outcomes Investigated
Treatment Control
Outcome Mean sd N Mean sd N t-test p-value
Student Desire to do science Frequency of participation in informal science activities Number of informal science activities Interest in informal science activities Engaged in STEM activities Anxiety toward science Self-confidence in science Interest in high school STEM coursework Expectation of college attendance Interest in college STEM coursework Interest in STEM careers Value of science to society
Parent Parent support for student's out-of-school science prior activities Parent support for student's out-of-school science upcoming activities Parent encouragement of High School STEM coursework Parent perception of student's need to understand science/math as an adult Parent encouragement of STEM fields in college
3.15 2.32
0.95 3.22 0.50 1.56 2.73 2.65 1.02 2.82 2.43 3.29 2.08
2.55
3.60
3.56
3.51
0.46 1.19
0.85 0.63 0.28 0.52 0.31 0.99 0.15 0.90 0.78 0.47 1.08
0.98
0.47
0.52
0.48
239 236
230 237 236 239 239 236 177 234 235 239
239
238
236
238
236
3.15 2.39
0.87 3.25 0.51 1.55 2.77 2.55 1.04 2.88 2.36 3.28 2.30
2.68
3.59
3.49
3.54
0.55 1.15
0.85 0.57 0.31 0.45 0.29 0.97 0.23 0.82 0.81 0.4
1.14
1.05
0.45
0.52
0.44
156 255
148 155 155 156 156 152 109 151 153 156
153
153
152
154
151
-0.04 -0.6
0.79 -0.42 -0.2 -0.05 -1.23 1.00
-0.62 -0.64 0.93 0.15
-1.84
-1.14
0.31
1.89
-0.39
0.96580.5483
0.42970.67740.83870.96080.22040.31680.53280.52270.355 0.8779 0.0667
0.2561
0.7535
0.0596
0.6998
Abt Associates Inc. National Evaluation of SEMAA
Appendix B: Instruments
Interview protocol
Student surveys – pretest and posttest
Parent surveys – pretest and posttest
B-1

THIS PAGE INTENTIONALLY BLANK
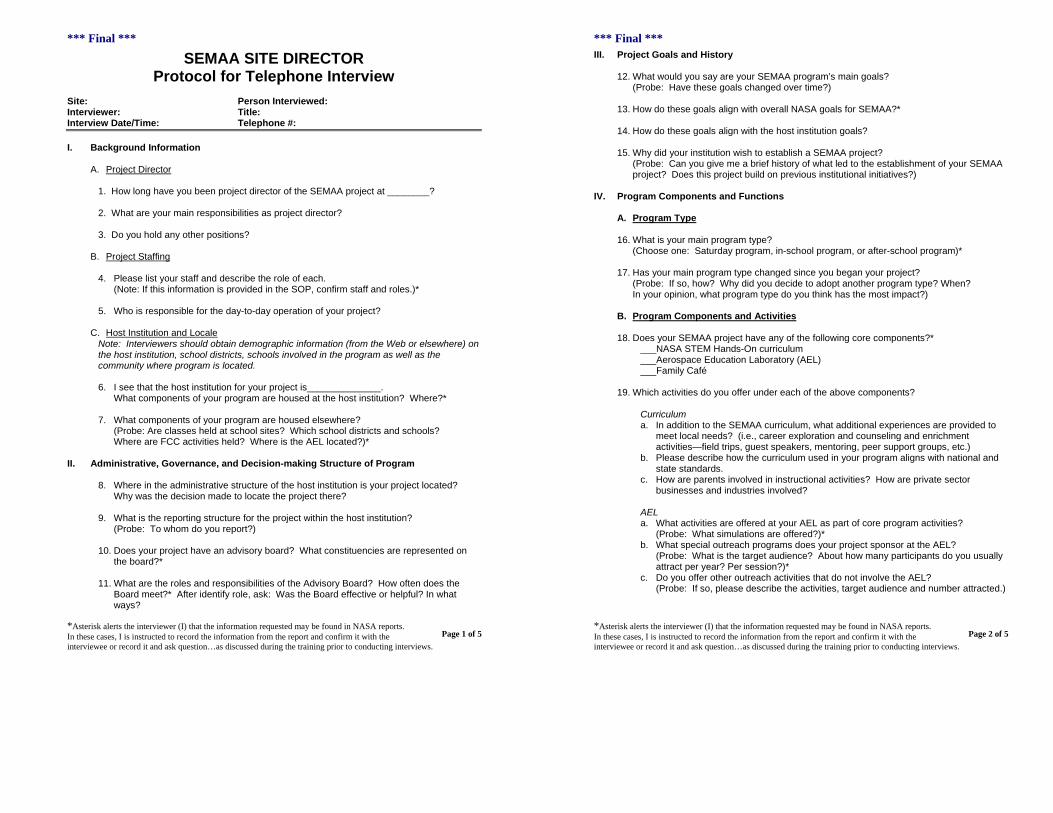
*** Final ***
SEMAA SITE DIRECTOR Protocol for Telephone Interview
Site: Person Interviewe d: Interviewer: Title: Interview Date/Time: Telephone #:
I. Background In formation
A. Project Director
1. How long have you been project director of the SEMAA project at ________?
2. What are your main responsibilities as project director?
3. Do you hold any other positions?
B. Project Staffing
4. Please list your staff and describe the role of each.
(Note: If this information is provided in the SOP, confirm staff and roles.)* 5. Who is responsible for the day-to-day operation of your project?
C. Host Institution and Locale
Note: Interviewers should obtain demographic information (from the Web or elsewhere) on the host institution, school districts, schools involved in the program as well as the community where program is located. 6. I see that the host institution for your project is______________.
What components of your program are housed at the host institution? Where?* 7. What components of your program are housed elsewhere?
(Probe: Are classes held at school sites? Which school districts and schools? Where are FCC activities held? Where is the AEL located?)*
II. Administrative, Governance, and Decision-making Structure of Program
8. Where in the administrative structure of the host institution is your project located?
Why was the decision made to locate the project there? 9. What is the reporting structure for the project within the host institution?
(Probe: To whom do you report?)
10. Does your project have an advisory board? What constituencies are represented on the board?*
11. What are the roles and responsibilities of the Advisory Board? How often does the
Board meet?* After identify role, ask: Was the Board effective or helpful? In what ways?
*Asterisk alerts the interviewer (I) that the information requested may be found in NASA reports. In these cases, I is instructed to record the information from the report and confirm it with the Page 1 of 5interviewee or record it and ask question…as discussed during the training prior to conducting interviews.
*** Final *** III. Project Goals and History
12. What would you say are your SEMAA program’s main goals?
(Probe: Have these goals changed over time?) 13. How do these goals align with overall NASA goals for SEMAA?*
14. How do these goals align with the host institution goals?
15. Why did your institution wish to establish a SEMAA project?
(Probe: Can you give me a brief history of what led to the establishment of your SEMAA project? Does this project build on previous institutional initiatives?)
IV. Program Components and Functions
A. Program Type
16. What is your main program type?
(Choose one: Saturday program, in-school program, or after-school program)*
17. Has your main program type changed since you began your project? (Probe: If so, how? Why did you decide to adopt another program type? When? In your opinion, what program type do you think has the most impact?)
B. Program Components and Activities
18. Does your SEMAA project have any of the following core components?*
___NASA STEM Hands-On curriculum ___Aerospace Education Laboratory (AEL) ___Family Café
19. Which activities do you offer under each of the above components?
Curriculum a. In addition to the SEMAA curriculum, what additional experiences are provided to
meet local needs? (i.e., career exploration and counseling and enrichment activities—field trips, guest speakers, mentoring, peer support groups, etc.)
b. Please describe how the curriculum used in your program aligns with national and state standards.
c. How are parents involved in instructional activities? How are private sector businesses and industries involved?
AEL a. What activities are offered at your AEL as part of core program activities?
(Probe: What simulations are offered?)* b. What special outreach programs does your project sponsor at the AEL?
(Probe: What is the target audience? About how many participants do you usually attract per year? Per session?)*
c. Do you offer other outreach activities that do not involve the AEL? (Probe: If so, please describe the activities, target audience and number attracted.)
*Asterisk alerts the interviewer (I) that the information requested may be found in NASA reports. In these cases, I is instructed to record the information from the report and confirm it with the Page 2 of 5interviewee or record it and ask question…as discussed during the training prior to conducting interviews.
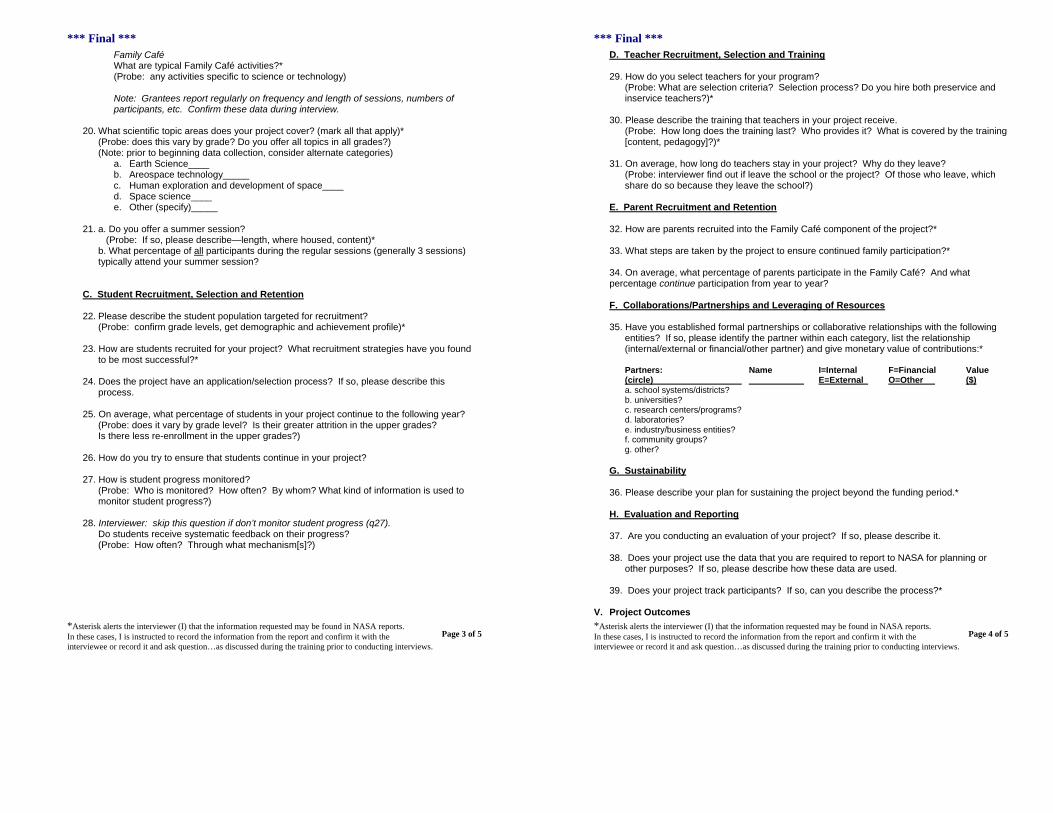
*** Final *** Family Café What are typical Family Café activities?* (Probe: any activities specific to science or technology) Note: Grantees report regularly on frequency and length of sessions, numbers of participants, etc. Confirm these data during interview.
20. What scientific topic areas does your project cover? (mark all that apply)*
(Probe: does this vary by grade? Do you offer all topics in all grades?) (Note: prior to beginning data collection, consider alternate categories)
a. Earth Science____ b. Areospac te echnology_____ c. Human exploration and development of space____ d. Space science____ e. Other (specify)_____
21. a. Do you offer a summer session?
(Probe: If so, please describe—length, where housed, content)* b. What percentage of all participants during the regular sessions (generally 3 sessions) typically attend your summer session?
C. Student Recruitment, Selection and Retention 22. Please describe the student population targeted for recruitment? (Probe: confirm grade levels, get demographic and achievement profile)* 23. How are students recruited for your project? What recruitment strategies have you found
to be most successful?* 24. Does the project have an application/selection process? If so, please describe this
process. 25. On average, what percentage of students in your project continue to the following year? (Probe: does it vary by grade level? Is their greater attrition in the upper grades? Is there less re-enrollment in the upper grades?) 26. How do you try to ensure that students continue in your project? 27. How is student progress monitored?
(Probe: Who is monitored? How often? By whom? What kind of information is used to monitor student progress?)
28. Interviewer: skip this question if don’t monitor student progress (q27). Do students receive systematic feedback on their progress? (Probe: How often? Through what mechanism[s]?)
*Asterisk alerts the interviewer (I) that the information requested may be found in NASA reports. In these cases, I is instructed to record the information from the report and confirm it with the Page 3 of 5interviewee or record it and ask question…as discussed during the training prior to conducting interviews.
*** Final *** D. Teacher Recruitment, Selection and Training 29. How do you select teachers for your program?
(Probe: What are selection criteria? Selection process? Do you hire both preservice and inservice teachers?)*
30. Please describe the training that teachers in your project receive. (Probe: How long does the training last? Who provides it? What is covered by the training [content, pedagogy]?)*
31. On average, how long do teachers stay in your project? Why do they leave? (Probe: interviewer find out if leave the school or the project? Of those who leave, which
share do so because they leave the school?) E. Parent Recruitment and Retention 32. How are parents recruited into the Family Café component of the project?* 33. What steps are taken by the project to ensure continued family participation?* 34. On average, what percentage of parents participate in the Family Café? And what percentage continue participation from year to year? F. Collaborations/Partnerships and Leveraging of Resources 35. Have you established formal partnerships or collaborative relationships with the following
entities? If so, please identify the partner within each category, list the relationship (internal/external or financial/other partner) and give monetary value of contributions:*
Partners: Name I=Internal F=Financial Value (circle) E=External O=Other ($) a. school systems/districts? b. universities? c. research centers/programs? d. laboratories? e. industry/business entities? f. community groups? g. other?
G. Sustainability 36. Please describe your plan for sustaining the project beyond the funding period.* H. Evaluation and Reporting 37. Are you conducting an evaluation of your project? If so, please describe it.
38. Does your project use the data that you are required to report to NASA for planning or
other purposes? If so, please describe how these data are used.
39. Does your project track participants? If so, can you describe the process?*
V. Project Outcomes
*Asterisk alerts the interviewer (I) that the information requested may be found in NASA reports. In these cases, I is instructed to record the information from the report and confirm it with the Page 4 of 5interviewee or record it and ask question…as discussed during the training prior to conducting interviews.
*** Final *** 40. What do you see as your project’s main outcomes?
41. What percentage of participants in your project do you estimate have majored in a STEM
degree in college? What percentage may be working in a STEM field?
VI. Lessons Learned 42. What have been the main lessons that you have learned in implementing your project? 43. What have been the main factors that have helped you implement your project successfully? 44. What have been your biggest challenges in implementing your project?
*Asterisk alerts the interviewer (I) that the information requested may be found in NASA reports. In these cases, I is instructed to record the information from the report and confirm it with the Page 5 of 5interviewee or record it and ask question…as discussed during the training prior to conducting interviews.

THIS PAGE INTENTIONALLY BLANK
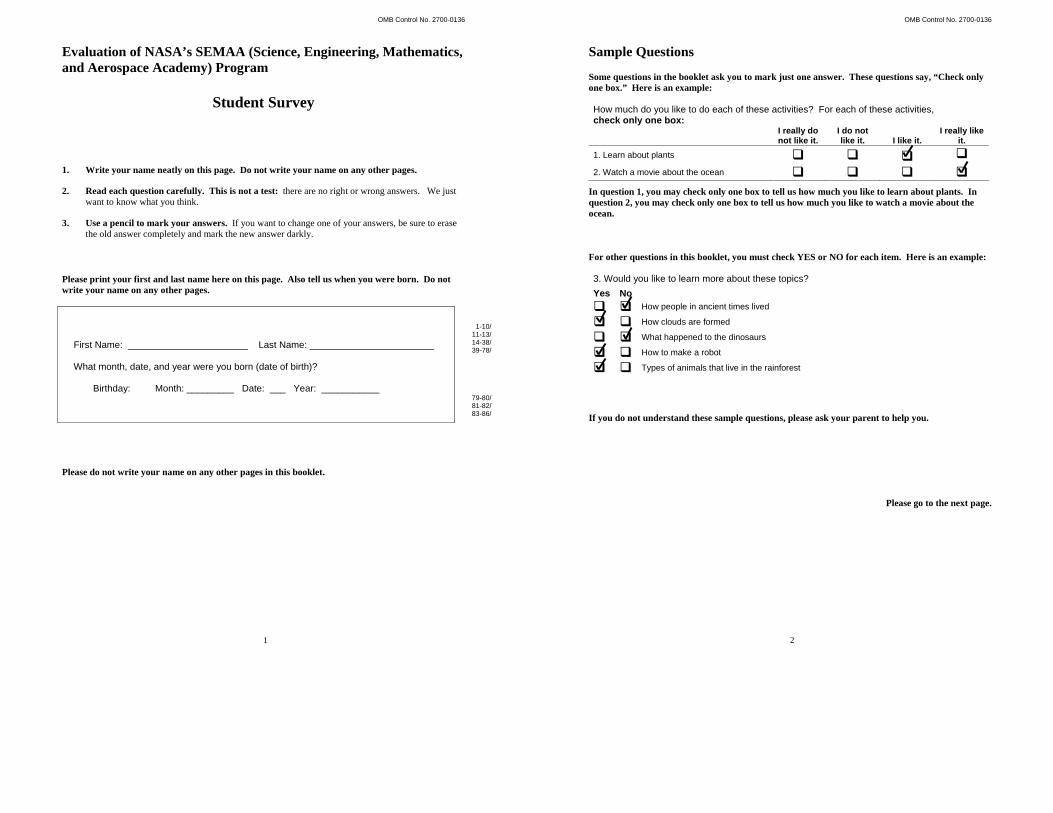
OMB Control No. 2700-0136
Evaluation of NASA’s SEMAA (Science, Engineering, Mathematics, and Aerospace Academy) Program
Student Survey
1. Write your name neatly on this page. Do not write your name on any other pages.
2. Read each question carefully. This is not a test: there are no right or wrong answers. We just want to know what you think.
3. Use a pencil to mark your answers. If you want to change one of your answers, be sure to erase the old answer completely and mark the new answer darkly.
Please print your first and last name here on this page. Also tell us when you were born. Do not write your name on any other pages.
First Name: Last Name: What month, date, and year were you born (date of birth)?
Birthday: Month: _________ Date: ___ Year: ___________
1-10/ 11-13/ 14-38/ 39-78/
79-80/ 81-82/ 83-86/
Please do not write your name on any other pages in this booklet.
1
OMB Control No. 2700-0136
Sample Questions Some questions in the booklet ask you to mark just one answer. These questions say, “Check only one box.” Here is an example:
How much do you like to do each of these activities? For each of these activities, check only one box:
I really do I do not I really like not like it. like it. I like it. it.
1. Learn about plants 2. Watch a movie about the ocean
In question 1, you may check only one box to tell us how much you like to learn about plants. In question 2, you may check only one box to tell us how much you like to watch a movie about the ocean. For other questions in this booklet, you must check YES or NO for each item. Here is an example: 3. Would you like to learn more about these topics?
Yes No
How people in ancient times lived
How clouds are formed
What happened to the dinosaurs
How to make a robot
Types of animals that live in the rainforest
If you do not understand these sample questions, please ask your parent to help you. Please go to the next page.
2
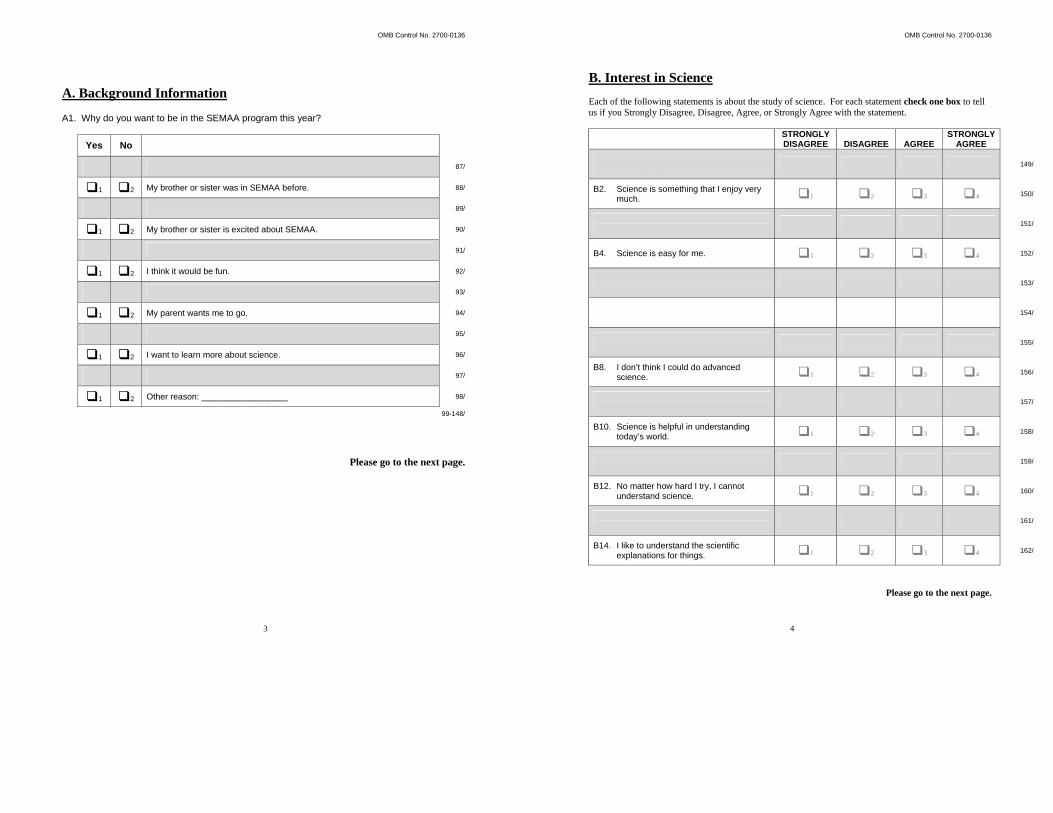
OMB Control No. 2700-0136
A. Background Information A1. Why do you want to be in the SEMAA program this year?
Yes No
1 2 I went to SEMAA before. 87/
1 2 My brother or sister was in SEMAA before. 88/
1 2 I am excited about SEMAA. 89/
1 2 My brother or sister is excited about SEMAA. 90/
1 91/2 One of my friends is excited about SEMAA.
1 2 I think it would be fun. 92/
1 2 I think I would learn a lot. 93/
1 2 My parent wants me to go. 94/
1 95/2 I like science.
1 2 I want to learn more about science. 96/
1 2 I want to meet new friends. 97/
1 2 Other reason: __________________ 98/
99-148/
Please go to the next page.
3
OMB Control No. 2700-0136
B. Interest in Science Each of the following statements is about the study of science. For each statement check one box to tell us if you Strongly Disagree, Disagree, Agree, or Strongly Agree with the statement.
STRONGLY STRONGLY DISAGREE DISAGREE AGREE AGREE
B1. Science is useful for solving problems 149/
of everyday life. 1 2 3 4
B2. Science is something that I enjoy very 2 much. 1 3 4 150/
B3. I like to read about science even when my teacher doesn’t ask me to. 1 2 3 4 151/
B4. Science is easy for me. 1 2 3 4 152/
B5. When I hear the word “science,” I have 153/
a feeling of dislike. 1 2 3 4
B6. Most people should study some science. 2 1 3 4 154/
B7. Sometimes I read ahead in our science book at school. 1 2 3 4 155/
B8. I don’t think I could do advanced 156/
science. 1 2 3 4
B9. I think I could do more difficult science 1 2 3 4 157/ work than what I do now.
B10. Science is helpful in understanding 1 2 3 4 158/ today’s world.
B11. I usually understand what we are talking 159/
about in science lessons at school. 1 2 3 4
B12. No matter how hard I try, I cannot 2 understand science. 1 3 4 160/
B13. I feel tense when someone talks to me about science. 1 2 3 4 161/
B14. I like to understand the scientific explanations for things. 1 2 3 4 162/
Please go to the next page.
4
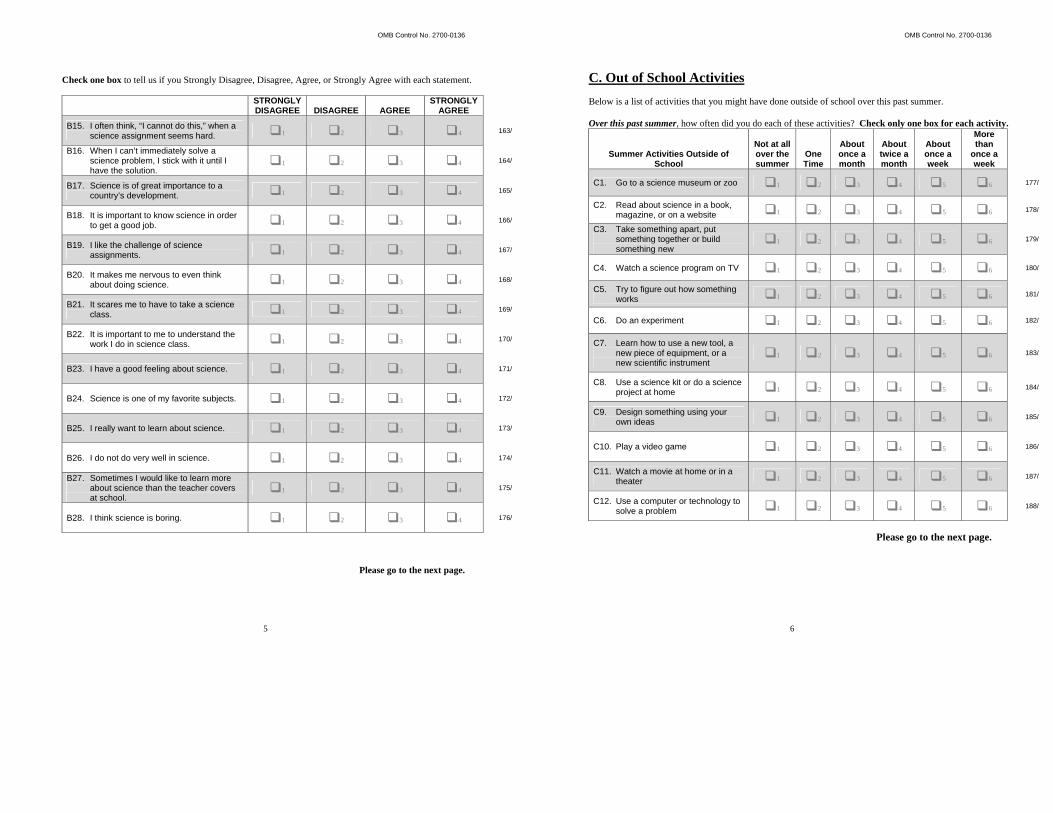
OMB Control No. 2700-0136
5
Check one box to tell us if you Strongly Disagree, Disagree, Agree, or Strongly Agree with each statement.
STRONGLY DISAGREE DISAGREE AGREE
STRONGLY AGREE
B15. I often think, “I cannot do this,” when a science assignment seems hard. 1 2 3 4 163/
B16. When I can’t immediately solve a science problem, I stick with it until I have the solution.
1 2 3 4 164/
B17. Science is of great importance to a country’s development. 1 2 3 4 165/
B18. It is important to know science in order to get a good job. 1 2 3 4 166/
B19. I like the challenge of science assignments. 1 2 3 4 167/
B20. It makes me nervous to even think about doing science. 1 2 3 4 168/
B21. It scares me to have to take a science class. 1 2 3 4 169/
B22. It is important to me to understand the work I do in science class. 1 2 3 4 170/
B23. I have a good feeling about science. 1 2 3 4 171/
B24. Science is one of my favorite subjects. 1 2 3 4 172/
B25. I really want to learn about science. 1 2 3 4 173/
B26. I do not do very well in science. 1 2 3 4 174/
B27. Sometimes I would like to learn more about science than the teacher covers at school.
1 2 3 4 175/
B28. I think science is boring. 1 2 3 4 176/
Please go to the next page.
OMB Control No. 2700-0136
6
C. Out of School Activities Below is a list of activities that you might have done outside of school over this past summer. Over this past summer, how often did you do each of these activities? Check only one box for each activity.
Summer Activities Outside of School
Not at all over the summer
One Time
About once a month
About twice a month
About once a week
More than
once a week
C1. Go to a science museum or zoo 1 2 3 4 5 6 177/
C2. Read about science in a book, magazine, or on a website 1 2 3 4 5 6 178/
C3. Take something apart, put something together or build something new
1 2 3 4 5 6 179/
C4. Watch a science program on TV 1 2 3 4 5 6 180/
C5. Try to figure out how something works 1 2 3 4 5 6 181/
C6. Do an experiment 1 2 3 4 5 6 182/
C7. Learn how to use a new tool, a new piece of equipment, or a new scientific instrument
1 2 3 4 5 6 183/
C8. Use a science kit or do a science project at home 1 2 3 4 5 6 184/
C9. Design something using your own ideas 1 2 3 4 5 6 185/
C10. Play a video game 1 2 3 4 5 6 186/
C11. Watch a movie at home or in a theater 1 2 3 4 5 6 187/
C12. Use a computer or technology to solve a problem 1 2 3 4 5 6 188/
Please go to the next page.
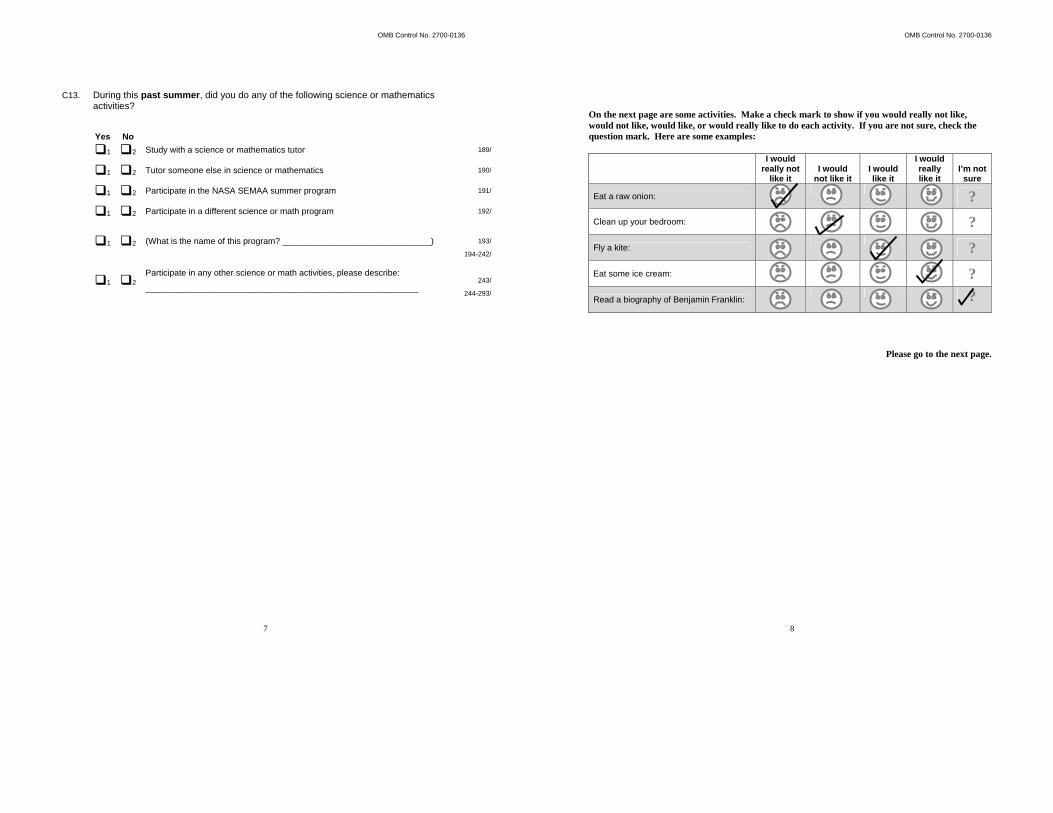
OMB Control No. 2700-0136
7
C13. During this past summer, did you do any of the following science or mathematics activities?
Yes No
1 2 Study with a science or mathematics tutor 189/
1 2 Tutor someone else in science or mathematics 190/
1 2 Participate in the NASA SEMAA summer program 191/
1 2 Participate in a different science or math program 192/
1 2 (What is the name of this program? _______________________________)
193/
194-242/
1 2 Participate in any other science or math activities, please describe:
_________________________________________________________
243/
244-293/
OMB Control No. 2700-0136
8
On the next page are some activities. Make a check mark to show if you would really not like, would not like, would like, or would really like to do each activity. If you are not sure, check the question mark. Here are some examples:
I would
really not like it
I would not like it
I would like it
I would really like it
I’m not sure
Eat a raw onion: ?
Clean up your bedroom: ?
Fly a kite: ?
Eat some ice cream: ?
Read a biography of Benjamin Franklin: ?
Please go to the next page.
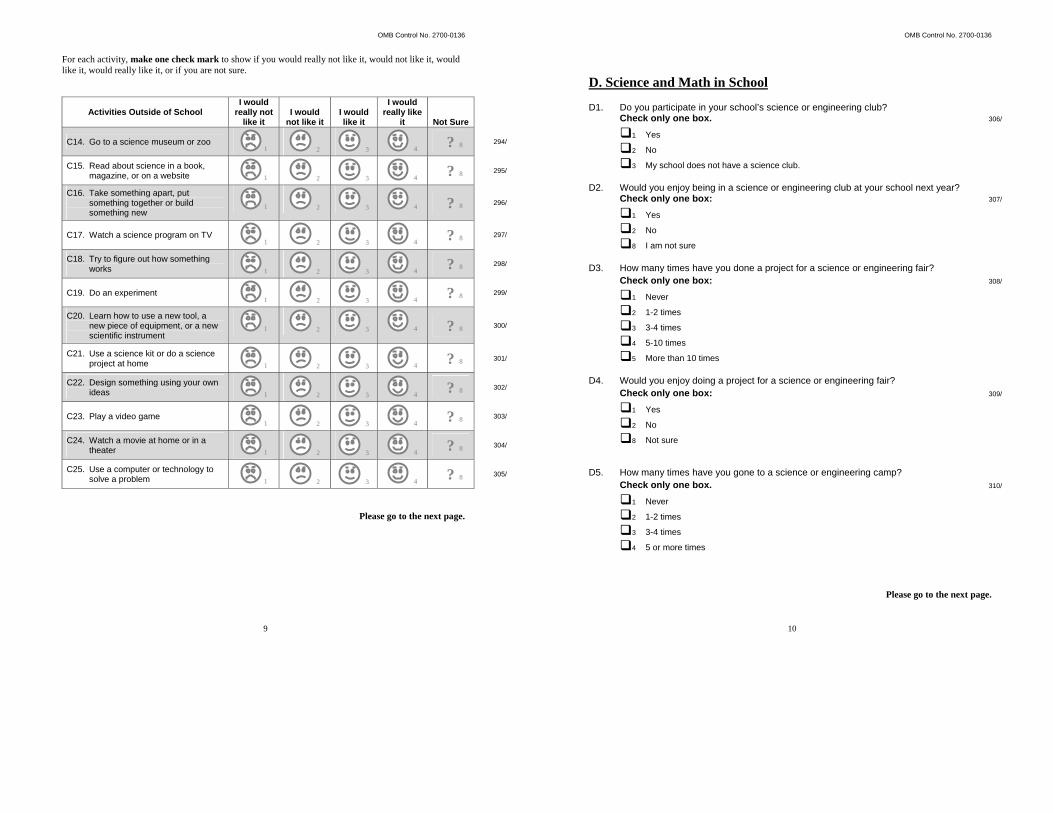
OMB Control No. 2700-0136
9
For each activity, make one check mark to show if you would really not like it, would not like it, would like it, would really like it, or if you are not sure.
Activities Outside of School I would
really not like it
I would not like it
I would like it
I would really like
it Not Sure
C14. Go to a science museum or zoo 1 2 3 4 ? 8 294/
C15. Read about science in a book, magazine, or on a website 1 2 3 4 ? 8 295/
C16. Take something apart, put something together or build something new
1 2 3 4 ? 8 296/
C17. Watch a science program on TV 1 2 3 4 ? 8 297/
C18. Try to figure out how something works 1 2 3 4 ? 8 298/
C19. Do an experiment 1 2 3 4 ? 8 299/
C20. Learn how to use a new tool, a new piece of equipment, or a new scientific instrument
1 2 3 4 ? 8 300/
C21. Use a science kit or do a science project at home 1 2 3 4 ? 8 301/
C22. Design something using your own ideas 1 2 3 4 ? 8 302/
C23. Play a video game 1 2 3 4 ? 8 303/
C24. Watch a movie at home or in a theater 1 2 3 4 ? 8 304/
C25. Use a computer or technology to solve a problem 1 2 3 4 ? 8 305/
Please go to the next page.
OMB Control No. 2700-0136
10
D. Science and Math in School D1. Do you participate in your school’s science or engineering club? Check only one box. 306/
1 Yes
2 No
3 My school does not have a science club. D2. Would you enjoy being in a science or engineering club at your school next year?
Check only one box: 307/
1 Yes
2 No
8 I am not sure D3. How many times have you done a project for a science or engineering fair?
Check only one box: 308/
1 Never
2 1-2 times
3 3-4 times
4 5-10 times
5 More than 10 times D4. Would you enjoy doing a project for a science or engineering fair?
Check only one box: 309/
1 Yes
2 No
8 Not sure
D5. How many times have you gone to a science or engineering camp?
Check only one box. 310/
1 Never
2 1-2 times
3 3-4 times
4 5 or more times
Please go to the next page.
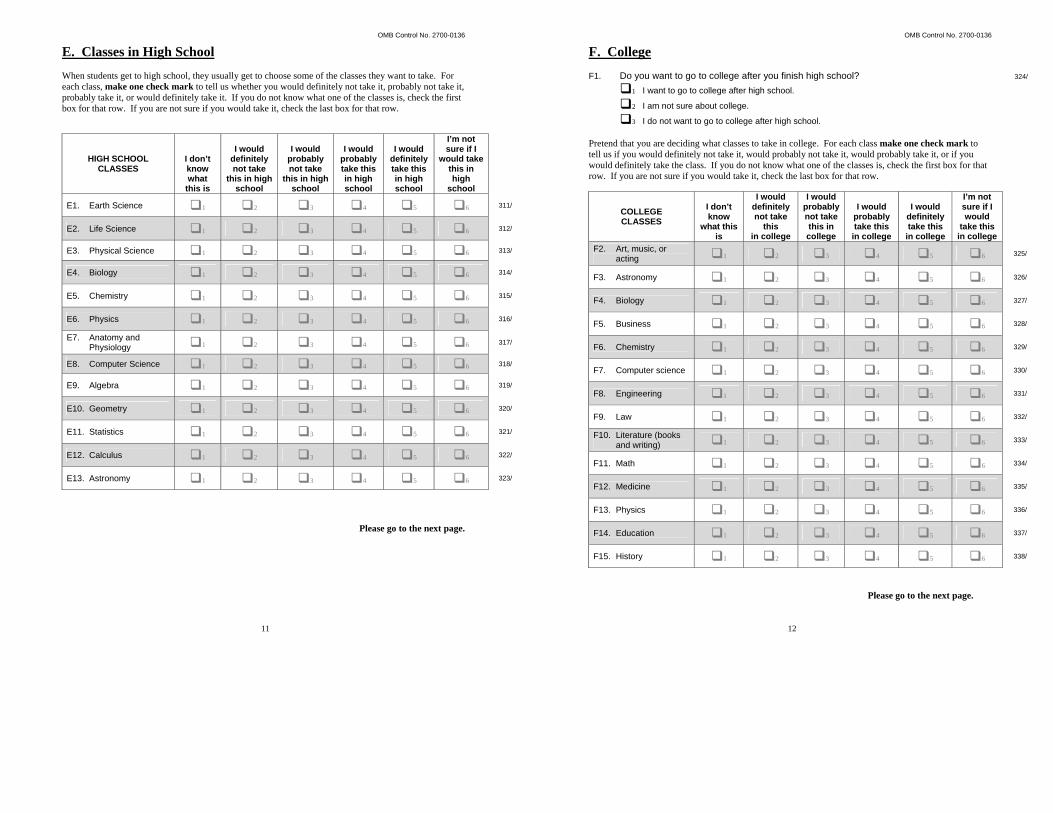
OMB Control No. 2700-0136
11
E. Classes in High School When students get to high school, they usually get to choose some of the classes they want to take. For each class, make one check mark to tell us whether you would definitely not take it, probably not take it, probably take it, or would definitely take it. If you do not know what one of the classes is, check the first box for that row. If you are not sure if you would take it, check the last box for that row.
HIGH SCHOOL CLASSES
I don’t know what
this is
I would definitely not take
this in high school
I would probably not take
this in high school
I would probably take this in high school
I would definitely take this in high school
I’m not sure if I
would take this in high
school
E1. Earth Science 1 2 3 4 5 6 311/
E2. Life Science 1 2 3 4 5 6 312/
E3. Physical Science 1 2 3 4 5 6 313/
E4. Biology 1 2 3 4 5 6 314/
E5. Chemistry 1 2 3 4 5 6 315/
E6. Physics 1 2 3 4 5 6 316/
E7. Anatomy and Physiology 1 2 3 4 5 6 317/
E8. Computer Science 1 2 3 4 5 6 318/
E9. Algebra 1 2 3 4 5 6 319/
E10. Geometry 1 2 3 4 5 6 320/
E11. Statistics 1 2 3 4 5 6 321/
E12. Calculus 1 2 3 4 5 6 322/
E13. Astronomy 1 2 3 4 5 6 323/
Please go to the next page.
OMB Control No. 2700-0136
12
F. College F1. Do you want to go to college after you finish high school? 324/
1 I want to go to college after high school.
2 I am not sure about college.
3 I do not want to go to college after high school. Pretend that you are deciding what classes to take in college. For each class make one check mark to tell us if you would definitely not take it, would probably not take it, would probably take it, or if you would definitely take the class. If you do not know what one of the classes is, check the first box for that row. If you are not sure if you would take it, check the last box for that row.
COLLEGE CLASSES
I don’t know
what this is
I would definitely not take
this in college
I would probably not take this in college
I would probably take this in college
I would definitely take this
in college
I’m not sure if I would
take this in college
F2. Art, music, or acting 1 2 3 4 5 6 325/
F3. Astronomy 1 2 3 4 5 6 326/
F4. Biology 1 2 3 4 5 6 327/
F5. Business 1 2 3 4 5 6 328/
F6. Chemistry 1 2 3 4 5 6 329/
F7. Computer science 1 2 3 4 5 6 330/
F8. Engineering 1 2 3 4 5 6 331/
F9. Law 1 2 3 4 5 6 332/
F10. Literature (books and writing) 1 2 3 4 5 6 333/
F11. Math 1 2 3 4 5 6 334/
F12. Medicine 1 2 3 4 5 6 335/
F13. Physics 1 2 3 4 5 6 336/
F14. Education 1 2 3 4 5 6 337/
F15. History 1 2 3 4 5 6 338/
Please go to the next page.
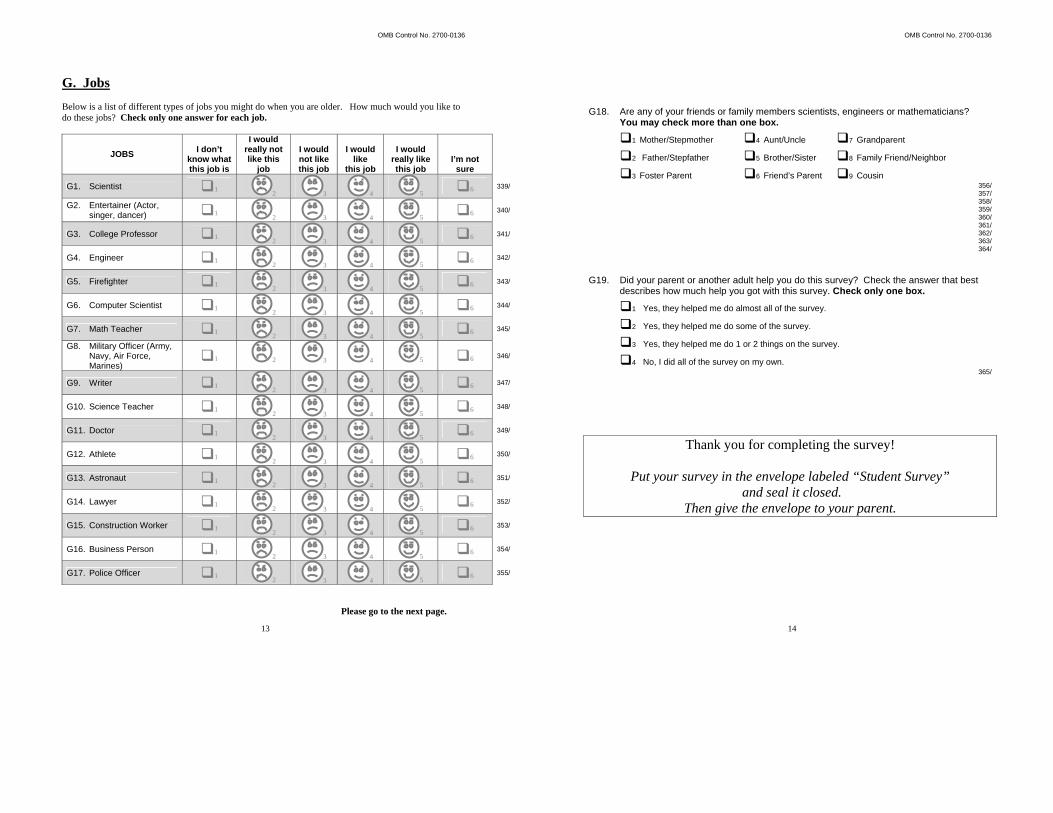
OMB Control No. 2700-0136
13
G. Jobs Below is a list of different types of jobs you might do when you are older. How much would you like to do these jobs? Check only one answer for each job.
JOBS I don’t
know what this job is
I would really not like this
job
I would not like this job
I would like
this job
I would really like this job
I’m not sure
G1. Scientist 1 2 3 4 5 6 339/
G2. Entertainer (Actor, singer, dancer) 1
2 3 4 5 6 340/
G3. College Professor 1 2 3 4 5 6 341/
G4. Engineer 1 2 3 4 5 6 342/
G5. Firefighter 1 2 3 4 5 6 343/
G6. Computer Scientist 1 2 3 4 5 6 344/
G7. Math Teacher 1 2 3 4 5 6 345/
G8. Military Officer (Army, Navy, Air Force, Marines)
1 2 3 4 5 6 346/
G9. Writer 1 2 3 4 5 6 347/
G10. Science Teacher 1 2 3 4 5 6 348/
G11. Doctor 1 2 3 4 5 6 349/
G12. Athlete 1 2 3 4 5 6 350/
G13. Astronaut 1 2 3 4 5 6 351/
G14. Lawyer 1 2 3 4 5 6 352/
G15. Construction Worker 1 2 3 4 5 6 353/
G16. Business Person 1 2 3 4 5 6 354/
G17. Police Officer 1 2 3 4 5 6 355/
Please go to the next page.
OMB Control No. 2700-0136
14
G18. Are any of your friends or family members scientists, engineers or mathematicians? You may check more than one box.
1 Mother/Stepmother 4 Aunt/Uncle 7 Grandparent
2 Father/Stepfather 5 Brother/Sister 8 Family Friend/Neighbor
3 Foster Parent 6 Friend’s Parent 9 Cousin 356/
357/ 358/ 359/ 360/ 361/ 362/ 363/ 364/
G19. Did your parent or another adult help you do this survey? Check the answer that best
describes how much help you got with this survey. Check only one box.
1 Yes, they helped me do almost all of the survey.
2 Yes, they helped me do some of the survey.
3 Yes, they helped me do 1 or 2 things on the survey.
4 No, I did all of the survey on my own. 365/
Thank you for completing the survey!
Put your survey in the envelope labeled “Student Survey” and seal it closed.
Then give the envelope to your parent.

THIS PAGE INTENTIONALLY BLANK
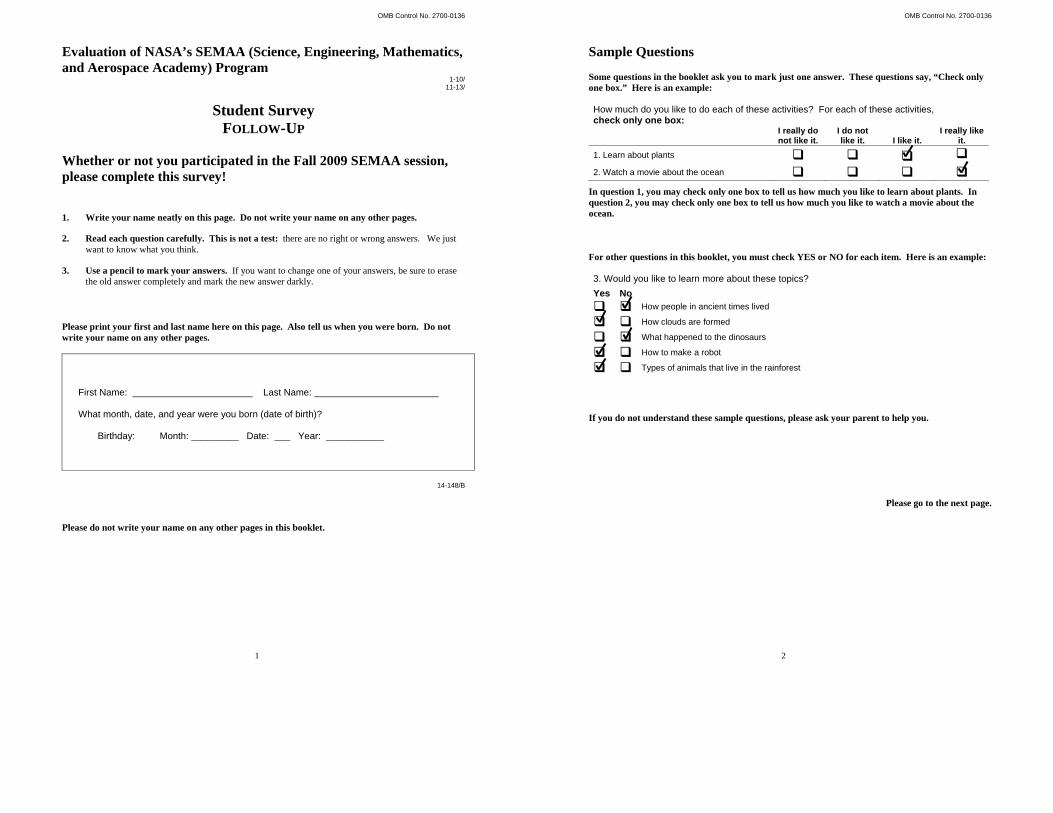
OMB Control No. 2700-0136
1
Evaluation of NASA’s SEMAA (Science, Engineering, Mathematics, and Aerospace Academy) Program
1-10/ 11-13/
Student Survey FOLLOW-UP
Whether or not you participated in the Fall 2009 SEMAA session, please complete this survey! 1. Write your name neatly on this page. Do not write your name on any other pages.
2. Read each question carefully. This is not a test: there are no right or wrong answers. We just want to know what you think.
3. Use a pencil to mark your answers. If you want to change one of your answers, be sure to erase the old answer completely and mark the new answer darkly.
Please print your first and last name here on this page. Also tell us when you were born. Do not write your name on any other pages.
First Name: Last Name: What month, date, and year were you born (date of birth)?
Birthday: Month: _________ Date: ___ Year: ___________
14-148/B
Please do not write your name on any other pages in this booklet.
OMB Control No. 2700-0136
2
Sample Questions Some questions in the booklet ask you to mark just one answer. These questions say, “Check only one box.” Here is an example:
How much do you like to do each of these activities? For each of these activities, check only one box:
I really do not like it.
I do not like it. I like it.
I really like it.
1. Learn about plants 2. Watch a movie about the ocean
In question 1, you may check only one box to tell us how much you like to learn about plants. In question 2, you may check only one box to tell us how much you like to watch a movie about the ocean. For other questions in this booklet, you must check YES or NO for each item. Here is an example: 3. Would you like to learn more about these topics?
Yes No
How people in ancient times lived
How clouds are formed
What happened to the dinosaurs
How to make a robot
Types of animals that live in the rainforest
If you do not understand these sample questions, please ask your parent to help you. Please go to the next page.
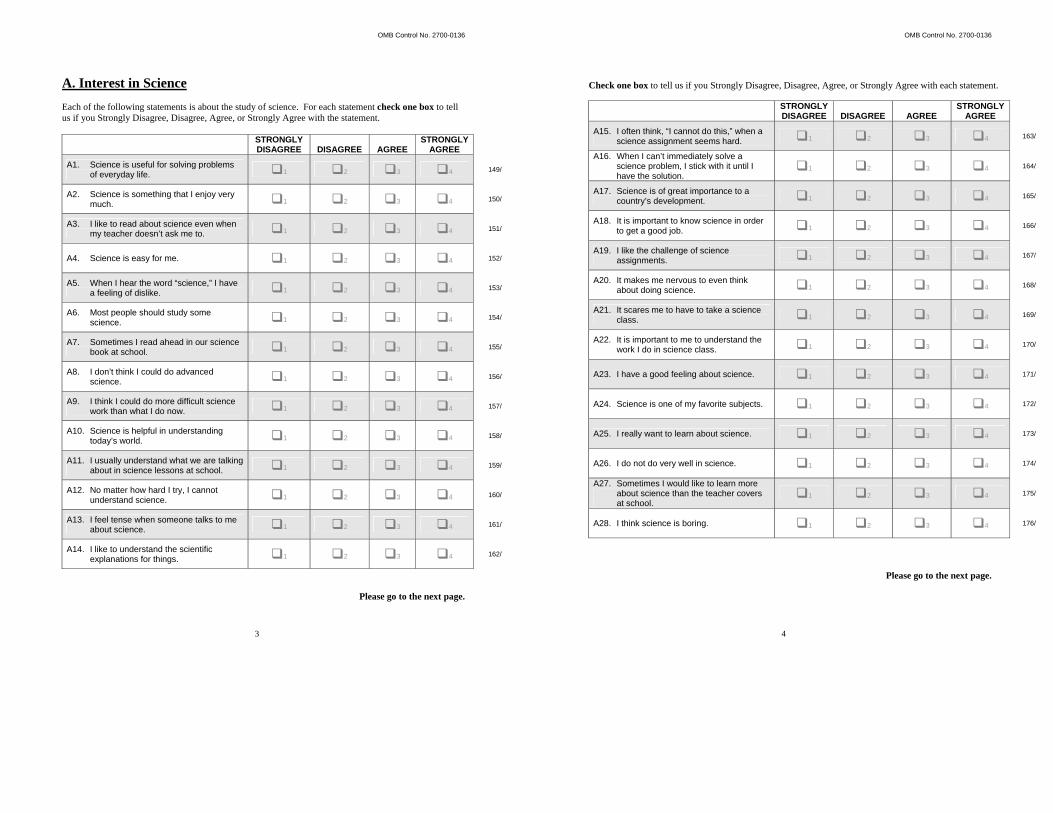
OMB Control No. 2700-0136
3
A. Interest in Science Each of the following statements is about the study of science. For each statement check one box to tell us if you Strongly Disagree, Disagree, Agree, or Strongly Agree with the statement.
STRONGLY DISAGREE DISAGREE AGREE
STRONGLY AGREE
A1. Science is useful for solving problems of everyday life. 1 2 3 4 149/
A2. Science is something that I enjoy very much. 1 2 3 4 150/
A3. I like to read about science even when my teacher doesn’t ask me to. 1 2 3 4 151/
A4. Science is easy for me. 1 2 3 4 152/
A5. When I hear the word “science,” I have a feeling of dislike. 1 2 3 4 153/
A6. Most people should study some science. 1 2 3 4 154/
A7. Sometimes I read ahead in our science book at school. 1 2 3 4 155/
A8. I don’t think I could do advanced science. 1 2 3 4 156/
A9. I think I could do more difficult science work than what I do now. 1 2 3 4 157/
A10. Science is helpful in understanding today’s world. 1 2 3 4 158/
A11. I usually understand what we are talking about in science lessons at school. 1 2 3 4 159/
A12. No matter how hard I try, I cannot understand science. 1 2 3 4 160/
A13. I feel tense when someone talks to me about science. 1 2 3 4 161/
A14. I like to understand the scientific explanations for things. 1 2 3 4 162/
Please go to the next page.
OMB Control No. 2700-0136
4
Check one box to tell us if you Strongly Disagree, Disagree, Agree, or Strongly Agree with each statement.
STRONGLY DISAGREE DISAGREE AGREE
STRONGLY AGREE
A15. I often think, “I cannot do this,” when a science assignment seems hard. 1 2 3 4 163/
A16. When I can’t immediately solve a science problem, I stick with it until I have the solution.
1 2 3 4 164/
A17. Science is of great importance to a country’s development. 1 2 3 4 165/
A18. It is important to know science in order to get a good job. 1 2 3 4 166/
A19. I like the challenge of science assignments. 1 2 3 4 167/
A20. It makes me nervous to even think about doing science. 1 2 3 4 168/
A21. It scares me to have to take a science class. 1 2 3 4 169/
A22. It is important to me to understand the work I do in science class. 1 2 3 4 170/
A23. I have a good feeling about science. 1 2 3 4 171/
A24. Science is one of my favorite subjects. 1 2 3 4 172/
A25. I really want to learn about science. 1 2 3 4 173/
A26. I do not do very well in science. 1 2 3 4 174/
A27. Sometimes I would like to learn more about science than the teacher covers at school.
1 2 3 4 175/
A28. I think science is boring. 1 2 3 4 176/
Please go to the next page.
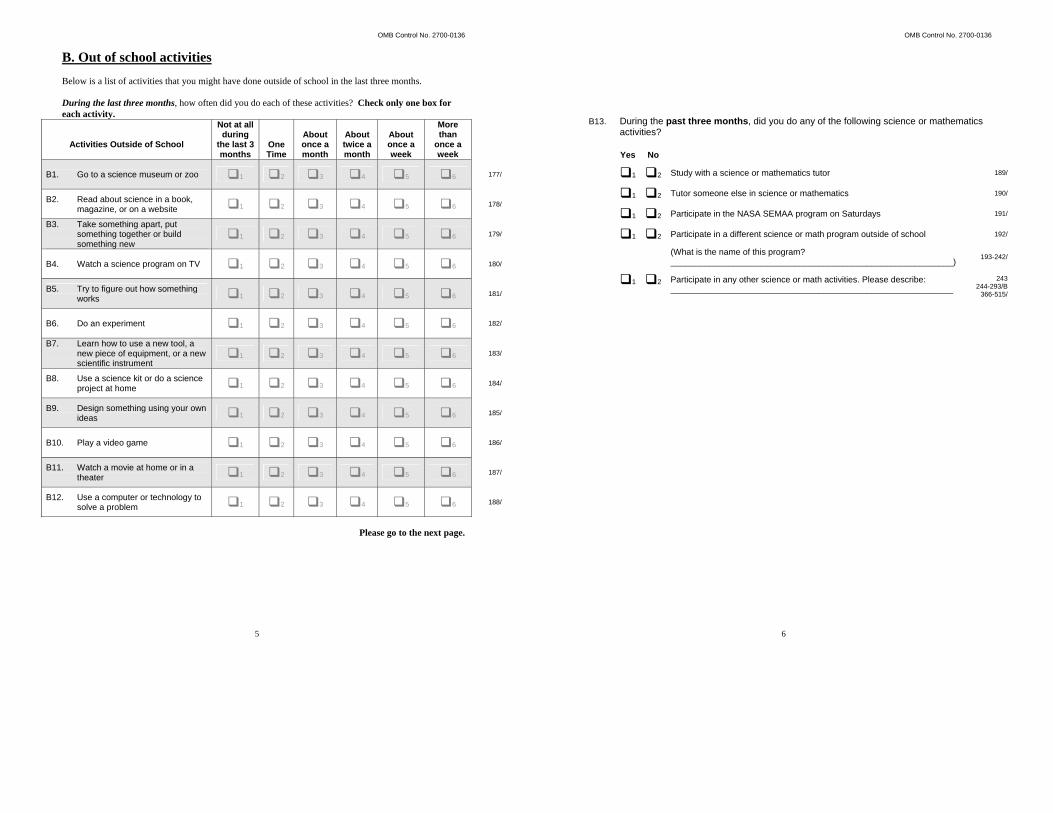
OMB Control No. 2700-0136
5
B. Out of school activities Below is a list of activities that you might have done outside of school in the last three months. During the last three months, how often did you do each of these activities? Check only one box for each activity.
Activities Outside of School
Not at all during
the last 3 months
One Time
About once a month
About twice a month
About once a week
More than
once a week
B1. Go to a science museum or zoo 1 2 3 4 5 6 177/
B2. Read about science in a book, magazine, or on a website 1 2 3 4 5 6 178/
B3. Take something apart, put something together or build something new
1 2 3 4 5 6 179/
B4. Watch a science program on TV 1 2 3 4 5 6 180/
B5. Try to figure out how something works 1 2 3 4 5 6 181/
B6. Do an experiment 1 2 3 4 5 6 182/
B7. Learn how to use a new tool, a new piece of equipment, or a new scientific instrument
1 2 3 4 5 6 183/
B8. Use a science kit or do a science project at home 1 2 3 4 5 6 184/
B9. Design something using your own ideas 1 2 3 4 5 6 185/
B10. Play a video game 1 2 3 4 5 6 186/
B11. Watch a movie at home or in a theater 1 2 3 4 5 6 187/
B12. Use a computer or technology to solve a problem 1 2 3 4 5 6 188/
Please go to the next page.
OMB Control No. 2700-0136
6
B13. During the past three months, did you do any of the following science or mathematics activities?
Yes No
1 2 Study with a science or mathematics tutor 189/
1 2 Tutor someone else in science or mathematics 190/
1 2 Participate in the NASA SEMAA program on Saturdays 191/
1 2 Participate in a different science or math program outside of school 192/
(What is the name of this program? ___________________________________________________________)
193-242/
1 2 Participate in any other science or math activities. Please describe: ___________________________________________________________
243 244-293/B
366-515/
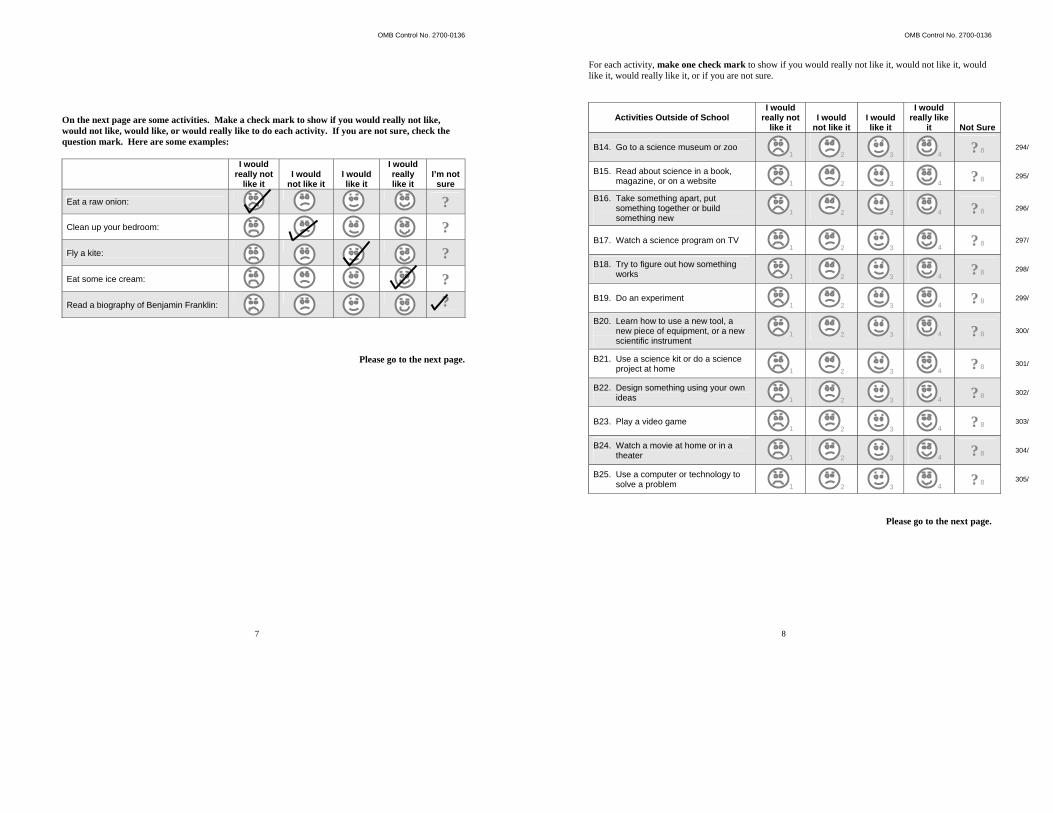
OMB Control No. 2700-0136
7
On the next page are some activities. Make a check mark to show if you would really not like, would not like, would like, or would really like to do each activity. If you are not sure, check the question mark. Here are some examples:
I would
really not like it
I would not like it
I would like it
I would really like it
I’m not sure
Eat a raw onion: ?
Clean up your bedroom: ?
Fly a kite: ?
Eat some ice cream: ?
Read a biography of Benjamin Franklin: ?
Please go to the next page.
OMB Control No. 2700-0136
8
For each activity, make one check mark to show if you would really not like it, would not like it, would like it, would really like it, or if you are not sure.
Activities Outside of School I would
really not like it
I would not like it
I would like it
I would really like
it Not Sure
B14. Go to a science museum or zoo 1 2 3 4 ? 8 294/
B15. Read about science in a book, magazine, or on a website 1 2 3 4 ? 8 295/
B16. Take something apart, put something together or build something new
1 2 3 4 ? 8 296/
B17. Watch a science program on TV 1 2 3 4 ? 8 297/
B18. Try to figure out how something works 1 2 3 4 ? 8 298/
B19. Do an experiment 1 2 3 4 ? 8 299/
B20. Learn how to use a new tool, a new piece of equipment, or a new scientific instrument
1 2 3 4 ? 8 300/
B21. Use a science kit or do a science project at home 1 2 3 4 ? 8 301/
B22. Design something using your own ideas 1 2 3 4 ? 8 302/
B23. Play a video game 1 2 3 4 ? 8 303/
B24. Watch a movie at home or in a theater 1 2 3 4 ? 8 304/
B25. Use a computer or technology to solve a problem 1 2 3 4 ? 8 305/
Please go to the next page.
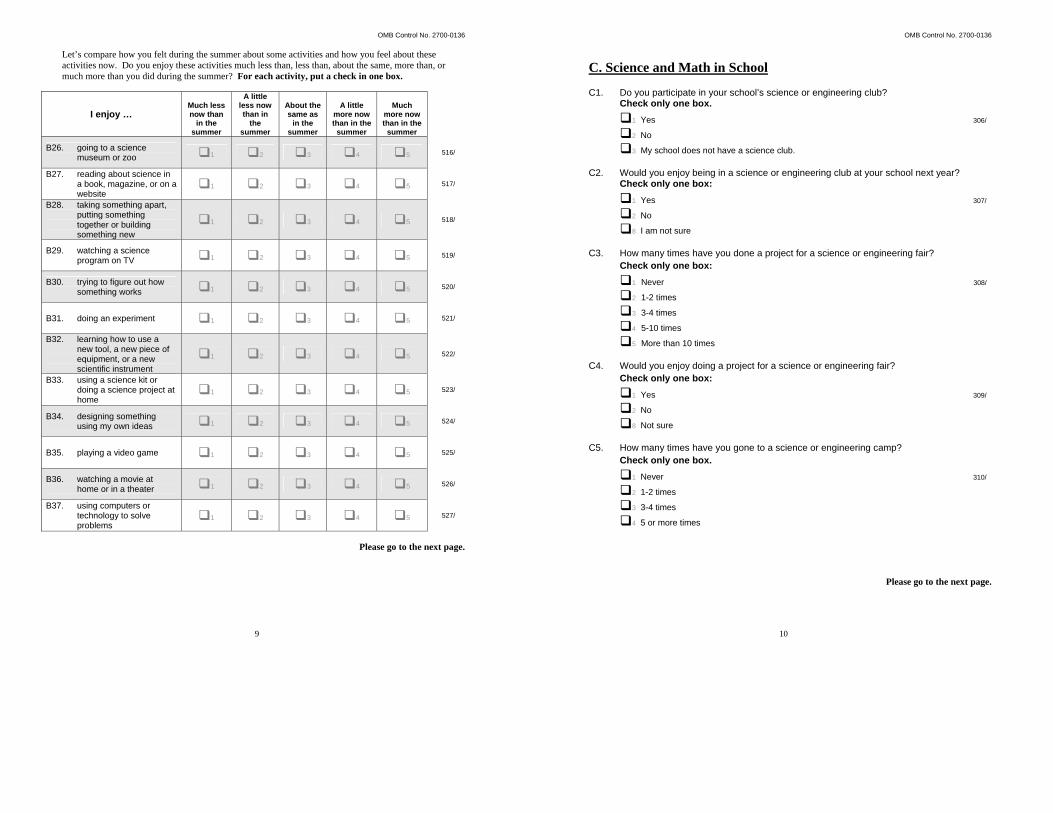
OMB Control No. 2700-0136
9
Let’s compare how you felt during the summer about some activities and how you feel about these activities now. Do you enjoy these activities much less than, less than, about the same, more than, or much more than you did during the summer? For each activity, put a check in one box.
I enjoy … Much less now than
in the summer
A little less now than in
the summer
About the same as
in the summer
A little more now than in the
summer
Much more now than in the
summer
B26. going to a science museum or zoo 1 2 3 4 5 516/
B27. reading about science in a book, magazine, or on a website
1 2 3 4 5 517/
B28. taking something apart, putting something together or building something new
1 2 3 4 5 518/
B29. watching a science program on TV 1 2 3 4 5 519/
B30. trying to figure out how something works 1 2 3 4 5 520/
B31. doing an experiment 1 2 3 4 5 521/
B32. learning how to use a new tool, a new piece of equipment, or a new scientific instrument
1 2 3 4 5 522/
B33. using a science kit or doing a science project at home
1 2 3 4 5 523/
B34. designing something using my own ideas 1 2 3 4 5 524/
B35. playing a video game 1 2 3 4 5 525/
B36. watching a movie at home or in a theater 1 2 3 4 5 526/
B37. using computers or technology to solve problems
1 2 3 4 5 527/
Please go to the next page.
OMB Control No. 2700-0136
10
C. Science and Math in School C1. Do you participate in your school’s science or engineering club? Check only one box.
1 Yes 306/
2 No
3 My school does not have a science club. C2. Would you enjoy being in a science or engineering club at your school next year?
Check only one box:
1 Yes 307/
2 No
8 I am not sure C3. How many times have you done a project for a science or engineering fair?
Check only one box:
1 Never 308/
2 1-2 times
3 3-4 times
4 5-10 times
5 More than 10 times C4. Would you enjoy doing a project for a science or engineering fair?
Check only one box:
1 Yes 309/
2 No
8 Not sure C5. How many times have you gone to a science or engineering camp?
Check only one box.
1 Never 310/
2 1-2 times
3 3-4 times
4 5 or more times
Please go to the next page.
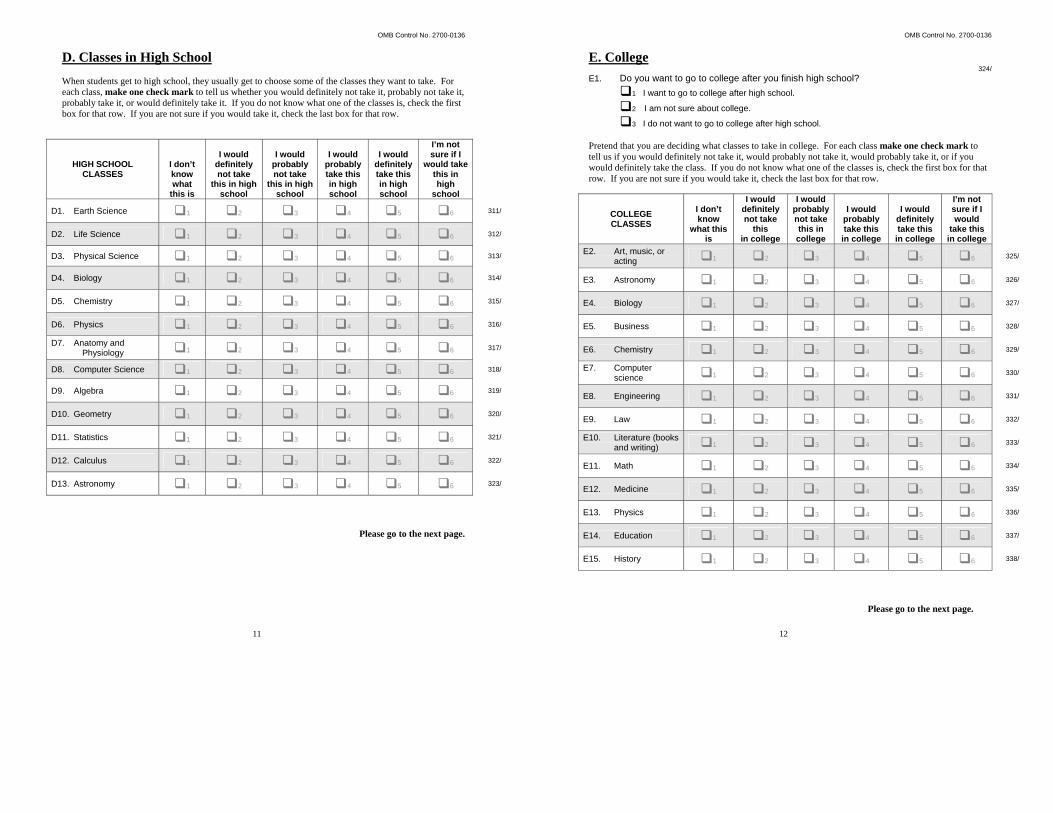
OMB Control No. 2700-0136
11
D. Classes in High School When students get to high school, they usually get to choose some of the classes they want to take. For each class, make one check mark to tell us whether you would definitely not take it, probably not take it, probably take it, or would definitely take it. If you do not know what one of the classes is, check the first box for that row. If you are not sure if you would take it, check the last box for that row.
HIGH SCHOOL CLASSES
I don’t know what
this is
I would definitely not take
this in high school
I would probably not take
this in high school
I would probably take this in high school
I would definitely take this in high school
I’m not sure if I
would take this in high
school
D1. Earth Science 1 2 3 4 5 6 311/
D2. Life Science 1 2 3 4 5 6 312/
D3. Physical Science 1 2 3 4 5 6 313/
D4. Biology 1 2 3 4 5 6 314/
D5. Chemistry 1 2 3 4 5 6 315/
D6. Physics 1 2 3 4 5 6 316/ D7. Anatomy and
Physiology 1 2 3 4 5 6 317/
D8. Computer Science 1 2 3 4 5 6 318/
D9. Algebra 1 2 3 4 5 6 319/
D10. Geometry 1 2 3 4 5 6 320/
D11. Statistics 1 2 3 4 5 6 321/
D12. Calculus 1 2 3 4 5 6 322/
D13. Astronomy 1 2 3 4 5 6 323/
Please go to the next page.
OMB Control No. 2700-0136
12
E. College 324/
E1. Do you want to go to college after you finish high school?
1 I want to go to college after high school.
2 I am not sure about college.
3 I do not want to go to college after high school. Pretend that you are deciding what classes to take in college. For each class make one check mark to tell us if you would definitely not take it, would probably not take it, would probably take it, or if you would definitely take the class. If you do not know what one of the classes is, check the first box for that row. If you are not sure if you would take it, check the last box for that row.
COLLEGE CLASSES
I don’t know
what this is
I would definitely not take
this in college
I would probably not take this in college
I would probably take this
in college
I would definitely take this in college
I’m not sure if I would
take this in college
E2. Art, music, or acting 1 2 3 4 5 6 325/
E3. Astronomy 1 2 3 4 5 6 326/
E4. Biology 1 2 3 4 5 6 327/
E5. Business 1 2 3 4 5 6 328/
E6. Chemistry 1 2 3 4 5 6 329/ E7. Computer
science 1 2 3 4 5 6 330/
E8. Engineering 1 2 3 4 5 6 331/
E9. Law 1 2 3 4 5 6 332/ E10. Literature (books
and writing) 1 2 3 4 5 6 333/
E11. Math 1 2 3 4 5 6 334/
E12. Medicine 1 2 3 4 5 6 335/
E13. Physics 1 2 3 4 5 6 336/
E14. Education 1 2 3 4 5 6 337/
E15. History 1 2 3 4 5 6 338/
Please go to the next page.
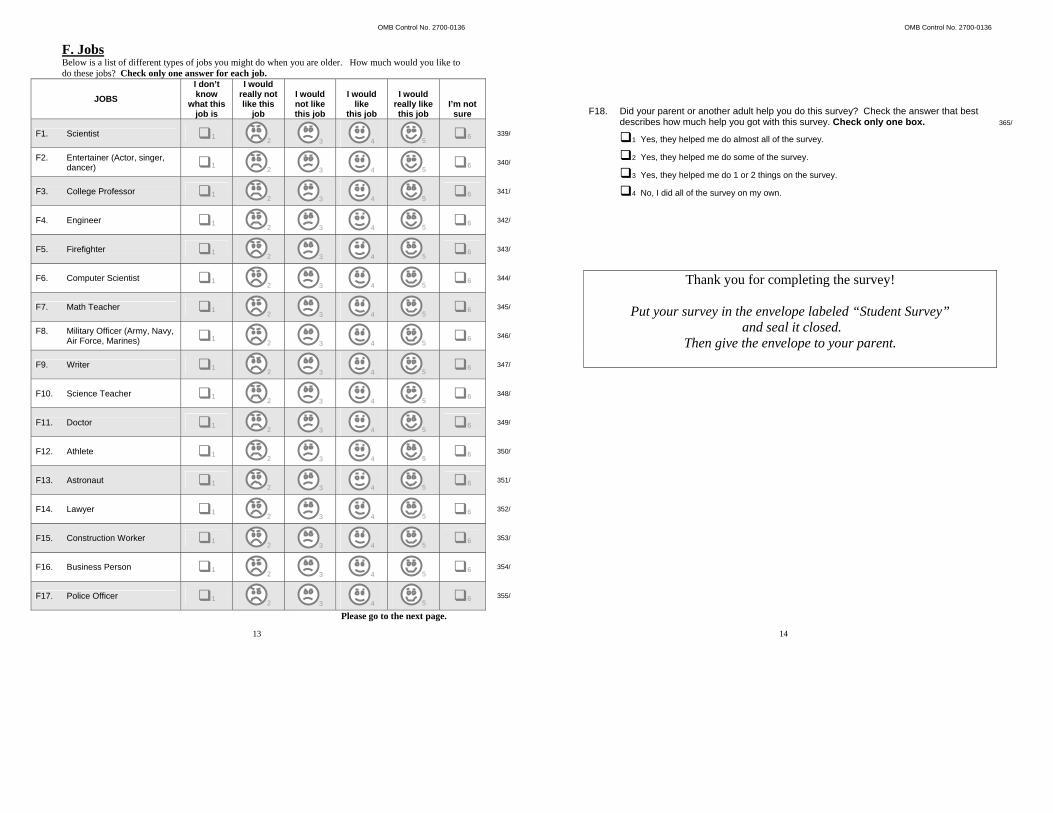
OMB Control No. 2700-0136
13
F. Jobs Below is a list of different types of jobs you might do when you are older. How much would you like to do these jobs? Check only one answer for each job.
JOBS
I don’t know
what this job is
I would really not like this
job
I would not like this job
I would like
this job
I would really like this job
I’m not sure
F1. Scientist 1 2 3 4 5 6 339/
F2. Entertainer (Actor, singer, dancer) 1
2 3 4 5 6 340/
F3. College Professor 1 2 3 4 5 6 341/
F4. Engineer 1 2 3 4 5 6 342/
F5. Firefighter 1 2 3 4 5 6 343/
F6. Computer Scientist 1 2 3 4 5 6 344/
F7. Math Teacher 1 2 3 4 5 6 345/
F8. Military Officer (Army, Navy, Air Force, Marines) 1
2 3 4 5 6 346/
F9. Writer 1 2 3 4 5 6 347/
F10. Science Teacher 1 2 3 4 5 6 348/
F11. Doctor 1 2 3 4 5 6 349/
F12. Athlete 1 2 3 4 5 6 350/
F13. Astronaut 1 2 3 4 5 6 351/
F14. Lawyer 1 2 3 4 5 6 352/
F15. Construction Worker 1 2 3 4 5 6 353/
F16. Business Person 1 2 3 4 5 6 354/
F17. Police Officer 1 2 3 4 5 6 355/
Please go to the next page.
OMB Control No. 2700-0136
14
F18. Did your parent or another adult help you do this survey? Check the answer that best
describes how much help you got with this survey. Check only one box. 365/
1 Yes, they helped me do almost all of the survey.
2 Yes, they helped me do some of the survey.
3 Yes, they helped me do 1 or 2 things on the survey.
4 No, I did all of the survey on my own.
Thank you for completing the survey!
Put your survey in the envelope labeled “Student Survey” and seal it closed.
Then give the envelope to your parent.

THIS PAGE INTENTIONALLY BLANK
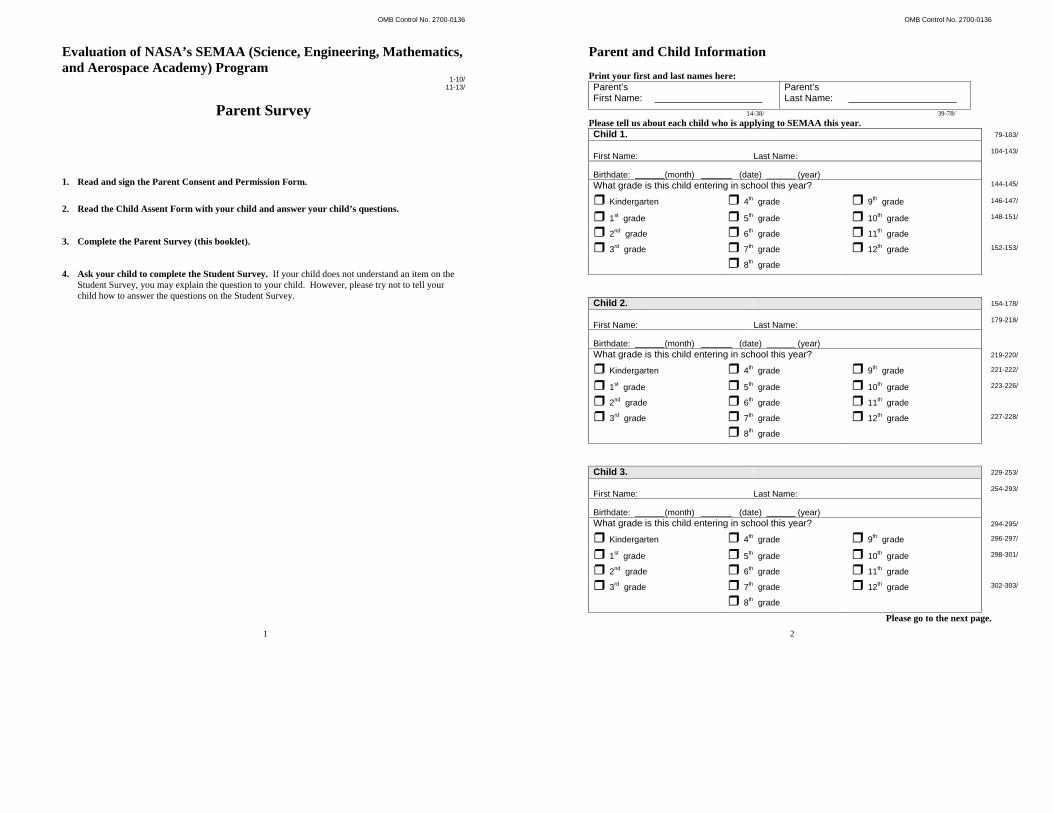
OMB Control No. 2700-0136
1
Evaluation of NASA’s SEMAA (Science, Engineering, Mathematics, and Aerospace Academy) Program
1-10/ 11-13/
Parent Survey
1. Read and sign the Parent Consent and Permission Form.
2. Read the Child Assent Form with your child and answer your child’s questions. 3. Complete the Parent Survey (this booklet). 4. Ask your child to complete the Student Survey. If your child does not understand an item on the
Student Survey, you may explain the question to your child. However, please try not to tell your child how to answer the questions on the Student Survey.
OMB Control No. 2700-0136
2
Parent and Child Information Print your first and last names here: Parent’s First Name:
Parent’s Last Name:
14-38/ 39-78/
Please tell us about each child who is applying to SEMAA this year. Child 1. 79-103/
First Name: Last Name:
104-143/
Birthdate: (month) (date) ______ (year)
What grade is this child entering in school this year? 144-145/
Kindergarten 4th grade 9th grade 146-147/
1st grade 5th grade 10th grade 148-151/
2nd grade 6th grade 11th grade
3rd grade 7th grade 12th grade 152-153/
8th grade
Child 2. 154-178/
First Name: Last Name:
179-218/
Birthdate: (month) (date) ______ (year)
What grade is this child entering in school this year? 219-220/
Kindergarten 4th grade 9th grade 221-222/
1st grade 5th grade 10th grade 223-226/
2nd grade 6th grade 11th grade
3rd grade 7th grade 12th grade 227-228/
8th grade
Child 3. 229-253/
First Name: Last Name:
254-293/
Birthdate: (month) (date) ______ (year)
What grade is this child entering in school this year? 294-295/
Kindergarten 4th grade 9th grade 296-297/
1st grade 5th grade 10th grade 298-301/
2nd grade 6th grade 11th grade
3rd grade 7th grade 12th grade 302-303/
8th grade Please go to the next page.
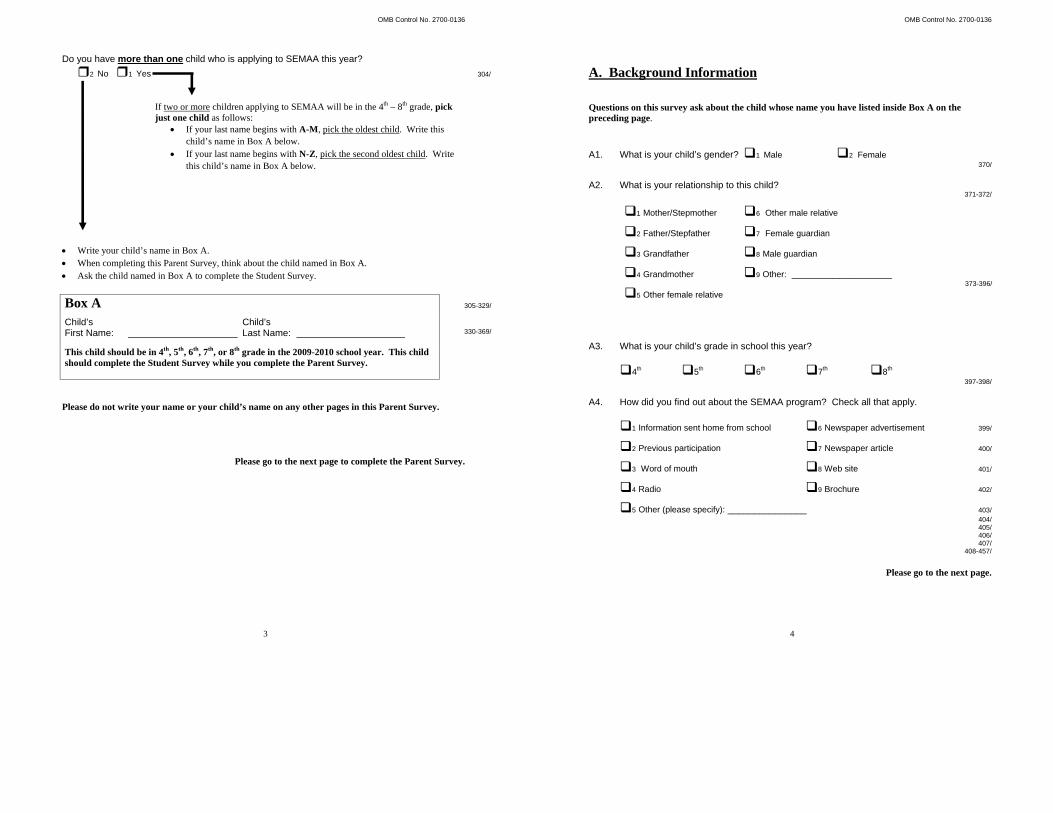
OMB Control No. 2700-0136
3
Do you have more than one child who is applying to SEMAA this year?
2 No 1 Yes 304/
If two or more children applying to SEMAA will be in the 4th – 8th grade, pick just one child as follows:
If your last name begins with A-M, pick the oldest child. Write this child’s name in Box A below.
If your last name begins with N-Z, pick the second oldest child. Write this child’s name in Box A below.
Write your child’s name in Box A. When completing this Parent Survey, think about the child named in Box A. Ask the child named in Box A to complete the Student Survey.
Box A
305-329/
Child’s First Name:
Child’s Last Name: 330-369/
This child should be in 4th, 5th, 6th, 7th, or 8th grade in the 2009-2010 school year. This child should complete the Student Survey while you complete the Parent Survey.
Please do not write your name or your child’s name on any other pages in this Parent Survey.
Please go to the next page to complete the Parent Survey.
OMB Control No. 2700-0136
4
A. Background Information Questions on this survey ask about the child whose name you have listed inside Box A on the preceding page.
A1. What is your child’s gender? 1 Male 2 Female 370/
A2. What is your relationship to this child?
371-372/
1 Mother/Stepmother
2 Father/Stepfather
3 Grandfather
4 Grandmother
5 Other female relative
6 Other male relative
7 Female guardian
8 Male guardian
9 Other: ___________________
373-396/
A3. What is your child’s grade in school this year?
4th 5th 6th 7th 8th 397-398/
A4. How did you find out about the SEMAA program? Check all that apply.
1 Information sent home from school 6 Newspaper advertisement 399/
2 Previous participation 7 Newspaper article 400/
3 Word of mouth 8 Web site 401/
4 Radio 9 Brochure 402/
5 Other (please specify): _______________ 403/ 404/ 405/ 406/ 407/ 408-457/
Please go to the next page.
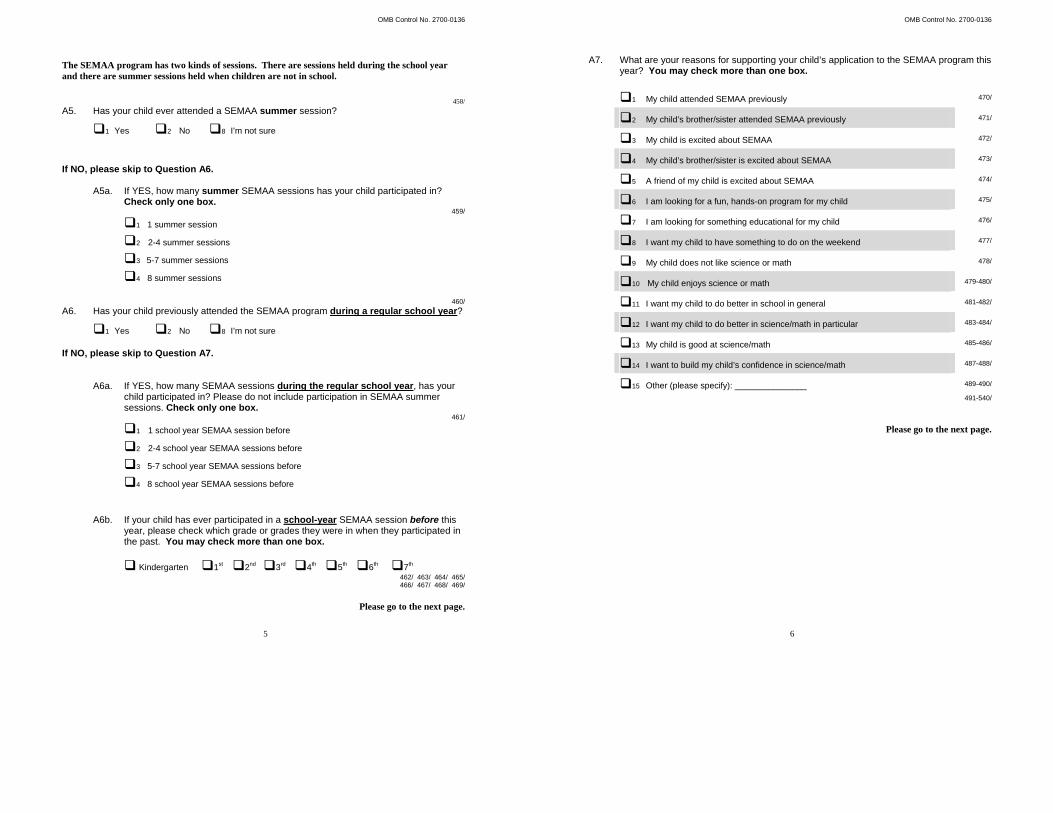
OMB Control No. 2700-0136
5
The SEMAA program has two kinds of sessions. There are sessions held during the school year and there are summer sessions held when children are not in school.
458/
A5. Has your child ever attended a SEMAA summer session?
1 Yes 2 No 8 I’m not sure
If NO, please skip to Question A6.
A5a. If YES, how many summer SEMAA sessions has your child participated in? Check only one box.
459/
1 1 summer session
2 2-4 summer sessions
3 5-7 summer sessions
4 8 summer sessions
460/
A6. Has your child previously attended the SEMAA program during a regular school year?
1 Yes 2 No 8 I’m not sure
If NO, please skip to Question A7.
A6a. If YES, how many SEMAA sessions during the regular school year, has your child participated in? Please do not include participation in SEMAA summer sessions. Check only one box.
461/
1 1 school year SEMAA session before
2 2-4 school year SEMAA sessions before
3 5-7 school year SEMAA sessions before
4 8 school year SEMAA sessions before
A6b. If your child has ever participated in a school-year SEMAA session before this year, please check which grade or grades they were in when they participated in the past. You may check more than one box.
Kindergarten 1st 2nd 3rd 4th 5th 6th 7th 462/ 463/ 464/ 465/ 466/ 467/ 468/ 469/
Please go to the next page.
OMB Control No. 2700-0136
6
A7. What are your reasons for supporting your child’s application to the SEMAA program this
year? You may check more than one box.
1 My child attended SEMAA previously 470/
2 My child’s brother/sister attended SEMAA previously 471/
3 My child is excited about SEMAA 472/
4 My child’s brother/sister is excited about SEMAA 473/
5 A friend of my child is excited about SEMAA 474/
6 I am looking for a fun, hands-on program for my child 475/
7 I am looking for something educational for my child 476/
8 I want my child to have something to do on the weekend 477/
9 My child does not like science or math 478/
10 My child enjoys science or math 479-480/
11 I want my child to do better in school in general 481-482/
12 I want my child to do better in science/math in particular 483-484/
13 My child is good at science/math 485-486/
14 I want to build my child’s confidence in science/math 487-488/
15 Other (please specify): _______________ 489-490/
491-540/
Please go to the next page.
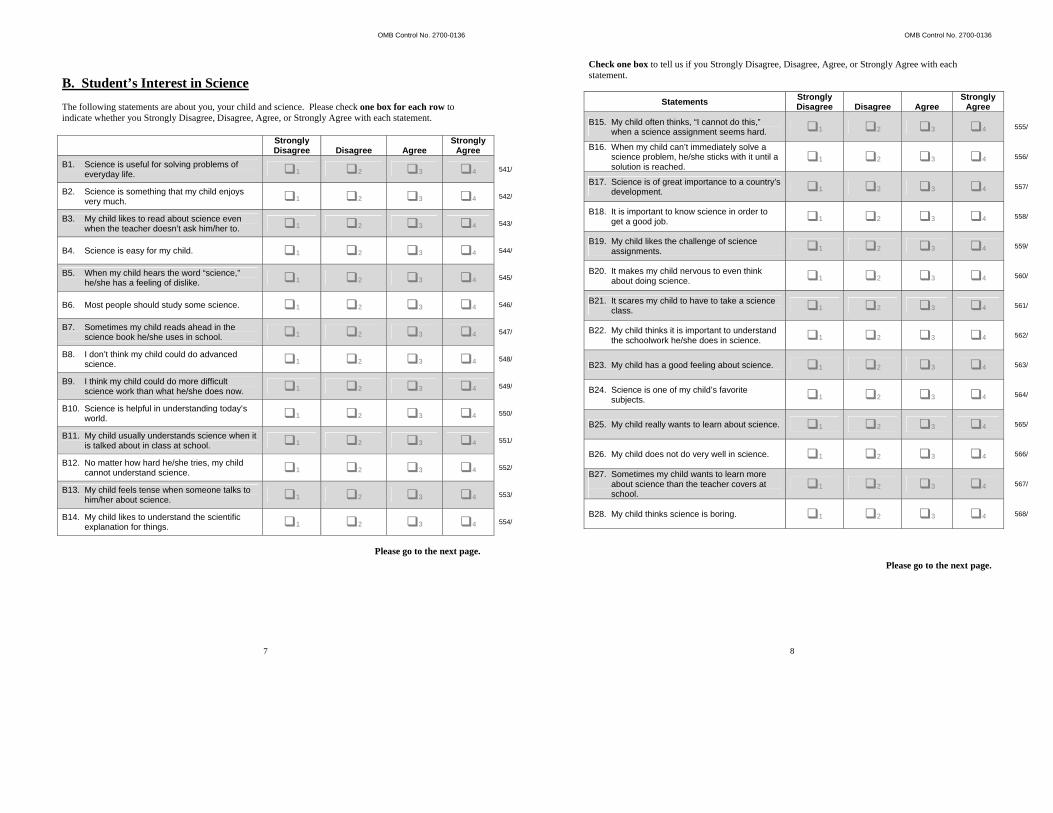
OMB Control No. 2700-0136
7
B. Student’s Interest in Science The following statements are about you, your child and science. Please check one box for each row to indicate whether you Strongly Disagree, Disagree, Agree, or Strongly Agree with each statement.
Strongly Disagree
Disagree
Agree
Strongly Agree
B1. Science is useful for solving problems of everyday life. 1 2 3 4 541/
B2. Science is something that my child enjoys very much. 1 2 3 4 542/
B3. My child likes to read about science even when the teacher doesn’t ask him/her to. 1 2 3 4 543/
B4. Science is easy for my child. 1 2 3 4 544/
B5. When my child hears the word “science,” he/she has a feeling of dislike. 1 2 3 4 545/
B6. Most people should study some science. 1 2 3 4 546/
B7. Sometimes my child reads ahead in the science book he/she uses in school. 1 2 3 4 547/
B8. I don’t think my child could do advanced science. 1 2 3 4 548/
B9. I think my child could do more difficult science work than what he/she does now. 1 2 3 4 549/
B10. Science is helpful in understanding today’s world. 1 2 3 4 550/
B11. My child usually understands science when it is talked about in class at school. 1 2 3 4 551/
B12. No matter how hard he/she tries, my child cannot understand science. 1 2 3 4 552/
B13. My child feels tense when someone talks to him/her about science. 1 2 3 4 553/
B14. My child likes to understand the scientific explanation for things. 1 2 3 4 554/
Please go to the next page.
OMB Control No. 2700-0136
8
Check one box to tell us if you Strongly Disagree, Disagree, Agree, or Strongly Agree with each statement.
Statements Strongly Disagree
Disagree
Agree
Strongly Agree
B15. My child often thinks, “I cannot do this,” when a science assignment seems hard. 1 2 3 4 555/
B16. When my child can’t immediately solve a science problem, he/she sticks with it until a solution is reached.
1 2 3 4 556/
B17. Science is of great importance to a country’s development. 1 2 3 4 557/
B18. It is important to know science in order to get a good job. 1 2 3 4 558/
B19. My child likes the challenge of science assignments. 1 2 3 4 559/
B20. It makes my child nervous to even think about doing science. 1 2 3 4 560/
B21. It scares my child to have to take a science class. 1 2 3 4 561/
B22. My child thinks it is important to understand the schoolwork he/she does in science. 1 2 3 4 562/
B23. My child has a good feeling about science. 1 2 3 4 563/
B24. Science is one of my child’s favorite subjects. 1 2 3 4 564/
B25. My child really wants to learn about science. 1 2 3 4 565/
B26. My child does not do very well in science. 1 2 3 4 566/
B27. Sometimes my child wants to learn more about science than the teacher covers at school.
1 2 3 4 567/
B28. My child thinks science is boring. 1 2 3 4 568/
Please go to the next page.
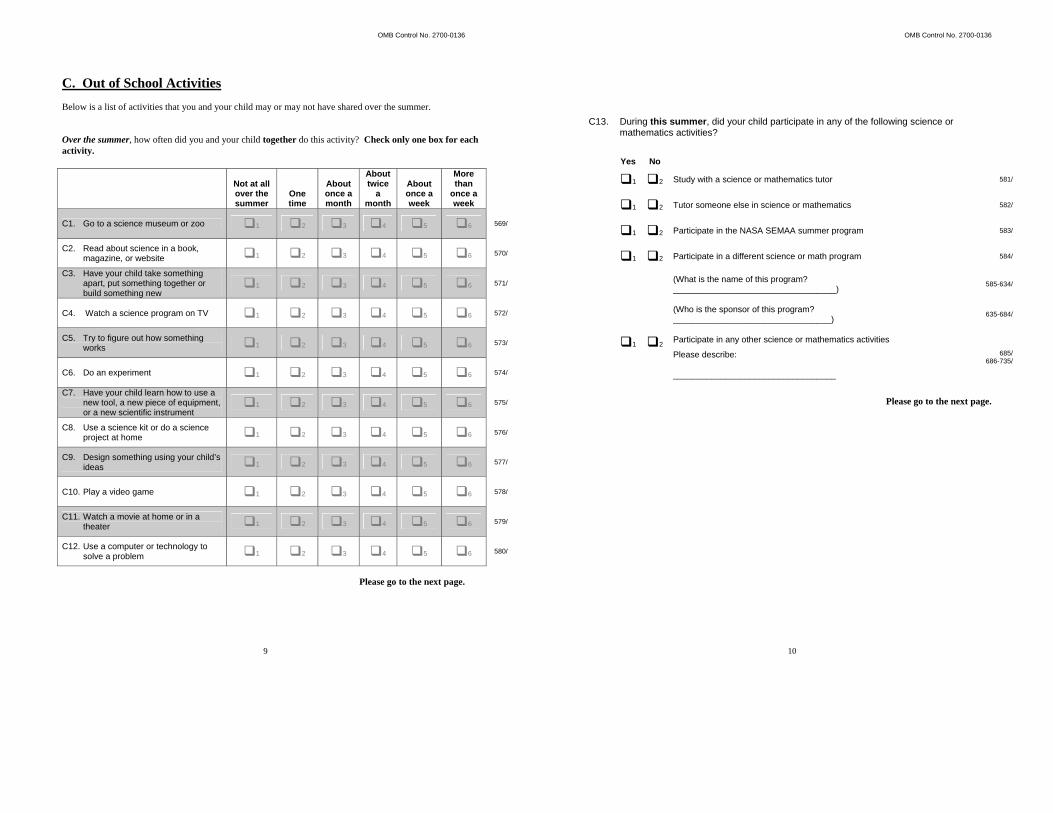
OMB Control No. 2700-0136
9
C. Out of School Activities Below is a list of activities that you and your child may or may not have shared over the summer. Over the summer, how often did you and your child together do this activity? Check only one box for each activity.
Please go to the next page.
Not at all over the summer
One time
About once a month
About twice
a month
About once a week
More than
once a week
C1. Go to a science museum or zoo 1 2 3 4 5 6 569/
C2. Read about science in a book, magazine, or website 1 2 3 4 5 6 570/
C3. Have your child take something apart, put something together or build something new
1 2 3 4 5 6 571/
C4. Watch a science program on TV 1 2 3 4 5 6 572/
C5. Try to figure out how something works 1 2 3 4 5 6 573/
C6. Do an experiment 1 2 3 4 5 6 574/
C7. Have your child learn how to use a new tool, a new piece of equipment, or a new scientific instrument
1 2 3 4 5 6 575/
C8. Use a science kit or do a science project at home 1 2 3 4 5 6 576/
C9. Design something using your child’s ideas 1 2 3 4 5 6 577/
C10. Play a video game 1 2 3 4 5 6 578/
C11. Watch a movie at home or in a theater 1 2 3 4 5 6 579/
C12. Use a computer or technology to solve a problem 1 2 3 4 5 6 580/
OMB Control No. 2700-0136
10
C13. During this summer, did your child participate in any of the following science or mathematics activities?
Yes No
1 2 Study with a science or mathematics tutor 581/
1 2 Tutor someone else in science or mathematics 582/
1 2 Participate in the NASA SEMAA summer program 583/
1 2 Participate in a different science or math program 584/
(What is the name of this program? __________________________________)
585-634/
(Who is the sponsor of this program? _________________________________)
635-684/
1 2Participate in any other science or mathematics activities
Please describe:
__________________________________
685/ 686-735/
Please go to the next page.
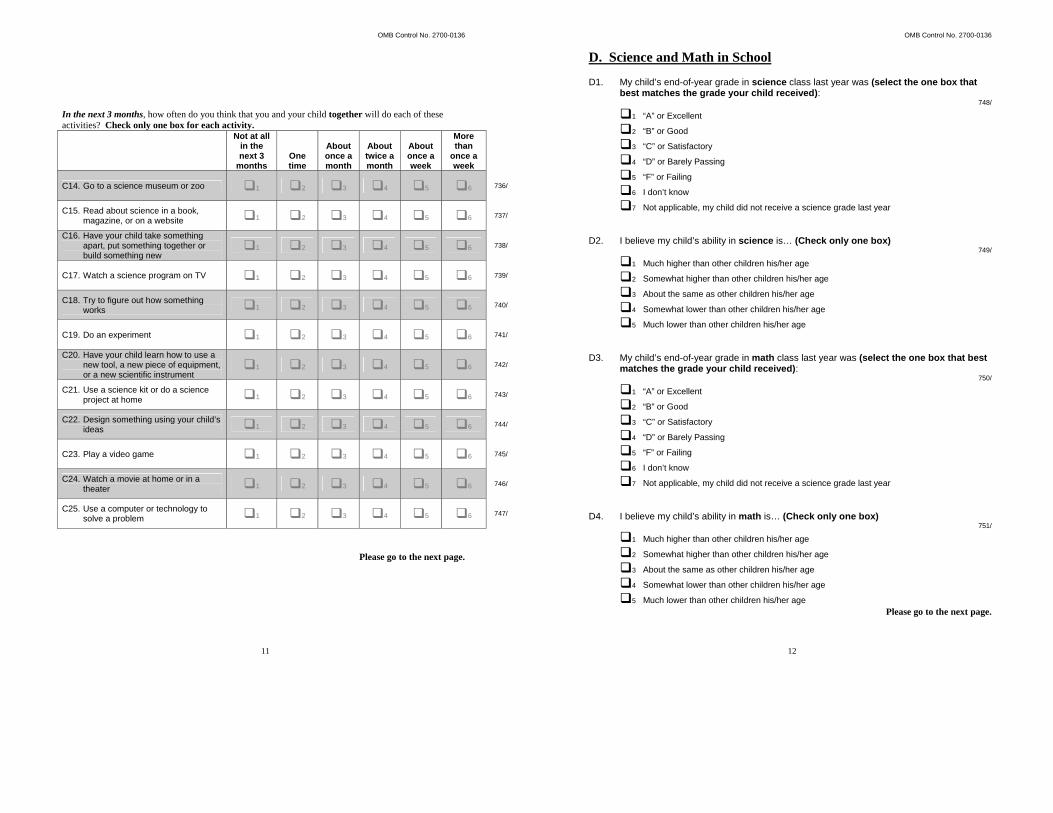
OMB Control No. 2700-0136
11
In the next 3 months, how often do you think that you and your child together will do each of these activities? Check only one box for each activity. Not at all
in the next 3
months One time
About once a month
About twice a month
About once a week
More than
once a week
C14. Go to a science museum or zoo 1 2 3 4 5 6 736/
C15. Read about science in a book, magazine, or on a website 1 2 3 4 5 6 737/
C16. Have your child take something apart, put something together or build something new
1 2 3 4 5 6 738/
C17. Watch a science program on TV 1 2 3 4 5 6 739/
C18. Try to figure out how something works 1 2 3 4 5 6 740/
C19. Do an experiment 1 2 3 4 5 6 741/
C20. Have your child learn how to use a new tool, a new piece of equipment, or a new scientific instrument
1 2 3 4 5 6 742/
C21. Use a science kit or do a science project at home 1 2 3 4 5 6 743/
C22. Design something using your child’s ideas 1 2 3 4 5 6 744/
C23. Play a video game 1 2 3 4 5 6 745/
C24. Watch a movie at home or in a theater 1 2 3 4 5 6 746/
C25. Use a computer or technology to solve a problem 1 2 3 4 5 6 747/
Please go to the next page.
OMB Control No. 2700-0136
12
D. Science and Math in School D1. My child’s end-of-year grade in science class last year was (select the one box that
best matches the grade your child received): 748/
1 “A” or Excellent
2 “B” or Good
3 “C” or Satisfactory
4 “D” or Barely Passing
5 “F” or Failing
6 I don’t know
7 Not applicable, my child did not receive a science grade last year D2. I believe my child’s ability in science is… (Check only one box)
749/
1 Much higher than other children his/her age
2 Somewhat higher than other children his/her age
3 About the same as other children his/her age
4 Somewhat lower than other children his/her age
5 Much lower than other children his/her age D3. My child’s end-of-year grade in math class last year was (select the one box that best
matches the grade your child received): 750/
1 “A” or Excellent
2 “B” or Good
3 “C” or Satisfactory
4 “D” or Barely Passing
5 “F” or Failing
6 I don’t know
7 Not applicable, my child did not receive a science grade last year D4. I believe my child’s ability in math is… (Check only one box)
751/
1 Much higher than other children his/her age
2 Somewhat higher than other children his/her age
3 About the same as other children his/her age
4 Somewhat lower than other children his/her age
5 Much lower than other children his/her age Please go to the next page.
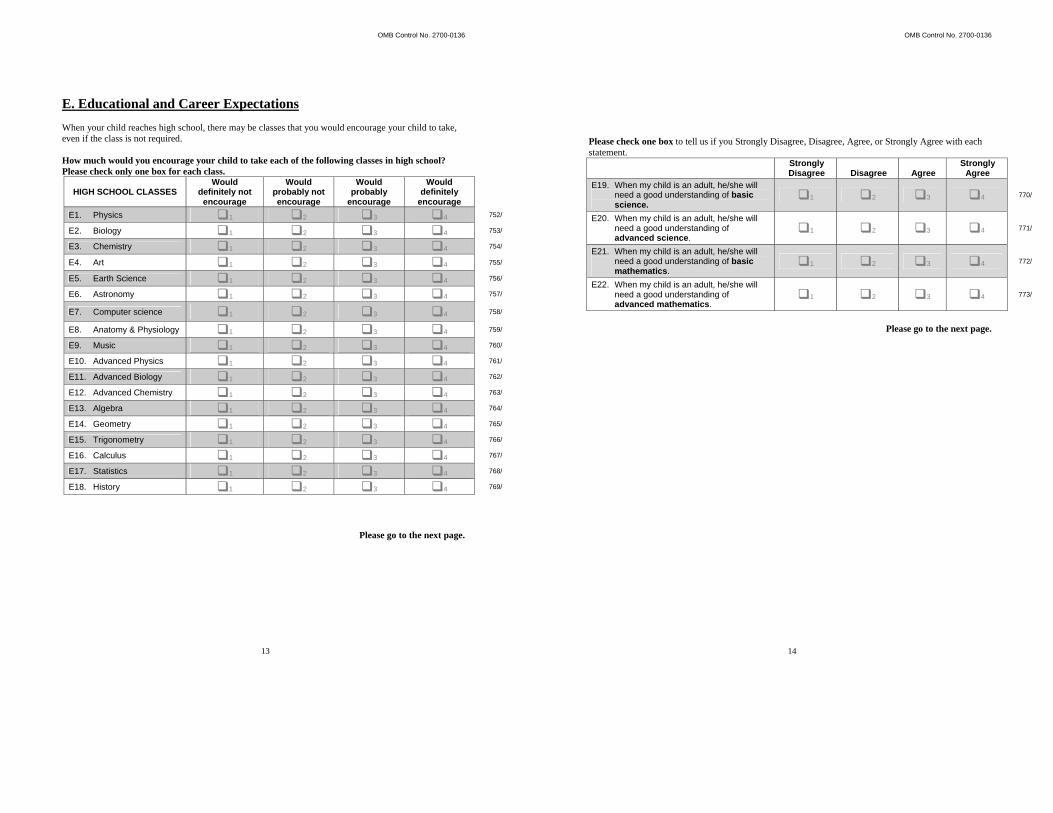
OMB Control No. 2700-0136
13
E. Educational and Career Expectations When your child reaches high school, there may be classes that you would encourage your child to take, even if the class is not required. How much would you encourage your child to take each of the following classes in high school? Please check only one box for each class.
HIGH SCHOOL CLASSES Would
definitely not encourage
Would probably not encourage
Would probably
encourage
Would definitely
encourage
E1. Physics 1 2 3 4 752/
E2. Biology 1 2 3 4 753/
E3. Chemistry 1 2 3 4 754/
E4. Art 1 2 3 4 755/
E5. Earth Science 1 2 3 4 756/
E6. Astronomy 1 2 3 4 757/
E7. Computer science 1 2 3 4 758/
E8. Anatomy & Physiology 1 2 3 4 759/
E9. Music 1 2 3 4 760/
E10. Advanced Physics 1 2 3 4 761/
E11. Advanced Biology 1 2 3 4 762/
E12. Advanced Chemistry 1 2 3 4 763/
E13. Algebra 1 2 3 4 764/
E14. Geometry 1 2 3 4 765/
E15. Trigonometry 1 2 3 4 766/
E16. Calculus 1 2 3 4 767/
E17. Statistics 1 2 3 4 768/
E18. History 1 2 3 4 769/
Please go to the next page.
OMB Control No. 2700-0136
14
Please check one box to tell us if you Strongly Disagree, Disagree, Agree, or Strongly Agree with each statement. Strongly
Disagree
Disagree
Agree Strongly
Agree
E19. When my child is an adult, he/she will need a good understanding of basic science.
1 2 3 4 770/
E20. When my child is an adult, he/she will need a good understanding of advanced science.
1 2 3 4 771/
E21. When my child is an adult, he/she will need a good understanding of basic mathematics.
1 2 3 4 772/
E22. When my child is an adult, he/she will need a good understanding of advanced mathematics.
1 2 3 4 773/
Please go to the next page.

OMB Control No. 2700-0136
15
If your child goes to college, he or she will have to choose a major field of study in which to earn a college degree. If your child were interested in many different fields, how much would you encourage your child to earn a degree in each of the following? Please check only one box for each type of degree.
COLLEGE DEGREE Would
definitely not encourage
Would probably not encourage
Would probably
encourage
Would definitely
encourage
E23. Physics 1 2 3 4 774/
E24. Biology 1 2 3 4 775/
E25. Computer science 1 2 3 4 776/
E26. Chemistry 1 2 3 4 777/
E27. Literature (books and writing) 1 2 3 4 778/
E28. History 1 2 3 4 779/
E29. Engineering 1 2 3 4 780/
E30. Mathematics 1 2 3 4 781/
E31. Art, music, or acting 1 2 3 4 782/
E32. Medicine 1 2 3 4 783/
E33. Business, accounting, or finance 1 2 3 4 784/
E34. Education 1 2 3 4 785/
E35. Law 1 2 3 4 786/
E36. Astronomy 1 2 3 4 787/
Please go to the next page.
OMB Control No. 2700-0136
16
Section F. About You and Your Child F1. What is your child’s ethnicity?
1 Hispanic or Latino 788/
2 Not Hispanic or Latino
3 Choose not to answer F2. What is your child’s race? Mark one or more:
1 American Indian or Alaska Native 789/
2 Asian 790/
3 Native Hawaiian or other Pacific Islander 791/
4 Black or African American 792/
5 White 793/
6 Choose not to answer 794/ F3. What language or languages do you and your child use at home? You may check
more than one box.
1 English 6 Russian 795/
2 Spanish 7 Arabic 796/
3 French 8 Chinese 797/
4 Italian 9 Other, please specify: _____________________804-828/ 798/
5 German 799/ 800/ 801/ 802/ 803/
F4. What language or languages does your child use at school? You may check more
than one box.
1 English 6 Russian 829/
2 Spanish 7 Arabic 830/
3 French 8 Chinese 831/
4 Italian 9 Other, please specify: _____________________838-862/ 832/
5 German 833/ 834/ 835/ 836/ 837/
Please go to the next page.
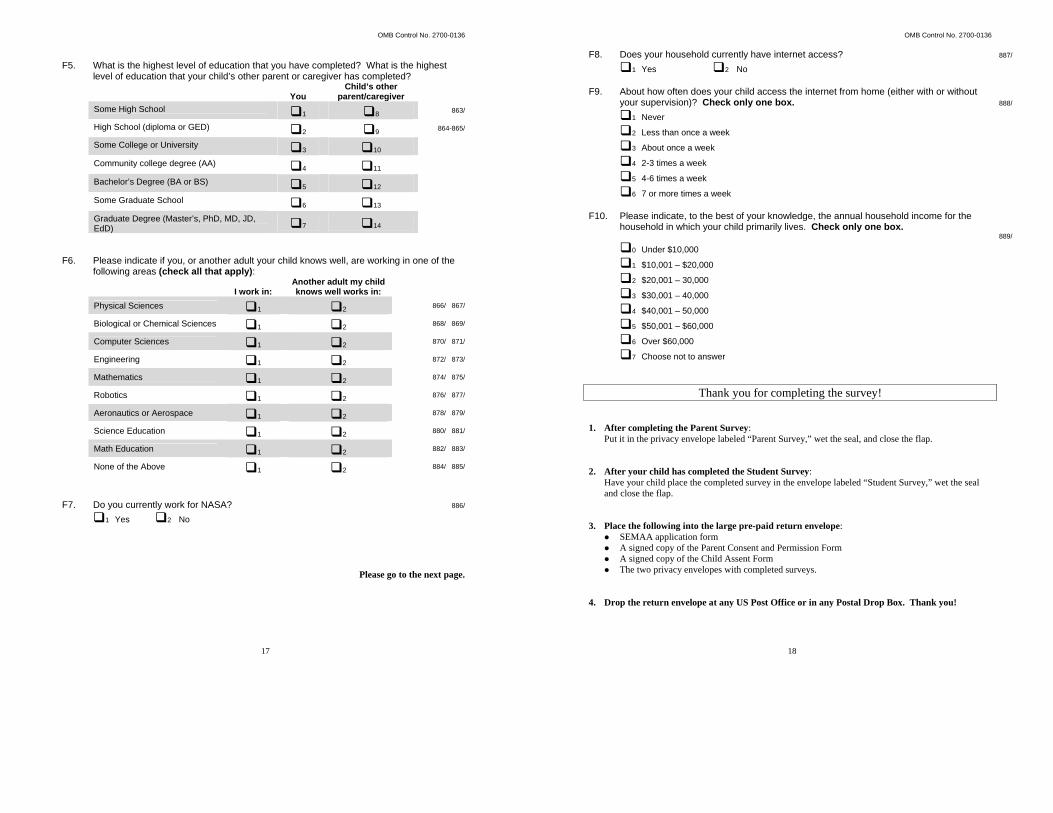
OMB Control No. 2700-0136
17
F5. What is the highest level of education that you have completed? What is the highest
level of education that your child’s other parent or caregiver has completed?
You Child’s other
parent/caregiver
Some High School 1 8 863/
High School (diploma or GED) 2 9 864-865/
Some College or University 3 10 Community college degree (AA) 4 11 Bachelor’s Degree (BA or BS) 5 12 Some Graduate School 6 13 Graduate Degree (Master’s, PhD, MD, JD, EdD) 7 14
F6. Please indicate if you, or another adult your child knows well, are working in one of the
following areas (check all that apply):
I work in: Another adult my child knows well works in:
Physical Sciences 1 2 866/ 867/
Biological or Chemical Sciences 1 2 868/ 869/
Computer Sciences 1 2 870/ 871/
Engineering 1 2 872/ 873/
Mathematics 1 2 874/ 875/
Robotics 1 2 876/ 877/
Aeronautics or Aerospace 1 2 878/ 879/
Science Education 1 2 880/ 881/
Math Education 1 2 882/ 883/
None of the Above 1 2 884/ 885/
F7. Do you currently work for NASA? 886/
1 Yes 2 No
Please go to the next page.
OMB Control No. 2700-0136
18
F8. Does your household currently have internet access? 887/
1 Yes 2 No F9. About how often does your child access the internet from home (either with or without
your supervision)? Check only one box. 888/
1 Never
2 Less than once a week
3 About once a week
4 2-3 times a week
5 4-6 times a week
6 7 or more times a week F10. Please indicate, to the best of your knowledge, the annual household income for the
household in which your child primarily lives. Check only one box. 889/
0 Under $10,000
1 $10,001 – $20,000
2 $20,001 – 30,000
3 $30,001 – 40,000
4 $40,001 – 50,000
5 $50,001 – $60,000
6 Over $60,000
7 Choose not to answer
Thank you for completing the survey!
1. After completing the Parent Survey: Put it in the privacy envelope labeled “Parent Survey,” wet the seal, and close the flap.
2. After your child has completed the Student Survey:
Have your child place the completed survey in the envelope labeled “Student Survey,” wet the seal and close the flap.
3. Place the following into the large pre-paid return envelope:
SEMAA application form A signed copy of the Parent Consent and Permission Form A signed copy of the Child Assent Form The two privacy envelopes with completed surveys.
4. Drop the return envelope at any US Post Office or in any Postal Drop Box. Thank you!

THIS PAGE INTENTIONALLY BLANK
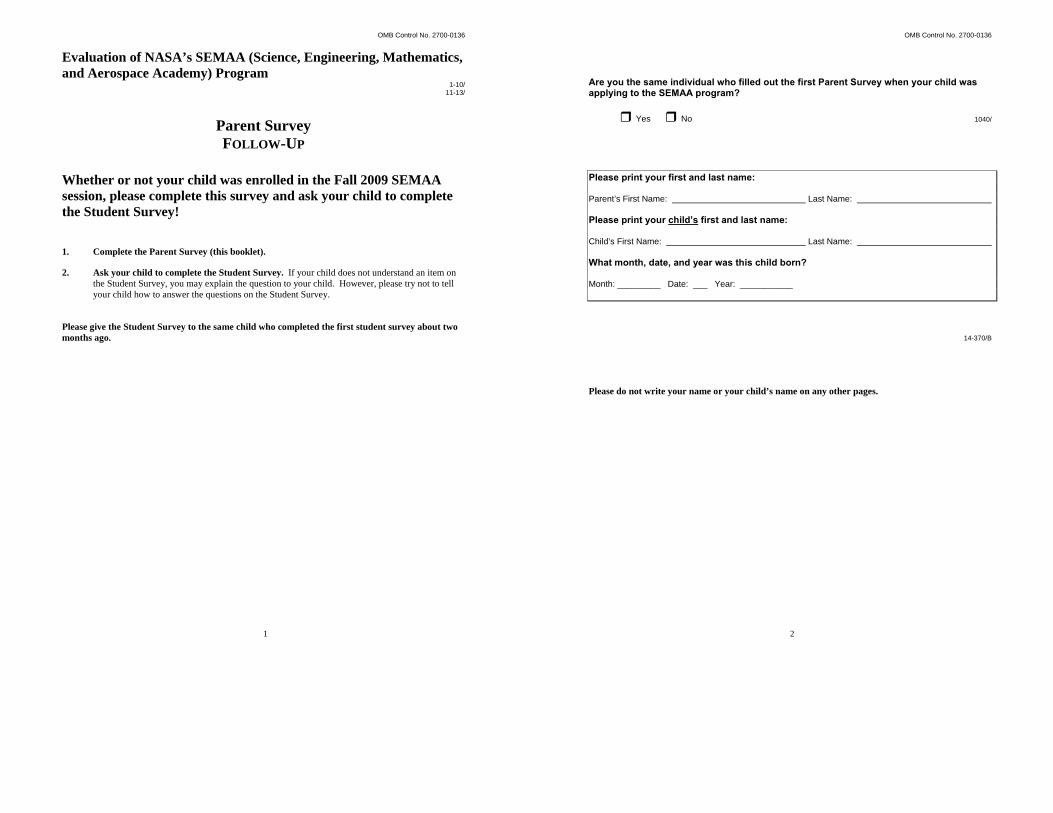
OMB Control No. 2700-0136
1
Evaluation of NASA’s SEMAA (Science, Engineering, Mathematics, and Aerospace Academy) Program
1-10/ 11-13/
Parent Survey FOLLOW-UP
Whether or not your child was enrolled in the Fall 2009 SEMAA session, please complete this survey and ask your child to complete the Student Survey! 1. Complete the Parent Survey (this booklet).
2. Ask your child to complete the Student Survey. If your child does not understand an item on the Student Survey, you may explain the question to your child. However, please try not to tell your child how to answer the questions on the Student Survey.
Please give the Student Survey to the same child who completed the first student survey about two months ago.
OMB Control No. 2700-0136
2
Are you the same individual who filled out the first Parent Survey when your child was applying to the SEMAA program?
Yes No 1040/
Please print your first and last name: Parent’s First Name: Last Name: Please print your child’s first and last name: Child’s First Name: Last Name: What month, date, and year was this child born? Month: _________ Date: ___ Year: ___________
14-370/B
Please do not write your name or your child’s name on any other pages.
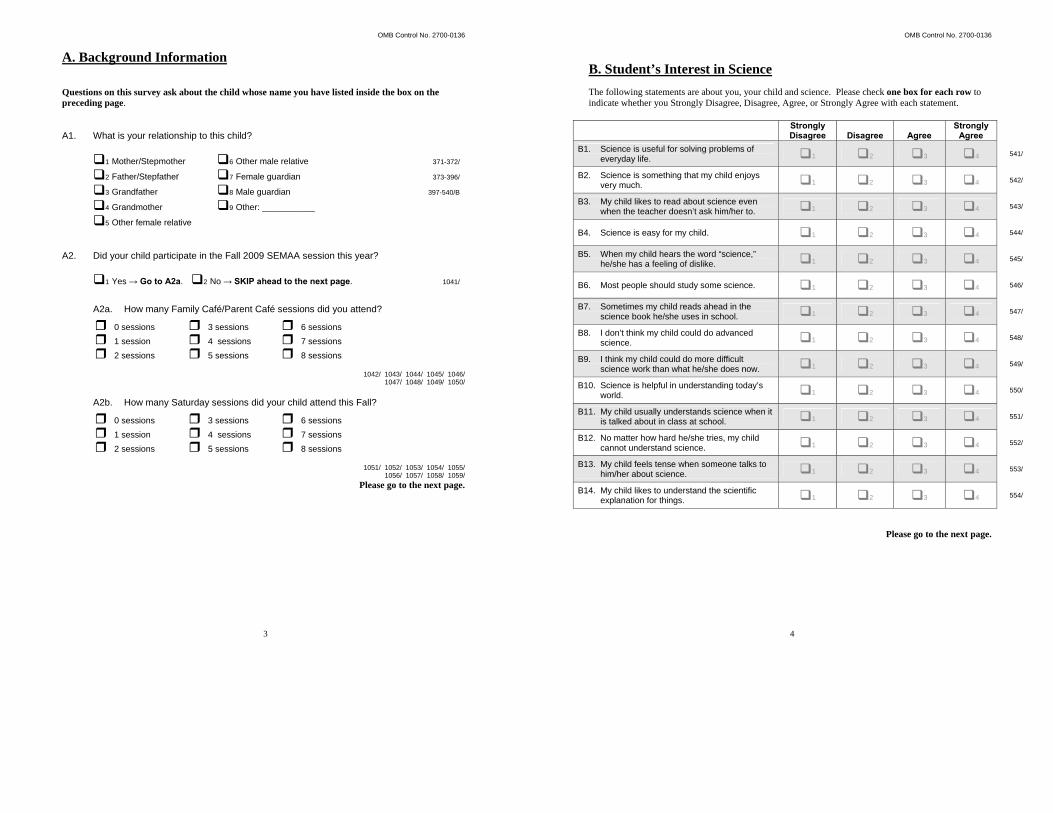
OMB Control No. 2700-0136
3
A. Background Information Questions on this survey ask about the child whose name you have listed inside the box on the preceding page. A1. What is your relationship to this child?
1 Mother/Stepmother 6 Other male relative 371-372/
2 Father/Stepfather 7 Female guardian 373-396/
3 Grandfather 8 Male guardian 397-540/B
4 Grandmother 9 Other: ___________
5 Other female relative A2. Did your child participate in the Fall 2009 SEMAA session this year?
1 Yes → Go to A2a. 2 No → SKIP ahead to the next page. 1041/
A2a. How many Family Café/Parent Café sessions did you attend?
1042/ 1043/ 1044/ 1045/ 1046/ 1047/ 1048/ 1049/ 1050/
A2b. How many Saturday sessions did your child attend this Fall?
1051/ 1052/ 1053/ 1054/ 1055/ 1056/ 1057/ 1058/ 1059/
Please go to the next page.
0 sessions
1 session
2 sessions
3 sessions
4 sessions
5 sessions
6 sessions
7 sessions
8 sessions
0 sessions
1 session
2 sessions
3 sessions
4 sessions
5 sessions
6 sessions
7 sessions
8 sessions
OMB Control No. 2700-0136
4
B. Student’s Interest in Science The following statements are about you, your child and science. Please check one box for each row to indicate whether you Strongly Disagree, Disagree, Agree, or Strongly Agree with each statement.
Strongly Disagree
Disagree
Agree
Strongly Agree
B1. Science is useful for solving problems of everyday life. 1 2 3 4 541/
B2. Science is something that my child enjoys very much. 1 2 3 4 542/
B3. My child likes to read about science even when the teacher doesn’t ask him/her to. 1 2 3 4 543/
B4. Science is easy for my child. 1 2 3 4 544/
B5. When my child hears the word “science,” he/she has a feeling of dislike. 1 2 3 4 545/
B6. Most people should study some science. 1 2 3 4 546/
B7. Sometimes my child reads ahead in the science book he/she uses in school. 1 2 3 4 547/
B8. I don’t think my child could do advanced science. 1 2 3 4 548/
B9. I think my child could do more difficult science work than what he/she does now. 1 2 3 4 549/
B10. Science is helpful in understanding today’s world. 1 2 3 4 550/
B11. My child usually understands science when it is talked about in class at school. 1 2 3 4 551/
B12. No matter how hard he/she tries, my child cannot understand science. 1 2 3 4 552/
B13. My child feels tense when someone talks to him/her about science. 1 2 3 4 553/
B14. My child likes to understand the scientific explanation for things. 1 2 3 4 554/
Please go to the next page.
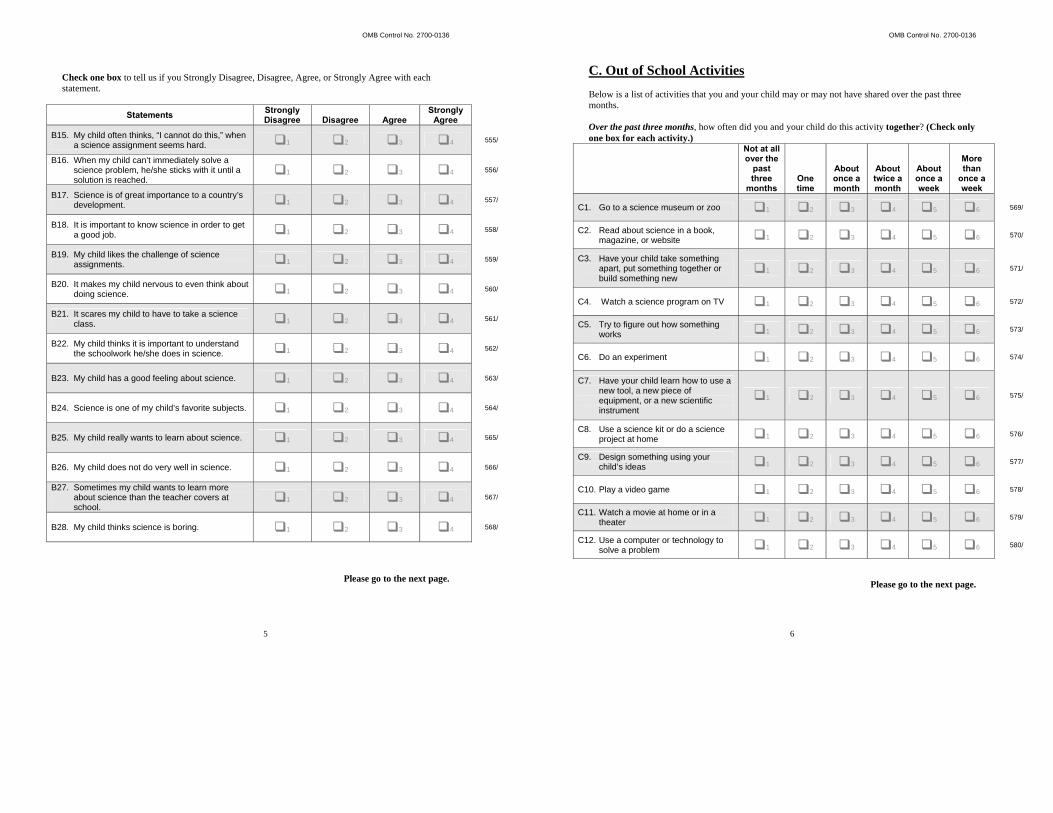
OMB Control No. 2700-0136
5
Check one box to tell us if you Strongly Disagree, Disagree, Agree, or Strongly Agree with each statement.
Statements Strongly Disagree
Disagree
Agree
Strongly Agree
B15. My child often thinks, “I cannot do this,” when a science assignment seems hard. 1 2 3 4 555/
B16. When my child can’t immediately solve a science problem, he/she sticks with it until a solution is reached.
1 2 3 4 556/
B17. Science is of great importance to a country’s development. 1 2 3 4 557/
B18. It is important to know science in order to get a good job. 1 2 3 4 558/
B19. My child likes the challenge of science assignments. 1 2 3 4 559/
B20. It makes my child nervous to even think about doing science. 1 2 3 4 560/
B21. It scares my child to have to take a science class. 1 2 3 4 561/
B22. My child thinks it is important to understand the schoolwork he/she does in science. 1 2 3 4 562/
B23. My child has a good feeling about science. 1 2 3 4 563/
B24. Science is one of my child’s favorite subjects. 1 2 3 4 564/
B25. My child really wants to learn about science. 1 2 3 4 565/
B26. My child does not do very well in science. 1 2 3 4 566/
B27. Sometimes my child wants to learn more about science than the teacher covers at school.
1 2 3 4 567/
B28. My child thinks science is boring. 1 2 3 4 568/
Please go to the next page.
OMB Control No. 2700-0136
6
C. Out of School Activities Below is a list of activities that you and your child may or may not have shared over the past three months. Over the past three months, how often did you and your child do this activity together? (Check only one box for each activity.)
Not at all over the
past three
months One time
About once a month
About twice a month
About once a week
More than
once a week
C1. Go to a science museum or zoo 1 2 3 4 5 6 569/
C2. Read about science in a book, magazine, or website 1 2 3 4 5 6 570/
C3. Have your child take something apart, put something together or build something new
1 2 3 4 5 6 571/
C4. Watch a science program on TV 1 2 3 4 5 6 572/
C5. Try to figure out how something works 1 2 3 4 5 6 573/
C6. Do an experiment 1 2 3 4 5 6 574/
C7. Have your child learn how to use a new tool, a new piece of equipment, or a new scientific instrument
1 2 3 4 5 6 575/
C8. Use a science kit or do a science project at home 1 2 3 4 5 6 576/
C9. Design something using your child’s ideas 1 2 3 4 5 6 577/
C10. Play a video game 1 2 3 4 5 6 578/
C11. Watch a movie at home or in a theater 1 2 3 4 5 6 579/
C12. Use a computer or technology to solve a problem 1 2 3 4 5 6 580/
Please go to the next page.
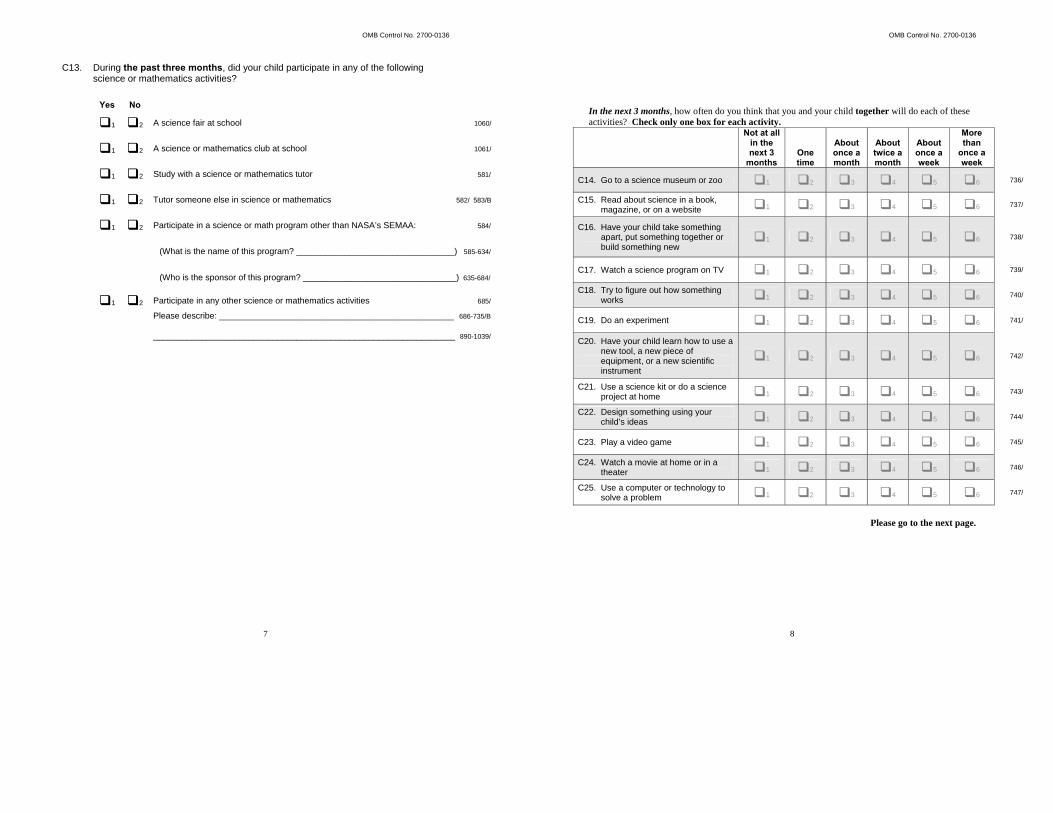
OMB Control No. 2700-0136
7
C13. During the past three months, did your child participate in any of the following science or mathematics activities?
Yes No
1 2 A science fair at school 1060/
1 2 A science or mathematics club at school 1061/
1 2 Study with a science or mathematics tutor 581/
1 2 Tutor someone else in science or mathematics 582/ 583/B
1 2 Participate in a science or math program other than NASA’s SEMAA: 584/
(What is the name of this program? _________________________________) 585-634/
(Who is the sponsor of this program? ________________________________) 635-684/
1 2 Participate in any other science or mathematics activities 685/
Please describe: _________________________________________________ 686-735/B
_______________________________________________________________ 890-1039/
OMB Control No. 2700-0136
8
In the next 3 months, how often do you think that you and your child together will do each of these activities? Check only one box for each activity.
Not at all in the next 3
months One time
About once a month
About twice a month
About once a week
More than
once a week
C14. Go to a science museum or zoo 1 2 3 4 5 6 736/
C15. Read about science in a book, magazine, or on a website 1 2 3 4 5 6 737/
C16. Have your child take something apart, put something together or build something new
1 2 3 4 5 6 738/
C17. Watch a science program on TV 1 2 3 4 5 6 739/
C18. Try to figure out how something works 1 2 3 4 5 6 740/
C19. Do an experiment 1 2 3 4 5 6 741/
C20. Have your child learn how to use a new tool, a new piece of equipment, or a new scientific instrument
1 2 3 4 5 6 742/
C21. Use a science kit or do a science project at home 1 2 3 4 5 6 743/
C22. Design something using your child’s ideas 1 2 3 4 5 6 744/
C23. Play a video game 1 2 3 4 5 6 745/
C24. Watch a movie at home or in a theater 1 2 3 4 5 6 746/
C25. Use a computer or technology to solve a problem 1 2 3 4 5 6 747/
Please go to the next page.
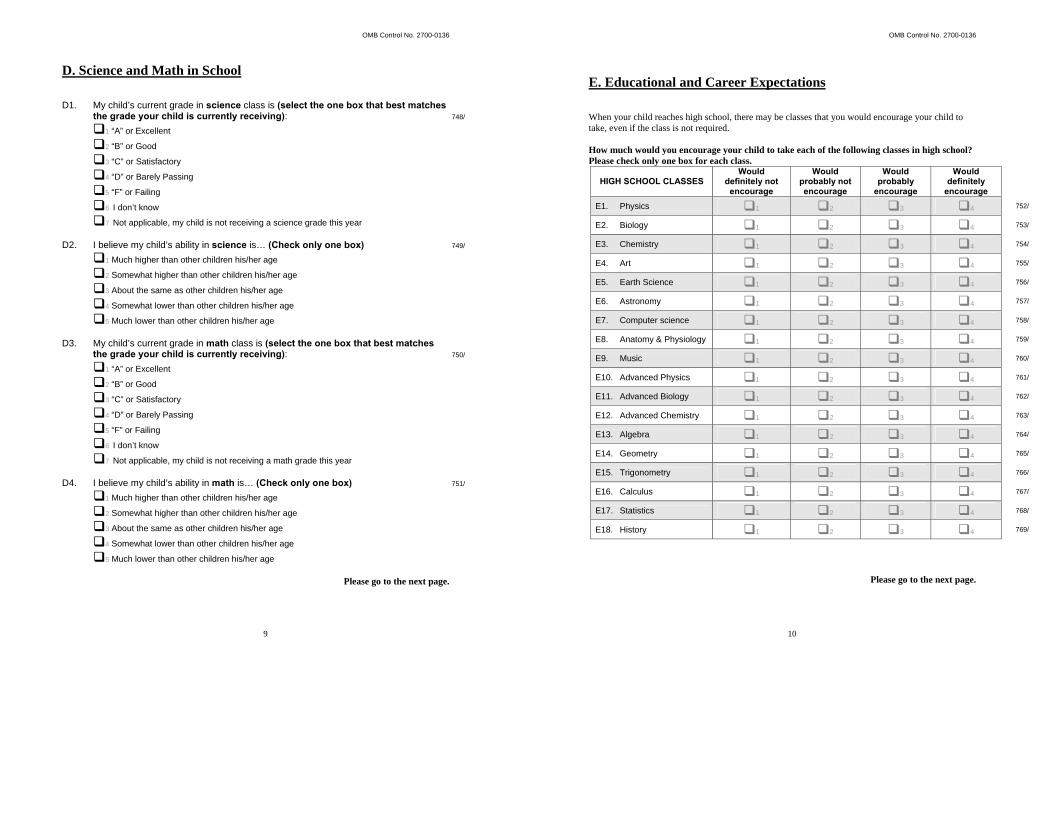
OMB Control No. 2700-0136
9
D. Science and Math in School D1. My child’s current grade in science class is (select the one box that best matches
the grade your child is currently receiving): 748/
1 “A” or Excellent
2 “B” or Good
3 “C” or Satisfactory
4 “D” or Barely Passing
5 “F” or Failing
6 I don’t know
7 Not applicable, my child is not receiving a science grade this year D2. I believe my child’s ability in science is… (Check only one box) 749/
1 Much higher than other children his/her age
2 Somewhat higher than other children his/her age
3 About the same as other children his/her age
4 Somewhat lower than other children his/her age
5 Much lower than other children his/her age D3. My child’s current grade in math class is (select the one box that best matches
the grade your child is currently receiving): 750/
1 “A” or Excellent
2 “B” or Good
3 “C” or Satisfactory
4 “D” or Barely Passing
5 “F” or Failing
6 I don’t know
7 Not applicable, my child is not receiving a math grade this year D4. I believe my child’s ability in math is… (Check only one box) 751/
1 Much higher than other children his/her age
2 Somewhat higher than other children his/her age
3 About the same as other children his/her age
4 Somewhat lower than other children his/her age
5 Much lower than other children his/her age
Please go to the next page.
OMB Control No. 2700-0136
10
E. Educational and Career Expectations When your child reaches high school, there may be classes that you would encourage your child to take, even if the class is not required. How much would you encourage your child to take each of the following classes in high school? Please check only one box for each class.
HIGH SCHOOL CLASSES Would
definitely not encourage
Would probably not encourage
Would probably
encourage
Would definitely
encourage
E1. Physics 1 2 3 4 752/
E2. Biology 1 2 3 4 753/
E3. Chemistry 1 2 3 4 754/
E4. Art 1 2 3 4 755/
E5. Earth Science 1 2 3 4 756/
E6. Astronomy 1 2 3 4 757/
E7. Computer science 1 2 3 4 758/
E8. Anatomy & Physiology 1 2 3 4 759/
E9. Music 1 2 3 4 760/
E10. Advanced Physics 1 2 3 4 761/
E11. Advanced Biology 1 2 3 4 762/
E12. Advanced Chemistry 1 2 3 4 763/
E13. Algebra 1 2 3 4 764/
E14. Geometry 1 2 3 4 765/
E15. Trigonometry 1 2 3 4 766/
E16. Calculus 1 2 3 4 767/
E17. Statistics 1 2 3 4 768/
E18. History 1 2 3 4 769/
Please go to the next page.
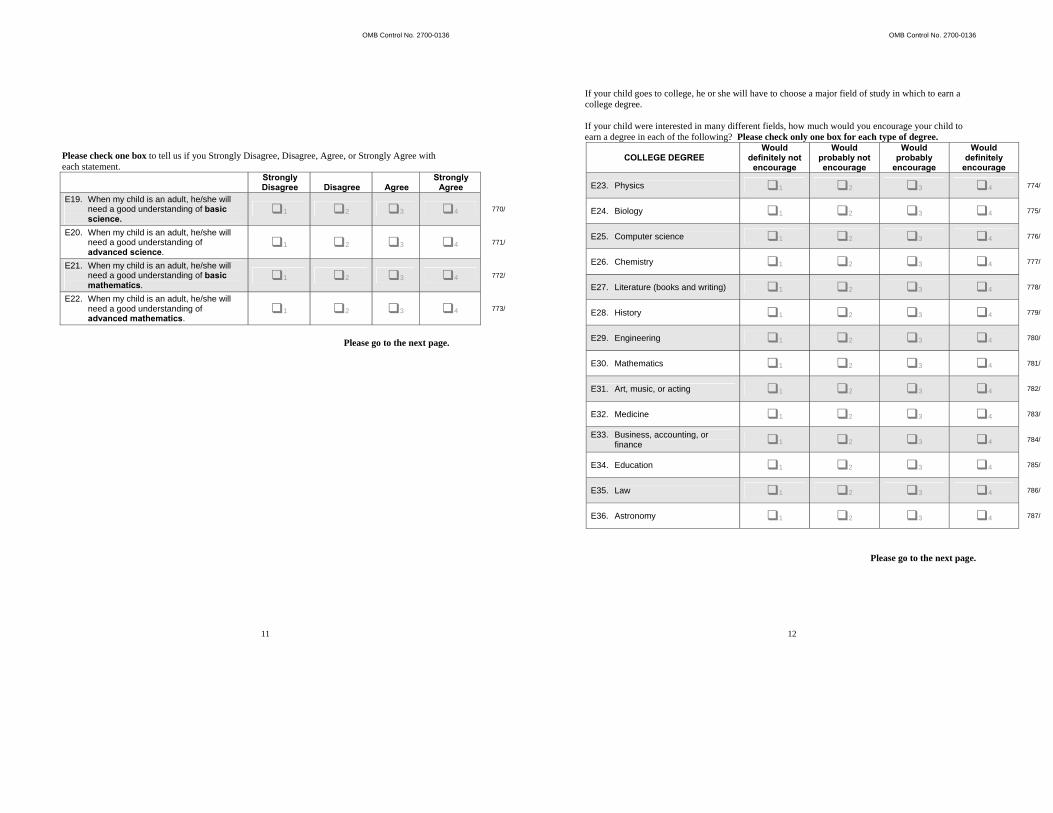
OMB Control No. 2700-0136
11
Please check one box to tell us if you Strongly Disagree, Disagree, Agree, or Strongly Agree with each statement. Strongly
Disagree
Disagree
Agree Strongly
Agree
E19. When my child is an adult, he/she will need a good understanding of basic science.
1 2 3 4 770/
E20. When my child is an adult, he/she will need a good understanding of advanced science.
1 2 3 4 771/
E21. When my child is an adult, he/she will need a good understanding of basic mathematics.
1 2 3 4 772/
E22. When my child is an adult, he/she will need a good understanding of advanced mathematics.
1 2 3 4 773/
Please go to the next page.
OMB Control No. 2700-0136
12
If your child goes to college, he or she will have to choose a major field of study in which to earn a college degree. If your child were interested in many different fields, how much would you encourage your child to earn a degree in each of the following? Please check only one box for each type of degree.
COLLEGE DEGREE Would
definitely not encourage
Would probably not encourage
Would probably
encourage
Would definitely
encourage
E23. Physics 1 2 3 4 774/
E24. Biology 1 2 3 4 775/
E25. Computer science 1 2 3 4 776/
E26. Chemistry 1 2 3 4 777/
E27. Literature (books and writing) 1 2 3 4 778/
E28. History 1 2 3 4 779/
E29. Engineering 1 2 3 4 780/
E30. Mathematics 1 2 3 4 781/
E31. Art, music, or acting 1 2 3 4 782/
E32. Medicine 1 2 3 4 783/
E33. Business, accounting, or finance 1 2 3 4 784/
E34. Education 1 2 3 4 785/
E35. Law 1 2 3 4 786/
E36. Astronomy 1 2 3 4 787/
Please go to the next page.
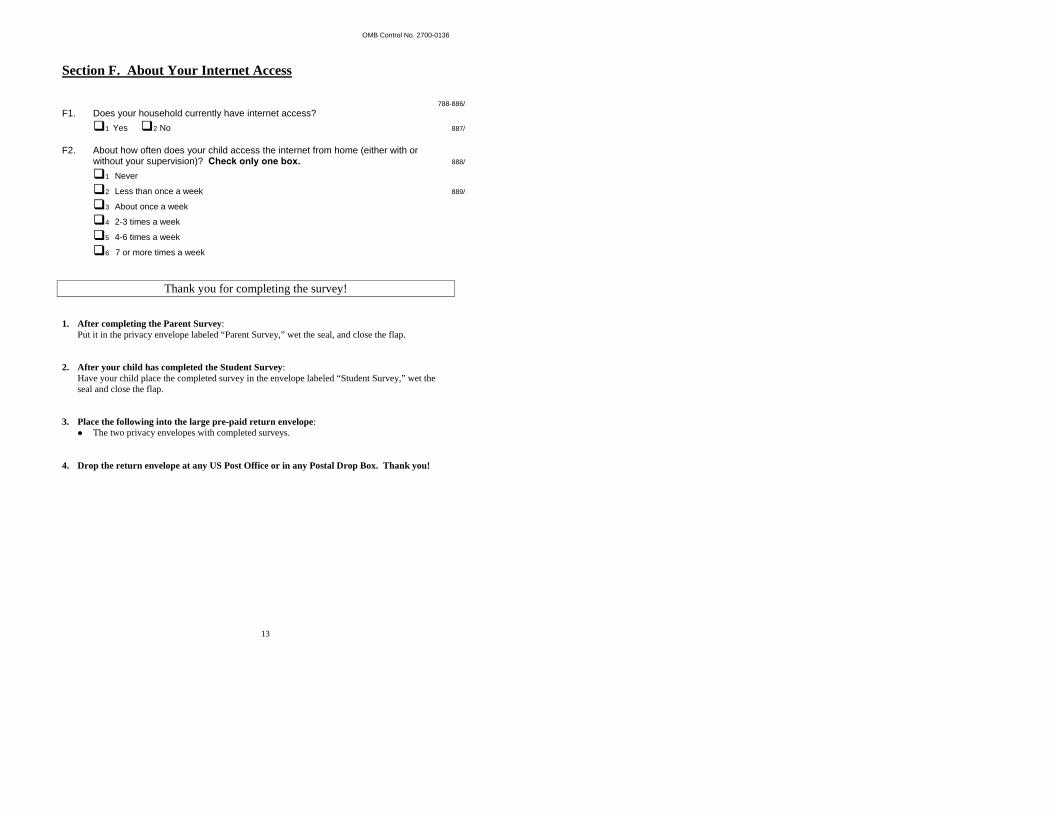
OMB Control No. 2700-0136
13
Section F. About Your Internet Access
788-886/ F1. Does your household currently have internet access?
1 Yes 2 No 887/ F2. About how often does your child access the internet from home (either with or
without your supervision)? Check only one box. 888/
1 Never
2 Less than once a week 889/
3 About once a week
4 2-3 times a week
5 4-6 times a week
6 7 or more times a week
Thank you for completing the survey!
1. After completing the Parent Survey: Put it in the privacy envelope labeled “Parent Survey,” wet the seal, and close the flap.
2. After your child has completed the Student Survey:
Have your child place the completed survey in the envelope labeled “Student Survey,” wet the seal and close the flap.
3. Place the following into the large pre-paid return envelope:
The two privacy envelopes with completed surveys. 4. Drop the return envelope at any US Post Office or in any Postal Drop Box. Thank you!

THIS PAGE INTENTIONALLY BLANK