Embed Size (px)
Citation preview
The Murray-Darling Drainage Basin Examine the competing demands for water in a specific river basin.
Evaluate the strategies that have been adopted to meet these demands
By The British Geographer
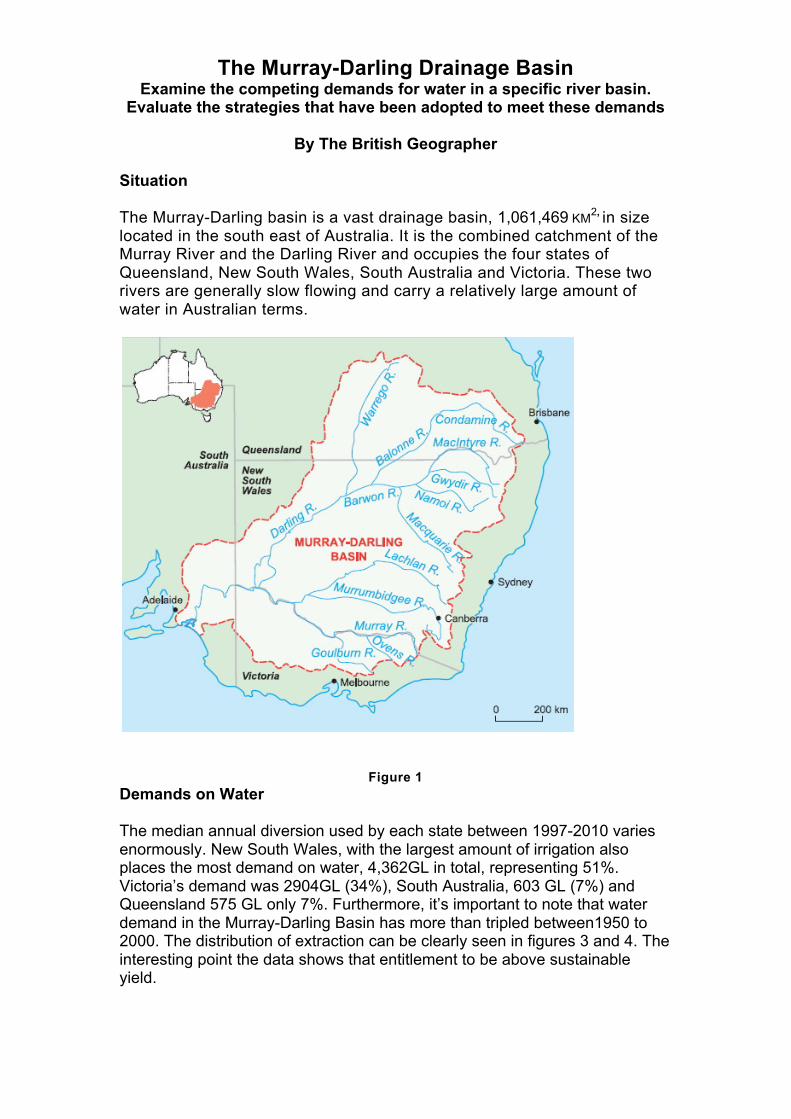
Situation The Murray-Darling basin is a vast drainage basin, 1,061,469 KM2, in size located in the south east of Australia. It is the combined catchment of the Murray River and the Darling River and occupies the four states of Queensland, New South Wales, South Australia and Victoria. These two rivers are generally slow flowing and carry a relatively large amount of water in Australian terms.
Figure 1 Demands on Water The median annual diversion used by each state between 1997-2010 varies enormously. New South Wales, with the largest amount of irrigation also places the most demand on water, 4,362GL in total, representing 51%. Victoria’s demand was 2904GL (34%), South Australia, 603 GL (7%) and Queensland 575 GL only 7%. Furthermore, it’s important to note that water demand in the Murray-Darling Basin has more than tripled between1950 to 2000. The distribution of extraction can be clearly seen in figures 3 and 4. The interesting point the data shows that entitlement to be above sustainable yield.
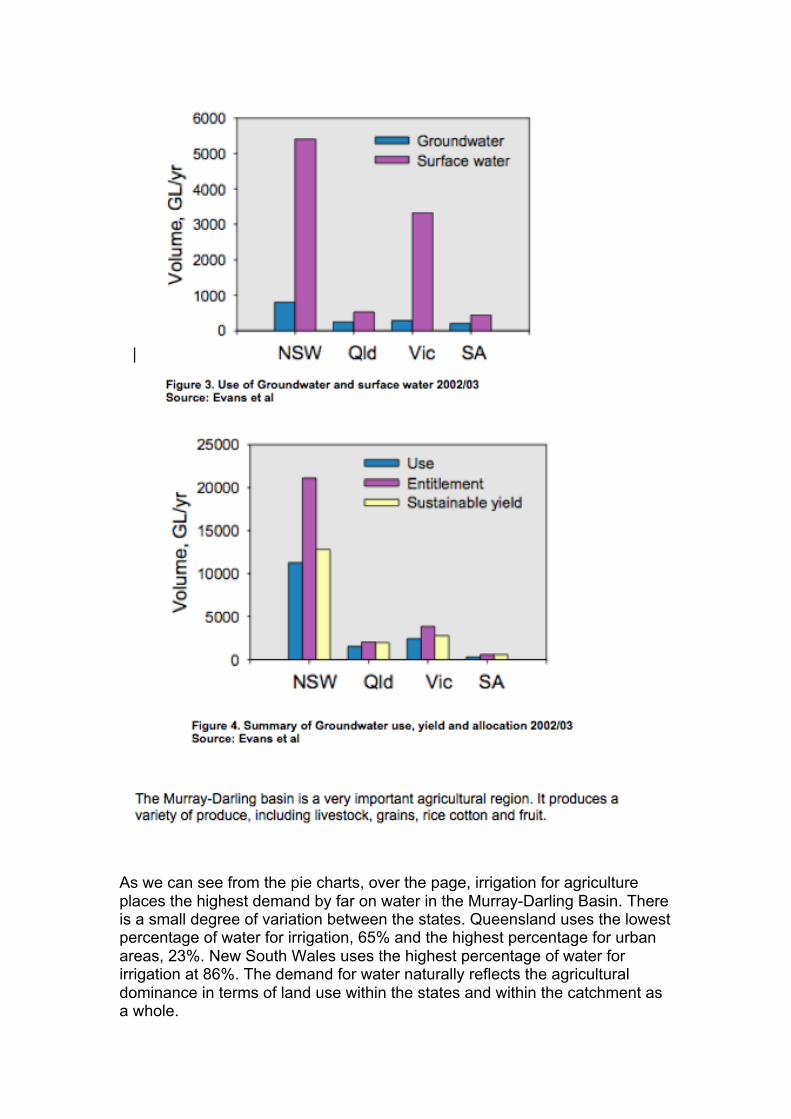
As we can see from the pie charts, over the page, irrigation for agriculture places the highest demand by far on water in the Murray-Darling Basin. There is a small degree of variation between the states. Queensland uses the lowest percentage of water for irrigation, 65% and the highest percentage for urban areas, 23%. New South Wales uses the highest percentage of water for irrigation at 86%. The demand for water naturally reflects the agricultural dominance in terms of land use within the states and within the catchment as a whole.
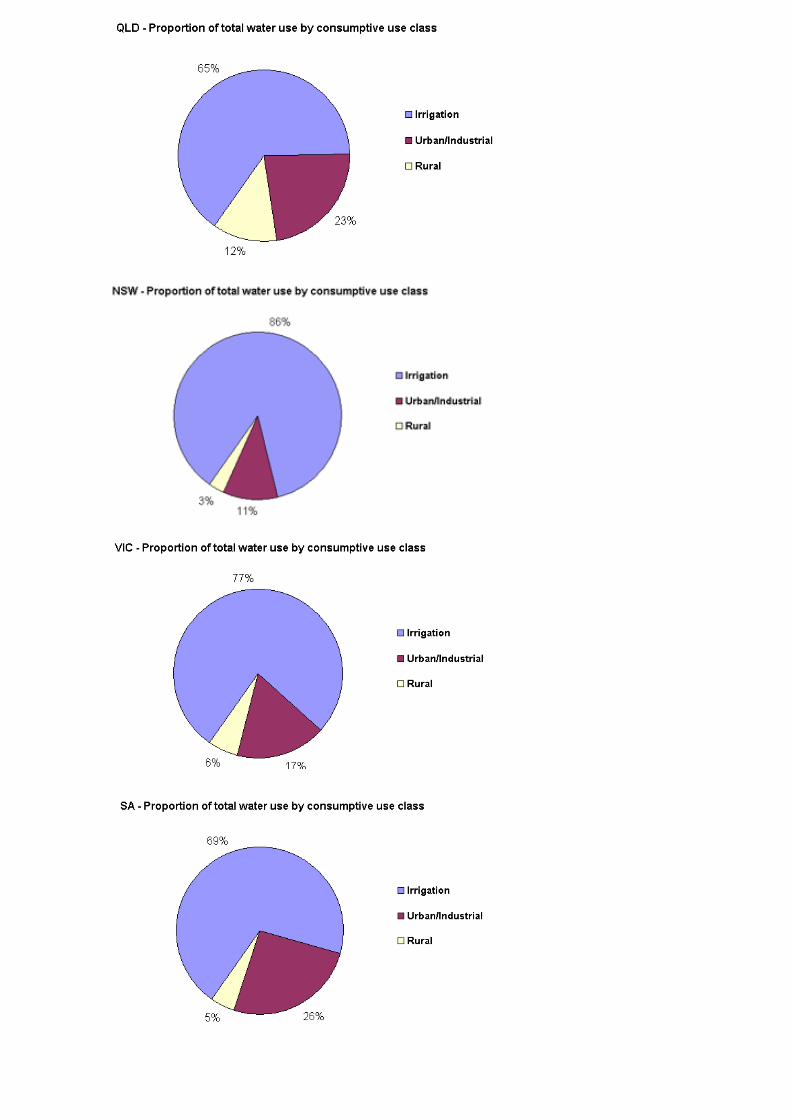
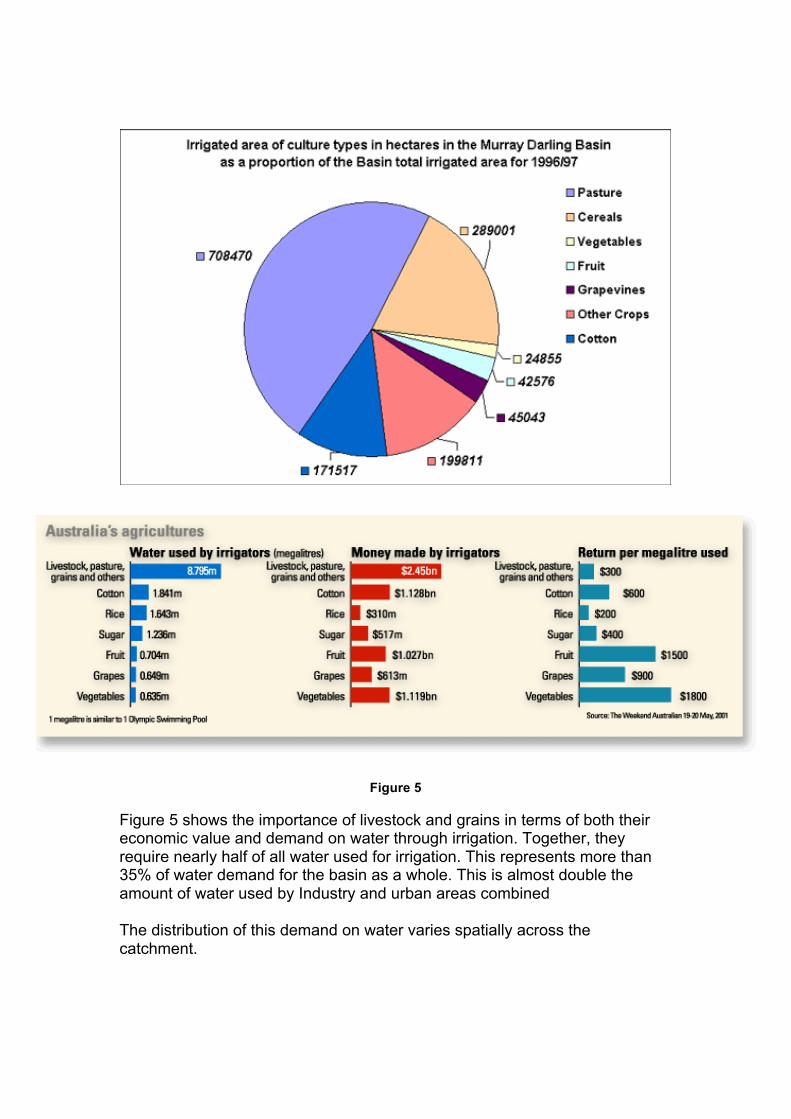
Figure 5
Figure 5 shows the importance of livestock and grains in terms of both their economic value and demand on water through irrigation. Together, they require nearly half of all water used for irrigation. This represents more than 35% of water demand for the basin as a whole. This is almost double the amount of water used by Industry and urban areas combined The distribution of this demand on water varies spatially across the catchment.
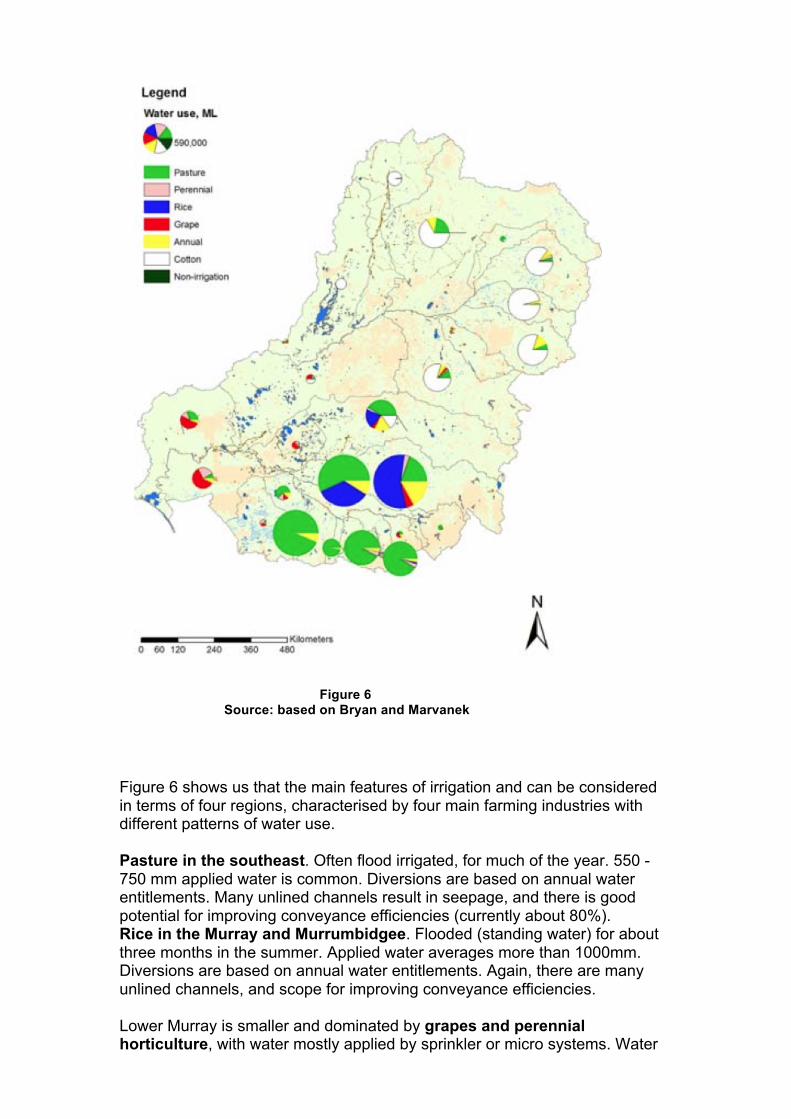
Figure 6 shows us that the main features of irrigation and can be considered in terms of four regions, characterised by four main farming industries with different patterns of water use. Pasture in the southeast. Often flood irrigated, for much of the year. 550 - 750 mm applied water is common. Diversions are based on annual water entitlements. Many unlined channels result in seepage, and there is good potential for improving conveyance efficiencies (currently about 80%). Rice in the Murray and Murrumbidgee. Flooded (standing water) for about three months in the summer. Applied water averages more than 1000mm. Diversions are based on annual water entitlements. Again, there are many unlined channels, and scope for improving conveyance efficiencies. Lower Murray is smaller and dominated by grapes and perennial horticulture, with water mostly applied by sprinkler or micro systems. Water
Figure 6 Source: based on Bryan and Marvanek
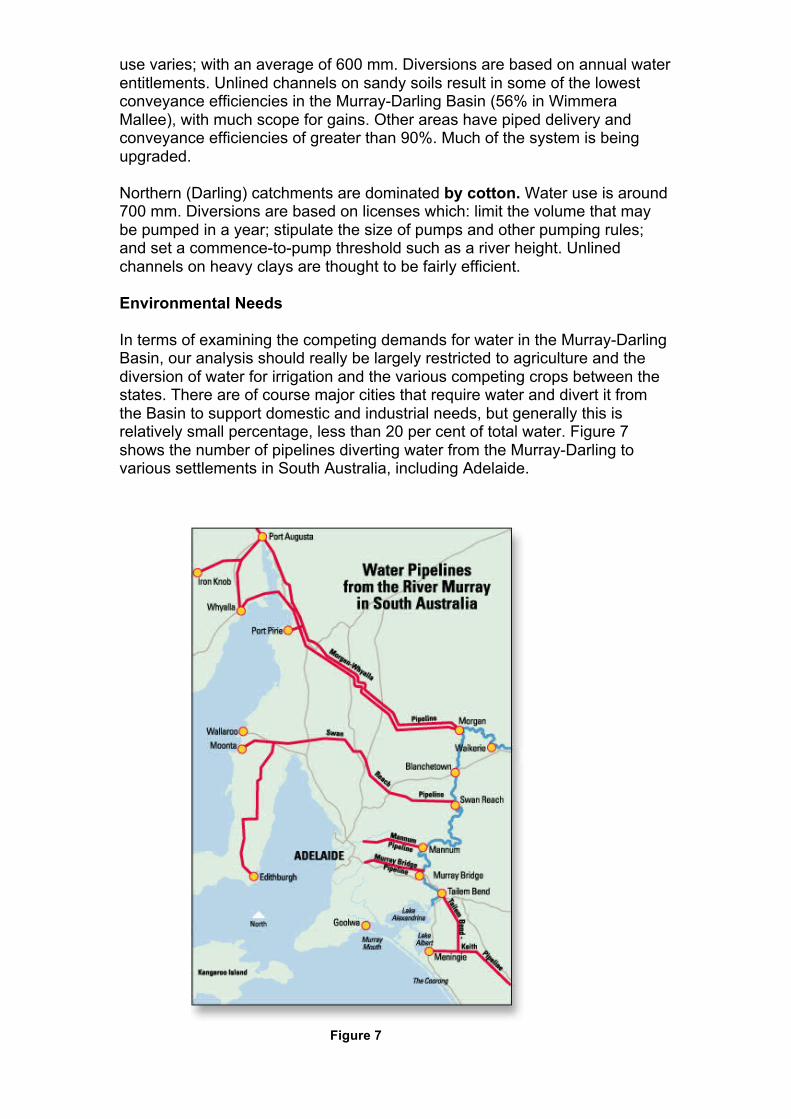
use varies; with an average of 600 mm. Diversions are based on annual water entitlements. Unlined channels on sandy soils result in some of the lowest conveyance efficiencies in the Murray-Darling Basin (56% in Wimmera Mallee), with much scope for gains. Other areas have piped delivery and conveyance efficiencies of greater than 90%. Much of the system is being upgraded. Northern (Darling) catchments are dominated by cotton. Water use is around 700 mm. Diversions are based on licenses which: limit the volume that may be pumped in a year; stipulate the size of pumps and other pumping rules; and set a commence-to-pump threshold such as a river height. Unlined channels on heavy clays are thought to be fairly efficient. Environmental Needs In terms of examining the competing demands for water in the Murray-Darling Basin, our analysis should really be largely restricted to agriculture and the diversion of water for irrigation and the various competing crops between the states. There are of course major cities that require water and divert it from the Basin to support domestic and industrial needs, but generally this is relatively small percentage, less than 20 per cent of total water. Figure 7 shows the number of pipelines diverting water from the Murray-Darling to various settlements in South Australia, including Adelaide. Figure 7
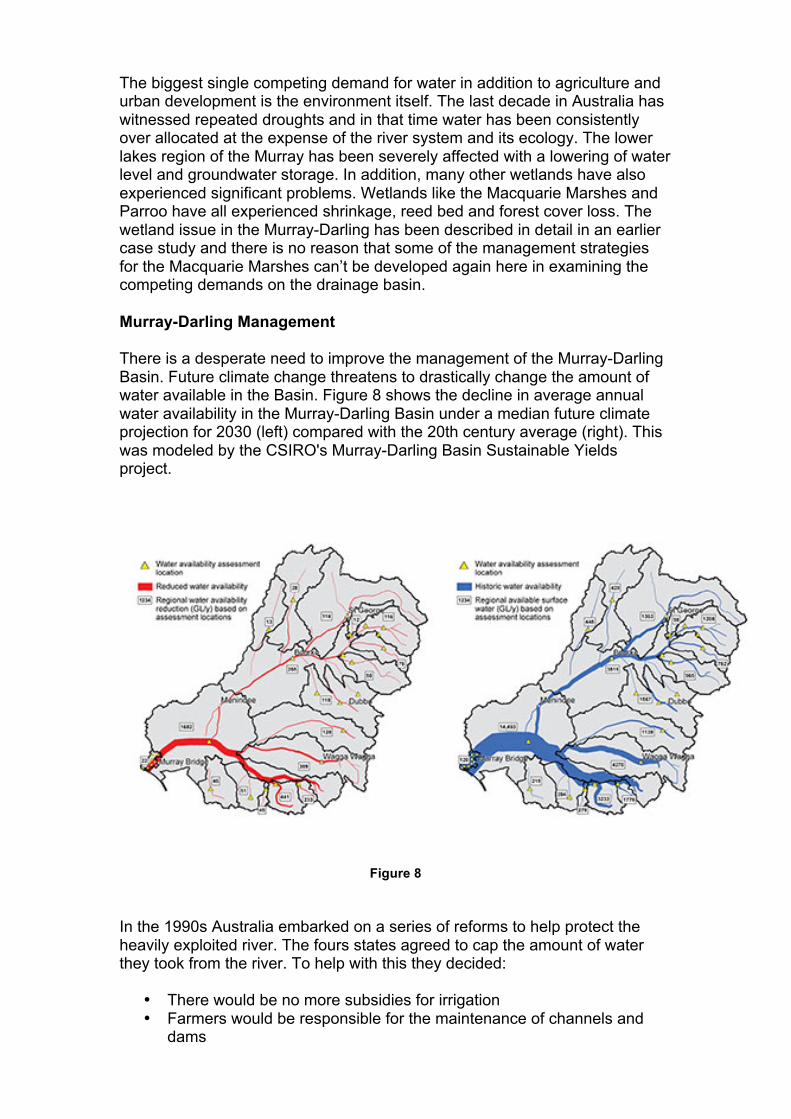
The biggest single competing demand for water in addition to agriculture and urban development is the environment itself. The last decade in Australia has witnessed repeated droughts and in that time water has been consistently over allocated at the expense of the river system and its ecology. The lower lakes region of the Murray has been severely affected with a lowering of water level and groundwater storage. In addition, many other wetlands have also experienced significant problems. Wetlands like the Macquarie Marshes and Parroo have all experienced shrinkage, reed bed and forest cover loss. The wetland issue in the Murray-Darling has been described in detail in an earlier case study and there is no reason that some of the management strategies for the Macquarie Marshes can’t be developed again here in examining the competing demands on the drainage basin. Murray-Darling Management There is a desperate need to improve the management of the Murray-Darling Basin. Future climate change threatens to drastically change the amount of water available in the Basin. Figure 8 shows the decline in average annual water availability in the Murray-Darling Basin under a median future climate projection for 2030 (left) compared with the 20th century average (right). This was modeled by the CSIRO's Murray-Darling Basin Sustainable Yields project.
Figure 8 In the 1990s Australia embarked on a series of reforms to help protect the heavily exploited river. The fours states agreed to cap the amount of water they took from the river. To help with this they decided:
• There would be no more subsidies for irrigation • Farmers would be responsible for the maintenance of channels and
dams
• Each river and tributary would be studied to calculate the sustainable allocation
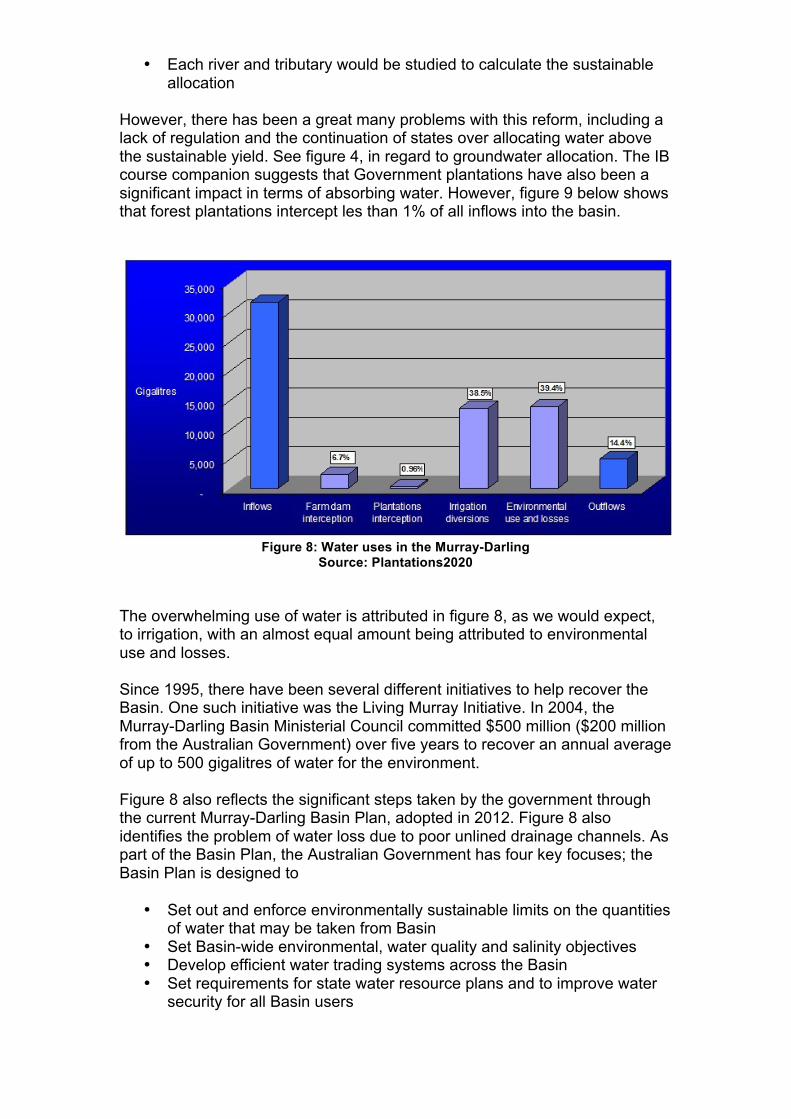
However, there has been a great many problems with this reform, including a lack of regulation and the continuation of states over allocating water above the sustainable yield. See figure 4, in regard to groundwater allocation. The IB course companion suggests that Government plantations have also been a significant impact in terms of absorbing water. However, figure 9 below shows that forest plantations intercept les than 1% of all inflows into the basin.
Figure 8: Water uses in the Murray-Darling
Source: Plantations2020 The overwhelming use of water is attributed in figure 8, as we would expect, to irrigation, with an almost equal amount being attributed to environmental use and losses. Since 1995, there have been several different initiatives to help recover the Basin. One such initiative was the Living Murray Initiative. In 2004, the Murray-Darling Basin Ministerial Council committed $500 million ($200 million from the Australian Government) over five years to recover an annual average of up to 500 gigalitres of water for the environment. Figure 8 also reflects the significant steps taken by the government through the current Murray-Darling Basin Plan, adopted in 2012. Figure 8 also identifies the problem of water loss due to poor unlined drainage channels. As part of the Basin Plan, the Australian Government has four key focuses; the Basin Plan is designed to
• Set out and enforce environmentally sustainable limits on the quantities of water that may be taken from Basin
• Set Basin-wide environmental, water quality and salinity objectives • Develop efficient water trading systems across the Basin • Set requirements for state water resource plans and to improve water
security for all Basin users
The Plan also intends to optimise social and economic impacts once these environmental outcomes have been met. As part of the Basin Plan the Australian Government has launched Water for the future. Through the Water for the Future initiative, the Australian Government has committed more than $9 billion to the Murray-Darling Basin to 2019. This will be phased in reallocate water, to improve the efficiency of irrigation networks and on-farm infrastructure as well as to explore additional environmental works and measures. There are four priorities of Water for the Future:
• Taking action on climate change • Using water wisely • Securing water supplies • Supporting healthy rivers
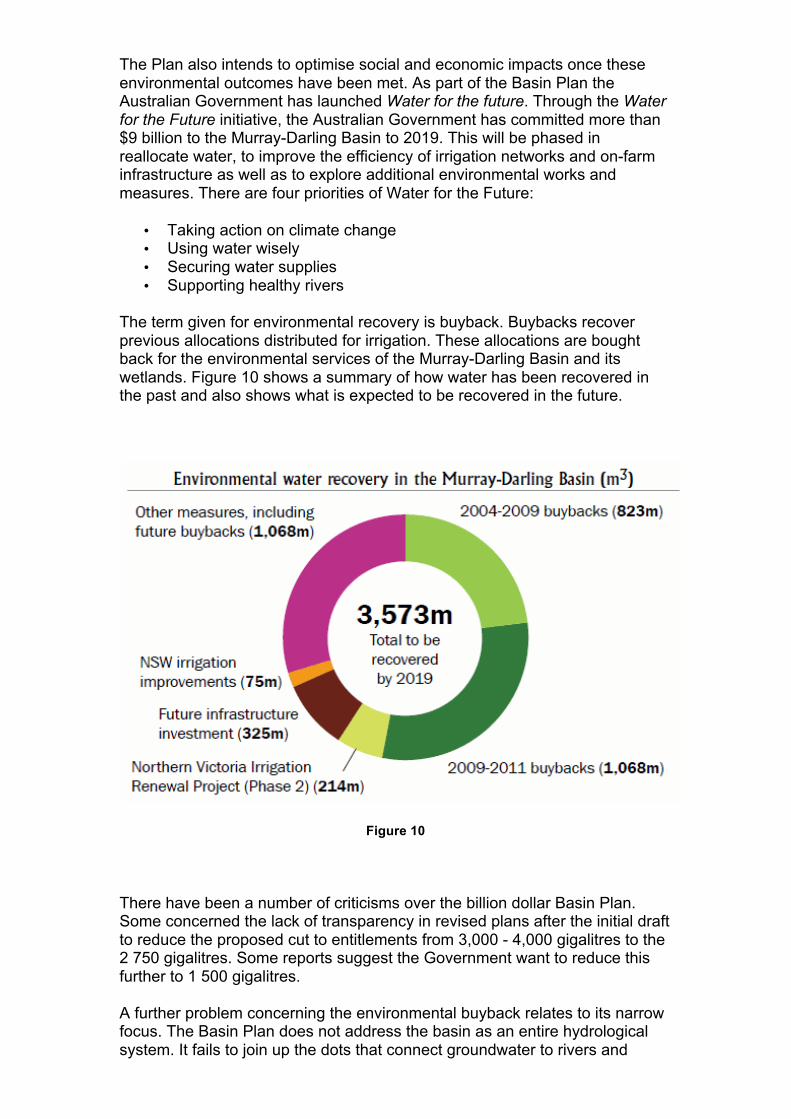
The term given for environmental recovery is buyback. Buybacks recover previous allocations distributed for irrigation. These allocations are bought back for the environmental services of the Murray-Darling Basin and its wetlands. Figure 10 shows a summary of how water has been recovered in the past and also shows what is expected to be recovered in the future.
Figure 10 There have been a number of criticisms over the billion dollar Basin Plan. Some concerned the lack of transparency in revised plans after the initial draft to reduce the proposed cut to entitlements from 3,000 - 4,000 gigalitres to the 2 750 gigalitres. Some reports suggest the Government want to reduce this further to 1 500 gigalitres. A further problem concerning the environmental buyback relates to its narrow focus. The Basin Plan does not address the basin as an entire hydrological system. It fails to join up the dots that connect groundwater to rivers and
streams and rivers to their floodplain and wetlands. The Murray-Darling Basin Cap is the title given to the historic decision to restrict diversions of water from rivers at 1994 levels of development. This policy was supposed to halt degradation and apply to the whole river. Excluded from this policy was the management of floodplains themselves. A report in 2005 revealed through satellite imagery more than 2,000km of earthworks - levees and channels - on the Macquarie floodplain alone. Which is feeder-river to the Darling River. These structures alter the natural cycles of the floodplain and its organisms and effectively restrict water flow into the vital wetlands that need them. This does not appear to be in place in regard to the Basin Plan either. It is therefore quite unclear how much of the environmental buyback is actually received into the environment. Others suggest the proposed plan sets up a whole load of environmental watering targets based on the key ecological assets with very little information being given on how they will be met. In addition, there is the concern over the plan to increase the amount of groundwater that can be extracted to as much as 2,600 gigalitres a year. This smacks of environmental ignorance. We’ve ruined the river, so we best let off it for a while, and extract from the ground instead! From the farmers’ perspective these cuts go too far and they fear that with reduced water allocation their livelihoods will be lost. However, the buybacks are only bought from willing farmers and so any farmer not willing to sell their allocation is not obliged to sell by law. Other farmers feel that overall licenses and entitlements are becoming too strict. Other commentators have criticised the Basin Plan, suggesting that it isn’t legal. The Environment Defenders Office in Victoria issued a document that read, “In our view the proposed basin plan (draft plan) does not comply with the (2007 Water) act in a number of respects,...in addition, it is clear from the draft plan and the associated explanatory materials that the approach the MDBA has taken in the development and drafting of the basin plan has been to consistently give provisions their weakest interpretation and/or give effect to them in the weakest way.” Conclusion The Management of the Murray-Darling is complex and far broader than the information provided in this case study summary. It must be noted that this case study focuses on the competing demands placed on the basin and not on the environmental issue of salinization. The environmental concerns do encompass salinization but are far more complex. Environmental buyback is a strategy being used to recover vital flow into the river and in doing so recover its floodplain and wetland storage. In a good year the Murray-Darling Basin only delivers 20% of its flow to the ocean. In periods of extended drought like the last 10 years, the basin has shrunk and along with it, much of its lakes and wetlands have been lost; vast strands of reed beds and forest have died and farms across the catchment have closed. The Australian Government has to balance the socio-economic needs of its farmers and the breadbasket they provide with the sustainability of the basin

as a whole, at a time of climate change and uncertainty. It seems to me that the Basin Plan lacks a holistic hydrological framework to effectively recover the Basin. There seems to be too much political wrangling between the four user States. In the past, the rivers have been managed as separate catchments within teach individual state. There seems to be a massive gulf between managing the river four separate catchments and managing the basin in a holistic way, in terms of groundwater, river system and floodplain. As a result, he Government seems to be following a path that favours the individual states and the farming communities that they support rather than putting the life, ecological health and sustainability of the Murray-Darling Basin first.