Embed Size (px)
Citation preview
River Murray System Annual Operating Plan 2018-19 water year 1 June 2018 – 31 May 2019 July 2018
Murray–Darling Basin Authority River Murray System Annual Operating Plan ii
Published by the Murray–Darling Basin Authority MDBA publication no: 22/18 ISBN (online): 978-1-925599-91-6
© Murray–Darling Basin Authority 2018 Ownership of intellectual property rights
With the exception of the Commonwealth Coat of Arms, the MDBA logo, trademarks and any exempt photographs and graphics (these are identified), this publication is provided under a Creative Commons
Attribution 4.0 licence. (https://creativecommons.org/licenses/by/4.0)
The Australian Government acting through the Murray–Darling Basin Authority has exercised due care and skill in preparing and compiling the information and data in this publication. Notwithstanding, the Murray–Darling Basin Authority, its employees and advisers disclaim all liability, including liability for negligence and for any loss, damage, injury, expense or cost incurred by any person as a result of accessing, using or relying upon any of the information or data in this publication to the maximum extent permitted by law.
The Murray‒Darling Basin Authority’s preference is that you attribute this publication (and any Murray‒Darling Basin Authority material sourced from it) using the following wording within your work:
Cataloguing data Title: River Murray System Annual Operating Plan, Murray‒Darling Basin Authority Canberra, 2018. CC BY 4.0
Accessibility The Murray‒Darling Basin Authority makes its documents and information available in accessible formats. On some occasions the highly technical nature of the document means that we cannot make some sections fully accessible. If you encounter accessibility problems or the document is in a format that you cannot access, please contact us.
Acknowledgement of the Traditional Owners of the Murray–Darling Basin The Murray−Darling Basin Authority pays respect to the Traditional Owners and their Nations of the Murray−Darling Basin. We acknowledge their deep cultural, social, environmental, spiritual and economic connection to their lands and waters.
The guidance and support received from the Murray Lower Darling Rivers Indigenous Nations, the Northern Basin Aboriginal Nations and our many Traditional Owner friends and colleagues is very much valued and appreciated.
Aboriginal people should be aware that this publication may contain images, names or quotations of deceased persons.
GPO Box 1801, Canberra ACT 2601 1800 230 067
[email protected] mdba.gov.au
Murray–Darling Basin Authority River Murray System Annual Operating Plan iii
Contents 1 Introduction ..................................................................................................................................... 1
2 Objectives and constraints .............................................................................................................. 4
2.1 Key objectives .......................................................................................................................... 4
2.2 System attributes .................................................................................................................... 5
3 Water availability ............................................................................................................................ 8
3.1 Review of 2017-18 system inflows and storage levels ............................................................ 8
4 System status as of 1 June 2018 .................................................................................................... 11
4.1 Active storage as of 1 June 2018 ........................................................................................... 11
4.2 Critical human water needs and conveyance reserve .......................................................... 12
5 Annual Operating Plan assumptions for 2018-19 ......................................................................... 13
5.1 Scenario Approach ................................................................................................................ 13
5.2 River Murray system scenarios for 2018–19 ........................................................................ 14
5.3 Conveyance losses ................................................................................................................. 15
5.4 Storage losses ........................................................................................................................ 17
5.5 South Australia’s Storage Right (Schedule G) ....................................................................... 18
5.6 Scenario Updates................................................................................................................... 19
5.7 Limitations ............................................................................................................................. 19
6 Summary of water sharing across the scenarios ........................................................................... 20
7 System operations ......................................................................................................................... 22
7.1 Climate outlook ..................................................................................................................... 22
7.2 Significant operations ............................................................................................................ 22
7.3 Expected minimum flow rates .............................................................................................. 25
7.4 Weir pool level manipulation ................................................................................................ 25
7.5 Delivering environmental water ........................................................................................... 28
Release of environmental water from Hume Reservoir................................................ 28
Barmah-Millewa Forest ................................................................................................. 29
Environmental inflows from the Goulburn River .......................................................... 32
Environmental inflows from the Murrumbidgee River ................................................. 32
Gunbower Creek and Gunbower Forest ....................................................................... 32
Koondrook–Perricoota Forest ....................................................................................... 33
Watering of Hattah Lakes .............................................................................................. 33
Watering in the Lindsay-Wallpolla-Mulcra icon site ..................................................... 33
Watering of the lower Darling and Great Darling Anabranch ....................................... 34
Murray–Darling Basin Authority River Murray System Annual Operating Plan iv
Environmental water delivered to South Australia ....................................................... 34
Watering via Chowilla works ......................................................................................... 35
7.6 Capacity considerations ........................................................................................................ 35
7.7 Barmah Choke trade restriction ............................................................................................ 37
7.8 Snowy Mountains Scheme .................................................................................................... 37
8 Scenario graphs ............................................................................................................................. 39
8.1 Dartmouth Reservoir ............................................................................................................. 39
8.2 Hume Reservoir and flow at Doctors Point ........................................................................... 41
8.3 Lake Mulwala and the Barmah Choke ................................................................................... 44
Winter and spring .......................................................................................................... 44
Summer and autumn ..................................................................................................... 46
8.4 Euston Weir flow ................................................................................................................... 47
8.5 Lake Victoria .......................................................................................................................... 48
8.6 Menindee Lakes Storage ....................................................................................................... 50
Releases from the Menindee Lakes Storage ................................................................. 51
8.7 Flow to South Australia ......................................................................................................... 53
8.8 Lower Lakes and Barrage operation ...................................................................................... 55
Lower Lakes ................................................................................................................... 55
9 Maintenance, construction and community events ..................................................................... 57
9.1 Maintenance and construction activity in 2018–19 .............................................................. 57
9.2 Calendar of community events in 2018–19 .......................................................................... 58
10 Further information ................................................................................................................... 60
Murray–Darling Basin Authority River Murray System Annual Operating Plan v
Figures Figure 1 MDBA active storage June 2005 to May 2018 .......................................................................... 8
Figure 2 River Murray system inflows—water year totals (to end May) since 1892 .............................. 9
Figure 3 River Murray system inflows June 2017 to May 2018, compared with recent years and long-
term averages ........................................................................................................................................ 10
Figure 4 River Murray system inflows – ranked water year totals since 1892 ..................................... 15
Figure 5 Dartmouth Reservoir storage outlook .................................................................................... 39
Figure 6 Dartmouth Reservoir release outlook ..................................................................................... 40
Figure 7 Hume Reservoir storage outlook ............................................................................................. 42
Figure 8 Hume reservoir release outlook—flow at Doctors Point ........................................................ 43
Figure 9 Yarrawonga Weir release outlook ........................................................................................... 46
Figure 10 Euston Weir flow outlook ...................................................................................................... 48
Figure 11 Lake Victoria storage outlook ................................................................................................ 49
Figure 12 Menindee Lakes' storage outlook ......................................................................................... 50
Figure 13 Menindee Lakes' release outlook .......................................................................................... 52
Figure 14 Flow to South Australia outlook ............................................................................................ 54
Figure 15: Average monthly Lower Lakes’ levels since 2010–11 .......................................................... 56
Murray–Darling Basin Authority River Murray System Annual Operating Plan vi
Tables Table 1: Storage in MDBA major reservoirs on 1 June 2018 ................................................................. 11
Table 2: Key assumptions in each 2018–19 scenario ............................................................................ 17
Table 3: Assumed monthly deferral volume of South Australian entitlement during 2018-19 as at 30
June 2018 .............................................................................................................................................. 18
Table 4:Summary of water availability under each scenario ................................................................ 21
Table 5: Summary of significant river operations under each scenario ................................................ 23
Table 6: Minimum flow rates at key locations ...................................................................................... 25
Table 7: Planned/potential weir pool manipulations in 2018–19 ......................................................... 26
Table 8: Significant environmental operations assumed and potential water quality considerations
under each scenario .............................................................................................................................. 30
Table 9: End of month 'trigger' storage volumes (GL) in Lake Victoria to initiate harmony transfers
from Menindee Lakes ............................................................................................................................ 53
Table 10 Significant works planned or underway in 2018-19 ............................................................... 57
Murray–Darling Basin Authority River Murray System Annual Operating Plan 1
1 Introduction The River Murray system Annual Operating Plan for the 2018–19 water year (1 June 2018 to 31 May 2019) describes the operational activities for the River Murray system (the system) under a number of inflow scenarios for 2018-19.
The purpose of this document is to set out the range of operational activities that may be expected in 2018-19. It provides a high level guide for river operations, assists with environmental water planning and can be used to communicate to river users how the system may affect them in 2018-19.
The inflow and hence operational scenarios have been prepared by the Murray–Darling Basin Authority (MDBA) with input from the Australian Government and the states of New South Wales, Victoria and South Australia through MDBA’s Water Liaison Working Group (WLWG).
Information in this plan is set out as follows:
• Chapter 1 – A brief description of the legislative framework relevant to the operation of the River Murray system
• Chapter 2 – Key objectives, system attributes and constraints in operations • Chapter 3 – Potential water availability • Chapter 4 – System status as of June 2018–19 • Chapter 5 – Key input assumptions • Chapter 6 – Summary of water sharing across the scenarios • Chapter 7 – Outlooks for River Murray system operations during 2018–19 • Chapter 8 – Graphs and analysis of potential operations for a range of scenarios at key
individual structures and reaches • Chapter 9 – Known maintenance, construction and community events • Chapter 10 – Advice on where to find further information on the River Murray system
It is important to note that the actual conditions that occur in the 2018–19 water year will not be confined to a single scenario. This is in-part driven by our highly variable climate where one month can be wet followed by a month of dry. Other variables include the patterns of environmental water delivery and use. However it is expected the scenarios in this plan indicate the likely breadth of potential river operations in the 2018–19 water year.
This document will be formally reviewed by the MDBA and the WLWG in October 2018. The jurisdictions regularly discuss system planning, through the WLWG, and account for actual conditions as the season progresses in order to fine-tune system operations. This plan will be updated if there are significant changes.
At the opening of each water year the MDBA undertakes a formal planning process with the WLWG to ensure adequate planning is in place prior to this operating plan being made public. At its meeting on 25 June 2018, the WLWG noted that:
• Minimum releases from Dartmouth Reservoir were planned for June, but if conditions continued dry, bulk transfers could commence as early as July 2018
• Additional releases of environmental water from Hume Reservoir are likely during winter
Murray–Darling Basin Authority River Murray System Annual Operating Plan 2
• No inter-valley trade (IVT) account water was planned to be called for delivery to the Murray system until spring 2018.
Following ongoing review of planning, this information was updated at the meeting on 25 July, when the WLWG noted that:
• If conditions and rainfall outlooks remained dry, Goulburn inter-valley trade (IVT) account water could be called for delivery to the Murray system as early as August 2018. If this occurred, volumes are likely to be relatively small
• Bulk transfers from Dartmouth Reservoir had not commenced but were likely to commence in August if conditions and rainfall outlooks remain dry.
If there are significant operations being proposed early in the 2018–19 water year, the MDBA will make these public.
LEGISLATIVE FRAMEWORK
The MDBA coordinates the operation of the River Murray system to provide water to the states of New South Wales, Victoria and South Australia in accordance with the Commonwealth Water Act 2007 (Act), and the Murray–Darling Basin Agreement (‘the Agreement’) which is a schedule to the Act.
State water entitlements are determined in accordance with Part XII of the Agreement – Distribution of Waters, and operations are undertaken in accordance with decisions of the Murray‒Darling Basin Ministerial Council and the Basin Officials Committee. In this respect the MDBA acts on behalf of the joint governments in operating the River Murray system to meet their requirements.
This Annual Operating Plan is consistent with the:
• Water Act 2007 including the Murray–Darling Basin Agreement • Relevant decisions of Ministerial Council and Basin Officials Committee • Objectives and Outcomes for River Operations in the River Murray system as determined by
the Basin Officials Committee • The Basin Plan 2012 (in particular Chapters 9 and 11) • MDBA corporate plan • MDBA asset management plan • MDBA asset agreement • States policies and laws • Memoranda of understanding with Constructing Authorities.
The Annual Operating Plan has regard to:
• Basin annual environmental watering priorities • Priorities of the Southern Connected Basin Environmental Watering Committee • The Living Murray operational scenarios • Commonwealth Environmental Water Holder environmental watering plans • Southern Basin state watering plans (where provided).
Murray–Darling Basin Authority River Murray System Annual Operating Plan 3
In the event of any conflict between the above documents or between the Annual Operating Plan and these documents, the MDBA will seek the advice of jurisdictions as appropriate.
KEY DIFFERENCES TO LAST YEAR’S PLAN
Annual Operating Plans aim to cover the full range of potential inflow and demand conditions that might be observed in any particular year and their implications on system operations and water availability. Some of the key differences between last year’s and this Annual Operating Plan worth noting are:
• Water in storage is lower than this time last year – see Section 3.1 and Section 6. • Starting storage in Menindee Lakes is less than 480 GL - see Section 8.6.1. • Channel capacity through the Barmah choke is assumed to be slightly lower - see Section 8.3. • The volume available to the MDBA from the Murrumbidgee inter-valley trade account is
assumed to be zero. • Deferral of South Australia’s Entitlement water has been included in this year’s scenario
assumptions - see Section 5.5.
Murray–Darling Basin Authority River Murray System Annual Operating Plan 4
2 Objectives and constraints 2.1 Key objectives The Australian government and the governments of NSW, Victoria and South Australia, via the Basin Officials Committee (BOC), have responsibility for the high-level decision-making in relation to river operations. They perform this by setting objectives and outcomes for MDBA to achieve. The document entitled “Objectives and Outcomes for River Operations in the River Murray System” (O&O) can be found on the MDBA website.
The following general objectives have been set by the BOC when carrying out river operations. The objectives, documented in the O&O and listed below, reflect the requirement of river operations to balance the competing needs of the system on a day-to-day basis.
Water storage and delivery and accounting — To operate the River Murray system efficiently and effectively in order to deliver state water entitlements, while conserving water and minimising undesirable losses; and to maximise the water available to the Southern Basin states, after providing for operating commitments in the River Murray system.
River Murray Operations (RMO) assets — To ensure that RMO assets allow MDBA to manage and deliver water that is fit for the purpose for which it is to be used, efficiently, effectively and safely.
People and communities — To contribute to the safety of communities along the River Murray as well as the economic, social, environmental and cultural activities of people using the River Murray system.
Environment — To contribute to the protection and, where possible, restoration of priority environmental assets and ecosystem functions within the River Murray system.
Communication and information management — To ensure that MDBA, in operating the River Murray system: uses the best available data, tools and systems; keeps all stakeholders with an interest in the MDBA's river operations well informed of its plans and activities; acts transparently; and is accountable for its actions in accordance with the Agreement.
If, on any occasion, the MDBA is unable to achieve one or more of the objectives above, in whole or in part, because of a conflict between those objectives and one or more other objectives, the MDBA shall consult with the jurisdictions. The MDBA will aim to achieve an appropriate balance between conflicting objectives, taking into consideration the prevailing circumstances, in accordance with the advice or decision of the jurisdictions.
Murray–Darling Basin Authority River Murray System Annual Operating Plan 5
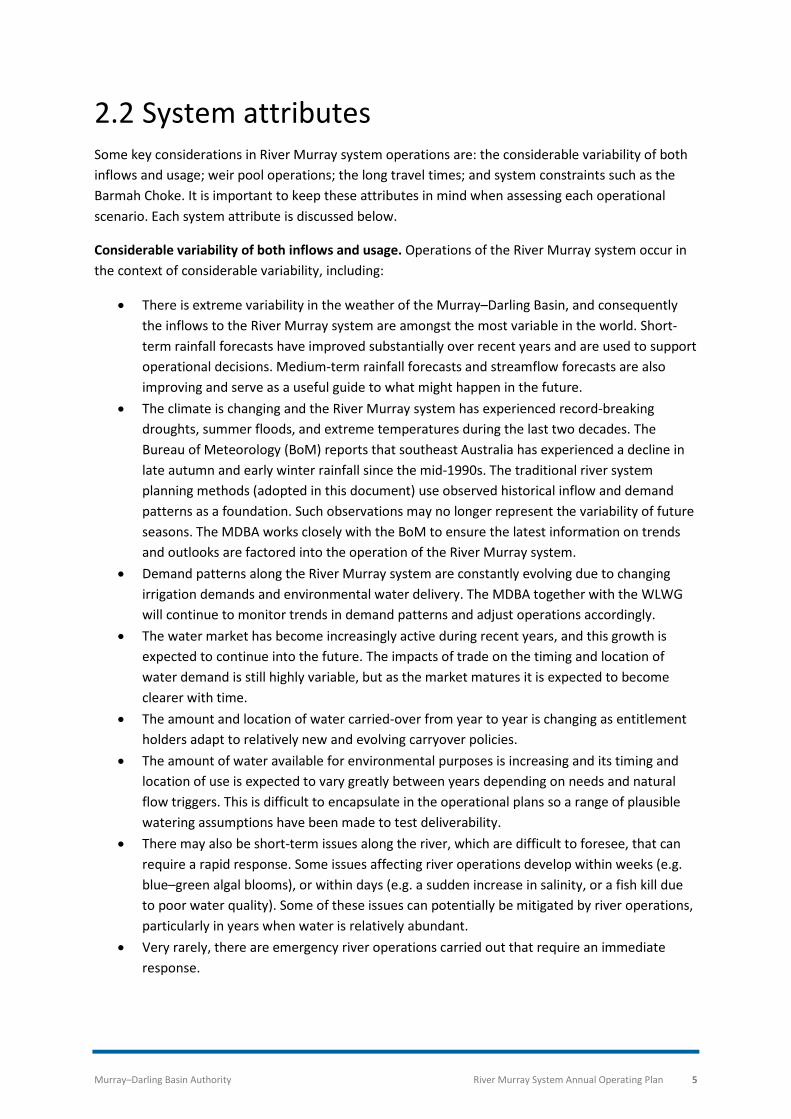
2.2 System attributes Some key considerations in River Murray system operations are: the considerable variability of both inflows and usage; weir pool operations; the long travel times; and system constraints such as the Barmah Choke. It is important to keep these attributes in mind when assessing each operational scenario. Each system attribute is discussed below.
Considerable variability of both inflows and usage. Operations of the River Murray system occur in the context of considerable variability, including:
• There is extreme variability in the weather of the Murray–Darling Basin, and consequently the inflows to the River Murray system are amongst the most variable in the world. Short-term rainfall forecasts have improved substantially over recent years and are used to support operational decisions. Medium-term rainfall forecasts and streamflow forecasts are also improving and serve as a useful guide to what might happen in the future.
• The climate is changing and the River Murray system has experienced record-breaking droughts, summer floods, and extreme temperatures during the last two decades. The Bureau of Meteorology (BoM) reports that southeast Australia has experienced a decline in late autumn and early winter rainfall since the mid-1990s. The traditional river system planning methods (adopted in this document) use observed historical inflow and demand patterns as a foundation. Such observations may no longer represent the variability of future seasons. The MDBA works closely with the BoM to ensure the latest information on trends and outlooks are factored into the operation of the River Murray system.
• Demand patterns along the River Murray system are constantly evolving due to changing irrigation demands and environmental water delivery. The MDBA together with the WLWG will continue to monitor trends in demand patterns and adjust operations accordingly.
• The water market has become increasingly active during recent years, and this growth is expected to continue into the future. The impacts of trade on the timing and location of water demand is still highly variable, but as the market matures it is expected to become clearer with time.
• The amount and location of water carried-over from year to year is changing as entitlement holders adapt to relatively new and evolving carryover policies.
• The amount of water available for environmental purposes is increasing and its timing and location of use is expected to vary greatly between years depending on needs and natural flow triggers. This is difficult to encapsulate in the operational plans so a range of plausible watering assumptions have been made to test deliverability.
• There may also be short-term issues along the river, which are difficult to foresee, that can require a rapid response. Some issues affecting river operations develop within weeks (e.g. blue–green algal blooms), or within days (e.g. a sudden increase in salinity, or a fish kill due to poor water quality). Some of these issues can potentially be mitigated by river operations, particularly in years when water is relatively abundant.
• Very rarely, there are emergency river operations carried out that require an immediate response.
Murray–Darling Basin Authority River Murray System Annual Operating Plan 6
System flow constraints and considerations. At various locations in the River Murray system there are flow constraints, which may apply during periods of regulated release and which, if breached, may have significant social and environmental impacts depending on magnitude and timing. Some of these constraints and considerations include:
• Mitta Mitta River downstream of Dartmouth Reservoir: 3.4 m local gauge height at Tallandoon. This currently equates to a flow of approximately 9,800 ML/day (note: flows above 5,000 ML/day for sustained periods have been identified to cause bank erosion downstream of Snowy Creek)
• Hume Reservoir to Yarrawonga Weir: 25,000 ML/day at Doctors Point • Yarrawonga Weir to the Barmah Choke: approximately 9,500 ML/day (see Section 8.3)
measured immediately downstream of Yarrawonga Weir when watering of the Barmah–Millewa Forest is not desirable, and regulated releases of up to 3.3 m gauge height at Tocumwal (~18,000 ML/day) may be targeted subject to a range of conditions, requirements and timing when watering of the Barmah–Millewa Forest is desirable
• inlet to Lake Victoria (Frenchmans Creek): up to 10,000 ML/day depending on the water level in Lake Victoria
• outlet from Lake Victoria (Rufus River): up to 10,000 ML/day depending on river and lake levels (although at rates above 7–8,000 ML/day, erosion along the Rufus River needs to be taken into consideration).
• Edward River downstream of Stevens Weir: 2,700 ML/day (not applicable when watering of Werai Forest is desirable)
• Lower Darling River downstream of Menindee Lakes: 9,000 ML/day (although rates may be reduced to improve NSW water supply reliability at Menindee Lakes)
• outlet to lower Darling River from Lake Menindee: less than 4,000 ML/day depending on level in Lake Menindee.
The constraints and considerations listed above are upper limits that are not normally targeted to be exceeded by normal river operations.
The coordination of inflows. The operation of the River Murray system occurs in coordination with:
• Snowy Hydro Limited, who control the releases from the Snowy Mountains Hydro-electric Scheme into the Upper Murray. Under the Snowy Water Licence, Snowy Hydro Limited have substantial flexibility over the pattern of releases.
• regulated tributary inflows, particularly the Goulburn River in Victoria (operated by Goulburn-Murray Water) and the Murrumbidgee River and Billabong Creek in NSW (operated by WaterNSW). This also includes the delivery of water held in inter-valley trade accounts (known as IVT or Valley Accounts) as a result of permanent and temporary water trade between the Murray and these tributaries.
• largely unregulated tributary inflows, such as from the Kiewa and Ovens Rivers. • the Darling River in NSW, including any operations of the Menindee Lakes when directed by
NSW (see Section 8.6).
Coordination of inflows is important, as water released from storages within the MDBA’s control needs to be managed in conjunction with other regulated and unregulated inflows to the system in order to optimise outcomes and ensure efficient water use.
Murray–Darling Basin Authority River Murray System Annual Operating Plan 7
Weir pool operations. Drawing on or raising weir pools has become a more common practice at an increasing number of weirs in recent years to assist in meeting environmental and water delivery objectives. Varying weir pool levels can be challenging for local communities that may have previously experienced near constant weir pool levels for long periods of time. Variation of weir pool levels is expected to increase in frequency in the future for a range of purposes, with a key reason being to achieve improved ecological outcomes (discussed further in Section 7.4).
Long travel times. During regulated flow conditions, it takes on average 25 days for releases from Hume Dam to reach Lake Victoria. The reliability of weather forecasts decline rapidly after one week.
While the bulk of water demands are located between Hume and Lake Victoria, there are no other MDBA controlled storages aside from the weir pools along the River Murray. These offer minimal storage capacity and limited ability to regulate tributary inflows.
The combination of long travel times and lack of opportunities for re-regulation limits the level of control that the MDBA has over the flow regime in much of the River Murray. This is particularly apparent in years of average and high tributary inflows, or during extended hot spells causing short term spikes in consumptive orders that cannot be met by the water already en-route.
For example, a ‘rain rejection’ can result if water orders are cancelled due to significant rainfall along the river and the cancellation occurs after the water has already been released from storage. The storage releases combined with tributary inflows may lead to overbank flows particularly in the Barmah–Millewa Forest (discussed further in Section 8.3).
In contrast, when hot and dry weather is more extreme or persistent than forecast, higher than expected consumptive use and evaporation may occur. This can result in relatively low river levels downstream of high use areas and the possibility of not fully supplying water demands at one or more parts of the system (discussed further in Section 7.6).
Murray–Darling Basin Authority River Murray System Annual Operating Plan 8
3 Water availability 3.1 Review of 2017-18 system inflows and
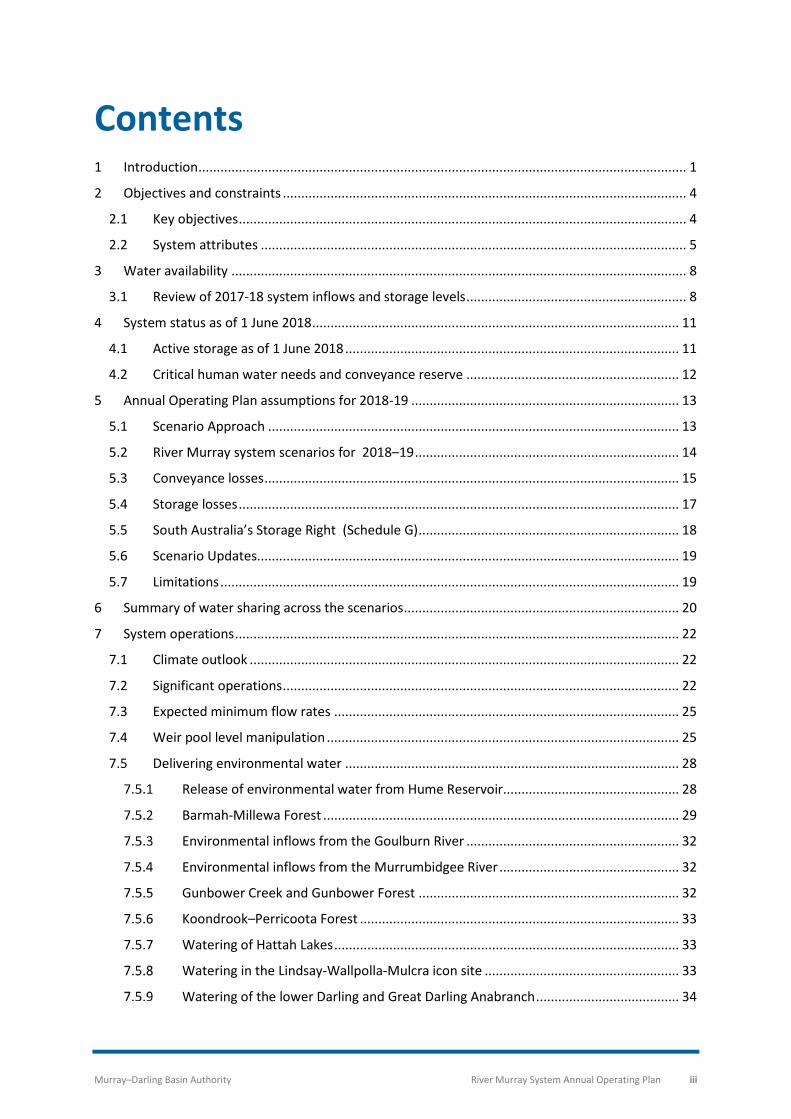
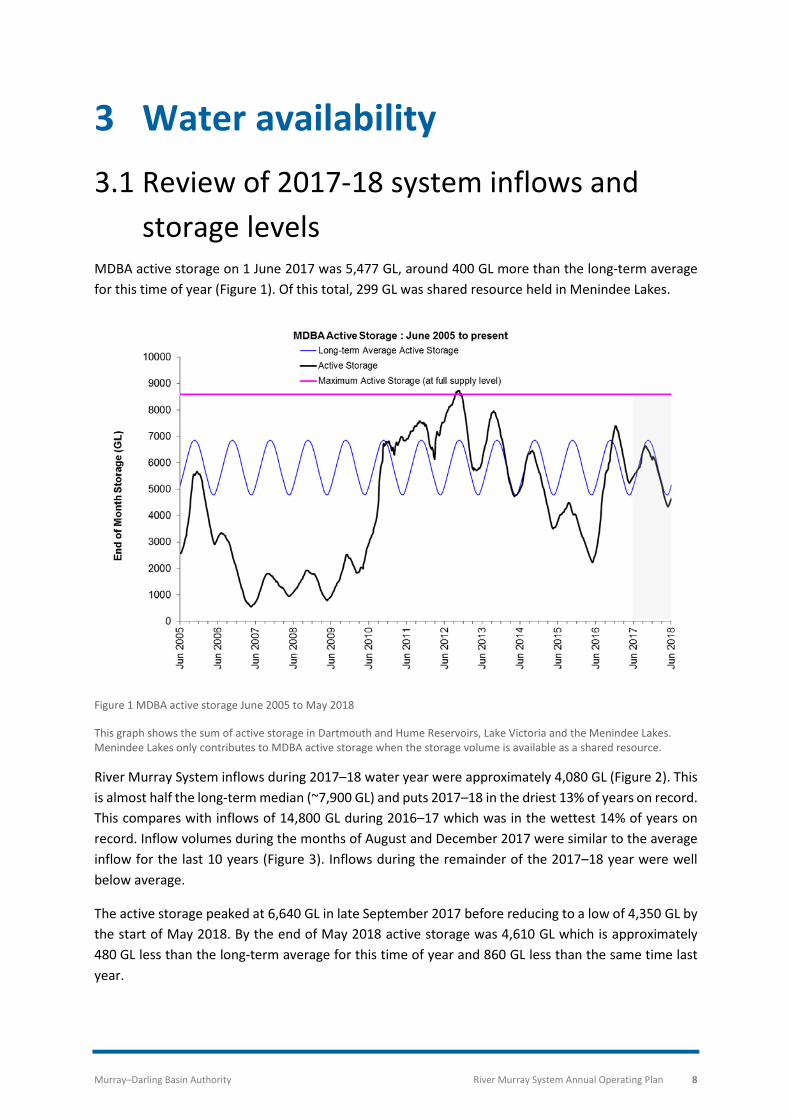
storage levels MDBA active storage on 1 June 2017 was 5,477 GL, around 400 GL more than the long-term average for this time of year (Figure 1). Of this total, 299 GL was shared resource held in Menindee Lakes.
Figure 1 MDBA active storage June 2005 to May 2018
This graph shows the sum of active storage in Dartmouth and Hume Reservoirs, Lake Victoria and the Menindee Lakes. Menindee Lakes only contributes to MDBA active storage when the storage volume is available as a shared resource.
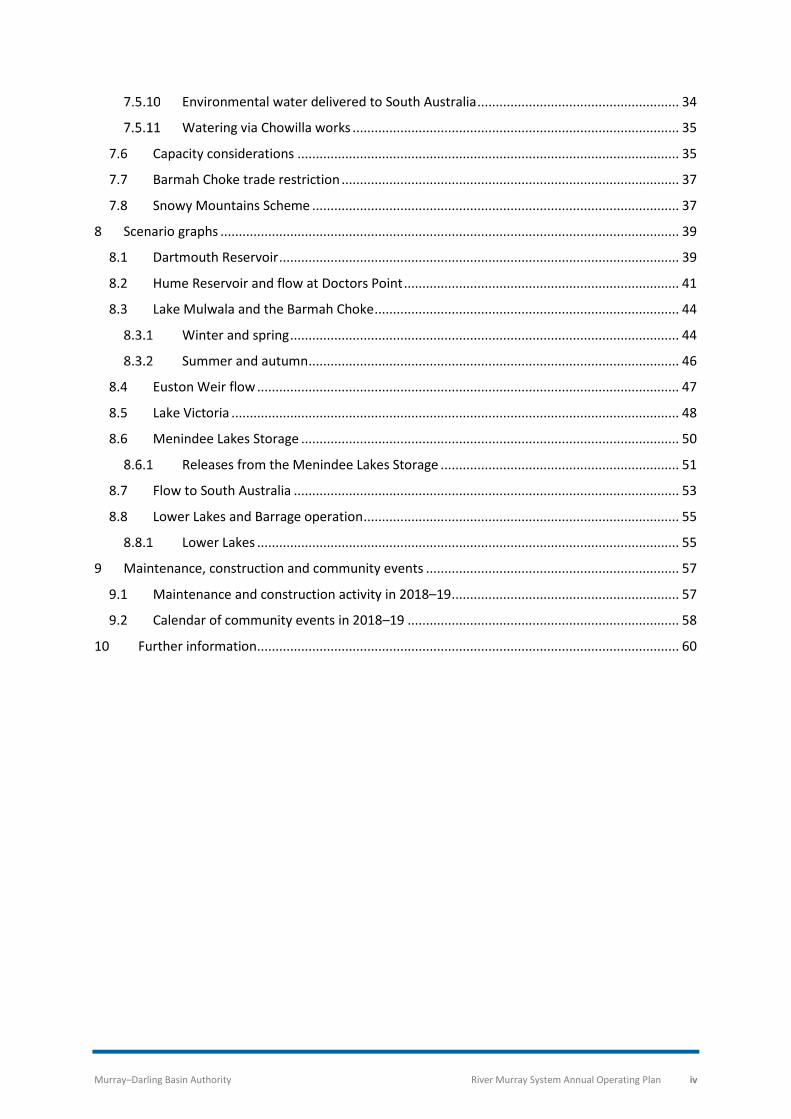
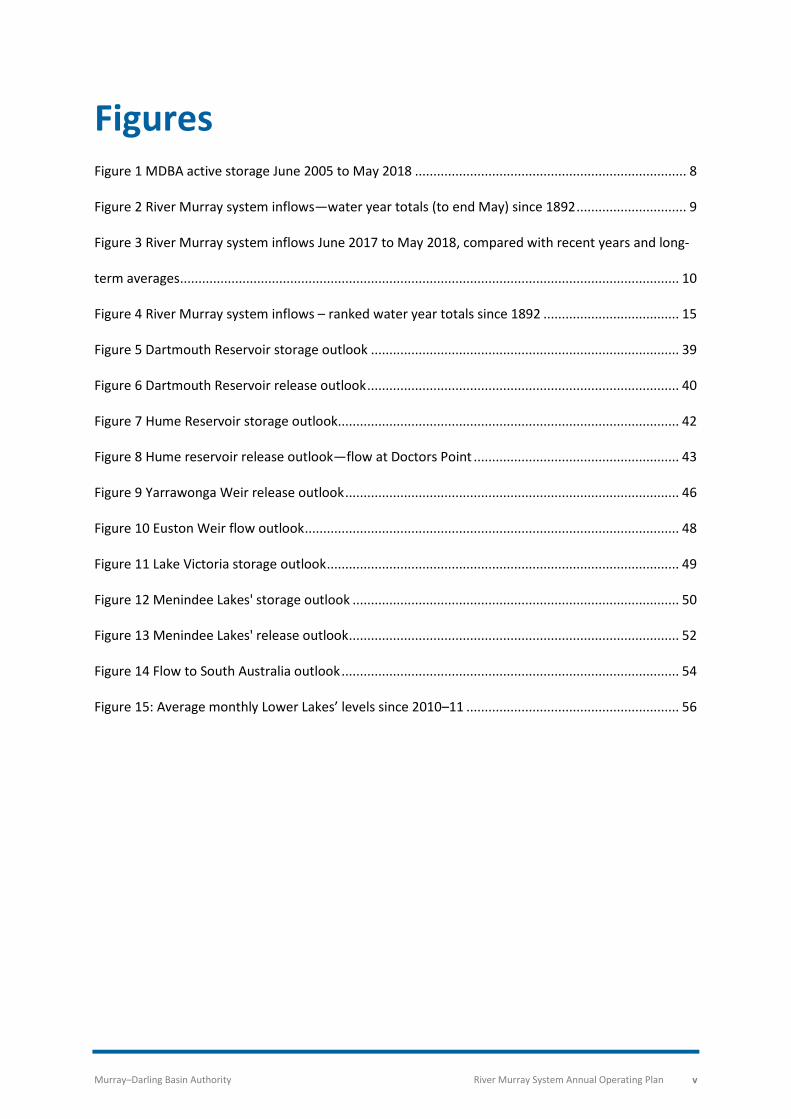
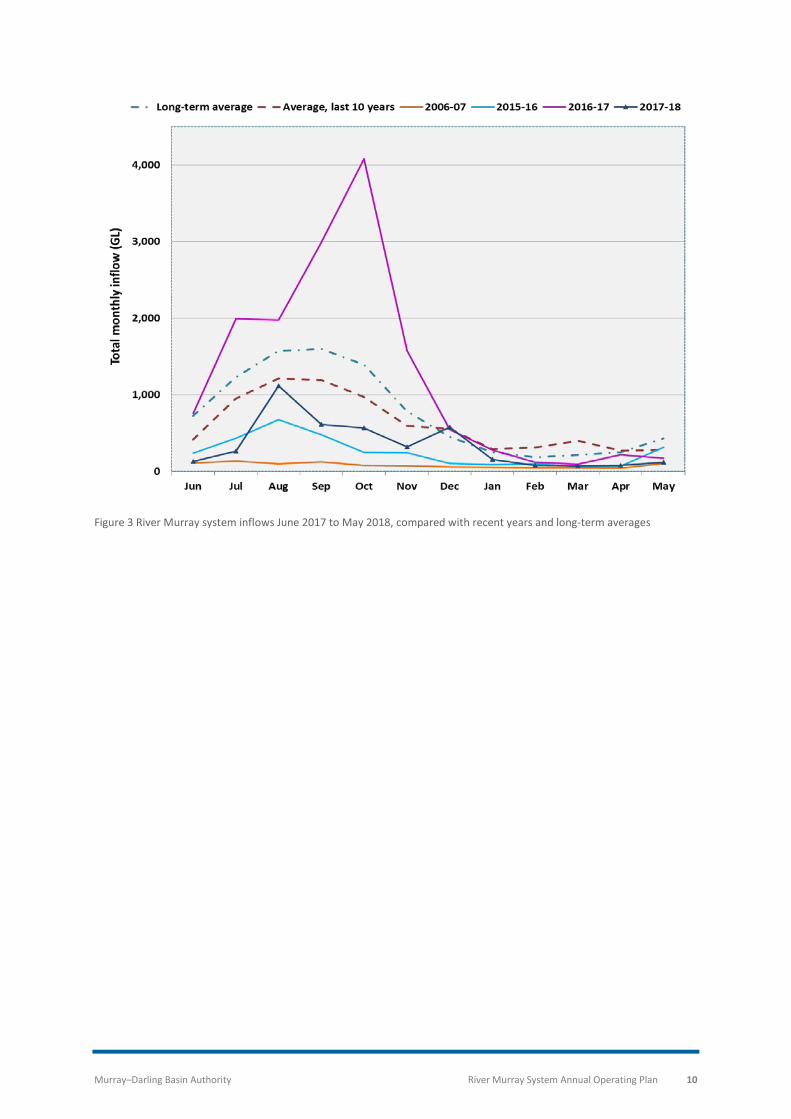
River Murray System inflows during 2017–18 water year were approximately 4,080 GL (Figure 2). This is almost half the long-term median (~7,900 GL) and puts 2017–18 in the driest 13% of years on record. This compares with inflows of 14,800 GL during 2016–17 which was in the wettest 14% of years on record. Inflow volumes during the months of August and December 2017 were similar to the average inflow for the last 10 years (Figure 3). Inflows during the remainder of the 2017–18 year were well below average.
The active storage peaked at 6,640 GL in late September 2017 before reducing to a low of 4,350 GL by the start of May 2018. By the end of May 2018 active storage was 4,610 GL which is approximately 480 GL less than the long-term average for this time of year and 860 GL less than the same time last year.
Murray–Darling Basin Authority River Murray System Annual Operating Plan 9
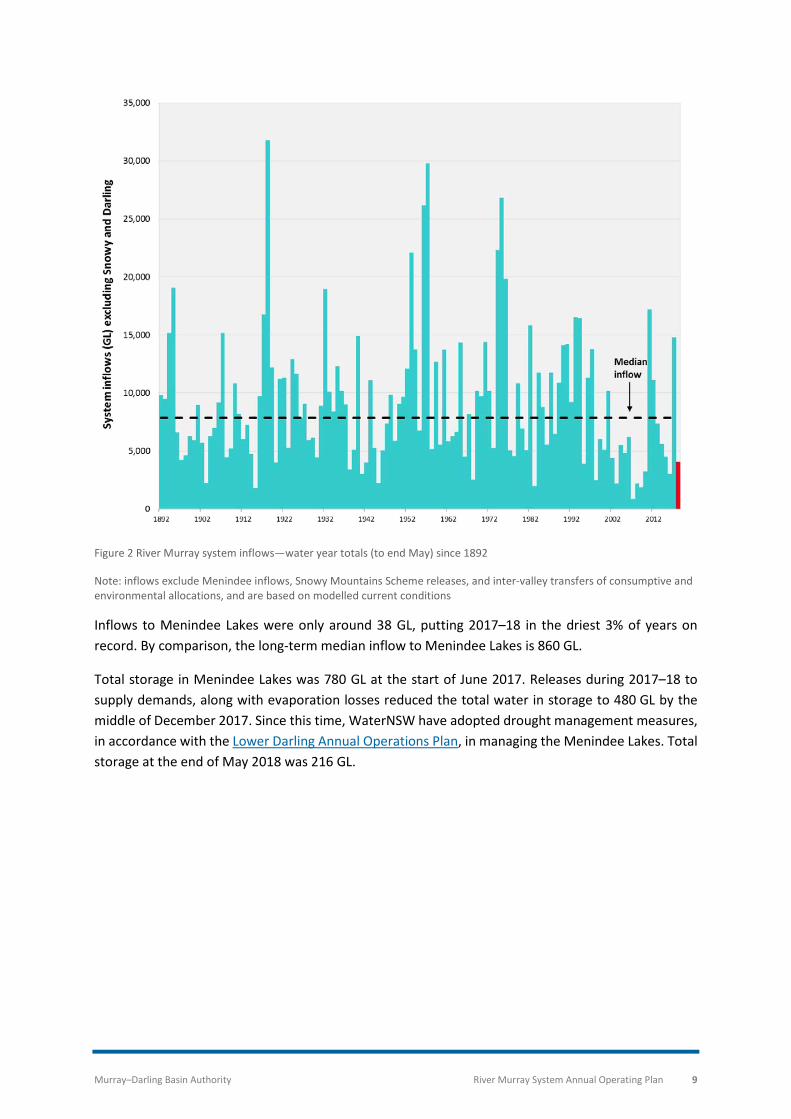
Figure 2 River Murray system inflows—water year totals (to end May) since 1892
Note: inflows exclude Menindee inflows, Snowy Mountains Scheme releases, and inter-valley transfers of consumptive and environmental allocations, and are based on modelled current conditions
Inflows to Menindee Lakes were only around 38 GL, putting 2017–18 in the driest 3% of years on record. By comparison, the long-term median inflow to Menindee Lakes is 860 GL.
Total storage in Menindee Lakes was 780 GL at the start of June 2017. Releases during 2017–18 to supply demands, along with evaporation losses reduced the total water in storage to 480 GL by the middle of December 2017. Since this time, WaterNSW have adopted drought management measures, in accordance with the Lower Darling Annual Operations Plan, in managing the Menindee Lakes. Total storage at the end of May 2018 was 216 GL.
Murray–Darling Basin Authority River Murray System Annual Operating Plan 10
Figure 3 River Murray system inflows June 2017 to May 2018, compared with recent years and long-term averages
Murray–Darling Basin Authority River Murray System Annual Operating Plan 11
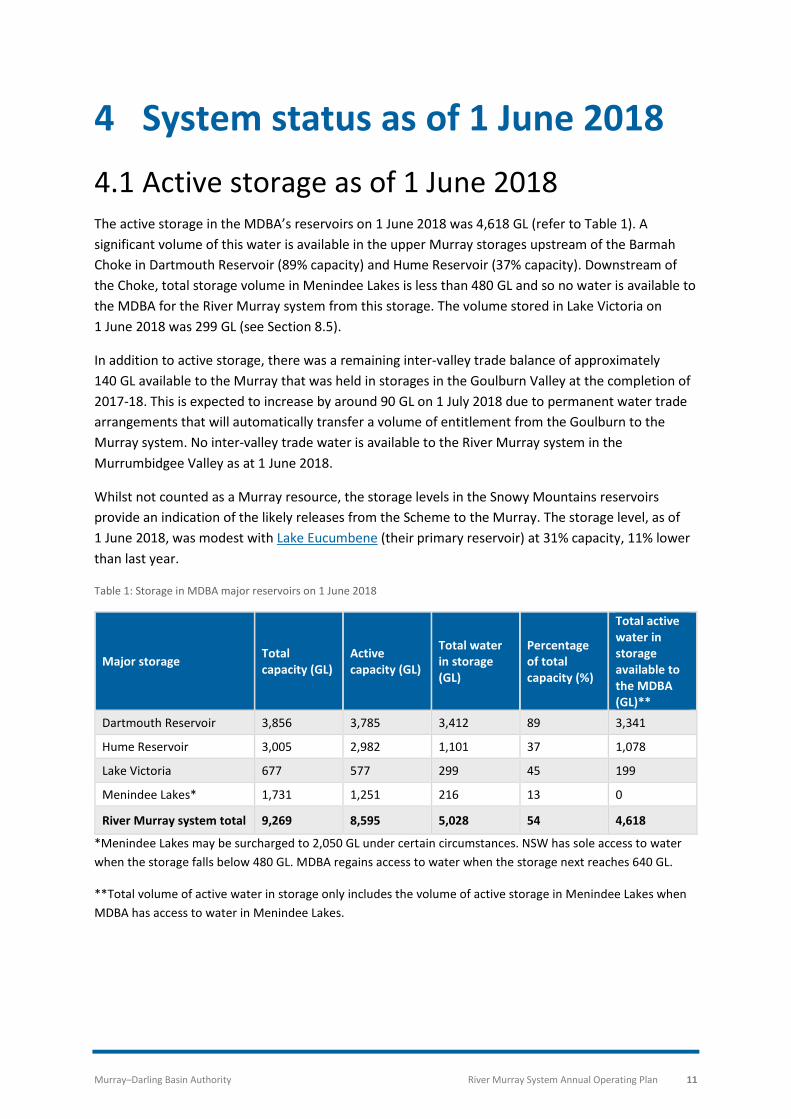
4 System status as of 1 June 2018 4.1 Active storage as of 1 June 2018 The active storage in the MDBA’s reservoirs on 1 June 2018 was 4,618 GL (refer to Table 1). A significant volume of this water is available in the upper Murray storages upstream of the Barmah Choke in Dartmouth Reservoir (89% capacity) and Hume Reservoir (37% capacity). Downstream of the Choke, total storage volume in Menindee Lakes is less than 480 GL and so no water is available to the MDBA for the River Murray system from this storage. The volume stored in Lake Victoria on 1 June 2018 was 299 GL (see Section 8.5).
In addition to active storage, there was a remaining inter-valley trade balance of approximately 140 GL available to the Murray that was held in storages in the Goulburn Valley at the completion of 2017-18. This is expected to increase by around 90 GL on 1 July 2018 due to permanent water trade arrangements that will automatically transfer a volume of entitlement from the Goulburn to the Murray system. No inter-valley trade water is available to the River Murray system in the Murrumbidgee Valley as at 1 June 2018.
Whilst not counted as a Murray resource, the storage levels in the Snowy Mountains reservoirs provide an indication of the likely releases from the Scheme to the Murray. The storage level, as of 1 June 2018, was modest with Lake Eucumbene (their primary reservoir) at 31% capacity, 11% lower than last year.
Table 1: Storage in MDBA major reservoirs on 1 June 2018
Major storage Total capacity (GL)
Active capacity (GL)
Total water in storage (GL)
Percentage of total capacity (%)
Total active water in storage available to the MDBA (GL)**
Dartmouth Reservoir 3,856 3,785 3,412 89 3,341
Hume Reservoir 3,005 2,982 1,101 37 1,078
Lake Victoria 677 577 299 45 199
Menindee Lakes* 1,731 1,251 216 13 0
River Murray system total 9,269 8,595 5,028 54 4,618
*Menindee Lakes may be surcharged to 2,050 GL under certain circumstances. NSW has sole access to water when the storage falls below 480 GL. MDBA regains access to water when the storage next reaches 640 GL.
**Total volume of active water in storage only includes the volume of active storage in Menindee Lakes when MDBA has access to water in Menindee Lakes.
Murray–Darling Basin Authority River Murray System Annual Operating Plan 12
4.2 Critical human water needs and conveyance reserve
The MDBA has declared that the River Murray system is currently in ‘Tier 1’ conditions. This means 'normal' water sharing arrangements apply.
Tier 1 water sharing arrangements occur when there is sufficient water available to operate the river for the year (conveyance water), meet critical human water needs (NSW 61 GL, Victoria 77 GL and South Australia 204 GL) and support starting seasonal allocations.
Under Tier 1 arrangements, States must also set aside a collective conveyance reserve of 225 GL for the following year. The reserve is to safeguard the delivery of next year’s critical human water needs in case extremely dry conditions prevail. The full conveyance reserve for 2019–20 has been set aside by the states along with sufficient water to meet critical human water needs in 2019–20.
Tier 1 water sharing arrangements are expected to continue for 2018–19. If inflows over 2018-19 are extremely low, and do not recover in 2019-20, there may not be sufficient water to sustain Tier 1 next year and delivery of critical human water needs may be a challenge. The probability of this occurring is low but nonetheless a possibility. The MDBA will liaise with partner governments to closely monitor risks and adjust plans accordingly in the knowledge that drought security is reliant on forward planning and the management of reserves.
Murray–Darling Basin Authority River Murray System Annual Operating Plan 13
5 Annual Operating Plan assumptions for 2018-19
5.1 Scenario Approach There are many variables that affect water availability which are inherently difficult to forecast. These variables include rainfall, soil moisture and water user demands. To account for the difficulties in accurately forecasting future water availability, six operational scenarios are provided. The six operational scenarios cover, in broad terms, the likely range of conditions and operations that are most likely in 2018–19.
Key assumptions in the scenarios include system inflows, conveyance losses, storage losses, environmental demand and consumptive demand.
System inflows cover releases from the Snowy Scheme, unregulated inflows into Dartmouth and Hume Reservoirs and tributaries inflows (including the Kiewa, Ovens, Goulburn, Murrumbidgee, and lower Darling Rivers).
The ‘environment’ is a relatively new and large ‘customer’ in the system. The pattern of environmental water demands is varied and different to consumptive (e.g. irrigation) demands. This inter-annual variability in demand presents a new challenge for annual operations planning. The assumptions on environmental water demands included in each of the scenarios are based on 2018 - 19 annual watering priorities published by each Environmental Water Holder (EWH). The main EWHs in the Murray and Darling systems are: the Commonwealth Environmental Water Holder, the Victorian Environmental Water Holder, the New South Wales’ Office of Environment and Heritage and The Living Murray initiative.
All scenarios start with the actual system conditions as of 1 June 2018 and assume Tier 1 water sharing arrangements (as discussed in Section 4.2). Water availability is calculated in accordance with the water sharing provisions of the Murray–Darling Basin Agreement using data available as of 1 June 2018, the annual assessment model (a simulation model of the system) and the assumptions for each scenario, all of which have been agreed to by the jurisdictions.
Murray–Darling Basin Authority River Murray System Annual Operating Plan 14
5.2 River Murray system scenarios for 2018–19
The six scenarios considered in this plan are labelled according to the assumed River Murray system inflows and are as follows:
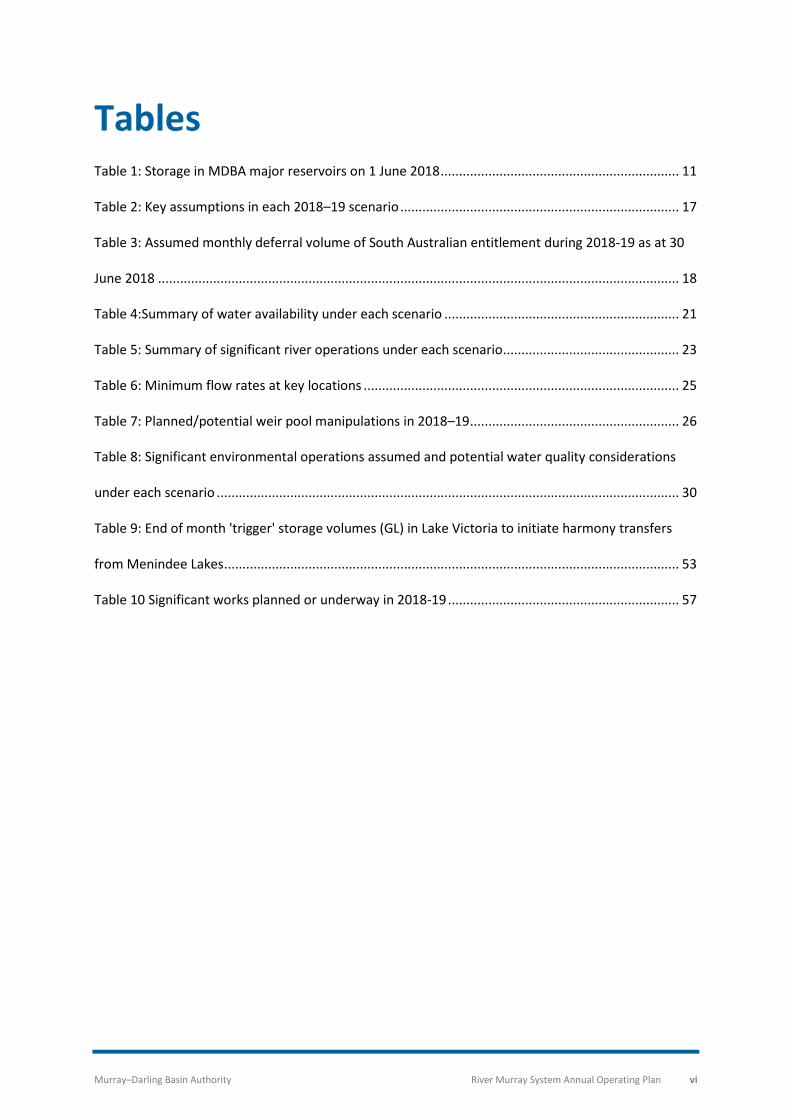
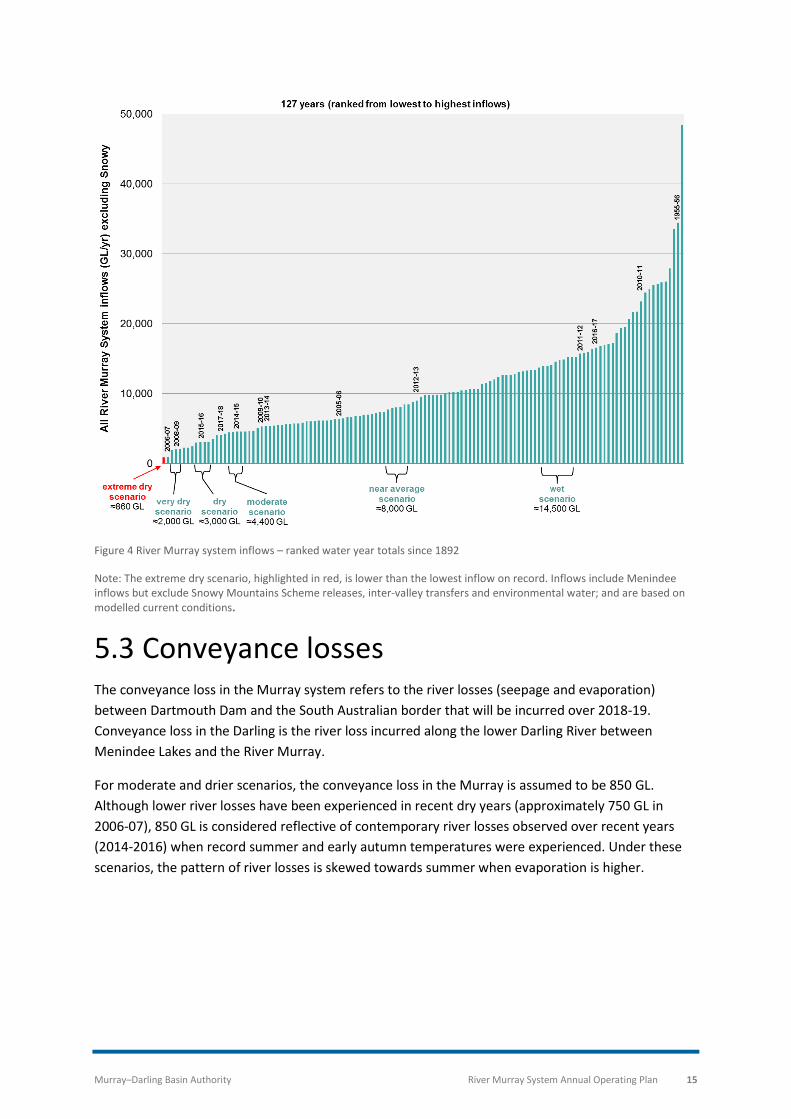
• Extreme dry scenario assumes annual River Murray system inflows of 860 GL. As shown in Figure 4, this is lower than the lowest inflow on record (914 GL in 2006-07)
• Very dry scenario assumes River Murray system inflows of about 2,000 GL (comparable to the 5th driest inflow year on record), which is comparable to inflows in 2008–09
• Dry scenario assumes River Murray system inflows of about 3,000 GL (comparable to the 10th driest inflow year on record), which is comparable to inflows in 2015–16
• Moderate scenario, assumes River Murray system inflows of about 4,400 GL (comparable to the 25th driest inflow year on record), which is comparable to inflows in 2014–15
• Near average scenario, assumes River Murray system inflows of about 8,000 GL (comparable to a 50 percentile inflow year), which is comparable to inflows in 2012–13
• Wet scenario, assumes River Murray system inflows of about 14,500 GL (comparable to the 25th wettest inflow year on record), which is comparable to inflows in 2011–12.
The relationship between scenario inflows is shown in Figure 4.
The ‘worst case’ scenario determined under the Basin Plan 2012, equates to inflows of 650 GL. This is drier than the extreme dry scenario in this plan. The ‘worse case’ is not included in this plan as to eventuate, would require extreme dry conditions to persist for a prolonged period of 18 month or more for catchments to dry and tributary inflows to recede to extremely low levels. Whilst quite dry conditions were observed in 2017-18, a significant volume of water still remains in storage as at 1 June 2018. It is conceivable that if extreme dry conditions are observed in 2018–19, MDBA may include the ‘worst case’ scenario for operational planning in 2019–20.
As shown in Figure 4 significantly wetter years than the wet scenario have occurred in the past. Whilst it is possible 2018-19 may end up wetter than this plan’s wet scenario, given the dry conditions during autumn 2018, the wet scenario is considered a suitable scenario for this year’s operational planning.
Murray–Darling Basin Authority River Murray System Annual Operating Plan 15
Figure 4 River Murray system inflows – ranked water year totals since 1892
Note: The extreme dry scenario, highlighted in red, is lower than the lowest inflow on record. Inflows include Menindee inflows but exclude Snowy Mountains Scheme releases, inter-valley transfers and environmental water; and are based on modelled current conditions.
5.3 Conveyance losses The conveyance loss in the Murray system refers to the river losses (seepage and evaporation) between Dartmouth Dam and the South Australian border that will be incurred over 2018-19. Conveyance loss in the Darling is the river loss incurred along the lower Darling River between Menindee Lakes and the River Murray.
For moderate and drier scenarios, the conveyance loss in the Murray is assumed to be 850 GL. Although lower river losses have been experienced in recent dry years (approximately 750 GL in 2006-07), 850 GL is considered reflective of contemporary river losses observed over recent years (2014-2016) when record summer and early autumn temperatures were experienced. Under these scenarios, the pattern of river losses is skewed towards summer when evaporation is higher.
Murray–Darling Basin Authority River Murray System Annual Operating Plan 16
The conveyance loss for the moderate and drier scenarios assumes:
• river flows are at channel capacity or higher through the ‘Barmah Choke’ for at least two months of the year
• all major wetlands affected by regulated flows are connected at some stage of the year • any additional net losses caused by varying weir pool levels for environmental benefit are
debited to environmental entitlement holders and therefore not counted as a conveyance loss
• any additional net losses, due to environmental water contributing to river flows above channel capacity through the ‘Barmah Choke’, are not accounted as a conveyance loss as these are debited to environmental entitlement holders.
Under the moderate and drier scenarios no water in the Menindee Lakes system is available for the River Murray system and no inflows are assumed at Burtundy due to management of Menindee lakes to conserve water for local requirements including for Broken Hill.
For near average and wetter scenarios, the assumed conveyance loss in the Murray increases to 860 GL and 1,050 GL (Table 2) respectively. The additional conveyance loss under these wetter scenarios is attributed to increased evaporation, evapo-transpiration and seepage due to overbank flow and floodplain inundation that is expected to occur under these conditions. Darling system conveyance loss increases to 10 GL under the near average and 100 GL for the wet scenario.
While initially set for each scenario, the volume and pattern of water actually set aside for conveyance will be regularly reviewed by the MDBA and altered to suit the actual conditions as they develop. It is also important to remember that the pattern of actual losses, in both location and time, can be very different to those assumed in this operational plan.
In addition to the conveyance losses described above, the Murray-Darling Basin Agreement provides 696 GL to meet some of the dilution and losses downstream of the South Australian border.
As required under Tier 1 arrangements, for all scenarios the conveyance reserve for 2019-20 of 225 GL has been set aside at the beginning of 2018-19. This water is reserved for use in the following year.
Murray–Darling Basin Authority River Murray System Annual Operating Plan 17
Table 2: Key assumptions in each 2018–19 scenario
Item Type
Extreme dry (GL)
Very dry (GL) Dry (GL) Moderate
(GL)
Near average (GL)
Wet (GL)
Active MDBA storage on 1 June 2018 Input 4,620 4,620 4,620 4,620 4,620 4,620
Water available from Valley Accounts Input 140 140 140 140 140 140
Inflows from upstream of Albury (including Snowy Scheme release assumptions)
Input 920 1,900 2,630 3,360 4,510 6,200
Inflows from upstream of Menindee Input 0 0 0 0 690 2,690
Inflows from Victorian tributaries Input 230 660 890 1,400 2,610 4,420
Inflows from NSW tributaries Input 200 200 200 410 960 1,890
Conveyance losses upstream of South Australian Border
Commitment -850** -850 -850 -850 -860 -1,050
Conveyance losses along lower Darling River
Commitment 0 0 0 0 -10** -110
Conveyance Reserve for 2019–20 Commitment -225** -225 -225 -225 -225 -225
Storage losses upstream of the South Australian Border
Commitment -280** -290 -320 -340 -540 -860
Supply of South Australian Dilution and Loss Entitlement
Commitment -696** -696 -696 -696 -696 -696
Supply of Additional Dilution Flow to South Australia
Commitment 0 0 0 0 0 ~180
Supply of unregulated flow to South Australia Commitment 0 0 0 -90** -1,670 -4,700
Minimum reserve for 2019–20 Commitment 0 -80** -310 -570 -835 -835
Approximate water allocated to NSW, Victoria and South Australia (rounded) *
Total 4,100 5,400 6,100 7,200 8,800 11,700
*Includes carryover water and South Australia’s Storage Right (see Section 5.5).
** A negative value indicates water to be set aside or allocated to a conveyance reserve or loss commitment.
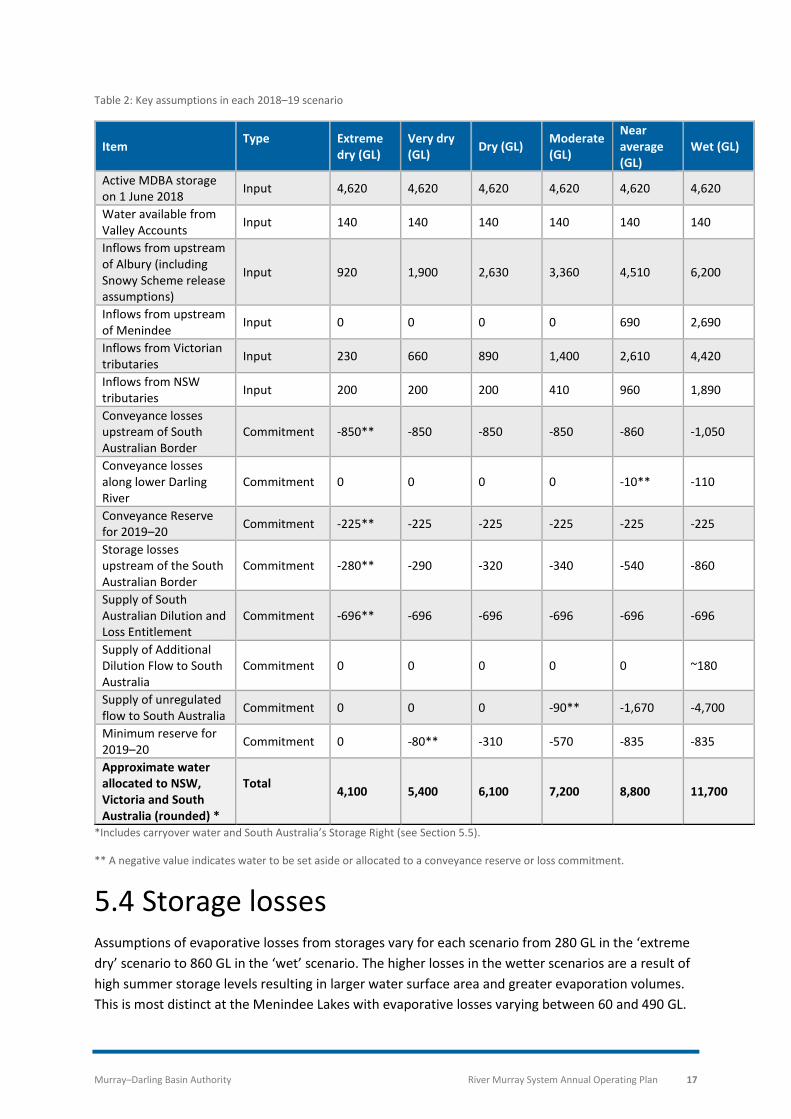
5.4 Storage losses Assumptions of evaporative losses from storages vary for each scenario from 280 GL in the ‘extreme dry’ scenario to 860 GL in the ‘wet’ scenario. The higher losses in the wetter scenarios are a result of high summer storage levels resulting in larger water surface area and greater evaporation volumes. This is most distinct at the Menindee Lakes with evaporative losses varying between 60 and 490 GL.
Murray–Darling Basin Authority River Murray System Annual Operating Plan 18
High summer rainfall, as occurred in 2011–12, can significantly reduce evaporative losses, but this has not been assumed in these scenarios.
5.5 South Australia’s Storage Right (Schedule G)
In response to the extreme drought conditions in 2006 and 2007, the Water Act (2007) includes provisions to improve security of supplies under a repeat of, or even worse, drought conditions. Two Schedules (Schedules G and H) to the Murray–Darling Basin Agreement have been enacted in this regard. These Schedules provide a process to allow for South Australia to defer and store a portion of its Entitlement Flow, without risk to Victorian and NSW water security, in order to safeguard the delivery of critical human water needs to South Australia during periods of severe drought. Additionally there are provisions for setting water aside for private carryover under Schedule G. South Australia has a Private Carryover Policy to guide the allocation of this water.
Water held in South Australia’s Storage Right is the first to spill, should physical spills or pre-flood releases occur at the relevant storage. Accordingly, during the unregulated flow event in December 2017, 22 GL of South Australian deferred Entitlement Flow stored in Lake Victoria at that time “spilled”, or in effect, was returned to South Australia.
From July 2017 to April 2018, South Australia set aside 115 GL for critical human water needs and private carryover from its monthly Entitlement Flow. Taking into account the volume set aside in previous years and after deductions for spills and evaporation, the total volume of water held in the South Australian Storage Right as of 1 June 2018 is 261 GL. Of this volume, 141 GL is stored in Dartmouth Reservoir, 120 GL is stored in Hume Reservoir and no water in Lake Victoria.
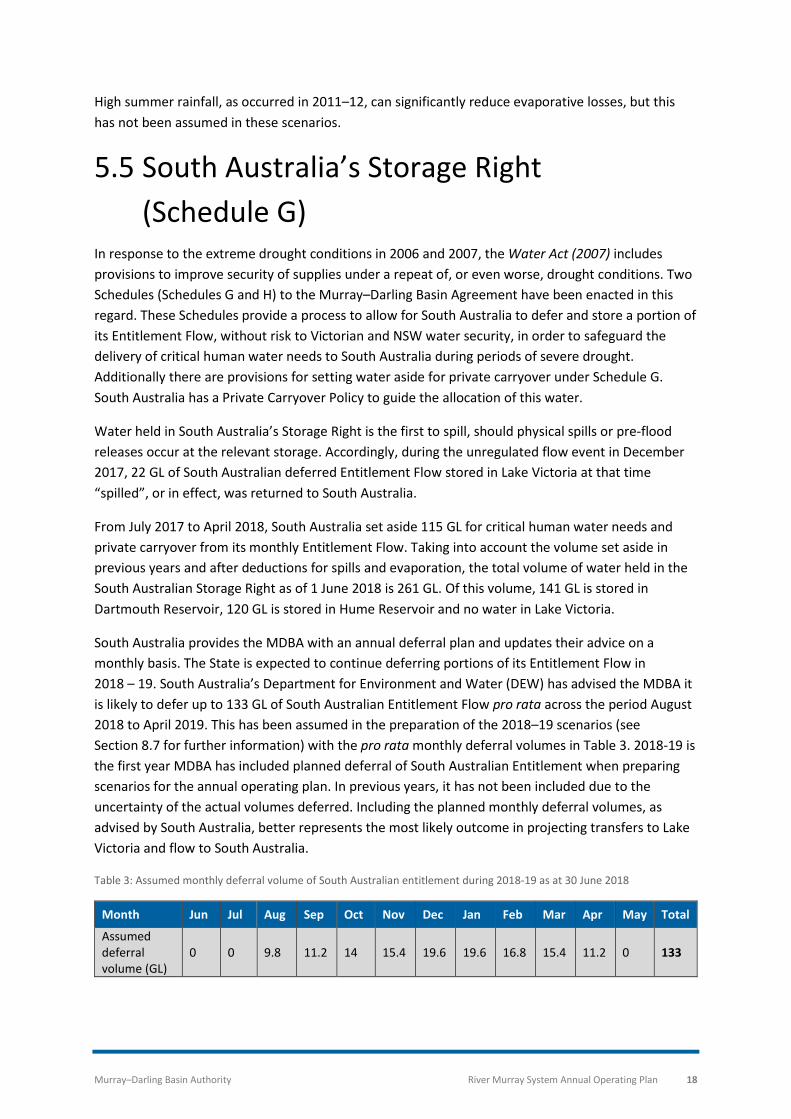
South Australia provides the MDBA with an annual deferral plan and updates their advice on a monthly basis. The State is expected to continue deferring portions of its Entitlement Flow in 2018 – 19. South Australia’s Department for Environment and Water (DEW) has advised the MDBA it is likely to defer up to 133 GL of South Australian Entitlement Flow pro rata across the period August 2018 to April 2019. This has been assumed in the preparation of the 2018–19 scenarios (see Section 8.7 for further information) with the pro rata monthly deferral volumes in Table 3. 2018-19 is the first year MDBA has included planned deferral of South Australian Entitlement when preparing scenarios for the annual operating plan. In previous years, it has not been included due to the uncertainty of the actual volumes deferred. Including the planned monthly deferral volumes, as advised by South Australia, better represents the most likely outcome in projecting transfers to Lake Victoria and flow to South Australia.
Table 3: Assumed monthly deferral volume of South Australian entitlement during 2018-19 as at 30 June 2018
Month Jun Jul Aug Sep Oct Nov Dec Jan Feb Mar Apr May Total
Assumed deferral volume (GL)
0 0 9.8 11.2 14 15.4 19.6 19.6 16.8 15.4 11.2 0 133
Murray–Darling Basin Authority River Murray System Annual Operating Plan 19
Actual decisions to defer and store Entitlement Flows throughout the year are informed by a number of factors including water availability, the weather outlook and flow and water level requirements downstream of Lock 1. There are currently no plans to call on any stored Entitlement Flow for delivery in 2018-19.
5.6 Scenario Updates Whilst the Annual Operating Plan is published annually, the scenarios in this plan are updated throughout the year to assist with operational planning. A formal update is published in October and at other times if deemed appropriate by the MDBA.
5.7 Limitations The scenarios in this plan indicate the water likely to be available to the states under a range of possible climatic conditions. The purpose of this information is to assist water managers and system operators with managing the risks of river operations and water supply. It is important to remember that the actual water available over the season will not follow a scenario but will fluctuate across these scenarios. Therefore the estimates of water availability in this plan are not suitable for, nor are they used for determination of allocations. Entitlement holders should regularly seek the latest information available from their respective water authority on announced allocations and outlooks for improvement.
Murray–Darling Basin Authority River Murray System Annual Operating Plan 20
6 Summary of water sharing across the scenarios
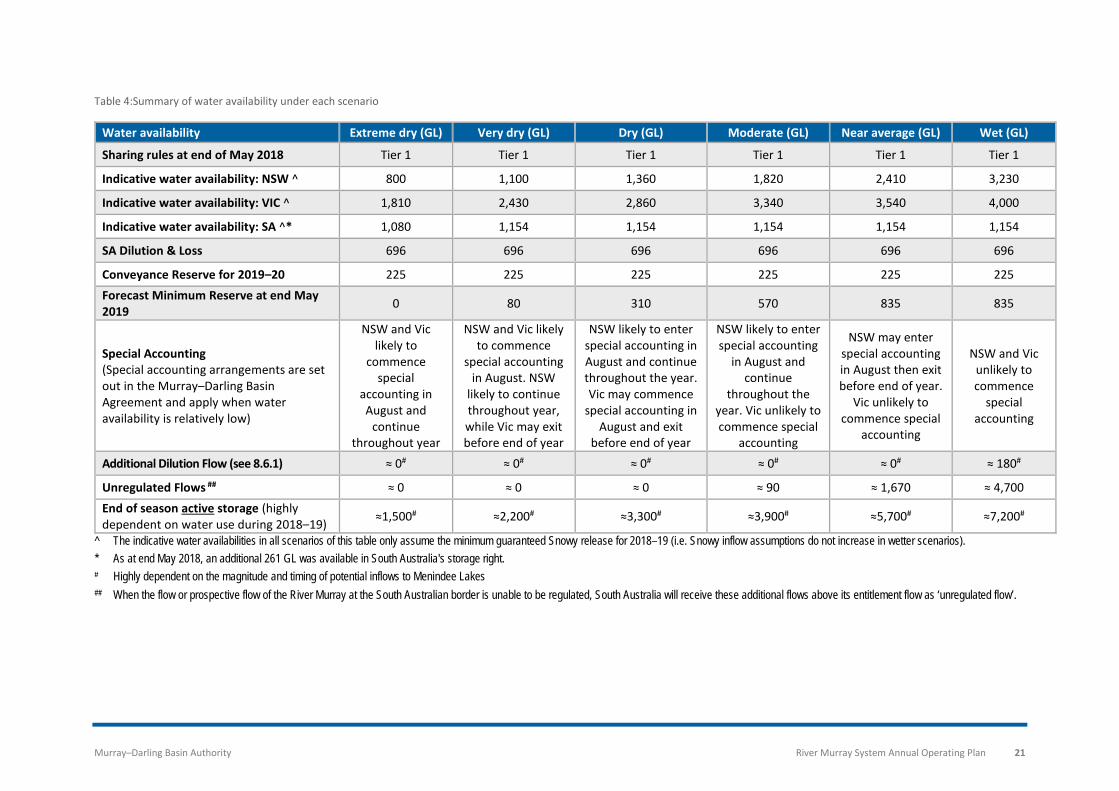
Estimates of state’s water resources for each scenario (outlined in Section 5.1) are summarised in Table 4. The quantity of water made available to States and significant decisions on river operations are primarily driven by the timing and location of inflow events and usage patterns.
Whilst lower than average inflows were recorded during 2017-18, and storage volumes have fallen below the long-term average, fairly significant volumes remain stored within Dartmouth and Hume Reservoirs as at 1 June 2018. This is predicted to have the following implications for water availability:
• Provided inflows are greater than the ‘extreme dry’ scenario, South Australia is likely to receive its full State Entitlement Flow of 1,850 GL.
• The Conveyance Reserve for 2019-20 has been set aside which means Tier 1 arrangements will remain in place for the current water year. The water sharing arrangements (Tier 1) between states, which are in effect at the start of 2018–19, are outlined in Part XII of the Murray–Darling Basin Agreement.
Water allocations for 2018-19 and carry over from 2017-18 are available from the following State websites:
NSW: www.water.nsw.gov.au/water-management/water-availability
VIC: nvrm.net.au/seasonal-determinations/current
SA: www.environment.sa.gov.au/managing-natural-resources/river-murray
State water allocations and improvements are highly dependent on weather and inflow conditions over the year.
Summary of important operational decisions for each scenario is discussed in Section 7.
Murray–Darling Basin Authority River Murray System Annual Operating Plan 21
Table 4:Summary of water availability under each scenario
Water availability Extreme dry (GL) Very dry (GL) Dry (GL) Moderate (GL) Near average (GL) Wet (GL)
Sharing rules at end of May 2018 Tier 1 Tier 1 Tier 1 Tier 1 Tier 1 Tier 1
Indicative water availability: NSW ^ 800 1,100 1,360 1,820 2,410 3,230
Indicative water availability: VIC ^ 1,810 2,430 2,860 3,340 3,540 4,000
Indicative water availability: SA ^* 1,080 1,154 1,154 1,154 1,154 1,154
SA Dilution & Loss 696 696 696 696 696 696
Conveyance Reserve for 2019–20 225 225 225 225 225 225 Forecast Minimum Reserve at end May 2019 0 80 310 570 835 835
Special Accounting (Special accounting arrangements are set out in the Murray–Darling Basin Agreement and apply when water availability is relatively low)
NSW and Vic likely to
commence special
accounting in August and
continue throughout year
NSW and Vic likely to commence
special accounting in August. NSW
likely to continue throughout year, while Vic may exit before end of year
NSW likely to enter special accounting in August and continue throughout the year. Vic may commence
special accounting in August and exit
before end of year
NSW likely to enter special accounting
in August and continue
throughout the year. Vic unlikely to commence special
accounting
NSW may enter special accounting in August then exit before end of year.
Vic unlikely to commence special
accounting
NSW and Vic unlikely to commence
special accounting
Additional Dilution Flow (see 8.6.1) ≈ 0# ≈ 0# ≈ 0# ≈ 0# ≈ 0# ≈ 180#
Unregulated Flows ## ≈ 0 ≈ 0 ≈ 0 ≈ 90 ≈ 1,670 ≈ 4,700 End of season active storage (highly dependent on water use during 2018–19) ≈1,500# ≈2,200# ≈3,300# ≈3,900# ≈5,700# ≈7,200#
^ The indicative water availabilities in all scenarios of this table only assume the minimum guaranteed Snowy release for 2018–19 (i.e. Snowy inflow assumptions do not increase in wetter scenarios). * As at end May 2018, an additional 261 GL was available in South Australia's storage right. # Highly dependent on the magnitude and timing of potential inflows to Menindee Lakes ## When the flow or prospective flow of the River Murray at the South Australian border is unable to be regulated, South Australia will receive these additional flows above its entitlement flow as ‘unregulated flow’.
Murray–Darling Basin Authority River Murray System Annual Operating Plan 22
7 System operations 7.1 Climate outlook Bureau of Meteorology’s (BoM) three month climate outlook released on 28 June 2018, indicates a significantly higher chance of drier and warmer than average conditions in the Murray-Darling Basin for the next three months.
While broad scale climate drivers, such as the El Niño–Southern Oscillation and the Indian Ocean Dipole have remained neutral in recent months, latest modelling suggests an increased likelihood of El Nino conditions developing in the coming months. In addition, below average pressure over the Tasman Sea, associated with warmer than average ocean temperatures, is likely to weaken the westerly winds that bring rain systems to southeast Australia. When considered together, these factors suggest that drier than average conditions are likely to develop across south-east Australia during the 2018 winter period.
As of mid-June, a number of fronts had delivered rainfall across the southern ranges resulting in a wetting up of catchments. In response, stream flows in the upper Murray catchments were starting to improve. Despite this, system inflows in June are likely to remain significantly below the long-term average, although above minimum levels.
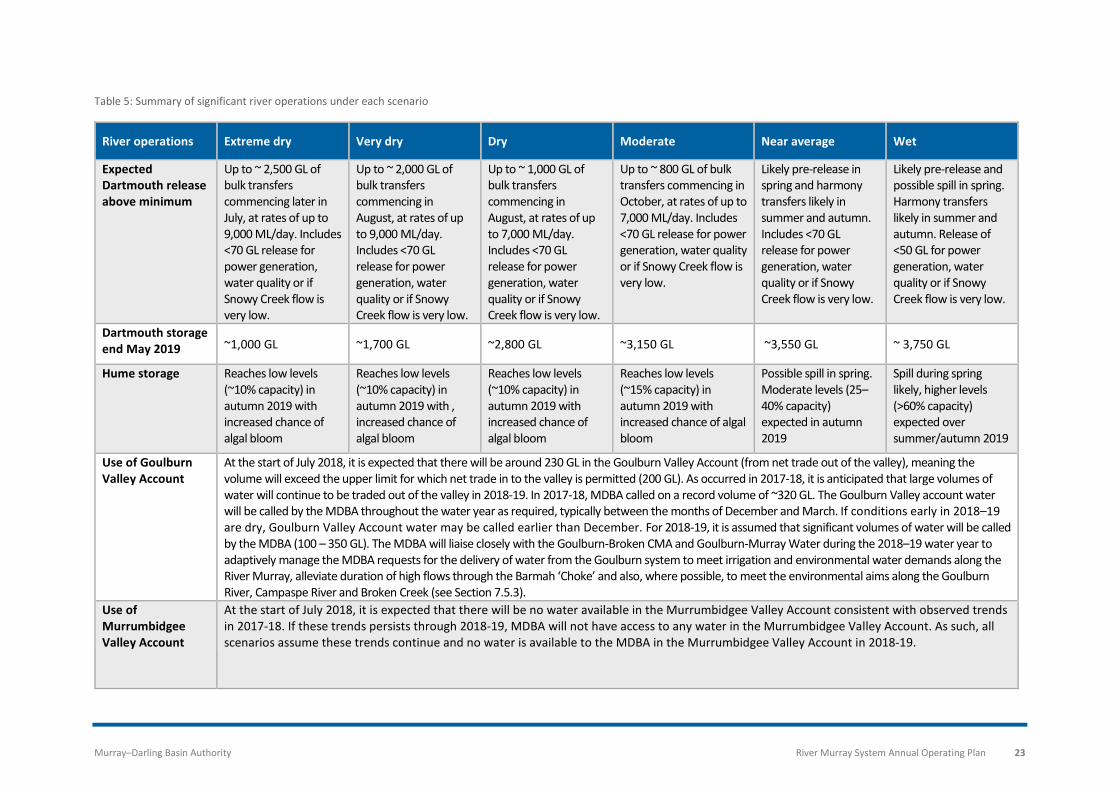
7.2 Significant operations Significant operational assumptions and outlooks from each scenario are summarised in Table 5. Outlooks related to environmental water management for the six scenarios are discussed in Section 7.5
Murray–Darling Basin Authority River Murray System Annual Operating Plan 23
Table 5: Summary of significant river operations under each scenario
River operations Extreme dry Very dry Dry Moderate Near average Wet
Expected Dartmouth release above minimum
Up to ~ 2,500 GL of bulk transfers commencing later in July, at rates of up to 9,000 ML/day. Includes <70 GL release for power generation, water quality or if Snowy Creek flow is very low.
Up to ~ 2,000 GL of bulk transfers commencing in August, at rates of up to 9,000 ML/day. Includes <70 GL release for power generation, water quality or if Snowy Creek flow is very low.
Up to ~ 1,000 GL of bulk transfers commencing in August, at rates of up to 7,000 ML/day. Includes <70 GL release for power generation, water quality or if Snowy Creek flow is very low.
Up to ~ 800 GL of bulk transfers commencing in October, at rates of up to 7,000 ML/day. Includes <70 GL release for power generation, water quality or if Snowy Creek flow is very low.
Likely pre-release in spring and harmony transfers likely in summer and autumn. Includes <70 GL release for power generation, water quality or if Snowy Creek flow is very low.
Likely pre-release and possible spill in spring. Harmony transfers likely in summer and autumn. Release of <50 GL for power generation, water quality or if Snowy Creek flow is very low.
Dartmouth storage end May 2019 ~1,000 GL ~1,700 GL ~2,800 GL ~3,150 GL ~3,550 GL ~ 3,750 GL
Hume storage Reaches low levels (~10% capacity) in autumn 2019 with increased chance of algal bloom
Reaches low levels (~10% capacity) in autumn 2019 with , increased chance of algal bloom
Reaches low levels (~10% capacity) in autumn 2019 with increased chance of algal bloom
Reaches low levels (~15% capacity) in autumn 2019 with increased chance of algal bloom
Possible spill in spring. Moderate levels (25–40% capacity) expected in autumn 2019
Spill during spring likely, higher levels (>60% capacity) expected over summer/autumn 2019
Use of Goulburn Valley Account
At the start of July 2018, it is expected that there will be around 230 GL in the Goulburn Valley Account (from net trade out of the valley), meaning the volume will exceed the upper limit for which net trade in to the valley is permitted (200 GL). As occurred in 2017-18, it is anticipated that large volumes of water will continue to be traded out of the valley in 2018-19. In 2017-18, MDBA called on a record volume of ~320 GL. The Goulburn Valley account water will be called by the MDBA throughout the water year as required, typically between the months of December and March. If conditions early in 2018–19 are dry, Goulburn Valley Account water may be called earlier than December. For 2018-19, it is assumed that significant volumes of water will be called by the MDBA (100 – 350 GL). The MDBA will liaise closely with the Goulburn-Broken CMA and Goulburn-Murray Water during the 2018–19 water year to adaptively manage the MDBA requests for the delivery of water from the Goulburn system to meet irrigation and environmental water demands along the River Murray, alleviate duration of high flows through the Barmah ‘Choke’ and also, where possible, to meet the environmental aims along the Goulburn River, Campaspe River and Broken Creek (see Section 7.5.3).
Use of Murrumbidgee Valley Account
At the start of July 2018, it is expected that there will be no water available in the Murrumbidgee Valley Account consistent with observed trends in 2017-18. If these trends persists through 2018-19, MDBA will not have access to any water in the Murrumbidgee Valley Account. As such, all scenarios assume these trends continue and no water is available to the MDBA in the Murrumbidgee Valley Account in 2018-19.
Murray–Darling Basin Authority River Murray System Annual Operating Plan 24
River operations Extreme dry Very dry Dry Moderate Near average Wet
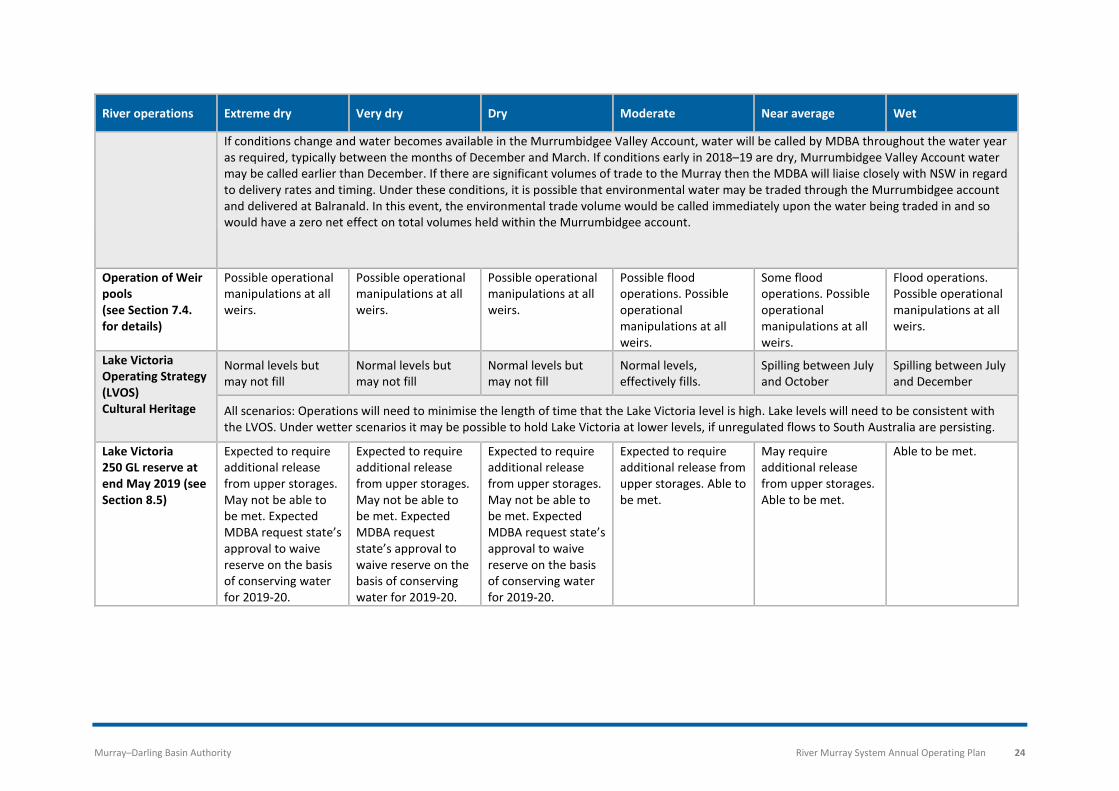
If conditions change and water becomes available in the Murrumbidgee Valley Account, water will be called by MDBA throughout the water year as required, typically between the months of December and March. If conditions early in 2018–19 are dry, Murrumbidgee Valley Account water may be called earlier than December. If there are significant volumes of trade to the Murray then the MDBA will liaise closely with NSW in regard to delivery rates and timing. Under these conditions, it is possible that environmental water may be traded through the Murrumbidgee account and delivered at Balranald. In this event, the environmental trade volume would be called immediately upon the water being traded in and so would have a zero net effect on total volumes held within the Murrumbidgee account.
Operation of Weir pools (see Section 7.4. for details)
Possible operational manipulations at all weirs.
Possible operational manipulations at all weirs.
Possible operational manipulations at all weirs.
Possible flood operations. Possible operational manipulations at all weirs.
Some flood operations. Possible operational manipulations at all weirs.
Flood operations. Possible operational manipulations at all weirs.
Lake Victoria Operating Strategy (LVOS) Cultural Heritage
Normal levels but may not fill
Normal levels but may not fill
Normal levels but may not fill
Normal levels, effectively fills.
Spilling between July and October
Spilling between July and December
All scenarios: Operations will need to minimise the length of time that the Lake Victoria level is high. Lake levels will need to be consistent with the LVOS. Under wetter scenarios it may be possible to hold Lake Victoria at lower levels, if unregulated flows to South Australia are persisting.
Lake Victoria 250 GL reserve at end May 2019 (see Section 8.5)
Expected to require additional release from upper storages. May not be able to be met. Expected MDBA request state’s approval to waive reserve on the basis of conserving water for 2019-20.
Expected to require additional release from upper storages. May not be able to be met. Expected MDBA request state’s approval to waive reserve on the basis of conserving water for 2019-20.
Expected to require additional release from upper storages. May not be able to be met. Expected MDBA request state’s approval to waive reserve on the basis of conserving water for 2019-20.
Expected to require additional release from upper storages. Able to be met.
May require additional release from upper storages. Able to be met.
Able to be met.
Murray–Darling Basin Authority River Murray System Annual Operating Plan 25
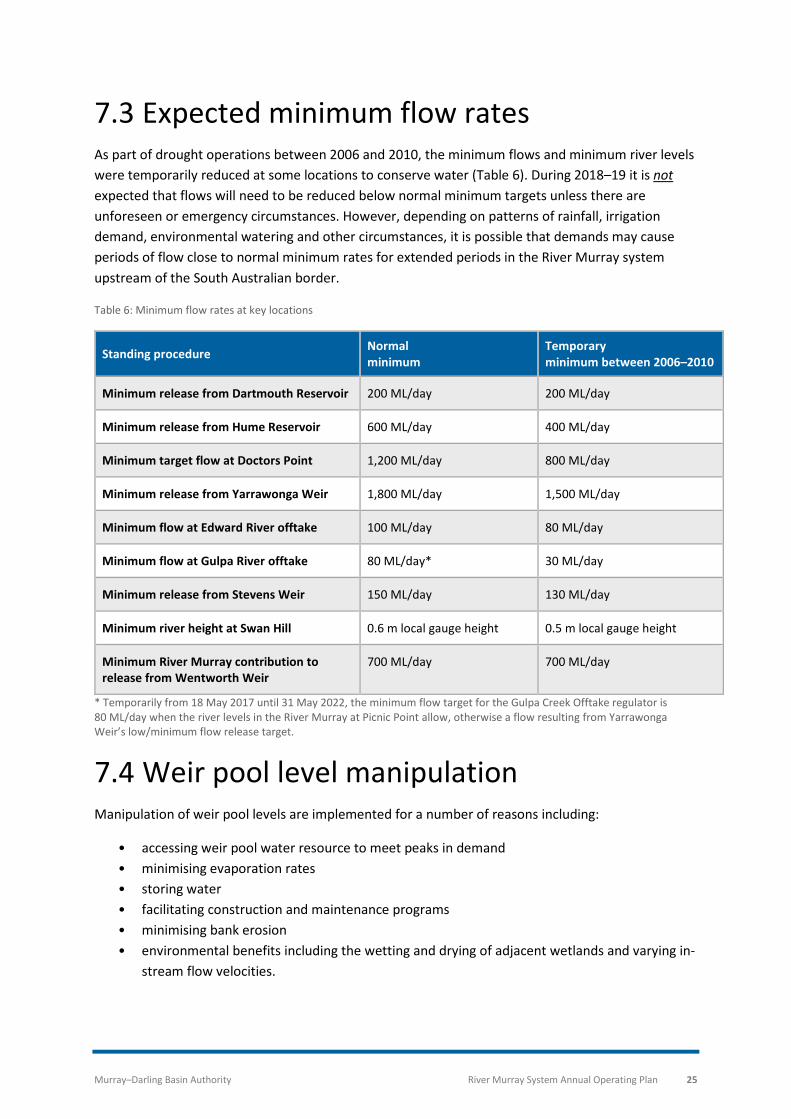
7.3 Expected minimum flow rates As part of drought operations between 2006 and 2010, the minimum flows and minimum river levels were temporarily reduced at some locations to conserve water (Table 6). During 2018–19 it is not expected that flows will need to be reduced below normal minimum targets unless there are unforeseen or emergency circumstances. However, depending on patterns of rainfall, irrigation demand, environmental watering and other circumstances, it is possible that demands may cause periods of flow close to normal minimum rates for extended periods in the River Murray system upstream of the South Australian border.
Table 6: Minimum flow rates at key locations
Standing procedure Normal minimum
Temporary minimum between 2006–2010
Minimum release from Dartmouth Reservoir 200 ML/day 200 ML/day
Minimum release from Hume Reservoir 600 ML/day 400 ML/day
Minimum target flow at Doctors Point 1,200 ML/day 800 ML/day
Minimum release from Yarrawonga Weir 1,800 ML/day 1,500 ML/day
Minimum flow at Edward River offtake 100 ML/day 80 ML/day
Minimum flow at Gulpa River offtake 80 ML/day* 30 ML/day
Minimum release from Stevens Weir 150 ML/day 130 ML/day
Minimum river height at Swan Hill 0.6 m local gauge height 0.5 m local gauge height
Minimum River Murray contribution to release from Wentworth Weir
700 ML/day 700 ML/day
* Temporarily from 18 May 2017 until 31 May 2022, the minimum flow target for the Gulpa Creek Offtake regulator is 80 ML/day when the river levels in the River Murray at Picnic Point allow, otherwise a flow resulting from Yarrawonga Weir’s low/minimum flow release target.
7.4 Weir pool level manipulation Manipulation of weir pool levels are implemented for a number of reasons including:
• accessing weir pool water resource to meet peaks in demand • minimising evaporation rates • storing water • facilitating construction and maintenance programs • minimising bank erosion • environmental benefits including the wetting and drying of adjacent wetlands and varying in-
stream flow velocities.
Murray–Darling Basin Authority River Murray System Annual Operating Plan 26
Variations in weir pool levels are becoming an increasingly common feature of routine river operations along the River Murray. If a weir pool needs to be raised or lowered outside its normal operating range, then state agencies would be notified via the WLWG. The public would be notified through the River Murray Weekly Report and via media releases where appropriate. Under high flow or flood events, such as those observed during 2016–17, many structures may be inundated or removed and, in such circumstances, the ability to undertake pool manipulations would be limited.
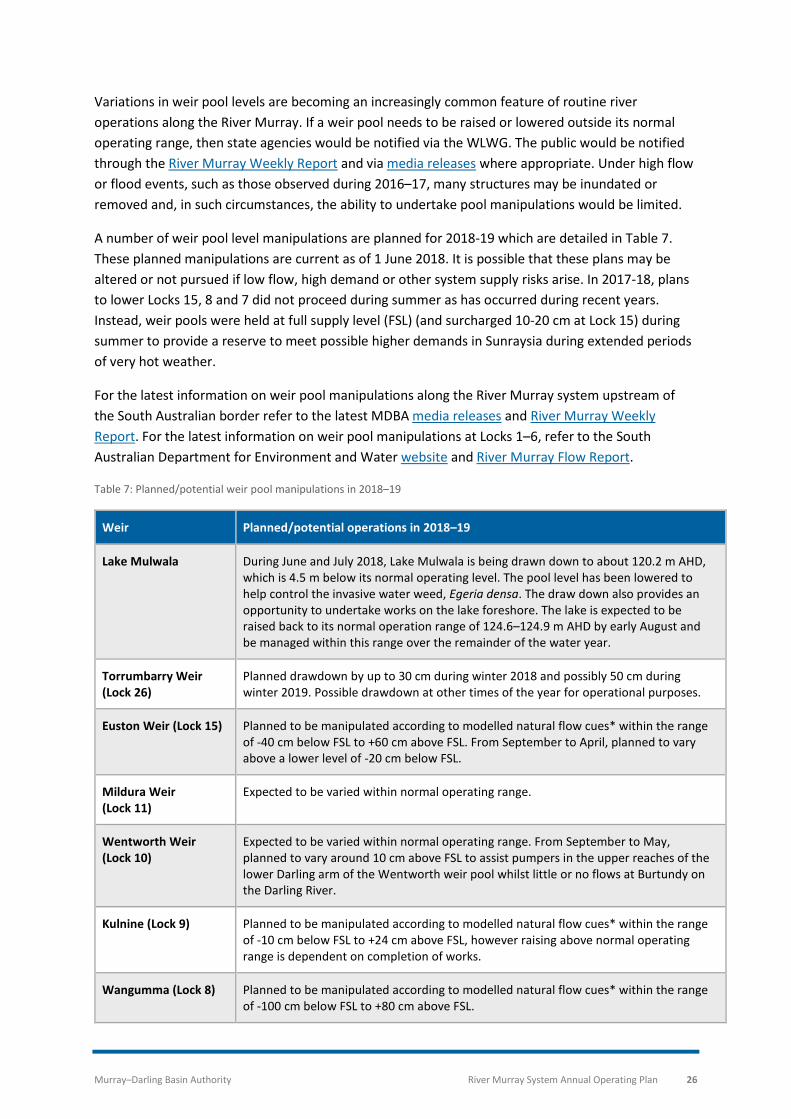
A number of weir pool level manipulations are planned for 2018-19 which are detailed in Table 7. These planned manipulations are current as of 1 June 2018. It is possible that these plans may be altered or not pursued if low flow, high demand or other system supply risks arise. In 2017-18, plans to lower Locks 15, 8 and 7 did not proceed during summer as has occurred during recent years. Instead, weir pools were held at full supply level (FSL) (and surcharged 10-20 cm at Lock 15) during summer to provide a reserve to meet possible higher demands in Sunraysia during extended periods of very hot weather.
For the latest information on weir pool manipulations along the River Murray system upstream of the South Australian border refer to the latest MDBA media releases and River Murray Weekly Report. For the latest information on weir pool manipulations at Locks 1–6, refer to the South Australian Department for Environment and Water website and River Murray Flow Report.
Table 7: Planned/potential weir pool manipulations in 2018–19
Weir Planned/potential operations in 2018–19
Lake Mulwala During June and July 2018, Lake Mulwala is being drawn down to about 120.2 m AHD, which is 4.5 m below its normal operating level. The pool level has been lowered to help control the invasive water weed, Egeria densa. The draw down also provides an opportunity to undertake works on the lake foreshore. The lake is expected to be raised back to its normal operation range of 124.6–124.9 m AHD by early August and be managed within this range over the remainder of the water year.
Torrumbarry Weir (Lock 26)
Planned drawdown by up to 30 cm during winter 2018 and possibly 50 cm during winter 2019. Possible drawdown at other times of the year for operational purposes.
Euston Weir (Lock 15) Planned to be manipulated according to modelled natural flow cues* within the range of -40 cm below FSL to +60 cm above FSL. From September to April, planned to vary above a lower level of -20 cm below FSL.
Mildura Weir (Lock 11)
Expected to be varied within normal operating range.
Wentworth Weir (Lock 10)
Expected to be varied within normal operating range. From September to May, planned to vary around 10 cm above FSL to assist pumpers in the upper reaches of the lower Darling arm of the Wentworth weir pool whilst little or no flows at Burtundy on the Darling River.
Kulnine (Lock 9) Planned to be manipulated according to modelled natural flow cues* within the range of -10 cm below FSL to +24 cm above FSL, however raising above normal operating range is dependent on completion of works.
Wangumma (Lock 8) Planned to be manipulated according to modelled natural flow cues* within the range of -100 cm below FSL to +80 cm above FSL.
Murray–Darling Basin Authority River Murray System Annual Operating Plan 27
Weir Planned/potential operations in 2018–19
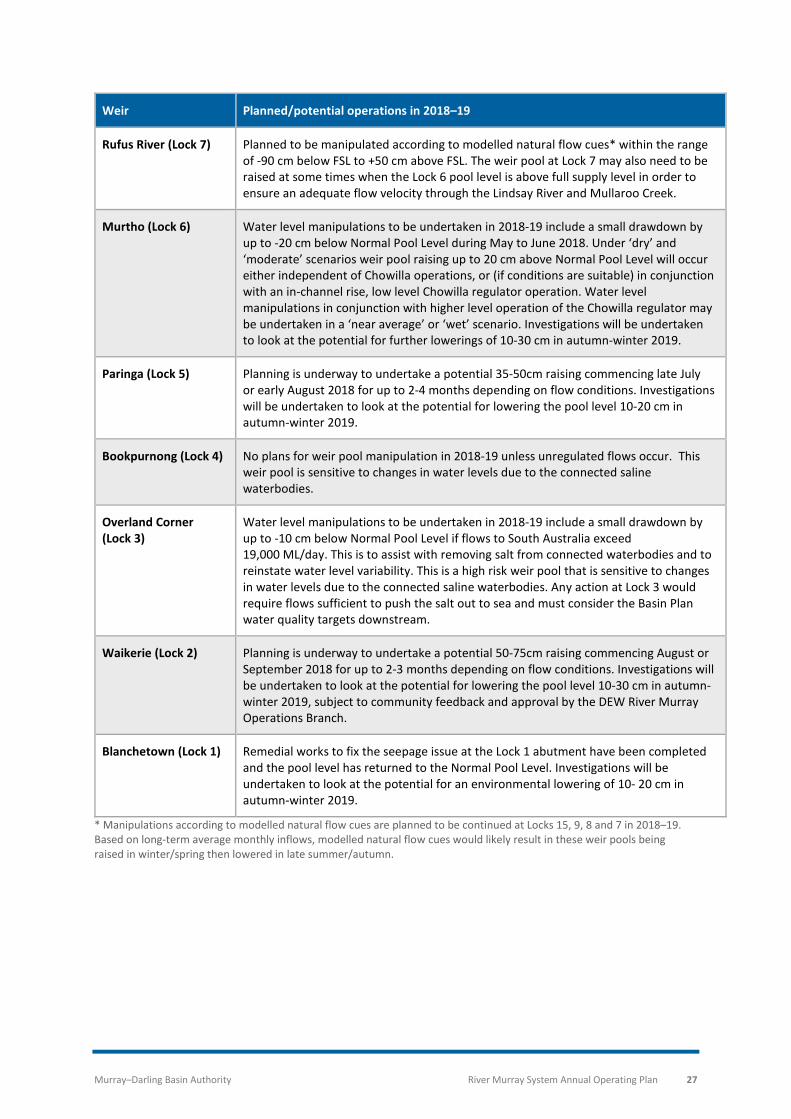
Rufus River (Lock 7) Planned to be manipulated according to modelled natural flow cues* within the range of -90 cm below FSL to +50 cm above FSL. The weir pool at Lock 7 may also need to be raised at some times when the Lock 6 pool level is above full supply level in order to ensure an adequate flow velocity through the Lindsay River and Mullaroo Creek.
Murtho (Lock 6) Water level manipulations to be undertaken in 2018-19 include a small drawdown by up to -20 cm below Normal Pool Level during May to June 2018. Under ‘dry’ and ‘moderate’ scenarios weir pool raising up to 20 cm above Normal Pool Level will occur either independent of Chowilla operations, or (if conditions are suitable) in conjunction with an in-channel rise, low level Chowilla regulator operation. Water level manipulations in conjunction with higher level operation of the Chowilla regulator may be undertaken in a ‘near average’ or ‘wet’ scenario. Investigations will be undertaken to look at the potential for further lowerings of 10-30 cm in autumn-winter 2019.
Paringa (Lock 5) Planning is underway to undertake a potential 35-50cm raising commencing late July or early August 2018 for up to 2-4 months depending on flow conditions. Investigations will be undertaken to look at the potential for lowering the pool level 10-20 cm in autumn-winter 2019.
Bookpurnong (Lock 4) No plans for weir pool manipulation in 2018-19 unless unregulated flows occur. This weir pool is sensitive to changes in water levels due to the connected saline waterbodies.
Overland Corner (Lock 3)
Water level manipulations to be undertaken in 2018-19 include a small drawdown by up to -10 cm below Normal Pool Level if flows to South Australia exceed 19,000 ML/day. This is to assist with removing salt from connected waterbodies and to reinstate water level variability. This is a high risk weir pool that is sensitive to changes in water levels due to the connected saline waterbodies. Any action at Lock 3 would require flows sufficient to push the salt out to sea and must consider the Basin Plan water quality targets downstream.
Waikerie (Lock 2) Planning is underway to undertake a potential 50-75cm raising commencing August or September 2018 for up to 2-3 months depending on flow conditions. Investigations will be undertaken to look at the potential for lowering the pool level 10-30 cm in autumn-winter 2019, subject to community feedback and approval by the DEW River Murray Operations Branch.
Blanchetown (Lock 1) Remedial works to fix the seepage issue at the Lock 1 abutment have been completed and the pool level has returned to the Normal Pool Level. Investigations will be undertaken to look at the potential for an environmental lowering of 10- 20 cm in autumn-winter 2019.
* Manipulations according to modelled natural flow cues are planned to be continued at Locks 15, 9, 8 and 7 in 2018–19. Based on long-term average monthly inflows, modelled natural flow cues would likely result in these weir pools being raised in winter/spring then lowered in late summer/autumn.
Murray–Darling Basin Authority River Murray System Annual Operating Plan 28
7.5 Delivering environmental water Similar to the inclusion of assumptions for consumptive demands, this annual operating plan includes assumptions on expected environmental water activities. These assumptions are based on preliminary consultation with the Commonwealth and state environmental water holders on how environmental water may be used in 2018-19. The assumptions included in this operating plan address watering activities that require the release of large volumes of water from storage. Smaller parcels of environmental water are also expected to be used in 2018–19; however are not described in this plan as these do not have a material impact on overall river operations.
The underlying assumptions regarding environmental watering activities in 2018-19 are to deliver water to continue to consolidate the positive environmental outcomes from the 2016 flooding, if sufficient water is available. Otherwise, if dry conditions prevail, the focus will be on supporting critical ecosystem processes, refuges and future needs.
Actual environmental water use will not necessarily match the assumed use in these scenarios. Rather, the scenarios provide an indication of what may occur based on current planning. Further information, plans and latest news on environmental water use in 2018–19 is available from the websites of the Victorian Environmental Water Holder, Commonwealth Environmental Water Office and the NSW Office of Environment and Heritage.
Table 8 provides outlooks related to environmental water management for the six different scenarios of this operating plan, with further information on key actions outlined below.
Release of environmental water from Hume Reservoir
In 2018–19, under all scenarios, significant volumes of environmental water are expected to be released from Hume Reservoir, with additional contributions from the Goulburn system and possibly the Murrumbidgee River. The volumes of Hume releases assumed in this operating plan range from 90 GL in the ‘extreme dry’ scenario up to 600 GL in the ‘near average’ scenario (see Table 8). These releases would, where possible, follow a similar pattern to natural inflows (otherwise known as ‘translucency’ flows). The releases are targeted at a broad-scale, low-level environmental watering event along the entire River Murray system all the way from Yarrawonga Weir to the Coorong and Murray Mouth in South Australia.
In the drier scenarios, the opportunity to release environmental water from Hume during late winter and spring, without causing flooding of the Barmah-Millewa Forest, is likely to be limited by transfers to Lake Victoria which are expected to occur at rates close to channel capacity downstream of Yarrawonga.
In the ‘moderate’ and ‘near average’ scenario, the opportunity to release environmental water is likely to be higher because Hume to Lake Victoria transfer volumes are lower. Also, natural cue triggers to deliver water overbank into the Barmah-Millewa Forest are more likely.
Murray–Darling Basin Authority River Murray System Annual Operating Plan 29
In the ‘wet’ scenario there may, at times, be limited opportunity to release environmental water due to very high flow rates and the risk of flooding. However, as in recent years, environmental water may be released to fill in gaps between high flow events, to ensure appropriate recession rates, to promote successful waterbird breeding and to provide flow variability to assist fish migration and spawning. Some environmental water may also be used to dilute blackwater (where low oxygen levels affect in-stream biota), if it occurs.
Environmental water released from Hume Reservoir is expected to be used at multiple sites as it flows down the river system. For example, water released from Hume may be used to increase the flow into Gunbower Forest. Accounted return flows from Gunbower to the Murray might then be pumped into Lake Wallawalla, with the remainder then contributing to higher flows into South Australia. In May 2018, the Basin Officials Committee approved the water accounting and delivery arrangements for a broad scale environmental watering occurring in 2018–19.
Barmah-Millewa Forest Under all scenarios, there are two potential environmental watering events proposed for Barmah-Millewa Forest in 2018–19. The first involves providing environmental water through the forest regulators on both the NSW and Victoria side to enable low level inundation and watering of crucial wetland and creek refuges in Barmah-Millewa Forest. This event is planned to be undertaken from early July to December when the flow rate through Barmah-Millewa Forest remains less than channel capacity.
In the scenarios where overbank flow into the Barmah–Millewa Forest is likely to occur, either naturally or as a result of operational transfers to Lake Victoria, the forest regulators will be further opened to allow passage of water as per standard operations. In these scenarios, natural overbank flows and operational transfers through the forest may be supplemented by extending with environmental water releases. As in other years, it is expected that any environmental flows will mainly focus on maintaining critical flows after flood peaks, providing flow pulses to assist fish spawning and migration, implementing a gradual recession of flows to minimise bank slumping and allowing waterbirds to complete breeding cycles (see Section 8.3.1 for further information).
NSW and Victoria have borrowed the majority of the Barmah-Millewa Environmental Water Allocation for 2018-19. This water will begin to be repaid when allocations reach 30% general security for NSW and 100% high reliability for Victoria.
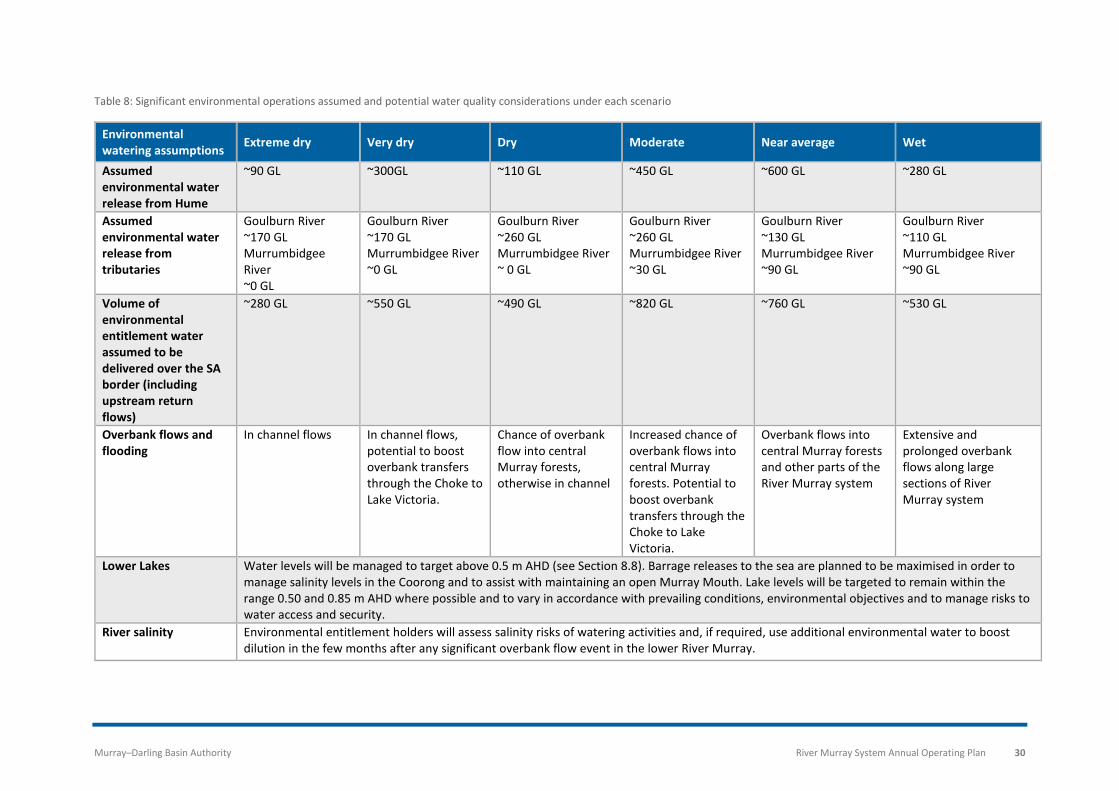
Murray–Darling Basin Authority River Murray System Annual Operating Plan 30
Table 8: Significant environmental operations assumed and potential water quality considerations under each scenario
Environmental watering assumptions Extreme dry Very dry Dry Moderate Near average Wet
Assumed environmental water release from Hume
~90 GL ~300GL ~110 GL ~450 GL ~600 GL ~280 GL
Assumed environmental water release from tributaries
Goulburn River ~170 GL Murrumbidgee River ~0 GL
Goulburn River ~170 GL Murrumbidgee River ~0 GL
Goulburn River ~260 GL Murrumbidgee River ~ 0 GL
Goulburn River ~260 GL Murrumbidgee River ~30 GL
Goulburn River ~130 GL Murrumbidgee River ~90 GL
Goulburn River ~110 GL Murrumbidgee River ~90 GL
Volume of environmental entitlement water assumed to be delivered over the SA border (including upstream return flows)
~280 GL ~550 GL ~490 GL ~820 GL ~760 GL ~530 GL
Overbank flows and flooding
In channel flows In channel flows, potential to boost overbank transfers through the Choke to Lake Victoria.
Chance of overbank flow into central Murray forests, otherwise in channel
Increased chance of overbank flows into central Murray forests. Potential to boost overbank transfers through the Choke to Lake Victoria.
Overbank flows into central Murray forests and other parts of the River Murray system
Extensive and prolonged overbank flows along large sections of River Murray system
Lower Lakes Water levels will be managed to target above 0.5 m AHD (see Section 8.8). Barrage releases to the sea are planned to be maximised in order to manage salinity levels in the Coorong and to assist with maintaining an open Murray Mouth. Lake levels will be targeted to remain within the range 0.50 and 0.85 m AHD where possible and to vary in accordance with prevailing conditions, environmental objectives and to manage risks to water access and security.
River salinity Environmental entitlement holders will assess salinity risks of watering activities and, if required, use additional environmental water to boost dilution in the few months after any significant overbank flow event in the lower River Murray.
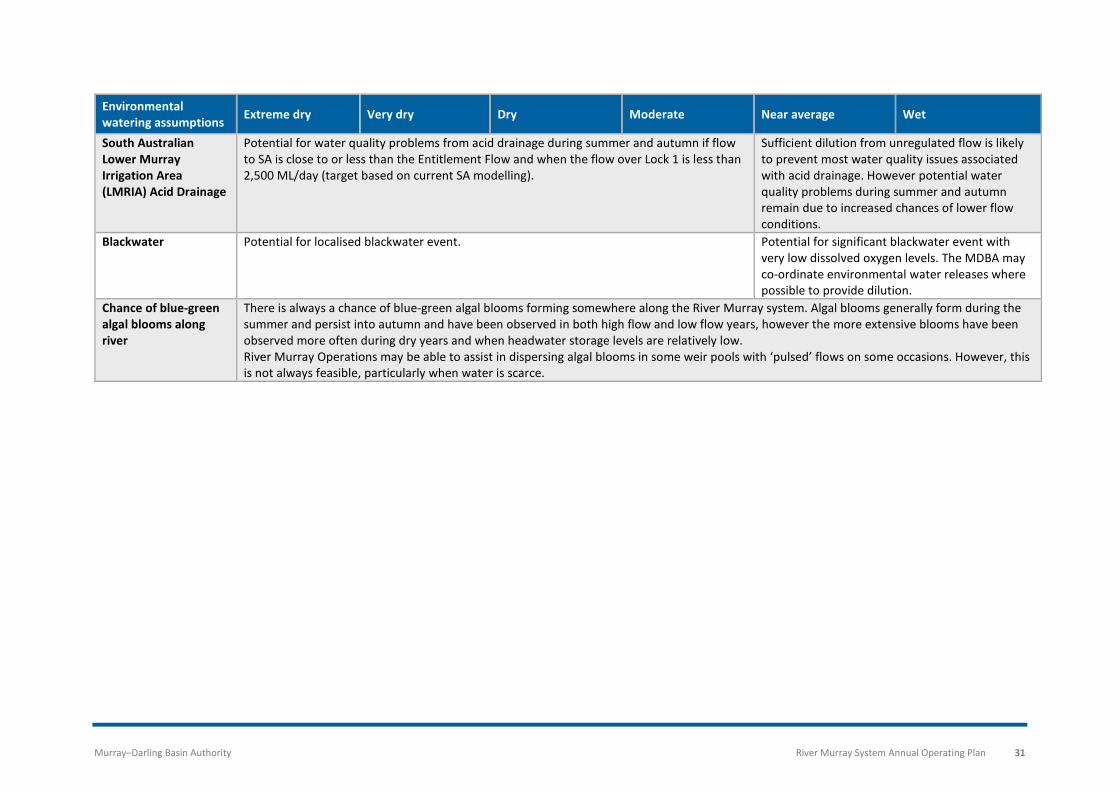
Murray–Darling Basin Authority River Murray System Annual Operating Plan 31
Environmental watering assumptions Extreme dry Very dry Dry Moderate Near average Wet
South Australian Lower Murray Irrigation Area (LMRIA) Acid Drainage
Potential for water quality problems from acid drainage during summer and autumn if flow to SA is close to or less than the Entitlement Flow and when the flow over Lock 1 is less than 2,500 ML/day (target based on current SA modelling).
Sufficient dilution from unregulated flow is likely to prevent most water quality issues associated with acid drainage. However potential water quality problems during summer and autumn remain due to increased chances of lower flow conditions.
Blackwater Potential for localised blackwater event. Potential for significant blackwater event with very low dissolved oxygen levels. The MDBA may co-ordinate environmental water releases where possible to provide dilution.
Chance of blue-green algal blooms along river
There is always a chance of blue-green algal blooms forming somewhere along the River Murray system. Algal blooms generally form during the summer and persist into autumn and have been observed in both high flow and low flow years, however the more extensive blooms have been observed more often during dry years and when headwater storage levels are relatively low. River Murray Operations may be able to assist in dispersing algal blooms in some weir pools with ‘pulsed’ flows on some occasions. However, this is not always feasible, particularly when water is scarce.
Murray–Darling Basin Authority River Murray System Annual Operating Plan 32
Environmental inflows from the Goulburn River As has been the case in recent years, significant environmental inflows from the Goulburn River are again expected in 2018–19. This operating plan assumes volumes of environmental water ranging between 110–260 GL depending on inflow conditions and delivery constraints. Under the current operational arrangements with each State and consistent with the Basin Plan obligations, it is expected that this environmental water will move through the system for reuse at sites within Victoria such as Gunbower Forest and Lake Wallawalla, and or to South Australia for use at Chowilla, the Lower Lakes, the Coorong and the Murray Mouth.
Environmental inflows from the Goulburn River are assumed for all scenarios with a large portion of the inflows delivered throughout the year in the form of elevated base flows with targeted ‘freshes’ (short periods of within-channel higher flows) in winter, spring and autumn. Smaller volumes of environmental water are also expected to enter the River Murray from lower Broken Creek and the Campaspe River throughout the year.
There may be times when delivery of environmental water in the Goulburn system is constrained by the operational need to call water from the Goulburn IVT account. Where possible the call on the IVT water will be shaped to help achieve environmental objectives in the Goulburn and Campaspe Rivers and lower Broken Creek. Co-ordination of the delivery of IVT account water with environmental and operational flows will be undertaken by the MDBA River Operations staff alongside Goulburn-Murray Water, Goulburn Broken Catchment Management Authority and relevant environmental water holders. Information on the delivery of IVT account water to the Murray will be provided to the public via the MDBA River Murray Operations Weekly Report and the Goulburn-Murray Water website as delivery arrangements are implemented.
It should also be noted that, as occurred in 2017-18, the delivery of very large volumes of Goulburn IVT account water over peak summer periods may compromise ecological objectives in the lower Goulburn and Campaspe Rivers. This is a real risk for 2018-19. In particular, if IVT water is required for sustained periods at rates above desired ecological limits to meet high demands downstream in the River Murray during summer and autumn.
Environmental inflows from the Murrumbidgee River This operating plan assumes volumes of environmental water ranging from 30 – 90 GL reaches the River Murray under the moderate and wetter scenarios. This water is delivered as spring and autumn pulses to enhance longitudinal connectivity along the Murrumbidgee River and into the River Murray for the benefit of native fish. The onward downstream delivery of this water into South Australia relies on necessary bulk entitlement delivery arrangements to be put in place by NSW water agencies.
Gunbower Creek and Gunbower Forest The Gunbower Forest, on the River Murray floodplain downstream of Echuca, is an important river red gum wetland complex. Environmental water can be delivered along the length of Gunbower Creek for fish outcomes, and or diverted from Gunbower Creek into the forest floodplain. Some
Murray–Darling Basin Authority River Murray System Annual Operating Plan 33
water from the forest watering events returns back to Gunbower Creek before re-joining the River Murray near Koondrook township.
Flows through Gunbower Creek are expected to be provided throughout the year in all scenarios. Of the total flow through the creek, the net use is expected to be about 25 GL.
For Gunbower Forest, floodplain watering in winter and spring 2018 is a high priority. Up to 82 GL is planned to be used from mid-June to early November. In this plan around 70 GL of use is assumed in the ‘moderate’ and drier scenarios. In the ‘near average’ and ‘wet’ scenario, lesser volumes are used due to natural overbank flooding.
For more information and the latest updates, see the Victorian Environmental Water Holder’s webpage for Gunbower Creek and Forest.
Koondrook–Perricoota Forest The environmental works at Koondrook–Perricoota Forest provide an opportunity for water to be diverted into the upstream end of the Koondrook–Perricoota State Forest where it flows through the forest into the Wakool River system. Structures located within the forest allow for some water to be returned directly to the River Murray, but only during very large watering events. In 2014–15, there was a small-scale commissioning of works at Koondrook–Perricoota which inundated approximately 4,500 ha of creeks and wetlands. In 2016–17, there was large-scale natural flooding of the forest. In 2017-18, a small volume naturally flowed into Koondrook–Perricoota in December 2017 when the flow downstream of Torrumbarry Weir peaked around 24,000 ML/day.
This plan does not currently factor in any delivery of environmental water into Koondrook-Perricoota Forest in 2018–19.
Watering of Hattah Lakes No environmental watering event is planned at Hattah Lakes for 2018–19 with objectives targeting a drying phase following consecutive years of inundation. Natural inflows are assumed to occur in winter–spring in the ‘near average’ and ‘wet’ scenarios.
For more information and the latest updates see the Victorian Environmental Water Holder’s webpage for Hattah Lakes.
Watering in the Lindsay-Wallpolla-Mulcra icon site Lindsay–Wallpolla and Mulcra Islands are comprised of three adjacent anabranch systems in north-west Victoria. In 2018–19, small scale watering is planned to focus on base flows, small wetlands and providing in-channel freshes, with less than 4 GL assumed to be used in all scenarios.
In ‘near average’ and ‘wet’ scenarios, up to 8 GL may be used to partially fill Lake Wallawalla.
For more information and the latest updates see Victorian Environmental Water Holder’s webpage for Lindsay-Wallpolla Islands.
Murray–Darling Basin Authority River Murray System Annual Operating Plan 34
Watering of the lower Darling and Great Darling Anabranch
As at 1 June 2018, the total volume stored in Menindee Lakes is 216 GL, and WaterNSW is implementing drought measures in accordance with the Lower Darling Annual Operations Plan. This includes releasing to the lower Darling River at rates below normal minimums in order to conserve water. In addition, installation of block banks in the lower Darling River downstream of Pooncarie is underway and due for completion in July 2018. Whilst these block banks are in place, inflows to the River Murray from the lower Darling River will be negligible. Without further significant inflows, releases at Weir 32 are likely to continue below normal minimums and there is unlikely to be additional water available for release to the lower Darling or the Anabranch on behalf of environmental water holders.
Should inflows improve over 2018-19, the decision to remove the block banks and make increased releases will be made by WaterNSW, until the volume stored in the Menindee Lake exceeds 640 GL.
In the ‘near average’ scenario, it is assumed small releases may be possible from around December 2018 targeting higher base flows in the lower Darling for native fish outcomes. However releases are at the discretion of WaterNSW. Under the ‘wet’ scenario, releases of larger volumes of water to the lower Darling on behalf of environmental water holders are likely in order to promote the maintenance and dispersal of native fish populations.
Whilst the storage volume in Menindee lakes remains below 640 GL, co-ordination of the delivery of environmental and operational flows will be undertaken by WaterNSW with DPI Water, local environmental managers and environmental water holders. If inflows are sufficient to return the storage volume above 640 GL, MDBA River Operations staff will also work with these agencies to co-ordinate releases of operational water to meet River Murray system requirements and benefit the ecology of the lower Darling River.
Environmental water reaching the River Murray would contribute to environmental flows into South Australia.
For more information, see the NSW Office of Environment and Heritage website on Murray and lower Darling watering priorities and the Commonwealth Environmental Water Office website on lower Murray-Darling water use.
Environmental water delivered to South Australia Significant volumes of environmental water are assumed to be delivered across the South Australian border in each of the scenarios of this operating plan, ranging from 280 GL in the ‘extreme dry’ scenario to 820 GL in the ‘moderate’ scenario (see Table 8). This environmental water is expected to comprise of water originating from Hume releases (see Section 7.5.1); and return flows from the Goulburn and Campaspe systems (see Section 7.5.3) and possibly the Murrumbidgee River (see Section 7.5.4). These volumes are considered to be in addition to approximately 200 GL of South Australian entitlements owned by environmental water holders. It is possible that this water may be traded for use elsewhere in the southern connected Basin, however this water and other environmental water may also be delivered
Murray–Darling Basin Authority River Murray System Annual Operating Plan 35
across the South Australian border using trade mechanisms. Further detail on the assumed pattern of this environmental water delivery to South Australia is described in Section 8.7.
Depending on the pattern and timing of delivery, environmental water delivered across the South Australian border may target environmental outcomes in the River Murray channel, at Chowilla floodplain, at other lower Murray floodplain sites, and/or the Lower Lakes and the Coorong.
Management of flows and water levels from the South Australia Border to the Murray Mouth is the responsibility of the South Australian Department for Environment and Water (DEW) in collaboration with SA Water. DEW, in exercising their responsibilities takes account of system and other advice provided by the MDBA and any arrangements agreed between the Commonwealth Environmental Water Office and DEW on the use and delivery of their environmental entitlements.
Watering via Chowilla works Further operation of the Chowilla floodplain infrastructure is planned to be undertaken during 2018. Volumes used on the floodplain could range between 4 and 160 GL and will depend on the flow rates into South Australia. In the driest case, only 4 GL is used to pump water to priority wetlands. In a ‘near average’ scenario up to 160 GL may be used to inundate the mid-level floodplain. In wetter scenarios, high River Murray levels naturally inundate the floodplain and less environmental water is required. For more information and the latest updates see the South Australian Department for Environment and Water wetlands website.
7.6 Capacity considerations There are a number of physical constraints in the system that can affect operations. One of these is the Barmah Choke where channel capacity is equivalent to a flow downstream of Yarrawonga of around 9,500 ML/day. This channel constraint means that if more than 9,500 ML/day of water is required downstream in the Murray, it needs to be sourced from tributary inflows downstream of the Choke (i.e. the Goulburn or Murrumbidgee) or at rates above the Choke channel capacity that result in inundation of the Barmah-Millewa Forest. Targeting flow rates above channel capacity to deliver more water through the Choke results in higher losses compared with flows confined to the main channel, and at certain times of the year, can have detrimental environmental impacts. For the purposes of this operational plan, it is assumed MDBA will not have access to the use of Murray Irrigation Limited’s infrastructure to move water around the Choke, which was also the case in 2017 - 18. If access becomes available, it will assist in reducing shortfall risks as well as risks to channel capacity due to increased erosion associated with sustained bank full flow conditions.
Flow constraints also exist in the Goulburn System, which limit the maximum daily call on water from the Goulburn inter-valley transfer account. In addition to these physical constraints, the MDBA in making regulated releases from headworks storages will not plan to exceed the maximum regulated flow limits that are set out in the ‘Objectives and Outcomes for River Operations in the River Murray System’.
If demands in the mid and lower Murray system are higher than the channel capacity available to deliver this water, then a system wide shortfall could arise. That is, demands may become greater
Murray–Darling Basin Authority River Murray System Annual Operating Plan 36
than the volume of water available in the river and water users’ access to water may be reduced. In operating the River Murray system, MDBA assesses channel capacity risks and takes action when required to mitigate the risks by implementing appropriate actions to increase the chances that demands will be supplied. Such actions include:
• Preparing and reviewing this operating plan • Reviewing forecast demands • Reviewing weather and tributary inflow forecasts • Reviewing minimum flow targets and storage targets in Lake Victoria under a range of
scenarios • Drawing on weir pool or mid-river storages to meet periods of peak demand • Arranging delivery of IVT water from tributaries downstream of the Choke • Managing the Barmah Choke trade restriction (see Section 7.7)
The MDBA is currently working with the partner governments to better understand system capacity risks resulting from changing operational and demand conditions. From this work, the MDBA and partner governments will develop and assess some potential longer term risk mitigation measures.
As demonstrated by the ‘dry’ scenario in this plan, the system could be operated without the requirement for operational flows above the Barmah Choke channel capacity however flows at or near channel capacity rates for extended periods would be necessary (i.e. from around August 2018 to April 2019). To meet downstream requirements in this scenario, a record volume of Goulburn IVT water (similar to or possibly more than the volume delivered in 2017-18) is likely to be required and the opportunity to deliver environmental water to South Australia is reduced. This is based on the assumptions that:
• Delivering operational transfers at channel capacity through the Choke during late winter and spring 2018 limit the need to release environmental water from Hume to maintain minimum flows and provide ‘translucent’ releases within channel downstream of Yarrawonga;
• There is no natural cue trigger to deliver water overbank into the Barmah-Millewa forest; and
• Environmental water holders are unlikely to order water for delivery at the South Australian border when this is likely to increase the risk of system shortfalls.
Whilst this approach minimises system losses, there are increased erosive pressures on the Barmah Choke and lower Goulburn River channel, possible challenges in filling Lake Victoria and increased risks of shortfalls.
It would be more preferable, as shown in the ‘very dry’ and ‘moderate’ flow scenarios to have operational flows above channel capacity for a month or more. This approach would reduce pressure on the Barmah Choke and lower Goulburn River channel, provide more assurance of meeting operational targets for Lake Victoria and assist in mitigating shortfall risks. The timing of these operationally driven overbank flows would likely be aligned with Barmah-Millewa environmental requirements as described in Section 8.3 and provide favourable conditions for follow-up environmental watering actions in the forest if they are desired.
Murray–Darling Basin Authority River Murray System Annual Operating Plan 37
7.7 Barmah Choke trade restriction The Barmah Choke trade restriction is an important tool for assisting with managing pressure on the Barmah Choke. The net trade of allocations from above the Barmah Choke to downstream is not permitted. This means that trade from above to below the Barmah Choke may only occur when there has been sufficient matching trade from below to above the Barmah Choke. Without this trade restriction, a potentially large volume of trade water, in addition to the normal downstream demand, would place additional pressure on the limited channel capacity through the Barmah Choke.
The MDBA is authorised to temporarily relax this trade restriction, but has previously only done so under exceptional circumstances and when there was a low risk of affecting the delivery of water to meet the normal downstream demand and following consultation with the states.
Each of the six scenarios of this operating plan considers the key drivers of water delivery through the Barmah Choke including:
• current storage levels • potential future inflows, demands and system losses • the availability of water downstream of the Choke including in Menindee Lakes and from IVT
delivery from the Murrumbidgee and Goulburn Valleys • end of season reserve requirements in Lake Victoria.
This operating plan shows that for a wide range of scenarios, channel capacity through the Barmah Choke (currently equivalent to around 9,500 ML/day downstream of Yarrawonga Weir) would be reached, or nearly reached, for prolonged periods in 2018–19 to deliver required flows (Figure 9). As such, the default restriction on trade across the Choke will remain in place unless there are exceptional circumstances to warrant relaxation of the restriction. Exceptional circumstances that would lift the restriction may include an extreme dry scenario when total flows are unlikely to impact channel capacity limitations.
The MDBA and the WLWG will consider the issue of trade across the Choke if exceptional circumstances occur that might allow the relaxation of the restriction. Further information on the trade rule and the latest information on the current capacity to trade across the Choke can be found on the MDBA website.
7.8 Snowy Mountains Scheme Each year Snowy Hydro Limited (SHL) has an obligation to release water to the Murray and Murrumbidgee catchments. Releases to the Murray catchment are included as part of the River Murray system inflows and shared and accounted as outlined in Schedule F of the Murray–Darling Basin Agreement. Releases to the Murrumbidgee catchment are not part of the River Murray system and not included in this plan.
The minimum release obligation to the Murray from the Snowy, termed the Required Annual Release (RAR), is prescribed in the Snowy Water Licence (SWL). The RAR is a calculated number that varies throughout the year and between years and can be as high as around 1,000 GL (1,062 GL less the
Murray–Darling Basin Authority River Murray System Annual Operating Plan 38
water savings made to provide for environmental flows on the Murray and Snowy Rivers). In drier years the RAR can be considerably less. In 2017-18, the Murray RAR increased from an opening value of 220 GL on 1 May 2017 to a closing value of 415 GL. In this case the increase in the RAR was attributed to improvements in Snowy system inflows experienced as the year progressed.
In addition to the RAR, SHL may choose to make additional releases. The flexibility to make additional releases is set out in the SWL. There could be multiple reasons why SHL may choose to release more than the RAR ranging from managing high Snowy storage levels to generating hydroelectricity. There can be considerable flexibility on the timing of these additional releases and they can be of substantial volumes. For example, in 2017-18 SHL released a total of 1,107 GL into the Murray System of which 415 GL was the RAR and the remaining 692 GL was additional releases.
In considering possible scenarios, this operating plan has assumed, consistent with recent trends, SHL will release a total volume in excess of the 2018-19 RAR (this was 360 GL as at 1 May 2018). The ‘extreme dry’ scenario has assumed a conservative total SHL release of 500 GL. The ‘very dry’, ‘dry’ and ‘moderate’ scenarios have assumed a release of 780 GL, while in the ‘near average’ and ‘wet’ scenarios a release of 900 GL is assumed.
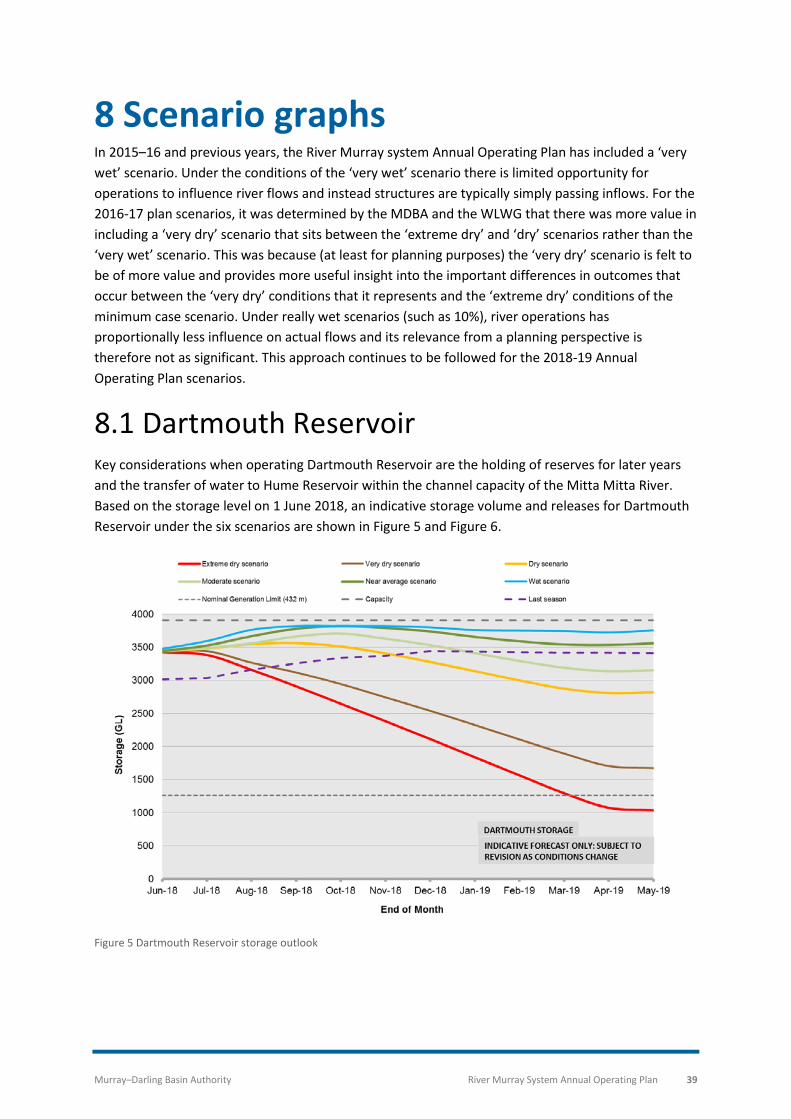
Murray–Darling Basin Authority River Murray System Annual Operating Plan 39
8 Scenario graphs In 2015–16 and previous years, the River Murray system Annual Operating Plan has included a ‘very wet’ scenario. Under the conditions of the ‘very wet’ scenario there is limited opportunity for operations to influence river flows and instead structures are typically simply passing inflows. For the 2016-17 plan scenarios, it was determined by the MDBA and the WLWG that there was more value in including a ‘very dry’ scenario that sits between the ‘extreme dry’ and ‘dry’ scenarios rather than the ‘very wet’ scenario. This was because (at least for planning purposes) the ‘very dry’ scenario is felt to be of more value and provides more useful insight into the important differences in outcomes that occur between the ‘very dry’ conditions that it represents and the ‘extreme dry’ conditions of the minimum case scenario. Under really wet scenarios (such as 10%), river operations has proportionally less influence on actual flows and its relevance from a planning perspective is therefore not as significant. This approach continues to be followed for the 2018-19 Annual Operating Plan scenarios.
8.1 Dartmouth Reservoir Key considerations when operating Dartmouth Reservoir are the holding of reserves for later years and the transfer of water to Hume Reservoir within the channel capacity of the Mitta Mitta River. Based on the storage level on 1 June 2018, an indicative storage volume and releases for Dartmouth Reservoir under the six scenarios are shown in Figure 5 and Figure 6.
Figure 5 Dartmouth Reservoir storage outlook
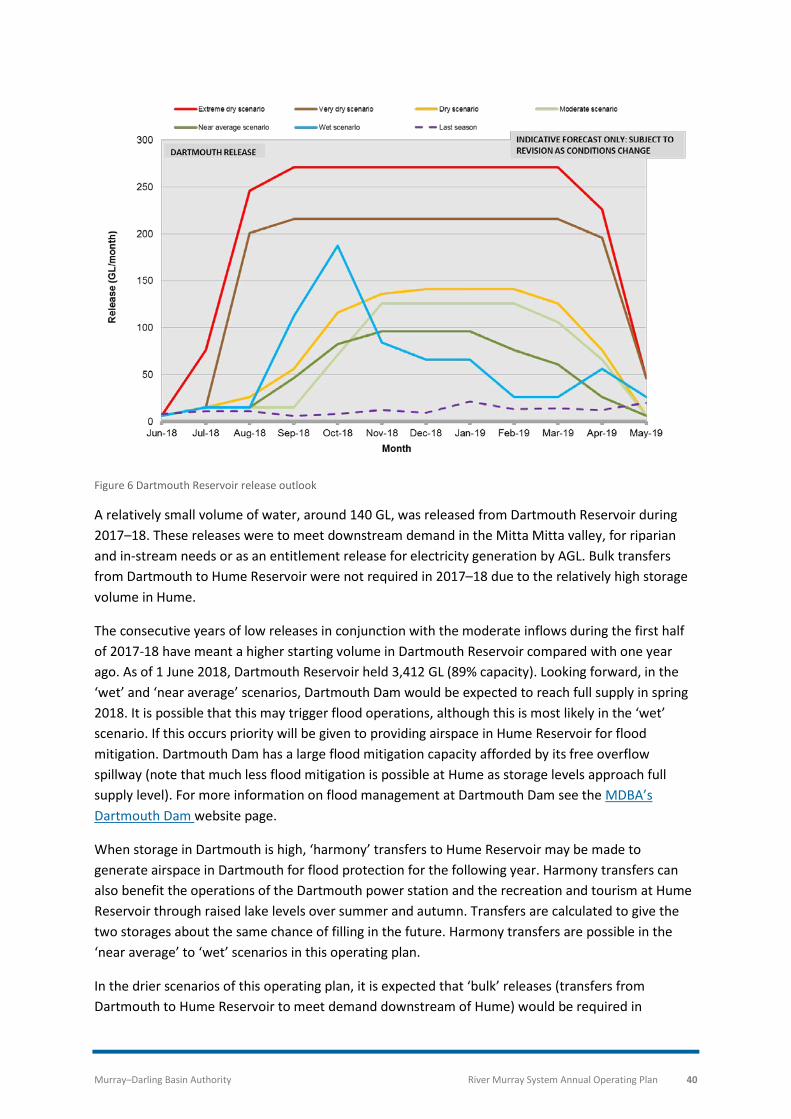
Murray–Darling Basin Authority River Murray System Annual Operating Plan 40
Figure 6 Dartmouth Reservoir release outlook
A relatively small volume of water, around 140 GL, was released from Dartmouth Reservoir during 2017–18. These releases were to meet downstream demand in the Mitta Mitta valley, for riparian and in-stream needs or as an entitlement release for electricity generation by AGL. Bulk transfers from Dartmouth to Hume Reservoir were not required in 2017–18 due to the relatively high storage volume in Hume.
The consecutive years of low releases in conjunction with the moderate inflows during the first half of 2017-18 have meant a higher starting volume in Dartmouth Reservoir compared with one year ago. As of 1 June 2018, Dartmouth Reservoir held 3,412 GL (89% capacity). Looking forward, in the ‘wet’ and ‘near average’ scenarios, Dartmouth Dam would be expected to reach full supply in spring 2018. It is possible that this may trigger flood operations, although this is most likely in the ‘wet’ scenario. If this occurs priority will be given to providing airspace in Hume Reservoir for flood mitigation. Dartmouth Dam has a large flood mitigation capacity afforded by its free overflow spillway (note that much less flood mitigation is possible at Hume as storage levels approach full supply level). For more information on flood management at Dartmouth Dam see the MDBA’s Dartmouth Dam website page.
When storage in Dartmouth is high, ‘harmony’ transfers to Hume Reservoir may be made to generate airspace in Dartmouth for flood protection for the following year. Harmony transfers can also benefit the operations of the Dartmouth power station and the recreation and tourism at Hume Reservoir through raised lake levels over summer and autumn. Transfers are calculated to give the two storages about the same chance of filling in the future. Harmony transfers are possible in the ‘near average’ to ‘wet’ scenarios in this operating plan.
In the drier scenarios of this operating plan, it is expected that ‘bulk’ releases (transfers from Dartmouth to Hume Reservoir to meet demand downstream of Hume) would be required in
Murray–Darling Basin Authority River Murray System Annual Operating Plan 41
2018 – 19. Where operationally possible, these transfers are timed to maximise environmental and community benefit.
The timing and release rates from Dartmouth will be greatly dependent on inflow and usage patterns and the storage volume in Hume Reservoir. Releases from the Snowy Mountains Scheme via Murray 1 power station (as discussed in Section 7.8) can contribute substantial volumes to Hume storage and influence the timing for bulk transfers. Broad assumptions have been made about the expected pattern of Snowy deliveries in 2018–19, however if these releases occur earlier than expected or are of larger volumes, this would delay the timing of bulk transfers, and transfers may also be at lower flow rates than they otherwise would.
Under the ‘extreme dry’ scenario, the plan indicates that bulk transfers may begin as early as July. If this scenario was to play out for the full year, the maximum volume of bulk transfers would be around 2,500 GL. This would cause a reduction in storage volume at Dartmouth to around 1,000 GL (26% capacity) by the end of the year. Inflows for June have been above those assumed in the ‘extreme dry’ scenario. This is likely to delay the need to commence bulk transfers until at least late July.
It is unlikely that bulk transfers will be required in the ‘near average’ or ‘wet’ scenarios.
Where possible, any transfers (including harmony transfers and bulk releases) from Dartmouth to Hume Reservoir will be made as a series of managed variable flows (also known as pulses) in accordance with the MDBA environmental guidelines for Dartmouth releases. Pulsing the releases from Dartmouth is designed to enhance the ecological values of the lower Mitta Mitta River and will aim to be less than 7,000 ML/day. However extended periods of higher releases of up to channel capacity (~9,800 ML/day) at Tallandoon cannot be ruled out, particularly under the ‘extreme dry’ and ‘very dry’ scenarios.
8.2 Hume Reservoir and flow at Doctors Point Hume Reservoir is the primary regulating structure in the River Murray system. Hume is used to store inflows from the upper Murray catchment as well as water released from the Snowy Mountains Scheme and Dartmouth Reservoir. This water is then released as needed, supplemented by downstream tributary inflows, to meet the consumptive and environmental needs of NSW, Victoria and South Australia.
There is almost no ability to surcharge Hume Reservoir under normal flood operations and therefore, under wetter scenarios, a small volume of airspace will aim to be maintained to assist in limiting damage caused by moderate to major floods. This will be achieved by passing smaller flow events through Lake Hume, with possibly little or no attenuation, if rainfall and streamflow conditions show this to be prudent. Such an operation aims to provide improved flood mitigation outcomes in any subsequent larger flood event. For very large floods, the ability for Hume Dam to mitigate downstream flooding is limited. More information on flood management at Hume Dam can be found on the MDBA website.
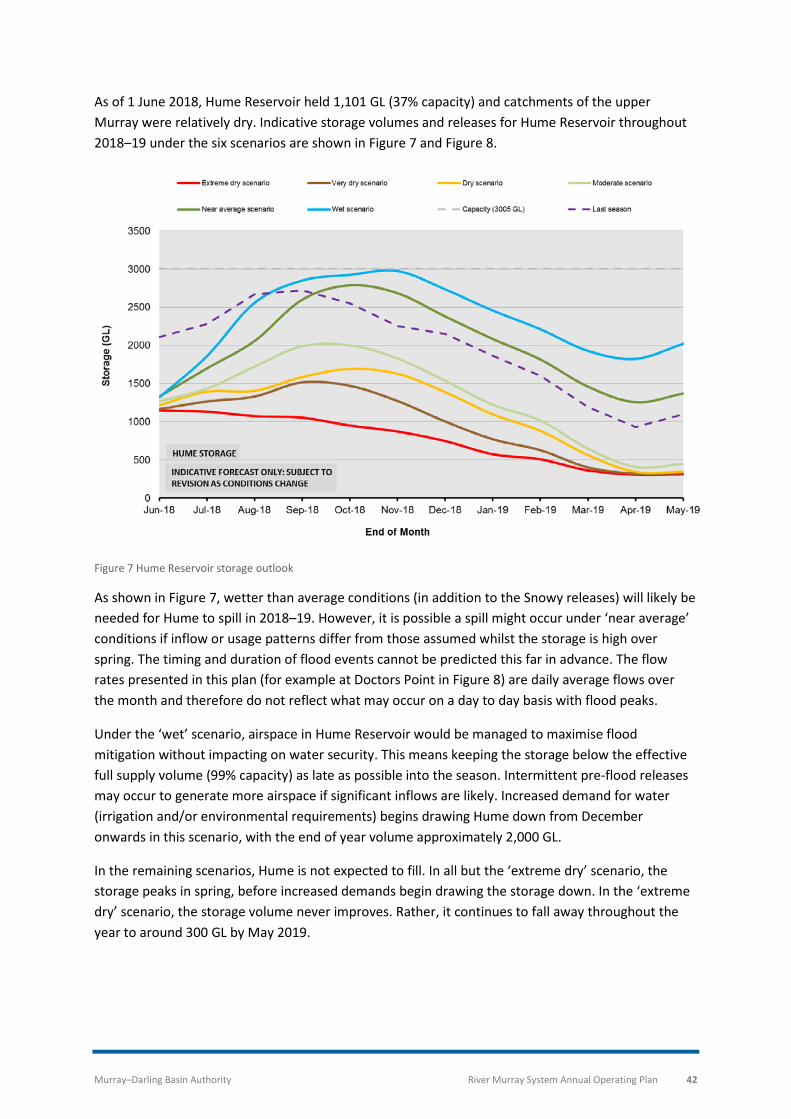
Murray–Darling Basin Authority River Murray System Annual Operating Plan 42
As of 1 June 2018, Hume Reservoir held 1,101 GL (37% capacity) and catchments of the upper Murray were relatively dry. Indicative storage volumes and releases for Hume Reservoir throughout 2018–19 under the six scenarios are shown in Figure 7 and Figure 8.
Figure 7 Hume Reservoir storage outlook
As shown in Figure 7, wetter than average conditions (in addition to the Snowy releases) will likely be needed for Hume to spill in 2018–19. However, it is possible a spill might occur under ‘near average’ conditions if inflow or usage patterns differ from those assumed whilst the storage is high over spring. The timing and duration of flood events cannot be predicted this far in advance. The flow rates presented in this plan (for example at Doctors Point in Figure 8) are daily average flows over the month and therefore do not reflect what may occur on a day to day basis with flood peaks.
Under the ‘wet’ scenario, airspace in Hume Reservoir would be managed to maximise flood mitigation without impacting on water security. This means keeping the storage below the effective full supply volume (99% capacity) as late as possible into the season. Intermittent pre-flood releases may occur to generate more airspace if significant inflows are likely. Increased demand for water (irrigation and/or environmental requirements) begins drawing Hume down from December onwards in this scenario, with the end of year volume approximately 2,000 GL.
In the remaining scenarios, Hume is not expected to fill. In all but the ‘extreme dry’ scenario, the storage peaks in spring, before increased demands begin drawing the storage down. In the ‘extreme dry’ scenario, the storage volume never improves. Rather, it continues to fall away throughout the year to around 300 GL by May 2019.
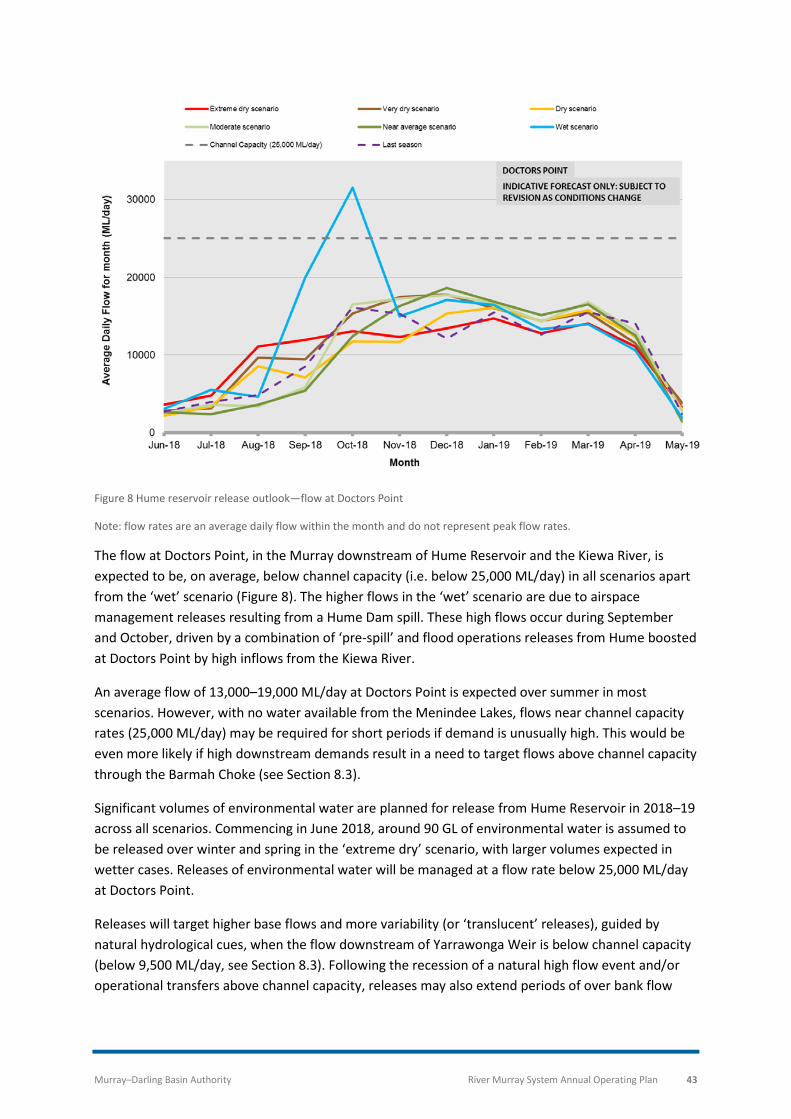
Murray–Darling Basin Authority River Murray System Annual Operating Plan 43
Figure 8 Hume reservoir release outlook—flow at Doctors Point
Note: flow rates are an average daily flow within the month and do not represent peak flow rates.
The flow at Doctors Point, in the Murray downstream of Hume Reservoir and the Kiewa River, is expected to be, on average, below channel capacity (i.e. below 25,000 ML/day) in all scenarios apart from the ‘wet’ scenario (Figure 8). The higher flows in the ‘wet’ scenario are due to airspace management releases resulting from a Hume Dam spill. These high flows occur during September and October, driven by a combination of ‘pre-spill’ and flood operations releases from Hume boosted at Doctors Point by high inflows from the Kiewa River.
An average flow of 13,000–19,000 ML/day at Doctors Point is expected over summer in most scenarios. However, with no water available from the Menindee Lakes, flows near channel capacity rates (25,000 ML/day) may be required for short periods if demand is unusually high. This would be even more likely if high downstream demands result in a need to target flows above channel capacity through the Barmah Choke (see Section 8.3).
Significant volumes of environmental water are planned for release from Hume Reservoir in 2018–19 across all scenarios. Commencing in June 2018, around 90 GL of environmental water is assumed to be released over winter and spring in the ‘extreme dry’ scenario, with larger volumes expected in wetter cases. Releases of environmental water will be managed at a flow rate below 25,000 ML/day at Doctors Point.
Releases will target higher base flows and more variability (or ‘translucent’ releases), guided by natural hydrological cues, when the flow downstream of Yarrawonga Weir is below channel capacity (below 9,500 ML/day, see Section 8.3). Following the recession of a natural high flow event and/or operational transfers above channel capacity, releases may also extend periods of over bank flow
Murray–Darling Basin Authority River Murray System Annual Operating Plan 44
through the Barmah Millewa Forest (up to a maximum release rate of 15,000 ML/day downstream of Yarrawonga Weir – see Section 8.3.1) or slow the rate of recession.
8.3 Lake Mulwala and the Barmah Choke The ‘Barmah Choke’ is a section of the River Murray (between Yarrawonga and Torrumbarry Weirs) that has the lowest capacity of any section of the river downstream of Hume Dam. The Barmah Choke is within an area of high ecological value: the Barmah–Millewa Forest.
The restricted channel capacity through the Barmah Choke limits the amount of water that can be delivered downstream (e.g. to the Torrumbarry Irrigation Area, Sunraysia, and South Australia). Choke capacity is likely to be an issue during 2018–19 if demands are high and tributary inflows (excluding environmental water) downstream of the Barmah Choke (e.g. from the Goulburn and Murrumbidgee Rivers) remain low. The risk of a shortfall in supply is increased when there is no water available in the Menindee Lakes. For information on the Barmah Choke trade restriction see Section 7.7. For more information on capacity issues see Section 7.6.
The capacity of the Choke varies over time and is influenced by both normal river flows and larger overbank flows. The MDBA undertakes regular gauging of the river to assess changes in the Choke capacity and uses this information to inform River Operations. Recent gauging suggest a decrease in channel capacity in line with historical trends. These reductions have now accumulated to an overall reduction that equates to a flow of around 9,500 ML/day downstream of Yarrawonga Weir.
Running the Choke at, or close to channel capacity, for extended periods increases erosive pressures on the channel banks through the Choke. Where erosion leads to bank slumping or erosion of the natural levee, channel capacity may be reduced. Erosion of the natural levee on the river bank leads to breakouts into the forest in isolated locations increasing the risk of unseasonal overbank flooding into the Barmah-Millewa Forest.
Some minor works to raise a short section of forest track and protect against localised breakouts has been planned and will be completed as soon as conditions are favourable. Further investigations are underway to examine whether a more substantial program of river bank stabilisation would be effective in reducing erosion and protecting channel capacity.
Releases from Lake Mulwala, through Yarrawonga Weir, in excess of about 9,500 ML/day are now sufficient to cause overbank flooding within Barmah-Millewa Forest. When ‘in channel’ flows are occurring, about 2,000 ML/day of the 9,500 ML/day is directed to the north via the Edward River and Gulpa Creek; with the remainder (about 7,500 ML/day) flowing south along the Murray past Picnic Point and towards Echuca.
Winter and spring The level in Lake Mulwala at the end of May 2018 was 3.1 m below the normal operating level of 124.7 m AHD. The Lake has subsequently been lowered further in early June and is expected to be held at about 4.5 m below FSL for most of June and early July. This lowering was undertaken to assist with control of the invasive water weed Egeria densa. The drawdown also provides an opportunity to undertake works on the lake foreshore. Gradual refilling of Lake Mulwala is expected to commence
Murray–Darling Basin Authority River Murray System Annual Operating Plan 45
from around mid-July, to enable filling of irrigation channels as required. The lake will be close to its normal operating level of 124.7 m AHD in time for the irrigation season in August. In the drier scenarios of this plan, inflows from the Kiewa and Ovens Rivers are not sufficient to refill the lake and additional water is released from Hume to achieve this.
Significant inflows from the Kiewa and/or Ovens River in winter-spring 2018 may lead to unregulated overbank events in the Barmah–Millewa Forest. During larger overbank flow events, the level of Lake Mulwala and releases from Yarrawonga Weir will be managed in accordance with flood operating procedures, being mindful of the environmental water proposals. Generally speaking, large inflow events can be expected to be passed ‘straight through’ Lake Mulwala in winter-spring with little mitigation as is the normal practice.
Any natural overbank flows may be followed up with environmental water released from Hume Reservoir to extend the period of inundation. This managed watering of Barmah–Millewa Forest is most likely to occur in the ‘near average’ and ‘wet’ scenarios (Figure 9) in which environmental water releases for watering of Barmah–Millewa Forest, if they occur, are planned to target a flow rate downstream of Yarrawonga of up to 15,000 ML/day. Under certain conditions a higher flow rate downstream of Yarrawonga of up to 18,000 ML/day may be deliberately targeted with environmental water, contingent upon environmental entitlement holder agreement and support from the Basin Officials Committee. However, even in the dry scenarios, a significant natural inflow event may result in overbank flows into the Barmah–Millewa Forest, which could be followed up by managed environmental flows or overbank transfers to Lake Victoria.
In the drier scenarios, ‘translucent’ releases of environmental water from Hume Reservoir are more likely to only contribute to flows within channel through the Barmah Choke (i.e. not exceeding 9,500 ML/day downstream release from Yarrawonga Weir). In all scenarios, during winter and spring while the flow is within channel, a portion of the ‘translucent’ releases is supplied through the Barmah-Millewa Forest regulators to facilitate watering of the major creek network within the forest.
In past years when flows through the Barmah Choke have been or were forecast to be at, or close to channel capacity, the MDBA has used available spare capacity in Murray Irrigation Limited (MIL) escapes to deliver additional water downstream via Mulwala Canal when required. However, as of June 2018, agreement on new commercial arrangements for the use of the MIL system had not been reached. No use of MIL irrigation escapes to transfer additional flow downstream of the Barmah Choke is assumed in any scenario.
Planned regulated releases up to 15,000 ML/day downstream of Yarrawonga Weir, may occur from late spring into early summer. This is most likely in moderate or drier inflow years. The driver for the high flows in these years is to transfer sufficient water downstream to meet lower system requirements, including for Lake Victoria over summer. An additional benefit is to ease the pressure on the banks of the Barmah Choke later in summer and autumn (i.e. flows less than 9,500 ML/day downstream of Yarrawonga weir). To reduce the pressure on the Choke during above channel flows, opportunities to use the major creek lines within the forest to increase the transfer capacity through this section would be explored with the relevant environmental agencies.
Above channel flows through the Choke with planned regulated releases up to 15,000 ML/day downstream of Yarrawonga Weir have been assumed in the ‘very dry’ and ‘moderate’ scenarios of
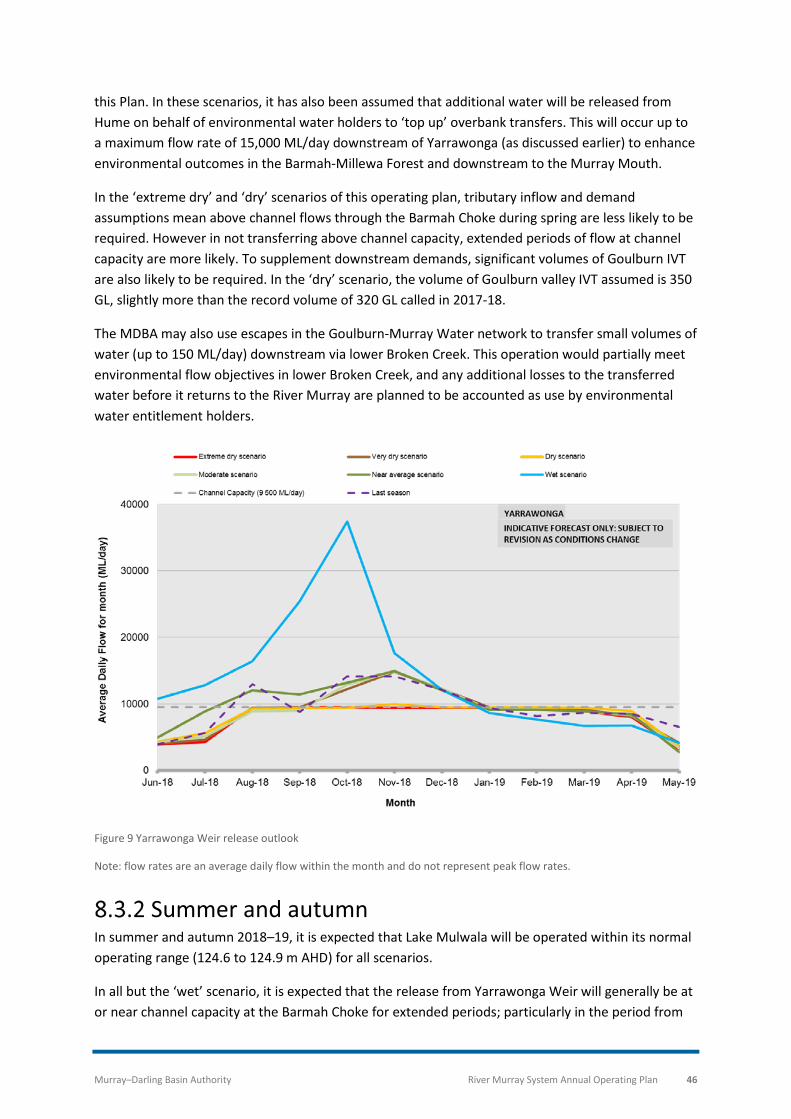
Murray–Darling Basin Authority River Murray System Annual Operating Plan 46
this Plan. In these scenarios, it has also been assumed that additional water will be released from Hume on behalf of environmental water holders to ‘top up’ overbank transfers. This will occur up to a maximum flow rate of 15,000 ML/day downstream of Yarrawonga (as discussed earlier) to enhance environmental outcomes in the Barmah-Millewa Forest and downstream to the Murray Mouth.
In the ‘extreme dry’ and ‘dry’ scenarios of this operating plan, tributary inflow and demand assumptions mean above channel flows through the Barmah Choke during spring are less likely to be required. However in not transferring above channel capacity, extended periods of flow at channel capacity are more likely. To supplement downstream demands, significant volumes of Goulburn IVT are also likely to be required. In the ‘dry’ scenario, the volume of Goulburn valley IVT assumed is 350 GL, slightly more than the record volume of 320 GL called in 2017-18.
The MDBA may also use escapes in the Goulburn-Murray Water network to transfer small volumes of water (up to 150 ML/day) downstream via lower Broken Creek. This operation would partially meet environmental flow objectives in lower Broken Creek, and any additional losses to the transferred water before it returns to the River Murray are planned to be accounted as use by environmental water entitlement holders.
Figure 9 Yarrawonga Weir release outlook
Note: flow rates are an average daily flow within the month and do not represent peak flow rates.
Summer and autumn In summer and autumn 2018–19, it is expected that Lake Mulwala will be operated within its normal operating range (124.6 to 124.9 m AHD) for all scenarios.
In all but the ‘wet’ scenario, it is expected that the release from Yarrawonga Weir will generally be at or near channel capacity at the Barmah Choke for extended periods; particularly in the period from
Murray–Darling Basin Authority River Murray System Annual Operating Plan 47
January to April 2018 (Figure 9). The driver for these flow rates is to deliver water from Hume Reservoir to meet the high demands downstream of the Barmah Choke.
These high flow rates increase the chances of summer flooding in the forest if there is a rainfall event that leads to a ‘rain rejection’ of ordered water. If there are summer inflow peaks or rain rejection events they will be mitigated to the extent possible, as per past practice, when flooding of the forest is not desirable (i.e. there is a potential to increase the Lake Mulwala level above the operational full supply level (124.9 m AHD) and even as high as 125.15 m AHD for short periods, to help limit the extent of above channel flows downstream of Yarrawonga Weir).
In the ‘wet’ scenario, lower flow rates (well below channel capacity) downstream of Yarrawonga Weir are targeted for autumn. This can occur as the scenario assumes: suppressed demands in the mid and lower Murray regions due to local rainfall, higher inflows from tributaries downstream of the Barmah Choke, water available in Menindee Lakes, and hence a reduction in volume of release required from Hume Reservoir.
In all cases over summer and autumn flows less than channel capacity will be targeted, if possible, to mitigate against rainfall rejection and to reduce pressure on the banks of the Barmah Choke.
In addition, short term spikes in demand at the Lake Mulwala irrigation offtakes may also cause a short term reduction of flows downstream of Yarrawonga. Irrigators with pumps along this reach of the Murray (Yarrawonga and the Barmah Choke) may be affected for short periods by the lower flow rates.
Lower flow rates downstream of Yarrawonga Weir also have the potential to affect recreational users in this reach. The MDBA will have regard to the requirements of recreational users and will aim to meet those requirements where they align with meeting other objectives but cannot guarantee river levels for recreational use. Recreational water users are encouraged to check flow forecasts on the MDBA website when planning their activities. Further information on recreation is also available on the MDBA website.
8.4 Euston Weir flow At Euston Weir, below the confluence of the Murray and Murrumbidgee Rivers, flows are boosted in winter and spring by the delivery of environmental water pulses from the major tributaries in the ‘moderate’ and drier scenarios in 2018–19 (Figure 10). Environmental water pulses from the major tributaries are also included in autumn in the ‘moderate’ and ‘dry’ scenarios. However flows past Euston are not expected to exceed a monthly average of 15,000 ML/day in these scenarios.
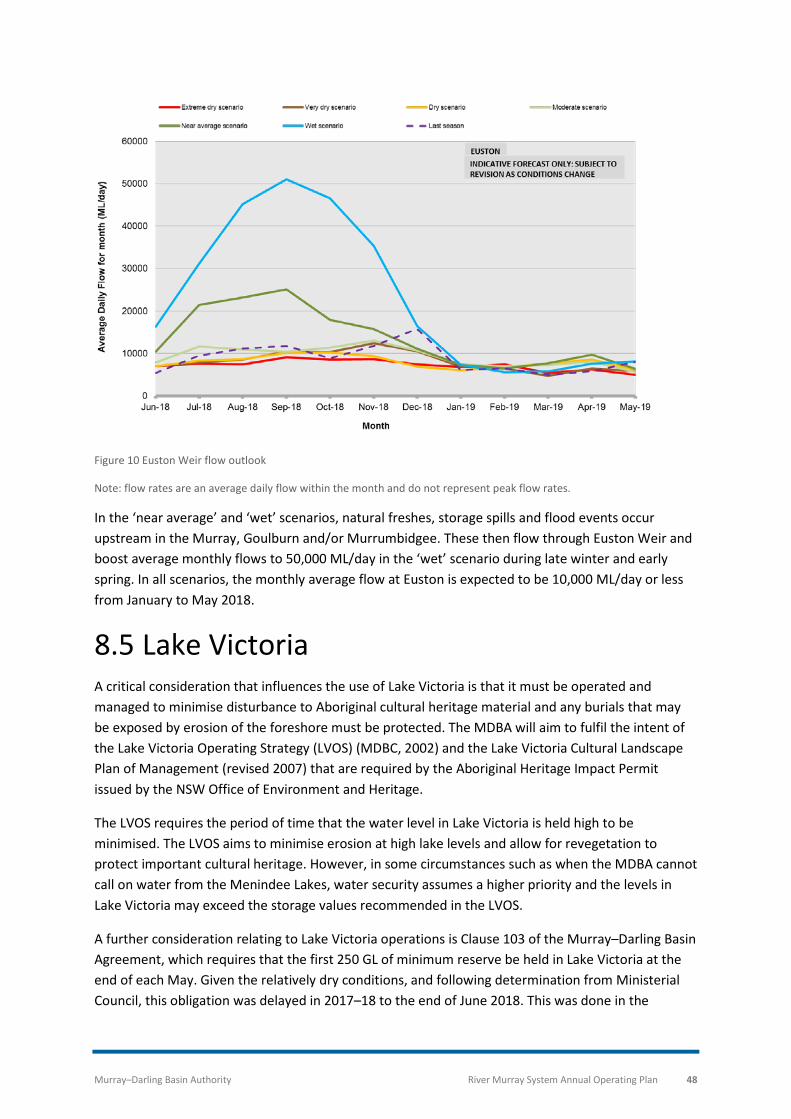
Murray–Darling Basin Authority River Murray System Annual Operating Plan 48
Figure 10 Euston Weir flow outlook
Note: flow rates are an average daily flow within the month and do not represent peak flow rates.
In the ‘near average’ and ‘wet’ scenarios, natural freshes, storage spills and flood events occur upstream in the Murray, Goulburn and/or Murrumbidgee. These then flow through Euston Weir and boost average monthly flows to 50,000 ML/day in the ‘wet’ scenario during late winter and early spring. In all scenarios, the monthly average flow at Euston is expected to be 10,000 ML/day or less from January to May 2018.
8.5 Lake Victoria A critical consideration that influences the use of Lake Victoria is that it must be operated and managed to minimise disturbance to Aboriginal cultural heritage material and any burials that may be exposed by erosion of the foreshore must be protected. The MDBA will aim to fulfil the intent of the Lake Victoria Operating Strategy (LVOS) (MDBC, 2002) and the Lake Victoria Cultural Landscape Plan of Management (revised 2007) that are required by the Aboriginal Heritage Impact Permit issued by the NSW Office of Environment and Heritage.
The LVOS requires the period of time that the water level in Lake Victoria is held high to be minimised. The LVOS aims to minimise erosion at high lake levels and allow for revegetation to protect important cultural heritage. However, in some circumstances such as when the MDBA cannot call on water from the Menindee Lakes, water security assumes a higher priority and the levels in Lake Victoria may exceed the storage values recommended in the LVOS.
A further consideration relating to Lake Victoria operations is Clause 103 of the Murray–Darling Basin Agreement, which requires that the first 250 GL of minimum reserve be held in Lake Victoria at the end of each May. Given the relatively dry conditions, and following determination from Ministerial Council, this obligation was delayed in 2017–18 to the end of June 2018. This was done in the
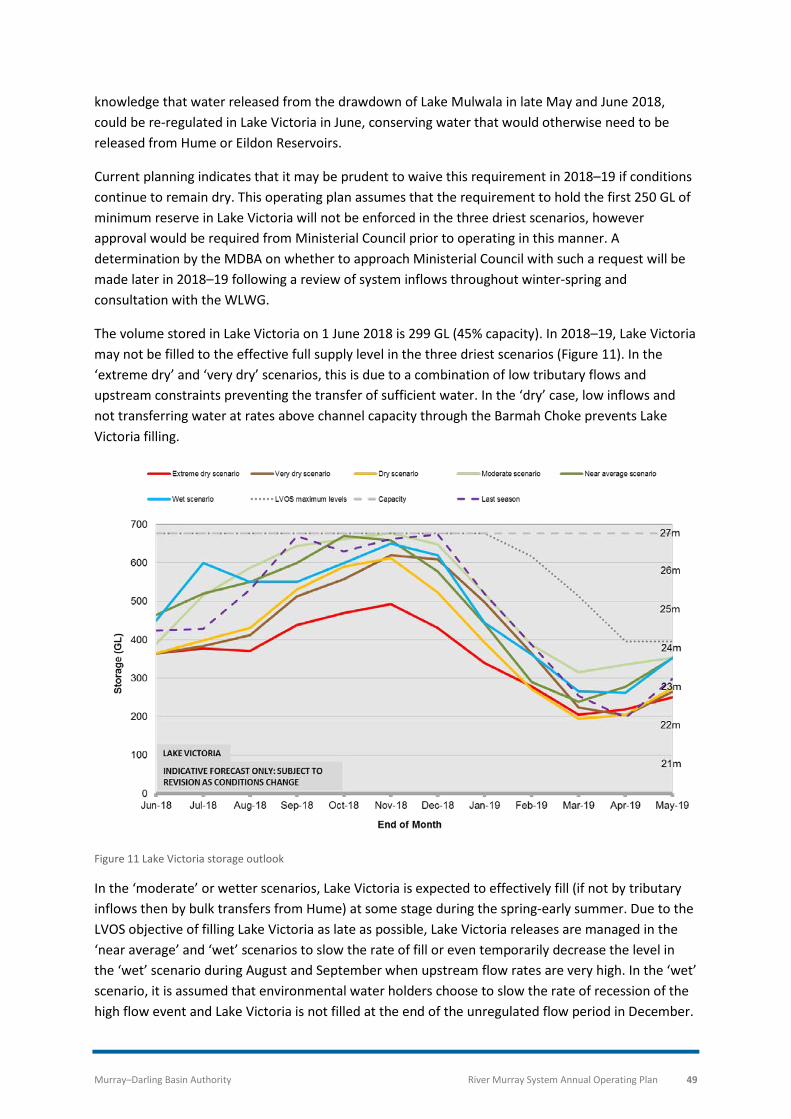
Murray–Darling Basin Authority River Murray System Annual Operating Plan 49
knowledge that water released from the drawdown of Lake Mulwala in late May and June 2018, could be re-regulated in Lake Victoria in June, conserving water that would otherwise need to be released from Hume or Eildon Reservoirs.
Current planning indicates that it may be prudent to waive this requirement in 2018–19 if conditions continue to remain dry. This operating plan assumes that the requirement to hold the first 250 GL of minimum reserve in Lake Victoria will not be enforced in the three driest scenarios, however approval would be required from Ministerial Council prior to operating in this manner. A determination by the MDBA on whether to approach Ministerial Council with such a request will be made later in 2018–19 following a review of system inflows throughout winter-spring and consultation with the WLWG.
The volume stored in Lake Victoria on 1 June 2018 is 299 GL (45% capacity). In 2018–19, Lake Victoria may not be filled to the effective full supply level in the three driest scenarios (Figure 11). In the ‘extreme dry’ and ‘very dry’ scenarios, this is due to a combination of low tributary flows and upstream constraints preventing the transfer of sufficient water. In the ‘dry’ case, low inflows and not transferring water at rates above channel capacity through the Barmah Choke prevents Lake Victoria filling.
Figure 11 Lake Victoria storage outlook
In the ‘moderate’ or wetter scenarios, Lake Victoria is expected to effectively fill (if not by tributary inflows then by bulk transfers from Hume) at some stage during the spring-early summer. Due to the LVOS objective of filling Lake Victoria as late as possible, Lake Victoria releases are managed in the ‘near average’ and ‘wet’ scenarios to slow the rate of fill or even temporarily decrease the level in the ‘wet’ scenario during August and September when upstream flow rates are very high. In the ‘wet’ scenario, it is assumed that environmental water holders choose to slow the rate of recession of the high flow event and Lake Victoria is not filled at the end of the unregulated flow period in December.
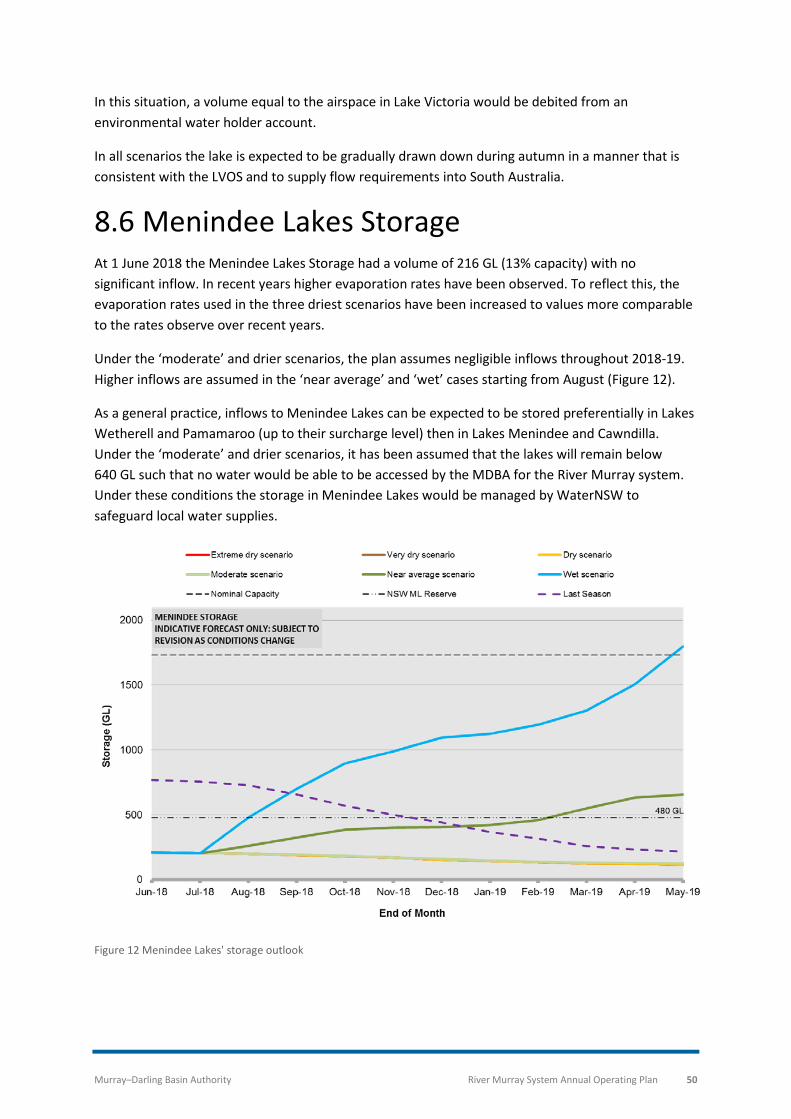
Murray–Darling Basin Authority River Murray System Annual Operating Plan 50
In this situation, a volume equal to the airspace in Lake Victoria would be debited from an environmental water holder account.
In all scenarios the lake is expected to be gradually drawn down during autumn in a manner that is consistent with the LVOS and to supply flow requirements into South Australia.
8.6 Menindee Lakes Storage At 1 June 2018 the Menindee Lakes Storage had a volume of 216 GL (13% capacity) with no significant inflow. In recent years higher evaporation rates have been observed. To reflect this, the evaporation rates used in the three driest scenarios have been increased to values more comparable to the rates observe over recent years.
Under the ‘moderate’ and drier scenarios, the plan assumes negligible inflows throughout 2018-19. Higher inflows are assumed in the ‘near average’ and ‘wet’ cases starting from August (Figure 12).
As a general practice, inflows to Menindee Lakes can be expected to be stored preferentially in Lakes Wetherell and Pamamaroo (up to their surcharge level) then in Lakes Menindee and Cawndilla. Under the ‘moderate’ and drier scenarios, it has been assumed that the lakes will remain below 640 GL such that no water would be able to be accessed by the MDBA for the River Murray system. Under these conditions the storage in Menindee Lakes would be managed by WaterNSW to safeguard local water supplies.
Figure 12 Menindee Lakes' storage outlook
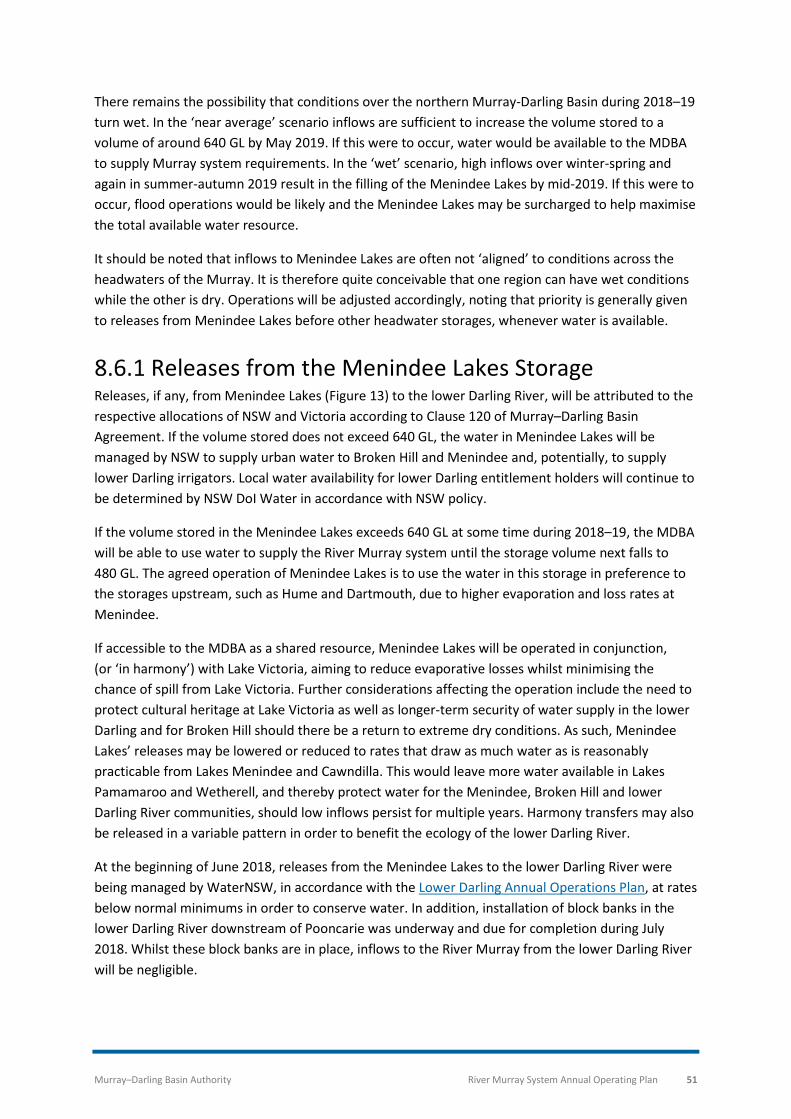
Murray–Darling Basin Authority River Murray System Annual Operating Plan 51
There remains the possibility that conditions over the northern Murray-Darling Basin during 2018–19 turn wet. In the ‘near average’ scenario inflows are sufficient to increase the volume stored to a volume of around 640 GL by May 2019. If this were to occur, water would be available to the MDBA to supply Murray system requirements. In the ‘wet’ scenario, high inflows over winter-spring and again in summer-autumn 2019 result in the filling of the Menindee Lakes by mid-2019. If this were to occur, flood operations would be likely and the Menindee Lakes may be surcharged to help maximise the total available water resource.
It should be noted that inflows to Menindee Lakes are often not ‘aligned’ to conditions across the headwaters of the Murray. It is therefore quite conceivable that one region can have wet conditions while the other is dry. Operations will be adjusted accordingly, noting that priority is generally given to releases from Menindee Lakes before other headwater storages, whenever water is available.
Releases from the Menindee Lakes Storage Releases, if any, from Menindee Lakes (Figure 13) to the lower Darling River, will be attributed to the respective allocations of NSW and Victoria according to Clause 120 of Murray–Darling Basin Agreement. If the volume stored does not exceed 640 GL, the water in Menindee Lakes will be managed by NSW to supply urban water to Broken Hill and Menindee and, potentially, to supply lower Darling irrigators. Local water availability for lower Darling entitlement holders will continue to be determined by NSW DoI Water in accordance with NSW policy.
If the volume stored in the Menindee Lakes exceeds 640 GL at some time during 2018–19, the MDBA will be able to use water to supply the River Murray system until the storage volume next falls to 480 GL. The agreed operation of Menindee Lakes is to use the water in this storage in preference to the storages upstream, such as Hume and Dartmouth, due to higher evaporation and loss rates at Menindee.
If accessible to the MDBA as a shared resource, Menindee Lakes will be operated in conjunction, (or ‘in harmony’) with Lake Victoria, aiming to reduce evaporative losses whilst minimising the chance of spill from Lake Victoria. Further considerations affecting the operation include the need to protect cultural heritage at Lake Victoria as well as longer-term security of water supply in the lower Darling and for Broken Hill should there be a return to extreme dry conditions. As such, Menindee Lakes’ releases may be lowered or reduced to rates that draw as much water as is reasonably practicable from Lakes Menindee and Cawndilla. This would leave more water available in Lakes Pamamaroo and Wetherell, and thereby protect water for the Menindee, Broken Hill and lower Darling River communities, should low inflows persist for multiple years. Harmony transfers may also be released in a variable pattern in order to benefit the ecology of the lower Darling River.
At the beginning of June 2018, releases from the Menindee Lakes to the lower Darling River were being managed by WaterNSW, in accordance with the Lower Darling Annual Operations Plan, at rates below normal minimums in order to conserve water. In addition, installation of block banks in the lower Darling River downstream of Pooncarie was underway and due for completion during July 2018. Whilst these block banks are in place, inflows to the River Murray from the lower Darling River will be negligible.
Murray–Darling Basin Authority River Murray System Annual Operating Plan 52
Should inflows improve over 2018-19, the decision to remove the block banks and make increased releases will be made by WaterNSW, until the volume stored in the Menindee Lake exceeds 640 GL.
In the ‘moderate’ and drier scenarios, it is assumed by MDBA that releases from Menindee only supply lower Darling water requirements and no flow reaches the River Murray. Under the ‘near average’ scenario, additional inflows to the Menindee Lakes help to boost storage levels and it is assumed they are sufficient to allow the removal of block banks and releases to re-establish flows along the lower Darling and to the River Murray in autumn 2019. In this scenario, it is possible that releases of water on behalf of environmental water holders may also be made at this time. By May 2019, the volume stored in Menindee Lakes exceeds 640 GL and so becomes a shared resource. Under this scenario, releases above minimum flow rates transfer a small volume to Lake Victoria to help meet the minimum reserve target of 350 GL (250 GL plus the dead storage volume of 100 GL) by the end of May 2019.
Figure 13 Menindee Lakes' release outlook
Note: Flow rates are an average daily flow within the month and do not represent peak flow rates. Some scenario graphs are hidden in parts of the year where flow rates are the same.
In the ‘wet’ scenario, there is no requirement to start releasing from Menindee to supply Murray system demands until early summer. Generally, it has been assumed that regulated release rates from Menindee Lakes will be below about 5,000 ML/day at Weir 32 to minimise river losses and to preferentially draw from Lakes Menindee and Cawndilla. However, regulated releases of up to 9,000 ML/day at Weir 32 may be implemented if required. In a very wet scenario, releases may exceed 9,000 ML/day due to inflows causing the lakes to spill. These flood releases are directed by WaterNSW and in general will be managed to pass inflows while the lakes are close to or surcharged above the full supply level. In the ‘wet’ scenario it is likely that releases will be made on behalf of
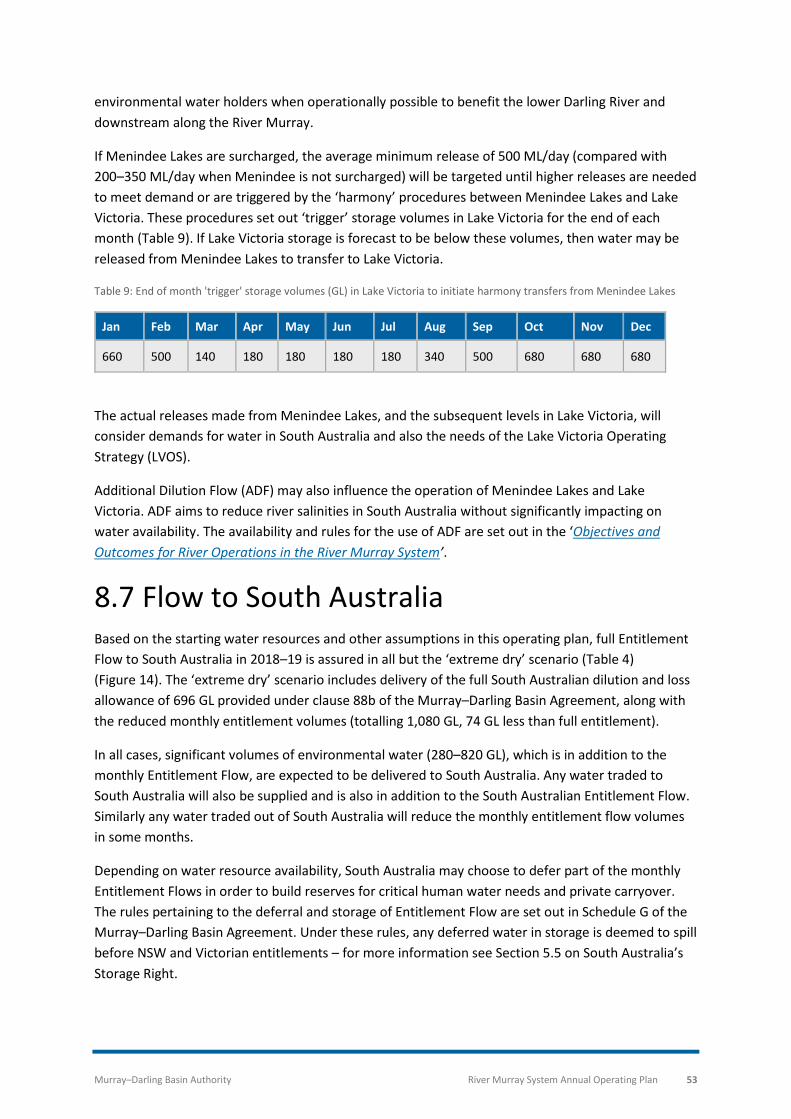
Murray–Darling Basin Authority River Murray System Annual Operating Plan 53
environmental water holders when operationally possible to benefit the lower Darling River and downstream along the River Murray.
If Menindee Lakes are surcharged, the average minimum release of 500 ML/day (compared with 200–350 ML/day when Menindee is not surcharged) will be targeted until higher releases are needed to meet demand or are triggered by the ‘harmony’ procedures between Menindee Lakes and Lake Victoria. These procedures set out ‘trigger’ storage volumes in Lake Victoria for the end of each month (Table 9). If Lake Victoria storage is forecast to be below these volumes, then water may be released from Menindee Lakes to transfer to Lake Victoria.
Table 9: End of month 'trigger' storage volumes (GL) in Lake Victoria to initiate harmony transfers from Menindee Lakes
Jan Feb Mar Apr May Jun Jul Aug Sep Oct Nov Dec
660 500 140 180 180 180 180 340 500 680 680 680
The actual releases made from Menindee Lakes, and the subsequent levels in Lake Victoria, will consider demands for water in South Australia and also the needs of the Lake Victoria Operating Strategy (LVOS).
Additional Dilution Flow (ADF) may also influence the operation of Menindee Lakes and Lake Victoria. ADF aims to reduce river salinities in South Australia without significantly impacting on water availability. The availability and rules for the use of ADF are set out in the ‘Objectives and Outcomes for River Operations in the River Murray System’.
8.7 Flow to South Australia Based on the starting water resources and other assumptions in this operating plan, full Entitlement Flow to South Australia in 2018–19 is assured in all but the ‘extreme dry’ scenario (Table 4) (Figure 14). The ‘extreme dry’ scenario includes delivery of the full South Australian dilution and loss allowance of 696 GL provided under clause 88b of the Murray–Darling Basin Agreement, along with the reduced monthly entitlement volumes (totalling 1,080 GL, 74 GL less than full entitlement).
In all cases, significant volumes of environmental water (280–820 GL), which is in addition to the monthly Entitlement Flow, are expected to be delivered to South Australia. Any water traded to South Australia will also be supplied and is also in addition to the South Australian Entitlement Flow. Similarly any water traded out of South Australia will reduce the monthly entitlement flow volumes in some months.
Depending on water resource availability, South Australia may choose to defer part of the monthly Entitlement Flows in order to build reserves for critical human water needs and private carryover. The rules pertaining to the deferral and storage of Entitlement Flow are set out in Schedule G of the Murray–Darling Basin Agreement. Under these rules, any deferred water in storage is deemed to spill before NSW and Victorian entitlements – for more information see Section 5.5 on South Australia’s Storage Right.
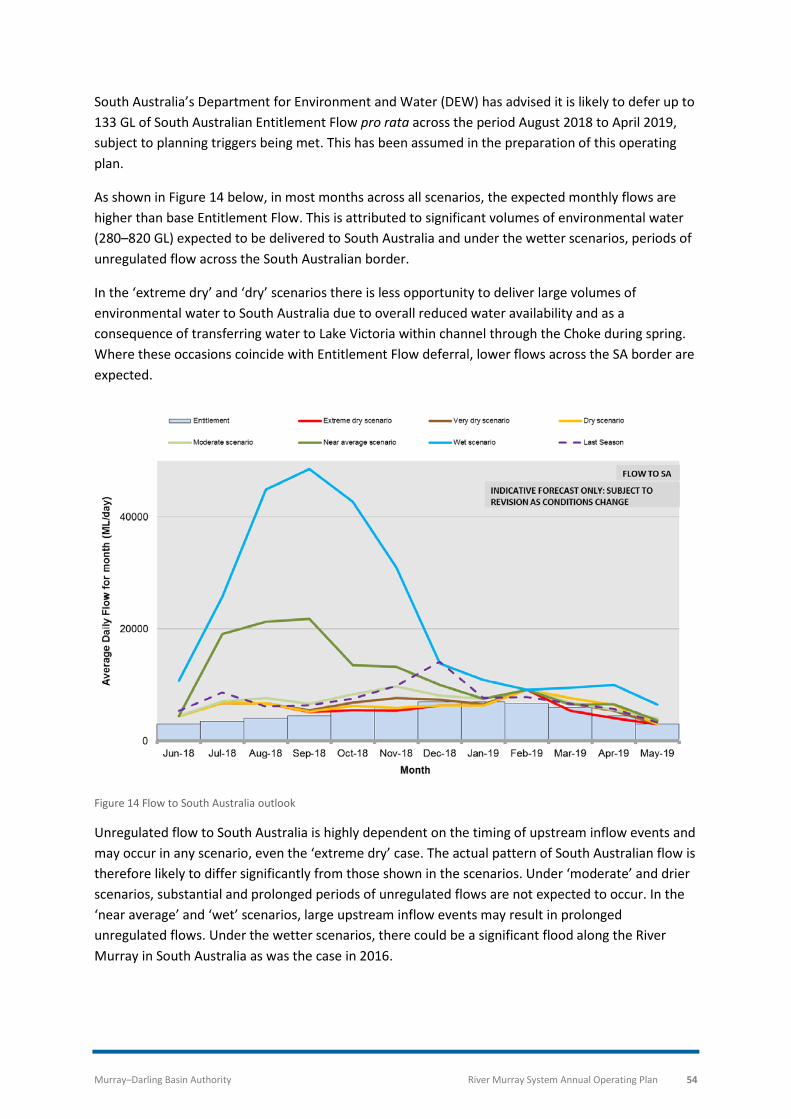
Murray–Darling Basin Authority River Murray System Annual Operating Plan 54
South Australia’s Department for Environment and Water (DEW) has advised it is likely to defer up to 133 GL of South Australian Entitlement Flow pro rata across the period August 2018 to April 2019, subject to planning triggers being met. This has been assumed in the preparation of this operating plan.
As shown in Figure 14 below, in most months across all scenarios, the expected monthly flows are higher than base Entitlement Flow. This is attributed to significant volumes of environmental water (280–820 GL) expected to be delivered to South Australia and under the wetter scenarios, periods of unregulated flow across the South Australian border.
In the ‘extreme dry’ and ‘dry’ scenarios there is less opportunity to deliver large volumes of environmental water to South Australia due to overall reduced water availability and as a consequence of transferring water to Lake Victoria within channel through the Choke during spring. Where these occasions coincide with Entitlement Flow deferral, lower flows across the SA border are expected.
Figure 14 Flow to South Australia outlook
Unregulated flow to South Australia is highly dependent on the timing of upstream inflow events and may occur in any scenario, even the ‘extreme dry’ case. The actual pattern of South Australian flow is therefore likely to differ significantly from those shown in the scenarios. Under ‘moderate’ and drier scenarios, substantial and prolonged periods of unregulated flows are not expected to occur. In the ‘near average’ and ‘wet’ scenarios, large upstream inflow events may result in prolonged unregulated flows. Under the wetter scenarios, there could be a significant flood along the River Murray in South Australia as was the case in 2016.
Murray–Darling Basin Authority River Murray System Annual Operating Plan 55
8.8 Lower Lakes and Barrage operation Management of flows and water levels from the South Australia Border to the Murray Mouth is the responsibility of the South Australian Department for Environment and Water (DEW) in collaboration with SA Water. DEW, in exercising their responsibilities takes account of system and other advice provided by the MDBA and any arrangements agreed between the Commonwealth Environmental Water Office and DEW on the use and delivery of their environmental entitlements.
The information presented in this plan is restricted to the Lower Lakes and the Coorong with the aim of capturing the key operational activities likely to be expected of DEW for 2018-19.
Lower Lakes Lakes Alexandrina and Albert (the Lower Lakes) are upstream of five barrages which are located at Goolwa, Mundoo, Boundary Creek, Ewe Island and Tauwitchere.
At the beginning of June 2018, the 5 day average level of the Lower Lakes was 0.55 m AHD. Delivery of additional environmental water early in June is likely to build lake levels above 0.6 m AHD by the end of the month, with the level likely to continue re-building towards full supply during winter.
With full Entitlement Flow, it is expected that the water level of the Lower Lakes will be managed between 0.50 and 0.85 m AHD, however wind and tidal influences may result in water levels temporarily outside this range. In drier scenarios, it remains possible that the water levels may fall below 0.5 m AHD. Should water levels fall below 0.4 m AHD, then the planning phase of the Ministerial Council approved Drought Emergency Framework for Lakes Alexandrina and Albert will commence.
If sufficient volumes of unregulated flows occur, then higher flows to the Coorong and Murray Mouth will be delivered. Actions such as lake level cycling may also be pursued to reduce salinity levels, particularly in Lake Albert. Following the end of the Millennium Drought, this action combined with increased volumes of environmental water delivery has assisted with the removal of salt from Lake Albert.
Since late 2011, managed releases of water through the barrages have been undertaken in such a way as to seasonally vary the level of the Lower Lakes between 0.50 and 0.85 m AHD (Figure 15). This action provides raising and drawdown in the Lower Lakes wetlands, with resultant breeding opportunities for threatened fish, frogs and waterbirds. It also helps to support barrage releases through summer if enough water is provided for early summer surcharge. Management of water levels and operations will be guided by the recently approved Barrage Operating Policy and Strategy.
However, at times it has been very difficult to implement releases through the barrages because of high water levels in the Coorong due to tidal and storm influences.
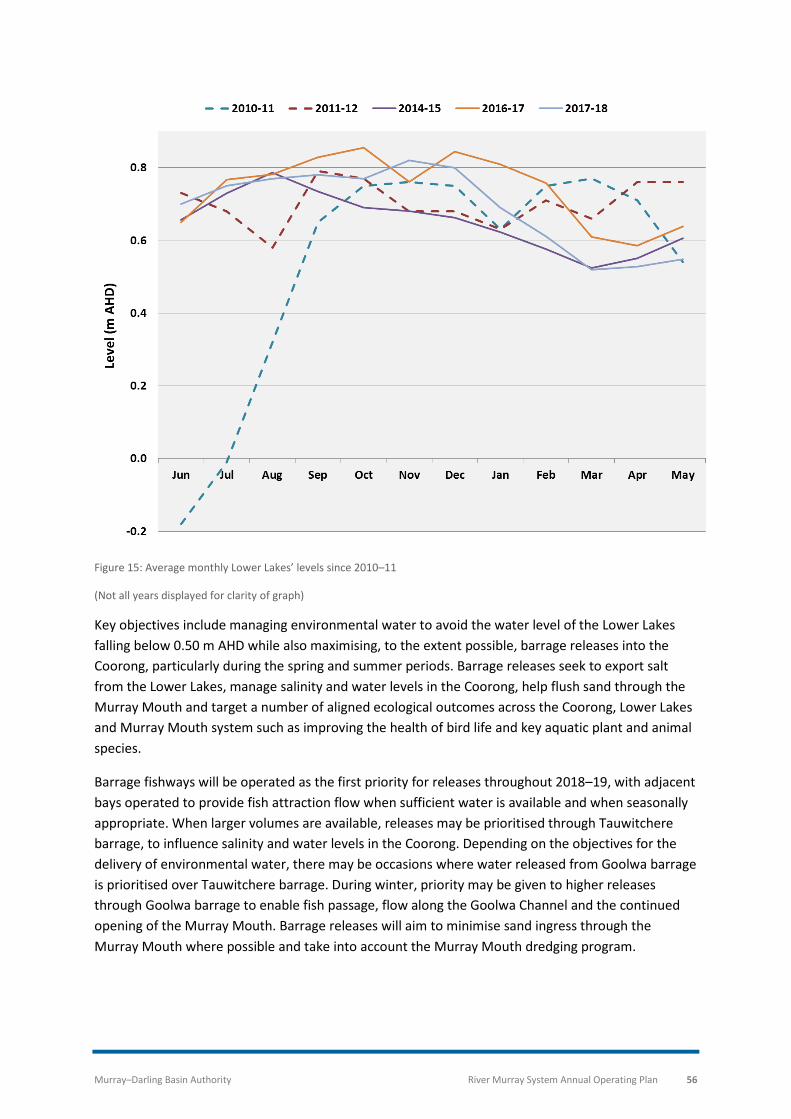
Murray–Darling Basin Authority River Murray System Annual Operating Plan 56
Figure 15: Average monthly Lower Lakes’ levels since 2010–11
(Not all years displayed for clarity of graph)
Key objectives include managing environmental water to avoid the water level of the Lower Lakes falling below 0.50 m AHD while also maximising, to the extent possible, barrage releases into the Coorong, particularly during the spring and summer periods. Barrage releases seek to export salt from the Lower Lakes, manage salinity and water levels in the Coorong, help flush sand through the Murray Mouth and target a number of aligned ecological outcomes across the Coorong, Lower Lakes and Murray Mouth system such as improving the health of bird life and key aquatic plant and animal species.
Barrage fishways will be operated as the first priority for releases throughout 2018–19, with adjacent bays operated to provide fish attraction flow when sufficient water is available and when seasonally appropriate. When larger volumes are available, releases may be prioritised through Tauwitchere barrage, to influence salinity and water levels in the Coorong. Depending on the objectives for the delivery of environmental water, there may be occasions where water released from Goolwa barrage is prioritised over Tauwitchere barrage. During winter, priority may be given to higher releases through Goolwa barrage to enable fish passage, flow along the Goolwa Channel and the continued opening of the Murray Mouth. Barrage releases will aim to minimise sand ingress through the Murray Mouth where possible and take into account the Murray Mouth dredging program.
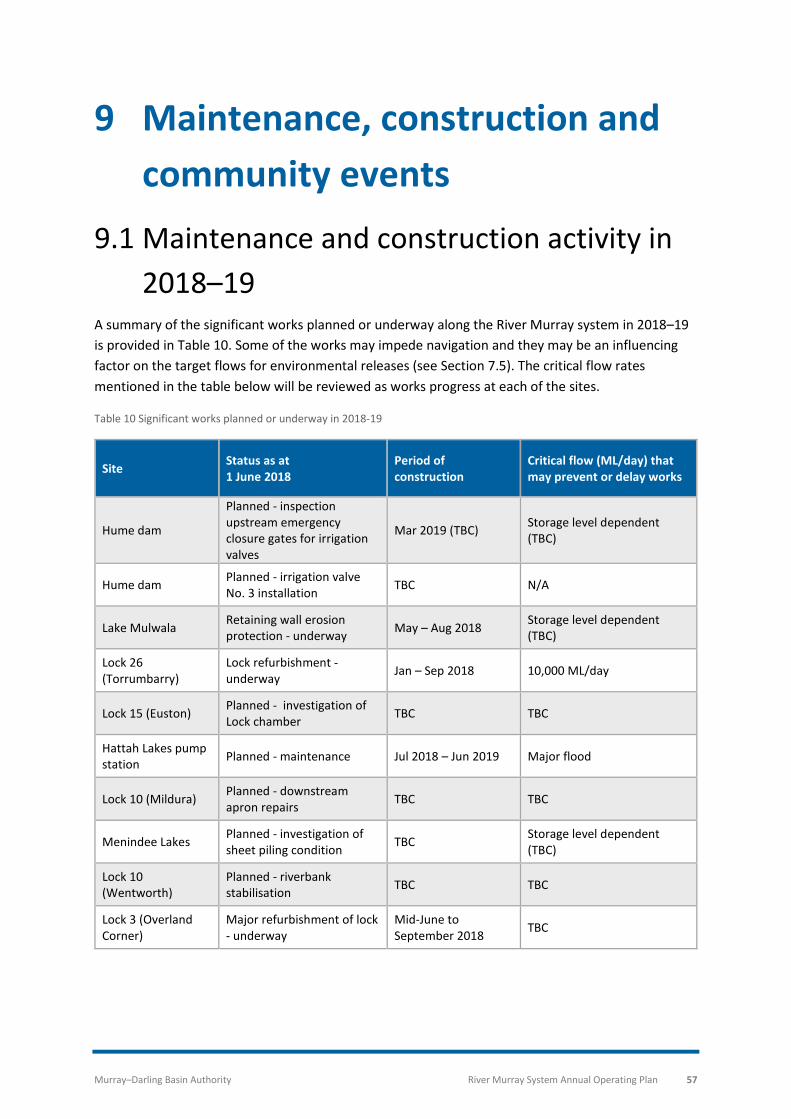
Murray–Darling Basin Authority River Murray System Annual Operating Plan 57
9 Maintenance, construction and community events
9.1 Maintenance and construction activity in 2018–19
A summary of the significant works planned or underway along the River Murray system in 2018–19 is provided in Table 10. Some of the works may impede navigation and they may be an influencing factor on the target flows for environmental releases (see Section 7.5). The critical flow rates mentioned in the table below will be reviewed as works progress at each of the sites.
Table 10 Significant works planned or underway in 2018-19
Site Status as at 1 June 2018
Period of construction
Critical flow (ML/day) that may prevent or delay works
Hume dam
Planned - inspection upstream emergency closure gates for irrigation valves
Mar 2019 (TBC) Storage level dependent (TBC)
Hume dam Planned - irrigation valve No. 3 installation TBC N/A
Lake Mulwala Retaining wall erosion protection - underway May – Aug 2018 Storage level dependent
(TBC)
Lock 26 (Torrumbarry)
Lock refurbishment - underway Jan – Sep 2018 10,000 ML/day
Lock 15 (Euston) Planned - investigation of Lock chamber TBC TBC
Hattah Lakes pump station Planned - maintenance Jul 2018 – Jun 2019 Major flood
Lock 10 (Mildura) Planned - downstream apron repairs TBC TBC
Menindee Lakes Planned - investigation of sheet piling condition TBC Storage level dependent
(TBC)
Lock 10 (Wentworth)
Planned - riverbank stabilisation TBC TBC
Lock 3 (Overland Corner)
Major refurbishment of lock - underway
Mid-June to September 2018 TBC
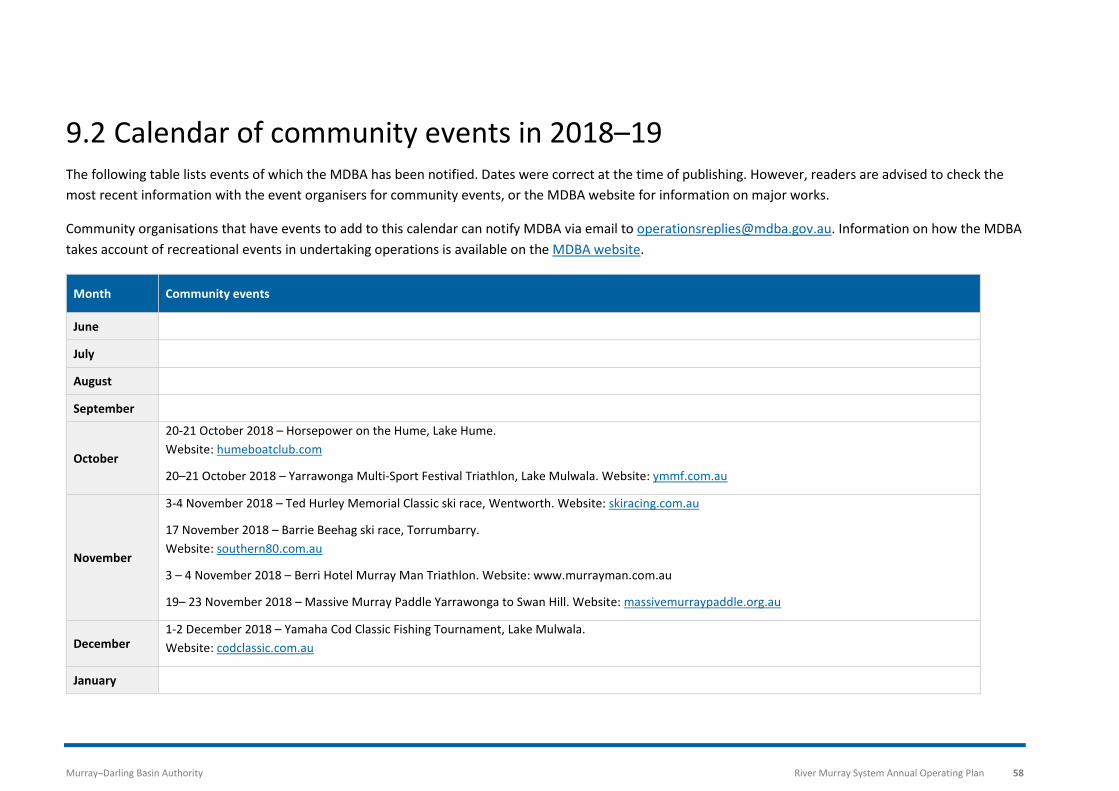
Murray–Darling Basin Authority River Murray System Annual Operating Plan 58
9.2 Calendar of community events in 2018–19 The following table lists events of which the MDBA has been notified. Dates were correct at the time of publishing. However, readers are advised to check the most recent information with the event organisers for community events, or the MDBA website for information on major works.
Community organisations that have events to add to this calendar can notify MDBA via email to [email protected]. Information on how the MDBA takes account of recreational events in undertaking operations is available on the MDBA website.
Month Community events
June
July
August
September
October
20-21 October 2018 – Horsepower on the Hume, Lake Hume. Website: humeboatclub.com
20–21 October 2018 – Yarrawonga Multi-Sport Festival Triathlon, Lake Mulwala. Website: ymmf.com.au
November
3-4 November 2018 – Ted Hurley Memorial Classic ski race, Wentworth. Website: skiracing.com.au
17 November 2018 – Barrie Beehag ski race, Torrumbarry. Website: southern80.com.au
3 – 4 November 2018 – Berri Hotel Murray Man Triathlon. Website: www.murrayman.com.au
19– 23 November 2018 – Massive Murray Paddle Yarrawonga to Swan Hill. Website: massivemurraypaddle.org.au
December 1-2 December 2018 – Yamaha Cod Classic Fishing Tournament, Lake Mulwala. Website: codclassic.com.au
January
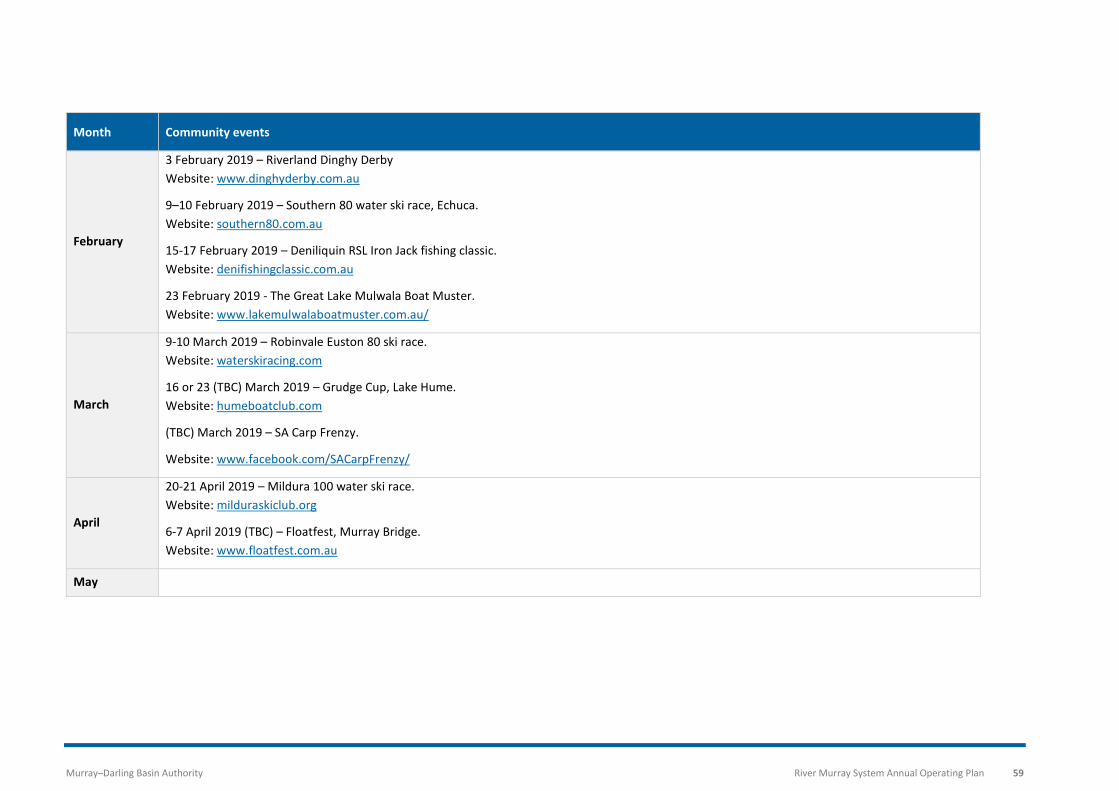
Murray–Darling Basin Authority River Murray System Annual Operating Plan 59
Month Community events
February
3 February 2019 – Riverland Dinghy Derby Website: www.dinghyderby.com.au
9–10 February 2019 – Southern 80 water ski race, Echuca. Website: southern80.com.au
15-17 February 2019 – Deniliquin RSL Iron Jack fishing classic. Website: denifishingclassic.com.au
23 February 2019 - The Great Lake Mulwala Boat Muster. Website: www.lakemulwalaboatmuster.com.au/
March
9-10 March 2019 – Robinvale Euston 80 ski race. Website: waterskiracing.com
16 or 23 (TBC) March 2019 – Grudge Cup, Lake Hume. Website: humeboatclub.com
(TBC) March 2019 – SA Carp Frenzy.
Website: www.facebook.com/SACarpFrenzy/
April
20-21 April 2019 – Mildura 100 water ski race. Website: milduraskiclub.org
6-7 April 2019 (TBC) – Floatfest, Murray Bridge. Website: www.floatfest.com.au
May
Murray–Darling Basin Authority River Murray System Annual Operating Plan 60
10 Further information This Annual Operating Plan will be reissued only if a significant amendment is required due to unforeseen circumstances.
The MDBA will update a routine monthly operational plan, which contains outlooks of potential storage behaviours and release rates, regularly throughout 2018–19. These updates will be shared with the jurisdictions via Water Liaison Working Group.
It is important to remember that the outlooks presented in this operating plan are based on modelled scenarios only. Although they give a reasonable overall picture of how the River Murray system may be operated under different climate and inflow conditions, the real world is more complex and actual outcomes will be different. The system will not follow any one scenario and this operating plan should be used for planning purposes only, not to predict what will actually happen as the year unfolds.
Updates on river operations within the water year will be provided in a number of forms, which can be accessed via the MDBA website (mdba.gov.au) including:
• the MDBA Weekly Report on river operations • River Murray data • water in storage • forecasts in relation to flows and salinity levels • media releases in relation to river operations • special circumstances reports.
Further information relating to River Operations can also be found on the MDBA website.

Office locations Adelaide Albury-Wodonga Canberra Toowoomba
mdba.gov.au 1800 230 067 [email protected]