Embed Size (px)
Citation preview

TABLE OF CONTENTS
CERTIFICATE
DECLARATION
ACKNOWLEDGEMENT
PREFACE
EXECUTIVE SUMMARY
INTRODUCTION
NOKIA
SAMSUNG INDIA
SONY ERICSON
RESEARCH METHODOLOGY
FINDINGS & ANALYSIS
SUGGESTION & RECOMMENDATIONS
CONCLUSION
BIBLIOGRAPHY

EXECUTIVE SUMMARY
Though mobiles have become an integral part of the society for various
reasons including safety, connectivity, fun, etc a lot of people still use it as a
sign of status. Therefore mobiles could be marketed and sold for various
segments meaning thereby that even though the telecom industry is on a
high there is still a lot of scope.
Any mobile manufacturer on studying a report of this kind should be able to
relate to his ideas of targeting the right population for the right handset.
There is a good scope for new entrants in this circle as the service provided
by the existing players are not up to the mark and subscribers want to try
out new ones provided they stand up to the customers expectations. MMS
and Bluetooth functions are fast becoming popular with the mobile users. In
fact these are becoming a criterion for choosing a mobile handset
DECLARATION
I hereby declare that the report on “ANALYSIS OF CURRENT MARKET
SCENARIO OF THE MOBILE MARKET WITH SPECIAL REFERENCE TO
NOKIA AND Samsung’s an authentic work carried out by me under worthy
guidance of Mrs. DIKSHA GANGULY (faculty NIU). This work has not been
submitted to any other university or institute for award of any degree or diploma
and is the whole sole property of NOIDA INTERNATIONAL UNIVERSITY,
Greater Noida. Any unauthorized use of this project report is strictly prohibited.
For further use, approval of the concern authority is mandatory.
HIMANSHU TANEJA
INTRODUCTIONINDIAN MOBILE MARKET
India is one of the largest and fastest growing mobile handset markets in the
world. At least five mobile handset companies have announced plans to set
up manufacturing bases herein India.
The gray market in India is huge. But, it is fast declining with much of the
gray market catering to the lower income group of the population such as
taxi drivers and plumbers. Gray market accounts for over 60% of the
handset market in India.
Not only this, repairing devices is preferred to replacing them. Hence, the
market also thrives for duplicate spares for mobile phones and also for any
electronic parts for that matter. It is quite common for people here in India to
buy a standard duplicate Nokia phone charger for just Rs. 30/- here in India.
($0.71)
Mobile Handset Replacement cycles average between 24 to 36 months. A
once flourishing handset “gray” market is on the decline now in India, due to
a reduction in duties and taxes. A customs tariff was lowered in January'2004
from 10% to 5%, and a Special Additional Duty (SAD) of 4% was abolished at
the same time. Further tax benefits are expected as the market matures
more.
Definetely, the margins would come down for handset resellers as these
handsets are locally manufactured here in India. But, a vast untapped
market of nearly 70 % of India's population (India's rural sector) coupled with
one of the world's cheapest mobile call charge rates here in India which, is
still expected to further go down, mobile handset resellers will not have
much to lose.
With rapid consumerism sweeping the country, India has emerged as the
second largest mobile handset market, poised for explosive growth by
20010. Industry observers are of the view that market within the Q1 (first
quarter of) 2006 could well become a global hub for mobile handset
manufacturers. With an eye on the impending growth opportunities, RNCOS's
market research report “India Mobile Handset Market (2008)” analyzes the
current market scenario and the technological developments driving the
demand graph.
The report, quoting the experts’ view, estimates that the total market value
worth Rs.8.05billion (US $2billion) as of 2008/09 will surge to approximately
35 crore (350 million) subscribers by 2010 nationwide. The study further
reveals that Indian mobile subscribers are willing to pay for upgrades, value-
based services, and advanced models that provide better services.
Dominated largely by Nokia with a total market share of 59%, followed by
Samsung (13%) and Motorola (7%) respectively, Indian mobile handset
market is currently catering to 45 million subscribers (June 2008). Recent
records show that Indian GSM cellular user base has grown from 43 million,
as estimated in May, to 45 million in June 2009, representing a growth of
3.50% in the month under review, witnessing large and propitious foreign
investors flooding the market eyeing for large chunks. In addition, recent
changes imbibed in the government policies that price mobile handsets at a
lower end with flexible custom-duty for new entrants are startling the market
with multiple models largely aimed to higher and middle-income groups.
Industry sources, though, view the market to be at its nascent stage, many
large EMS (Electronic Manufacturing Services) companies are seriously
considering setting up their handset facilities in India. Not surprisingly, phone
vendors would prefer to source the lowest-cost phones available and these
come from contract manufacturers elsewhere in Asia. Opportunities are
largely looming for mobile bigwigs like, BenQ, Elcoteq, and Alcatel quibbled
over licenses; now, they are fighting over spectrum.
The market research report "Indian Mobile Handset Market (2009)" published
by RNCOS examines ongoing market trends responsible for the escalating
demand for mobile handsets and value-added services in India. The report
investigates and assesses the growth factors contributing to mobile handset
market and includes wide coverage of important issues and policies
concerning development of Indian mobile telecommunication industry. With
statistics including current market share data, leading players and
manufacturers’ profiles, and mobile subscriber predictions for 2010, the
report covers the key aspects of the scenario in the Indian market for the
mobile industry. Special emphasis is given to emerging trends in the market.
This market research report also gives a complete analysis of India’s mobile
market for in-depth insights into mobile subscriber’s base, mobile tariffs,
usage patterns, and potential for value added services.
NOKIA
The roots of Nokia go back to the year 1865 with the establishment of a
forest industry enterprise in South-Western Finland by mining engineer
Fredrik Idestam. Elsewhere, the year 1898 witnessed the foundation of
Finnish Rubber Works Ltd, and in 1912 Finnish Cable Works began
operations. Gradually, the ownership of these two companies and Nokia
began to shift into hands of just a few owners. Finally in 1967 the three
companies were merged to form Nokia Corporation.
At the beginning of the 1980s, Nokia strengthened its position in the
telecommunications and consumer electronics markets through the
acquisitions of Mobira, Salora, Televa and Luxor of Sweden. In 1987, Nokia
acquired the consumer electronics operations and part of the component
business of the German Standard Elektrik Lorenz, as well as the French
consumer electronics company Oceanic. In 1987, Nokia also purchased the
Swiss cable machinery company Maillefer.
In the late 1980s, Nokia became the largest Scandinavian information
technology company through the acquisition of Ericsson's data systems
division. In 1989, Nokia conducted a significant expansion of its cable
industry into Continental Europe by acquiring the Dutch cable company NKF.
Since the beginning of the 1990's, Nokia has concentrated on its core
business, telecommunications, by divesting its information technology and
basic industry operations.
HANDSETS
Nokia N-Gage™ QD
Game Deck
Nokia N90
New release
Nokia N70
Nokia 9500
Communicator
Nokia 9300
New release
Nokia 8800
New release
Nokia 810
Nokia 7710
Nokia 7610
Nokia 7370
Nokia 7360
Nokia 7270
Nokia 7260
Nokia 6681
New release
Nokia 6680
Nokia 6670
Nokia 6630
Nokia 6610i
Nokia 6600
Nokia 6585
Nokia 6270
Nokia 6265
Nokia 6260
Nokia 6255
New release
Nokia 6235
Nokia 6230i
Nokia 6230
Nokia 6225
Nokia 6170
Nokia 6155
Nokia 6111
New release
Nokia 6101
New release
Nokia 6100
Nokia 6060
New release
Nokia 6030
New release
Nokia 6021
Nokia 6020
Nokia 3250
New release
Nokia 3230
New release
Nokia 3220
SAMSUNG INDIA
Digital technology leader, Samsung India Electronics Ltd., a subsidiary of the
US$55.2 billion recognized as one of the fastest growing brands. It has been
operating in India since 1995. Samsung Electronics Co., Ltd. is a global
leader in semiconductor, telecommunication, digital media and digital
convergence technologies. Employing approximately 123,000 people in 93
offices in 48 countries, the company consists of five main business units:
Digital Appliance Business, Digital Media Business, LCD Business,
Semiconductor Business and Telecommunication Network Business.
Samsung Electronics is a leading provider of high tech Consumer Electronics,
Home Appliance, IT and Telecom Products in the country. It is the world's
largest producer of color monitors, colorTVs, memory chips and TFT-LCDs.
In its tenure of over 10 years in the country, Samsung India has set up
manufacturing facilities for Colour Televisions, Microwave Ovens, Washing
machines, Airconditioners, Colour Monitors and more recently, Refrigerators
in the country. All the facilities are located at its Manufacturing Complex at
Noida, Uttar Pradesh. The Company set up a Software Technology Park for
Digital Visual Display Products at Noida in the year 2002. In the year 2004,
Samsung India has been made the Regional Headquarters for Samsung
operations in South West Asia.
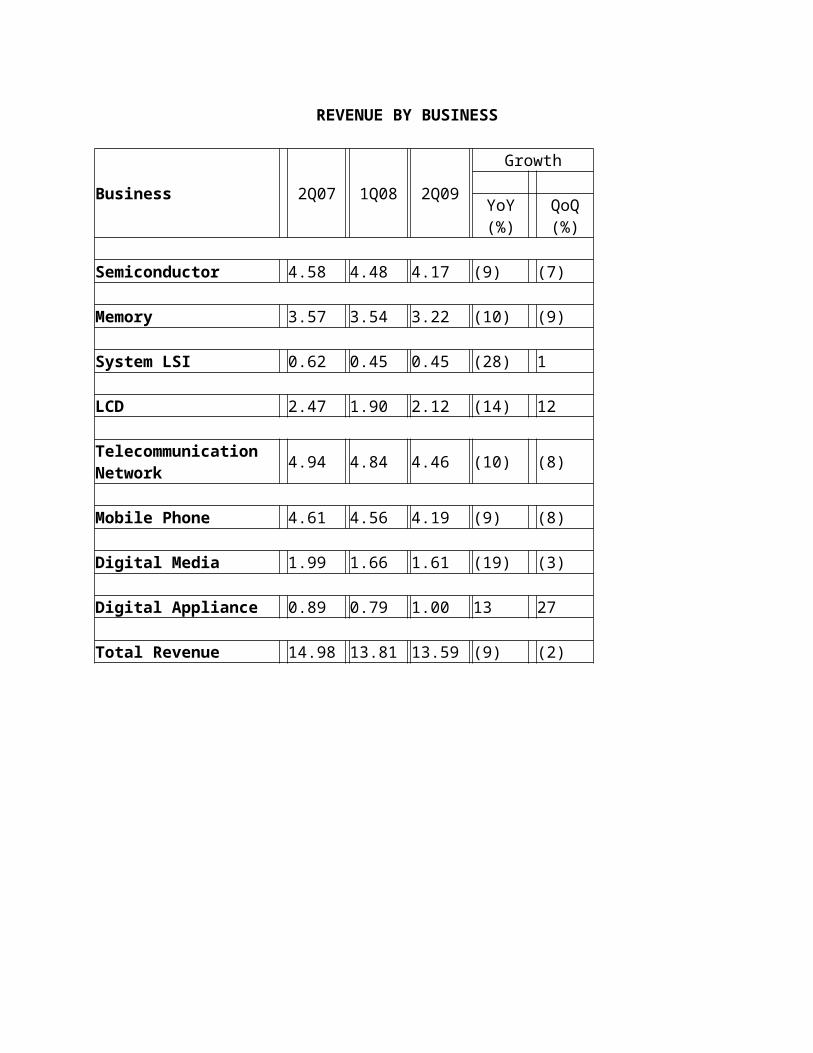
REVENUE BY BUSINESS
Business 2Q07 1Q08 2Q09
Growth
YoY (%)
QoQ (%)
Semiconductor 4.58 4.48 4.17 (9) (7)
Memory 3.57 3.54 3.22 (10) (9)
System LSI 0.62 0.45 0.45 (28) 1
LCD 2.47 1.90 2.12 (14) 12
Telecommunication Network
4.94 4.84 4.46 (10) (8)
Mobile Phone 4.61 4.56 4.19 (9) (8)
Digital Media 1.99 1.66 1.61 (19) (3)
Digital Appliance 0.89 0.79 1.00 13 27
Total Revenue 14.98 13.81 13.59 (9) (2)
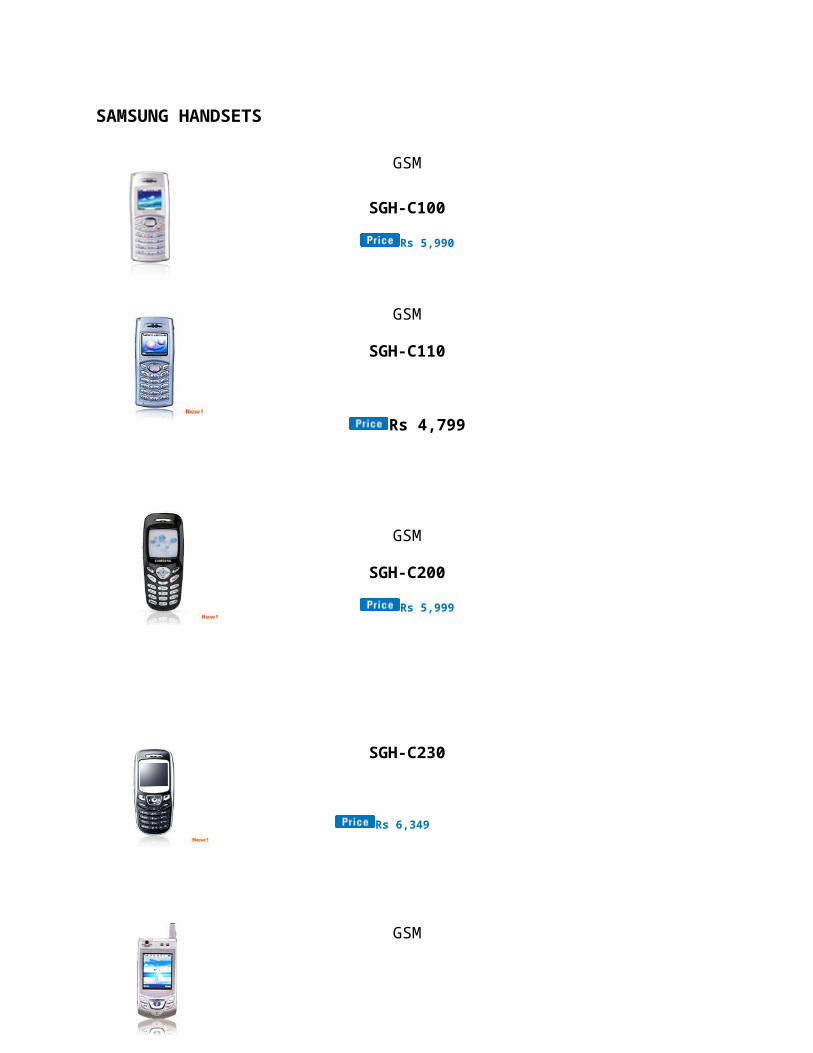
SAMSUNG HANDSETS
GSM
SGH-C100
Rs 5,990
GSM
SGH-C110
Rs 4,799
GSM
SGH-C200
Rs 5,999
SGH-C230
Rs 6,349
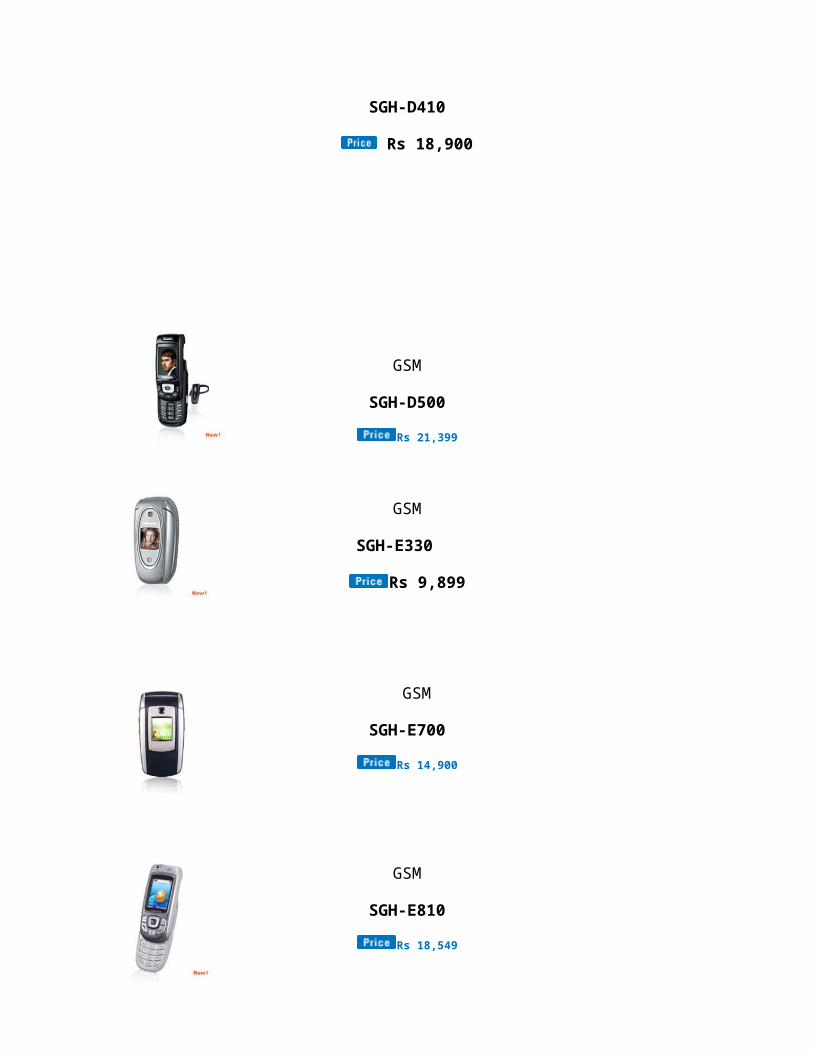
GSM
SGH-D410
Rs 18,900
GSM
SGH-D500
Rs 21,399
GSM
SGH-E330
Rs 9,899
GSM
SGH-E700
Rs 14,900
GSM
SGH-E810
Rs 18,549
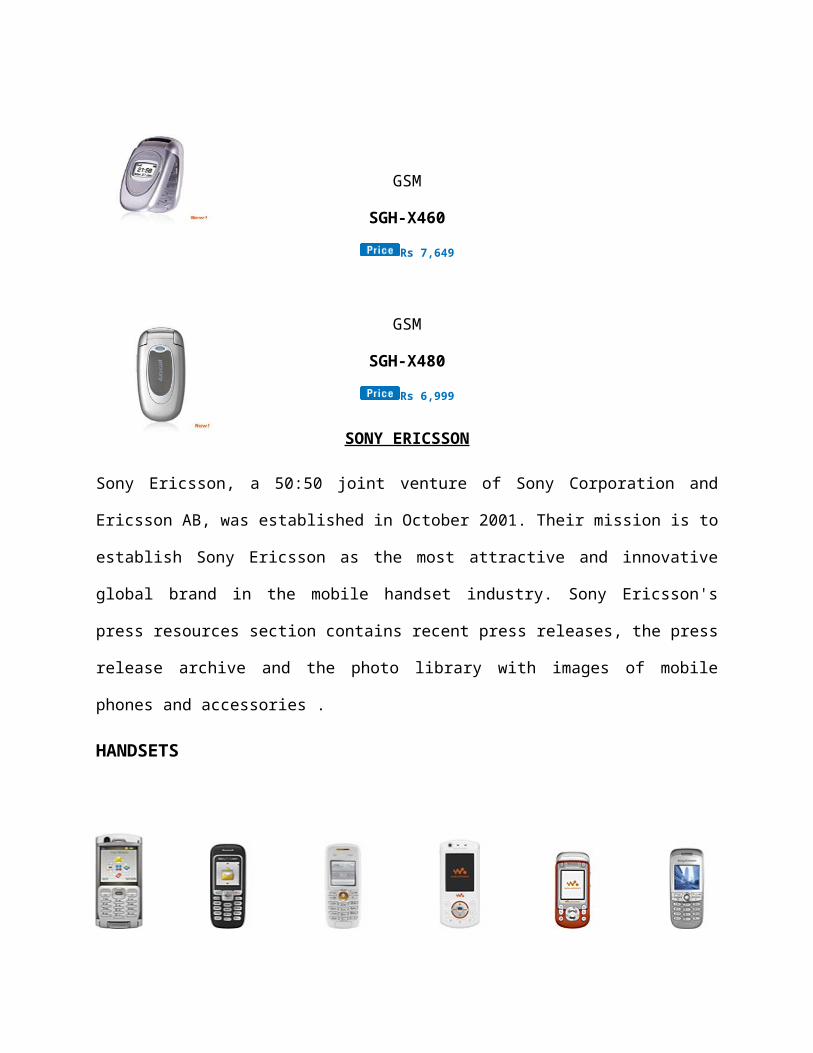
GSM
SGH-X460
Rs 7,649
GSM
SGH-X480
Rs 6,999
SONY ERICSSON
Sony Ericsson, a 50:50 joint venture of Sony Corporation and Ericsson AB,
was established in October 2001. Their mission is to establish Sony Ericsson
as the most attractive and innovative global brand in the mobile handset
industry. Sony Ericsson's press resources section contains recent press
releases, the press release archive and the photo library with images of
mobile phones and accessories .
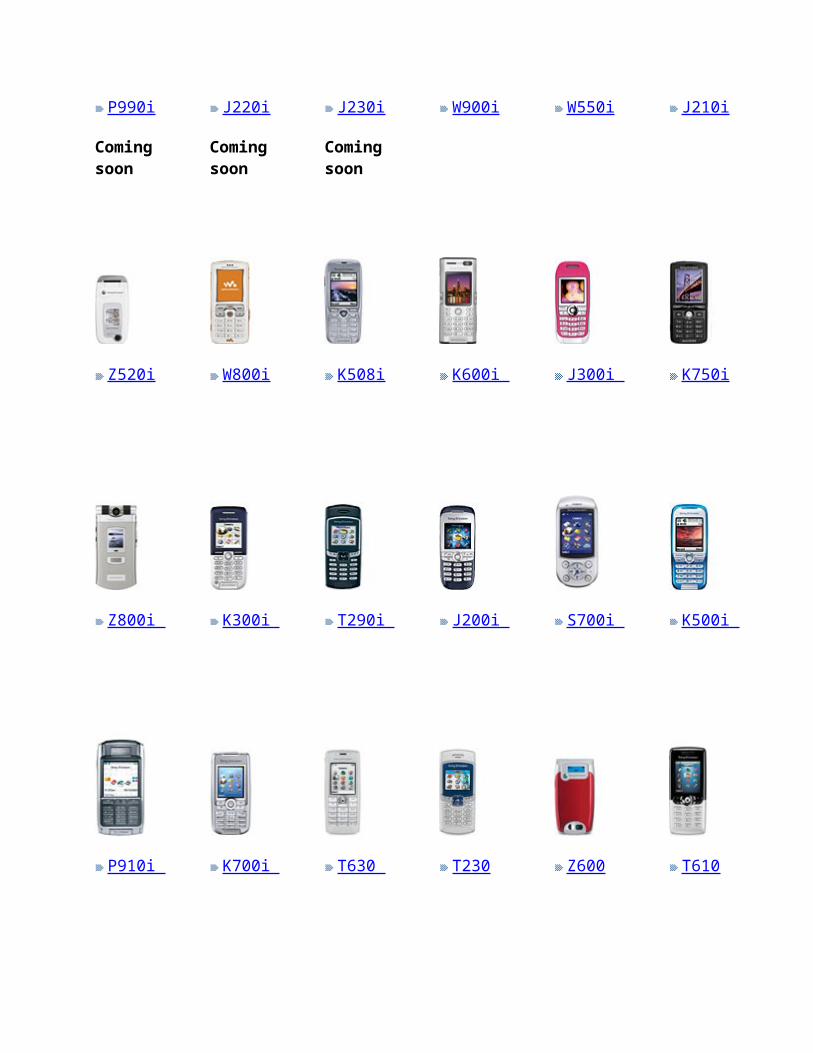
HANDSETS
P990i
Coming soon
J220i
Coming soon
J230i
Coming soon
W900i W550i J210i
Z520i W800i K508i K600i J300i K750i
Z800i K300i T290i J200i S700i K500i
P910i K700i T630 T230 Z600 T610
MOTOROLA
Motorola is a Fortune 100 global communications leader that provides
seamless mobility products and solutions across broadband, embedded
systems and wireless networks. Seamless mobility means you can reach the
people, things and information you need in your home, auto, workplace and
all spaces in between. Seamless mobility harnesses the power of technology
convergence and enables smarter, faster, cost-effective and flexible
communication. Motorola had sales of US $31.3 billion in 2008.
Today, Motorola is comprised of four businesses: Connected Home
Solutions, Government & Enterprise Mobility Solutions, Mobile Devices and
Networks.
Connected Home Solutions
Provides a scalable, integrated end-to-end system for the delivery of
broadband services that keeps consumers informed, entertained and
connected. Its technology enables network operators and retailers to create
and execute on new business opportunities by providing innovative products
and services to the home.
Government and Enterprise Mobility Solutions
A leading provider of integrated radio communications and information
solutions, with more than 65 years of experience in meeting the mission-
critical requirements of public safety,
government and enterprise customers worldwide. It also designs,
manufactures and sells automotive and industrial electronics systems and
telematics systems that enable automated roadside assistance, navigation
and advanced safety features for automobiles.
Mobile Devices
Offers market-changing icons of personal technology - transforming the
device formerly known as the cell phone into a universal remote control for
life. A leader in multi-mode, multi-band communications products and
technologies, Mobile Devices designs, manufactures, sells and services
wireless subscriber and server equipment for cellular systems, portable
energy storage products and systems, servers and software solutions and
related software and accessory products.
Networks
Delivers proven capabilities in cellular, wireless broadband and wireline
access technologies, with recognized leadership in integrating core networks
through wireless IP, wireless softswitch and IP multimedia subsystems. The
Networks group is advancing seamless mobility with innovative technology
solutions, as well as a billion dollar services business with an expanded
portfolio delivering support, integration, applications and management.
LG MOBILES
LG Electronics India Pvt. Ltd., a wholly owned subsidiary of LG Electronics,
South Korea was established in January, 1997 after clearance from the
Foreign Investment Promotion Board (FIPB).
The company has achieved a turnover of Rs 6500 crore in 2004 and aims to
touch a turnover of 10 Billion US Dollars by 2010 and commands an enviable
position in the GSM mobile phone market. It has already started
manufacturing of GSM phones in its plant at Pune.
RESEARCH METHODOLOGY
Research is the systematic and objective search for the analysis of the
information relevant to the identification and solution of any problem in the
field of channel
The objective behind this project was to get a deep insight into the answers
to the questions “what are the brand preferences of the consumers and what
they expect from mobile handsets providers and study of current mobile
market”. The object of the survey was the mobile users of various mobile
companies.
RESEARCH OBJECTIVES
MAIN OBJECTIVE
o Analysis of current market scenario of mobile market with special
reference to NOKIA and SAMSUNG IND.MOBILES.
SUB OBJECTIVES
o To study the satisfaction level of cellular users in Noida, Ghaziabad
and New Delhi
o To study the buying behaviors of the customers.
o To understand the price sensitivity of the market in respect to the
telecom services.
o To identify the key buying factors which are used in hiring the
telecom services.
o To understand the various sales promotional schemes being offered
by various mobile handsets providers.
Methodology Used
The data was collected through both the primary as well as secondary
sources. The primary source of the data is the users of various mobile
handset users. The sources of secondary data are the websites and company
catalogues.
The Research Design
The research design followed for this research was:
1. Problem Formulation: This refers to transferring of the management
problem into a research problem. The management was “to gauge the
behavior of consumer in respect of mobile market.”
2. Research Method: the method involved getting the questionnaires
filled by consumers and then analyzing the data with the help of SPSS
software.
3. Research Design: It is the specification of the methods and
procedures for acquiring he information needed. It is overall
operational pattern or framework of the project that stimulates what
information is to be collected, from which source and by what
procedure. The three types of design used are exploratory, descriptive
and causal for this research the descriptive design was used. This is
because it is marked by the prior formulation of specific research
questions. It has a preplanned and structure design. For descriptive
study proposed data analysis and project output are critical aspects. It
was decided that the users of various mobile companies would be used
as the primary source of data.
4. Selection of data collection techniques: For this research the data
was to be collected was of primary as well as secondary nature. The
source of primary data was the user of various mobile companies. Thus
the data collection was done through a survey by using questionnaire
technique. This consisted of an interview and questionnaire. The
questionnaire contained the questions relating hiring and uses of
different mobile handsets. The questionnaire was first pre tested and
later making certain necessary changes in modified it.
5. Sample Design: A sample chosen has to be representative of the
population. For this survey cluster and stratified sampling was used.
The sample size was more than 300 users and 50 retailers.
6. Data collection: At this stage the data is actually colleted according
to the decided technique of data collection. The questionnaire is main
source for the collection of data.
7. Analysis and interpretation: Data which has been obtained are
seldom useful to anyone, if it is not analyzed and interpreted in order,
the breaking down of constituent parts and the manipulating of the
data and to obtain answer to the research questions. Interpretations
involve taking the result of analysis, making inferences relevant to the
research relationship studied and drawing conclusions about these
relationships.
8. Research report: The culmination of the research process is research
report. Methodology, report and recommendations for course of action
are presented. The two critical attribute of report are completeness
and conciseness. Therefore these attributes are conflicting; a balance
has to be stuck between the two. On presenting the research report
one should understand it and able to take decision on
recommendations and conclusions of research.
Steps in Sampling Design
1. Type of Universe: The first step in developing any sample design is
to clearly define the set of objects, technically called the Universe, to
be studied. Universe can be infinite or finite. In the research the
universe taken was the finite i.e. the users of various mobile
companies.
2. Sampling Unit: A decision has to be taken concerning a sampling unit
before selecting sample. Sampling unit in case of this research study
were the present and prospective consumers of Noida, Ghaziabad and
New Delhi.
3. Source list: It is known as “sampling frame” from which sample is to
be drawn. It contains names of all items of a universe. In this case
present clients “database and prospective clients” database was used
as source list to pick the required sample.
4. Size of Sample: This refers to the number of items to be selected
from universe to constitute the sample. That is optimum or neither be
excessively large, nor to small.
5. Parameters of interests: In determining the sampling design, one
must consider the question of the specific population parameters
which are of interests. In this research study the parameters of interest
were the behavior of different mobile users with respect to the facilities
provided to them in handsets.
6. Time and Budgetary Constraints: Cost and time consideration from
practical point of view, have major impact upon decision relating to not
only size but also to the type of sample. In this research, the time
constraint was that it has to be done in 45days with a restricted
budget.
7. Sampling procedure: Finally, the researcher must decide the type of
sample he will use i.e., he must decide about the technique to be used
in selecting the item for the sample. In fact the technique or procedure
stands for the sample design itself. In this research study probability or
random sampling is used.
Tools for data collection
The task of the data collection begins after research problem has been
defined and research design/plan chalked out. While deciding about the
method of the data collection to be used for study, the researcher should
keep in mind two types of data primary and secondary.
1. Sources of Data:
a) Primary Data: We collect primary data during the course of
experiments in an experimental research but in case do research of
the descriptive type and perform surveys, then we can obtain primary
data either through observation or through direct communication with
the respondents in one form or another or through personal interview.
Since the research is of descriptive type in witch data is collected
through direct communication with respondents. Sample survey is
carried out during this project. The survey was performed through a
structured questionnaire.
b) Secondary Data: Secondary data means data that are already
available i.e. they refer to the data which have already been collected
by someone else. The sources of secondary data in this project were
the websites of various mobile providers, catalogues of various
mobiles, newspapers, magazines etc.
2. Method adopted in research:
The survey method was used for this research project. A general survey
was conducted to gather the required data.
3. Research tool used:
Questionnaire was used to collect the data from the users of various
mobile handsets.
a) Method of population Selection:
The population for this survey was selected with the help of cluster and
stratified random techniques. In cluster, we divided the three cities
area wise then we applied stratified.
b) Method of Interaction with the population:
Personal visit method is used for this research project. The
respondents were the users of various mobiles. These respondents
were approached and requested to give their opinion on the mobile
handsets providers by answering in the questionnaire.

Limitations of the research
This research was subjected to following limitation:
1. The survey cannot be termed 100% accurate due to lack of time and
cost and only 300 users and 50 retailers and whole sellers had been
studied. Thus the scope of study is limited in terms of no. of
respondent.
2. The lack of candidness of respondent towards answering the
questionnaire in few cases may have reduced the accuracy of survey
to some extent.
3. Despite the unbiased opinion and efforts the possibility of technical
exceptions cannot be ruled out.
4. The statistical analysis with various automated tools might have
computational errors.
FINDINGS AND ANALYSIS
Findings and analysis
Mostly people are attracted towards Nokia and Samsung mobiles due to
good reputation and low initial investment in color and flip handsets.
More than 40% users use Nokia handsets.
Handset Dimensions (w×h×d) and excellent Build Quality are the
perfect consideration in Nokia & Samsung Mobiles when buying a cell
phone.
Ergonomics is very helpful to understand the interface in these mobiles
and it also makes customers.
A lot of people use mobiles as a status symbol.
One feature that most of the users probably prefer more than anything
else is light weight of these handsets.
Analysis Of Individual Questions
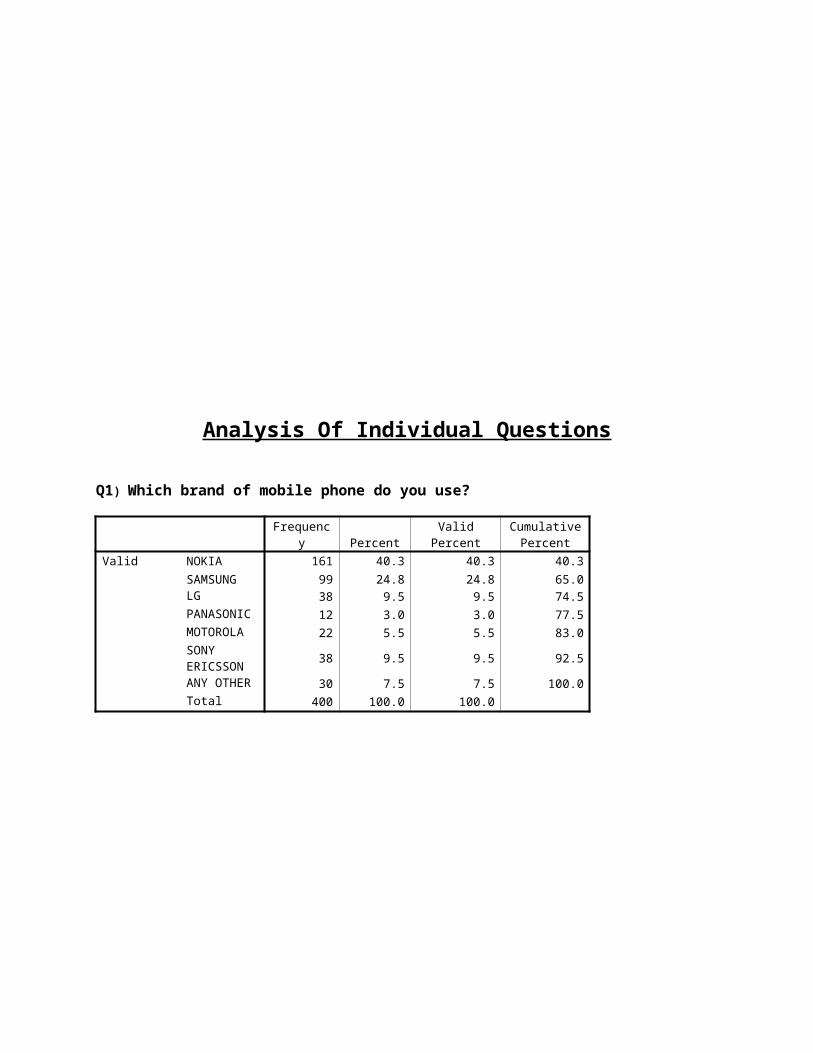
Q1) Which brand of mobile phone do you use?
Frequenc
y PercentValid
PercentCumulative
PercentValid NOKIA 161 40.3 40.3 40.3
SAMSUNG 99 24.8 24.8 65.0LG 38 9.5 9.5 74.5PANASONIC 12 3.0 3.0 77.5MOTOROLA 22 5.5 5.5 83.0SONY ERICSSON
38 9.5 9.5 92.5
ANY OTHER 30 7.5 7.5 100.0Total 400 100.0 100.0
NOKIA
SAMSUNG
LG
PANASONIC
MOTOROLA
SONY ERICSSON
ANY OTHER
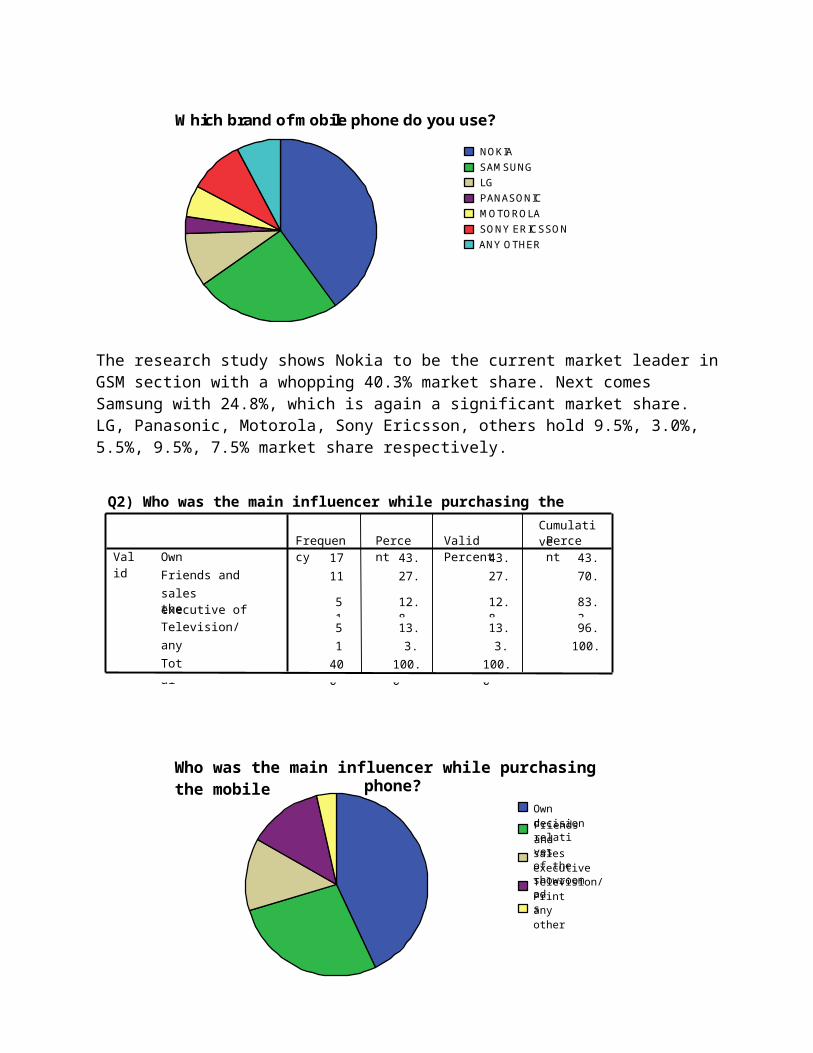
Which brand of mobile phone do you use?
The research study shows Nokia to be the current market leader in GSM section with a whopping 40.3% market share. Next comes Samsung with 24.8%, which is again a significant market share. LG, Panasonic, Motorola, Sony Ericsson, others hold 9.5%, 3.0%, 5.5%, 9.5%, 7.5% market share respectively.
Q2) Who was the main influencer while purchasing the mobile phone?
172 43.0 43.0 43.0
110 27.5 27.5 70.5
51 12.8 12.8 83.3
53 13.3 13.3 96.5
14 3.5 3.5 100.0
400 100.0 100.0
Own decision
Friends and relativessales executive ofthe showroom
Television/Print ads
any other
Total
ValidFrequency Percent Valid Percent
CumulativePercent
Own decision
Friends and relatives
sales executive of the showroom
Television/Print ads
any other
Who was the main influencer while purchasing the mobile phone?
43% of the respondents said that it was their own decision to purchase their handset, while 27.5% of the respondents were influenced by their friends and relatives to purchase that handset. Sales executive of the showroom, television could influence only 12.8%, 13.3% respectively. Other factors such as gifts could account for only 3.5% of the sales.
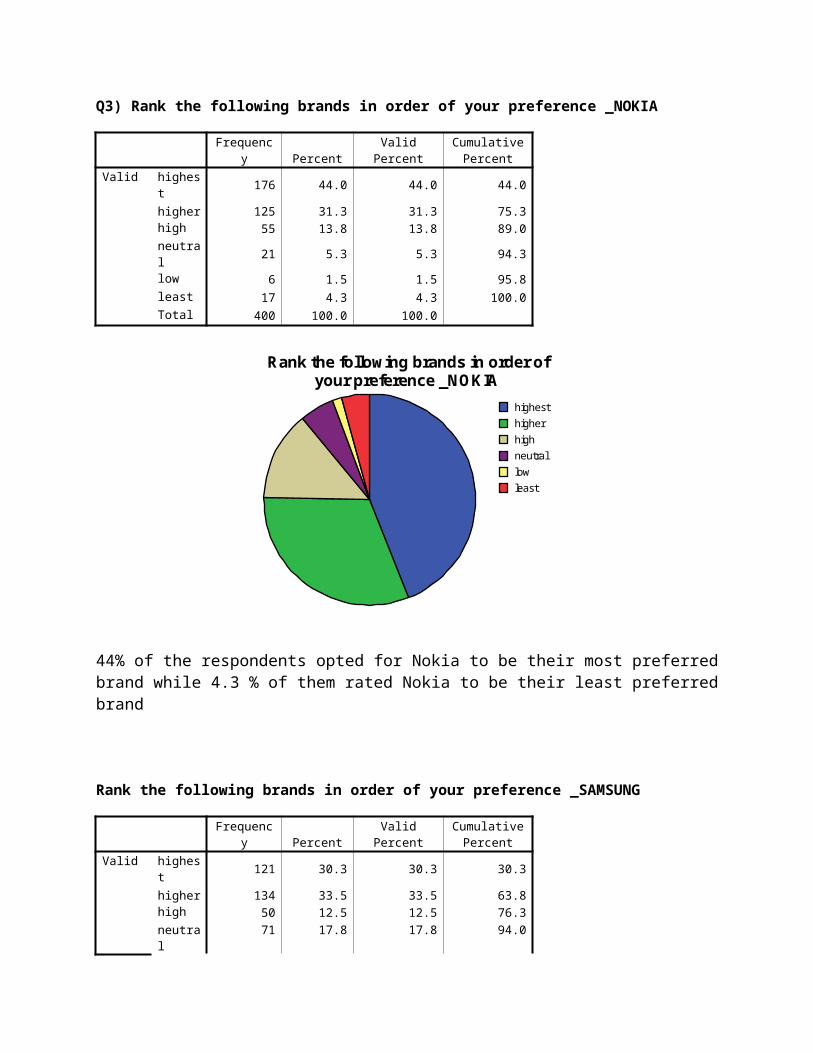
Q3) Rank the following brands in order of your preference _NOKIA
Frequenc
y PercentValid
PercentCumulative
PercentValid highes
t176 44.0 44.0 44.0
higher 125 31.3 31.3 75.3high 55 13.8 13.8 89.0neutral 21 5.3 5.3 94.3low 6 1.5 1.5 95.8least 17 4.3 4.3 100.0Total 400 100.0 100.0
highest
higher
high
neutral
low
least
Rank the following brands in order of your preference _NOKIA
44% of the respondents opted for Nokia to be their most preferred brand while 4.3 % of them rated Nokia to be their least preferred brand
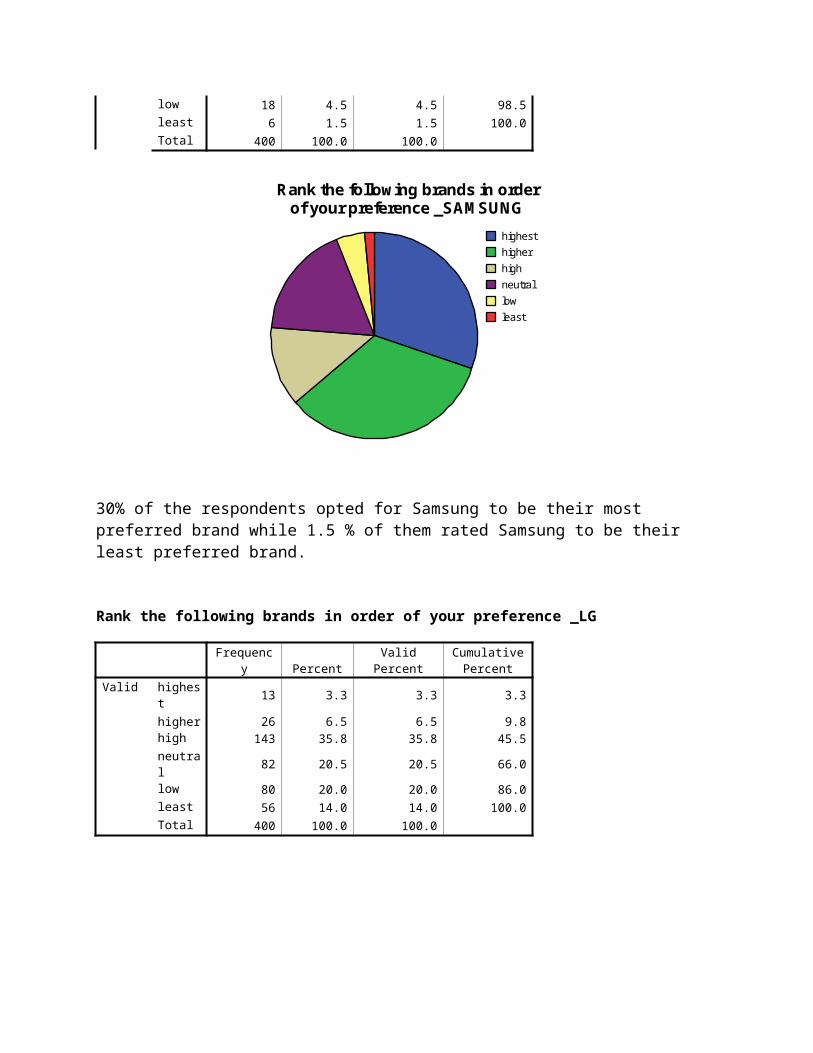
Rank the following brands in order of your preference _SAMSUNG
Frequenc
y PercentValid
PercentCumulative
PercentValid highes
t121 30.3 30.3 30.3
higher 134 33.5 33.5 63.8high 50 12.5 12.5 76.3neutral 71 17.8 17.8 94.0low 18 4.5 4.5 98.5least 6 1.5 1.5 100.0Total 400 100.0 100.0
highest
higher
high
neutral
low
least
Rank the following brands in order of your preference _SAMSUNG
30% of the respondents opted for Samsung to be their most preferred brand while 1.5 % of them rated Samsung to be their least preferred brand.
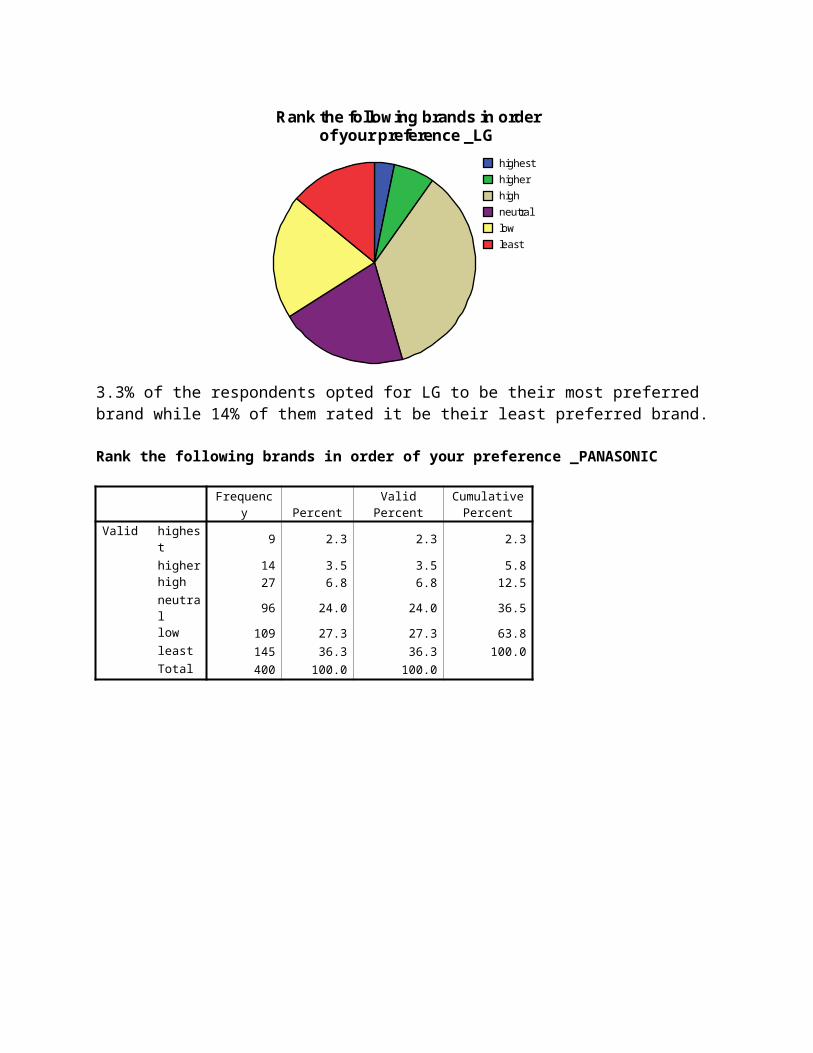
Rank the following brands in order of your preference _LG
Frequenc
y PercentValid
PercentCumulative
PercentValid highes
t13 3.3 3.3 3.3
higher 26 6.5 6.5 9.8high 143 35.8 35.8 45.5neutral 82 20.5 20.5 66.0low 80 20.0 20.0 86.0least 56 14.0 14.0 100.0Total 400 100.0 100.0
highest
higher
high
neutral
low
least
Rank the following brands in order of your preference _LG
3.3% of the respondents opted for LG to be their most preferred brand while 14% of them rated it be their least preferred brand.
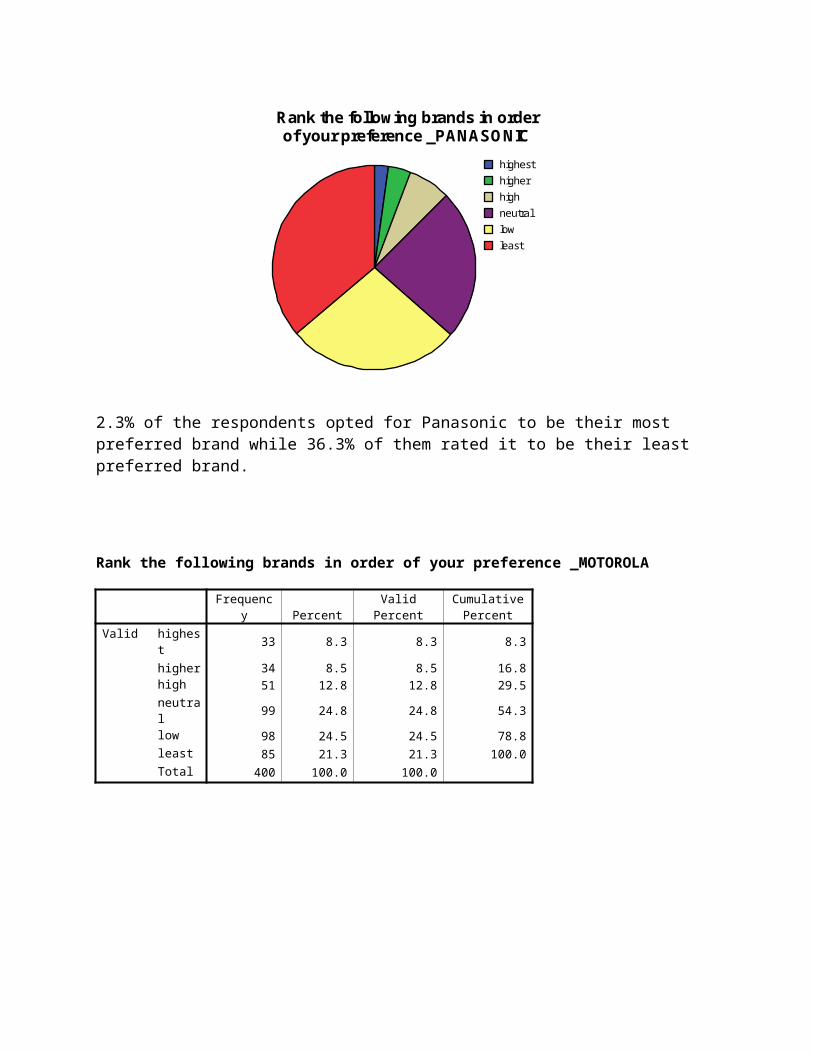
Rank the following brands in order of your preference _PANASONIC
Frequenc
y PercentValid
PercentCumulative
PercentValid highes
t9 2.3 2.3 2.3
higher 14 3.5 3.5 5.8high 27 6.8 6.8 12.5neutral 96 24.0 24.0 36.5low 109 27.3 27.3 63.8least 145 36.3 36.3 100.0Total 400 100.0 100.0
highest
higher
high
neutral
low
least
Rank the following brands in order of your preference _PANASONIC
2.3% of the respondents opted for Panasonic to be their most preferred brand while 36.3% of them rated it to be their least preferred brand.
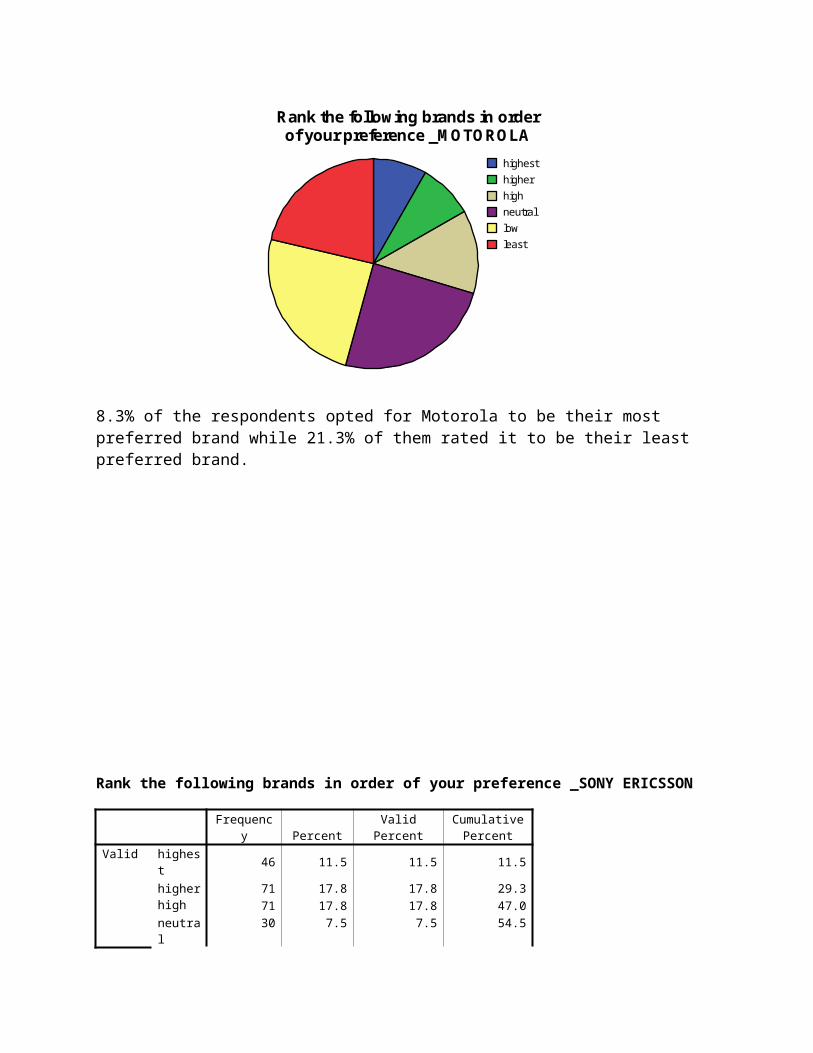
Rank the following brands in order of your preference _MOTOROLA
Frequenc
y PercentValid
PercentCumulative
PercentValid highes
t33 8.3 8.3 8.3
higher 34 8.5 8.5 16.8high 51 12.8 12.8 29.5neutral 99 24.8 24.8 54.3low 98 24.5 24.5 78.8least 85 21.3 21.3 100.0Total 400 100.0 100.0
highest
higher
high
neutral
low
least
Rank the following brands in order of your preference _MOTOROLA
8.3% of the respondents opted for Motorola to be their most preferred brand while 21.3% of them rated it to be their least preferred brand.
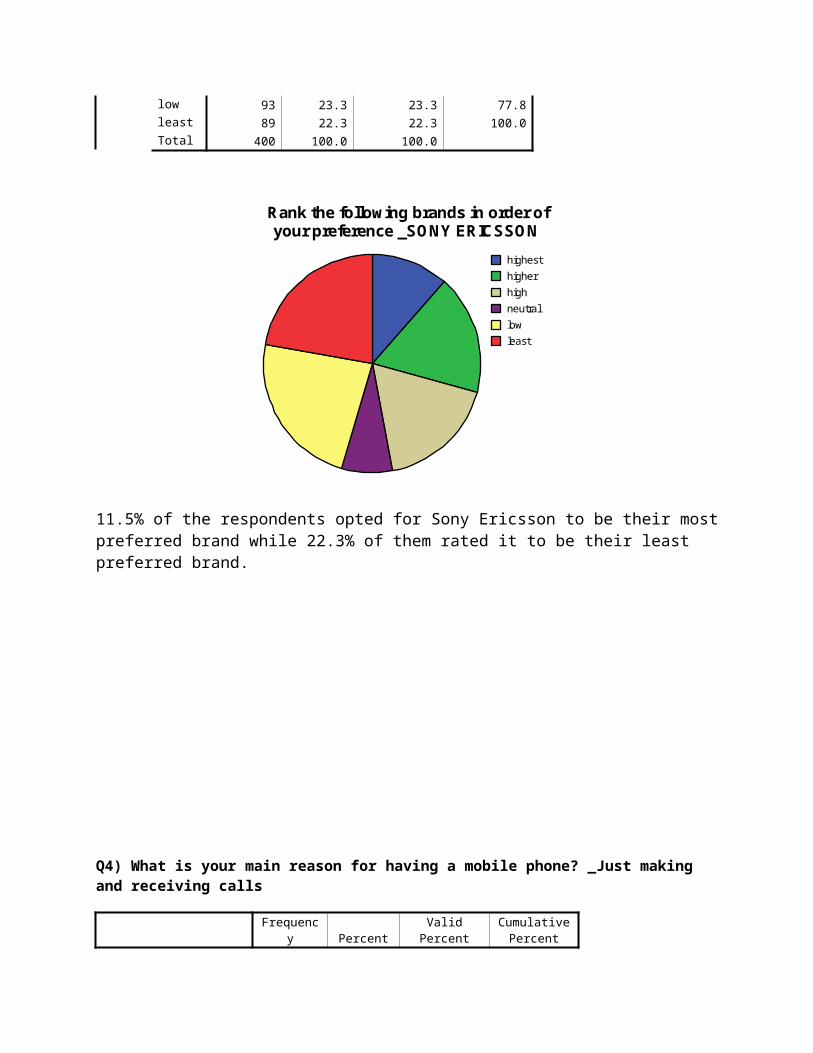
Rank the following brands in order of your preference _SONY ERICSSON
Frequenc
y PercentValid
PercentCumulative
PercentValid highes
t46 11.5 11.5 11.5
higher 71 17.8 17.8 29.3high 71 17.8 17.8 47.0neutral 30 7.5 7.5 54.5low 93 23.3 23.3 77.8least 89 22.3 22.3 100.0Total 400 100.0 100.0
highest
higher
high
neutral
low
least
Rank the following brands in order of your preference _SONY ERICSSON
11.5% of the respondents opted for Sony Ericsson to be their most preferred brand while 22.3% of them rated it to be their least preferred brand.
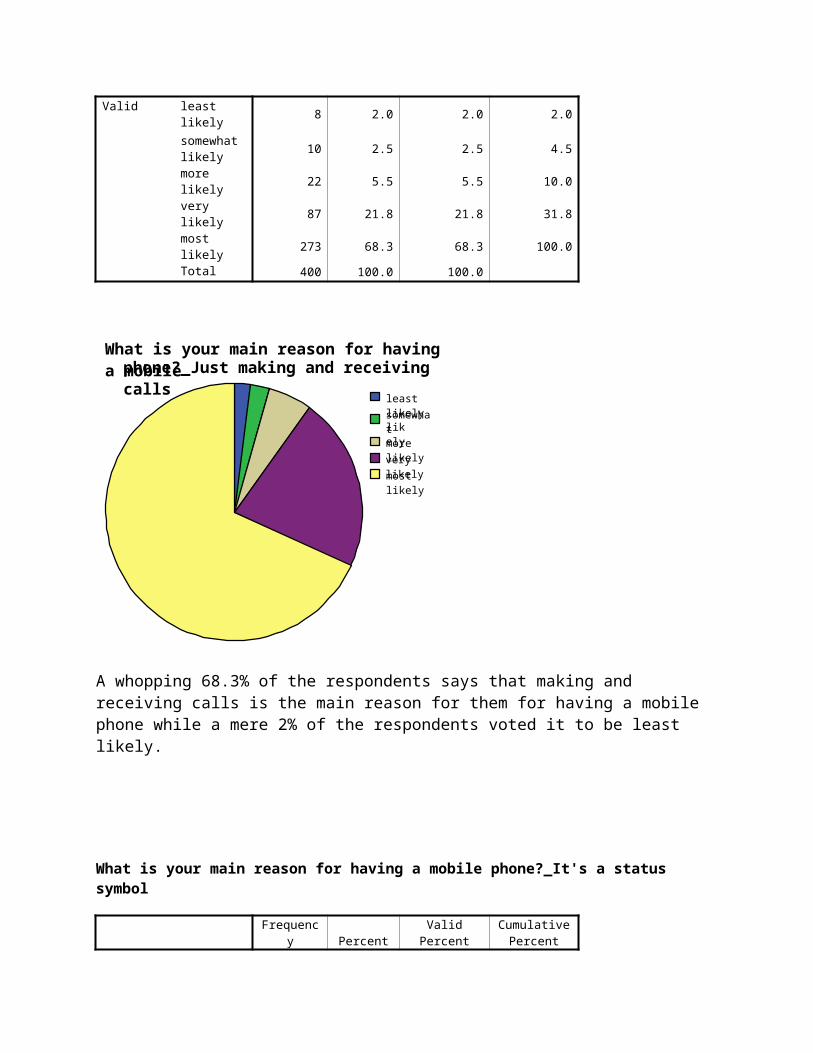
Q4) What is your main reason for having a mobile phone? _Just making and receiving calls
Frequenc
y PercentValid
PercentCumulative
PercentValid least likely 8 2.0 2.0 2.0
somewhat likely
10 2.5 2.5 4.5
more likely
22 5.5 5.5 10.0
very likely 87 21.8 21.8 31.8most likely 273 68.3 68.3 100.0Total 400 100.0 100.0
least likely
somewhat likely
more likely
very likely
most likely
What is your main reason for having a mobile phone?_Just making and receiving calls
A whopping 68.3% of the respondents says that making and receiving calls is the main reason for them for having a mobile phone while a mere 2% of the respondents voted it to be least likely.
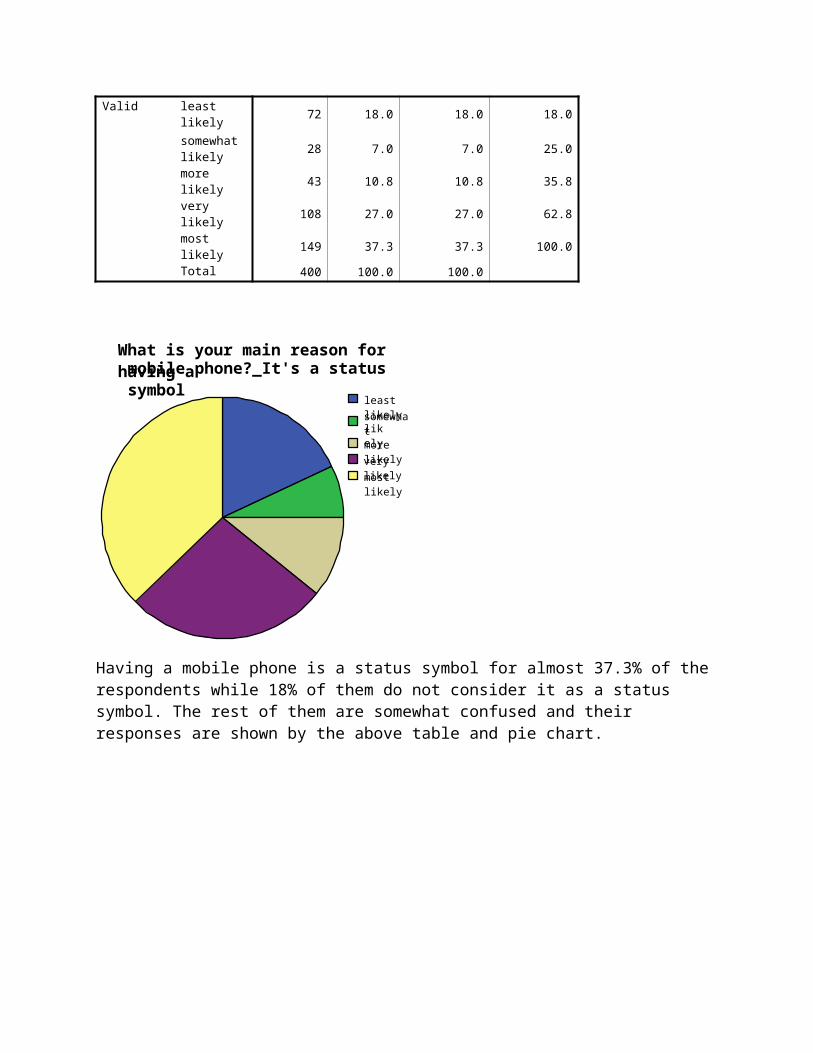
What is your main reason for having a mobile phone?_It's a status symbol
Frequenc
y PercentValid
PercentCumulative
PercentValid least likely 72 18.0 18.0 18.0
somewhat likely
28 7.0 7.0 25.0
more likely
43 10.8 10.8 35.8
very likely 108 27.0 27.0 62.8most likely 149 37.3 37.3 100.0Total 400 100.0 100.0
least likely
somewhat likely
more likely
very likely
most likely
What is your main reason for having a mobile phone?_It's a status symbol
Having a mobile phone is a status symbol for almost 37.3% of the respondents while 18% of them do not consider it as a status symbol. The rest of them are somewhat confused and their responses are shown by the above table and pie chart.
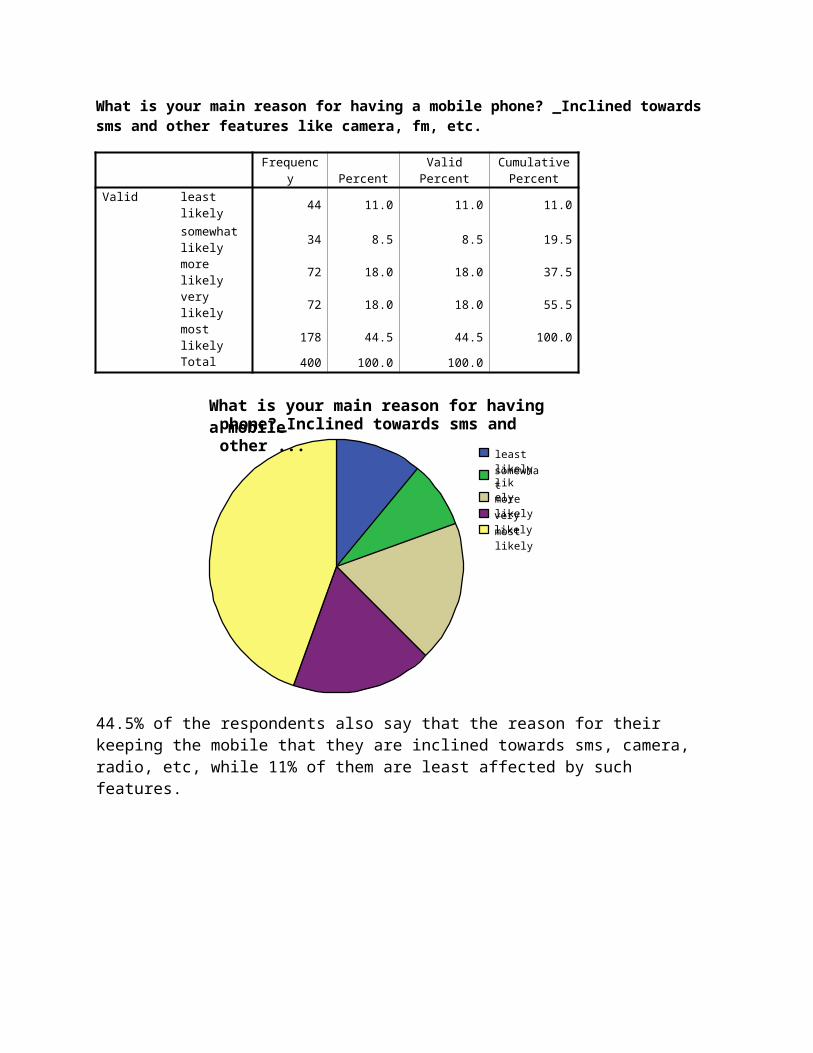
What is your main reason for having a mobile phone? _Inclined towards sms and other features like camera, fm, etc.
Frequenc
y PercentValid
PercentCumulative
PercentValid least likely 44 11.0 11.0 11.0
somewhat likely
34 8.5 8.5 19.5
more likely
72 18.0 18.0 37.5
very likely 72 18.0 18.0 55.5most likely 178 44.5 44.5 100.0Total 400 100.0 100.0
least likely
somewhat likely
more likely
very likely
most likely
What is your main reason for having a mobile phone?_Inclined towards sms and other ...
44.5% of the respondents also say that the reason for their keeping the mobile that they are inclined towards sms, camera, radio, etc, while 11% of them are least affected by such features.
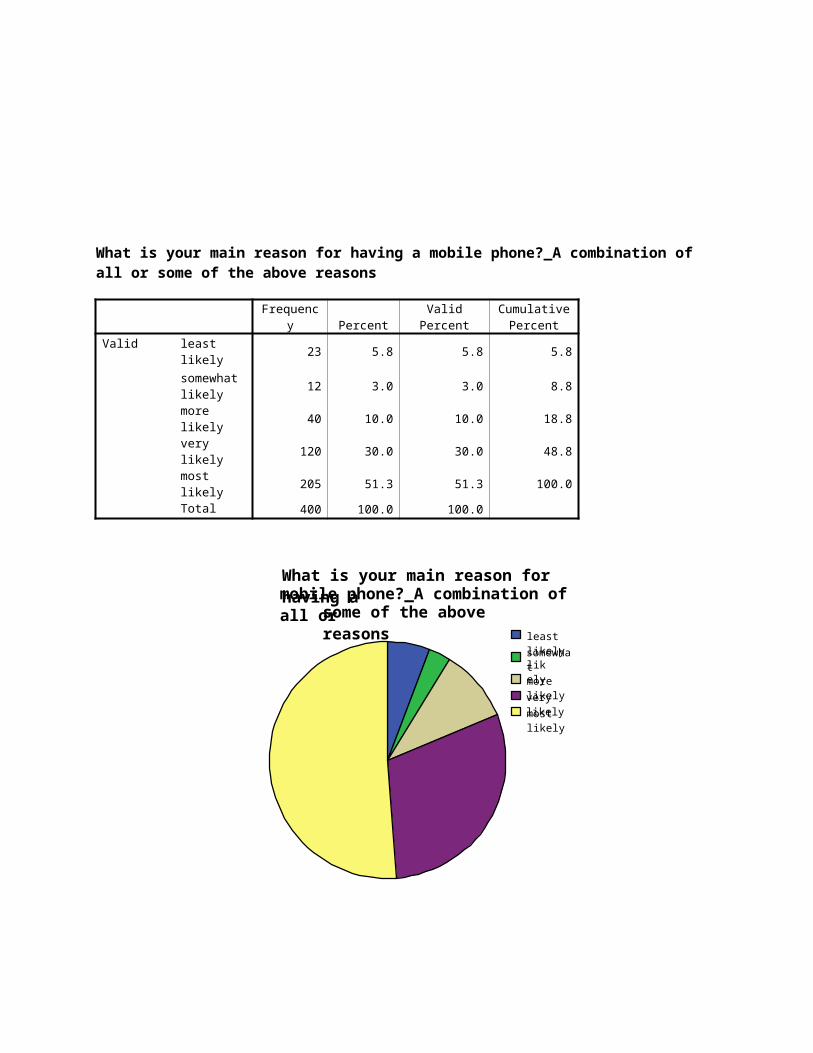
What is your main reason for having a mobile phone?_A combination of all or some of the above reasons
Frequenc
y PercentValid
PercentCumulative
PercentValid least likely 23 5.8 5.8 5.8
somewhat likely
12 3.0 3.0 8.8
more likely
40 10.0 10.0 18.8
very likely 120 30.0 30.0 48.8most likely 205 51.3 51.3 100.0Total 400 100.0 100.0
least likely
somewhat likely
more likely
very likely
most likely
What is your main reason for having a mobile phone?_A combination of all or
some of the above reasons
51% of the respondents say that a combination of all or some of the above mentioned factors is their reason to have the mobile phone, while 5.8% of them are not affected by such factors.
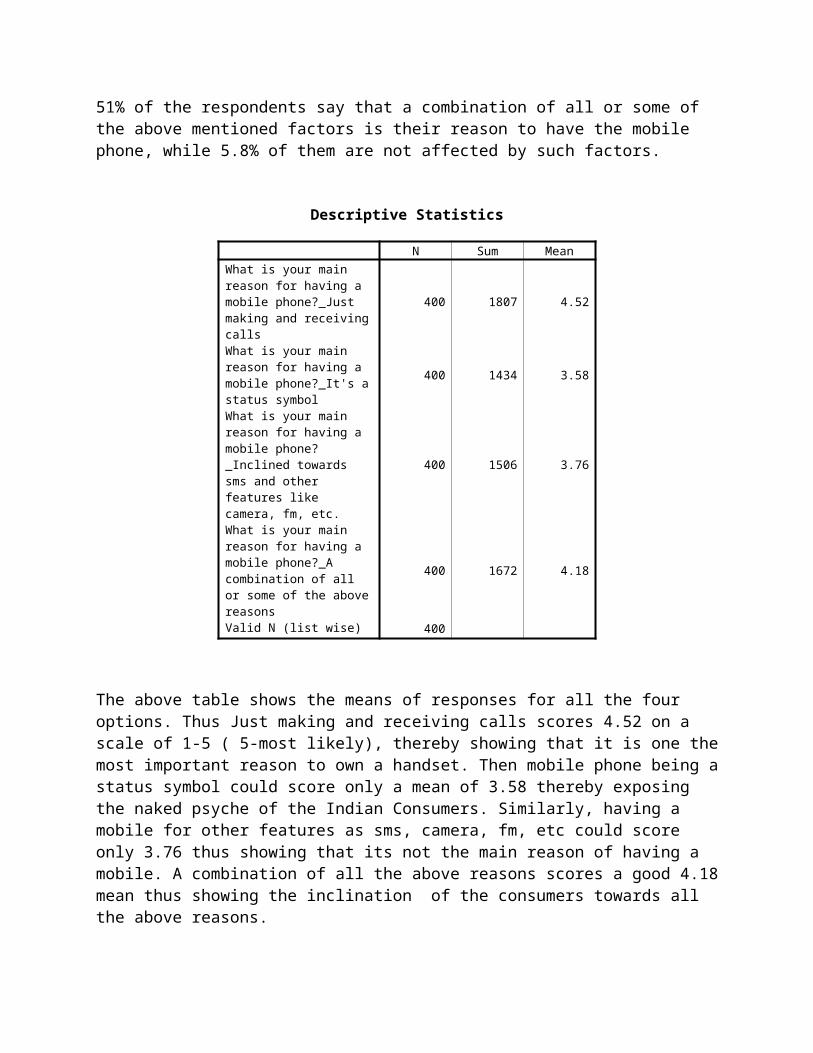
Descriptive Statistics
N Sum MeanWhat is your main reason for having a mobile phone?_Just making and receiving calls
400 1807 4.52
What is your main reason for having a mobile phone?_It's a status symbol
400 1434 3.58
What is your main reason for having a mobile phone?_Inclined towards sms and other features like camera, fm, etc.
400 1506 3.76
What is your main reason for having a mobile phone?_A combination of all or some of the above reasons
400 1672 4.18
Valid N (list wise) 400
The above table shows the means of responses for all the four options. Thus Just making and receiving calls scores 4.52 on a scale of 1-5 ( 5-most likely), thereby showing that it is one the most important reason to own a handset. Then mobile phone being a status symbol could score only a mean of 3.58 thereby exposing the naked psyche of the Indian Consumers. Similarly, having a mobile for other features as sms, camera, fm, etc could score only 3.76 thus showing that its not the main reason of having a mobile. A combination of all the above reasons scores a good 4.18 mean thus showing the inclination of the consumers towards all the above reasons.
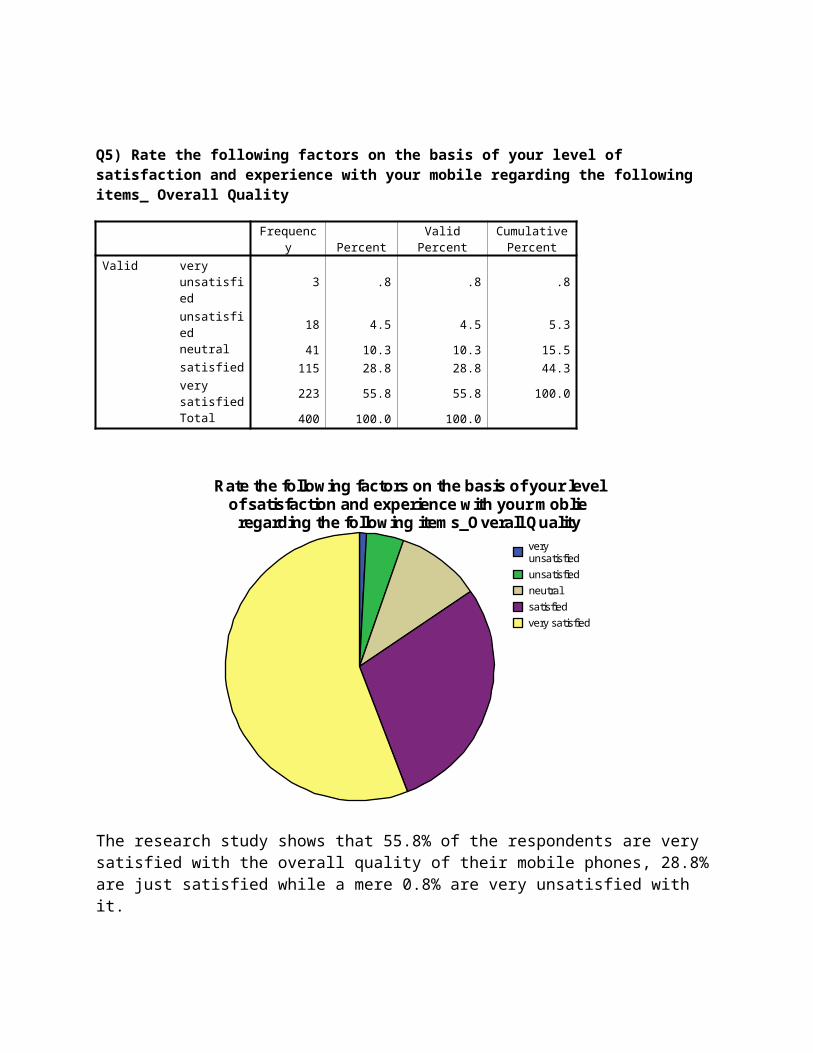
Q5) Rate the following factors on the basis of your level of satisfaction and experience with your mobile regarding the following items_ Overall Quality
Frequenc
y PercentValid
PercentCumulative
PercentValid very
unsatisfied
3 .8 .8 .8
unsatisfied
18 4.5 4.5 5.3
neutral 41 10.3 10.3 15.5satisfied 115 28.8 28.8 44.3very satisfied
223 55.8 55.8 100.0
Total 400 100.0 100.0
very unsatisfied
unsatisfied
neutral
satisfied
very satisfied
Rate the following factors on the basis of your level of satisfaction and experience with your moblie
regarding the following items_Overall Quality
The research study shows that 55.8% of the respondents are very satisfied with the overall quality of their mobile phones, 28.8% are just satisfied while a mere 0.8% are very unsatisfied with it.
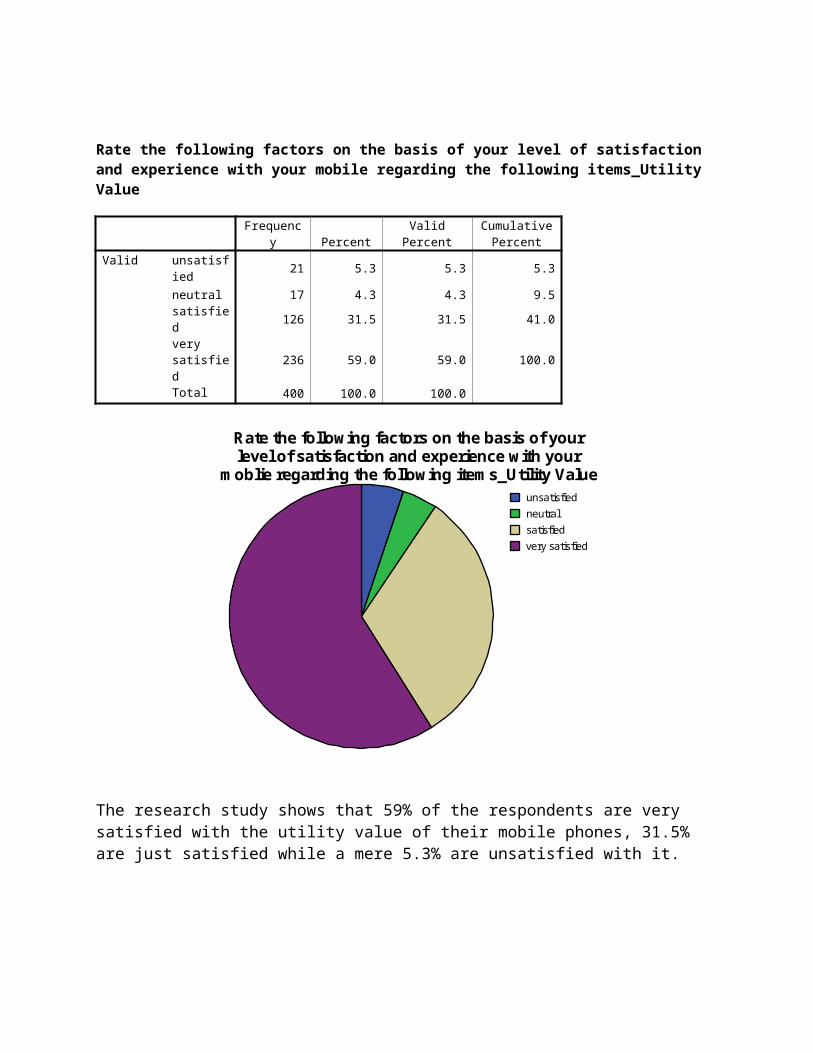
Rate the following factors on the basis of your level of satisfaction and experience with your mobile regarding the following items_Utility Value
Frequenc
y PercentValid
PercentCumulative
PercentValid unsatisfi
ed21 5.3 5.3 5.3
neutral 17 4.3 4.3 9.5satisfied 126 31.5 31.5 41.0very satisfied
236 59.0 59.0 100.0
Total 400 100.0 100.0
unsatisfied
neutral
satisfied
very satisfied
Rate the following factors on the basis of your level of satisfaction and experience with your
moblie regarding the following items_Utility Value
The research study shows that 59% of the respondents are very satisfied with the utility value of their mobile phones, 31.5% are just satisfied while a mere 5.3% are unsatisfied with it.
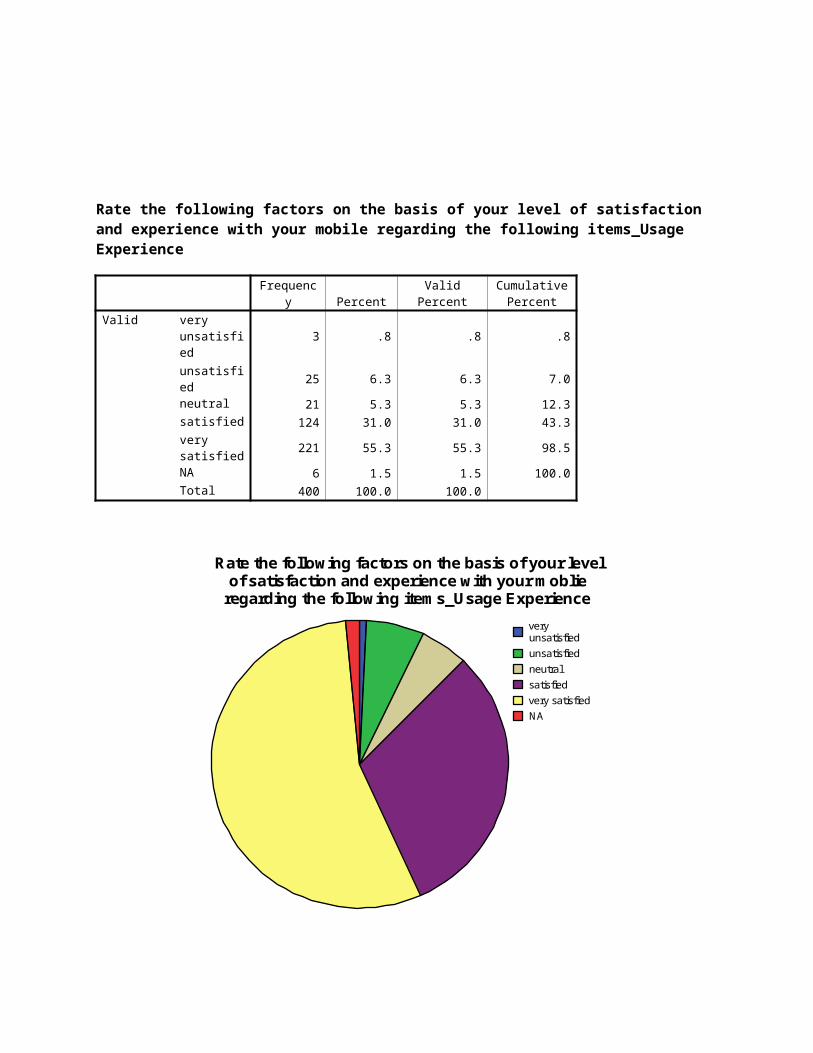
Rate the following factors on the basis of your level of satisfaction and experience with your mobile regarding the following items_Usage Experience
Frequenc
y PercentValid
PercentCumulative
PercentValid very
unsatisfied
3 .8 .8 .8
unsatisfied
25 6.3 6.3 7.0
neutral 21 5.3 5.3 12.3satisfied 124 31.0 31.0 43.3very satisfied
221 55.3 55.3 98.5
NA 6 1.5 1.5 100.0
Total 400 100.0 100.0
very unsatisfied
unsatisfied
neutral
satisfied
very satisfied
NA
Rate the following factors on the basis of your level of satisfaction and experience with your moblie
regarding the following items_Usage Experience
The research study shows that 55.3% of the respondents are very satisfied with the usage experience of their mobile phones, 31% are just satisfied while a mere 0.8% are very unsatisfied with it. There is a significant 1.5% of the respondents who have opted for Not Applicable in this case.
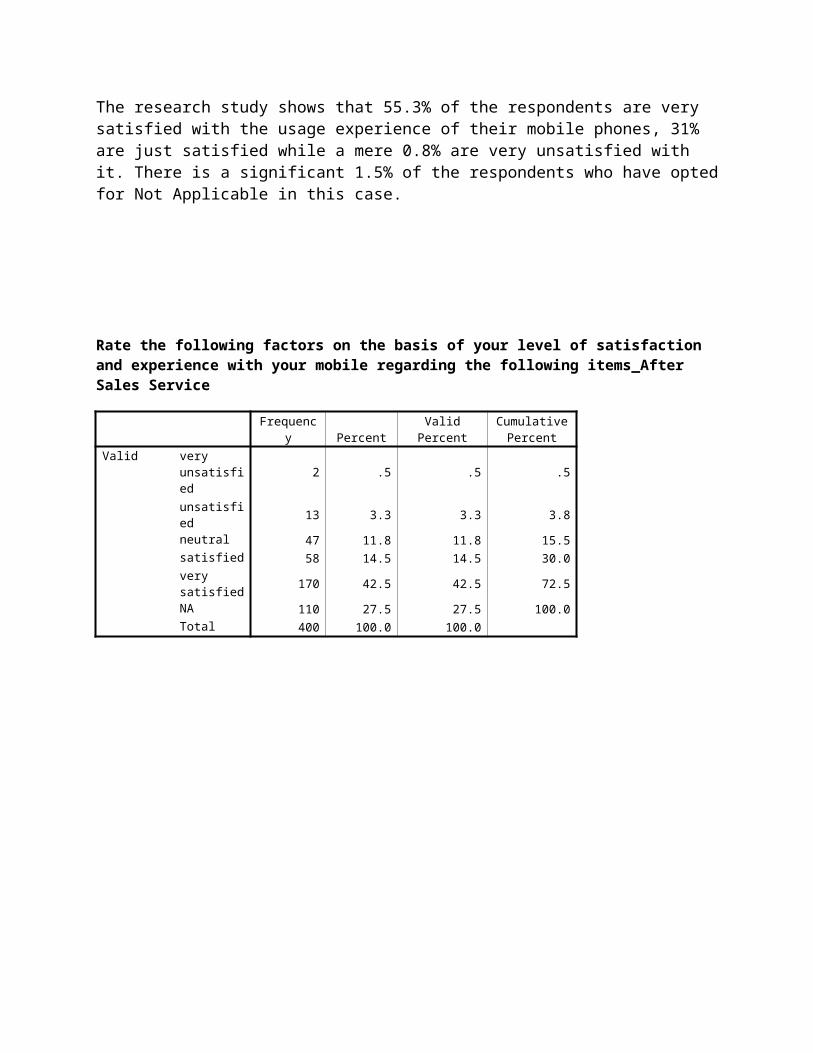
Rate the following factors on the basis of your level of satisfaction and experience with your mobile regarding the following items_After Sales Service
Frequenc
y PercentValid
PercentCumulative
PercentValid very
unsatisfied
2 .5 .5 .5
unsatisfied
13 3.3 3.3 3.8
neutral 47 11.8 11.8 15.5satisfied 58 14.5 14.5 30.0
very satisfied
170 42.5 42.5 72.5
NA 110 27.5 27.5 100.0Total 400 100.0 100.0
very unsatisfied
unsatisfied
neutral
satisfied
very satisfied
NA
Rate the following factors on the basis of your level of satisfaction and experience with your moblie
regarding the following items_After Sales Service
The research study shows that 42.5% of the respondents are very satisfied with the after sales service of their mobile phones, 14.5% are just satisfied while a 3.8% are either unsatisfied or very unsatisfied with it. Here also 27.5% have opted for NA which means they have never availed after sales service.
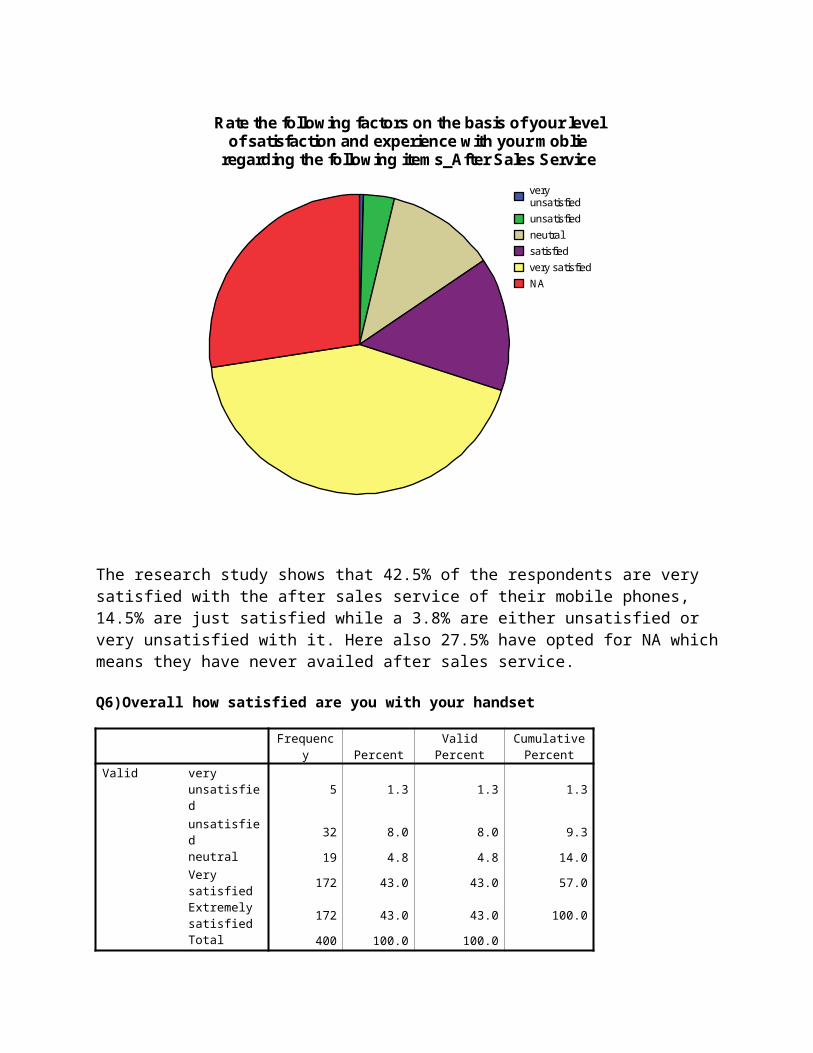
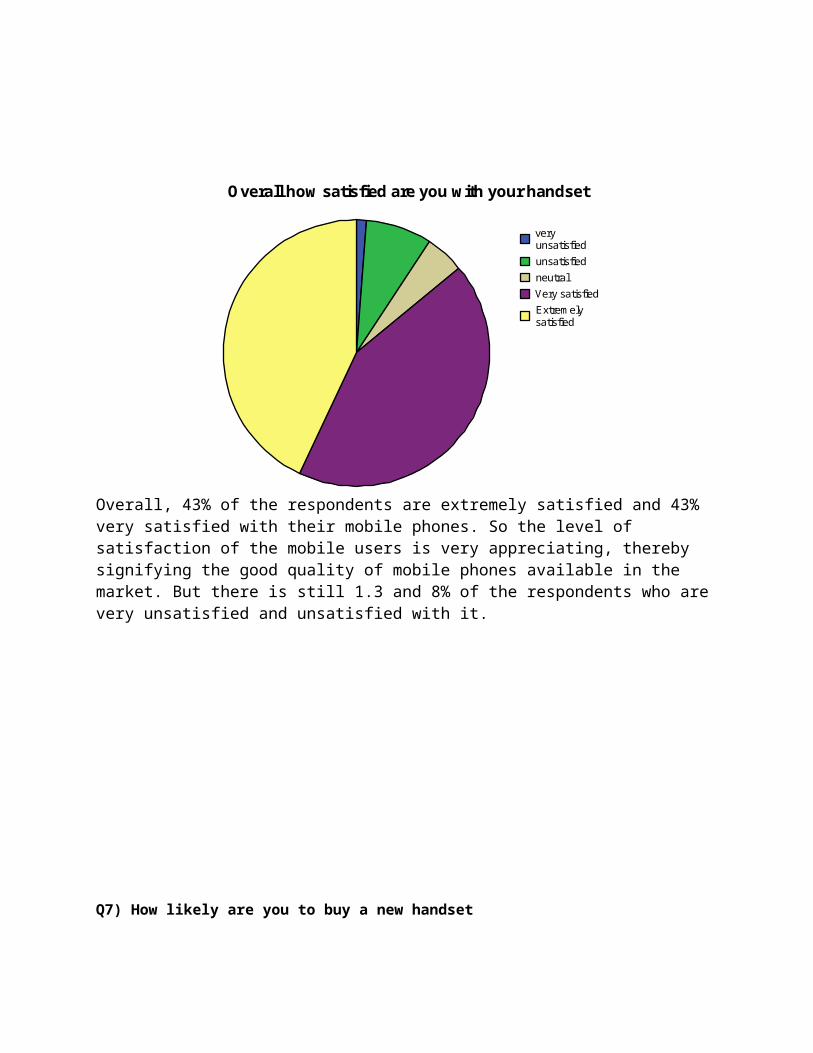
Q6)Overall how satisfied are you with your handset
Frequenc
y PercentValid
PercentCumulative
PercentValid very
unsatisfied5 1.3 1.3 1.3
unsatisfied 32 8.0 8.0 9.3neutral 19 4.8 4.8 14.0Very satisfied
172 43.0 43.0 57.0
Extremely satisfied
172 43.0 43.0 100.0
Total 400 100.0 100.0
very unsatisfied
unsatisfied
neutral
Very satisfied
Extremely satisfied
Overall how satisfied are you with your handset
Overall, 43% of the respondents are extremely satisfied and 43% very satisfied with their mobile phones. So the level of satisfaction of the mobile users is very appreciating, thereby signifying the good quality of mobile phones available in the market. But there is still 1.3 and 8% of the respondents who are very unsatisfied and unsatisfied with it.
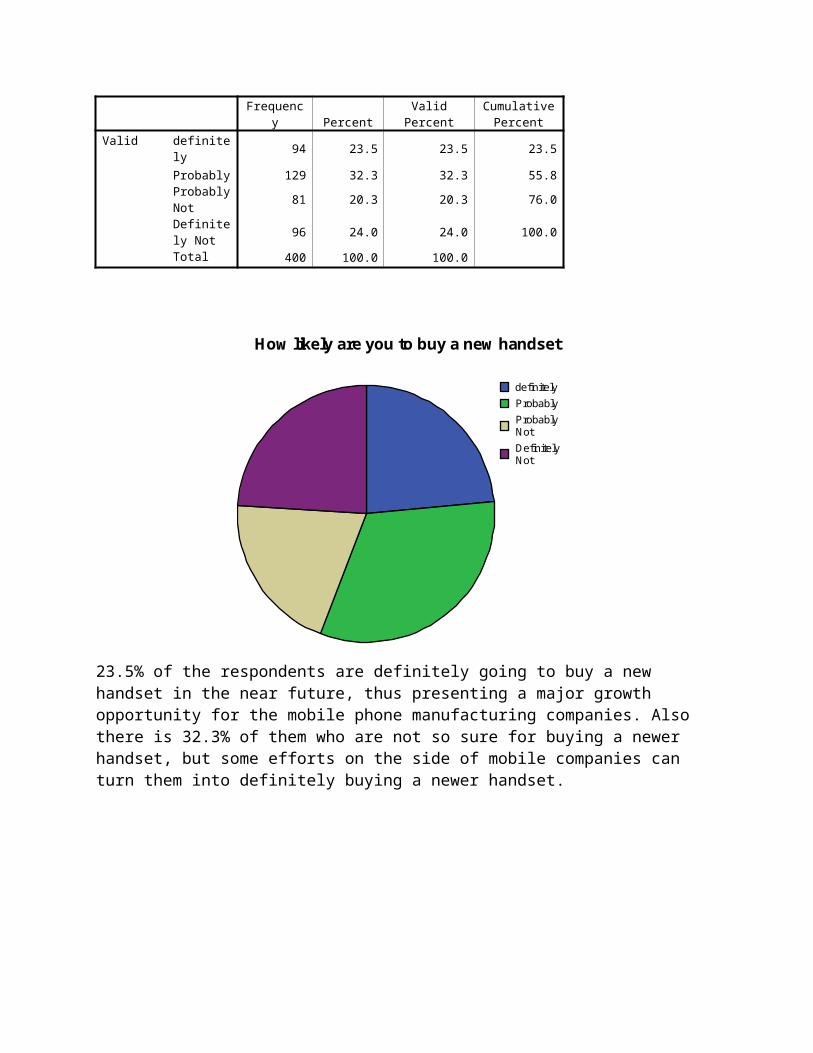
Q7) How likely are you to buy a new handset
Frequenc
y PercentValid
PercentCumulative
PercentValid definitely 94 23.5 23.5 23.5
Probably 129 32.3 32.3 55.8Probably Not
81 20.3 20.3 76.0
Definitely Not
96 24.0 24.0 100.0
Total 400 100.0 100.0
definitely
Probably
Probably Not
Definitely Not
How likely are you to buy a new handset
23.5% of the respondents are definitely going to buy a new handset in the near future, thus presenting a major growth opportunity for the mobile phone manufacturing companies. Also there is 32.3% of them who are not so sure for buying a newer handset, but some efforts on the side of mobile companies can turn them into definitely buying a newer handset.
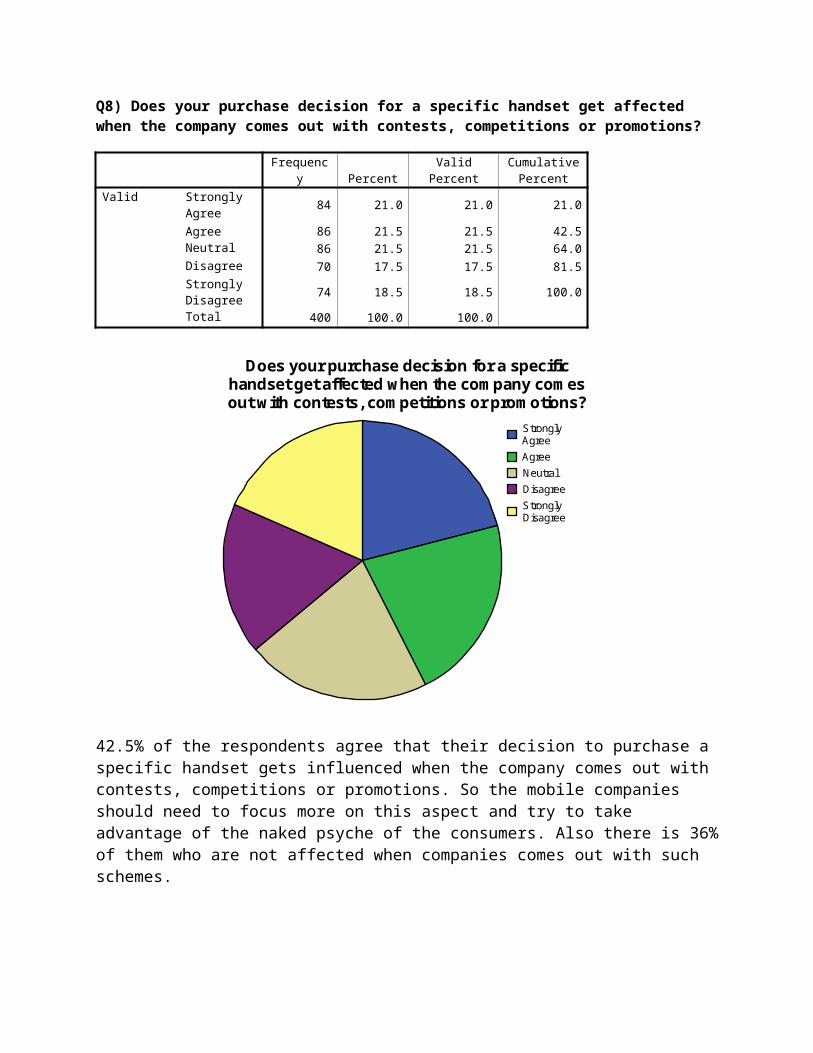
Q8) Does your purchase decision for a specific handset get affected when the company comes out with contests, competitions or promotions?
Frequenc
y PercentValid
PercentCumulative
PercentValid Strongly
Agree84 21.0 21.0 21.0
Agree 86 21.5 21.5 42.5Neutral 86 21.5 21.5 64.0Disagree 70 17.5 17.5 81.5Strongly Disagree
74 18.5 18.5 100.0
Total 400 100.0 100.0
Strongly Agree
Agree
Neutral
Disagree
Strongly Disagree
Does your purchase decision for a specific handset get affected when the company comes out with contests, competitions or promotions?
42.5% of the respondents agree that their decision to purchase a specific handset gets influenced when the company comes out with contests, competitions or promotions. So the mobile companies should need to focus more on this aspect and try to take advantage of the naked psyche of the consumers. Also there is 36% of them who are not affected when companies comes out with such schemes.
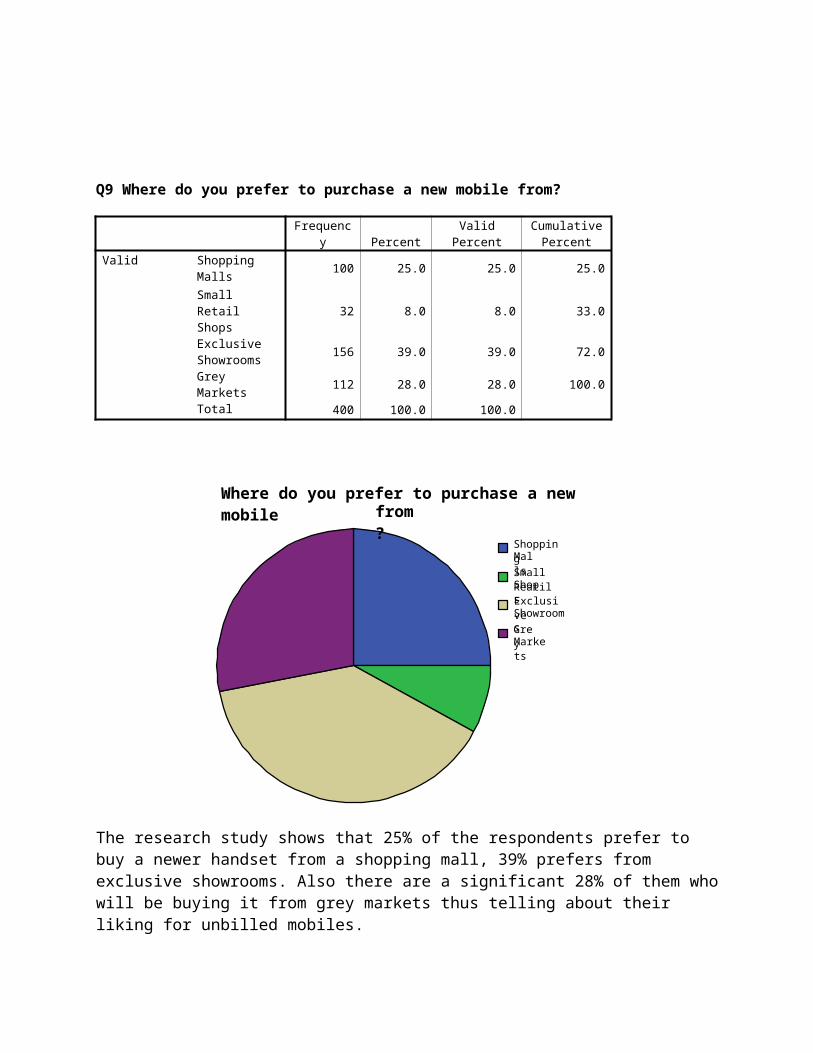
Q9 Where do you prefer to purchase a new mobile from?
Frequenc
y PercentValid
PercentCumulative
PercentValid Shopping
Malls100 25.0 25.0 25.0
Small Retail Shops
32 8.0 8.0 33.0
Exclusive Showrooms
156 39.0 39.0 72.0
Grey Markets 112 28.0 28.0 100.0Total 400 100.0 100.0
Shopping Malls
Small Reatil Shops
Exclusive Showrooms
Grey Markets
Where do you prefer to purchase a new mobile from?
The research study shows that 25% of the respondents prefer to buy a newer handset from a shopping mall, 39% prefers from exclusive showrooms. Also there are a significant 28% of them who will be buying it from grey markets thus telling about their liking for unbilled mobiles.
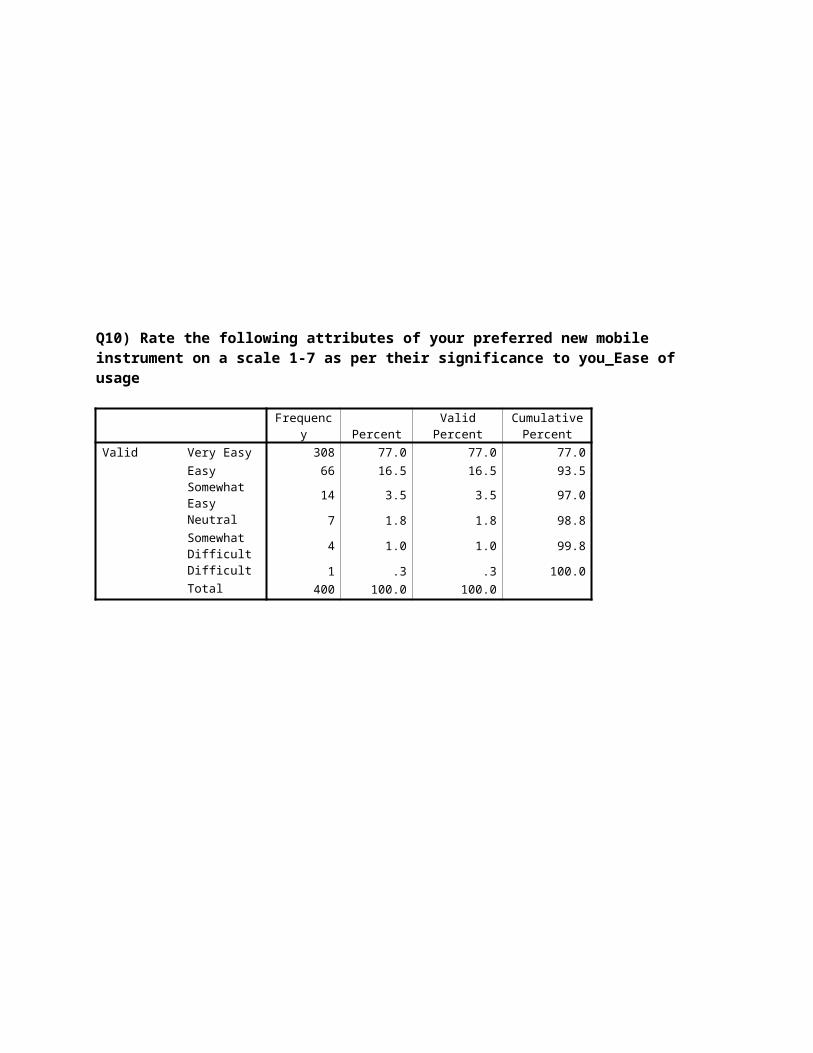
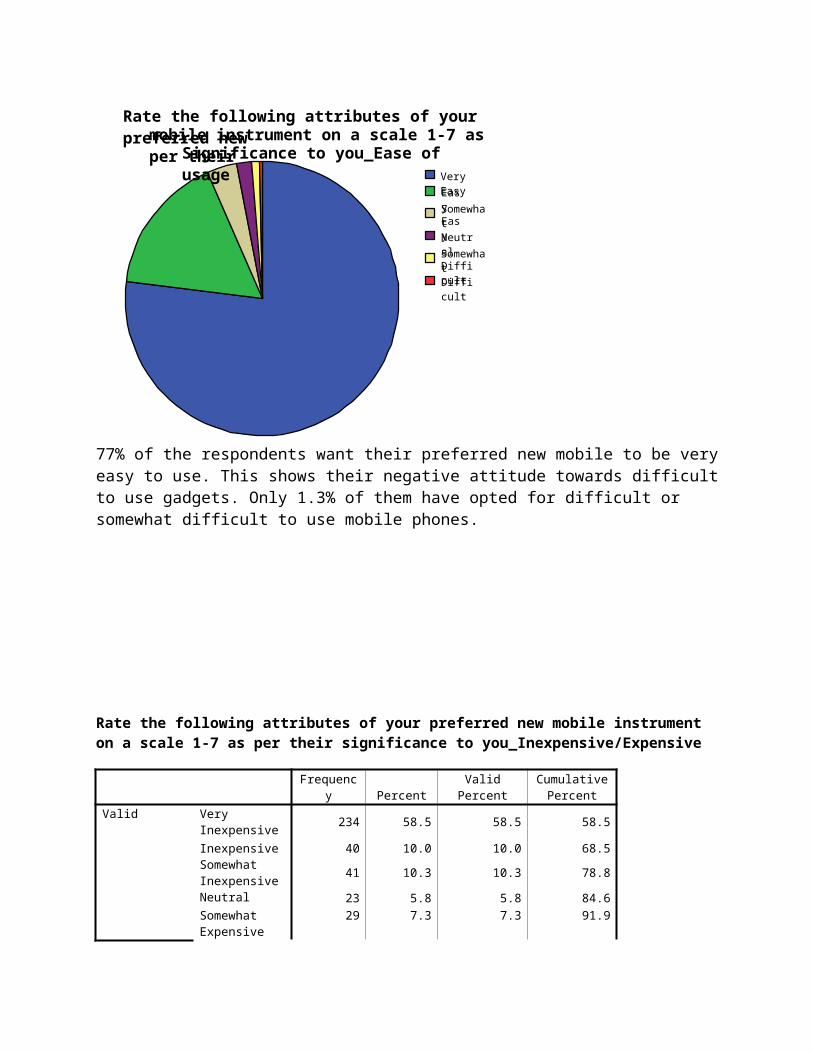
Q10) Rate the following attributes of your preferred new mobile instrument on a scale 1-7 as per their significance to you_Ease of usage
Frequenc
y PercentValid
PercentCumulative
PercentValid Very Easy 308 77.0 77.0 77.0
Easy 66 16.5 16.5 93.5Somewhat Easy
14 3.5 3.5 97.0
Neutral 7 1.8 1.8 98.8
Very Easy
Easy
Somewhat Easy
Neutral
Somewhat Difficult
Difficult
Rate the following attributes of your preferred new mobile instrument on a scale 1-7 as per their
Significance to you_Ease of usage
Somewhat Difficult
4 1.0 1.0 99.8
Difficult 1 .3 .3 100.0Total 400 100.0 100.0
77% of the respondents want their preferred new mobile to be very easy to use. This shows their negative attitude towards difficult to use gadgets. Only 1.3% of them have opted for difficult or somewhat difficult to use mobile phones.
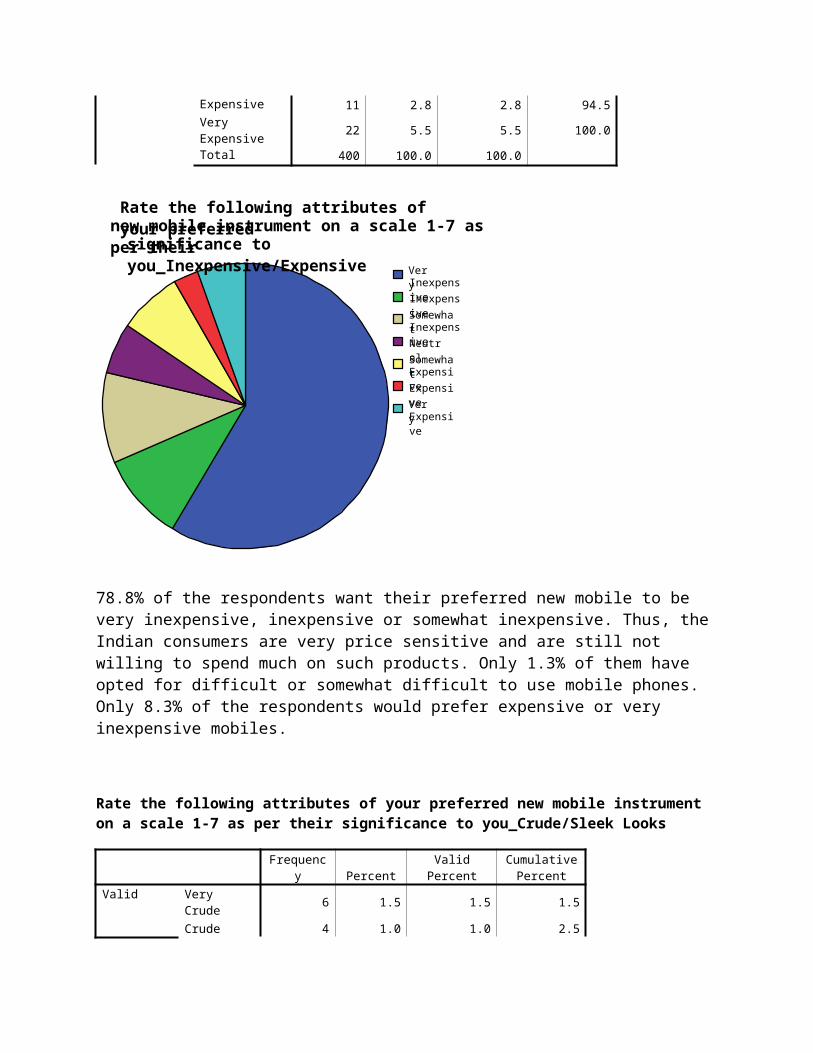
Rate the following attributes of your preferred new mobile instrument on a scale 1-7 as per their significance to you_Inexpensive/Expensive
Frequenc
y PercentValid
PercentCumulative
PercentValid Very
Inexpensive234 58.5 58.5 58.5
Inexpensive 40 10.0 10.0 68.5Somewhat Inexpensive
41 10.3 10.3 78.8
Neutral 23 5.8 5.8 84.6
Very Inexpensive
Inexpensive
Somewhat Inexpensive
Neutral
Somewhat Expensive
Expensive
Very Expensive
Rate the following attributes of your preferred new mobile instrument on a scale 1-7 as per their
significance to you_Inexpensive/Expensive
Somewhat Expensive
29 7.3 7.3 91.9
Expensive 11 2.8 2.8 94.5Very Expensive
22 5.5 5.5 100.0
Total 400 100.0 100.0
78.8% of the respondents want their preferred new mobile to be very inexpensive, inexpensive or somewhat inexpensive. Thus, the Indian consumers are very price sensitive and are still not willing to spend much on such products. Only 1.3% of them have opted for difficult or somewhat difficult to use mobile phones. Only 8.3% of the respondents would prefer expensive or very inexpensive mobiles.
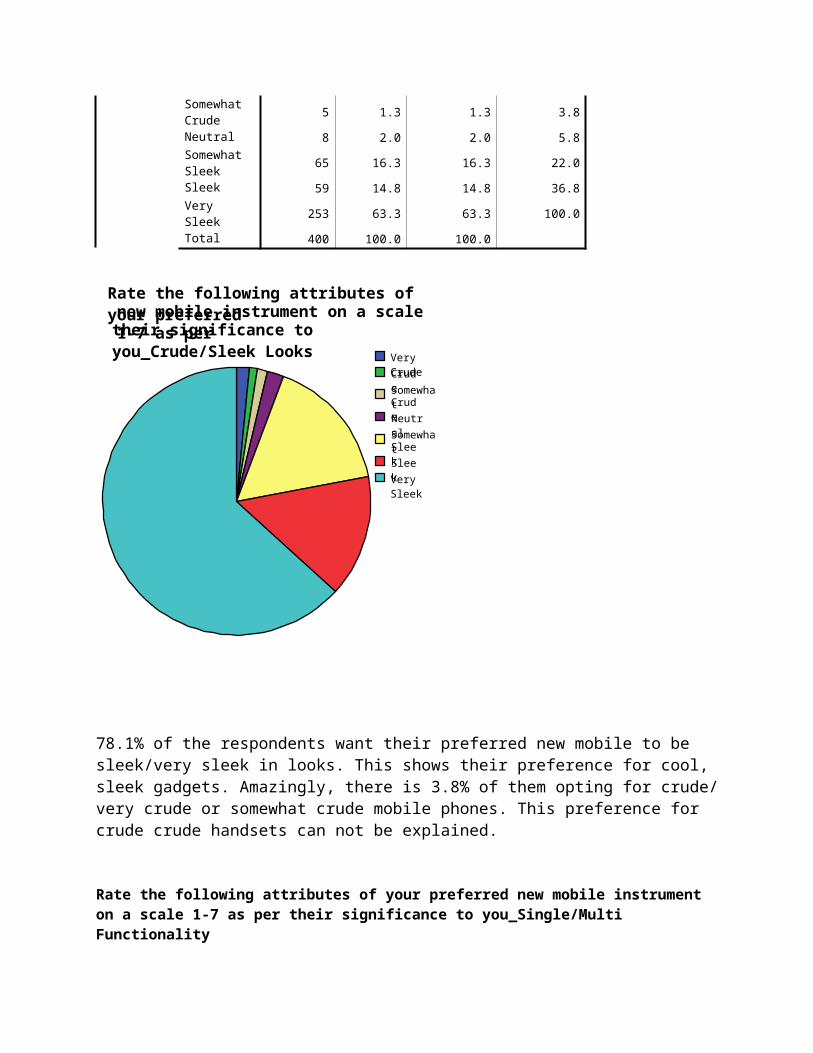
Rate the following attributes of your preferred new mobile instrument on a scale 1-7 as per their significance to you_Crude/Sleek Looks
Frequenc
y PercentValid
PercentCumulative
PercentValid Very Crude 6 1.5 1.5 1.5
Crude 4 1.0 1.0 2.5Somewhat Crude
5 1.3 1.3 3.8
Neutral 8 2.0 2.0 5.8Somewhat Sleek
65 16.3 16.3 22.0
Very Crude
Crude
Somewhat Crude
Neutral
Somewhat Sleek
Sleek
Very Sleek
Rate the following attributes of your preferred new mobile instrument on a scale 1-7 as per
their significance to you_Crude/Sleek Looks
Sleek 59 14.8 14.8 36.8Very Sleek 253 63.3 63.3 100.0Total 400 100.0 100.0
78.1% of the respondents want their preferred new mobile to be sleek/very sleek in looks. This shows their preference for cool, sleek gadgets. Amazingly, there is 3.8% of them opting for crude/ very crude or somewhat crude mobile phones. This preference for crude crude handsets can not be explained.
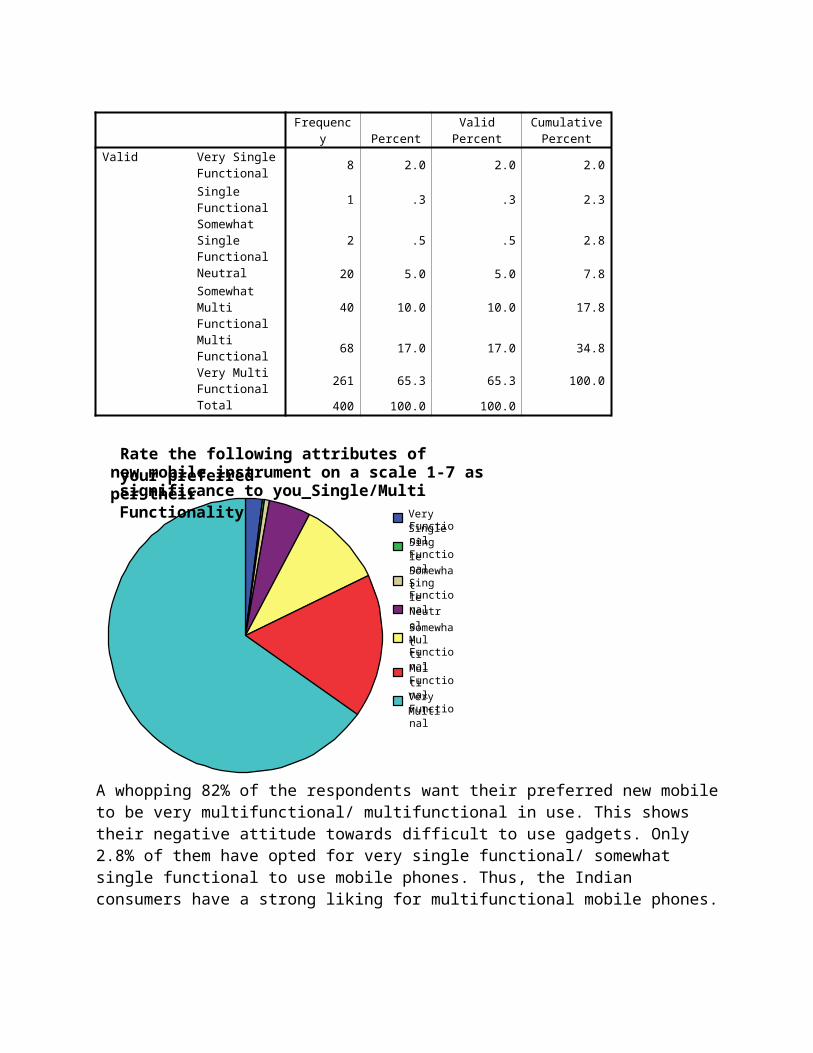
Rate the following attributes of your preferred new mobile instrument on a scale 1-7 as per their significance to you_Single/Multi Functionality
Frequenc
y PercentValid
PercentCumulative
PercentValid Very Single
Functional8 2.0 2.0 2.0
Single Functional
1 .3 .3 2.3
Somewhat Single Functional
2 .5 .5 2.8
Neutral 20 5.0 5.0 7.8
Very Single Functional
Single Functional
Somewhat Single Functional
Neutral
Somewhat Multi Functional
Multi Functional
Very Multi Functional
Rate the following attributes of your preferred new mobile instrument on a scale 1-7 as per their
significance to you_Single/Multi Functionality
Somewhat Multi Functional
40 10.0 10.0 17.8
Multi Functional
68 17.0 17.0 34.8
Very Multi Functional
261 65.3 65.3 100.0
Total 400 100.0 100.0
A whopping 82% of the respondents want their preferred new mobile to be very multifunctional/ multifunctional in use. This shows their negative attitude towards difficult to use gadgets. Only 2.8% of them have opted for very single functional/ somewhat single functional to use mobile phones. Thus, the Indian consumers have a strong liking for multifunctional mobile phones.
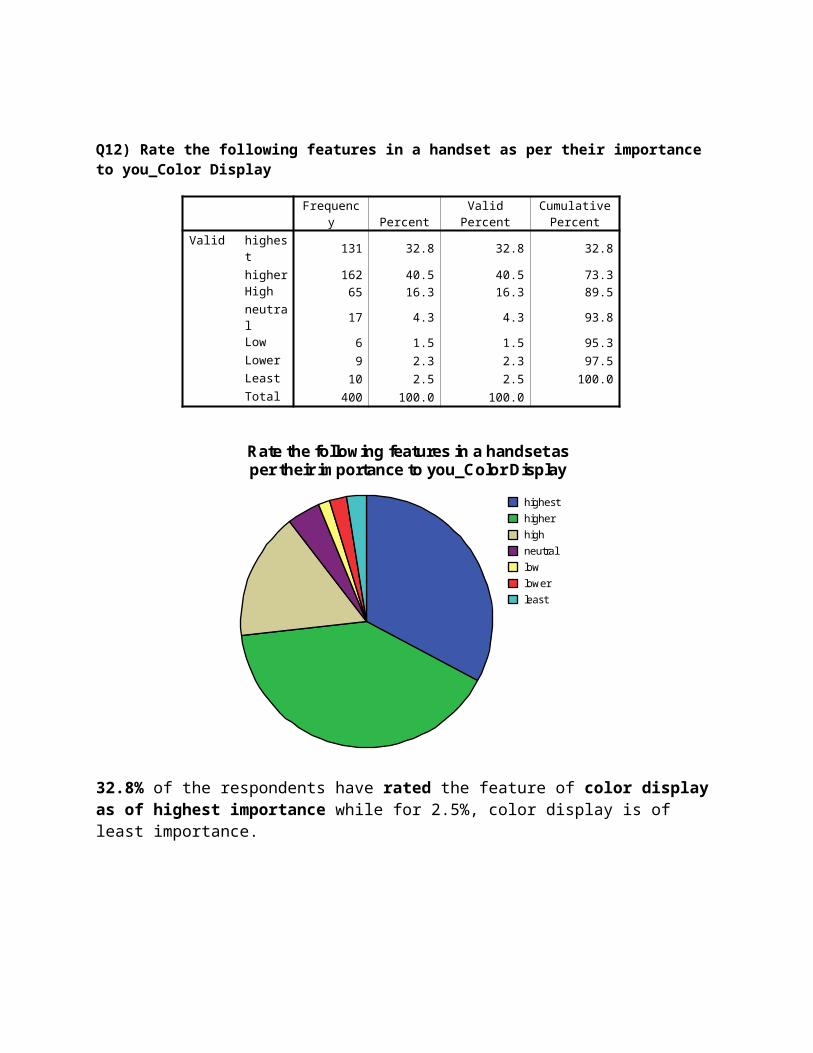
Q12) Rate the following features in a handset as per their importance to you_Color Display
Frequenc
y PercentValid
PercentCumulative
PercentValid highes
t131 32.8 32.8 32.8
higher 162 40.5 40.5 73.3High 65 16.3 16.3 89.5neutral 17 4.3 4.3 93.8Low 6 1.5 1.5 95.3
Lower 9 2.3 2.3 97.5Least 10 2.5 2.5 100.0Total 400 100.0 100.0
highest
higher
high
neutral
low
lower
least
Rate the following features in a handset as per their importance to you_Color Display
32.8% of the respondents have rated the feature of color display as of highest importance while for 2.5%, color display is of least importance.
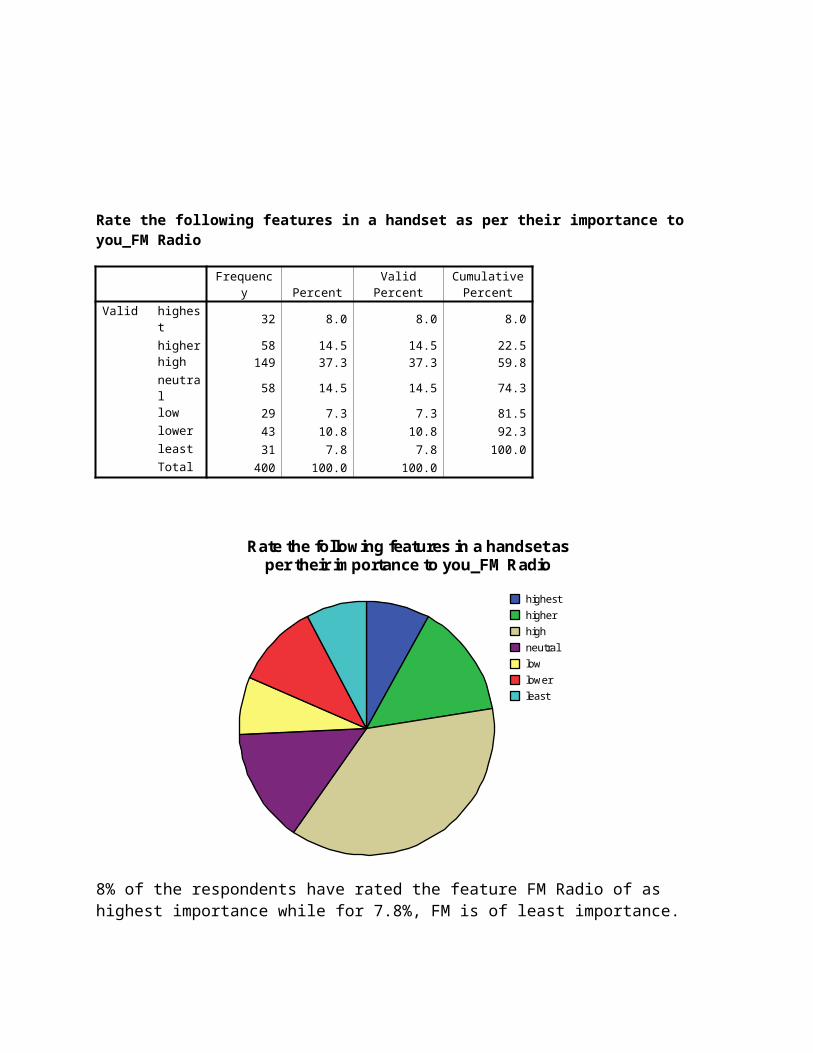
Rate the following features in a handset as per their importance to you_FM Radio
Frequenc
y PercentValid
PercentCumulative
PercentValid highes
t32 8.0 8.0 8.0
higher 58 14.5 14.5 22.5high 149 37.3 37.3 59.8neutral 58 14.5 14.5 74.3low 29 7.3 7.3 81.5lower 43 10.8 10.8 92.3
least 31 7.8 7.8 100.0Total 400 100.0 100.0
highest
higher
high
neutral
low
lower
least
Rate the following features in a handset as per their importance to you_FM Radio
8% of the respondents have rated the feature FM Radio of as highest importance while for 7.8%, FM is of least importance.
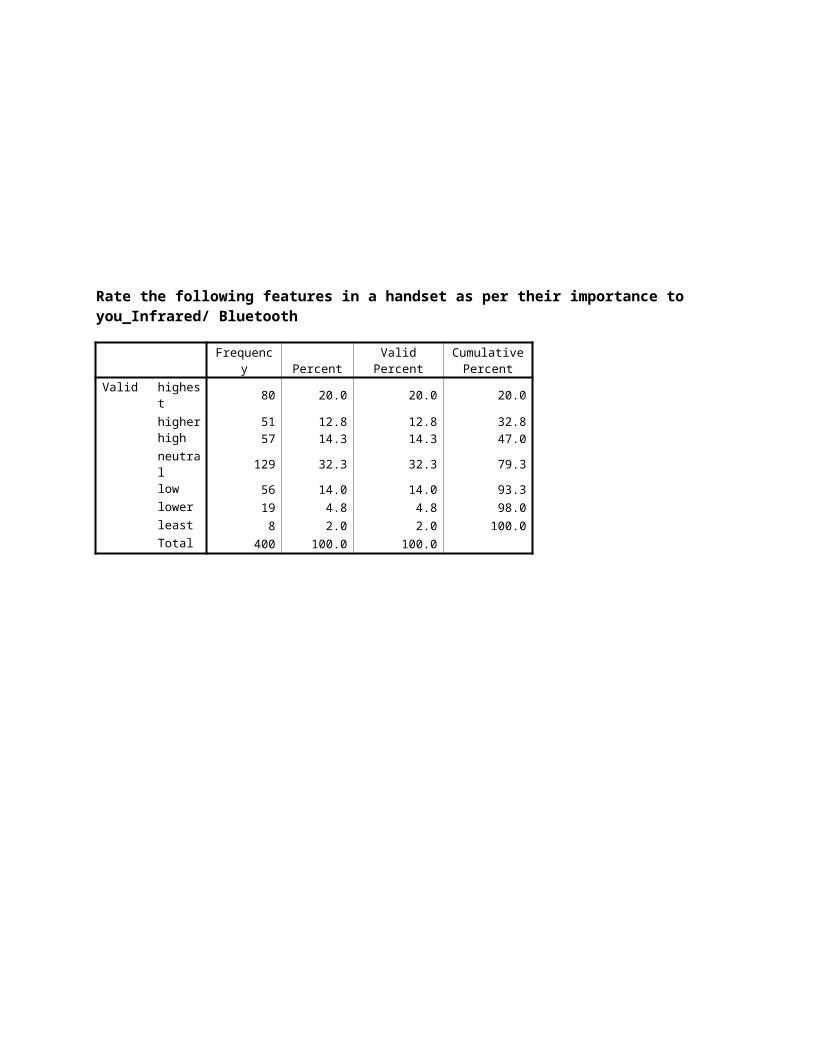
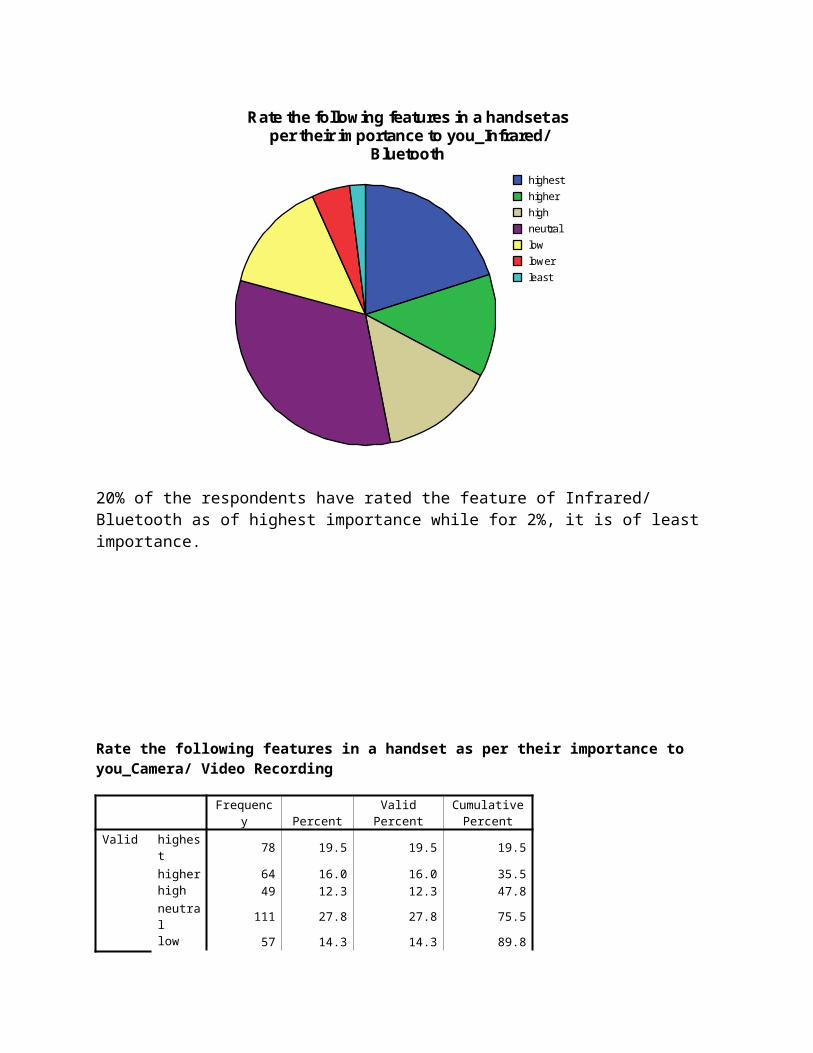
Rate the following features in a handset as per their importance to you_Infrared/ Bluetooth
Frequenc
y PercentValid
PercentCumulative
PercentValid highes
t80 20.0 20.0 20.0
higher 51 12.8 12.8 32.8high 57 14.3 14.3 47.0neutral 129 32.3 32.3 79.3low 56 14.0 14.0 93.3lower 19 4.8 4.8 98.0
least 8 2.0 2.0 100.0Total 400 100.0 100.0
highest
higher
high
neutral
low
lower
least
Rate the following features in a handset as per their importance to you_Infrared/
Bluetooth
20% of the respondents have rated the feature of Infrared/ Bluetooth as of highest importance while for 2%, it is of least importance.
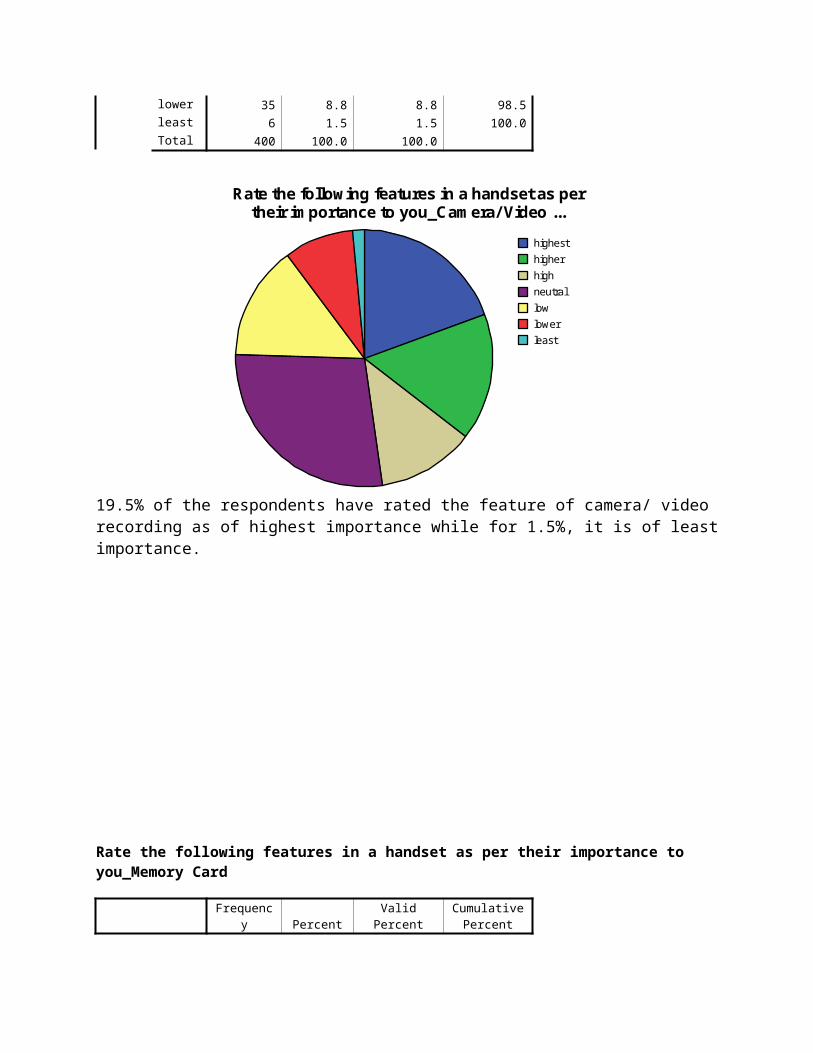
Rate the following features in a handset as per their importance to you_Camera/ Video Recording
Frequenc
y PercentValid
PercentCumulative
PercentValid highes
t78 19.5 19.5 19.5
higher 64 16.0 16.0 35.5high 49 12.3 12.3 47.8neutral 111 27.8 27.8 75.5
low 57 14.3 14.3 89.8lower 35 8.8 8.8 98.5least 6 1.5 1.5 100.0Total 400 100.0 100.0
highest
higher
high
neutral
low
lower
least
Rate the following features in a handset as per their importance to you_Camera/ Video ...
19.5% of the respondents have rated the feature of camera/ video recording as of highest importance while for 1.5%, it is of least importance.
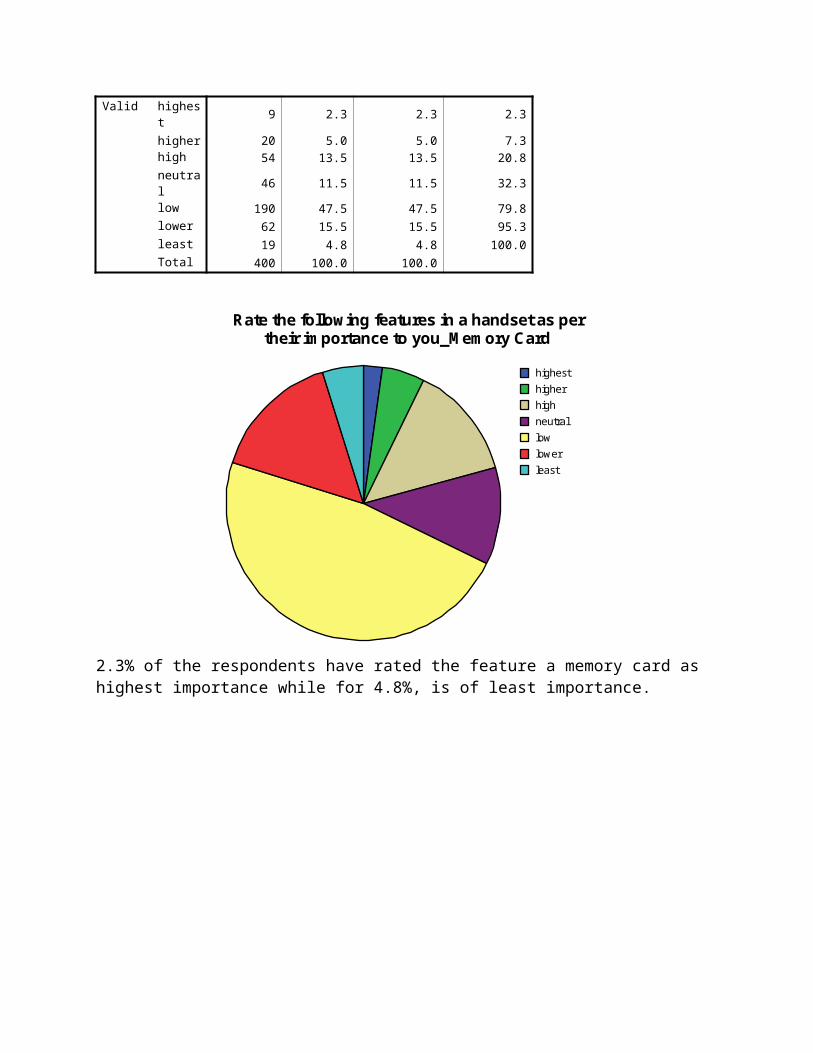
Rate the following features in a handset as per their importance to you_Memory Card
Frequenc
y PercentValid
PercentCumulative
PercentValid highes
t9 2.3 2.3 2.3
higher 20 5.0 5.0 7.3high 54 13.5 13.5 20.8neutral 46 11.5 11.5 32.3
low 190 47.5 47.5 79.8lower 62 15.5 15.5 95.3least 19 4.8 4.8 100.0Total 400 100.0 100.0
highest
higher
high
neutral
low
lower
least
Rate the following features in a handset as per their importance to you_Memory Card
2.3% of the respondents have rated the feature a memory card as highest importance while for 4.8%, is of least importance.
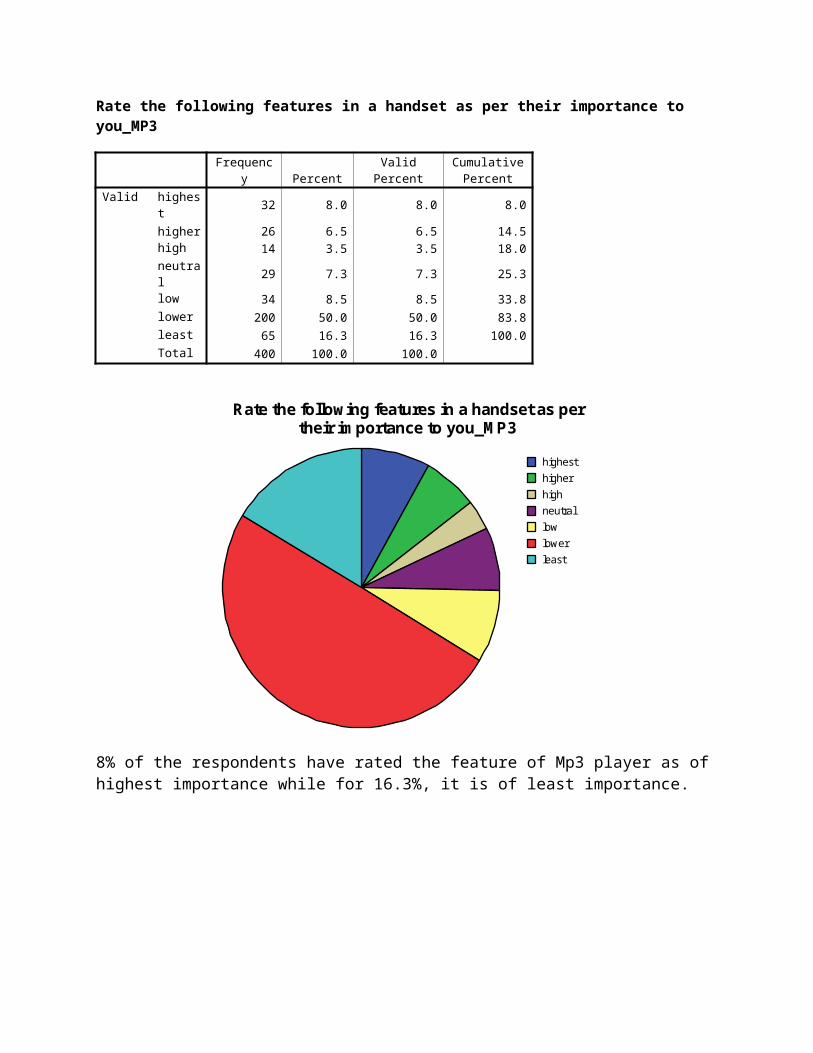
Rate the following features in a handset as per their importance to you_MP3
Frequenc
y PercentValid
PercentCumulative
PercentValid highes
t32 8.0 8.0 8.0
higher 26 6.5 6.5 14.5high 14 3.5 3.5 18.0neutral 29 7.3 7.3 25.3
low 34 8.5 8.5 33.8lower 200 50.0 50.0 83.8least 65 16.3 16.3 100.0Total 400 100.0 100.0
highest
higher
high
neutral
low
lower
least
Rate the following features in a handset as per their importance to you_MP3
8% of the respondents have rated the feature of Mp3 player as of highest importance while for 16.3%, it is of least importance.
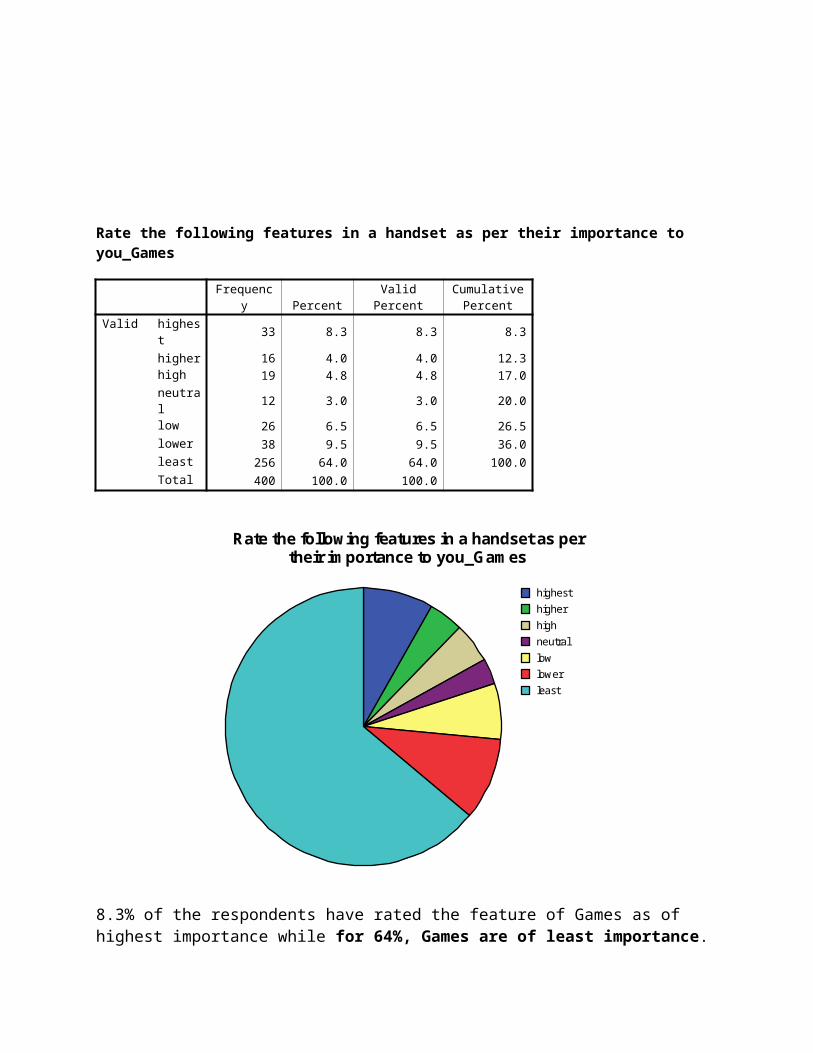
Rate the following features in a handset as per their importance to you_Games
Frequenc
y PercentValid
PercentCumulative
PercentValid highes
t33 8.3 8.3 8.3
higher 16 4.0 4.0 12.3
high 19 4.8 4.8 17.0neutral 12 3.0 3.0 20.0low 26 6.5 6.5 26.5lower 38 9.5 9.5 36.0least 256 64.0 64.0 100.0Total 400 100.0 100.0
highest
higher
high
neutral
low
lower
least
Rate the following features in a handset as per their importance to you_Games
8.3% of the respondents have rated the feature of Games as of highest importance while for 64%, Games are of least importance.
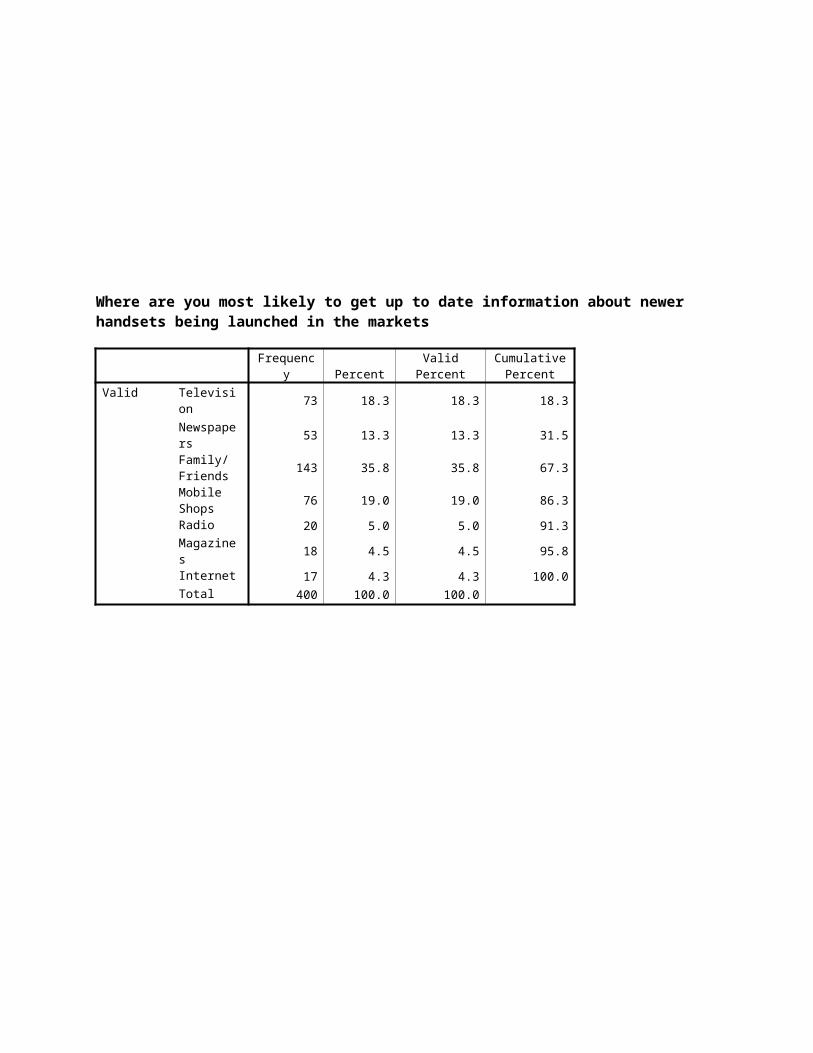
Where are you most likely to get up to date information about newer handsets being launched in the markets
Frequenc
y PercentValid
PercentCumulative
PercentValid Television 73 18.3 18.3 18.3
Newspapers
53 13.3 13.3 31.5
Family/ Friends
143 35.8 35.8 67.3
Mobile Shops
76 19.0 19.0 86.3
Radio 20 5.0 5.0 91.3Magazines 18 4.5 4.5 95.8Internet 17 4.3 4.3 100.0Total 400 100.0 100.0
Television
Newspapers
Family/ Friends
Mobile Shops
Radio
Magazines
Internet
Where are you most likely to get up to date information about newer handsets being
launched in the markets
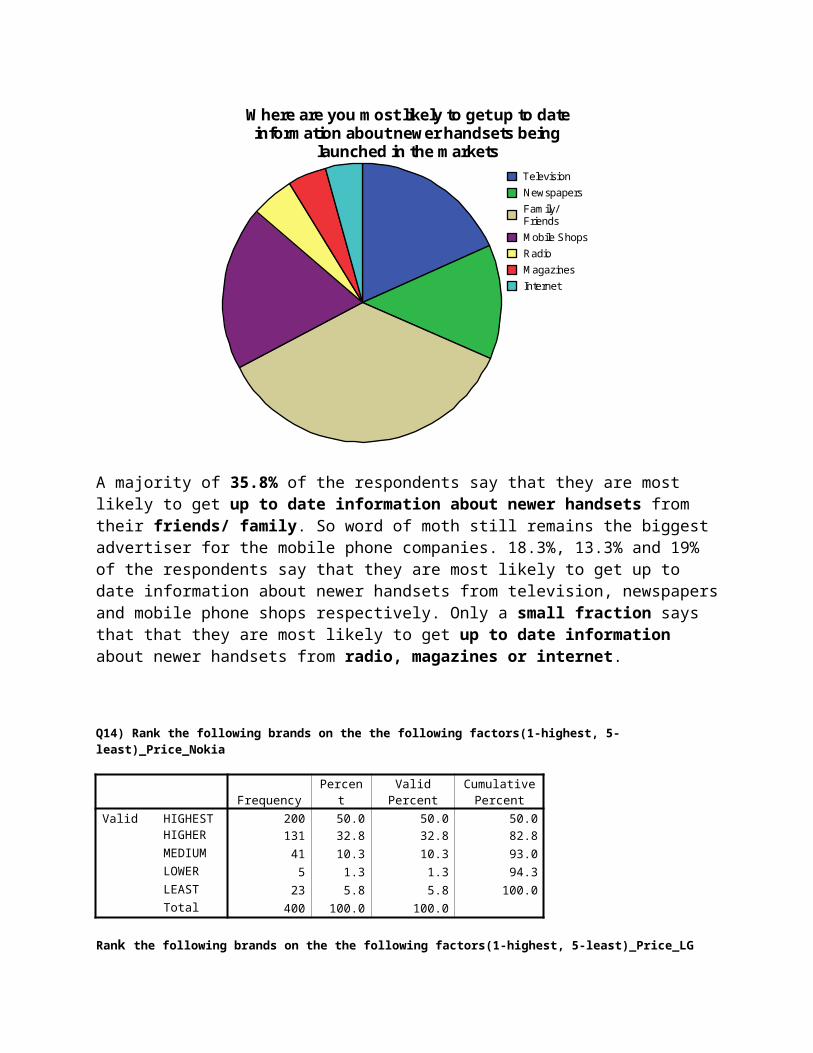
A majority of 35.8% of the respondents say that they are most likely to get up to date information about newer handsets from their friends/ family. So word of moth still remains the biggest advertiser for the mobile phone companies. 18.3%, 13.3% and 19% of the respondents say that they are most likely to get up to date information about newer handsets from television, newspapers and mobile phone shops respectively. Only a small fraction says that that they are most likely to get up to date information about newer handsets from radio, magazines or internet.
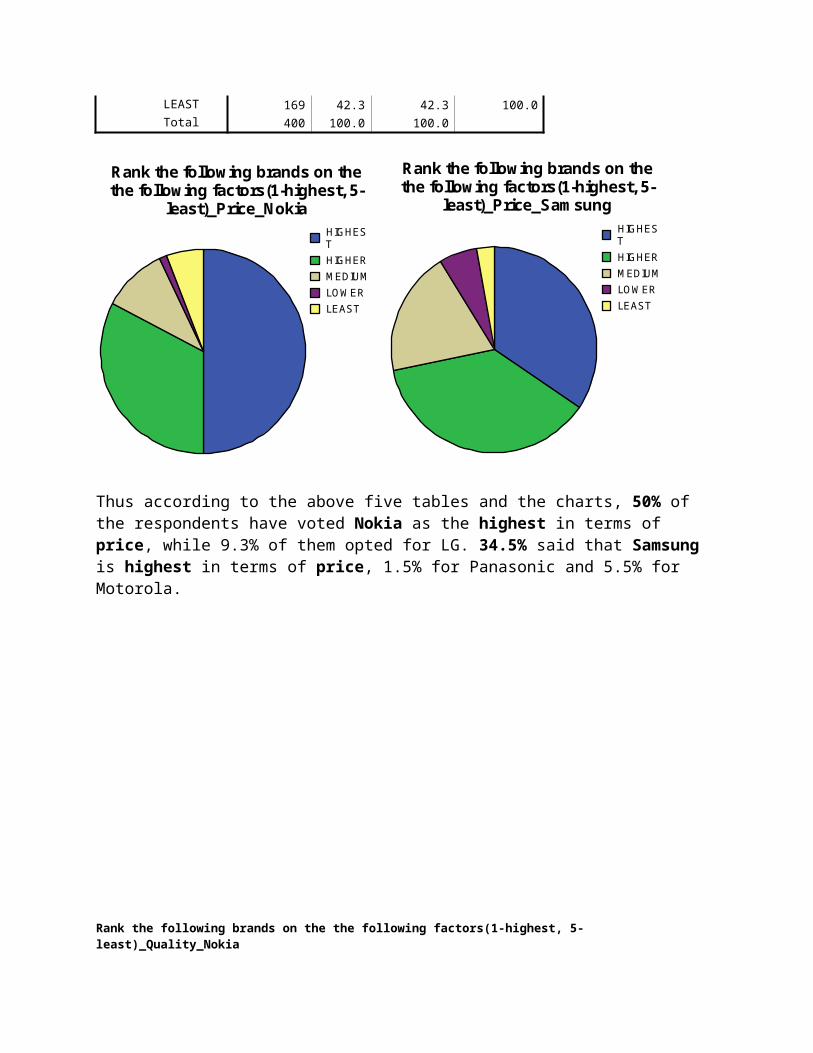
Q14) Rank the following brands on the the following factors(1-highest, 5-least)_Price_Nokia
Frequency PercentValid
PercentCumulative
PercentValid HIGHEST 200 50.0 50.0 50.0 HIGHER 131 32.8 32.8 82.8 MEDIUM 41 10.3 10.3 93.0
LOWER 5 1.3 1.3 94.3 LEAST 23 5.8 5.8 100.0 Total 400 100.0 100.0
Rank the following brands on the the following factors(1-highest, 5-least)_Price_LG
Frequency PercentValid
PercentCumulative
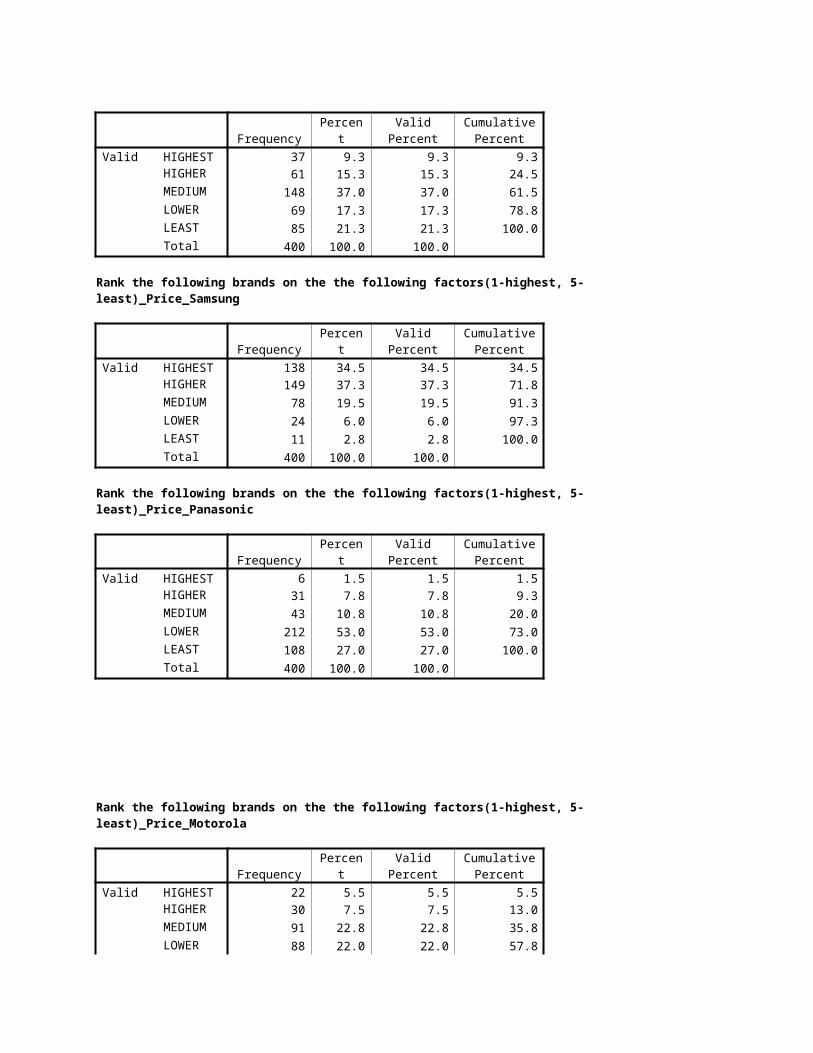
PercentValid HIGHEST 37 9.3 9.3 9.3 HIGHER 61 15.3 15.3 24.5 MEDIUM 148 37.0 37.0 61.5 LOWER 69 17.3 17.3 78.8 LEAST 85 21.3 21.3 100.0 Total 400 100.0 100.0
Rank the following brands on the the following factors(1-highest, 5-least)_Price_Samsung
Frequency PercentValid
PercentCumulative
PercentValid HIGHEST 138 34.5 34.5 34.5 HIGHER 149 37.3 37.3 71.8 MEDIUM 78 19.5 19.5 91.3 LOWER 24 6.0 6.0 97.3 LEAST 11 2.8 2.8 100.0 Total 400 100.0 100.0
Rank the following brands on the the following factors(1-highest, 5-least)_Price_Panasonic
Frequency PercentValid
PercentCumulative
PercentValid HIGHEST 6 1.5 1.5 1.5 HIGHER 31 7.8 7.8 9.3 MEDIUM 43 10.8 10.8 20.0 LOWER 212 53.0 53.0 73.0 LEAST 108 27.0 27.0 100.0 Total 400 100.0 100.0
Rank the following brands on the the following factors(1-highest, 5-least)_Price_Motorola
Frequency PercentValid
PercentCumulative
PercentValid HIGHEST 22 5.5 5.5 5.5 HIGHER 30 7.5 7.5 13.0 MEDIUM 91 22.8 22.8 35.8 LOWER 88 22.0 22.0 57.8
LEAST 169 42.3 42.3 100.0 Total 400 100.0 100.0
HIGHEST
HIGHER
MEDIUM
LOWER
LEAST
Rank the following brands on the the following factors(1-highest, 5-
least)_Price_Nokia
HIGHEST
HIGHER
MEDIUM
LOWER
LEAST
Rank the following brands on the the following factors(1-highest, 5-
least)_Price_Samsung
Thus according to the above five tables and the charts, 50% of the respondents have voted Nokia as the highest in terms of price, while 9.3% of them opted for LG. 34.5% said that Samsung is highest in terms of price, 1.5% for Panasonic and 5.5% for Motorola.
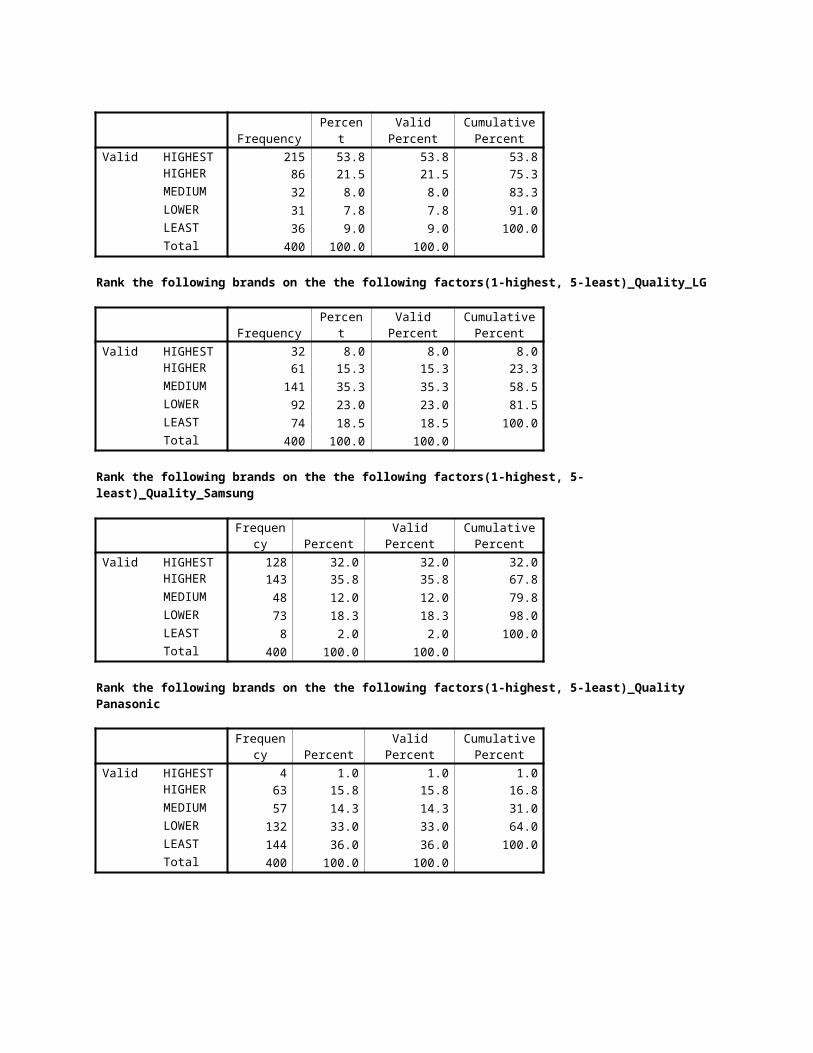
Rank the following brands on the the following factors(1-highest, 5-least)_Quality_Nokia
Frequency PercentValid
PercentCumulative
PercentValid HIGHEST 215 53.8 53.8 53.8 HIGHER 86 21.5 21.5 75.3 MEDIUM 32 8.0 8.0 83.3
LOWER 31 7.8 7.8 91.0 LEAST 36 9.0 9.0 100.0 Total 400 100.0 100.0
Rank the following brands on the the following factors(1-highest, 5-least)_Quality_LG
Frequency PercentValid
PercentCumulative
PercentValid HIGHEST 32 8.0 8.0 8.0 HIGHER 61 15.3 15.3 23.3 MEDIUM 141 35.3 35.3 58.5 LOWER 92 23.0 23.0 81.5 LEAST 74 18.5 18.5 100.0 Total 400 100.0 100.0
Rank the following brands on the the following factors(1-highest, 5-least)_Quality_Samsung
Frequen
cy PercentValid
PercentCumulative
PercentValid HIGHEST 128 32.0 32.0 32.0 HIGHER 143 35.8 35.8 67.8 MEDIUM 48 12.0 12.0 79.8 LOWER 73 18.3 18.3 98.0 LEAST 8 2.0 2.0 100.0 Total 400 100.0 100.0
Rank the following brands on the the following factors(1-highest, 5-least)_Quality Panasonic
Frequen
cy PercentValid
PercentCumulative
PercentValid HIGHEST 4 1.0 1.0 1.0 HIGHER 63 15.8 15.8 16.8 MEDIUM 57 14.3 14.3 31.0 LOWER 132 33.0 33.0 64.0 LEAST 144 36.0 36.0 100.0 Total 400 100.0 100.0
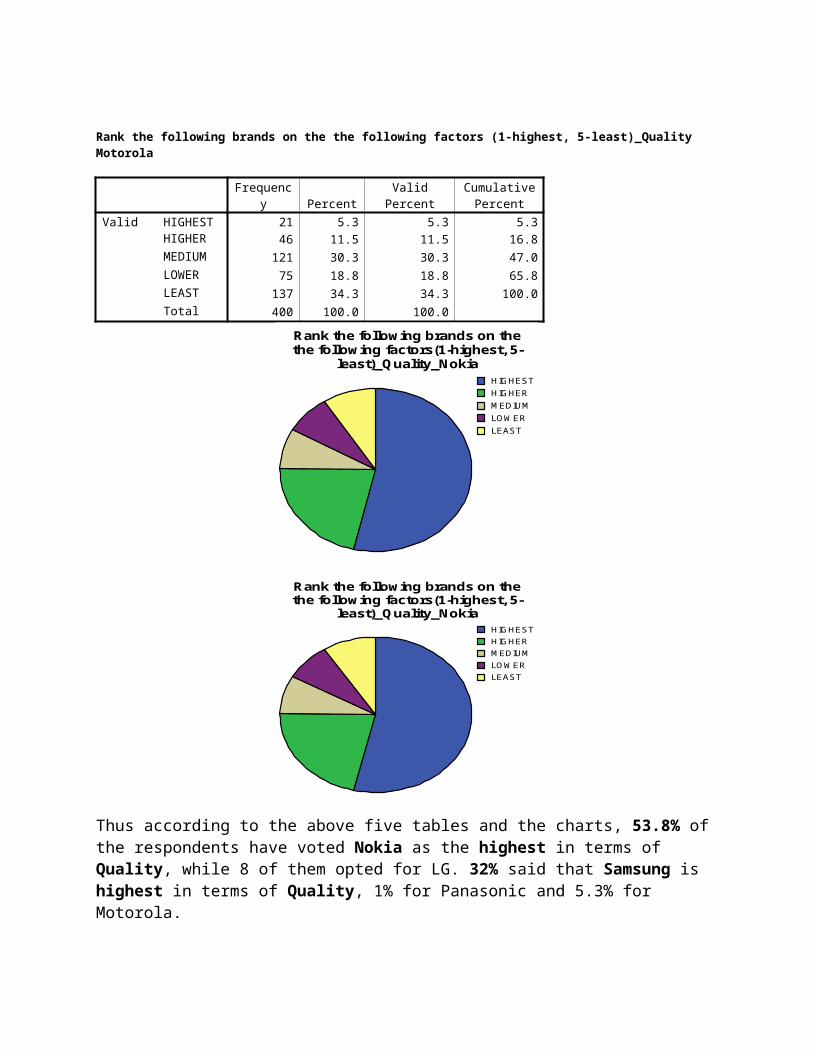
Rank the following brands on the the following factors (1-highest, 5-least)_Quality Motorola
Frequenc
y PercentValid
PercentCumulative
PercentValid HIGHEST 21 5.3 5.3 5.3 HIGHER 46 11.5 11.5 16.8 MEDIUM 121 30.3 30.3 47.0
LOWER 75 18.8 18.8 65.8 LEAST 137 34.3 34.3 100.0 Total 400 100.0 100.0
HIGHEST
HIGHER
MEDIUM
LOWER
LEAST
Rank the following brands on the the following factors(1-highest, 5-
least)_Quality_Nokia
HIGHEST
HIGHER
MEDIUM
LOWER
LEAST
Rank the following brands on the the following factors(1-highest, 5-
least)_Quality_Nokia
Thus according to the above five tables and the charts, 53.8% of the respondents have voted Nokia as the highest in terms of Quality, while 8 of them opted for LG. 32% said that Samsung is highest in terms of Quality, 1% for Panasonic and 5.3% for Motorola.
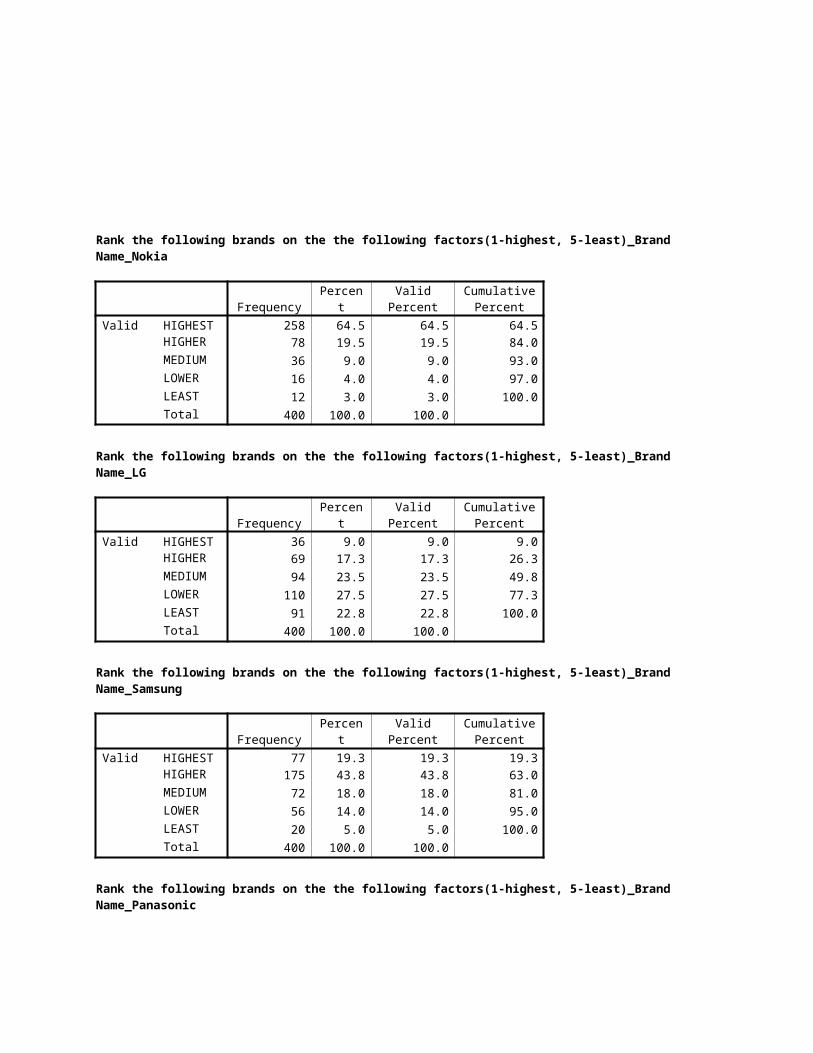
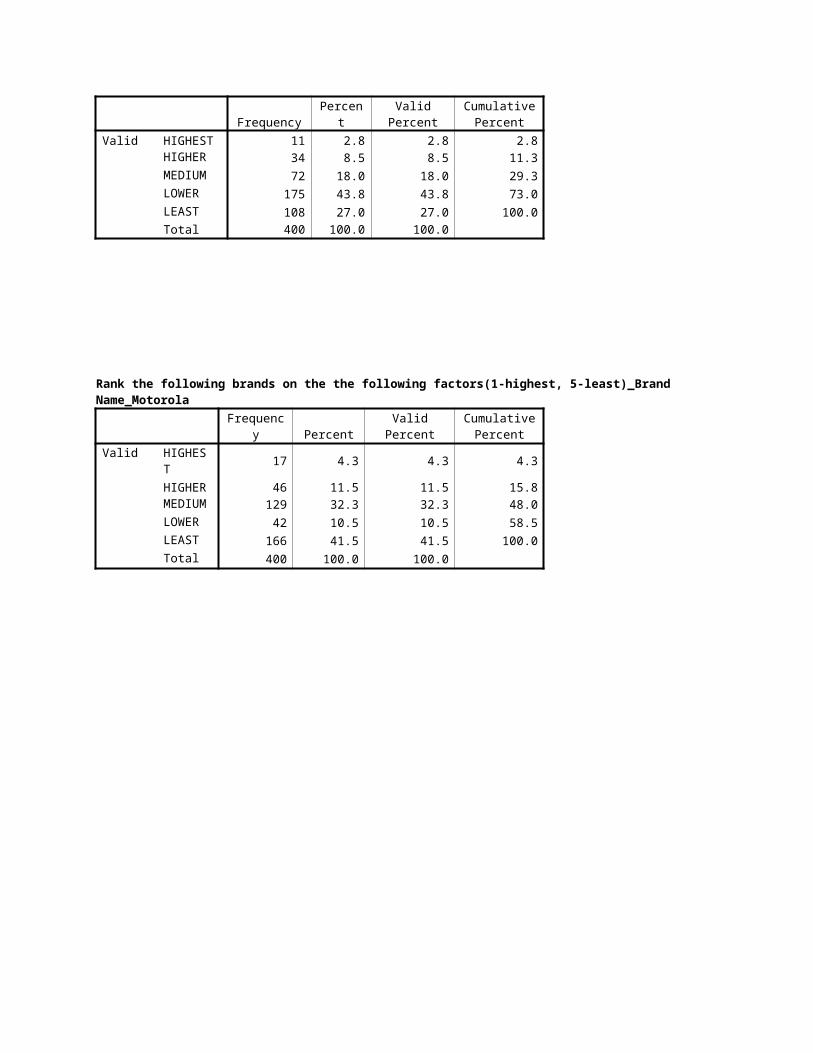
Rank the following brands on the the following factors(1-highest, 5-least)_Brand Name_Nokia
Frequency PercentValid
PercentCumulative
PercentValid HIGHEST 258 64.5 64.5 64.5
HIGHER 78 19.5 19.5 84.0 MEDIUM 36 9.0 9.0 93.0 LOWER 16 4.0 4.0 97.0 LEAST 12 3.0 3.0 100.0 Total 400 100.0 100.0
Rank the following brands on the the following factors(1-highest, 5-least)_Brand Name_LG
Frequency PercentValid
PercentCumulative
PercentValid HIGHEST 36 9.0 9.0 9.0 HIGHER 69 17.3 17.3 26.3 MEDIUM 94 23.5 23.5 49.8 LOWER 110 27.5 27.5 77.3 LEAST 91 22.8 22.8 100.0 Total 400 100.0 100.0
Rank the following brands on the the following factors(1-highest, 5-least)_Brand Name_Samsung
Frequency PercentValid
PercentCumulative
PercentValid HIGHEST 77 19.3 19.3 19.3 HIGHER 175 43.8 43.8 63.0 MEDIUM 72 18.0 18.0 81.0 LOWER 56 14.0 14.0 95.0 LEAST 20 5.0 5.0 100.0 Total 400 100.0 100.0
Rank the following brands on the the following factors(1-highest, 5-least)_Brand Name_Panasonic
Frequency PercentValid
PercentCumulative
PercentValid HIGHEST 11 2.8 2.8 2.8 HIGHER 34 8.5 8.5 11.3 MEDIUM 72 18.0 18.0 29.3 LOWER 175 43.8 43.8 73.0 LEAST 108 27.0 27.0 100.0 Total 400 100.0 100.0
Rank the following brands on the the following factors(1-highest, 5-least)_Brand Name_Motorola
Frequenc
y PercentValid
PercentCumulative
PercentValid HIGHES
T17 4.3 4.3 4.3
HIGHER 46 11.5 11.5 15.8MEDIUM
129 32.3 32.3 48.0
LOWER 42 10.5 10.5 58.5LEAST 166 41.5 41.5 100.0Total 400 100.0 100.0
HIGHEST
HIGHER
MEDIUM
LOWER
LEAST
Rank the following brands on the the following factors(1-highest, 5-least)
_Brand Name_Nokia
HIGHEST
HIGHER
MEDIUM
LOWER
LEAST
Rank the following brands on the the following factors(1-highest, 5-least)_Brand
Name_Samsung
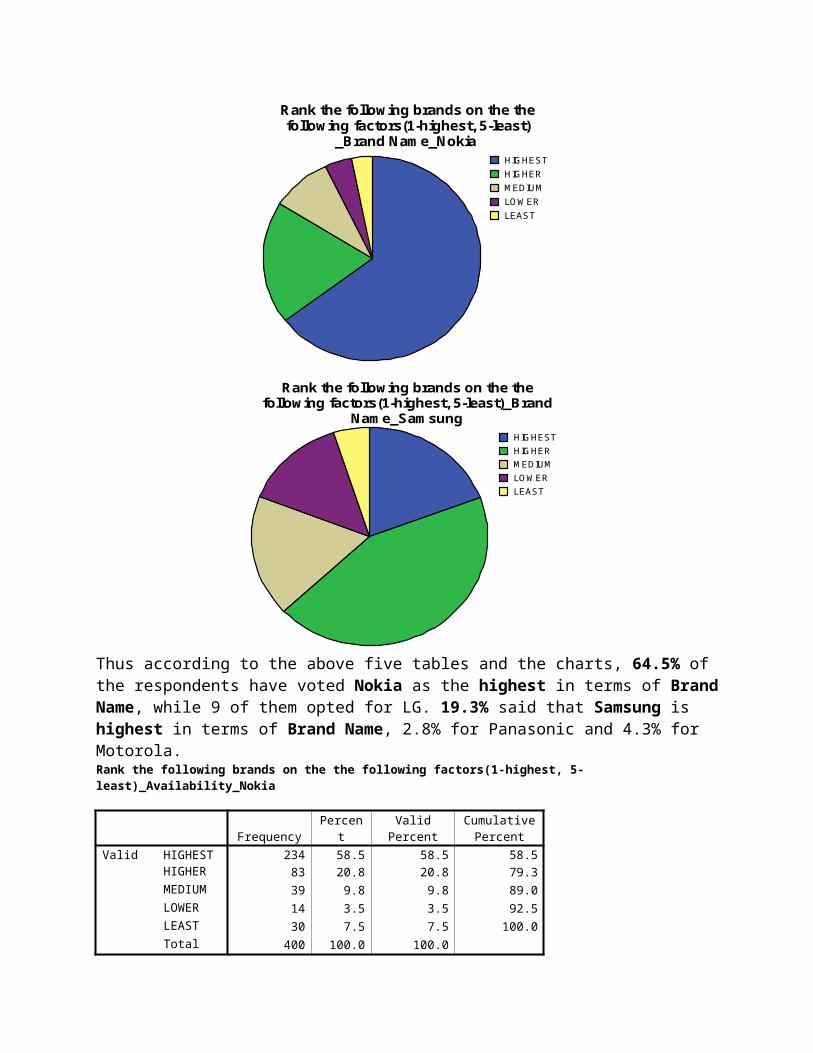
Thus according to the above five tables and the charts, 64.5% of the respondents have voted Nokia as the highest in terms of Brand Name, while 9 of them opted for LG. 19.3% said that Samsung is highest in terms of Brand Name, 2.8% for Panasonic and 4.3% for Motorola.Rank the following brands on the the following factors(1-highest, 5-least)_Availability_Nokia
Frequency PercentValid
PercentCumulative
PercentValid HIGHEST 234 58.5 58.5 58.5 HIGHER 83 20.8 20.8 79.3 MEDIUM 39 9.8 9.8 89.0 LOWER 14 3.5 3.5 92.5 LEAST 30 7.5 7.5 100.0 Total 400 100.0 100.0
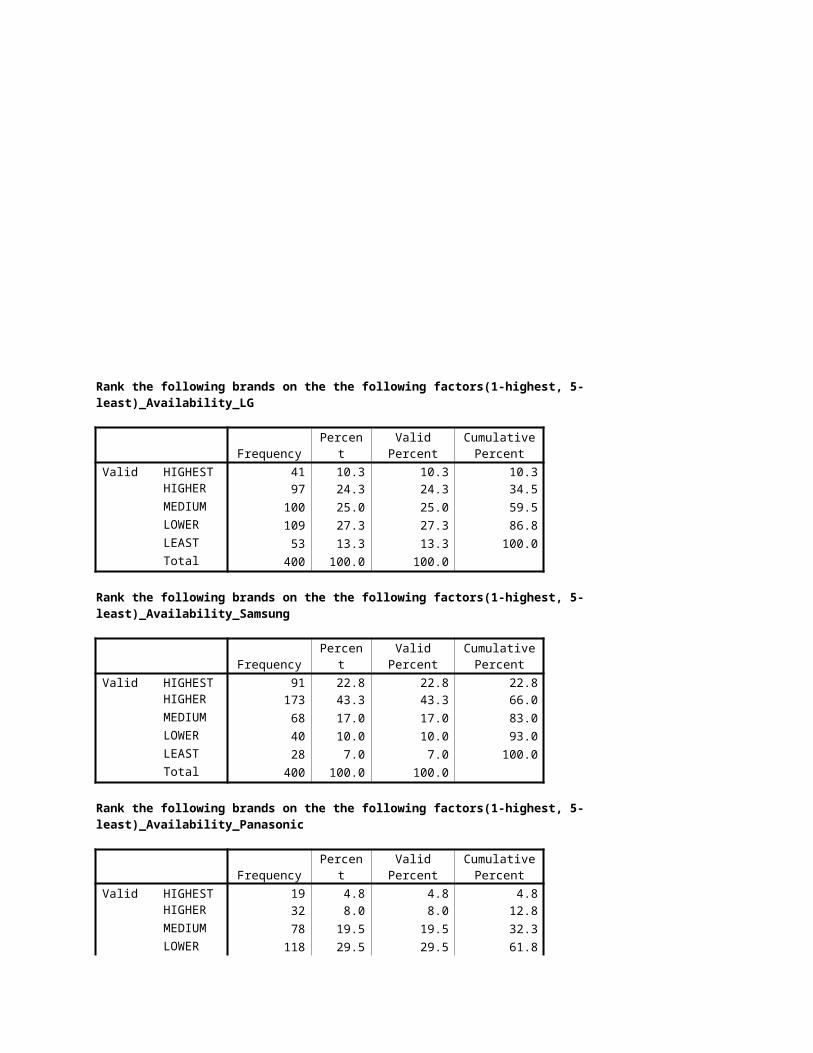
Rank the following brands on the the following factors(1-highest, 5-least)_Availability_LG
Frequency PercentValid
PercentCumulative
PercentValid HIGHEST 41 10.3 10.3 10.3 HIGHER 97 24.3 24.3 34.5 MEDIUM 100 25.0 25.0 59.5 LOWER 109 27.3 27.3 86.8 LEAST 53 13.3 13.3 100.0 Total 400 100.0 100.0
Rank the following brands on the the following factors(1-highest, 5-least)_Availability_Samsung
Frequency PercentValid
PercentCumulative
PercentValid HIGHEST 91 22.8 22.8 22.8 HIGHER 173 43.3 43.3 66.0 MEDIUM 68 17.0 17.0 83.0 LOWER 40 10.0 10.0 93.0 LEAST 28 7.0 7.0 100.0 Total 400 100.0 100.0
Rank the following brands on the the following factors(1-highest, 5-least)_Availability_Panasonic
Frequency PercentValid
PercentCumulative
Percent
Valid HIGHEST 19 4.8 4.8 4.8 HIGHER 32 8.0 8.0 12.8 MEDIUM 78 19.5 19.5 32.3 LOWER 118 29.5 29.5 61.8 LEAST 153 38.3 38.3 100.0 Total 400 100.0 100.0
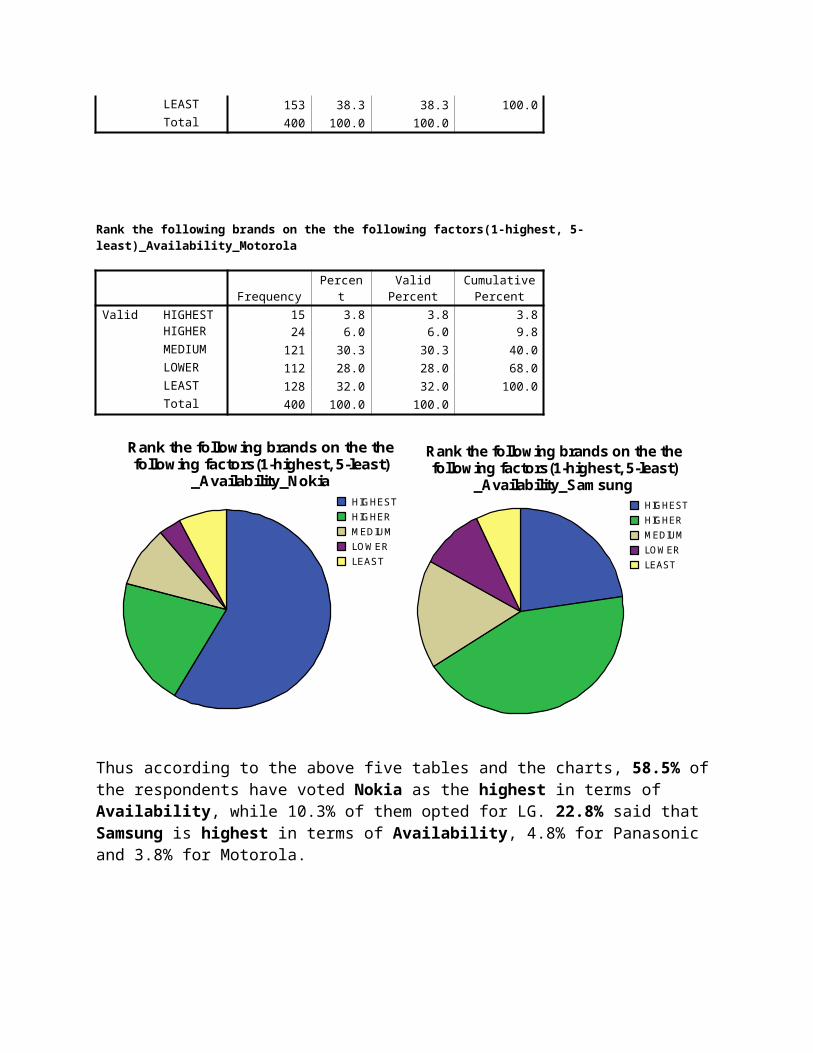
Rank the following brands on the the following factors(1-highest, 5-least)_Availability_Motorola
Frequency PercentValid
PercentCumulative
PercentValid HIGHEST 15 3.8 3.8 3.8 HIGHER 24 6.0 6.0 9.8 MEDIUM 121 30.3 30.3 40.0 LOWER 112 28.0 28.0 68.0 LEAST 128 32.0 32.0 100.0 Total 400 100.0 100.0
HIGHEST
HIGHER
MEDIUM
LOWER
LEAST
Rank the following brands on the the following factors(1-highest, 5-least)
_Availability_Nokia
HIGHEST
HIGHER
MEDIUM
LOWER
LEAST
Rank the following brands on the the following factors(1-highest, 5-least)
_Availability_Samsung
Thus according to the above five tables and the charts, 58.5% of the respondents have voted Nokia as the highest in terms of Availability, while 10.3% of them opted for LG. 22.8% said that Samsung is highest in terms of Availability, 4.8% for Panasonic and 3.8% for Motorola.
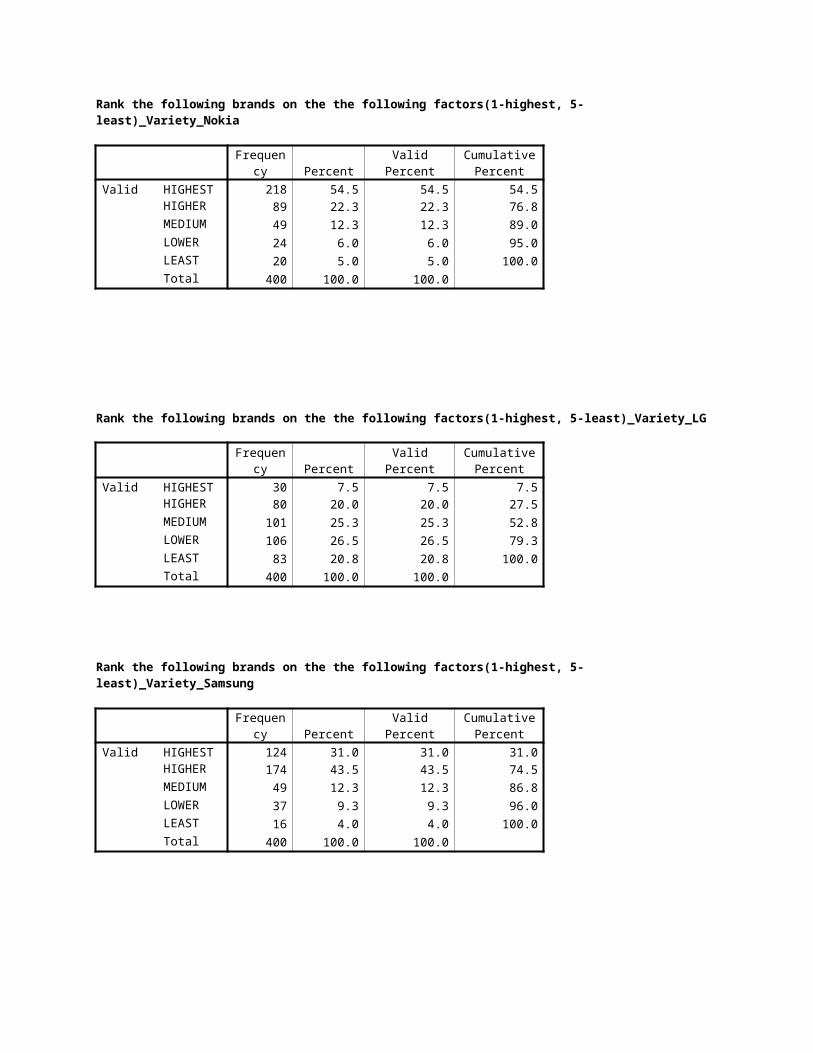
Rank the following brands on the the following factors(1-highest, 5-least)_Variety_Nokia
Frequen
cy PercentValid
PercentCumulative
PercentValid HIGHEST 218 54.5 54.5 54.5 HIGHER 89 22.3 22.3 76.8 MEDIUM 49 12.3 12.3 89.0 LOWER 24 6.0 6.0 95.0 LEAST 20 5.0 5.0 100.0 Total 400 100.0 100.0
Rank the following brands on the the following factors(1-highest, 5-least)_Variety_LG
Frequen
cy PercentValid
PercentCumulative
PercentValid HIGHEST 30 7.5 7.5 7.5 HIGHER 80 20.0 20.0 27.5 MEDIUM 101 25.3 25.3 52.8 LOWER 106 26.5 26.5 79.3 LEAST 83 20.8 20.8 100.0 Total 400 100.0 100.0
Rank the following brands on the the following factors(1-highest, 5-least)_Variety_Samsung
Frequen
cy PercentValid
PercentCumulative
PercentValid HIGHEST 124 31.0 31.0 31.0 HIGHER 174 43.5 43.5 74.5 MEDIUM 49 12.3 12.3 86.8 LOWER 37 9.3 9.3 96.0 LEAST 16 4.0 4.0 100.0 Total 400 100.0 100.0
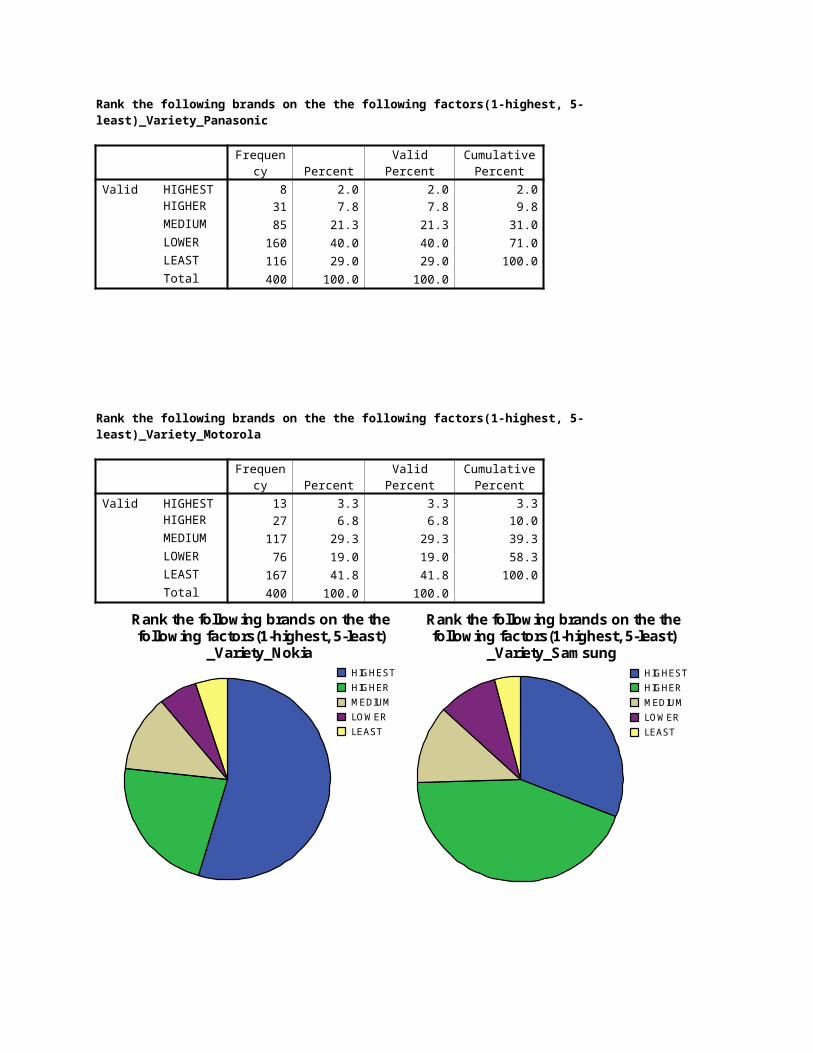
Rank the following brands on the the following factors(1-highest, 5-least)_Variety_Panasonic
Frequen
cy PercentValid
PercentCumulative
PercentValid HIGHEST 8 2.0 2.0 2.0 HIGHER 31 7.8 7.8 9.8 MEDIUM 85 21.3 21.3 31.0 LOWER 160 40.0 40.0 71.0 LEAST 116 29.0 29.0 100.0 Total 400 100.0 100.0
Rank the following brands on the the following factors(1-highest, 5-least)_Variety_Motorola
Frequen
cy PercentValid
PercentCumulative
PercentValid HIGHEST 13 3.3 3.3 3.3 HIGHER 27 6.8 6.8 10.0 MEDIUM 117 29.3 29.3 39.3 LOWER 76 19.0 19.0 58.3 LEAST 167 41.8 41.8 100.0 Total 400 100.0 100.0
HIGHEST
HIGHER
MEDIUM
LOWER
LEAST
Rank the following brands on the the following factors(1-highest, 5-least)
_Variety_Nokia
HIGHEST
HIGHER
MEDIUM
LOWER
LEAST
Rank the following brands on the the following factors(1-highest, 5-least)
_Variety_Samsung
Thus according to the above five tables and the charts, 54.5% of the respondents have voted Nokia as the highest in terms of Variety, while 7.5% of them opted for LG. 31.0% said that Samsung is highest in terms of Variety, 2.0% for Panasonic and 3.3% for Motorola.
Very Similar
Somewhat Similar
Similar
Neutral
Different
Somewhat Different
Very Different
Please rate the following pairs of mobilephones as to how similar they are_NOKIA-LG
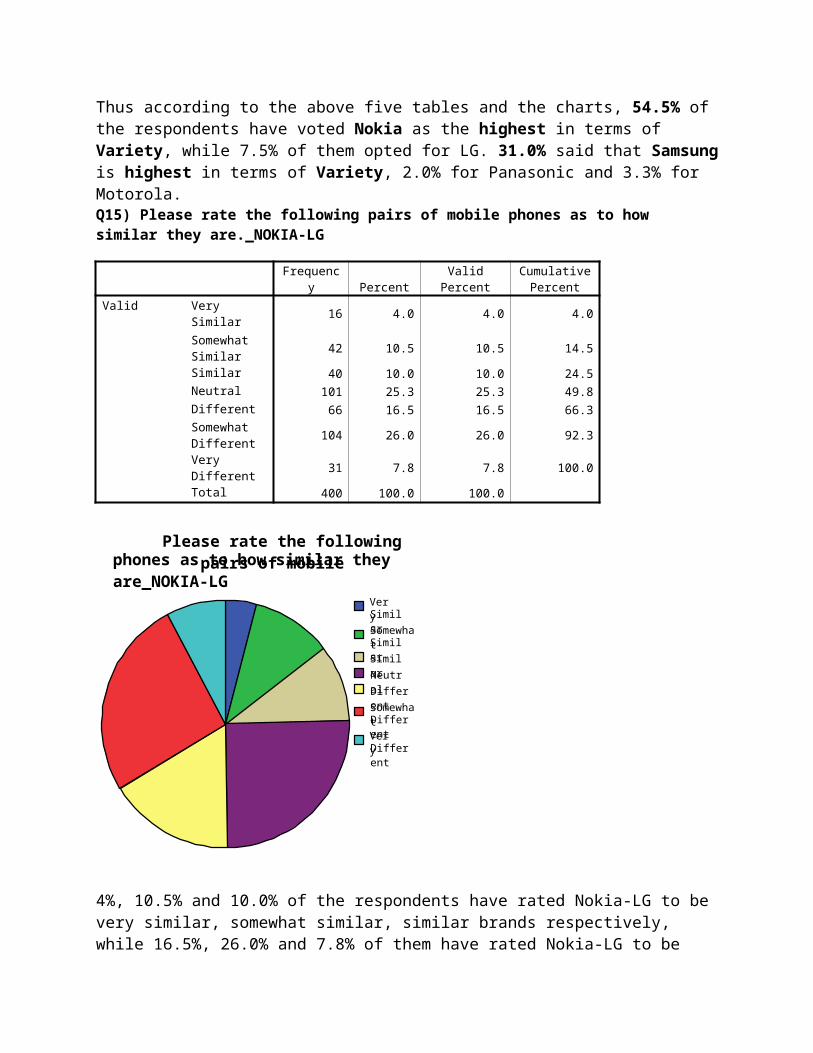
Q15) Please rate the following pairs of mobile phones as to how similar they are._NOKIA-LG
Frequenc
y PercentValid
PercentCumulative
PercentValid Very Similar 16 4.0 4.0 4.0
Somewhat Similar
42 10.5 10.5 14.5
Similar 40 10.0 10.0 24.5Neutral 101 25.3 25.3 49.8Different 66 16.5 16.5 66.3Somewhat Different
104 26.0 26.0 92.3
Very Different
31 7.8 7.8 100.0
Total 400 100.0 100.0
4%, 10.5% and 10.0% of the respondents have rated Nokia-LG to be very similar, somewhat similar, similar brands respectively, while 16.5%, 26.0% and 7.8% of them have rated Nokia-LG to be different, somewhat different, very different brands respectively.
Very Similar
Somewhat Similar
Similar
Neutral
Different
Somewhat Different
Very Different
Please rate the following pairs of mobile phones as to how similar they are_Nokia-Motorola
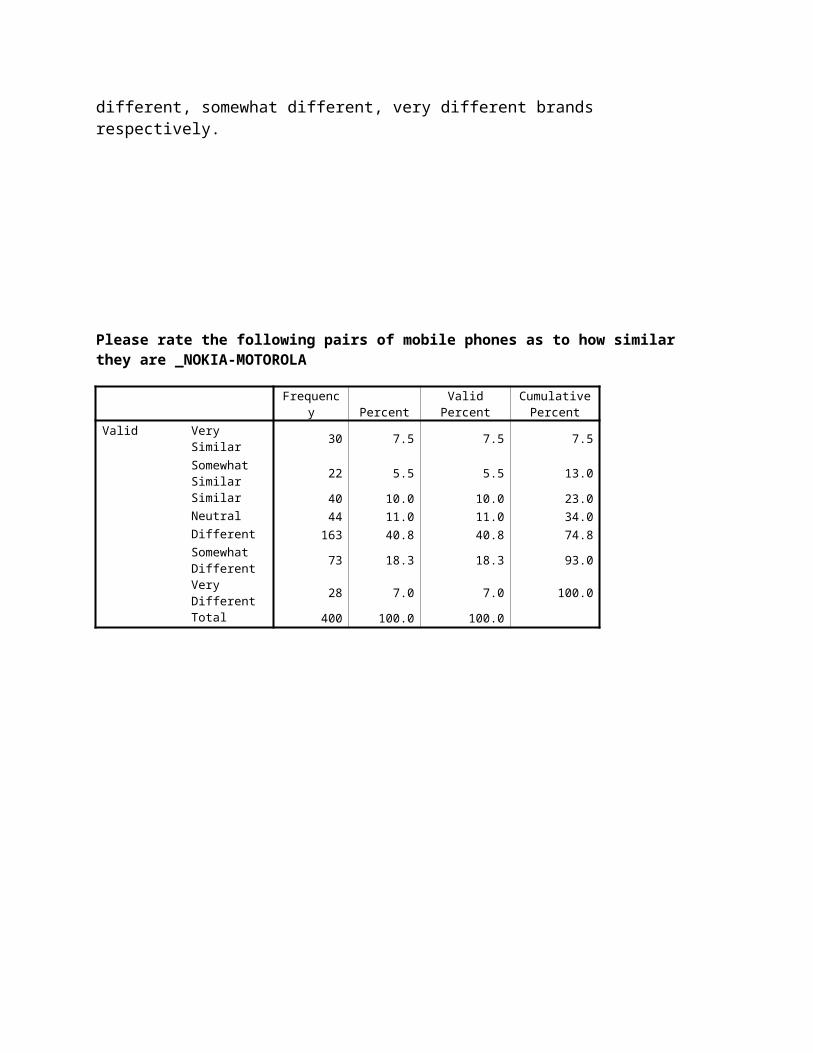
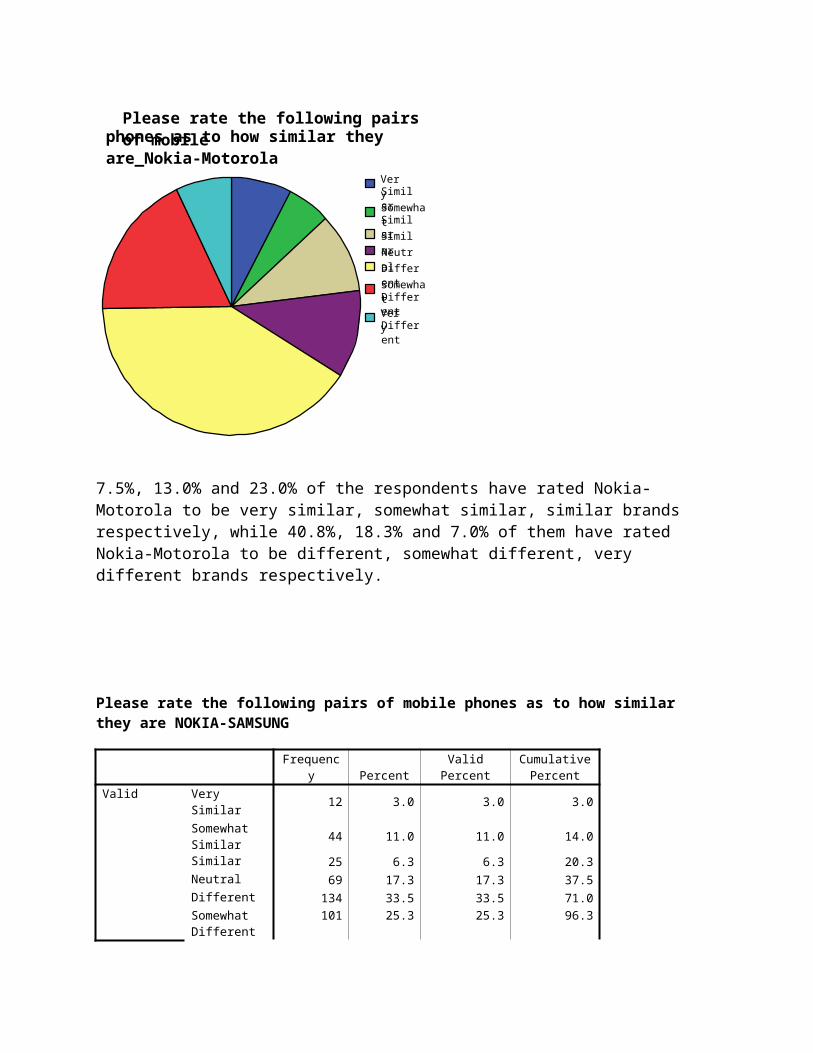
Please rate the following pairs of mobile phones as to how similar they are _NOKIA-MOTOROLA
Frequenc
y PercentValid
PercentCumulative
PercentValid Very Similar 30 7.5 7.5 7.5
Somewhat Similar
22 5.5 5.5 13.0
Similar 40 10.0 10.0 23.0Neutral 44 11.0 11.0 34.0Different 163 40.8 40.8 74.8Somewhat Different
73 18.3 18.3 93.0
Very Different
28 7.0 7.0 100.0
Total 400 100.0 100.0
7.5%, 13.0% and 23.0% of the respondents have rated Nokia-Motorola to be very similar, somewhat similar, similar brands respectively, while 40.8%, 18.3% and 7.0% of them have rated Nokia-Motorola to be different, somewhat different, very different brands respectively.
Very Similar
Somewhat Similar
Similar
Neutral
Different
Somewhat Different
Very Different
Please rate the following pairs of mobile
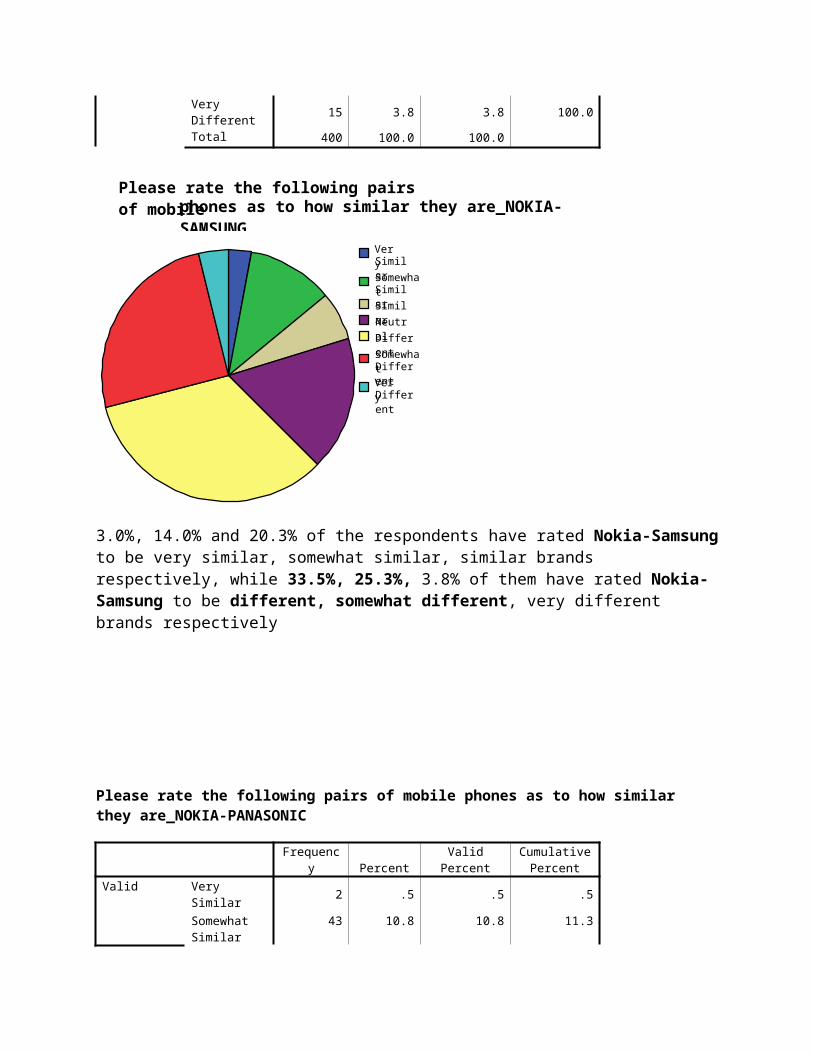
Please rate the following pairs of mobile phones as to how similar they are NOKIA-SAMSUNG
Frequenc
y PercentValid
PercentCumulative
PercentValid Very Similar 12 3.0 3.0 3.0
Somewhat Similar
44 11.0 11.0 14.0
Similar 25 6.3 6.3 20.3Neutral 69 17.3 17.3 37.5Different 134 33.5 33.5 71.0Somewhat Different
101 25.3 25.3 96.3
Very Different
15 3.8 3.8 100.0
Total 400 100.0 100.0
3.0%, 14.0% and 20.3% of the respondents have rated Nokia-Samsung to be very similar, somewhat similar, similar brands respectively, while 33.5%, 25.3%, 3.8% of them have rated Nokia-Samsung to be different, somewhat different, very different brands respectively
phones as to how similar they are_NOKIA-SAMSUNG
Very Similar
Somewhat Similar
Similar
Neutral
Different
Somewhat Different
Very Different
Please rate the following pairs of mobile
Please rate the following pairs of mobile phones as to how similar they are_NOKIA-PANASONIC
Frequenc
y PercentValid
PercentCumulative
PercentValid Very Similar 2 .5 .5 .5
Somewhat Similar
43 10.8 10.8 11.3
Similar 36 9.0 9.0 20.3Neutral 123 30.8 30.8 51.0Different 103 25.8 25.8 76.8Somewhat Different
65 16.3 16.3 93.0
Very Different
28 7.0 7.0 100.0
Total 400 100.0 100.0
0.5%, 10.8% and 9.0% of the respondents have rated NOKIA-PANASONIC to be very similar, somewhat similar, similar brands respectively, while 25.8%, 16.3% and 7.0% of them have rated NOKIA-PANASONIC to be different, somewhat different, very different brands respectively.
phones as to how similar they are_NOKIA-PANASONIC
Very Similar
Somewhat Similar
Similar
Neutral
Different
Somewhat Different
Very Different
Please rate the following pairs of mobile
Please rate the following pairs of mobile phones as to how similar they are _SAMSUNG-LG
Frequenc
y PercentValid
PercentCumulative
PercentValid Very Similar 27 6.8 6.8 6.8
Somewhat Similar
28 7.0 7.0 13.8
Similar 38 9.5 9.5 23.3Neutral 74 18.5 18.5 41.8Different 145 36.3 36.3 78.0Somewhat Different
66 16.5 16.5 94.5
Very Different
22 5.5 5.5 100.0
Total 400 100.0 100.0
6.8%, 7.0% and 9.5% of the respondents have rated SAMSUNG-LG to be very similar, somewhat similar, similar brands respectively, while 36.3%, 16.5% and 5.5% of them have rated SAMSUNG-LG to be different, somewhat different, very different brands respectively.
phones as to how similar they are_SAMSUNG-LG
Very Similar
Somewhat Similar
Similar
Neutral
Different
Somewhat Different
Very Different
Please rate the following pairs of mobile
Please rate the following pairs of mobile phones as to how similar they are_SAMSUNG-MOTOROLA
Frequenc
y PercentValid
PercentCumulative
PercentValid Very Similar 7 1.8 1.8 1.8
Somewhat Similar
33 8.3 8.3 10.0
Similar 51 12.8 12.8 22.8Neutral 80 20.0 20.0 42.8Different 102 25.5 25.5 68.3Somewhat Different
98 24.5 24.5 92.8
Very Different
29 7.3 7.3 100.0
Total 400 100.0 100.0
1.8%, 8.3% and 12.8% of the respondents have rated SAMSUNG-MOTOROLA to be very similar, somewhat similar, similar brands respectively, while 25.5%, 24.5% and 7.3% of them have rated SAMSUNG- MOTOROLA to be different, somewhat different, very different brands respectively.
phones as to how similar they are_SAMSUNG-
MOTOROLA
Very Similar
Somewhat Similar
Similar
Neutral
Different
Somewhat Different
Very Different
Please rate the following pairs of mobile
Please rate the following pairs of mobile phones as to how similar they are_SAMSUNG-PANASONIC
Frequenc
y PercentValid
PercentCumulative
PercentValid Very Similar 9 2.3 2.3 2.3
Somewhat Similar
31 7.8 7.8 10.0
Similar 60 15.0 15.0 25.0Neutral 75 18.8 18.8 43.8Different 111 27.8 27.8 71.5Somewhat Different
78 19.5 19.5 91.0
Very Different
36 9.0 9.0 100.0
Total 400 100.0 100.0
2.3%, 7.8% and 15.0% of the respondents have rated SAMSUNG-PANASONIC to be very similar, somewhat similar, similar brands respectively, while 27.8%, 19.5% and 9.0% of them have rated SAMSUNG- PANASONIC to be different, somewhat different, very different brands respectively.
phones as to how similar they are_SAMSUNG-PANASONIC
Very Similar
Somewhat Similar
Similar
Neutral
Different
Somewhat Different
Very Different
Please rate the following pairs of mobile
Please rate the following pairs of mobile phones as to how similar they are_LG-MOTOROLA
Frequenc
y PercentValid
PercentCumulative
PercentValid Very Similar 5 1.3 1.3 1.3
Somewhat Similar
35 8.8 8.8 10.0
Similar 56 14.0 14.0 24.0Neutral 54 13.5 13.5 37.5Different 113 28.3 28.3 65.8Somewhat Different
110 27.5 27.5 93.3
Very Different
27 6.8 6.8 100.0
Total 400 100.0 100.0
1.3% , 8.8% and 14.0% of the respondents have rated LG-MOTOROLA to be very similar, somewhat similar, similar brands respectively, while 28.3%, 27.5% and 6.8% of them have rated LG SAMSUNG- MOTOROLA to be different, somewhat different, very different brands respectively.
phones as to how similar they are_LG-MOTOROLA
Very Similar
Somewhat Similar
Similar
Neutral
Different
Somewhat Different
Very Different
Please rate the following pairs of mobile
Please rate the following pairs of mobile phones as to how similar they are_LG-PANASONIC
Frequenc
y PercentValid
PercentCumulative
PercentValid Very Similar 12 3.0 3.0 3.0
Somewhat Similar
40 10.0 10.0 13.0
Similar 58 14.5 14.5 27.5Neutral 79 19.8 19.8 47.3Different 80 20.0 20.0 67.3Somewhat Different
100 25.0 25.0 92.3
Very Different
31 7.8 7.8 100.0
Total 400 100.0 100.0
3.0%, 10.0% and 14.5% of the respondents have rated LG-PANASONIC to be very similar, somewhat similar, similar brands respectively, while 20.0%, 25.0% and 7.8% of them have rated LG-PANASONIC to be different, somewhat different, very different brands respectively.
phones as to how similar they are_LG-PANASONIC
Very Similar
Somewhat Similar
Similar
Neutral
Different
Somewhat Different
Very Different
Please rate the following pairs of mobile
-
Please rate the following pairs of mobile phones as to how similar they are. Circle the appropriate number_PANASONIC-MOTOROLA
Frequenc
y PercentValid
PercentCumulative
PercentValid Very Similar 22 5.5 5.5 5.5
Somewhat Similar
24 6.0 6.0 11.5
Similar 61 15.3 15.3 26.8Neutral 74 18.5 18.5 45.3Different 118 29.5 29.5 74.8Somewhat Different
73 18.3 18.3 93.0
Very Different
28 7.0 7.0 100.0
Total 400 100.0 100.0
5.5%, 6.0% and 15.3% of the respondents have rated PANASONIC-MOTOROLA to be very similar, somewhat similar, similar brands respectively, while 29.5%, 18.3% and 7.0% of them have rated PANASONIC-MOTOROLA to be different, somewhat different, very different brands respectively
phones as to how similar they are_PANASONIC-
Age
Frequenc
y PercentValid
PercentCumulative
PercentValid 15-25 161 40.3 40.3 40.3
26-35 110 27.5 27.5 67.836-50 103 25.8 25.8 93.5above 50
26 6.5 6.5 100.0
Total 400 100.0 100.0
15-25
26-35
36-50
above 50
Age
The age distribution of the various respondents is as follows: 40.3% of them belonged to the age limit of 15-25 yrs. 27.5% of them belonged to age limit 26-35 yrs. 25.8% belonged to 36-50 age limit while 6.5% of them were above fifty years of age.
Gender
Frequenc
y PercentValid
PercentCumulative
PercentValid MALE 241 60.3 60.3 60.3
FEMALE
159 39.8 39.8 100.0
Total 400 100.0 100.0
MALE
FEMALE
Gender
60.3% of the respondents of the research study were males while the remaining 39.7% were females.
Occupation
Frequenc
y PercentValid
PercentCumulative
PercentValid Service 150 37.5 37.5 37.5
Business/Self Employed
107 26.8 26.8 64.3
Student 92 23.0 23.0 87.3Housewife 51 12.8 12.8 100.0Total 400 100.0 100.0
Service
Business/Self Employed
Student
Housewife
Occupation
The occupation distribution of the various respondents is as follows: 37.5% of them belonged to the service class, 26.8% of them were into business or self employed. 23.0% of the respondents were those who are still studying and the rest 12.8% were housewives.
Household Income Level
Frequenc
y PercentValid
PercentCumulative
PercentValid Below 2
Lacs8 2.0 2.0 2.0
2-4 Lacs 143 35.8 35.8 37.8Above 4 Lacs
249 62.3 62.3 100.0
Total 400 100.0 100.0
Below 2 Lacs
2-4 Lacs
Above 4 Lacs
Household Income Level
Only 2.0 of the respondents are such whose house holds income is less than below 2 lacs, while 35.8% of them have household incomes between 2-4 lacs. A whopping 62.3% of them were those whose household incomes are above 4 lacs.
Some important cross tabulation
WHERE DID YOU PICK IT UP FROM?
NOKIASAMSUNG
LGPANASONIC
MOTOROLASONY ERICSSON
ANY OTHER
Which brand of mobile phone do you use?
0
20
40
60
80
Co
un
t
Where do you
prefer to purchase a
new mobile from?
Shopping Malls
Small Reatil Shops
Exclusive Showrooms
Grey Markets
Bar Chart
Maximum purchase of nokia phones is done from exclusive showrooms and minimum from small retail shops
Maximum sales of Samsung phones is from exclusive showrooms and grey markets
Motorola is sold in malls though the response for it is weak in the survey so it is difficult to comment on the sales. A larger sample size might produce better results
Response for the brands other than the ones mentioned above the response is not good.
THE AGE GROUP TO TARGET!!
NOKIASAMSUNG
LGPANASONIC
MOTOROLASONY ERICSSON
ANY OTHER
Which brand of mobile phone do you use?
0
10
20
30
40
50
60
70
Co
un
t
Age
15-25
26-35
36-50
above 50
Bar Chart
Sony Ericsson is sold the maximum in the age group above 50 Nokia is the leader in terms of sales for the first 3 sets of age groups
closely followed by Samsung. LG is sold maximum in the age group of 26-35. Panasonic has almost zero market for people below the age group of
36 and above that of 50
MAN OR WOMAN? BIG QUESTION!
NOKIASAMSUNG
LGPANASONIC
MOTOROLASONY ERICSSON
ANY OTHER
Which brand of mobile phone do you use?
0
20
40
60
80
100
120
Co
un
t
Gender
MALE
FEMALE
Bar Chart
Nokia is more popular with the males Samsung is more popular with the females due to their compact sizes
and flip phones. Motorola has very low market share for females, But with the launch of
Moto Razor pink and grey their share with women might increase LG is popular amongst the males more than the females The other brands such as Bird and BenQ are more popular with the
females but by a slight margin. Panasonic is more popular with the females
WHOM TO TARGET?
NOKIASAMSUNG
LGPANASONIC
MOTOROLASONY ERICSSON
ANY OTHER
Which brand of mobile phone do you use?
0
10
20
30
40
50
60
70
Co
un
t
Occupation
Service
Business/Self Employed
Student
Housewife
Bar Chart
Nokia remains a favorite across all occupations however Sony Ericsson enjoys an almost equal share in the business/ self employed category.
WHICH INCOME GROUP TO TARGET??
NOKIASAMSUNG
LGPANASONIC
MOTOROLASONY ERICSSON
ANY OTHER
Which brand of mobile phone do you use?
0
20
40
60
80
100
120
Co
un
t
Household Income
Level
Below 2 Lacs
2-4 Lacs
Above 4 Lacs
4.00
Bar Chart
Nokia sells the most across the various household income groups owing to the wide variety of their products.
Every brand sells more in the income group which is higher Panasonic, Motorola, Sony Ericsson and other brands do not sell in the
households where the annual income is below 2 lacs
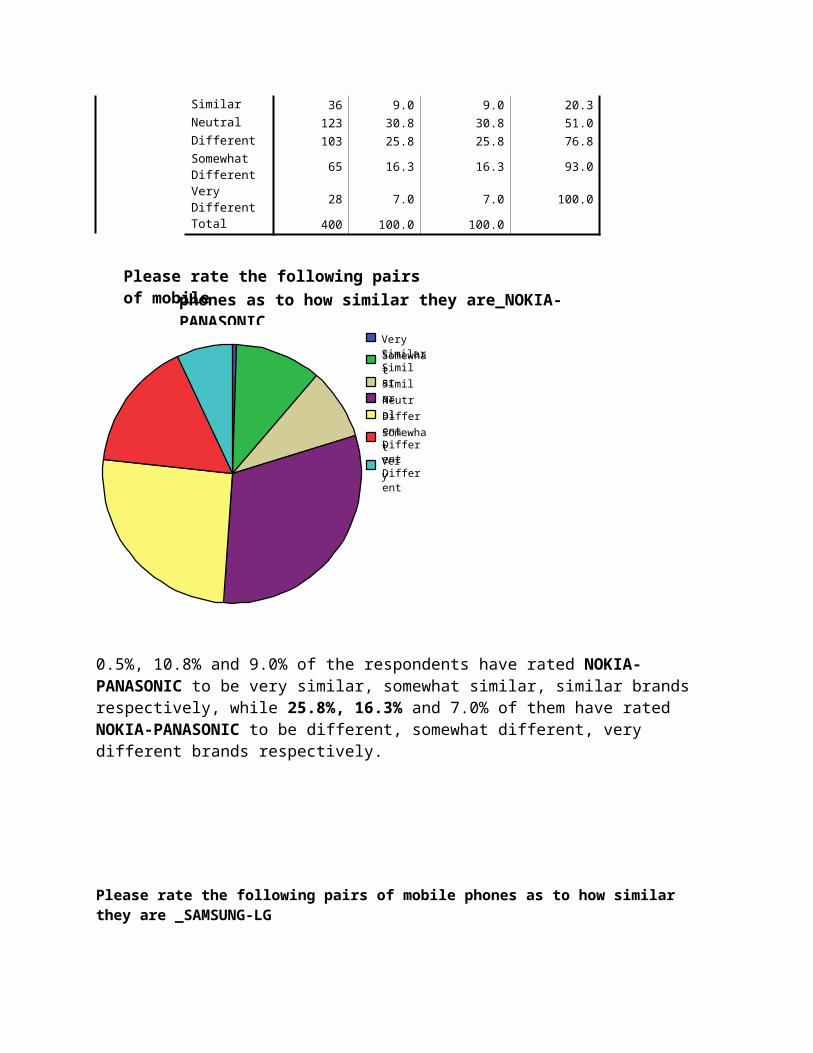
IS IT WORTH IT??
NOKIASAMSUNG
LGPANASONIC
MOTOROLASONY ERICSSON
ANY OTHER
Which brand of mobile phone do you use?
0
20
40
60
80
Co
un
t
Overall how
satisfied are you
with your handset
very unsatisfied
unsatisfied
neutral
Very satisfied
Extremely satisfied
Bar Chart
Nokia and Samsung mobile owners have very high satisfaction levels. Motorola and Panasonic do not have any unsatisfied customers There are more unsatisfied than satisfied customers with the mobile
brands other than the ones mentioned.
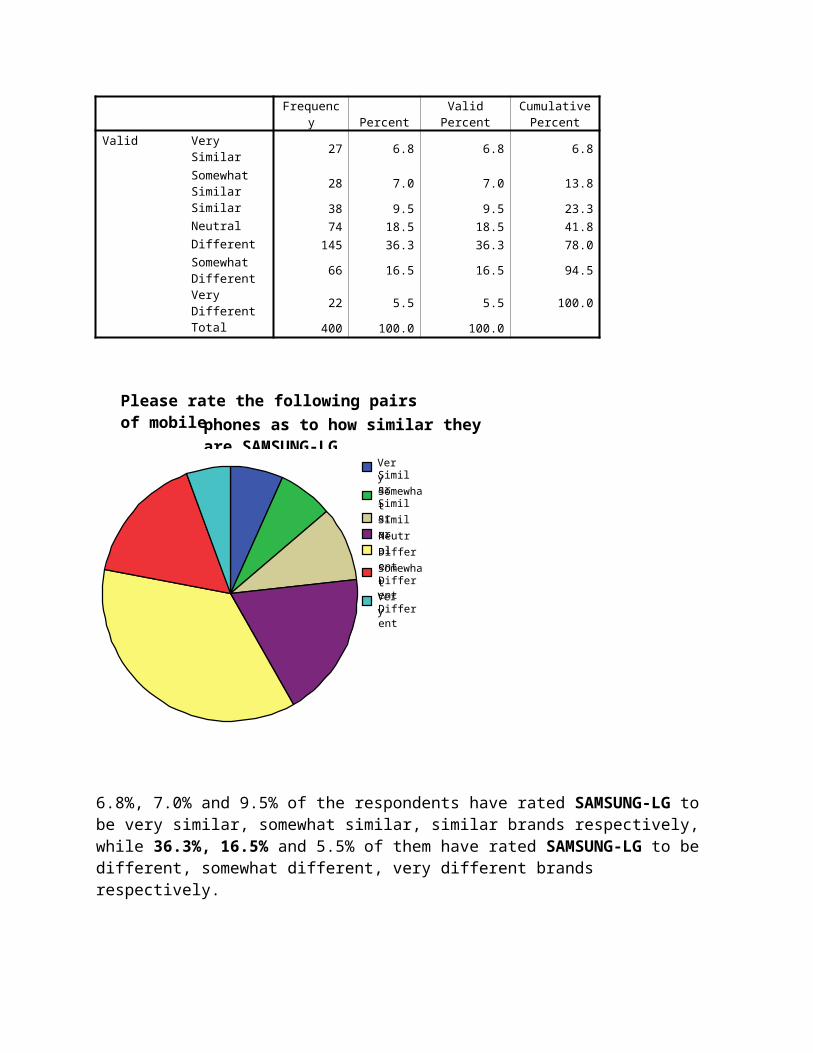
Definitely Probably Probably Not Definitely Not
How likely are you to buy a new handset
0
10
20
30
40
Count
Does your purchase
decision for a
specific handset get
affected when the
company comes
out with contests,
competitions or
promotions?
Strongly Agree
Agree
Neutral
Disagree
Strongly Disagree
Bar Chart
ANYTHING.. ANYTHING AT ALL.. SCHEMES.. PROMOTIONS
Coming out with promotions and schemes enhances the chances of sale of the product as a lot of people say their choice is affected if a scheme comes out.
People who disagree with the above statement do not plan to buy a new phone so the opinion might not matter from the sales and marketing point of view
WHERE WILL YOU BUY IT FROM?
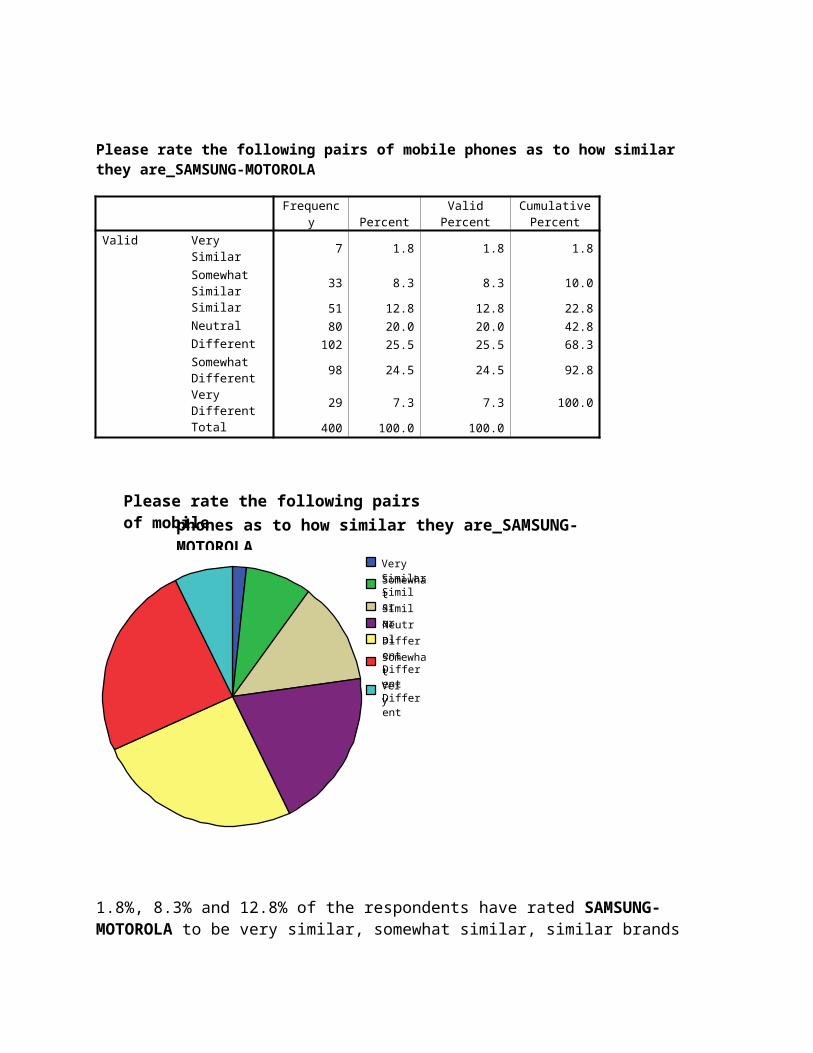
Shopping Malls Small Retail Shops
Exclusive Showrooms
Grey Markets
Where do you prefer to purchase a new mobile from?
0
10
20
30
40
50
60
70
Count
How likely are you
to buy a new
handset
definitely
Probably
Probably Not
Definitely Not
Bar Chart
Exclusive showrooms are the most preferred place for the purchase of cell phones.
Few people purchase from small retail shops A lot of people disagreed on purchases from shopping malls
WHERE TO ADVERTIZE?
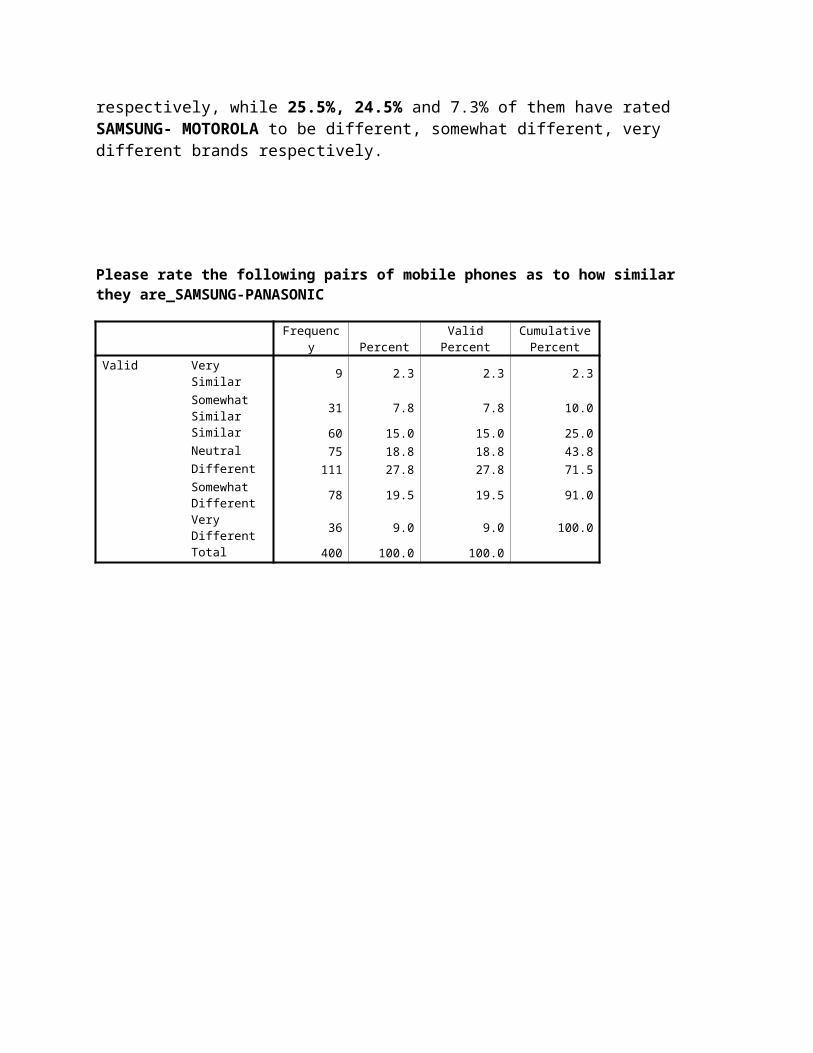
TelevisionNewspapers
Family/ FriendsMobile Shops
RadioMagazines
Internet
Where are you most likely to get up to date information about newer handsets being
launched in the markets
0
10
20
30
40
Count
How likely are you
to buy a new
handset
definitely
Probably
Probably Not
Definitely Not
Bar Chart
Television and news papers are the best options for advertising. Word of mouth is the main factor that people consider while enquiring
about new phones
WHY THE MOBILES? WHY?
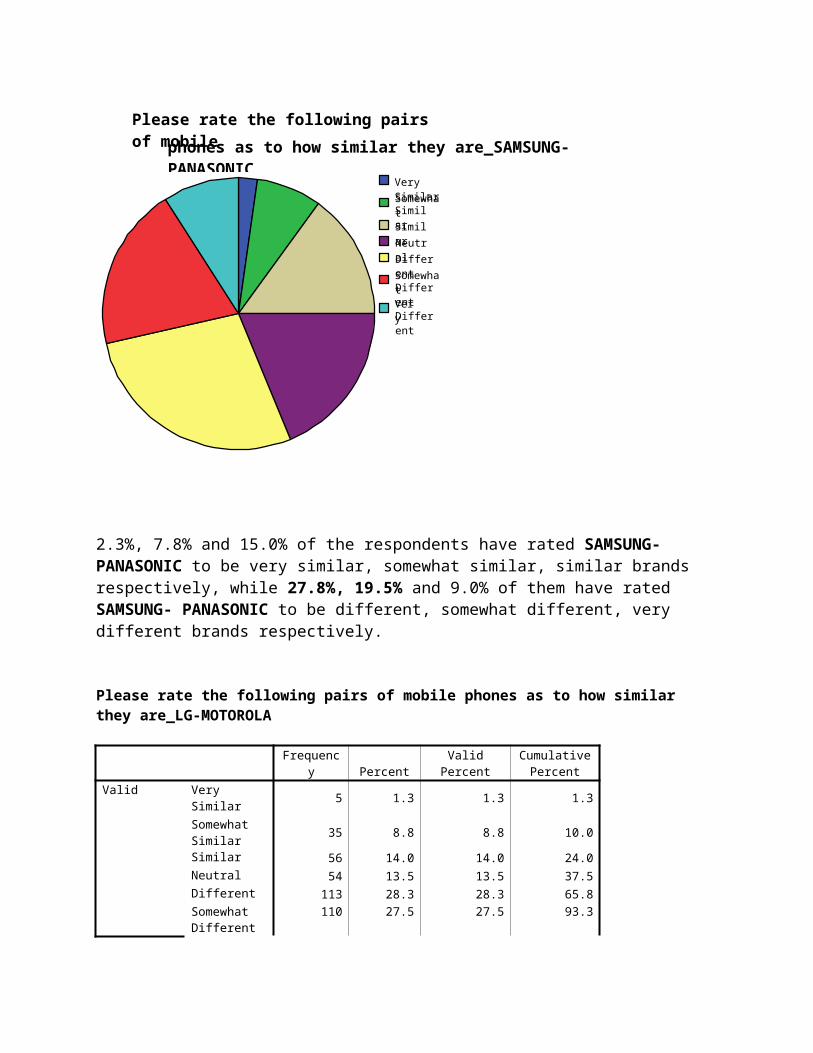
least likely somewhat likely
more likely very likely most likely
What is your main reason for having a moblie phone?_Just making and receiving calls
0
20
40
60
80
100
120
Co
un
t
Age
15-25
26-35
36-50
above 50
Bar Chart
Mostly people across all age groups use mobiles to make and receive calls
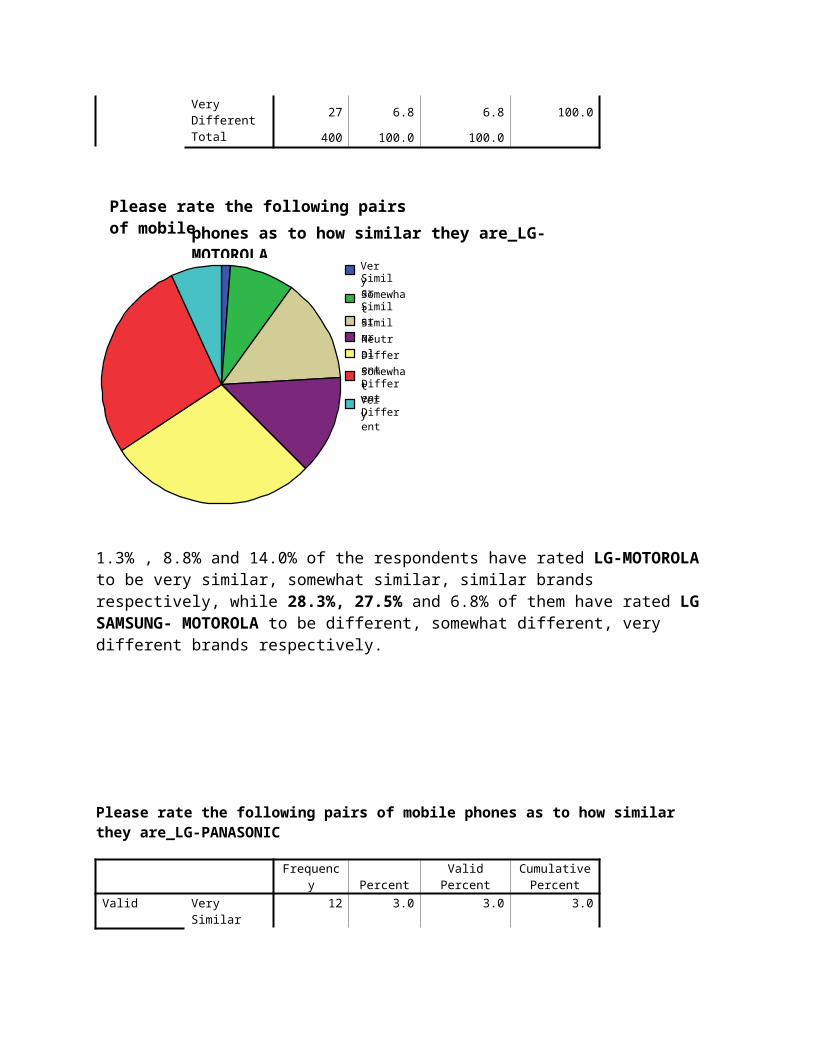
least likely somewhat likely
more likely very likely most likely
What is your main reason for having a moblie phone?_It's a status symbol
0
20
40
60
80
Co
un
t
Age
15-25
26-35
36-50
above 50
Bar Chart
People across the 15-25 use a phone mainly because it is a sign of status symbol for them.
Age groups 36-50 are the least likely to use a phone just for a status symbol
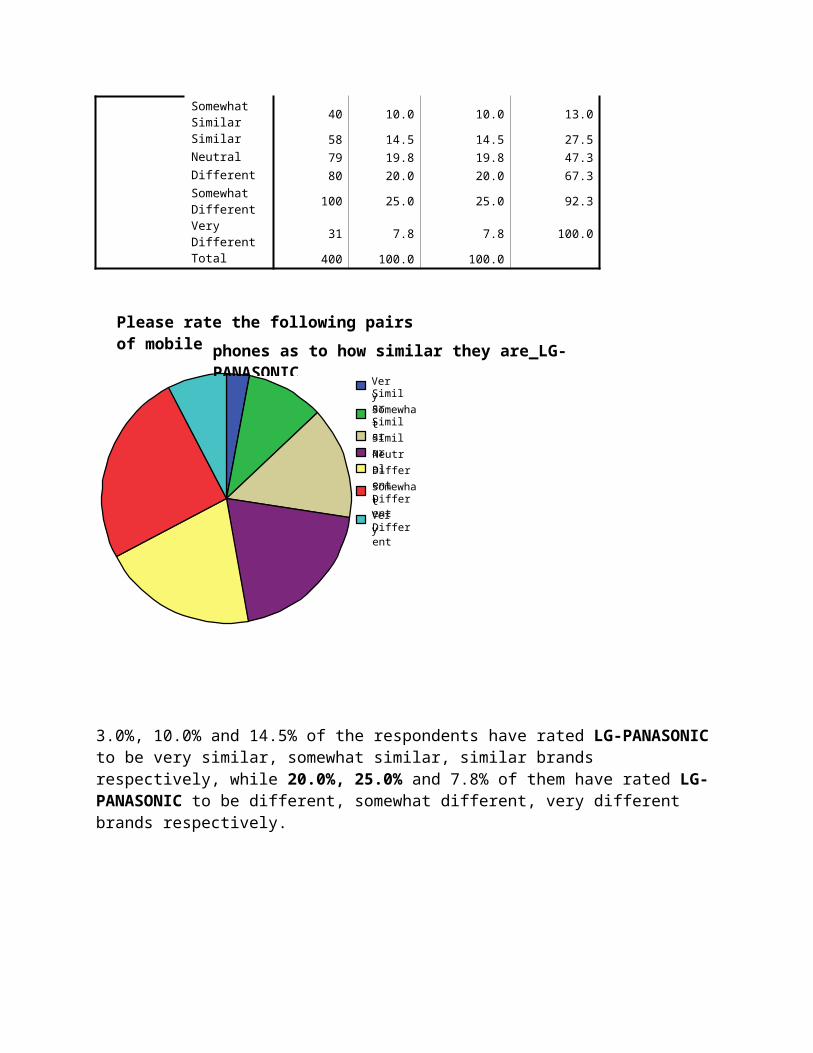
least likely somewhat likely
more likely very likely most likely
What is your main reason for having a moblie phone?_Inclined towards sms and other
features like camera, fm, etc.
0
20
40
60
80
Co
un
t
Age
15-25
26-35
36-50
above 50
Bar Chart
The advanced features in a phone are used mainly by youngsters Very few respondents don’t use these features.
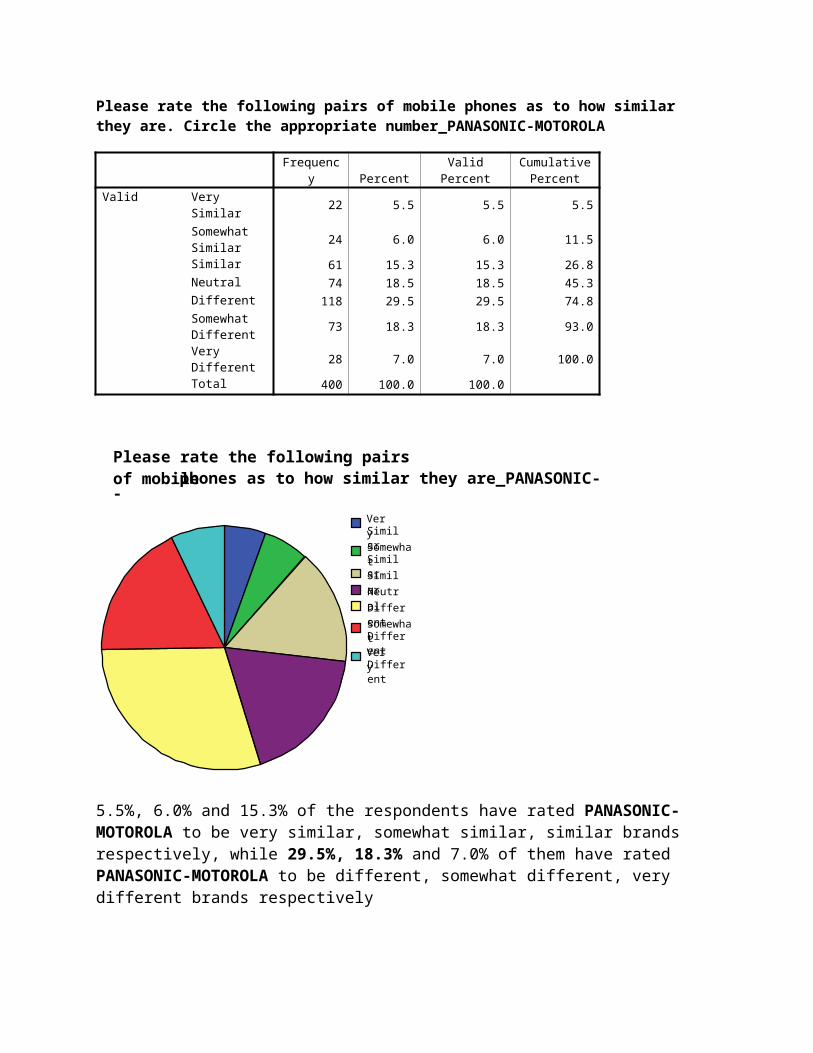
least likely somewhat likely
more likely very likely most likely
What is your main reason for having a moblie phone?_A combination of all or some of the
above reasons
0
20
40
60
80
100
Co
un
t
Age
15-25
26-35
36-50
above 50
Bar Chart
The advanced features in a phone are used mainly by youngsters Very few respondents don’t use these features.
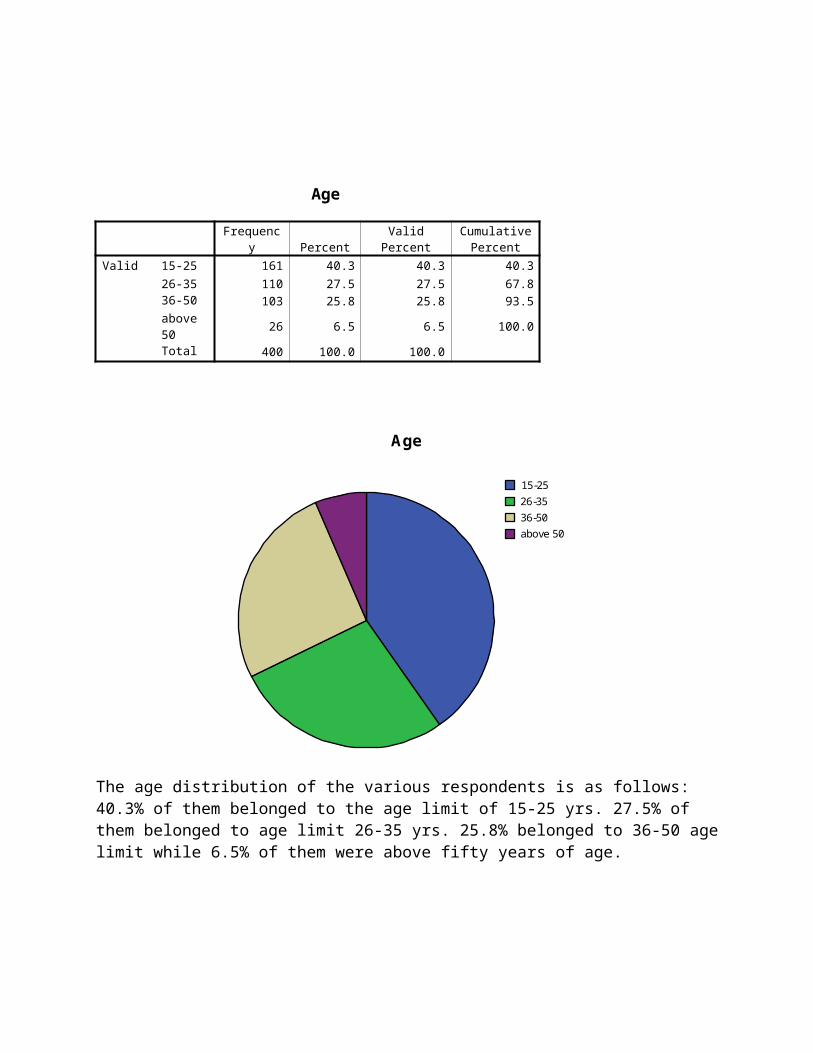
CONCLUSIONS
Mobile has become an important part of people’s life and it is no more a
luxury.
New Delhi, Noida and Ghaziabad is highly competitive and price sensitive
market as majority of respondents want maximum services provided by
company in low priced handsets.
There is a good scope for new entrants in this circle as the service
provided by the existing players are not up to the mark and subscribers
want to try out new ones provided they stand up to the customers
expectations.
Numbers of color mobile users far out number B/W mobile users. And
among the color mobile users majority of them are camera mobile users.
As the circle comprises of mainly high standard areas with many big
shopping malls, subscribers want that the network coverage should
extend up to shopping malls in addition to the small markets and roads.
MMS and Bluetooth functions are fast becoming popular with the mobile
users. In fact these are becoming a criterion for choosing a mobile
handset.
Majority of respondents perceives Samsung as the best color mobile
provider. It commands high respect and favorable image amongst the
mobile users.
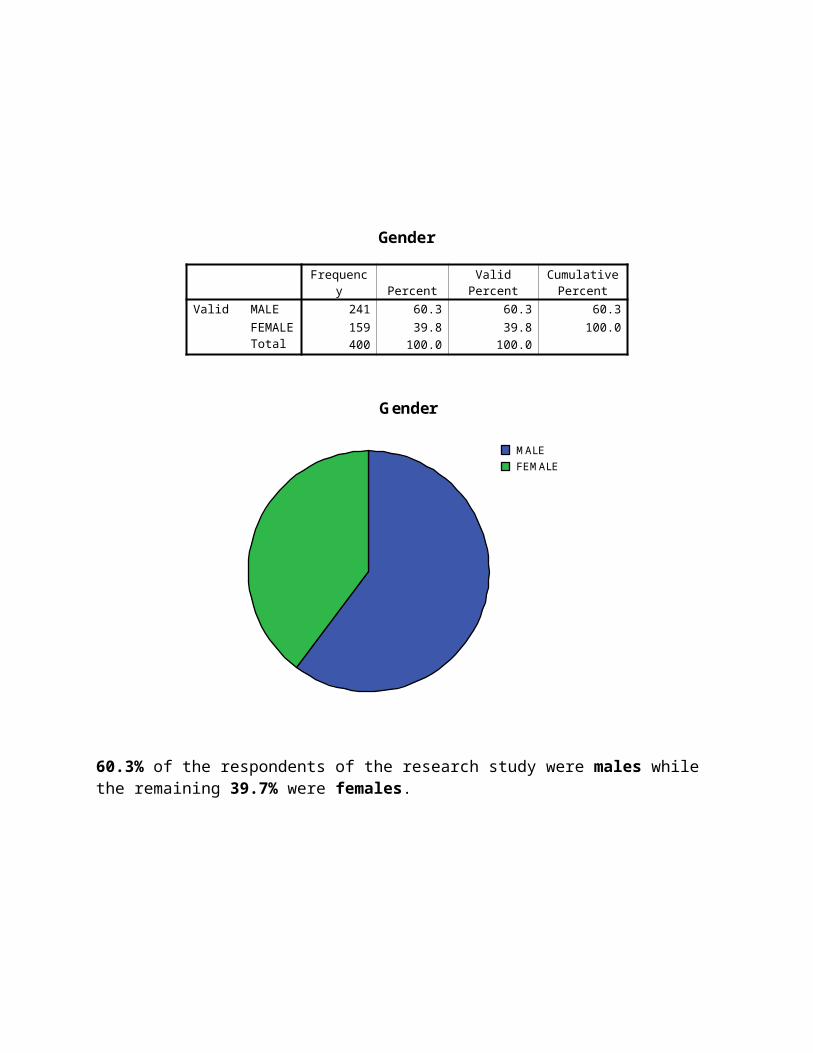
RECOMMENDATIONS
Some recommendations and additional enhancements are following:
New Delhi, Noida and Ghaziabad is a highly competitive and price
sensitive market, which is having better shopping malls and markets,
hence a suitable marketing strategy, needs to be formulated taking into
consideration the advertising and price factor.
As the numbers of mobile users are relatively young, marketing strategy
should be more focused on this age group.
One of the drawbacks of Samsung brand in this market could be its
common flavor not metro flavor. Hence to succeed in this market it need
to reposition itself as the premium brand.
Since customer education about new launchings and facilities provided in
handsets is the major problem faced by most of the mobile users,
Samsung needs to take extra efforts for promptness in customer
education to win and retain users.
Samsung needs to prune up its advertising campaign to increase its
visibility further as one of its competitors’ visibility is high.
Bluetooth and other connectivity services are fast emerging as an
important area of mobile service. Therefore, Samsung should come up
with these relevant services from time to time differentiate its product
and to generate additional revenue.
Samsung should give high priority to customer service and satisfaction as your satisfied customers do the best advertisement.
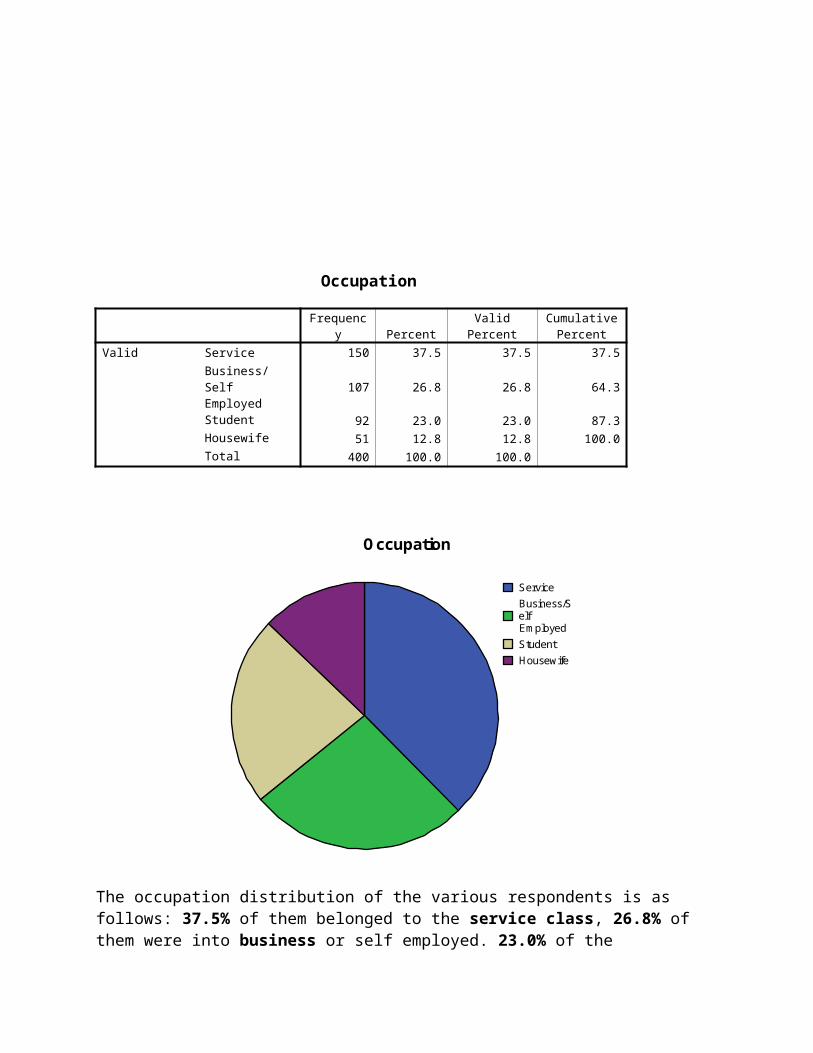
QUESTIONNARE
Q1) Which brand of mobile phone do you use?
Q2) Who was the main influencer while purchasing the mobile phone?
Q3) Rank the following brands in order of your preference _NOKIA
Q4) What is your main reason for having a mobile phone? _Just making and receiving calls
Q5) Rate the following factors on the basis of your level of satisfaction and experience with your mobile regarding the following items_ Overall Quality
Q6) Overall how satisfied are you with your handset
Q7) How likely are you to buy a new handset
Q8) Does your purchase decision for a specific handset get affected when the company comes out with contests, competitions or promotions?
Q9 Where do you prefer to purchase a new mobile from?
Q10 Rate the following attributes of your preferred new mobile instrument on a scale 1-7 as per their significance to you_Ease of usage
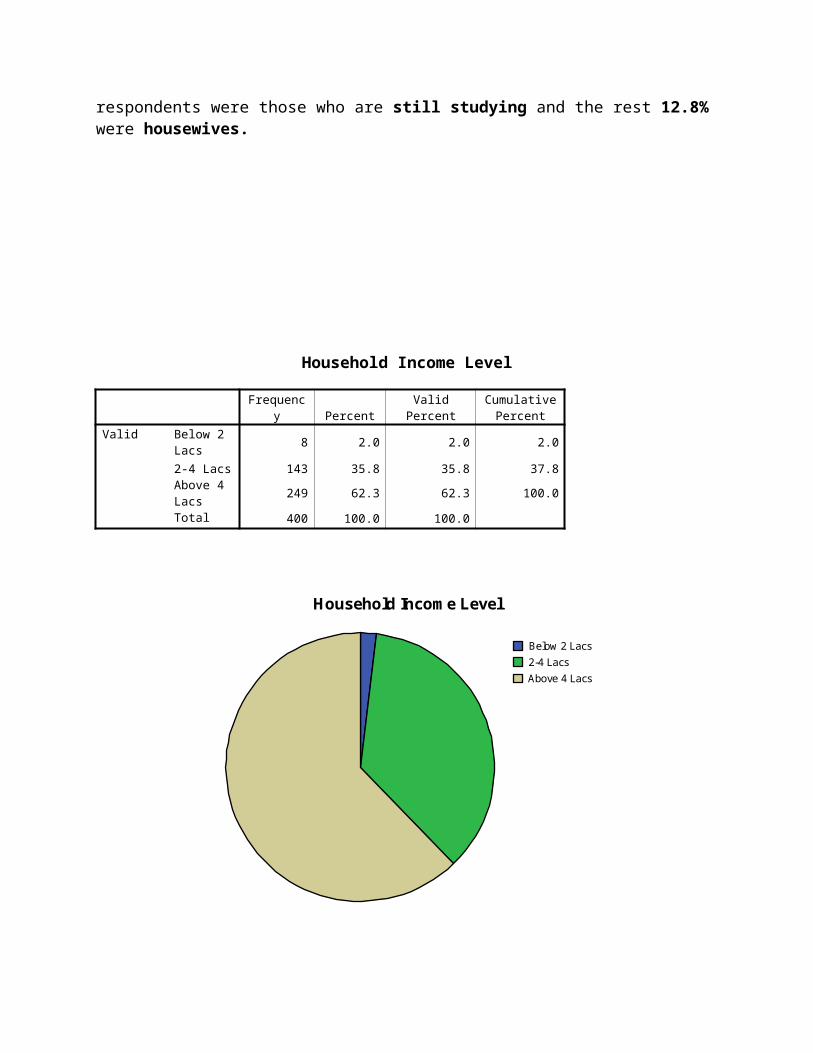
BIBLIOGRAPHY
Reference Book-
1) Research Methodology By C.R Kothari
2) Marketing Management By Philip Kotler
3) Principles of Marketing By Kotler and Armstrong
4) Intelligent computing CHIP, Volume 1, Issue 3, 2004 published at
www.chip-india.com
website used-
1. www.in.samsungmobile.com
2. www.samsung.org
3. www.nokia.com
4. www.google.com
5. www.motorola.com
6. www.lgindia.com