Embed Size (px)
Citation preview
The Mix of Monetary and FiscalPolicies: Conventional Wisdom Vs.Empirical RealityKEITH M. CARLSON
I, HE current economic situation of high interestrates, high unemployment and large federal deficitshas prompted a call for a change in the mix of stabiliza-tion policies. The current mnix seems to be one of “easy”fiscal policy and “tight” monetary policy. Manyanalysts feel the mix should be shifted toward “tighter”
fiscal policy and “easier” monetary policy, ostensiblyfor purposes of putting the economy on the path torecovery.
Jamnes Toiin, for example, recently stated that:
the mix of policies is unhealthy. To achieve a solidrecovery, such as the administration projects, and toachieye it withommt astronomical interest rates and se-rious crowding out, we need an easier monetary policycomhined with a tighter fiscal policy.’
Economists at the Brookings Institution have ex-pressed a similar view:
Beyond 1982, the key to an improved economicsitu-ation must lie in a realigmument of economic policy—a shift in the mix of fiscal and monetary policy, bymatching reductions of future budget deficits withan easier monetary policy. As presently constituted,fiscal and monetary policies appear to he on a collisioncourse 2
The Congressional Budget Office talks of the clashbetween mnonetary and fiscal policy:
Statements from the Federal Reserve suggest thatmonetary policy will continue its anti-inflationary
‘James Tohin, “The wrong Mix lbr Recovery,” Challenge (May-’June 1982), p. 25,
tmJoseph A, Pechmanand Barry P. I3oswomth, “The Budget and theEconomy,” in Joseph A. Pechmnan, ed,, Setting Nationa/ Priorities:The 1983 Budget (The Brookings Institution, 1982), p. 43’
stance in the coming years. . By contrast, the budgetmeasures enacted last summer will provide consider-able stimulus to economic activity over the next fewyears. This suggests the possibility of a clash betweenmonetar and fiscal policy unless the Congress emmactsfurther spending cuts and tax increases to reducefederal borrowing or the Federal Reserve adopts a lessrestrictive monetary policy. If the clash materializes, itwill he reflected in high real interest rates that crowdout private investment. ‘~
The notion of policy mix is well-known and has beena part ofthe macroeconomics literature for a nummber ofyears, hut seldom has it generated controversy as it hasnow. Despite its recognition, however, little is knownabout the exact terms of the mnix or what indicators ofmonetary and fiscal policy are most appropriate to umsein defining it. For example, neither Tobin, the Brook-ings econoniists, nor the Congressional Budget Officestate by how much fiscal policy should be tightenedand to what extent monetary policy should be eased.
The gravity of the current economic situation re-quires that the notion of policy mix” ie given a moreprecise interpretation. Is cmmrrentpolicy what it seems?How does one measure the ease and tightness ofmonetary and fiscal policies? What measures of eco-nomic performance are relevant to the mix argu-ment—interest rates, GNP, the ratio of investment toCNP? What horizon is pertinent—short-run, long-
run, a specific number ofyears? Can policies really betraded off to achieve a specific economic objective?These are the types of questions that are given shortshrift when the mix of policies is discussed.
3Congressional Budget Office. The Prospects for Economic Recor-cry (US’ Government Printing Office, 1982), p. 27.
7
FEDERAL RESERVE BANK OF ST. LOUIS OCTOBER 1982
The purpose of this article is to provide some spec-ificity to the policy mix question. As a point of de-parture, some indicators of monetary’ and fiscal policyare examined, amud a historical classification of policymix is developed. A conventional macroeconomictreatment of polic~’mix is then presented, providingthe basis for developmnent of testable hypotheses.These hypotheses are tested, and somne policy implica-tiomus are derived.
DEFIPS INC EASE AND TIGHTNESS
OF i.2OLICY
Many sumnnsary measures of nionetary and fiscalpolicy have been developed over the years. The mnaimireason fUr seeking such a measure is toprovide a quickinterpretation of current policy stamuce. The criteria forselection are that the nieasure primnarily reflect move-ments in the instruments of policy’ andl that it not heinfluenced greatly by the pace of economic activity.4 Inother words, the indicator should reflect the thrust ofthe policy on the economy rather than the reverse.
)%:Icasurcmcnt oj 1~Uo~.atiu’u ,~i.trans
Measuring the stance of monetary policy revivesmany controversial issues, one of the oldest of whichcenters on the choice between interest rates andmonetary aggregates Although the level of interestrates is often alluded to as an indicator of monetarypolicy, most analysts have fhund it tohe unreliable as apolicy measure, since a great mnany forces influmeneeinterest rates besides mnonetary actions. The monetaryag,gregates, on the other hand, tend to reflect moreaccurately changes in the policy imustrnments—openmarket operations, reserve requiremnents and the dis-count rate—without being influenced undumly by out-side forces.’
Chief among the candidates for a monetary policyindicator are the money stock (Ml) and the monetarybase. The mnonetary base has appeal because it reflectsmore accurately changes in the instrumnents of policythan does Ml. The Ml measure, however, tends to bemore closely related to CNP.6
4See, for example, Albert E. Burger, “The Implementation Prob-lem of Monetary Policy,” this Review (Nlarch 1971), pp. 20—30,
‘5See R. w. Hafer, “selecting a Monetary Indicator: A Test of theNew Momietary Aggregates,” this Review (Fehruary 1981), pp.12—18.
°Forreferences to the literature, along with a contrasting inter-pretation, see William E. Cullison, “Money, the Monetary Base,and Nominal GNP,” Federal Reserve Bank ofRichmond EconomicReview (May/June 1982), pp. 3—13,
Labeling momuetary’ policy as easy’ or tight is, ofcourse, quite arbitrary. The procedure followed here isto examimue the historical record of Ml and develop aclassification of relatively easy and relatively tight
policy on the basis of this record. To make this classifi-cation mneaningfml, one mimst accoumut fUrchanges in thetrend ofmonetary growth, particularly ifone intends toficus on the imnpact of monetary’ policy’ on real vari-ables. Consumers and investors come to expect certaimugroxvth rates of the mnonetarv aggregates, basing suchexpectations on past experience. It is the deviation ofthe monetary aggregate around this expected growthrate that a,ffeets real economic activity.
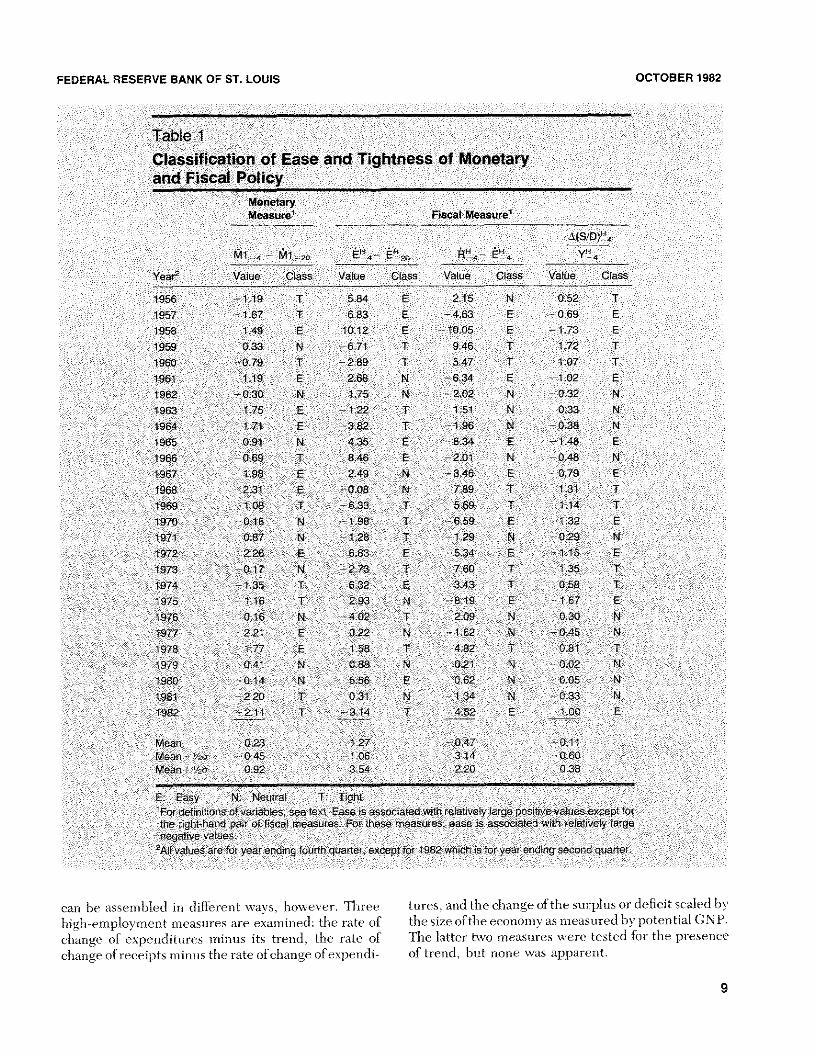
Table 1 summarizes monetary policy since 1956.The first column shows the four-quarter rate ofchangeof Nil minus its trend (20-quarter rate of change) fUrthe period ending in the fourth quarter of each year(except for 1982).’ The second column, which classifiesmonetary policy as easy, tight or neutral, follows from athree-part division of the observations in the first col-umn. The mean plus or minus ½standard deviationserve as points of demarcation. The classification isrelative and also approximate. Rigidly adhering to thefour-quarter rate of change can mnask changes in policythat occur within the year. A more exhaustive studywould not be tied to periods of fixed length. Nonethe-less, the classification seems to accord with commnoninterpretation of economicexperience; for example, allof the observations labeled as “tight” occurred nearrecession periods.
~1Jf1/ u;-’en.i.eri.t at Fiscal ,~‘1cn•an,s
The measurement of fiscal actions, also has beemuresearched extensively over the years.5 The chiefcon-clusion from this research is that recorded surpluses ordeficits do not provide an accurate measure of fiscalactions. The reason is that a considerable amotmnt ofthemovement of receipts and expenditures reflects anautomatic response to the pace of economic activityrather than policy actions, Consequently, only fiscalmeasures on a high-emuployment basis are con-sidered.9 These high-employment budget measures
7Justiflcation for a 20-quarter rate of change as a measure oftrend isfound in Denis S. Karnosky. “The Link Between Money andPrices,” this Review (June 1976), pp. 17—23. See also Keith M.Carlsom,, “The Lag from Money to Prices,” this Review (October1980), pp. 3—10.
5Alan S. Blinder and Robert M. Solow, “Analytical Foundations ofFiscal Policy,” in Alan S. Blinder and Robert M. Solow, eds., TheEconomics ofPublic Finance (The Brookings Institution, 1974), pp.3—115.
°Frauk de Leeuw and Thomas M. Holloway, “The High-Employment Bmmdget: Revised Estimates and Automatic InflationEffects,” Survey of Current Business (April 1982), pp. 21—33.
8
FEDERAL RESERVE BANK OF ST LOUIS OCTOBER 1982
Table IClassification of Ease and Tightness of Monetaryand Fiscal Policy
Monetary
Measure Fiscal Measure1
Ml ~ Ml EF~4
En20
A’~ E
Year2
Value Class Value Class Value Class Value Class
1958 119 T 584 E 215 N 0.52 T1957 1.67 T GSa E 463 E 069 E1958 149 5 1012 5 1005 E 173 5
1959 033 N 671 T 948 T 172 T1960 039 T 289 P 547 T 107 1198 119 5 288 N 634 5 1.02 5
1962 030 N 1.75 N 202 N 032 N
1963 175 122 T 151 N 0.33 N1964 171 5 82 T 196 P4 038 N
1985 091 N 435 5 834 1.48 51966 069 1 846 5 201 N 0,48 N
1967 188 5 249 N 346 5 079 51968 231 008 N 7S9 1 131 11968 tUB T 633 1 5,69 T 14 T1970 016 N 198 1 659 5 13 5
1971 087 N 1.28 T 129 N 029 N
1972 226 E 683 E 534 5 15
1973 01 N 273 T 760 1 35 T
1974 135 ‘1’ 632 5 343 T 058 T1975 116 T 293 N 819 16 5
1976 06 N 402 T 209 N 030 N
1977 221 5 022 N 162 N 045 N
1978 177 5 158 T 482 1 081 1979 041 N 088 N 02 N 00 N
1980 014 N 556 5 06 N 00 N
981 220 T 031 N 124 N 033 N
198 211 1 314 1 482 5 —10
Mean 0 127 047 01Mean zu 04 106 34 06Mean 092 354 220 038
Easy N Neutal T TighFor definitions of variables see te Ease is associated with relatively large positive v uese cept forthe ight hand pair of fiscal measures For these measu e ease is associated Wi h relatively largenegative valuesAl alues are or year endin fourth quarte emtcept for 1982 which is foryear ending second quarter
can h’ ~s nhled i diffe ent say houes.er. Three tu es and the change of the surplus o deflet cal d hshigh-c ploxmem t measures are examined: the rate of the si, ofthe econ ins as measu ed by potential (,NP.change of expenditur ‘, minus its trend the rite of The latte two measures sx re’ tested for the presenhange )f receipts minu. the r te of change’ f xpendi of trend but nom e was appa ent.
9
FEDERAL RESERVE BANK OF ST. LOUIS OCTOBER 1982
The right—hand portion of table 1 summarizes these other extreme of tight monetary policy and easy fiscalthree fiscal measures over the 1956-to-1982 period, policy occurred in 1957, 1975 and 1982~these wereThe rate of change of high-employment expenditures recession years, although all of 1975 is not classifiedis included because previous studies have used it as a so according to the National Bureau of Economicsummnary’ fiscal measure even though it does not re— Research.fleet changes in tax policy. mo The other two high-emnploymnent measures—the rate of change of receiptsminus the rate of change of expenditures and thechange in the surplus/deficit scaled by’ potentialCNP—reflect changes in both tax polic~’and expendi-ture policy’. In general, these latter two measnres yieldthe same classification of easy, tight and neutral.
The current situation (note that 1982 refers to thefbur quarters ending in second quarter 1982) clearlyfalls into the classification of tight monetary policy’ andeasy’ fiscal policy’. According to the detrencled measureof monetary’ policy as shown in table 1, 1981 and 1982are the tightest years fUr monetary’ policy fUr the 1956—82 period. The measures of fiscal policy’, however, donot indicate unusual ease. The expenditure measuredoes not indicate ease at all, and the other two,although suggesting ease, do not indicate that the dc—
gree of ease is unusual. There have been six or sevenof the last 27 years (depending on which measure isused) when fiscal policv~has been easier than in 1982.
The current concern about the mnix of policies,however, is not focused entirely on the recent past(note, in particular, the quotations by Brookings andthe Congressional Budget Office above). There is con-cern about the near future. In other words, givencurrent trends, analysts seem to he mnost concernedabommt developing trends in the mnix. Consequently, afUll assessment of policy’ mix requires an extrapolationof trends to determine if the mix of policies appears tohe worsening, that is, that monetary policy’ is tighten-ing further or at least remaining tight, and that expen-diture and tax policies are leading to a further easingof fiscal policy.
Table 2The Mix of Policy. 1956—82
Monetary Fiscal
1 ight Np_ira’ Easy
light 1956. 1960 1969 1974 1966 ‘YB ‘95/ 1975982
Ne’Ara’ 1973 959 1962 197 196~‘970
9?6 1979 1980
Easy 968. 1918 1963.1964 97/ 958 19E11967 t97~
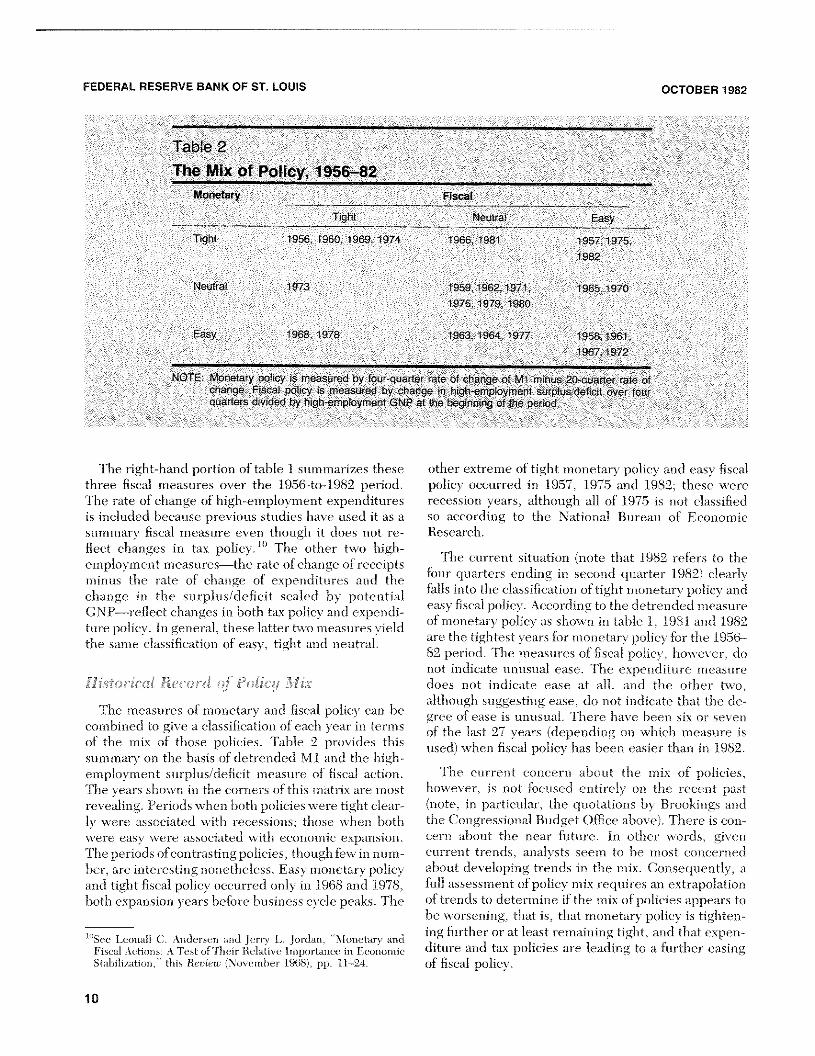
NOTE Moneiav DOi’cV ,s reasu ad ny fov-aua’te’ -ate o’ change C’ M’ ri,nus 20-cuaie -ato otcharge Fiscal uo ‘ry is Pleasured by charge in hiqi -erneloymert surplus deficit over fouraba-ters d,v.ried by hIab.errployrnent GNP at the heqinn:nq o’ the oprioo
His/:orica). B.ecard of to. I Mix
The measures of monetary and fiscal policy can hecombined to give a classification of each year in termsof the mix of those policies. Table 2 provides thissummary’ on the basis of detrencled Ml and the high—employment surplus/deficit measure of fiscal action.The years shown in the corners of this mnatrix are mnostrevealing. Periods when both policies were tight clear-ly’ were associated with recessions; those when bothwere easy’ were associated with economic expansion.The periods ofcontrasting policies, though few in numn—her, are interesting nonetheless. Easy’ nmonetary policyand tight fiscal policy occtmrred only’ in 1968 and 1978,both expansion years before business cycle peaks. Tbe
‘°SeeLcomiall C. Amidersen and Jerry L. Jordan, “Mommetary andFiscal Actions: A Test of‘Fheir Relative Importance in EconomicStabilization,” this Renew (Novcmbc’r 1968), pp. 11—24.
10
FEDERAL RESERVE BANK OF ST. LOUIS OCTOBER 1982
Figure 1
Determination ot Real Income, Interest Rate and Investment-Saving Ratio
IX)
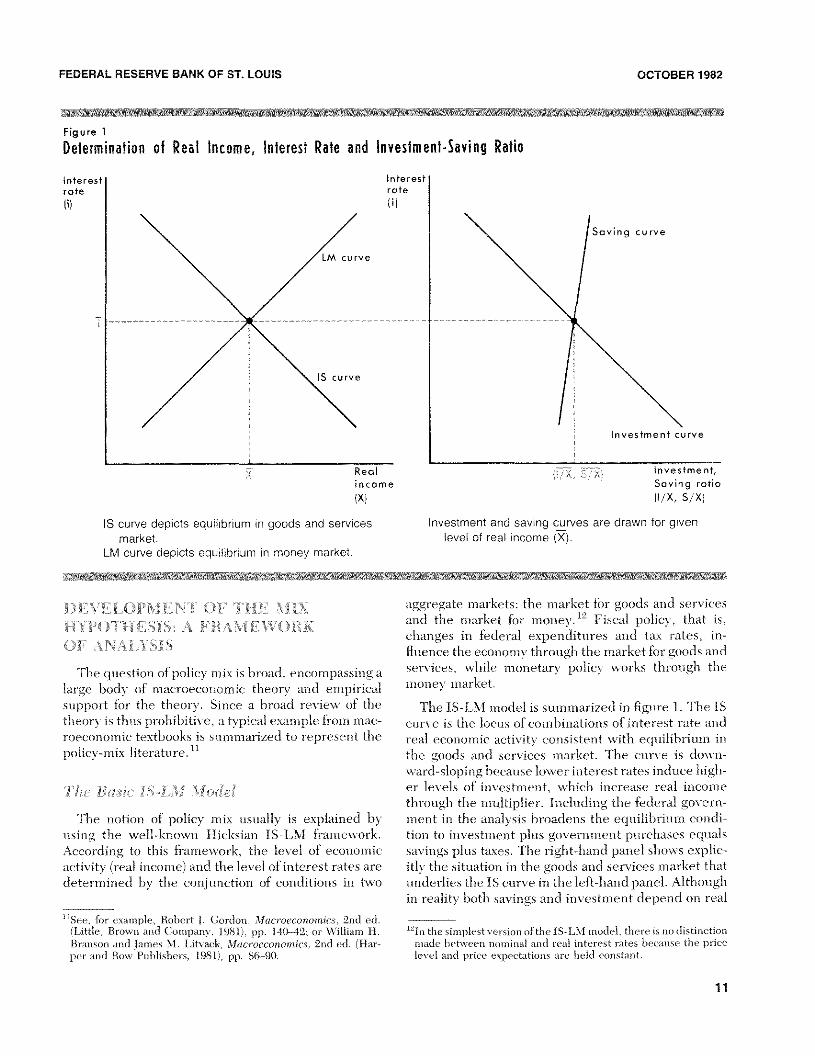
IS curve depicts equilibrium in goods and servicesmarket.
LM curve depicts equilibrium in money market.
Interestrote(ii
Investment,Soving rotio(t/X, S/X)
Investment and saving curves are drawn for gvenlevel of real income (X).
i)E\.:rFLC)P • “i’ O~F’TiilE. NIJX
Ii ~ I I i.~S I~i < toll ~<)f•~ ANA1XSIS
The qmmestion of polic~’mix is broad, encompassing alarge body’ of macroeconomic theory’ and empiricalsupport for the theom’ . Since a broad review of thetheory is thus pi-ohihitive,a typical examnple from mac-roeconomic textbooks is summarized to represent thepolicy’—mix literattmre. mm
•‘~yJ I$’~9,r ~ ton,].”
The notion of policy’ mix usually’ is explained by’using the well—known Hicksian IS—LM framework.According to this framnework, the level of economicactivity’ (real income) and the level of interest rates arecletermnined by’ the conjtmnction of conditions in tsvo
See, for example, Robert J. Gordon , ,%Irwroecoaoones, 2nd ed.(Little, Brown and Company. I98th pp 140—42; or William H.Branson and James Ni. Litvaclc , .%Iocroecononnc,s, 2nd ed, (liar—per and Row Puhlishers, 1981), pp. 86—90.
aggregate markets: the market for goods and servicesamid the market for money’. m2 Fiscal policy, that is,changes in federal expendittmres and tax rates, in-fluence the economliv throtmgh the market for goods andservices, while monetary’ policy’ sx’orks through themoney market.
The IS—LM model is summarized in figure 1. The IScurve is the locus of combinations of interest rate andreal economic activity’ consistent with equilibrium inthe goods and services market. The curve is down-ward—sloping because lower interest rates induce high-er levels of investment, which increase real incomethrough the mnultiplier. Including the federal govern-ment in the analysis broadens the eqmmilibrium condi-tion to investment plus government purchases equalssavings plus taxes. The right—hand panel shows explic-itly’ the sitm.mation in the goods and services market thatunderlies the IS curve in the left—hand panel. Althoughin reality 1)0th savings and investment depend on real
m21n the sinmplcst version ol’the IS—LM nmodel, there is no distinction
made hetween nominal an ml real interest rates because the print’level and priec expectations arc held constant.
Interestrote
LM curve
Soving curve
IS curve
Reolincome
Investment curve
11
FEDERAL RESERVE BANK OffSt LOUIS OCTOBER 1902
Figure 2Policy Nix and lie IS-tN Framework
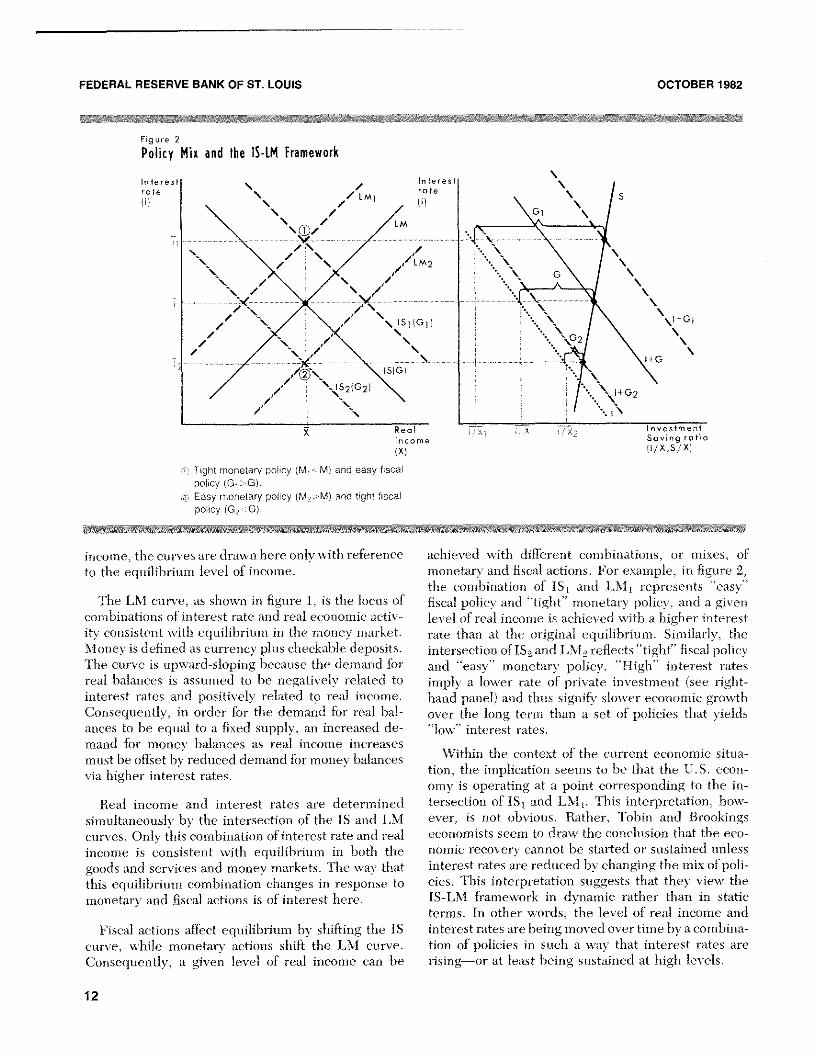
® Tight monetary policy (M,<M) and easy fiscalpolicy (G1>G).
e Easy monetary policy (M2>M) and tight fiscalpolicy (02<0).
income, the curves are drawn hereonly with referenceto the equilibrium level of income.
The LM curve, as shown in figure 1, is the locus ofcombinations of interest rate and real economic activ-fly consistent with equilibrium in the money market.Money is definedas currency plus checkable deposits.The curve is upward-sloping because the demand lbrreal balances is assumed to be negatively related tointerest rates and positively related to real income.Consequently, in order 1kw the demand 1kw real bal-ances to be equal to a fixed supply, an increased de-mand for money balances as real income increasesmust be offset by reduced demandfor money balancesvia higher interest rates.
Real income and interest rates are determinedsimultaneously by the intersection of the IS and LMcurves. Only this combination ofinterest rate and realincome is consistent with equilibrium in both thegoods and services and money markets. The way thatthis equilibrium combination changes in response tomonetary and fiscal actions is of interest here.
Fiscal actions affect equilibrium by shifting the IScurve, while monetary actions shift the LM curve.Consequently, a given level of real income can be
achieved with different combinations, or mixes, ofmonetary and fiscal actions. For example, in figure 2,the combination of IS1 and LM1 represents “easy”fiscal policy and “tight” monetary policy, and a givenlevel of real income is achieved with a higher interestrate than at the original equilibrium. Similarly, theintersection ofIS2 and LM2 reflects “fight fiscalpolicyand “easy” monetary policy. “High” interest ratesimply a lower rate of private investment (see right-hand panel) and thus signify slower economic growthover the long tenn than a set of policies that yields“low” interest rates.
Within the context of the current economic situa-tion, the implication seems to be that the U.S. econ-omy is operating at a point corresponding to the in-tersection of IS1 and LM1. This interpretation, how-ever, is not obvious. Bather, Tobin and Brcokingseconomists seem to draw the conclusion that the eco-nomic recovery cannot be started or sustained unlessinterest rates are reducedby changingthe mix ofpoli-cies. This interpretation suggests that they view theIS-LM framework in dynamic rather than in staticterms. In other words, the level of real income andinterest rates are beingmoved over timeby a combina-tion of policies in such a way that interest rates arerising’—or at least being sustained at high levels.
InterestrateIll
12
FEDERAL RESERVE BANK OF ST. LOUIS OCTOBER1982
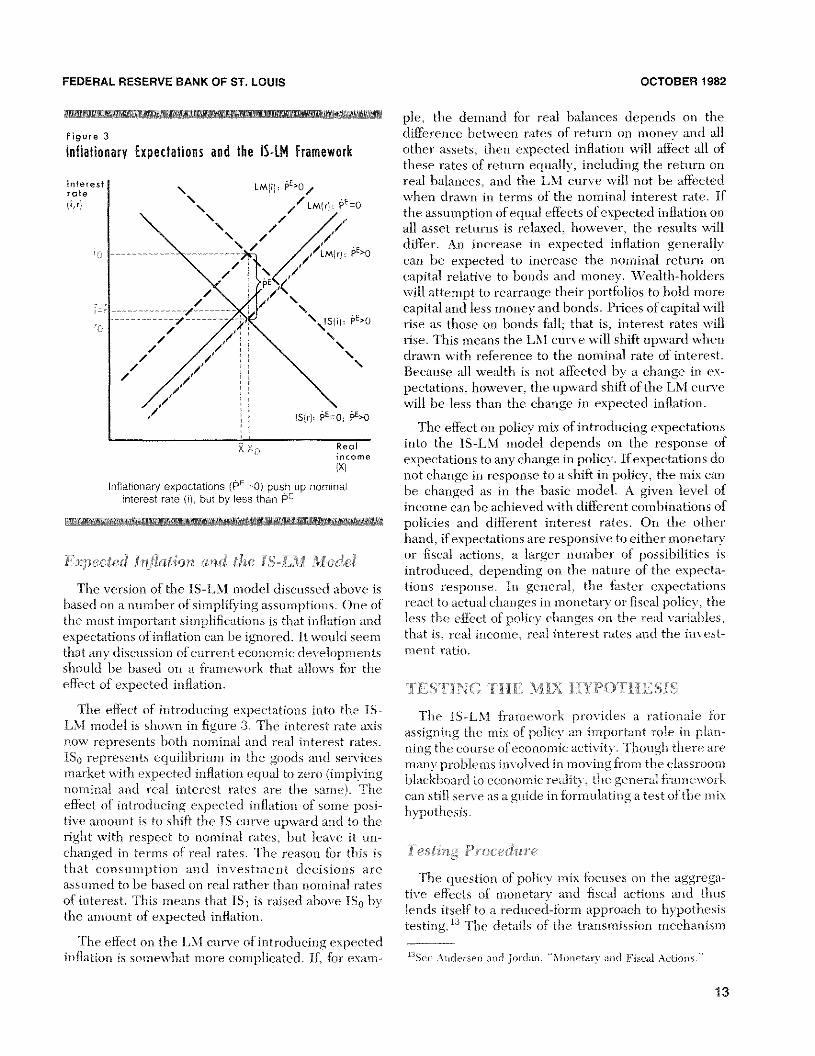
Figure 3
Inhlafionary Expectations and the ~S-1MFramework
—a
Expected. Inflation and the IS-Li. :1 iWod.eI
The version of the IS-LM model discussed above isbased on a number of simplifying assumptions. One ofthe most important simplifications is that inflation andexpectations of inflation can he ignored. It wouki seemthat any discussion of current economic developmentsshould be based on a framework that allows for theeffect of expected inflation.
The effect of introducmg expectations into the IS—LM model is shown in figure 3. The interest rate axisnow represents both nominal and real interest rates.~ represents equilibrium in the goods~~£1I~(lservicesmarket with expected inflation equal to zero (implyingnominal and real interest r~ites~~ire the same). Theeffect of introducing expected inflation of some posi-tive amount is to shift the IS curve upward and to theright with respect to nommal rates, but leave it un-changed in terms of real rates. The reason fhr this isthat consumption and investment decisions areassumed to be based on real rather than nominal ratesof interest. This means that ~s1 is raised above IS0 bythe amount of expected inflation.
The effect on the LXI curve of introducing expectedinflation is somewhat more complicated. If, for exam—
pIe, the demand for real balances depends on thedifference between rates of return on money and allother assets, then expected inflation will afThct all ofthese rates of return equall~’,including the return onreal balances, and the LXI curve will not he affectedwhen drawn in terms of the nominal interest rate. Ifthe assumption of equal efli~ctsof expected inflation onall asset returns is relaxed, however, the results willdiffer. An increase in expected inflation generallycan he expected to increase the nominal return oncapital relative to bonds and money. W~ealth—bolderswill attempt to rearrange their portfhlios to hold morecapital and less money and bonds. Prices of capital willrise as those on bonds fall; that is, interest rates willrise. This means the LM curve will shift upward whendrawn with reference to the nominal rate of interest.Because all wealth is not affhcted by a change in ex-pectations, however, the upward shift ofthe LM curvewill be less than the change in expected inflation.
The effect on policy mix of introducing expectationsinto the IS-LM model depends on the response ofexpectations toany change inpolicy. If expectations donot change in response to a shift in policy, the mix canbe changed as in the basic model- A given level ofincome can be achieved with different combinations ofpolicies and different interest rates. On the otherband, if expectations are responsive toeither monetaryor fiscal actions. a larger number of possibilities isintroduced, depending on the nature of the expecta-tions response. In general, the faster expectationsreact to actual changes in monetary or fiscal policy, theless the efl’ect of policy changes on the real variables,that is, real income, real interest rates and the invest-ment ratio.
T.ESTI.NG Ti••IE \fL HYPOTHE 8.15
The IS—LM framework providc~sa rationale forassigning the mix of policy an important role in plan-ning the course of economicactivity. Though there aremany problems involved in moving from the classroomblackboard to economic reality, tbe general frameworkcan still serve as a guide in formulating a test of the mixhypothesis -
Testing Pracei:hsre
The question of policy mix focuses on the aggrega—tive eflects of monetary and fiscal actions and thuslends itself to a reduced—form approach to hypothesistesting. 13 The details of the transmission mechanism
cc Anderscii anci Jordan- “N innctarv and Fiscal Actions- -,
interestrote(i,rl
LM(i): P1>O,
\~\ ,“ LM(r~ P~O
/
,‘ \ tS{i) P~>O/ ‘H/ /1
H, ~‘ H ‘S
H/
/ :1/ H
~1 ISlr}~~~=o~E>o
Realincome(X)
Inflationary expectations (P’~-0) push op nominalinterest rate (i), but by less than pE,
13
FEDERAL RESERVE BANK OF ST. LOUIS OCTOBER 1982
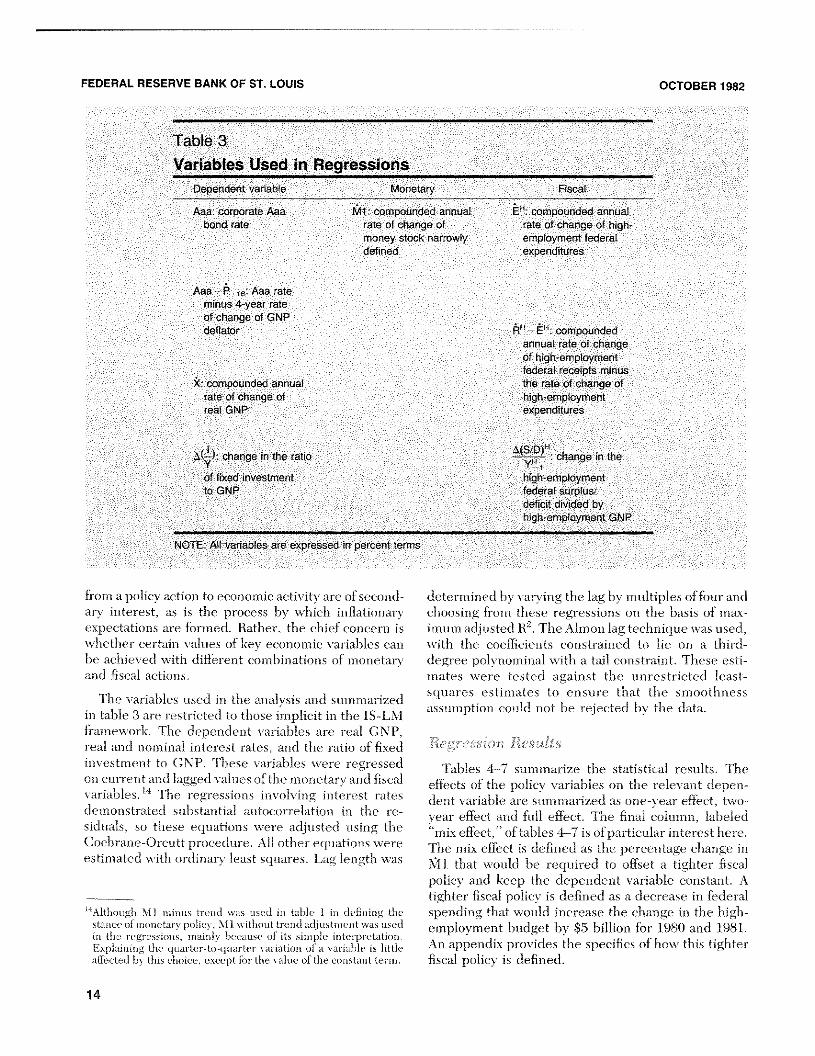
Table 3Variables Used in Regressions
Dependent variable Monetary Fiscal
Ma. corporate Aaa Ml compounded annual E~’compounded annualbond rate rate of change of rate of change of high
money stock narrowly employment federaldefined expenditures
Aaa P Aaa rateminus 4-year rateof change of GNPdeflator R° E~.compounded
annual rate of changeof high employmentfederal receipts minus
k~compounded annual the rate of change ofrate of change of high-employmentreal GNP expenditures
Ac) change in the ratio Ms/DY change in the
of fixed investment high employmentto ONP federal su plus
deficit divided byhigh employment ONP
NOTE All variables are expressed in percent terms
ft d) n a polici action to economic -ictis its are of second dc t i mined hi san ii g the lag bs nultiples of four audiai interest a. is the process bs ss hicli inflationars cb osing from these caressions di i he h’ sis of ma —
xpectations a e formed Rither the chief cone rn is imum djustecl R’. The -klmd ii lag technique ss a usedI ether cc tim s dues of key x,onoinic ariables can s~ith the coefficients constrais ed to he on a third—
he hR seel ith difl ic nt cot ibinatmom s of monetars degree p01’ nc miual si itb i a ii on tr i t. These c> ti—and fiscal actions. mates xi re sted igainst the unre trictc dl Ic ast—
- . . . squares c stisnates to ens re t at the smoothness‘I h x a tables used in the anals sis and s immarized -
- . . ass unption could not lie ej ct ci Iii the data.in table 3 are rc st set dl to those nnphc it in the IS—LMframes cirk. Tb el ~pendent sat iahles ar • sc al ( \ Pea and i omutal inte est rates and the atio if fi ed
is estinc nt t G\ P. rhese s in bles ii e e regs essedon ci rent a id Ia r ‘clx als es oftbc i 0 iet~ s md fiscal
ti-chIc ~ The s egi c ions md Is ma inter t ritedIes onstr-ited s list’ i tial autocor ~latio i i tI re—sidu-ils so t iese equat on is idjustecl Ising theCoch -fl —Os cutt roc -dlure. Al dither eq tations is crcest mated is ith or~li i. s least sq iares. Lag k nc t i ssas
“Although N-f I so inus tresid was u sect in table 1 in deBo ing thetatice of inonetarv pohcv, )O I xvi thenit tie tie
1adjustni eUt \“as used
in the regressiosis, iiiai nix because of its sinsliie interpretation -
Explaining the ci uarter— to—i jsiarter variation of a variable is littleaffected by this choice, except for the value of the constant tcrus,
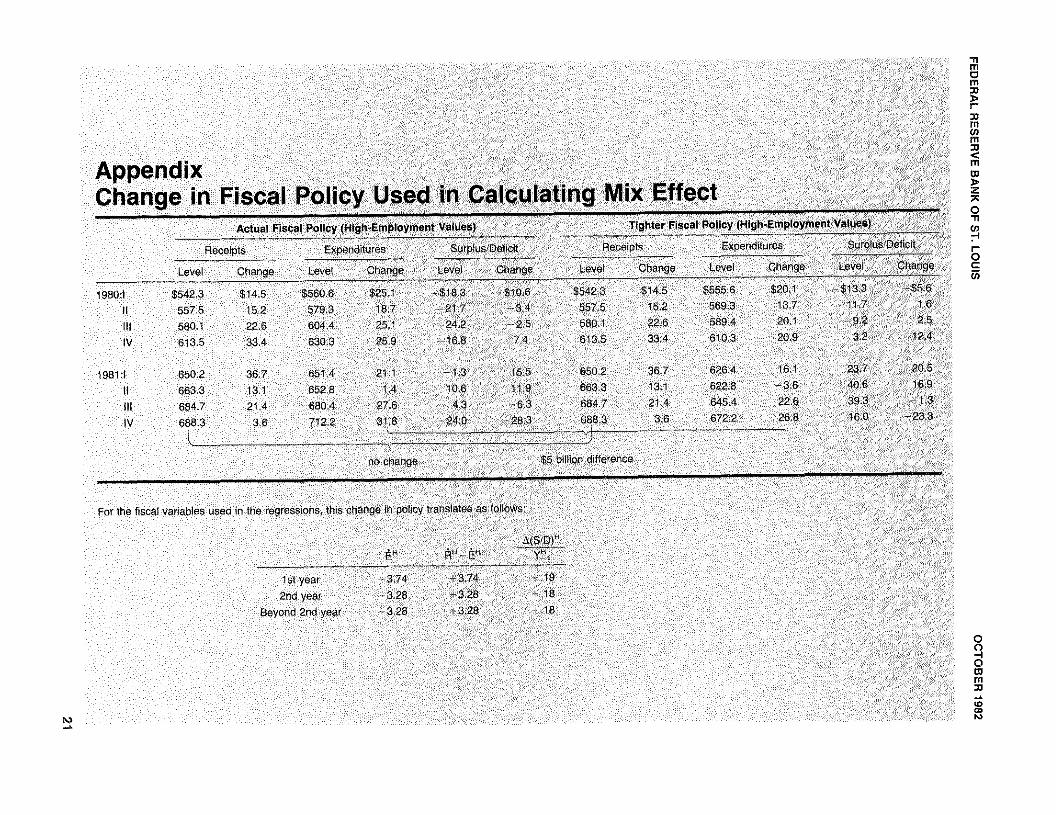
Tables 4—7 summarize the statistical results. Theeflbcts of the po1~cyvariables cm time relevant depen-dent variable are summarized as one-year effect, txyo-year effect and full eflCct. The final column, lauded“mix effect,’’ of tables 4—7 is of particular interest here.The mix effect is defined as the percentage change inMi that would lie reqcnred to offset a tighter fiscalpolicy and keel) the dependent varialile constant. Atighter fiscal policy is defined as a decrease in federalspending that would increase the change in the high—employment lmudget imy 65 billion for 1.960 and1 1961.An appendix provides the specifics of how this tighterfiscal policy is defined.
14
FEDERAL RESERVE BANK OF ST. LOUIS OCTOBER 1982
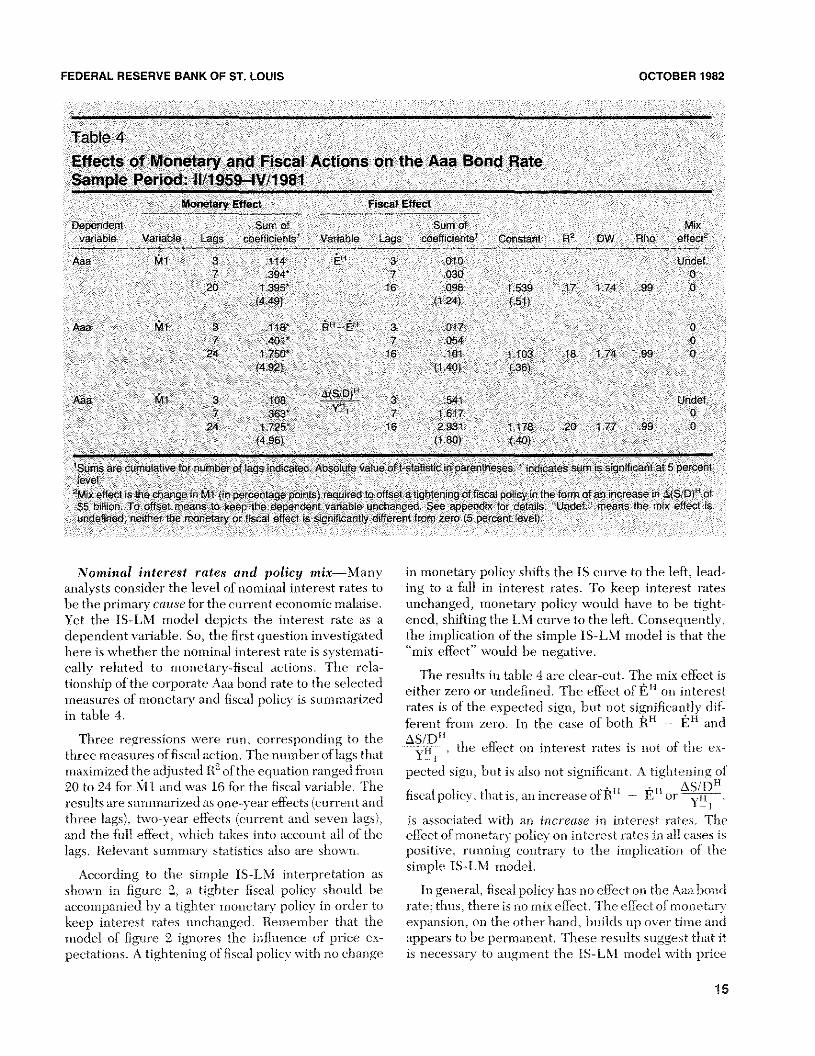
Table 4Effects of Monetary and Fiscal Actions on the Aaa Bond RateSample Period: l1/1959’-IV/1981
Monetary Effect Fiscal Effect
Dependent Sum of Sum of Mix
variable Vanable Lags coefficients Variable Lags coefficients Constant El2 DW Rho effectMa Ml 3 i14 EH 3 010 (Jndef
7 394 7 030 020 1395 6 098 1539 17 174 99 0
(449) (124) (51)
Ma g%l 3 118* frEH 3 017 07 401 7 054 0
24 1750 16 101 1103 8 174 29 0(492) (140 (36)
AtS D~1~Ma Ml 3 106 ‘H’ 3 541 Undef
7 363 ‘~ 7 1517 024 1725 16 2931 1178 20 177 99 0
(496) (1 80) (40)
1Sums are cumulative fo number of lags indicated Absolute value oft statistic in parentheses * indica es sum is significant at 5 percentlevel2Mixeffect is the change in Ml (in pe centage points) required to offset a tightening offiscal policy in the form of an increase in A(S D)u of$5 billion To offset means to keep the dependent variable unchanged See appendi for details Undef” means the mix effect isundefined neither the monetary o fiscal effect i significantly different f om zero (5 percent level)
Nominal interest rates and policy rnix—Many in monetary policy shifts the IS curve to the left, lead-analysts consider the level of nominal interest rates to ing to a fall in interest rates. To keep interest rateshe the primary cause for the current economicmalaise. unchanged, monetary policy would have to lie tight-Yet the IS-LM model depicts the interest rate as a ened, shifting the LM curye to the left. Consequently,dependent variable. So, the first question investigated the implication of the simple IS-LM model is that thehere is whether the nominal interest rate is systemnati- “mix effect” would he negative.eally related to monetary-fiscal actions. The rela- . - -
- . The results in table 4 are clear-cut. The mix effect istmonshmp of the corporate Aaa bond rate to the selected . . H- - . either zero or undefined. The effect of F on interestmeasures of monetars’ and fiscal policy is summarized . .., . -
- hi’ 4 - - rates is of the expected sign, hut not significantly dif-in ta . ferent from zero. In the case of both RH — E~5and
Three regressions were run, corresponding to the ~S/DH- - . p , the effect on interest rates is not of the cx—
three measures of fiscal action. The number of lags that X:~m iximnized the adjuste el R2 of the equ ition r mge d from pected sign but is ilso not significant N tigbtc snug of20 to 24 fhr N-Il and was 16 Ihr the fiscal variable. The . - - n _______
- fiscal polmcv. that is an umcrease ofR — E or nresults are summarized as one-year effects (current and - - —
three lags), two-year effects (current and seven lags), is associated with an increase in interest rates. Theandl the full effect, xvhich takes into account all of the effect of monetary policy omi interest rates in all eases islags. Relevant summary statistics also are show-mi. positive, running contrary to the implication of the
- . . simple IS-LM model.Aecordmng to the simple IS—LM interpretation as
shown in figure 2, a tighter fiscal policy should he In general, fiscal policy has no effect on the Aaa bondaccompanied by a tighter monetary policy in order to rate; thus, there is no mix efihct. The effect of monetarykeep interest rates unchanged. Resnemnher that the expansion, on the other hand, builds up over time andmodel of figure 2 ignores the influence of price cx- appears to lie permanent. These results suggest that itpectations. A tightening of fiscal policy with no change is necessary to augmnent the IS—LM snoclel with price
15
FEDERAL RESERVE BANK OF ST. LOUIS OCTOBER 1982
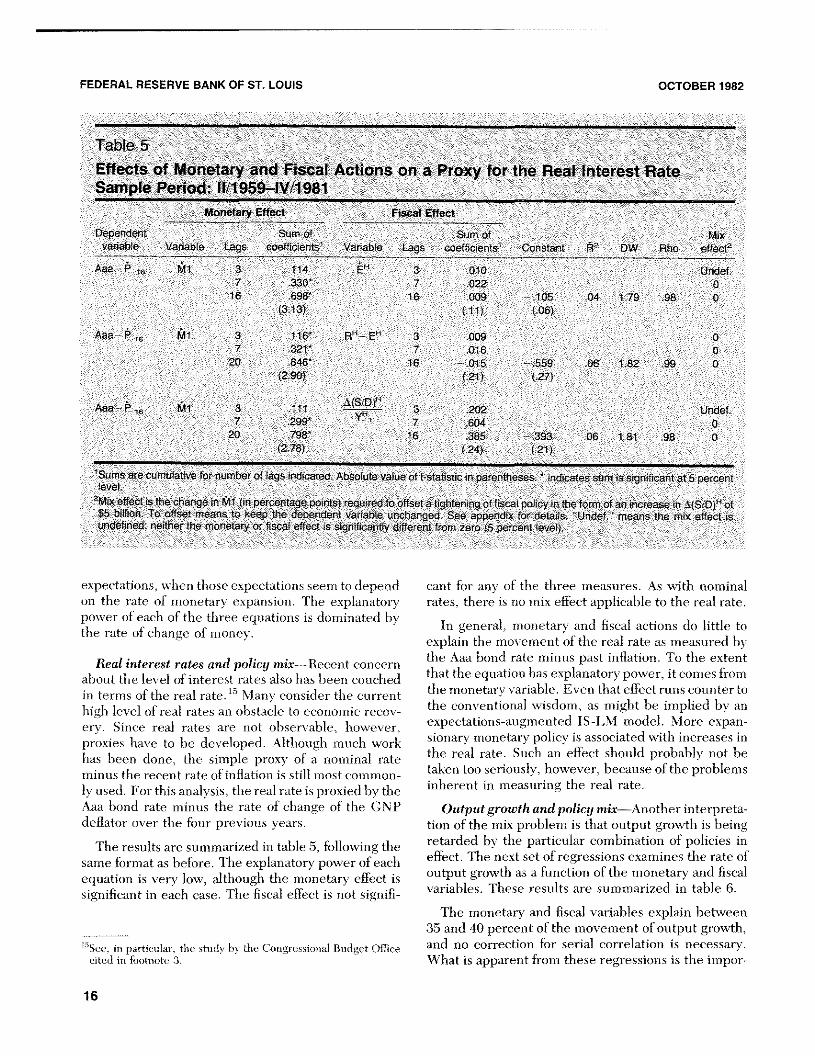
Table 5Effects of Monetary and Fiscal Actions on a Proxy for the Real Interest RateSample Period. fl11959—IV/1981
Monetary Effect Fiscal Effect
Dependent Sum of Sum of Mix
variable Variable Lags coefficIents Variable Lags coefficients Constant A2 DW Rho effecPAaa~8 f~t 3 114 E 3 010 Undef
7 S30 7 022 016 698 16 009 105 04 179 98 0
(313) (11) (06)
Aaa P, Ml 3 116* Rh.i EH 3 009 07 321 7 018 0
20 846 16 015 558 08 182 99 0(290) (21) (27)
Ma ~ ~ ttl 3 111 A(SIDr 3 202 Undef7 299 7 604 0
20 798 16 385 393 08 181 98 0(278) (.24) (21)
Sums are cumulative for riumbe of lags indicated Absolute value oft statistic in parentheses. * indicates sum issignificant at 5 percent
Mix effect is the change in M (in percentage points) requ red to offset a tightening of fiscal policy in the form of an increase in ,S(S p)ii of$5 billion To offset means to keep the dependent variable unchanged See appendix for detail Undef means the mix effect isundefined neither the monetaiy or fiscal effect s significantly different rom zero (5 percen evel)
expectations, when those expectations seem todepend cant for any of the three measures. As with nominalon the rate of monetary expansion. The explanatory rates, there is no mix effect applicable to the real rate.power of each of the three equations is dominated bythe rate of change of money. - In general, monetary and fiscal actions do little to
-- - explain the movement of the real rate as measured byReal interest rates and policy mix—Recent concern the Aaa bond rate minus past inflation. To the extent
about the level of interest rates -also has been couched that the equation has explanatory power, it comes fromin terms (if the real rate.’5 Many consider the current the monetary variable. Even that effect runs counter tohigh level of real rates an obstacle to economic recov- the conventional wisdom, as might he implied by ancry. Since real rates are not observable, however, expectations-augmented IS-LM model. More expan-proxies have to be developed. Although much work sionary monetary policy is associated with increases inhas been done, the simple proxy of a nominal rate the real rate. Such an effect should probably not beminus the recent rate of inflation is still most common- taken too seriously, however, because of the problemsly used. For this analysis, the real rate is proxiecl by the inherent in measuring the real rate.Aaa bond rate minus the rate of change of the CNP Output growth and policy mix—Another interpreta-deflator over the four previous years. tion of the mix problem is that output growth is being
The results are summarized in table 5, fbllowing the retarded by the particular combination of policies insame format as before. The explanatory power of each effect. The next set of regressions examines the rate ofequation is very low, although the monetary effect is output growth as a function of the monetary and fiscalsignificant in each case. The fiscal effect is not signifi- variables. These results are summarized in table 6.
The monetary and fiscal variables explain between
______ 35 and 40 percent of the movement of output growth,‘3See in particular, the study Iiy the Congressional Budget Office and no correction for serial correlation is necessary.
cited in footnote 3. What is apparent from these regressions is the impor-
16
FEDERAL RESERVE BANK OF St LOUIS OCTOBER 1982
Table 6Effects of Monetary and Fiscal Actions on the Rate of Output GrowthSample Period: l1f1959—IV/1981
Monetary Effect Fiscal Effect
Dependent Sum of Sum of Mix
variable Variable Lags coefficients’ Variable Lags coefficients’ Constant R DW Rho effect2
SC t~tl 3 1010* El~ 3 030 07 434 7 092 Undef.
20 001 12 307 6055 .39 2.28 NA Undef(01 (170) (483)
Sc t~ti 3 1 008 fr EH 3 .082 07 520 7 082 Undef
20 301 12 020 4506 37 220 NA Undef(161) (12) (461)
X P~ll 3 1076 3 2776 07 670 7 3129 Undef
20 278 12 945 4279 39 225 NA. Undef(156) (24) (451)
tSums are cumulative for number of lags md cated Absolute valu oft-statistic in parentheses indicates sum is significant at 5 percentlevel2Mix effect is the change in Ml (in percentage points) required to offset a tightening offiscal policy in the form of an increase in A(S
0)H of
$5 billion To offset means to keep the dependent vanable unchanged See appendix for details “Undef’~means the mix effect isundefined; neither the monetary or fiscal effect a significantly different from zero (5 percent level).
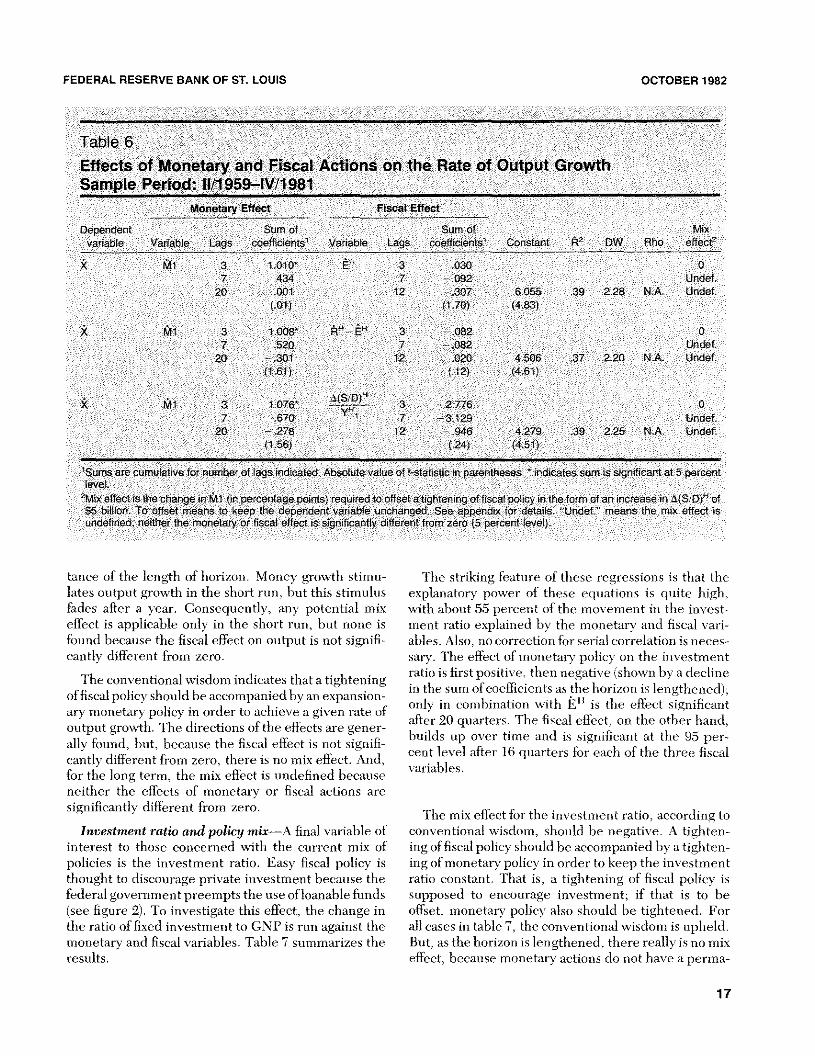
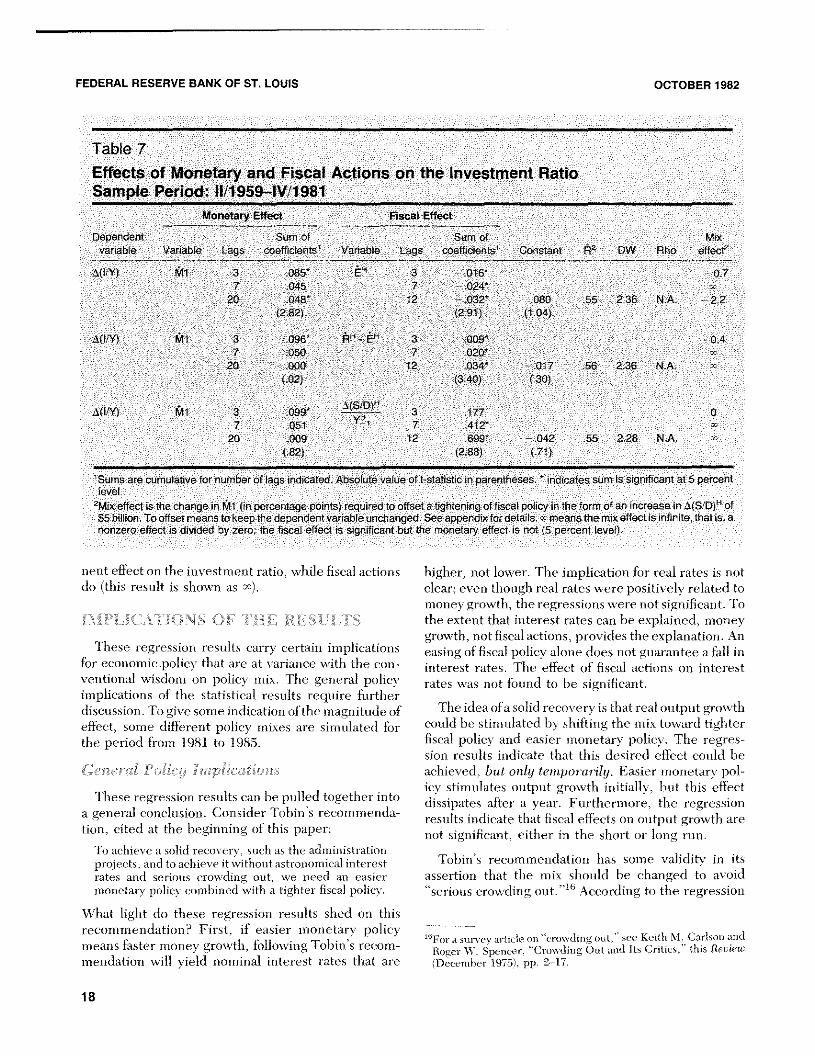
tance of the length of horizon. Money growth stimu- lime striking feature of these regressions is that thelates output growth in the short run, hut this stimulus explanatory power of these equations is quite high,fades after a year. Consequently, any potential mix with about 55 percent of the niovement in the invest-effect is applicable only in the short rmin, hut none is ment ratio explained by the monetary and fiscal van-found because the fiscal effect on output is not signifi- ables. Also, no correction for serial correlation is neces-cantly different fromn zero. sary. l’he effect of monetary policy on the investment
ratio is first positive, then negative (shown liv a declinerIse conventional wmsdom indicates that a tightening . , . . . -
in the sum ofcoefficients as the horizon is lengthened)-of fiscal policy should he accompanied by an expansion- . . . . u
only in comhmnation wmth E ms the effect signmflcantary monetary policy in order to achieve a given rate of
- . . after 20 quarters. The fiscal effect, on the other hamid,output growth. The directions of the effects are gener- . .
builds up over time and ms significant at the 9a per-ally found, lint, because the fiscal effect is not signifi-
- . , . cent level after 16 quarters for each of the three fiscalcantly different from zero, there is no mix effect. And, .~ ~ -
for the long term, the mnix effect is undefined because \-ariaoies.neither the effects of monetary or fiscal actiomms aresignificantly different from zero. .
- The mix effect for the investment ratio, according toInvestment ratio and policy mix—A final variable of conventional wisdom, should he negative. A tighten-
interest to those concerned with the current mix of ingof fiscal policy should he accompanied by a tighten-policies is the investmnent ratio. Easy fiscal policy is ingof monetary policy in order to keep the investmentthought to discourage private investment because the ratio constant. That is, a tightening of fiscal policy isfederal government preenmpts the use ofloanable funds supposed to encourage investmnemmt; if that is to he(see figure 2). To investigate this effect, the change in offset. monetary policy also should he tightened. Forthe ratio of fixed investment to GNP is run against the all cases in table 7, the conventional wisdom is upheld.monetary and fiscal variables. Table 7 summarizes the But, as the horizon is lengthened, there really is no mixresults. effect, because monetary actions do not have a perma-
17
FEDERAL RESERVE BANK OF ST. LOUIS OCTOBER1982
Table 7Effects of Monetary and Fiscal Actions on the Investment RatioSample Period: lI/1959—lVf1981
Monetary Effect Fiscal Effect
Dependent Sum of Sum of Mix
variable Variable Lags coefficients Variable Lags coefficients Constant R2 DW Rho effec9f~11 3 085* 5” 3 016* 07
7 045 7 02420 048 12 032 080 55 236 NA 22
(262) (291) (1.04)
AQ/Y) ~l 3 096k ~ E 3 009 047 050 7 020
20 000 12 034 017 56 236 N.A(.02) (340) (30)
A(ITY) t~t 3 099 3 177 07 051 7 412~
20 009 12 699 042 55 2.28 NA(.82) (288) (71)
1Sums are cumulative for number of lags indicated Absolute value oft statistic in parentheses indicates sum Is significant at 5 percentlevel
2Mix effect is the change in g11 (in percentage points) required to offset a tightening offiscal policy in the form of an increase in X(S/D)” of$5 billion To offset means to keepthe dependentvariable unchanged See appendix fordetails meansthe mix effect is infinite that is, anonzero effect is divided by zero the fiscal effect is significant but the monetary effect is not (5 percent level)
nent effect on the investnu mit ratio, while fiscal actions higher, not lower. The implication for real rates is notdo (this result is shown a ~). clear; even though real rates si-c e positively related to
money growth, the regressions were miot significant. To
the extent that interest rat s can he explained, moneygrowth, not fiscal actions, prom ides the explanation. An
These regression results carr~certaui nnplications easing of fiscal policy alone does not guarantee a fall infor economic policm that a e at maniance with the con- interest rates. The eft~ctof fiscal actions on interestventional wisdom on polic\ mix. The g mu n-il policy rates was not found to he significant.implications of the statistical results require furtherdiscussion. To give some indication ofthe magnitude of The idea (ifasolid recovery is that real output growtheffect, some different polic\ mixes are simnulati d for could be stimulated liv shifting the mix toward tighterthe period from 1981 to 1985. fiscal policy amid easier monetary policy. The regres-
sion results indicate that this desired effect could lieGem-ru! Po/Icq impheutiour achieved, but only temporarily. Easier monetary pol-
icy stimulates output gromvth initially, but this effectThese regression ii stilts can he pulled togeth r into dissip ites after a veam Furthermore the regression
a general conclusion. Consider Toliin 5 reconimenda- results indicate that fiscal effects on outliut growth aretion, cited at the heginning of this paper: not significant, either in the short or long rim.
To achieve a solid recover’-, such as the administration ,
projects, and toaclneve it ~vithoutastronomical interest Tohin s recommendation has some validity in itsrates and serious crowding out, we need an easier assertion that the mix should lie changed to avoidmonetary policy combined with a tighter fiscal policy- serious crowding out. ‘‘~~ According to the regression
What light do these regression results shed on tinsrecommendation? First, if easier monetary policy -- - ,, -
- . . ‘ “For a survey article on crowding out, see Keith NI - Carlson andmeans faster money growth, followingTohmn 5 recom- liogem W. ~pencer. Crowding Out and Its Critics.” tins Review
memsdation will yield nominal interest rates that are (D~cemnberi975), ~i~i 2-47.
18
FEDERAL RESERVE BANK OF St LOUIS OCTOBER 1982
Table 8Simulation of Alternative Policy Mixes
Easy Fiscal Policy Tight Fiscal Policy Tight Fiscal Policyand and and
Tight Monetary Policy Tight Monetary Policy Easy Monetary Policy
Corporate Aaa Bond Rate1981 Actual 14.17% 1417% 1417%1982 1426 14.28 14.391983 1301 13.26 13.781984 1137 1200 13.161985 999 1087 12.82
Growth Rate of Real GNP1981 Actual 080% 0 80% 0.80%1982 013 0.35 1361983 2,16 110 2841984 3.10 214 2.541985 3.67 3.41 2.83
Investment Ratio1981 Actual 1536% 1536% 1536%1982 1462 14,64 15001983 1396 1419 15241984 1343 1416 1548
1985 1295 1452 1573
NOTE Easy fiscal policy is a steady increase of the high employment deficit to $150 billion in fiscal 1985Tight fiscal policy is a steady movement toward a balanced high employment budget in fiscal 1985.Easy monetary policy is 6.5 percent growth rate of MlTight monetary policy is 4.5 percent growth rate of Ml
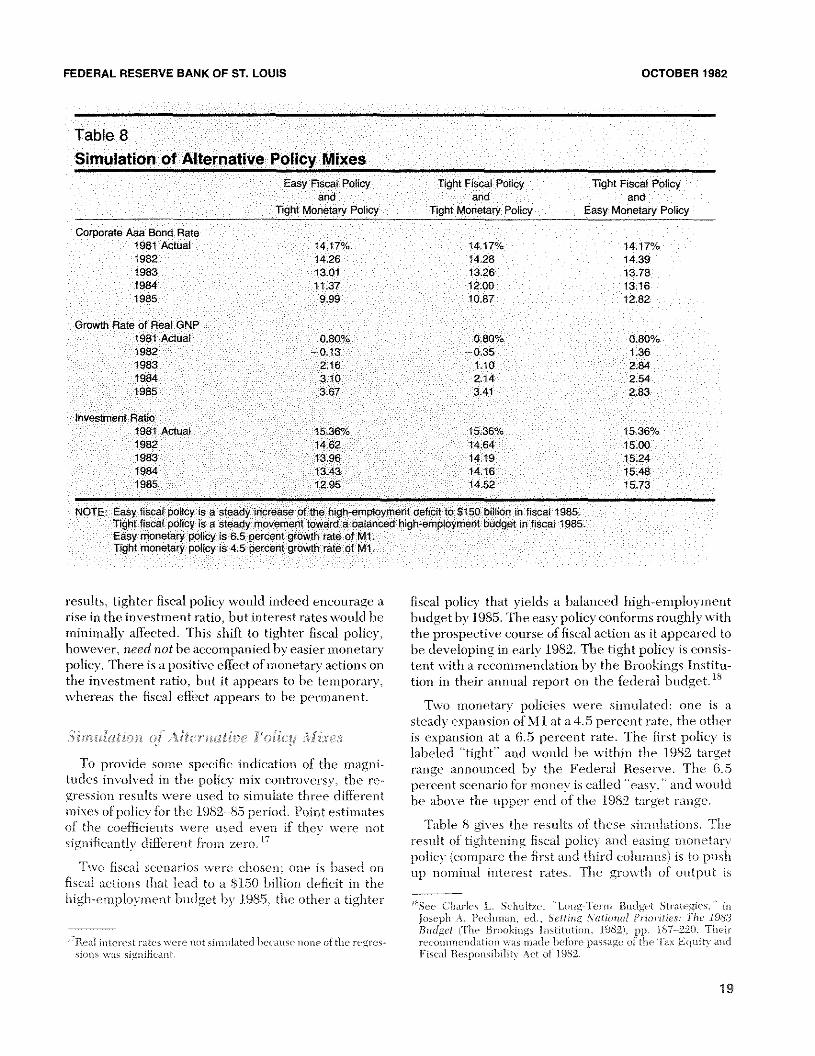
results, tighter fiscal policy would indeed encourage a fiscal policy that yields a balanced high—employmnemitrise in the investment ratio, limit interest rates would he budget by 198.5. The easy policy conforms roughlvwithmninimally affected. This shift to tighter fiscal policy, the prospective course of fiscal action as it appeared tohowever, need not be accompanied hy easier monetary he developing in early 1982. The tight policy is consis-policy. There isa positive effect of momietary actions on tent with a recouimendation liv the Brookings Institu—the investment ratio, but it appears to he temporary. tion in their annual report omi the federal liudget. 15,
whereas the fiscal effect appears to he permanent.Two monetary policies were simulated: one is a
- - steady expansion of Ml at a 4.5 liercent rate, the othere~mwuUwuof Aiternuiire Pout-u Mixes is expansion at a 6.5 percent rate. The first pohc~is
labeled “tight” and ~~‘onldhe within the 1982 targetTo provide some specific indication of the inagni— range announced by the Federal Reserve. The 6.5
tudes imivolved iii the policy miiix controversy, the re- percent scenario for money is called “easy,” and wouldgression results were used to simulate three different be above the upper end of the 1982 target range.nines of iioltc~foi the 1982—85 pcrmod Point stun itesof the coefficients were used even if they were not Table 8 gives the results of these simulations. Thesignificantly difiCrent from zero, iT ‘ result of tightening fiscal policy and easing monetary
policy (compare the first and third columns) is to pushTmvo fiscal scenarios were chosen; one is based on up nominal interest rates. The growth of output is
fiscal actions that lead to a 8150 billion deficit in thehigh—emplovmnent budget liv 1985, the other a tiahter -~ - - -. -- - - -. -
- . - , See- Chamles L. Schulize. Loug—Tei-mn Lmudge-t Strategies, inJ, iseph A - i’eeh nan - ccl - - Se U iug Net is,flu? Ps-jo m -itic-s: T/i e I
— Budge! The Brnol-ciugs lnstitutiuu, 1982s, pp. i-S7——220. Their- Real hits- -es rats-s were n,s siinn Inted I ,eeat,si- font- ofthe re-gm-es- reef ni mu en dat mc, n was m nails’ before passage of Ume Tax Equmt~andSbus was significant. Fiscal Responsihuitv -Sc-c ol 1982.
19
FEDERAL RESERVE BANK OF ST. LOUIS OCTOBER1962
actually worsenedby the change in the mix, the reasonbeing that inflation accelerates with easier monetarypolicy. The investment ratio, however, is increased bychanging the mix of policy. As the middle column oftable 8 shows, there is little to be gained by expandingmoney more rapidly when fiscal policy is tightened.Although easing monetary policy appears desirablebecause of its beneficial effects on fixed investment,recall that the long-run effects ofmoney growth on theinvestment ratio were not statistically different fromzero.
SUMMARY AND CONCLUSIONSThe notion of policy mix has been presented in
textbooks and discussed by eminentanalysts almost asif it were a self-evident truth. Arecommended changein policy mix seems to be based on the well-knownIS-LM model. When scrutinized more closely, thequestion oftheappropriate mix ofmonetary-fiscal poli-cies is not as clear-cut as the simple IS-LM modelimplies. The lagged effects of policy actions must betaken into account, as wellas the empirical realities ofcertain economic relationships.
This paper examined thur dependentvariables thatseem relevant in any discussion of policy mix—nomi-nal interest rates, real interest rates, the rate ofoutput
growth, and the investment ratio. The conclusions areas follows:
(1) Movements ofnominal interest rates and, to alesserextent, real rates are dominated by monetary actions.The effect offiscalactions on interestrates is not statisti-cally significant.
(2) There is a short-run effect of monetary actions onoutput growth, but it is only temporary. Over the longrun, movements In output growth are unaffected byeither monetary or fiscal actions.
(3) The investment ratio is influenced temporarily bymonetary actions, but the effect appears to be penna-nent for fiscal actions.
These conclusions imply that the IS-LM frameworkmust be carefully interpreted when used as a guide forpolicy analysis, and that current recommendationsfbra change in the mix are only partly valid. Fiscal policyshould indeed be lightened in order to stimulate anincrease in the investment ratio, iflong-term economicgrowth and/or housing investment is a national goal.There is little evidence, however, to support the no-tion that interest rates would be affected greatly. Thereis no basis lbr thinkingthat a tightening offiscal policyshould be accompanied by an easing of monetarypolicy. The efl~ctof easier monetary policy would behigher nominal interest rates and only a temporarysurge of output growth.
20
-TI‘iiaF,’mr
iii
(A
AppendixChange in Fiscal Policy Used in Calculating Mix Effect
Actual Fiscal Policy (High-Employment Values) Tighter Fiscal Policy (High-Employment Values)—.-—.—--— ———————--———--————.——————— -4
Receipt Expenditures Surplus/Detici Receipts Expenditures surplus/Deficit
Level Change Level Change Level Change Level Change Level Change Level Change(A
1980! $5423 $145 $5606 $251 $18.3 $108 $5423 $145 $5556 $201 $133 $58
II 5575 152 5793 187 17 34 ~575 152 569.3 137 117 16III 5801 22.8 6044 251 242 2 5801 2 6 5894 201 92 25IV 8135 334 6303 259 168 74 6135 334 6103 20.9 32 1 4
1981! 6502 367 6514 211 13 155 6502 367 626.4 161 37 205II 663.3 131 6528 4 106 119 6633 131 6228 36 40.6 189
Ill 6847 214 6804 276 43 83 6847 214 6454 226 39.3 1.3IV 6883 36 122 3 .8 40 263 6883 36 6722 268 160 233
no change $5 billion difference
For the Ii cal variables used in the regressions this change in policy translate a follows
(S/D)Hii ~H ~
1st year 3.74 +374 192nd year 328 328 18
Beyond 2nd year 328 3.28 18
0C)—I0wmI0
-S F’)