Embed Size (px)
Citation preview

U.S Monetary Policy and Foreign Bond Yields
Simon Gilchrist
Boston University
Vivian Yue
Emory University and Federal Reserve Bank of Atlanta
Egon Zakrajsek
Federal Reserve Board
Paper presented at the 15th Jacques Polak Annual Research Conference
Hosted by the International Monetary Fund
Washington, DC─November 13–14, 2014
The views expressed in this paper are those of the author(s) only, and the presence
of them, or of links to them, on the IMF website does not imply that the IMF, its
Executive Board, or its management endorses or shares the views expressed in the
paper.
1155TTHH JJAACCQQUUEESS PPOOLLAAKK AANNNNUUAALL RREESSEEAARRCCHH CCOONNFFEERREENNCCEE NNOOVVEEMMBBEERR 1133––1144,, 22001144

U.S. Monetary Policy and Foreign Bond Yields
Simon Gilchrist∗ Vivian Yue† Egon Zakrajsek‡
November 11, 2014
Abstract
This paper compares the effects of conventional U.S. monetary policy on foreign governmentbonds yields with those of the unconventional measures employed after the target federal fundsrate hit the zero lower bound in late 2008. We measure the U.S. monetary policy surprises usingnarrow-window changes in the 2-year Treasury yield bracketing FOMC announcements. Theresults indicate that an expansionary U.S. monetary policy steepens the foreign yield curve—denominated in local currency—during conventional period and flattens the foreign yield curveduring unconventional period. The passthrough of unconventional U.S. monetary policy is, onbalance, roughly comparable to that of conventional policy. We also find that a conventional U.S.monetary policy easing leads to a significant narrowing of credit spreads on dollar-denominatedsovereign bonds issued by countries with a speculative-grade sovereign credit rating. However,during the unconventional policy regime, yields on speculative-grade sovereign debt denomi-nated in dollars move one-to-one with yields on comparable Treasury securities.
JEL Classification: E4, E5, F3Keywords: conventional and unconventional U.S. monetary policy; sovereign yields and creditspreads; spillovers
We thank Chris Nealy and Argia Sbordone for helpful comments at an early stage of this project. Lucas Husted,Shaily Patel, and Rebecca Zhang provided superb research assistance. The views expressed in this paper are solelythe responsibility of the authors and should not be interpreted as reflecting the views of the Board of Governorsof the Federal Reserve System, the Federal Reserve Bank of Atlanta, or of anyone else associated with the FederalReserve System.
∗Boston University and NBER. Email: [email protected]†Emory University and Federal Reserve Bank of Atlanta. Email: [email protected]‡Federal Reserve Board of Governors. Email: [email protected]
1 Introduction
Late 2008 marks a watershed moment in the history of U.S. monetary policy. On November 25
at 8:15 a.m. EST—outside its regular meeting schedule—the Federal Open Market Committee
(FOMC) announced that it will initiate a program to purchase the direct obligations of, and
mortgage-backed securities (MBS) issued by, the housing-related government-sponsored enterprises.
A mere three weeks later, at the conclusion of its regular meeting on December 16, the FOMC an-
nounced that it is lowering the target federal funds rate to a range between 0 to 1/4 percent—its
effective lower bound. These unprecedented actions were taken in response to a mutually rein-
forcing phenomenon between a rapidly deteriorating economic outlook and escalating turmoil in
financial markets, a destructive feedback loop that soon engulfed the global economy.
The effects of these unconventional monetary policy actions—on both the real economy and
financial asset prices—soon became one of the hottest area of research in macroeconomics. In this
paper, we ask whether the Federal Reserve’s unconventional monetary policy actions had much im-
pact on asset markets beyond U.S. borders, especially on foreign bond yields and sovereign credit
spreads. A considerable body of previous research has documented the extent of spillovers in the
international bond market resulting from U.S. monetary policy (see Bredin, Hyde, and O’Reilly,
2010; Hausman and Wongswan, 2011; Ehrmann, Fratzscher, and Rigabon, 2011). To date, how-
ever, there is relatively empirical little evidence on how the strength and scope of these spillover
effects differ across conventional and unconventional policy regimes. Our aim is to systematically
quantify differences—if any—in the transmission of U.S. monetary policy to international bond
market between these two policy regimes.
To compare the transmission of conventional and unconventional policy measures to interna-
tional bond market, we follow Hanson and Stein (2012) and Gertler and Karadi (2013) and use
changes in the 2-year nominal Treasury yield on policy announcement days as a common instru-
ment across the two policy regimes. In contrast to the above two papers, we rely on the intraday
changes in the 2-year Treasury yield within a narrow window surrounding FOMC and other pol-
icy announcements to identify unanticipated U.S. policy actions.1 Implicit in this approach is the
identifying assumption that movements in shorter-term Treasury yields in a narrow window brack-
eting policy announcements are due primarily to the unanticipated changes in the stance of U.S.
monetary policy or the FOMC’s communication regarding the path for policy going forward.
During the unconventional policy regime, the Federal Reserve implemented different forms of
forward guidance regarding the future path of the federal funds rate, as well as a number of Large-
Scale Asset Purchase programs (LSAPs), the primary goal of which was to influence longer-term
yields on Treasury and MBS securities through direct purchases of those assets. These policy
actions were introduced to the public via announcements, either following the regularly-scheduled
1Hanson and Stein (2012) and Gertler and Karadi (2013) use daily changes in the 2-year Treasury yield to identifymonetary policy surprises. The use of intraday data allows us to rule out the potential reverse causality, a situationin which the daily change in the 2-year Treasury yield, even on a policy announcement day, may not reflect solelychanges in the stance of monetary policy, but also the endogenous response of policy to changes in the economicoutlook or other common shocks.
1

FOMC meetings or in special announcements outside the regular FOMC schedule. To gauge the
effects of these unconventional measures on global interest rates, we also consider a subset of policy
announcements during the unconventional policy regime that exclude direct information about the
LSAPs.
The paper contains two sets of related empirical exercises. In the first set, we analyze the
response of shorter- and longer-term interest rates on sovereign bonds denominated in local cur-
rencies to an unanticipated change in the stance of U.S. monetary policy. As alluded to earlier and
discussed more fully below, we consider three distinct U.S. monetary policy regimes: the conven-
tional policy regime; the unconventional policy regime; and a subset of the unconventional regime
that excludes FOMC announcements that were most closely associated with the Fed’s balance
sheet policies. We perform this analysis for a set of 10 advanced foreign economies and a group of
six emerging market economies.
The results from this exercise indicate that conventional U.S. monetary policy is transmit-
ted very effectively to both shorter- and longer-term bond yields of advanced foreign economies.
Although the degree of passthrough to shorter-term interest rates differs noticeably across these
countries, the passthrough of conventional monetary policy to longer-term global interest rates
is much more uniform. In comparison, U.S. unconventional monetary policy operates primarily
through the long end of the yield curve. That is, there is virtually no passthrough of unconven-
tional monetary policy to yields on shorter-term government bonds issued by the advanced foreign
economies. However, yields on longer-term securities issued by those countries react significantly
to U.S. monetary policy surprises during the unconventional policy regime. That said, the degree
of passthrough is, on balance, roughly similar to that estimated for the conventional policy regime.
Conventional U.S. monetary policy appears to have relatively little systematic effect on yields
on sovereign securities—denominated in local currencies—issued by our set of emerging market
economies. In some sense that is not too surprising, as many of these countries actively manage
their exchange rates and can intervene in foreign exchange markets to offset U.S. policy-induced
movements in their benchmark interest rates. Interestingly, however, our results indicate that U.S.
unconventional monetary policy had large effects on longer-term interest rates in emerging markets,
a finding consistent with that for advanced foreign economies.
In an effort to abstract from the policy-induced movements in exchange rates and thus more
cleanly identify the transmission of U.S. monetary policy to international bond market, our sec-
ond set of empirical exercises focuses on sovereign debt denominated is U.S. dollars. Specifi-
cally, from Thompson Reuters Datastream, we obtained daily secondary market prices of dollar-
denominated sovereign bonds issued by nearly 80 countries, both emerging market and advanced for-
eign economies. We exploit the cross-sectional heterogeneity of our data by constructing sovereign
bond portfolios, conditional on whether a country falls into a speculative- or investment-grade por-
tion of the credit quality spectrum. As a result, we are able to quantify how the effects of U.S.
monetary policy on sovereign bond yields (and spreads) differs not only across the conventional
and unconventional policy regimes, but also across “high” and “low” risk countries. An additional
2

advantage of building bond portfolios from the “ground up” is that we can construct credit spreads
that are not subject to the “duration mismatch,” a problem common to the standard sovereign
credit spread indexes, such as the EMBI or EMBI+.
The results from this set of exercises show that conventional U.S. monetary policy has eco-
nomically large and statistically significant effects on credit spreads on dollar-denominated debt
of countries with a speculative-grade credit rating. Specifically, credit spreads on risky sovereign
debt are estimated to narrow significantly in response to an unanticipated policy easing during the
conventional regime; sovereign credit spread for investment-grade countries, by contrast, are left
unchanged—that is, sovereign bond yields for low-risk countries are estimated to decline about as
much as the yields on comparable-maturity U.S. Treasury securities.
The spillovers to sovereign debt markets during the unconventional policy regime are somewhat
more muted, according to our estimates. An unanticipated easing of U.S. monetary policy during
this period induces a decline in speculative-grade sovereign bond yields that is commensurate with
that in yields on a portfolio of comparable U.S. Treasuries. Interestingly, our results indicate that
the passthrough of unconventional U.S. monetary policy to sovereign bond yields for investment-
grade countries is essentially one-to-one—the same as during the conventional policy regime. Thus,
the unconventional policy actions undertaken by the FOMC over the past five years or so did not
affect, on average, the level of sovereign credit spreads across the sovereign credit quality spectrum.
Our paper is part of a rapidly growing effort that tries to quantify empirically the effects of
unconventional policy measures on financial asset prices. To date, much of this research has focused
on the question of whether purchases of large quantities of Treasuries and MBS by the Federal
Reserve and various forms of forward guidance have lowered longer-term U.S. benchmark yields
and the associated private interest rates.2 Recent work by Rogers, Scotti, and Wright (2014), by
contrast, compares the efficacy of unconventional policy measures employed by the Bank of England,
European Central Bank, and the Bank of Japan.
To gauge the impact of LSAPs beyond U.S. borders, Neely (2010) employs an event-style
methodology and finds that these unconventional policy actions substantially lowered the foreign
exchange value of the U.S. dollar and reduced longer-term yields yields for a small sample of ad-
vanced foreign economies; Chen, Filardo, He, and Zhu (2012) report similar results for emerging
market economies. In a follow-up paper, Bauer and Neely (2012) use dynamic term structure mod-
els to parse out the extent to which the declines in foreign interest rates occurred through the
signaling or portfolio rebalancing channels and find evidence that both channels were in opera-
tion. Our paper is also related to the recent work of Fratzscher, Lo Duca, and Straub (2013), who
2See, for example, Gagnon, Raskin, Remache, and Sack (2011), Hancock and Passmore (2011, 2012)Krishnamurthy and Vissing-Jorgensen (2011); Krishnamurthy and Vissing-Jorgensen (2013) Swanson (2011),Hamilton and Wu (2012), Christensen and Rudebusch (2012), D’Amico, English, Lopez Salido, and Nelson (2012),Hanson and Stein (2012), Justiniano, Evans, Campbell, and Fisher (2012), Wright (2012), D’Amico and King (2013),Gilchrist and Zakrajsek (2013), Li and Wei (2013), Bauer and Rudebusch (2013), Nakamura and Steinsson (2013),and Gilchrist, Lopez-Salido, and Zakrajsek (2014). Although employing a variety of empirical approaches, a commonfinding that emerges from these studies is that the unconventional policy measures employed by the FOMC since theend of 2008 have led to a significant reduction in Treasury yields and that this broad-based reduction in longer-terminterest rates has been passed fully to lower borrowing costs for businesses and households.
3

systematically analyze the global spillovers of the Federal Reserve’s asset purchase programs on a
broad array of financial asset prices; their results show that these unconventional policy measures
induced a significant portfolio reallocation among investors and led to to a notable repricing of risk
in global financial markets.
The outline for the reminder of the paper is as follows: Section 2 outlines our empirical method-
ology. Section 3 contains the results that compare the effects of U.S. monetary policy on yields
on foreign government bonds denominated in local currencies across the two policy regimes. In
Section 4, we present our main results: subsection 4.1 discusses the construction of the dollar-
denominated sovereign portfolios using bond-level data; and subsection 4.2 contains the results
that compare the effects of U.S. monetary policy on sovereign credit spreads—for both speculative-
and investment-grade countries—across the different policy regimes. Section 5 concludes.
2 Empirical Framework
This section outlines the empirical approach used to estimate the impact of U.S. monetary policy
on international bond market during both the conventional and unconventional policy regimes.
Central to our approach is the use of intraday data, from which we can directly infer monetary
policy surprises associated with FOMC announcements. In combination with the daily data on
foreign interest rates, these high-frequency policy surprises allow us to estimate the causal effect of
policy actions on foreign bond yields.
Also central to our approach is the dating of the two policy regimes. The sample period
underlying our analysis runs from January 2, 1992 to May 30, 2014. We divide this period into two
distinct monetary policy regimes: (1) a conventional policy regime, a period in which the primary
policy instrument was the federal funds rate; and (2) an unconventional policy regime during which
the funds rate has been stuck at the zero lower bound, and the FOMC conducted monetary policy
primarily by altering the size and composition of the Federal Reserve’s balance sheet and by issuing
various forms of forward guidance regarding the future trajectory for the federal funds rate.
As discusses in detail by Gilchrist, Lopez-Salido, and Zakrajsek (2014), the dating of these two
regimes is relatively straightforward. We assume that the unconventional policy regime began on
November 25, 2008 and that prior to that day, the conventional policy regime was in effect. Nearly
all of the 143 announcements during the conventional policy period followed regularly-scheduled
FOMC meetings; only six were associated with the intermeeting policy moves.3 According to our
chronology, the last FOMCmeeting during the conventional policy regime took place on October 29,
2008, at which point, the FOMC lowered its target for the federal funds rate 50 basis points, to
1 percent.
3As is customary, we excluded from the sample the announcement made on September 17, 2001, which was madewhen trading on major stock exchanges resumed after it was temporarily suspended following the 9/11 terroristattacks. The other six intermeeting moves occurred on April 18, 1994; October 15, 1998; January 3, 2001; April 18,2001; January 22, 2008; and October 8, 2008. Most of the FOMC announcements took place at 2:15 p.m. (EST);however, announcements for the intermeeting policy moves were made at different times of the day. We obtained allthe requisite times from the Office of the Secretary of the Federal Reserve Board.
4

Standard characterization of changes in the stance of conventional U.S. monetary pol-
icy generally relies on a single factor—the “target” surprise or the unanticipated component
of the change in the current federal funds rate target (see Cook and Hahn, 1989; Kuttner,
2001; Cochrane and Piazzesi, 2002; Bernanke and Kuttner, 2005). However, as shown by
Gurkaynak, Sack, and Swanson (2005), this characterization is incomplete, and another factor—
changes in the future policy rates that are independent of the current target rate—is needed to
fully capture the effect of conventional monetary policy on financial asset prices. This second factor,
commonly referred to as a “path” surprise, is closely associated with the FOMC statements that
accompany changes in the target rate and represents a communication aspect of monetary policy
that assumed even greater importance after the target rate was lowered to its effective lower bound
in December 2008.
To facilitate the comparison of the spillover effects from conventional and unconventional U.S.
monetary policy, we follow Hanson and Stein (2012) and Gertler and Karadi (2013) and assume
that the change in the 2-year nominal Treasury yield over a narrow window bracketing an FOMC
announcement captures both aspects of U.S. monetary policy. Under this assumption, the effect
of unanticipated changes in the stance of U.S. monetary policy on foreign interest rates can be
inferred from
∆hyi,t+h−1(m) = βimUS
t + ǫi,t+h−1, (1)
where ∆hyi,t+h−1 denotes an h-day change (from day t− 1 to day t+ h− 1) bracketing an FOMC
announcement on day t in the yield on an m-year sovereign bond of country i; mUSt is the intraday
change in the (on-the-run) 2-year nominal Treasury yield over a narrow-window surrounding an
FOMC announcement; and ǫt is a stochastic disturbance capturing the information that possibly
was released earlier in the day as well as noise from other financial market developments that took
place through day t+ h− 1.
For the conventional U.S. policy regime, we measure the unanticipated changes in the stance
of monetary policy mUSt using a 30-minute window surrounding FOMC announcements (10 min-
utes before to 20 minutes after). The unconventional policy regime, however, includes a number
of key speeches/testimonies through which the policymakers elaborated on the various aspects of
unconventional policy measures being employed by the FOMC. In these instances, we are trying to
capture the information content of announcements that reflects the market participants’ interpreta-
tion of statements and speeches—as opposed to conveying information about the precise numerical
value of the target funds rate—so we use a wider 60-minute window bracketing an announcement
(10 minutes before to 50 minutes after) to calculate the intraday changes in the 2-year Treasury
yield. The use of a 60-minute window to calculate the policy surprise mUSt during this period should
allow the market a sufficient amount of time to digest the news contained in announcements as-
sociated with unconventional policy measures. And lastly, to separate the effect of balance sheet
policies from other forms of unconventional policy, we also consider a subsample of the unconven-
tional policy period, which excludes the 12 announcements most closely identified with the asset
purchase programs (see Table 1 for details).
5

Table 1: LSAP-Related Unconventional Monetary Policy Actions
Date Timea FOMCb Highlights
11/25/2008 08:15 N Announcement that starts LSAP-I.12/01/2008 08:15 N Announcement indicating potential purchases of Treasury securities12/16/2008 14:20 Y Target federal funds is lowered to its effective lower bound; statement
indicating that the Federal Reserve is considering using its balance sheetto further stimulate the economy; first reference to forward guidance:“... economic conditions are likely to warrant exceptionally low levels ofthe federal funds rate for some time.”
01/28/2009 14:15 Y “Disappointing” FOMC statement because of its lack of concrete languageregarding the possibility and timing of purchases of longer-term Treasuries.
03/18/2009 14:15 Y Announcement to purchase Treasuries and increase the size of purchases ofagency debt and agency MBS; also, first reference to extended period:“... interests rates are likely to remain low for an extended period ...”
08/10/2010 14:15 Y Announcement that starts LSAP-II.09/21/2010 14:15 Y Announcement reaffirming the existing reinvestment policy.11/03/2010 14:15 Y Announcement of additional purchases of Treasury securities.09/21/2011 14:15 Y Announcement of the Maturity Extension Program (MEP).06/20/2012 12:30 Y Announcement of continuation of the MEP through end of 2012.09/13/2012 12:30 Y Third “calendar-based” forward guidance: “... likely maintain the federal
funds rate near zero at least through mid-2015.” In addition, first forwardguidance regarding the pace of interest rates after lift-off: “... likelymaintain low rates for a considerable time after the economic recoverystrengthens,” and announcement of LSAP-III (flow-based; $40 billion permonth of agency MBS).
12/12/2012 12:30 Y Announcement of an increase in LSAP-III (from $40 billion to $85 billionper month);first “threshold-based” forward guidance: maintain the funds rate near zerofor as long as unemployment is above 6.5%, inflation (1–2 years ahead) isbelow 2.5%, and long-term inflation expectations remain well-anchored.
a All announcements are at Eastern Standard Time.b Y = an announcement associated with a regularly-schedule FOMC meeting; N = an intermeeting policyannouncement.
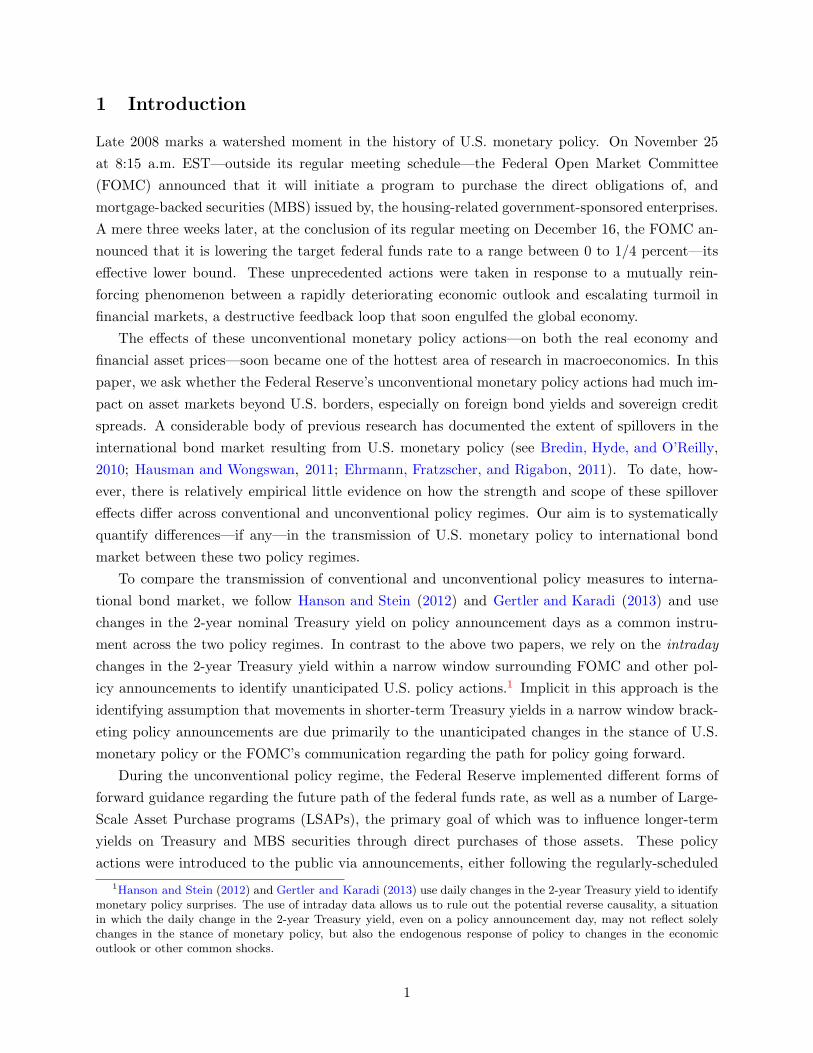
The top panel of Figure 1 shows the path of the target federal funds rate and the 2-year Treasury
yield over the entire sample period. Clearly, our sample period is marked by substantial variation in
shorter-term interest rates and contains a number of distinct phases of U.S. monetary policy: The
1994–95 tightening phase that followed the “jobless”recovery during the early 1990s; the tightening
phase that preceded the bursting of the “tech bubble” in early 2001; the subsequent easing of
policy in response to a rapid slowdown in economic activity and the emergence of substantial
disinflationary pressures; the 2003–04 period of very low interest rates; the gradual removal of
monetary accommodation that commenced in the spring of 2004; the aggressive reduction in the
target federal funds rate during the early stages of the 2007–09 financial crisis; and the period when
the federal funds rate was stuck at the zero lower bound.
The bottom panel depicts the sequence of monetary policy surprises—that is, the mUSt ’s—
associated with the FOMC’s actions during this period. During the conventional policy regime,
the largest (absolute) policy surprises are associated with the intermeeting policy actions. As
shown by the red spikes, the largest (absolute) surprises during the unconventional policy regimes
correspond to the early LSAP announcements. For all three policy regimes under consideration, we
estimate equation (1) by OLS. Implicit in this approach is the assumption that movements in the
2-year Treasury yield in narrow windows bracketing FOMC announcements are due entirely to the
6
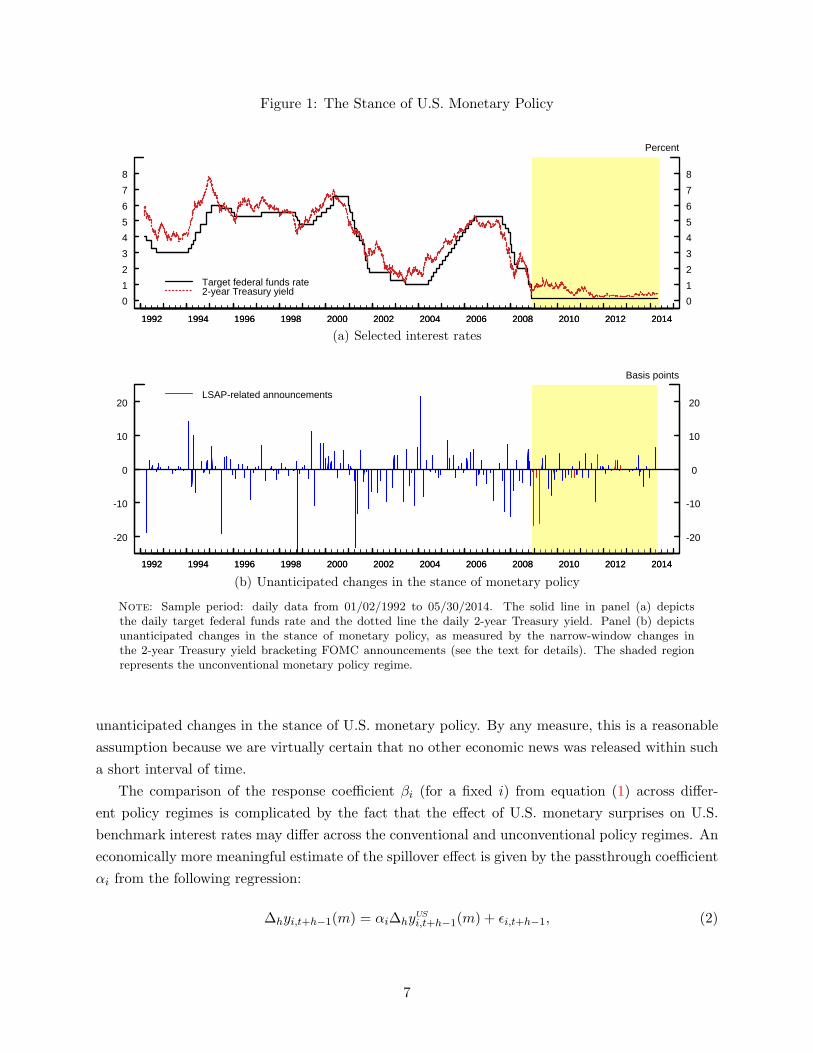
Figure 1: The Stance of U.S. Monetary Policy
0
1
2
3
4
5
6
7
8
1992 1994 1996 1998 2000 2002 2004 2006 2008 2010 2012 20141992 1994 1996 1998 2000 2002 2004 2006 2008 2010 2012 2014
0
1
2
3
4
5
6
7
8
Percent
Target federal funds rate2-year Treasury yield
(a) Selected interest rates
-20
-10
0
10
20
1992 1994 1996 1998 2000 2002 2004 2006 2008 2010 2012 20141992 1994 1996 1998 2000 2002 2004 2006 2008 2010 2012 2014
-20
-10
0
10
20
Basis points
LSAP-related announcements
(b) Unanticipated changes in the stance of monetary policy
Note: Sample period: daily data from 01/02/1992 to 05/30/2014. The solid line in panel (a) depictsthe daily target federal funds rate and the dotted line the daily 2-year Treasury yield. Panel (b) depictsunanticipated changes in the stance of monetary policy, as measured by the narrow-window changes inthe 2-year Treasury yield bracketing FOMC announcements (see the text for details). The shaded regionrepresents the unconventional monetary policy regime.
unanticipated changes in the stance of U.S. monetary policy. By any measure, this is a reasonable
assumption because we are virtually certain that no other economic news was released within such
a short interval of time.
The comparison of the response coefficient βi (for a fixed i) from equation (1) across differ-
ent policy regimes is complicated by the fact that the effect of U.S. monetary surprises on U.S.
benchmark interest rates may differ across the conventional and unconventional policy regimes. An
economically more meaningful estimate of the spillover effect is given by the passthrough coefficient
αi from the following regression:
∆hyi,t+h−1(m) = αi∆hyUS
i,t+h−1(m) + ǫi,t+h−1, (2)
7

where ∆hyUS
i,t+h−1 denotes an h-day change (from day t− 1 to day t+ h− 1) bracketing an FOMC
announcement on day t in the yield on an m-year U.S. Treasury security. Given our identifying
assumptions, a consistent estimate of the passthrough effect can be obtained via an IV regression,
where ∆hyUS
i,t+h−1 is instrumented with the policy surprise mUSt .
3 U.S. Monetary Policy and Local Currency Sovereign Yields
In this section, we analyze the effects of U.S. monetary policy shocks on the yields of foreign govern-
ment bonds denominated in local currencies. We focus on the 2- and 10-year maturities and look
at both advanced foreign and emerging market economies. The former include Australia, Canada,
Switzerland, Germany, Spain, France, Italy, Japan, Sweden, and United Kingdom, while the latter
set consists of Brazil, India, Korea, Mexico, Singapore, and Thailand. The selection of the coun-
tries is based on the data availability, particularly the coverage of the local currency denominated
government bond yields during the conventional monetary policy regime. In all specifications, we
set h, the number of days used to calculate the change in foreign bond yields, equal to 2, a choice
reflecting the timing of the daily data on foreign interest rates.
3.1 Advanced Foreign Economies
The effects of U.S. monetary policy on shorter-term foreign interest rates for advanced foreign
economies (AFEs) are presented in Table 2, while Table 3 shows the corresponding effects on
foreign longer-term bond yields. According to the column labeled “Conventional” in Table 2, a
policy-induced reduction in the 2-year U.S. Treasury yield of 10 basis points during the conventional
policy regime leads to a decline of between 3 and 10 basis points in the yields on 2-year government
bonds issued by AFEs—the exception to this pattern are Switzerland, Japan, and Sweden, where
the response coefficients to U.S. monetary shocks are statistically indistinguishable from zero.
During the conventional policy regime, the largest effect of U.S. monetary policy actions on
foreign shorter-term interest rates is in Canada, followed by the responses of Australian and U.K.
yields. During the unconventional policy regime (column labeled “Unconventional”), by contrast,
the U.S. monetary policy surprises have an effect on 2-year yields in only Australia, France, and
United Kingdom. Shorter-term interest rates for the other AFEs do not respond to the U.S. mone-
tary surprises associated with the unconventional policy actions. This result is reinforced when we
exclude the LSAP-related FOMC announcements from that period (column labeled “Non-LSAP”);
in this case, only Australian shorter-term interest rates appear to react to the U.S. monetary policy
shocks.
Table 3 presents the same analysis for longer-term foreign interest rates. During the conven-
tional policy regime, the estimated responses are economically and statistically significant for all
AFEs except Switzerland. Specifically, in response to an unanticipated conventional monetary
easing that lowers the 2-year U.S. Treasury yield 10 basis points, the 10-year foreign government
bond yields decline between 3 and 11 basis points. In combination with the results from Ta-
8

Table 2: The Effect of U.S. Monetary Policy on Shorter-Term Foreign Interest Rates(2-year Government Bond Yields for Selected Advanced Foreign Economies)
U.S. Monetary Policy Regime
Dependent Variables (2-day changes) Conventionala Unconventionalb Non-LSAPc
Australia (AU) 0.621∗∗∗ 0.875∗∗∗ 0.681∗
(0.184) (0.216) (0.376)Canada (CA) 0.972∗∗∗ 0.294 −0.010
(0.145) (0.265) (0.267)Switzerland (CH) 0.156 0.072 0.072
(0.141) (0.113) (0.195)Germany (DE) 0.364∗∗∗ 0.558∗ 0.362
(0.090) (0.320) (0.405)Spain (ES) 0.344∗∗∗ 0.396 0.667
(0.113) (0.421) (0.535)France (FR) 0.269∗∗∗ 0.642∗∗ 0.443
(0.085) (0.303) (0.383)Italy (IT) 0.428∗∗∗ 0.450 0.430
(0.095) (0.390) (0.454)Japan (JP) 0.104 0.127 −0.014
(0.068) (0.091) (0.079)Sweden (SE) 0.071 0.597 0.519
(0.146) (0.411) (0.499)United Kingdom (UK) 0.518∗∗ 0.768∗∗∗ 0.445
(0.239) (0.240) (0.289)
Note: In each specification, the dependent variable is ∆2yt+1(2), a 2-day change (from day t− 1 to day t+ 1)bracketing an FOMC announcement on day t in the 2-year government bond yield for the specified country. Theentries denote the OLS estimates of the country-specific response coefficients to a U.S. policy-induced surprisein the 2-year Treasury yield (see the text for details). All specifications include a constant (not reported).Heteroskedasticity-consistent asymptotic standard errors are reported in parentheses: * p < 0.10; ** p < 0.05;and *** p < 0.01.a 143 FOMC announcements (02/06/1992–11/24/2008).b 52 LSAP- and non-LSAP-related FOMC announcements (11/25/2008–04/30/2014).c 40 non-LSAP-related FOMC announcements (11/25-2008–04/30/2014).
ble 2, these estimates indicate that an easing of U.S. monetary policy during the conventional
period leads to a broad-based decline in foreign interest rates along the entire term structure (see
Hausman and Wongswan, 2011). At the same time, the estimated response coefficients of the 10-
year foreign bond yields are, on balance, somewhat smaller than those on their 2-year counterparts,
indicating that a conventional U.S. monetary stimulus induces a steepening of the yield curve in
most industrialized countries.
During the unconventional policy regime, longer-term bond yields of AFEs all respond signif-
icantly to U.S. monetary policy surprises. Evidently, the unconventional U.S. monetary policy
actions have been very effective in lowering the long-end of foreign yield curves across a range
of industrialized countries. In combination with the results from Table 2, this implies that an
9

Table 3: The Effect of U.S. Monetary Policy on Longer-Term Foreign Interest Rates(10-year Government Bond Yields for Selected Advanced Foreign Economies)
U.S. Monetary Policy Regime
Dependent Variables (2-day changes) Conventionala Unconventionalb Non-LSAPc
Australia (AU) 0.483∗∗∗ 1.346∗∗∗ 0.879∗∗
(0.164) (0.243) (0.375)Canada (CA) 0.435∗∗∗ 0.880∗∗∗ 0.625
(0.128) (0.255) (0.377)Switzerland (CH) 0.121 0.583∗∗∗ 0.598∗∗
(0.087) (0.146) (0.266)Germany (DE) 0.262∗∗∗ 0.723∗∗∗ 0.397
(0.100) (0.213) (0.336)Spain (ES) 0.367∗∗∗ 0.873∗∗ 1.435∗∗∗
(0.127) (0.340) (0.519)France (FR) 0.285∗∗ 0.651∗∗∗ 0.451
(0.117) (0.189) (0.319)Italy 0.366∗∗∗ 1.061∗∗∗ 1.254∗∗∗
(0.110) (0.270) (0.465)Japan (JP) 0.151∗∗ 0.217∗∗∗ 0.102
(0.065) (0.078) (0.132)Sweden (SE) 0.391∗∗ 0.916∗∗ 0.637
(0.177) (0.369) (0.499)United Kingdom (UK) 0.407∗ 0.890∗∗∗ 0.874∗∗
(0.220) (0.299) (0.382)
Note: In each specification, the dependent variable is ∆2yt+1(10), a 2-day change (from day t− 1 to day t+1)bracketing an FOMC announcement on day t in the 10-year government bond yield for the specified country. Theentries denote the OLS estimates of the country-specific response coefficients to a U.S. policy-induced surprisein the 2-year Treasury yield (see the text for details). All specifications include a constant (not reported).Heteroskedasticity-consistent asymptotic standard errors are reported in parentheses: * p < 0.10; ** p < 0.05;and *** p < 0.01.a 143 FOMC announcements (02/06/1992–11/24/2008).b 52 LSAP- and non-LSAP-related FOMC announcements (11/25/2008–04/30/2014).c 40 non-LSAP-related FOMC announcements (11/25-2008–04/30/2014).
unconventional U.S. monetary policy easing narrows the yield spread between long- and short-
term nominal foreign interest rates, a finding consistent with those reported for the U.S. by
Gilchrist, Lopez-Salido, and Zakrajsek (2014). This effect persists even when we exclude the LSAP-
related announcements from that period, though it is estimated somewhat less precisely.
Table 4 summarizes the estimates of the passthrough coefficients—to both shorter- and longer-
term foreign bond yields—of U.S. monetary policy across the different policy regimes. These
estimates quantify the extent to which U.S. policy-induced movements in the 2- and 10-year
Treasury yields are transmitted to comparable-maturity foreign bond yields and thus are directly
comparable across the different policy regimes. During the conventional policy regime, the esti-
mated passthrough coefficients for the 2-year foreign bond yields range between 0.3 (France) and
10

Table 4: The Passthrough of U.S. Monetary Policy to Foreign Interest Rates(Selected Advanced Foreign Economies)
U.S. Monetary Policy Regime
Conventionala Unconventionalb Non-LSAPc
Country 2-year 10-year 2-year 10-year 2-year 10-year
AU 0.719∗∗∗ 0.954∗∗∗ 1.411∗∗ 0.755∗∗∗ 0.902∗ 0.689∗∗
(0.195) (0.255) (0.564) (0.151) (0.508) (0.335)CA 1.125∗∗∗ 0.858∗∗∗ 0.474 0.493∗∗∗ −0.013 0.490∗∗∗
(0.113) (0.184) (0.562) (0.053) (0.347) (0.138)CH 0.198 0.239∗ 0.116 0.327∗∗∗ 0.095 0.469∗∗∗
(0.175) (0.134) (0.206) (0.067) (0.240) (0.106)DE 0.422∗∗∗ 0.517∗∗∗ 0.900 0.406∗∗∗ 0.480 0.311∗
(0.090) (0.133) (0.808) (0.092) (0.460) (0.181)ES 0.401∗∗∗ 0.673∗∗∗ 0.639 0.489∗∗ 0.884 1.124∗∗∗
(0.125) (0.191) (0.828) (0.209) (0.646) (0.430)FR 0.309∗∗∗ 0.556∗∗∗ 1.035 0.365∗∗∗ 0.587 0.354∗∗
(0.086) (0.166) (0.833) (0.094) (0.419) (0.163)IT 0.502∗∗∗ 0.722∗∗∗ 0.752 0.595∗∗∗ 0.569 0.983∗∗∗
(0.104) (0.153) (0.827) (0.186) (0.549) (0.306)JP 0.128 0.300∗∗ 0.205 0.122∗∗∗ −0.019 0.080
(0.079) (0.119) (0.219) (0.047) (0.102) (0.110)SE 0.089 0.768∗∗∗ 0.963 0.514∗∗ 0.688 0.499∗∗
(0.178) (0.277) (0.987) (0.212) (0.610) (0.225)UK 0.600∗∗ 0.803∗∗ 1.238 0.499∗∗ 0.589∗∗ 0.685∗∗∗
(0.262) (0.393) (0.823) (0.198) (0.288) (0.123)
Note: In columns labeled “2-year,” the dependent variable is ∆2yt+1(2), a 2-day change (from day t − 1 today t + 1) bracketing an FOMC announcement on day t in the 2-year government bond yield for the specifiedcountry, while in columns labeled “10-year,” the dependent variable is ∆2yt+1(10), the corresponding change inthe 10-year government bond yield. In columns labeled “2-year,” the endogenous explanatory variable is the 2-day change in the 2-year Treasury yield, while in columns labeled “10-year,” the endogenous explanatory variableis the 2-day change in the 10-year Treasury yield. The entries denote the 2SLS estimates of the country-specificpassthrough coefficients, using a U.S. policy-induced surprises in the 2-year Treasury yield as an instrument.(see the text for details): AU = Australia; CA = Canada; CH = Switzerland; DE = Germany; ES = Spain;FR =France; IT = Italy; JP = Japan; SE =Sweden; and UK = United Kingdom. All specifications include aconstant (not reported). Heteroskedasticity-consistent asymptotic standard errors are reported in parentheses:* p < 0.10; ** p < 0.05; and *** p < 0.01.a 143 FOMC announcements (02/06/1992–11/24/2008).b 52 LSAP- and non-LSAP-related FOMC announcements (11/25/2008–04/30/2014).c 40 non-LSAP-related FOMC announcements (11/25-2008–04/30/2014).
1.3 (Canada), the exceptions being Switzerland, Japan, and Sweden, countries for which the esti-
mated conventional U.S. policy passthrough is economically and statistically indistinguishable from
zero. Thus only Canada experiences a complete passthrough of conventional U.S. monetary policy
at the short-end of the yield curve, a result reflecting close economic ties between the two countries.
The passthrough of conventional U.S. monetary policy onto longer-term foreign interest rates is
11

more complete, as evidenced by the fact that the estimated passthrough coefficients for the 10-year
yields are, in general, larger—though in most cases still significantly below one—than those for
the 2-year yields. Moreover, the international transmission of U.S. monetary policy to longer-term
foreign interest rates is, on average, fairly similar between the conventional and unconventional
policy regimes. Clear exceptions to this patterns are Canada and United Kingdom, two countries
for which the unconventional policy passthrough is estimated to be noticeably lower.
When we exclude the LSAP-related announcements from the unconventional policy regime, the
estimates of the passthrough coefficients to longer-term foreign interest rates generally decline, with
the exception of Spain, Italy, and the United Kingdom. It is worth noting that in the case of Spain
and Italy, the comparison of the passthrough coefficients with those for Germany indicates that
the spreads on 10-year Spanish and Italian euro-denominated bonds—relative to those of 10-year
German bunds—narrowed significantly in response to unconventional U.S. monetary policy actions
that were not explicitly focused on the Fed’s asset purchase programs.
3.2 Emerging Market Economies
We now consider the effect of U.S. monetary policy on government bond yields for selected emerging
market economies (EMEs). As shown in Tables 5–6, the spillover effects from conventional U.S.
monetary policy to EMEs are much less systematic. Focusing first on the shorter-term interest
rates (Table 5), an unanticipated conventional U.S. policy easing that lowers the 2-year Treasury
yield 10 basis points causes 2-year Mexican and Singaporean government bond yields to decline
about 5 basis points; for the other EMEs in our sample, in contrast, the effect of a conventional
U.S. policy shock is insignificant.
A similarly heterogeneous picture emerges for the U.S. monetary actions during the unconven-
tional regime. In fact, Mexico is the only country where movement in shorter-term interest rates
are in sync with the U.S. monetary policy in both the conventional and unconventional policy
regimes, a result that highlights the tight link between the Mexican and U.S. economies as well as
the Mexican exchange rate policy. However, most of the co-movement between the Mexican 2-year
bond yield and U.S. policy actions appears to reflect the LSAP-related announcements. Brazil and
Thailand are the other two countries whose shorter-term interest rates respond significantly to the
unconventional U.S. monetary policy shocks.
As shown in Table 6, longer-term interest rates for all of the EMEs in our sample responded
significantly to the unconventional U.S. monetary policy actions. This results stands in sharp con-
trast to that for the conventional policy regime, which, on balance, indicates very little sensitivity
of longer-term interest rates to conventional U.S. monetary policy shocks. In part, this divergence
could be due to the fact that for many of these countries, markets for government bonds denom-
inated in local currency were considerably less developed in the early part of our sample period.
As a result, limited liquidity in these markets might be biasing the response coefficients toward
zero during the conventional policy regime. Aside from those concerns, our estimates imply that
during the unconventional monetary policy regime, U.S. monetary policy announcements prompted
12

Table 5: The Effect of U.S. Monetary Policy on Shorter-Term Foreign Interest Rates(2-year Government Bond Yields for Selected Emerging Market Economies)
U.S. Monetary Policy Regime
Dependent Variables (2-day changes) Conventionala Unconventionalb Non-LSAPc
Brazil (BR) 1.220 1.750∗∗∗ 1.440∗
(1.299) (0.407) (0.758)India (IN) 0.145 0.306 0.819
(0.159) (0.336) (0.845)Korea (KR) −0.103 0.568 1.008∗∗∗
(0.105) (0.384) (0.337)Mexico (MX) 0.678∗∗∗ 0.946∗∗ 0.556
(0.190) (0.411) (0.497)Singapore (SG) 0.416∗∗∗ 0.129 0.205
(0.120) (0.112) (0.196)Thailand (TH) 0.161 1.035∗∗ 0.862∗∗
(0.129) (0.435) (0.326)
Note: In each specification, the dependent variable is ∆2yt+1(2), a 2-day change (from day t− 1 to day t+ 1)bracketing an FOMC announcement on day t in the 2-year government bond yield for the specified country. Theentries denote the OLS estimates of the country-specific response coefficients to a U.S. policy-induced surprisein the 2-year Treasury yield (see the text for details). All specifications include a constant (not reported).Heteroskedasticity-consistent asymptotic standard errors are reported in parentheses: * p < 0.10; ** p < 0.05;and *** p < 0.01.a 143 FOMC announcements (02/06/1992–11/24/2008).b 52 LSAP- and non-LSAP-related FOMC announcements (11/25/2008–04/30/2014).c 40 non-LSAP-related FOMC announcements (11/25-2008–04/30/2014).
significant movements in longer-term interest rates across EMEs.
Table 7 shows the passthrough coefficients of U.S. monetary policy to both shorter- and longer-
term interest rates for these EMEs. Under the conventional policy regime, the implied passthrough
is only significant for Mexico and Singapore for the 2-year bond yields. For the unconventional
policy regime, our estimates point to substantial spillover effects, especially for longer-term bond
yields. However, compared with the AFEs, the passthrough of U.S. monetary policy onto local cur-
rency denominated government bond yields for EMEs is far more idiosyncratic, likely reflecting the
shallowness of local currency government bond markets, shorter sample period, and the relatively
inflexible exchange rate regimes for many of these countries.
4 U.S. Monetary Policy and Dollar-Denominated Sovereign Yields
4.1 Data Sources and Methods
To abstract from the policy-induced movements in exchange rates that confound the response of
yields on foreign bonds denominated in local currencies, this section focuses on sovereign debt
denominated is U.S. dollars. To that purpose, we downloaded from Thompson Reuters Datastream
13

Table 6: The Effect of U.S. Monetary Policy on Longer-Term Foreign Interest Rates(10-year Government Bond Yields for Selected Emerging Market Economies)
U.S. Monetary Policy Regime
Dependent Variables (2-day changes) Conventionala Unconventionalb Non-LSAPc
Brazil (BR) 3.429∗∗∗ 2.299∗∗∗ 2.313(1.198) (0.525) (1.433)
India (IN) 0.231∗∗∗ 0.839∗∗∗ 0.791∗∗∗
(0.087) (0.308) (0.313)Korea (KR) −0.057 0.864∗∗∗ 0.739∗∗
(0.121) (0.145) (0.303)Mexico (MX) 0.506∗ 1.513∗∗ 1.563∗∗
(0.282) (0.631) (0.783)Singapore (SG) 0.146 0.642∗∗∗ 1.044∗∗
(0.115) (0.234) (0.409)Thailand (TH) 0.455∗∗ 1.729∗∗∗ 1.950∗∗
(0.176) (0.428) (0.884)
Note: In each specification, the dependent variable is ∆2yt+1(1), a 2-day change (from day t− 1 to day t+ 1)bracketing an FOMC announcement on day t in the 10-year government bond yield for the specified country. Theentries denote the OLS estimates of the country-specific response coefficients to a U.S. policy-induced surprisein the 2-year Treasury yield (see the text for details). All specifications include a constant (not reported).Heteroskedasticity-consistent asymptotic standard errors are reported in parentheses: * p < 0.10; ** p < 0.05;and *** p < 0.01.a 143 FOMC announcements (02/06/1992–11/24/2008).b 52 LSAP- and non-LSAP-related FOMC announcements (11/25/2008–04/30/2014).c 40 non-LSAP-related FOMC announcements (11/25-2008–04/30/2014).
daily secondary market prices of dollar-denominated sovereign bonds issued by nearly 80 countries
(see Table A-1 in Appendix A for details). The micro-level aspect of our data allows us to construct
credit spreads free of the “duration mismatch,” a problem common to many of the standard credit
spread indexes. We do so by constructing a synthetic Treasury security that exactly replicates the
cash-flows of the corresponding sovereign debt instrument.
Formally, consider a dollar-denominated sovereign bond k (issued by country i) that at time t
is promising a sequence of cash-flows denoted by {C(s) : s = 1, 2, . . . , S}.4 The price of this bond
is given by
Pit[k] =S∑
s=1
C(s)D(ts),
where D(t) = e−rtt is the discount function in period t. To calculate the price of the corre-
sponding synthetic Treasury security—denoted by P USt [k]—we discount the cash-flow sequence
{C(s) : s = 1, 2, . . . , S} using continuously-compounded zero-coupon Treasury yields in period
t, obtained from the U.S. Treasury yield curve estimated daily by Gurkaynak, Sack, and Wright
4The cash-flow sequence {C(s) : s = 1, 2, . . . , S} consists of the regular coupon payments and the repayment ofthe principle at maturity.
14

Table 7: The Passthrough of U.S. Monetary Policy to Foreign Interest Rates(Selected Emerging Market Economies)
U.S. Monetary Policy Regime
Conventionala Unconventionalb Non-LSAPc
Country 2-year 10-year 2-year 10-year 2-year 10-year
BR 1.781 16.757 2.822∗ 1.223∗∗∗ 1.908∗ 2.813(1.769) (29.156) (1.548) (0.366) (0.967) (2.019)
IN 0.231 0.588∗ 0.528 0.471∗∗ 1.162 0.620∗∗
(0.250) (0.309) (0.649) (0.205) (1.263) (0.313)KR −0.151 −0.144 0.916 0.485∗∗∗ 1.355∗∗ 0.579∗∗∗
(0.160) (0.329) (0.926) (0.089) (0.588) (0.196)MX 0.883∗∗∗ 0.902 1.525 0.849∗∗ 0.736 1.225∗∗∗
(0.313) (0.623) (1.142) (0.427) (0.541) (0.464)SG 0.584∗∗∗ 0.390 0.208 0.360∗∗ 0.271 0.818∗∗∗
(0.156) (0.306) (0.211) (0.158) (0.219) (0.246)TH 0.235 1.224∗ 1.649 0.970∗∗∗ 1.098∗∗ 1.528∗∗∗
(0.184) (0.655) (1.351) (0.305) (0.545) (0.454)
Note: In columns labeled “2-year,” the dependent variable is ∆2yt+1(2), a 2-day change (from day t − 1 today t + 1) bracketing an FOMC announcement on day t in the 2-year government bond yield for the specifiedcountry, while in columns labeled “10-year,” the dependent variable is ∆2yt+1(10), the corresponding change inthe 10-year government bond yield. In columns labeled “2-year,” the endogenous explanatory variable is the 2-day change in the 2-year Treasury yield, while in columns labeled “10-year,” the endogenous explanatory variableis the 2-day change in the 10-year Treasury yield. The entries denote the 2SLS estimates of the country-specificpassthrough coefficients, using a U.S. policy-induced surprises in the 2-year Treasury yield as an instrument.(see the text for details): BR = Brazil; IN = India; KR = Korea; MX = Mexico; SG = Singapore; and TH =Thailand. All specifications include a constant (not reported). Heteroskedasticity-consistent asymptotic standarderrors are reported in parentheses: * p < 0.10; ** p < 0.05; and *** p < 0.01.a 143 FOMC announcements (02/06/1992–11/24/2008).b 52 LSAP- and non-LSAP-related FOMC announcements (11/25/2008–04/30/2014).c 40 non-LSAP-related FOMC announcements (11/25-2008–04/30/2014).
(2007). The resulting price P USt [k] can then be used to calculate the yield—denoted by yUS
t [k]—of a
hypothetical Treasury security with exactly the same cash-flows as the underlying sovereign bond.
The resulting credit spread sit[k] = yit[k] − yUSt [k], where yit[k] denotes the yield of the sovereign
bond k, is thus free of the bias that would occur were the spreads computed simply by matching
the corporate yield to the estimated yield of a Treasury security of the same maturity.5
Table 8 contains summary statistics for the key characteristics of bonds in our sample. An
average country in our sample has almost 17 sovereign bond issues outstanding at any point in
time. This distribution, however, is skewed significantly to the right by a few countries that have a
very large number of issues trading in the secondary market at a point in time. In fact, the median
5To ensure that our results are not driven by a small number of extreme observations, we eliminated all observationswith credit spreads of less that −50 basis points and more than 3, 000 basis points. In addition, we dropped from oursample very small sovereign debt issues (par value of less than $1 million in 2005 dollars) and all observations witha remaining term-to-maturity of less than one year or more than 30 years. These selection criteria yielded a sampleof 1,278 individual securities for the period between 01/01/1992 and 05/30/2014.
15

Table 8: Selected Sovereign Bond Characteristics(Dollar-Denominated Sovereign Bonds)
Bond Characteristic Mean StdDev Min Median Max
No. of bonds per country 16.50 51.44 1 6 450Maturity at issue (years) 12.64 7.76 2 10 30Term to maturity (years) 7.01 4.95 1.00 5.85 30.00Duration (years) 5.63 3.32 0.91 5.06 18.87Par amount ($millions)a 766.62 946.96 1.06 429.85 11,209Sovereign credit rating (Moody’s) . . Ca A1 AaaCoupon rate (pct.) 4.20 3.51 0.00 4.50 13.63Nominal yield to maturity (pct.) 4.93 3.22 0.11 4.31 36.57Credit spread (bps.) 205 269 −50 107 3,000
Note: Sample period: daily data from 01/01/1992 to 05/30/2014. No. of bonds = 1,287; No. ofcountries = 78; Obs = 1,474,612; see Table A-1 for a list of countries included in the sample. Allstatistics are based on trimmed data (see the text for details).a The par amount issued is deflated by the CPI (2005 = 100).
country has only six such issues trading in any given day.
The size distribution of the sovereign bond issues is similarly skewed, with the range running
from $1.6 million to more than $11 billion. The maturity of these debt instruments is fairly long,
with the average maturity at issue of almost 13 years. In terms of default risk—at least as measured
by the Moody’s sovereign credit ratings—our sample spans a significant portion of the credit-quality
spectrum. At “A1,” however, the median observation is well within the investment-grade category.
An average sovereign bond in our sample has an expected return of 205 basis points more than
a comparable Treasury security, while the standard deviation of 270 basis points reflects the wide
range of credit quality in our sample.
We exploit the cross-sectional heterogeneity of our data by constructing daily sovereign bond
portfolios, conditional on whether issuing country has a speculative- or investment-grade sovereign
credit rating in the previous day. By building sovereign bond portfolios from the “ground up,”
we can also construct portfolios of corresponding Treasury securities, again conditional on the
sovereign’s credit rating.6 The difference between these portfolio yields provides a measure of
the spread on the sovereign yield relative to the yield on U.S. Treasuries with matched payout
characteristics. As shown in Figure 2, there is considerable cross-sectional and time-series variation
in the sovereign bond portfolios in both credit rating categories.
4.2 Results
We begin by discussing the effect of a U.S. monetary policy surprise on sovereign yields and the
yields for the matched U.S. Treasury portfolios. Specifically, we use OLS to estimate the following
6All portfolios are weighted by the market value of the underlying bond issues.
16

Figure 2: Sovereign Credit Spreads
1992 1994 1996 1998 2000 2002 2004 2006 2008 2010 2012 2014 0
2
4
6
8
10
12
14
16Percentage points
Median
Interquartile range
(a) Speculative-grade sovereign credits
1992 1994 1996 1998 2000 2002 2004 2006 2008 2010 2012 20140
1
2
3
4
5
6Percentage points
Median
Interquartile range
(b) Investment-grade sovereign credits
Note: Sample period: weekly averages of daily data from 01/02/1992 to 05/30/2014. The solid line inpanel (a) depicts the median credit spread across country-specific portfolios of (dollar-denominated) sovereignbonds with a speculative-grade credit rating, while the shaded bands denotes the corresponding interquartile(P75 − P25) range. Panel (b) shows the same information for countries with an investment-grade sovereignrating.
system of equations:
∆hyp,t+h−1 = βpmUS
t + ǫp,t+h−1;
∆hyUS
p,t+h−1 = γpmUS
t + νp,t+h−1,
where ∆hyp,t+h−1 denotes an h-day change in the sovereign bond portfolio yield associated with
credit quality p = SG (speculative grade) and IG (investment grade) and ∆hyUS
p,t+h−1 is the corre-
sponding h-day change in the yield on a matched portfolio of U.S. Trasuries. The response of the
sovereign credit spreads to U.S. monetary policy surprises may then be directly inferred from the
difference in response between these two portfolio yields—that is, βp − γp, for p = SG and IG.
17

Table 9: The Effect of U.S. Monetary Policy and Sovereign Bond Yields(Investment- vs. Speculative-Grade Portfolio Yields)
U.S. Monetary Policy Regime
Dependent Variables (2-day changes) Conventionala Unconventionalb Non-LSAPc
Sovereign yield (SG) 0.977∗∗∗ 1.254∗∗ 0.335(0.196) (0.521) (0.885)
Sovereign yield (IG) 0.727∗∗∗ 1.374∗∗∗ 0.976∗∗
(0.100) (0.241) (0.402)Treasury yield (SG) 0.506∗∗∗ 1.597∗∗∗ 1.246∗∗∗
(0.116) (0.343) (0.417)Treasury yield (IG) 0.693∗∗∗ 1.375∗∗∗ 1.183∗∗∗
(0.111) (0.306) (0.368)
Implied credit spread responsed
Credit spread (SG) 0.471∗∗ −0.343 −0.911(0.193) (0.605) (0.950)
Credit spread (IG) 0.035 −0.001 −0.207(0.091) (0.333) (0.358)
Note: In each specification, the dependent variable is ∆2yt+1, a 2-day change (from day t − 1 to day t +1) bracketing an FOMC announcement on day t in the specified portfolio yield: SG = portfolio of (dollar-denominated) bonds issued by countries with a speculative-grade sovereign credit rating at t − 1; and IG =portfolio of (dollar-denominated) bonds issued by countries with an investment-grade sovereign credit ratingat t − 1. Treasury (SG/IG) corresponds to a 2-day change in the yield on the portfolio of synthetic Treasurysecurities of identical duration as the sovereign bonds in the (SG/IG) portfolios. The entries denote the OLSestimates of the portfolio-specific response coefficients to a U.S. policy-induced surprise in the 2-year Treasuryyield (see the text for details). All specifications include a constant (not reported). Heteroskedasticity-consistentasymptotic standard errors are reported in parentheses: * p < 0.10; ** p < 0.05; and *** p < 0.01.a 143 FOMC announcements (02/06/1992–11/24/2008).b 52 LSAP- and non-LSAP-related FOMC announcements (11/25/2008–04/30/2014).c 40 non-LSAP-related FOMC announcements (11/25-2008–04/30/2014).d The response of sovereign credit spreads for the SG and IG credit rating categories is computed as the differencebetween the estimated response of sovereign bond yields and the estimated response of Treasury yields in theportfolio of comparable-maturity Treasuries in that category.
Table 9 documents the effect of an increase in the 2-year Treasury yield during the narrow
window around a monetary policy announcement on the 2-day change in the sovereign bond yield
and its matched U.S. Treasury equivalent, for both speculative- and investment-grade sovereign
bond portfolios. We again conduct a separate analysis across the three monetary policy regimes—
conventional, unconventional, and unconventional that excludes the LSAP-related announcements.
The results in Table 9 imply that during the conventional period, a 1 percentage point monetary
policy induced increase in the 2-year U.S. Treasury yield leads to a 0.977 percentage point rise
in the yields on speculative-grade sovereign bonds and a 0.727 percentage point increase in the
yields on their investment-grade counterparts. Both of these effects are statistically significant at
the 1 percent level. The matched portfolio Treasury yield for speculative-grade sovereign bonds
increases by 0.506 percentage points over this 2-day period, while that of the investment-grade
18

bonds rises by 0.693 percentage points.
The implied credit spread response, computed as the difference between these two numbers, is
0.471 percentage points for speculative-grade sovereign bonds and 0.035 percentage points for the
investment-grade sovereign bonds. The standard errors associated with these responses imply that
the credit spread response for speculative-grade bonds is statistically significantly different from
zero at the 5 percent level, while the response for investment-grade securities is not statistically
indistinguishable from zero. Thus, during the conventional period, a U.S. monetary policy easing
that causes a 1 percentage point reduction in the 2-year Treasury yield leads to a 50 basis point de-
cline in speculative-grade sovereign credit spreads but has essentially zero impact on credit spreads
for investment-grade sovereign credits. These results are consistent with the notion that U.S. mon-
etary policy has a direct impact on global asset prices by reducing foreign investment-grade yields
one-for-one with U.S. Treasury yields and has an additional impact by reducing the credit risk
premia on speculative-grade sovereign bonds by an additional 50 basis points.
The second column of the table reports analogous results for the unconventional policy regime.
Again we observe an economically important and statistically significant response in the 2-day
change of both sovereign and matched U.S Treasury yields to the U,S. monetary policy surprise.
Consistent with our previous findings, the size of the response of both the sovereign yields and
the yields on comparable U.S. Treasuries is substantially greater than what we obtain during the
conventional period. During the unconventional regime, a U.S. monetary policy easing reduces
longer-term yields by more than short-term yields. Hence, this finding reflects the fact that portfo-
lios of Treasury securities with matched payout characteristics to speculative- and investment-grade
sovereign bonds are of significantly longer duration than the 2-year (zero-coupon) Treasury note.
Taking the difference in response between the sovereign bond yields and the matched Treasury
yields again allows us to infer the response of the credit spread of dollar-denominated sovereign
bonds to an unanticipated change in the stance of U.S. monetary policy. In contrast to the conven-
tional policy regime, there is no statistically significant decline in the credit spread on speculative-
grade sovereign bonds during the unconventional period. The response of the credit spread for
investment-grade sovereign bonds is again zero, both economically and statistically. Thus, dur-
ing the unconventional policy regime, monetary policy has a direct effect on both speculative- and
investment-grade sovereign debt by reducing yields on comparable U.S. Treasury securities that are
then transmitted one-for-one to yields on dollar-denominated sovereign bonds but has no additional
impact via a reduction in sovereign credit risk.
The third column of the table reports results for the unconventional period that excludes the
LSAP-related announcements. Excluding these announcements results in roughly similar responses
of U.S. Treasury and investment-grade sovereign bond yields to U.S. monetary policy shocks as does
the full unconventional sample. However, the coefficient on speculative-grade sovereign bonds is now
substantially muted (0.335 during the non-LSAP sample versus 1.254 for the full unconventional
sample) and is also estimated with a large degree of imprecision. The credit spread coefficient on
speculative-grade sovereign bonds is consequently large and negative but imprecisely estimated. As
19

Table 10: The Effect of U.S. Monetary Policy and Sovereign Bond Yields(Investment- vs. Speculative-Grade Portfolio Yields)
U.S. Monetary Policy Regime
Dependent Variables (6-day changes) Conventionala Unconventionalb Non-LSAPc
Sovereign yield (SG) 1.746∗∗∗ 1.358 −1.114(0.515) (1.097) (1.489)
Sovereign yield (IG) 0.725∗∗∗ 1.617∗∗∗ 1.374∗∗
(0.138) (0.409) (0.692)Treasury yield (SG) 0.316∗∗ 1.852∗∗∗ 2.092∗∗∗
(0.144) (0.234) (0.479)Treasury yield (IG) 0.455∗∗∗ 1.479∗∗∗ 1.903∗∗∗
(0.136) (0.258) (0.456)
Implied credit spread responsed
Credit spread (SG) 1.430∗∗∗ −0.493 −3.206∗∗
(0.494) (1.061) (1.300)Credit spread (IG) 0.270∗∗∗ 0.138 −0.529
(0.091) (0.393) (0.440)
Note: In each specification, the dependent variable is ∆6yt+5, a 6-day change (from day t − 1 to day t +5) bracketing an FOMC announcement on day t in the specified portfolio yield: SG = portfolio of (dollar-denominated) bonds issued by countries with a speculative-grade sovereign credit rating at t − 1; and IG =portfolio of (dollar-denominated) bonds issued by countries with an investment-grade sovereign credit ratingat t − 1. Treasury (SG/IG) corresponds to a 6-day change in the yield on the portfolio of synthetic Treasurysecurities of identical duration as the sovereign bonds in the (SG/IG) portfolios. The entries denote the OLSestimates of the portfolio-specific response coefficients to a U.S. policy-induced surprise in the 2-year Treasuryyield (see the text for details). All specifications include a constant (not reported). Heteroskedasticity-consistentasymptotic standard errors are reported in parentheses: * p < 0.10; ** p < 0.05; and *** p < 0.01.a 143 FOMC announcements (02/06/1992–11/24/2008).b 52 LSAP- and non-LSAP-related FOMC announcements (11/25/2008–04/30/2014).c 40 non-LSAP-related FOMC announcements (11/25-2008–04/30/2014).d The response of sovereign credit spreads for the SG and IG credit rating categories is computed as the differencebetween the estimated response of sovereign bond yields and the estimated response of Treasury yields in theportfolio of comparable-maturity Treasuries in that category.
a result, there is no evidence that U.S. monetary policy easing leads to a reduction in sovereign
credit spreads during the unconventional period.
Given the potentially illiquid nature of sovereign bonds, and the delayed response of Treasury
securities to the effects of monetary policy announcements, we now consider the effect of a U.S.
monetary policy surprise on the 6-day change in the sovereign bond yields and their matched U.S.
Treasury portfolios. These results are summarized in Table 10.
During the conventional regime, the response of speculative-grade sovereign yields shows a
substantially greater response at the 6-day horizon (1.746) than at the 2-day horizon (0.977). The
response of investment-grade sovereign yields, by contrast, is equal at both horizons. This suggests
that there is some price discovery or market illiquidity in the speculative-grade segment of the
sovereign debt market that dissipates over several days. In addition, the response of the yields on
20

the matched portfolios of Treasury securities shows attenuation at the 6-day horizon relative to
the 2-day horizon. As a result, the response of credit spreads to a U.S. monetary policy surprise
becomes larger in absolute value and statistically significant for both speculative- and investment-
grade sovereign bonds , when we allow for the longer horizon. A monetary policy-induced change
of 1 percentage point in the 2-year Treasury yield now implies a 1.43 percentage point narrowing of
credit spreads on speculative-grade sovereign bonds and a 0.270 percentage point decline in credit
spreads on investment-grade bonds—note that both coefficients are statistically significant at the
1 percent level.
These findings likely reflect the confluence of two factors. First, a decline in international risk-
free interest rates could lead to narrower sovereign credit spreads because it improves creditworthi-
ness of riskier countries; and second, international investors’ attempts to enhance portfolio returns in
a low interest rate environment by increasing their risk exposure could also put downward pressure
on credit spreads of riskier sovereigns. While intuitive, our results stand in sharp contrast to those
from the earlier literature, which found than an increase in U.S. shorter-term interest rates led to
a narrowing of sovereign credit spreads, especially for the EMEs (see Kamin and von Kleist, 1999;
Eichengreen and Mody, 2010; Uribe and Yue, 2006). Importantly, these papers rely on monthly or
quarterly changes in U.S. interest rates to estimate the spillover effects of U.S. monetary policy
to international bond markets. Our analysis, by contrast, highlights the advantage of using high-
frequency data to more cleanly identify the unanticipated changes in the stance of U.S. monetary
policy and trace out the causal effect of these changes on sovereign credit spreads.
During the unconventional period, the coefficient estimates imply a modest increase in the
response of both speculative- and investment-grade sovereign yields at the 6-day horizon compared
with the 2-day horizon. In contrast, there is a substantially greater response of U.S. Treasuries over
the 6-day horizon relative to the 2-day horizon. The combination of these two forces again implies no
statistically significant effect of a U.S. monetary policy surprise on sovereign credit spreads during
the unconventional policy regime. This result is further reinforced when we consider the sample
that excludes LSAP-related announcements. In fact, the coefficient estimate on speculative-grade
sovereign bonds is now large and negative (−3.21) and statistically significant at the 5 percent level.
Given the limited sample and large standard errors, we are reluctant to conclude from this evidence
that U.S. monetary policy easing causes a widening of credit spreads on speculative-grade sovereign
bonds. Nonetheless, these estimates reinforce the finding that U.S. monetary policy easings do not
lead to narrower sovereign spreads during the unconventional period, whether or not one includes
or excludes the LSAP-related announcements in the analysis.
To further examine this issue, we now consider estimates based on the micro-level data, which
allow us to control directly for potential liquidity concerns by including an interaction between
the monetary policy surprise and bond characteristics that likely influence liquidity premia. In
addition to explicitly controlling for observable liquidity characteristics, the panel data analysis
may be viewed as providing the equivalent of an equally-weighted portfolio analysis.
21
Formally, we estimate the following regression specification:
∆hsi,t+h−1[k] = βSGmUS
t × 1[RTGi,t−1 ∈ SG] + βIGmUS
t × 1[RTGi,t−1 ∈ IG] +
θ′xi,t[k]×mUS
t + ǫi,t+h−1[k],
where ∆hsi,t+h−1[k] ≡ ∆hyit[k] −∆hyUSt [k], is the h-day change in the credit spread on sovereign
bond k (issued by country i); 1[RTGi,t−1 ∈ p] is an indicator variable that equals 1 if country
i’s sovereign credit rating at t − 1 falls into the p = SG and IG credit-rating category; and xi,t[k]
is a vector of (pre-determined) observable bond characteristics that may influence the liquidity of
the issue k. Specifically, xi,t[k] consists of lnPARi[k], ln(1 + AGEi,t[k]), ln(1 + COUPi[k]), and
lnDURi,t[k], where PARi[k] is the inflation-adjusted size of the sovereign bond issue, AGEi,t[k]
is the age (in days) of the issue, COUPi[k] is the fixed coupon rate, and DURi,t[k] is the bond’s
duration. These characteristics are interacted with the policy surprise mUSt and thus control for the
fact that a portion of the credit spread response may reflect movements in liquidity premium that
is a function of the specified bond characteristics.
Table 11 reports the estimated effects of monetary policy on both the 2- and 6-day changes in
sovereign credit spreads. Consistent with the view that some part of the credit spread response
may be attributed to a liquidity premium that varies with issue size and other bond characteristics,
the panel-data estimates imply a smaller response of credit spreads to monetary policy surprises
during the conventional period relative to those obtained from the aggregate portfolio analysis.
The coefficients on the 2-day change in credit spreads for speculative-grade sovereign bonds falls
from an estimated value of 0.47, when estimated at the portfolio level, to 0.22 when estimated
using the micro data. Similarly, the coefficient estimate on the 6-day change in the response of
speculative-grade credit spread falls from 1.43 to 0.757, but nonetheless remains highly statistically
significant. In sum, the panel-data estimates do not change our conclusions regarding the lack of
any impact of U.S. monetary policy on sovereign credit spreads during the unconventional period.
To provide a more insightful comparison in results across both the conventional and unconven-
tional regime, we now compute the effective passthrough of U.S. monetary policy to sovereign bond
yields and credit spreads. The passthrough measures by how much dollar-denominated sovereign
yields respond to a monetary policy-induced change in U.S. Treasuries of comparable maturity.
Note that this can computed as the ratio of the coefficient on the sovereign yield response relative
to the response of the yield on the matched portfolio of Treasury securities that are reported in
Tables 9–10. We report these passthrough coefficients along with their standard errors in Table 12.
When we consider 2-day changes in yields, the passthrough coefficient is economically and sta-
tistically equal to one for investment-grade bonds during both the conventional and unconventional
policy regimes. The passthrough coefficient for speculative-grade sovereign bonds is 1.931 during
the unconventional period and 0.785 during the unconventional period. Although passthrough co-
efficients during the unconventional period are not different across the 2- and 6-day horizons, the
estimated passthrough is substantially greater when we consider 6-day changes relative to the 2-
day changes during the conventional period. The estimate coefficients across a 6-day change imply
22

Table 11: The Effect of U.S. Monetary Policy and Sovereign Credit Spreads(Investment- vs. Speculative-Grade Sovereign Credit Spreads)
U.S. Monetary Policy Regime
Dependent Variables Conventionala Unconventionalb Non-LSAPc
2-day changes (h = 2)Credit spread (SG) 0.222 −0.372 −0.403
(0.170) (0.302) (0.409)Credit spread (IG) −0.056 0.183 −0.109
(0.066) (0.298) (0.267)
6-day changes (h = 6)Credit spread (SG) 0.757∗∗∗ −0.292 −1.052∗∗
(0.255) (0.284) (0.428)Credit spread (IG) 0.141 −0.074 −0.096
(0.095) (0.169) (0.208)
Note: The dependent variable is ∆hsi,t+h−1[k], an h-day change (from day t− 1 to day t+ h− 1) bracketingan FOMC announcement on day t in the credit spread on (dollar-denominated) sovereign bond k issuedby country i. The entries denote the OLS estimates of the response coefficients to a U.S. policy-inducedsurprise in the 2-year Treasury yield interacted with the country’s sovereign credit rating indicator at t − 1:SG = speculative-grade sovereign credit rating; and IG = investment-grade sovereign credit rating. Theresponse coefficients are evaluated at the sample mean of the bond-specific characteristics included to controlfor liquidity of individual bond issues (see the text for details). All specifications include a constant (notreported). Robust asymptotic standard errors reported in parentheses are clustered in the i and t dimensions(see Cameron, Gelbach, and Miller, 2011): * p < 0.10; ** p < 0.05; and *** p < 0.01.a 143 FOMC announcements (02/06/1992–11/24/2008); No. of bonds = 417; No. of countries = 48; andObs = 16,040.b 52 LSAP- and non-LSAP-related FOMC announcements (11/25/2008–04/30/2014); No. of bonds = 1,038;No. of countries = 75; and Obs = 32,253.c 40 non-LSAP-related FOMC announcements (11/25-2008–04/30/2014); No. of bonds = 1,035; No. of coun-tries = 75; and Obs = 25,983.
that a monetary policy-induced reduction in Treasury yields of 10 basis points leads to 16 basis
point decline in investment-grade sovereign yields and a 55 basis point drop in speculative-grade
sovereign yields. Thus, during the conventional regime, U.S. monetary policy had an economically
large and statistically significant effect on both sovereign bond yields and corresponding credit
spreads. During the unconventional period, by contrast, U.S. monetary policy caused one-for-one
movements in comparable maturity sovereign bond yields and therefore had no discernible impact
of sovereign credit spreads.
5 Conclusion
This paper compares the effects of conventional U.S. monetary policy on foreign government bond
yields with those of the unconventional measures employed after the target federal funds rate hit the
zero lower bound. We measure the U.S. monetary policy surprises using narrow-window changes
in the 2-year Treasury yield around policy announcements. We find that during the conventional
23

Table 12: The Passthrough of U.S. Monetary Policy to Sovereign Bond Yields(Investment- vs. Speculative-Grade Portfolio Yields)
U.S. Monetary Policy Regime
Dependent Variables Conventionala Unconventionalb Non-LSAPc
2-day changes (h = 2)Sovereign yield (SG) 1.931∗∗∗ 0.785∗∗ 0.269
(0.486) (0.357) (0.709)Pr > CLRd 0.000 0.011 0.652
Sovereign yield (IG) 1.050∗∗∗ 0.999∗∗∗ 0.825∗∗∗
(0.136) (0.242) (0.286)Pr > CLR 0.000 0.000 0.004
6-day changes (h = 6)Sovereign yield (SG) 5.532∗∗∗ 0.734 −0.533
(2.592) (0.576) (0.783)Pr > CLR 0.001 0.133 0.407
Sovereign yield (IG) 1.593∗∗∗ 1.093∗∗∗ 0.722∗∗∗
(0.305) (0.271) (0.253)Pr > CLR 0.002 0.000 0.024
Note: In each specification, the dependent variable is ∆hyt+h−1, an h-day change (from day t− 1 to day t+h − 1) bracketing an FOMC announcement on day t in the specified sovereign bond portfolio yield. SG =portfolio of (dollar-denominated) bonds issued by countries with a speculative-grade sovereign credit rating att−1; and IG = portfolio of (dollar-denominated) bonds issued by countries with an investment-grade sovereigncredit rating at t − 1. The endogenous explanatory variable in each specification is the corresponding h-daychange in the yield on the portfolio of synthetic Treasury securities of identical duration as the sovereignbonds in the specified credit risk portfolios. The entries denote the 2SLS estimates of the portfolio-specificpassthrough coefficients, using a U.S. policy-induced surprise in the 2-year Treasury yield as an instrument(see the text for details). All specifications include a constant (not reported). Heteroskedasticity-consistentasymptotic standard errors are reported in parentheses: * p < 0.10; ** p < 0.05; and *** p < 0.01.a 143 FOMC announcements (02/06/1992–11/24/2008).b 52 LSAP- and non-LSAP-related FOMC announcements (11/25/2008–04/30/2014).c 40 non-LSAP-related FOMC announcements (11/25-2008–04/30/2014).d p-value for the Moreira (2003) weak instruments conditional likelihood ratio test of the null hypothesis thatthe estimated passthrough coefficient is equal to zero.
monetary policy regime, U.S. monetary policy has a significant effect on the shorter-term inter-
est rates for advanced foreign countries, while during the unconventional policy regime, the U.S.
monetary policy is more effective in moving the longer-term foreign interest rates. During the con-
ventional policy regime, expansionary U.S. monetary policy steepens, on balance, the foreign yield
curve—denominated in local currency— and flattens the foreign yield curve during unconventional
regime. On average, however, the average passthrough of unconventional policy to longer-term
foreign bond yields is roughly comparable to that of conventional policy.
To abstract from the confounding effects of policy-induced movements in exchange rates, we also
examine the response of yields on dollar-denominated sovereign bonds issued by a large sample of
24
advanced and developing countries. We conduct the analysis on both the bond portfolios—sorted
by the issuing country’s sovereign credit rating—and the micro-level bond yields. Our results
indicate that during the conventional U.S. monetary policy regime, the yields on speculative-grade
sovereign bonds decline more than one-for-one in response to an unanticipated easing of U.S.
monetary policy, implying a significant narrowing of sovereign credit spreads for riskier countries.
During the unconventional policy regime, by contrast, the response of speculative-grade sovereign
bond yields to U.S. monetary policy shocks is one-to-one.
25
References
Bauer, M. D., and C. J. Neely (2012): “International Channels of the Fed’s UnconventionalMonetary Policy,” Working Paper No. 2012-028, Federal Reserve Bank of St. Louis.
Bauer, M. D., and G. D. Rudebusch (2013): “The Signalling Channel for Federal ReserveBond Purchases,” Working Paper, Federal Reserve Bank of San Francisco.
Bernanke, B. S., and K. N. Kuttner (2005): “What Explains the Stock Market’s Reaction toFederal Reserve Policy?,” Journal of Finance, 60(3), 1221–1257.
Bredin, D., S. J. Hyde, and G. P. O’Reilly (2010): “Monetary Policy Surprises and Interna-tional Bond Markets,” Journal of International Money and Finance, 29(6), 988–1002.
Cameron, A. C., J. B. Gelbach, and D. L. Miller (2011): “Robust Inference with Multi-WayClustering,” Journal of Business and Economic Statistics, 29(2), 238–249.
Chen, Q., A. J. Filardo, D. He, and F. Zhu (2012): “International Spillovers of Central BankBalance Sheet Policies,” Discussion Paper No. 66p, Bank for International Settlements.
Christensen, J. H., and G. D. Rudebusch (2012): “The Response of Interest Rates to US andUK Quantitative Easing,” Economic Journal, 122(546), F385–F414.
Cochrane, J., and M. Piazzesi (2002): “The Fed and Interest Rates: A High-Frequency Iden-tification,” American Economic Review, Papers and Proceedings, 92(2), 90–95.
Cook, T., and T. Hahn (1989): “The Effect of Changes in the Federal Funds Rate Target onMarket Interest Rates in the 1970s,” Journal of Monetary Economics, 24(3), 331–351.
D’Amico, S., W. B. English, D. Lopez Salido, and E. Nelson (2012): “The Federal Reserve’sLarge-Scale Asset Purchase Programs: Rationale and Effects,” Economic Journal, 122(564),F415–F446.
D’Amico, S., and T. B. King (2013): “Flow and Stock Effects of Large-Scale Treasury Purchases:Evidence on the Importance of Local Supply,” Journal of Financial Economics, 108(2), 425–448.
Ehrmann, M., M. Fratzscher, and R. Rigabon (2011): “Stocks, Bonds, Money Markets, andExchange Rates: Measuring International Financial Transmission,” Journal of Applied Econo-
metrics, 26(6), 948–978.
Eichengreen, B., and A. Mody (2010): “What Explains Changing Spreads on Emerging-MarketDebt: Fundamentals or Market Sentiment?,” in The Economics of International Capital Flows,ed. by S. Edwards, pp. 107–134. The University of Chicago Press, Chicago.
Fratzscher, M., M. Lo Duca, and R. Straub (2013): “On the International Spillovers of U.S.Quantitative Easing,” Working Paper No. 1557, European Central Bank.
Gagnon, J., M. Raskin, J. Remache, and B. Sack (2011): “The Financial Market Effects ofthe Federal Reserve’s Large-Scale Asset Purchases,” International Journal of Central Banking,7(1), 3–43.
Gertler, M., and P. Karadi (2013): “Monetary Policy Surprises, Credit Costs, and EconomicActivity,” Forthcoming in the American Economic Journal: Macroeconomics.
26

Gilchrist, S., D. Lopez-Salido, and E. Zakrajsek (2014): “Monetary Policy and RealBorrowing Costs at the Zero Lower Bound,” Forthcoming in the American Economic Journal:
Macroeconomics.
Gilchrist, S., and E. Zakrajsek (2013): “The Impact of the Federal Reserve’s Large-ScaleAsset Purchase Programs on Corporate Credit Risk,” Journal of Money, Credit, and Banking,45(s2), 29–57.
Gurkaynak, R. S., B. Sack, and E. Swanson (2005): “Do Actions Speak Louder Than Words?The Response of Asset Prices to Monetary Policy Actions and Statements,” International Journal
of Central Banking, 1(1), 55–93.
Gurkaynak, R. S., B. Sack, and J. H. Wright (2007): “The U.S. Treasury Yield Curve: 1961to the Present,” Journal of Monetary Economics, 54(8), 2291–2304.
Hamilton, J. D., and J. C. Wu (2012): “The Effectiveness of Alternative Monetary Policy Toolsin a Zero Lower Bound Environment,” Journal of Money, Credit, and Banking, 44(s1), 3–46.
Hancock, D., and W. Passmore (2011): “Did the Federal Reserve MBS Purchase ProgramLower Mortgage Rates?,” Journal of Monetary Economics, 58(5), 498–518.
(2012): “The Federal Reserve’s Portfolio and Its Effects on Mortgage Markets,” Financeand Economics Discussion Series Paper 2012-22, Federal Reserve Board.
Hanson, S. G., and J. C. Stein (2012): “Monetary Policy and Long-Term Real Rates,” Forth-coming in the Journal of Financial Economics.
Hausman, J., and J. Wongswan (2011): “Global Asset prices and FOMC Announcements,”Journal of International Money and Finance, 30(3), 547–571.
Justiniano, A., C. L. Evans, J. R. Campbell, and J. D. Fisher (2012): “MacroeconomicEffects of FOMC Forward Guidance,” Brookings Papers on Economic Activity, 44(Spring), 1–80.
Kamin, S. B., and K. von Kleist (1999): “The Evolution and Determinants of Emerging MarketCredit Spreads in the 1990s,” BIS Quarterly Review, November, 36–44.
Krishnamurthy, A., and A. Vissing-Jorgensen (2011): “The Effects of Quantitative Easingon Interest Rates: Channels and Implications for Policy,” Brookings Papers on Economic Activity,Fall, 215–265.
Krishnamurthy, A., and A. Vissing-Jorgensen (2013): “The Ins and Outs of Large-ScaleAsset Purchases,” Paper presented at the Jackson Hole Economic Symposium on ”Global Di-mensions of Unconventional Monetary Policy,” Federal Reserve Bank of Kansas City.
Kuttner, K. N. (2001): “Monetary Policy Surprises and Interest Rates: Evidence From the FedFunds Futures Market,” Journal of Monetary Economics, 47(3), 523–544.
Li, C., and M. Wei (2013): “Term Structure Modeling With Supply Factors and the FederalReserve’s Large-Scale Asset Purchase Programs,” International Journal of Central Banking, 9(1),3–39.
Moreira, M. J. (2003): “A Conditional Likelihood Ratio Test For Structural Models,” Econo-
metrica, 71(4), 1027–1048.
27

Nakamura, E., and J. Steinsson (2013): “High-Frequency Identification of Monetary Non-Neutrality,” NBER Working Paper No. 19260.
Neely, C. J. (2010): “The Large-Scale Asset Purchases had Large International Effects,” WorkingPaper No. 2010-018, Federal Reserve Bank of St. Louis.
Rogers, J. H., C. Scotti, and J. H. Wright (2014): “Evaluating Asset-Market Effects of Un-conventional Monetary Policy: A Cross-Country Comparison,” International Finance Discussionpaper No. 1101, Federal Reserve Board.
Swanson, E. T. (2011): “Let’s Twist Again: A High-Frequency Event-Study Analysis of Op-eration Twist and Its Implications for QE2,” Brookings Papers on Economic Activity, Spring,151–188.
Uribe, M., and V. Z. Yue (2006): “Country Spreads and Emerging Countries: Who DrivesWhom?,” Journal of International Economics, 69(1), 6–36.
Wright, J. H. (2012): “What Does Monetary Policy Do to Long-Term Interest Rates at the ZeroLower Bound?,” Economic Journal, 122(546), F447–F466.
28

Appendices
A Data Appendix
Table A-1: Sample Composition
Country Name Country Code IFSC Start Date End Date No. of Bonds Obs.
United Kingdom GBR 112 07/30/2009 05/07/2013 7 2,756Austria AUT 122 05/19/2004 05/30/2014 15 10,717Belgium BEL 124 01/01/1992 05/30/2014 19 27,514Denmark DNK 128 07/30/2009 05/30/2014 8 3,113Italy ITA 136 01/01/1992 05/30/2014 49 59,443Netherlands NLD 138 02/24/2012 05/30/2014 4 2,078Norway NOR 142 01/01/1992 04/12/1996 6 2,076Sweden SWE 144 01/02/2001 05/30/2014 36 21,429Canada CAN 156 02/14/2012 05/30/2014 3 790Japan JPN 158 01/01/1992 05/30/2014 75 96,789Finland FIN 172 01/01/1992 05/30/2014 23 23,203Greece GRC 174 05/24/1994 09/12/2011 21 8,871Iceland ISL 176 01/02/2001 05/30/2014 6 4,102Ireland IRL 178 01/01/1992 07/15/2009 6 8,923Portugal PRT 182 09/08/1999 03/25/2014 3 3,142Spain ESP 184 09/23/1992 05/30/2014 15 14,215Turkey TUR 186 05/05/1992 05/30/2014 29 39,816Australia AUS 193 07/30/2009 05/30/2014 1 1,262New Zealand NZL 196 01/01/1992 05/30/2014 10 15,740South Africa ZAF 199 12/12/1994 05/30/2014 11 19,712Argentina ARG 213 10/01/1992 05/30/2014 12 13,294Bolivia BOL 218 10/29/2012 05/30/2014 4 1,234Brazil BRA 223 05/15/1994 05/30/2014 26 52,249Chile CHL 228 10/16/2001 05/30/2014 6 7,991Colombia COL 223 10/11/1996 05/30/2014 17 38,274Costa Rica CRI 238 07/30/2009 05/30/2014 5 2,314El Salvador SLV 253 10/25/2002 05/30/2014 5 6,150Guatemala GTM 258 06/06/2012 05/30/2014 4 1,712Honduras HND 268 03/15/2013 05/30/2014 4 872Mexico MEX 273 03/03/1993 05/30/2014 17 31,275Panama PAN 283 05/11/1997 05/30/2014 9 20,436Paraguay PRY 288 01/25/2013 05/30/2014 2 702Peru PER 293 11/26/2002 05/30/2014 6 13,101Uruguay URY 298 11/18/2005 05/30/2014 3 3,654Venezuela VEN 299 01/01/1992 05/30/2014 28 47,703Bahamas BHS 313 11/20/2009 05/30/2014 4 2,556Barbados BRB 316 01/02/2001 05/30/2014 5 7,868Bermuda BMU 319 07/20/2010 05/30/2014 6 3,444Jamaica JAM 343 12/19/2001 05/30/2014 7 12,857Trinidad & Tobago TTO 369 01/02/2009 05/30/2014 3 1,651Cayman Islands CYM 377 11/24/2009 05/30/2014 2 2,357South Korea KOR 410 04/09/1998 05/30/2014 60 65,464Cyprus CYP 423 01/29/1998 06/26/2001 1 889Israel ISR 436 05/10/2000 05/30/2014 450 505,116Jordan JOR 439 11/12/2010 05/30/2014 2 1,078Quatar QAT 453 04/09/2009 05/30/2014 9 8,713Egypt EGY 469 07/02/2001 05/30/2014 5 5,311Sri Lanka LKA 524 11/04/2010 05/30/2014 11 6,557Hong Kong HKG 532 07/22/2004 08/01/2013 2 4,712
29

Table A-1: Sample Composition (continued)
Country Name Country Code IFSC Start Date End Date No. of Bonds Obs.
India IND 534 02/25/2004 05/07/2014 14 13,744Indonesia IDN 536 03/20/2004 05/30/2014 29 33,550Malaysia MYS 548 05/28/1999 07/15/2010 2 4,705Pakistan PAK 564 02/12/2004 05/30/2014 5 7,830Philippines PHL 566 11/23/1996 05/30/2014 15 32,448Thailand THA 578 12/23/2005 09/28/2012 1 1,766Vietnam VNM 582 11/03/2005 05/30/2014 4 6,735Ghana GHA 652 07/26/2013 05/30/2014 4 868Morocco MAR 686 11/12/2012 05/30/2014 2 768Senegal SEN 722 05/05/2011 05/30/2014 3 2,278Namibia NAM 728 11/03/2011 05/30/2014 2 1,344Fiji FJI 819 07/30/2009 09/12/2011 2 1,132Belarus BLR 913 08/03/2010 05/30/2014 2 1,872Albania ALB 914 11/01/2010 05/30/2014 1 935Georgia GEO 915 10/06/2010 05/30/2014 3 2,036Kazakhstan KAZ 916 12/11/1996 11/10/2006 5 5,263Bulgaria BGR 918 04/10/2002 01/15/2014 2 6,142Russia RUS 922 11/22/1996 05/30/2014 25 33,363China CHN 924 07/05/1996 05/21/2010 4 6,762Ukraine UKR 926 11/20/2001 05/30/2014 32 27,699Latvia LVA 941 06/16/2011 05/30/2014 6 3,496Hungary HUN 944 02/03/2005 05/30/2014 7 5,963Lithuania LTU 946 10/15/2009 05/30/2014 9 8,194Mongolia MNG 948 12/05/2012 05/30/2014 4 1,552Croatia HRV 960 02/12/1997 05/30/2014 13 9,093Slovenia SVN 961 07/25/1996 05/30/2014 11 3,284Poland POL 964 06/30/1995 05/30/2014 10 13,331Serbia SRB 965 07/15/2013 05/30/2014 6 1,178Romania ROU 968 02/07/2012 05/30/2014 6 2,056
Note: No. of bonds = 1,278; No. of countries = 78; Obs. = 1,474,612. Bonds in default are excluded.
30