Embed Size (px)
Citation preview

Standing Committee of Analysts
The Microbiology of Water and Associated Materials (2017)
Practices and Procedures for Laboratories
Methods for the Examination of Waters and Associated Materials

2

The Microbiology of Waters and Associated Materials (2017) - Practices and procedures for laboratories Methods for the Examination of Waters and Associated Materials This booklet contains details of practices and procedures that should be adopted within laboratories undertaking microbiological examinations of drinking waters, environmental and recreational waters and sewage sludge. This document replaces the Microbiology of Drinking Water (2002) - Part 3 - Practices and procedures for laboratories. Whilst specific commercial products may be referred to in this document, this does not constitute an endorsement of these products but serves only as an illustrative example of the type of products available. Equivalent products are available and it should be understood that the performance of the method might differ when other materials are used and all should be confirmed by validation of the method.
3

This booklet provides details of practices and procedures for application in laboratories conducting microbiological testing of water and associated materials. It applies to three themed series consisting of separate booklets, each of which deals with different topics concerning the microbiology of water and associated materials. These series of booklets include The Microbiology of Drinking Water (2002 onwards) A series comprising thirteen individual parts The Microbiology of Recreational and Environmental Waters (2015) A series comprising thirteen individual parts The Microbiology of Sewage Sludge (2003 onwards) A series comprising four individual parts
4

The Microbiology of Water and Associated Materials: Practices and Procedures for Laboratories Contents About this series 8 Warning to users 8 Glossary 9 Practices and procedures for laboratories 11 1 Introduction and scope 11 2 The quality manual 12 3 Laboratory staff 13
3.1 Staff training and records 14 3.2 On-going competency and development 15
4 General laboratory environment 15 4.1 Laboratory Organisation 15 4.2 Environmental monitoring 15 4.3 Management and disposal of waste 17
5 Laboratory equipment 18 5.1 Autoclaves 18 5.2 Balances and gravimetric devices 20 5.3 Centrifuges 20 5.4 Colony counting devices 20 5.5 Dry heat sterilising ovens 21 5.6 Filtration systems 21 5.7 Flow cytometry 22 5.8 Gas burners 22 5.9 Glassware 23 5.10 Glass washers 23 5.11 Hotplates and heating mantles 23 5.12 Immunomagnetic separators 24 5.13 Incubators 24 5.14 Media and reagents dispensers 25 5.15 Media preparators 25 5.16 Microscopes (optical) 26 5.17 Microwave ovens 29 5.18 Modified atmosphere incubation equipment 29 5.19 pH meters 30 5.20 Pipettes and pipettors 31 5.21 Protective cabinets 32 5.22 Refrigerators and freezers 33 5.23 Sample preparation devices (blender, homogeniser and pulsifier®) 33 5.24 Spiral platers 34 5.25 Steamers and boiling baths 34 5.26 Temperature recording devices, (thermometers and thermocouples), and
temperature control 35 5.27 Timing devices 36 5.28 Ultra violet steriliser cabinets 36 5.29 Vortex mixers 36 5.30 Water baths 36 5.31 Water purifiers- stills, deionisers, RO devices 37
5

6 Materials and techniques used in a microbiology laboratory 38
6.1 Media 38 6.1.1 Different types of media 39 6.1.2 Basic constituents of media 39 6.1.3 Agar 40
6.2 Storage of dry media 40 6.3 Preparation of media 41 6.4 Preparation using media preparators 42 6.5 Water 42 6.6 Sterilisation of media 43 6.7 Petri dishes 44 6.8 Cooling, storage and dispensing sterile media 44 6.9 Sterilisation of solutions by membrane filtration 46 6.10 Quality control of culture media 47
6.10.1 pH check 48 6.10.2 Microbial check 48
6.10.2.1 Purchase and storage of reference cultures 48 6.10.2.2 Performance testing 49
6.11 Additional media and regents 53 6.12 Gram stain 56 6.13 Microbial identification by MALDI-TOF 59
7 Analytical techniques 60 7.1 Standard operating procedures 60
7.1.1 Format of a standard operating procedure 60 7.2 Methods for isolation and enumeration of indicator and other organisms 61
7.2.1 Preparation of samples 62 7.2.2 The multiple tube (or MPN) technique 62 7.2.3 The membrane filtration method 63 7.2.4 Advantages and limitations of the membrane filtration method 64 7.2.5 Alternative confirmation techniques 64
7.3 Statistical considerations 65 7.3.1 Accuracy 65
7.3.1.1 How accurate is the result in representing the source material? 66 7.3.1.2 How is accuracy affected by collection, transport and storage of the sample? 66 7.3.1.3 Accuracy of the chosen method 67 7.3.1.4 How is accuracy affected if only a sub-portion of the original sample is tested? 68 7.3.1.5 Inaccuracy introduced by the application of methods to the selected portion of water (uncertainty of measurement) 71 7.3.1.6 Summary of accuracy for sample processing within the laboratory 71
7.3.2 Comparing results with prescribed limits 72 7.3.3 Reporting results 72
8 Quality Control 74 8.1 Internal quality control 74 8.2 Quantitative internal quality control 75
8.2.1 Reference materials 76 8.2.2 Split samples 77
8.3 External quality assessment 79
6

9 Characterisation, verification of performance and comparison of microbiological cultural methods 84 9.1 Basic concepts and definitions 84
9.1.1 Microbiological cultural methods 84 9.1.2 Definitions 84
9.2 Characterisation of methods 86 9.2.1 Identification of target and non-target organisms 87 9.2.2 False positive and false negative results 87 9.2.3 International or prescribed methods 87
9.3 Verification of performance 88 9.3.1 Verification for low number and presence/absence counts 89
9.4 Comparison of methods 91 9.4.1 Statistical considerations 91
9.4.1.1 Sample variation 91 9.4.1.2 Natural (random) variation 92 9.4.1.3 Other sources of variation 93 9.4.1.4 Statistical detection of other sources of variation 93 9.4.1.5 Limitations of error 94
9.5 Practical aspects of the comparison of two methods 95 9.5.1 Preparation of drinking water test samples to compare one selective medium with another 96
9.5.1.1 Preparation of spiked samples 97 9.5.2 Preparation of environmental and recreational water test samples
to compare one selective medium with another 99 9.5.3 Preparation of environmental and recreational water test samples
to verify the performance of a selective medium using reference cultures 100
9.5.4 Preparation of sewage sludge test samples 101 9.5.5 Confirmation tests 103 9.5.6 Verification of identity of target and non-target organisms 103
9.6 Interpretation of data 104 9.7 Low count evaluation 108 9.8 Comparison of an MPN method with an enumeration method 108 9.9 Comparison of two MPN methods 109 9.10 Progress of a new method to national or international adoption 109
10 References 111 Annex A: 95 % confidence intervals for the (unobserved) count from the second half-sample for the observed count from the first half-sample 116 Annex B Test micro-organisms media quality control 119 Address for correspondence 122 Members assisting with this booklet 122
7

About this series Introduction This booklet is part of a series intended to provide authoritative guidance on recommended methods of sampling and analysis for determining the quality of drinking water, ground water, river water and sea water, waste water and effluents as well as sewage sludges, sediments, soils (including contaminated land) and biota. In addition, short reviews of the most important analytical techniques of interest to the water and sewage industries are included. Performance of methods Ideally, all methods should be fully evaluated with results from performance tests. These methods should be capable of establishing, within specified or pre-determined and acceptable limits of deviation and detection, whether or not any sample contains concentrations of parameters above those of interest. For a method to be considered fully evaluated, individual results from at least three laboratories should be reported. The specifications of performance generally relate to maximum tolerable values for total error (random and systematic errors) systematic error (bias) total standard deviation and limit of detection. Often, full evaluation is not possible and only limited performance data may be available. In addition, good laboratory practice and analytical quality control are essential if satisfactory results are to be achieved. Standing Committee of Analysts The preparation of booklets within the series “Methods for the Examination of Waters and Associated Materials” and their continuing
revision is the responsibility of the Standing Committee of Analysts (established 1972 by the Department of the Environment). At present, there are seven working groups, each responsible for one section or aspect of water quality analysis. They are 1 General principles of sampling and accuracy of results 2 Microbiological methods 3 Empirical, Inorganic and physical methods, Metals and metalloids 4 Solid substances 5 Organic impurities 6 Biological, biodegradability and inhibition methods 7 Radiochemical methods The actual methods and reviews are produced by smaller panels of experts in the appropriate field, in co-operation with the working group and main committee. The names of those members principally associated with these methods are listed at the back of this booklet. Publication of new or revised methods will be notified to the technical press. If users wish to receive copies or advanced notice of forthcoming publications or obtain details of the index of methods then contact the Secretary on the SCA’s web-page:-http://www.standingcommitteeofanalysts.co.uk/Contact.html Every effort is made to avoid errors appearing in the published text. If, however, any are found, please notify the Secretary. Users should ensure they are aware of the most recent version they seek. Rob Carter Secretary June 2017
_________________________________________________________________________ Warning to users The analytical procedures described in this booklet should only be carried out under the proper supervision of competent, trained analysts in properly equipped laboratories. All possible safety precautions should be followed and appropriate regulatory requirements complied with. This should include compliance with the Health and Safety at Work etc Act 1974 and all regulations made under the Act, and the Control of Substances Hazardous to Health Regulations 2002 (SI 2002/2677). Where particular or exceptional hazards exist in carrying out the procedures described in this booklet, then specific attention is noted. Numerous publications are available giving practical details on first aid and laboratory safety.
These should be consulted and be readily accessible to all analysts. Amongst such resources are; HSE website HSE: Information about health and safety at work ; RSC website http://www.rsc.org/learn-chemistry/collections/health-and-safety “Safe Practices in Chemical Laboratories” and “Hazards in the Chemical Laboratory”, 1992, produced by the Royal Society of Chemistry; “Guidelines for Microbiological Safety”, 1986, Portland Press, Colchester, produced by Member Societies of the Microbiological Consultative Committee; and “Biological Agents: Managing the Risks in Laboratories and Healthcare Premises”, 2005 and “The Approved List of Biological Agents” 2013, produced by the Advisory Committee on Dangerous Pathogens of the Health and Safety Executive (HSE).
8

Glossary ANOVA Analysis of variance AQC Analytical Quality Control Broth A liquid medium design for the selective or non-selective recovery of
bacteria BSI British Standards Institute CEN European Committee for Standardization (Comité Européen de
Normalisation) cfu Colony forming units CI Confidence interval COSHH Control of Substances Hazardous to Health E. coli Escherichia coli EQA External Quality Assessment IEC International Electrotechnical Commission ISO International Organization for Standardization kPa Kilopascals MALDI-TOF MS Matrix Assisted Laser Desorption/Ionization Time of Flight, Mass
Spectrometer MPN Most probable number MPR Most probable range NCTC National Collection of Type Cultures (UK) PTS Proficiency Testing Scheme QA Quality Assurance QC Quality Control Reference Material A material or substance one or more of whose property values are
sufficiently homogeneous and well established to be used for the calibration of an apparatus, the assessment of a measurement method, or for assigning values to materials
RO Reverse Osmosis Sample matrix A sample description relating to its derivation, being specifically
defined and of distinct relevance to its analysis, for example water type: potable water
UKAS The United Kingdom Accreditation Service UM Uncertainty of Measurement UV Ultraviolet WDCM World data centre for microorganisms Abbreviations of media names (examples only for table 5.12) MLSB / MLSA Membrane lauryl sulphate broth / agar MLGA Membrane lactose glucuronide agar MEA Membrane Enterococcus agar TSCA Tryptose sulphite cycloserine agar TCA Tryptose cycloserine agar YEA Yeast extract agar PSA Pseudomonas selective agar LPW Lactose peptone water TW Tryptone water TNA Tryptone nutrient agar KAAA Kanamycin aesculin azide agar BA Blood agar BAA Bile aesculin agar BPW Buffered peptone water
9

XLDA Xylose lysine deoxycholate agar CCDA Charcoal cefoperazone deoxycholate agar
10

Practices and procedures for laboratories
1 Introduction and scope The microbiological analysis of water and associated materials involves the use of selective procedures and media. In addition, the nature of the organisms being isolated and enumerated can present challenges to analysts. These include the stressed or damaged states (due to environmental or disinfectant challenge) the micro-organisms may be in, and the presence of competing and non-target organisms (which may result in restricted growth or false-positive colonies). It is, therefore, important that the media used by a laboratory are prepared, and the procedures conducted, in such a way that the results truly reflect, for example, the quality of the water being tested and that the data generated are reliable. This booklet has been revised with the recognition that laboratory practices and procedures used for the microbiological analysis of water and associated materials are largely independent of the sample character, matrix or water type. It is intended that the document should support application of methods published in the series ‘Microbiology of’, whether drinking water, recreational and environmental waters or sewage sludge. While many of the examples given in the booklet relate to drinking water, reflecting the importance of this matrix and the origin of the document, specific guidance is also provided where appropriate for other water types and associated materials including sewage sludge. It is essential that a laboratory is able to demonstrate that results produced are fit for the purpose for which they are to be used. This can be achieved by implementing an appropriate programme of quality assurance. In the UK the regulator has issued guidance(1) on the performance criteria of methods for compliance purposes for the monitoring of drinking water supplies. Methods should be capable of establishing, within acceptable limits of deviation and detection, whether the sample contains numbers of selected groups of micro-organisms which may contravene prescribed values. Depending on the test being used, it is necessary to be able to demonstrate the presence (or absence) of particular micro-organisms or a class of micro-organisms in a given sample volume, and to estimate their numbers. The detection of small numbers of organisms is particularly important for drinking water and environmental samples from unpolluted sources. An effective quality assurance programme should, therefore, cover the whole process from sample collection to reporting and interpretation of results. The programme should also include a system of internal quality control, and participation in an appropriate external quality assurance proficiency testing scheme. Any laboratory where the analysis of water and associated materials is undertaken should operate a quality system. The main function of such a system is to define the processes that have been put into place to ensure that results are reliable and which must be performed to recognised procedures by properly trained staff using suitable equipment. A good quality system enables analytical data to be audited and provides documentary evidence that data generated are accurate and reliable within the constraints of microbiological testing. A quality system also provides the basis for documenting structures for the laboratory and staff, equipment and associated service and calibration, and methods that the laboratory uses. The quality system also acts as a reference system for any documentation relating to the laboratory and its operation.
11

The quality system will depend on the content of a number of documents, each of which is inter-dependent on other documents for its correct function. This booklet describes the basic requirements of a quality system, coupled with criteria for equipment and materials, which enable the reliable analysis of water and associated materials to be undertaken. Guidance on basic analytical procedures, and statistical considerations concerning results, is also given, together with protocols for comparing methods prior to adoption of a new or modified method within a laboratory. Laboratories wishing to be accredited under a national accreditation scheme need to fulfil the requirements of BS EN ISO/IEC 17025(2). This document provides a framework for establishing appropriate documentation and procedures. Further information on requirements for accreditation in the UK under the Drinking Water Testing Specification (DWTS) has been provided by UKAS(3) and specific information and guidance for microbiological laboratories, on how to fulfil the requirements of ISO 17025 published by Eurachem(4). 2 The quality manual The foundation of a quality system which aims to meet the requirements of ISO 17025 on general requirements for the competence of testing and calibration laboratories(2) is a quality manual that defines the laboratory’s quality management system and its policy towards quality in relation to its testing and, where appropriate, sampling. The manual should be broad in its approach, establishing the basis of a management system that is appropriate to the scope of the laboratory’s activities. It should be simple in that it is easily read and understood by all members of staff, and it should be easy to maintain in the ever-changing circumstances of the laboratory. In broad outline, the manual should document the laboratory’s policies, and summarise its systems, programmes, procedures and instructions to an appropriate extent. It should contain a quality statement, details of the laboratory in terms of location and staff structure, and should define senior level responsibilities such as those of technical and quality management. Every laboratory should have an organisational chart showing staff posts and associated role profiles, and importantly, the chain of accountability and reporting. The post responsible for the quality assurance programme should be clearly defined and each member of staff should have a well-defined job description outlining their role and responsibilities. The quality system will require a record of staff training which should be maintained and regularly updated to provide a record of staff competence. There should also be a defined plan for individual staff development and the provision of cover for work when staff members are absent. In addition to the requirements of ISO 17025(2), the quality manual may also incorporate health and safety policies, safe working procedures and environmental policies and how it will set, maintain and check quality standards. The quality manual should define records that the laboratory will keep, and maintain, the nature and frequency of measurement calibrations of equipment critical to the testing scope, the format of analytical procedures and strategies for internal and external quality assurance. The protocol for assuring the quality of test results should be fully documented within the quality system and should include participation in appropriate external proficiency schemes where such schemes exist. A robust internal quality assurance system is essential. These areas are covered in more detail within other sections of this booklet.
12

Suppliers and materials purchased for use during analysis must be appropriately evaluated to confirm their suitability and to ensure that the quality of the testing activities are not compromised. New batches of, for example, membrane filters whether from the same or a different supplier to those ‘in use’ should be tested to verify that performance is both acceptable and consistent. A procedure relating to the handling of items under test needs to be included within the quality system and referenced from the quality manual. The use of appropriate sample containers and preservatives, details of sample handling, reception and suitable transportation conditions are all factors which need to be considered. One of the critical components of the quality management system is an effective internal audit process. This process must be documented to provide guidance on the audit process and should require that audits are undertaken by appropriately trained staff. Internal auditors should be knowledgeable of, but not directly involved in, the activity, process or procedure being audited. The procedure should include the requirement to take remedial action, which must include investigations, identification of root causes, implementation of appropriate corrective actions and a check on the effectiveness of these implemented corrective actions. The importance of effective interactions between the laboratory and its customers cannot be underestimated, as understanding the needs of the customer and their use of the final result can have a significant influence on method selection and guidance provided to explain results. Documented policies on defining customer requirements with regard to service and contract set up through to contract execution should therefore be contained within the quality manual. The method of reporting results to customers should be clearly defined and enable results which require immediate remedial action to be communicated without delay to appropriate persons. Records relating to laboratory results should be kept for as long as is necessary to comply with requirements for archive and audit trails. These should include, for example; the date, place and time of sampling, the members of staff undertaking the sampling and analysis, the test result with appropriate units and a reference to the methodologies used along with full details of testing. The quality management system can only be successful if all constituent parts are well documented, understood and supported by staff. The manual should provide policies covering all activities of the laboratory and requires periodic review. The information that is produced by all areas of the quality management system, for example the results of the audit process, should feed into the laboratory planning system and should include goals, objectives and action plans for the coming year. This information is usually assessed by top management of the organisation and other staff as appropriate, during the management review meeting, which is usually held on an annual basis. 3 Laboratory staff The nature of microbiological testing requires that the work should be performed by or under the supervision of an experienced person qualified in microbiology. Laboratories should have a documented policy, and associated procedures, that detail staff responsibilities, training and on-going competency assessment. All laboratory staff
13

should have training records that detail relevant education, qualifications, training received, on-going competency and experience acquired. New employees should be made aware of key laboratory hygiene practices that are very important in minimising the risks of infection when handling samples or cultures. These include requirements for wearing of laboratory coats, the need for hand washing and personal hygiene, disinfection of laboratory work surfaces and cleaning up of spillages and basic aseptic techniques. These practices should be observed and maintained at all times. Analytical staff should be trained in the principles and rationale of the tests being conducted in addition to receiving training in each analytical method. Training in ancillary techniques and the operation of major items of equipment should also be described and recorded. Wherever possible, staff should be encouraged to broaden their understanding and to make contact with people from similar organisations, including participation at appropriate meetings, seminars and conferences. It is important that staff should understand the principles of the tests being conducted, the reasons why they are carried out and the significance of results. 3.1 Staff training and records Staff training records should show appropriate training for each documented method where training has been given, including training in the use of major items of equipment and basic microbiological techniques. Evidence that training has been both adequate and successful should be documented in training records. New analysts under training should be supervised during any analysis, counting and recording of results performed. Any counting by a trainee should be carefully checked by a competent analyst. Assessment of successful training may involve staff analysing external quality assurance samples where their data can be compared with data from other analysts or laboratories. Alternatively, for water analysis, spiked or raw water samples, containing low numbers of target organisms (for drinking water) or higher numbers requiring dilution (for environmental waters), may be used provided that replicate samples are analysed in parallel by a fully trained member of staff. In order to demonstrate satisfactory performance, an appropriate number of replicates containing the target organism should be analysed using the full analytical procedure so as to provide statistical confidence in the assessment. There should be no significant difference between the results obtained by the two analysts. Details of the comparisons of the test results should also be documented in the training record. Further guidance on the criteria for assessment of competency is given by the UK Drinking Water Inspectorate (5). Following the successful delivery of training, laboratory management can authorise staff to perform particular test methods and this is generally documented within the individuals training record. Training records can also be used to store documentary evidence of additional training, for example, courses, conferences, workshops etc. that the analyst has attended.
14

3.2 On-going competency and development Training records should be reviewed regularly to ensure completeness and to identify any training needs for an analyst. On-going competency of trained analysts may be assessed by performance in appropriate internal quality control testing including: method demonstration during internal audits, duplicate split samples, spike recovery testing, externally sourced reference preparations and, where available, an external proficiency testing scheme. Failure by an analyst to perform satisfactorily should lead to a thorough investigation including both the adequacy of, and response to, the training received. Where appropriate, on-going professional development should be encouraged and include attendance at appropriate meetings, workshops, seminars, training courses and similar events. A record of such events should be maintained and kept up to date by the analyst to demonstrate their continuing professional development. 4 General laboratory environment 4.1 Laboratory Organisation The nature of microbiological examinations places requirements, particularly in the context of health and safety, on the design and organisation of the laboratory space. These include the progression of samples and materials through the laboratory, controlling ventilation, facilitating good microbiological practice and hygiene and managing contaminated materials. In many cases consideration should be given to restricting access to authorised personnel and supervised visitors only. The laboratory environment for the microbiological examination of water should comply with guidelines(6,7,8) for category 2 containment. Guidelines include provision of sealed non-absorbent floor surfaces, work surfaces that are impervious and resistant to chemicals, and separate hand-washing facilities that are close to the exit of the laboratory. In addition, laboratory cupboards should be labelled with their contents and lighting for all purposes should be adequate. Floors and work surfaces should be easy to clean and cleaning should be undertaken frequently. Work surfaces should be disinfected often and immediately if contamination is known to have occurred. Laboratories where micro-organisms in category 3 containment level are intentionally sought and isolated (for example Salmonella Typhi) need to comply with separate and additional requirements(7) including security. Whilst laboratory-acquired infection is rare, staff should be adequately trained in good microbiological practice including aseptic technique and the prevention of infection, not only to themselves but also to their colleagues. Training should include the understanding of risks from micro-organisms associated with ingestion, inhalation and skin absorption. Further guidance is given elsewhere (6,8,9,10). 4.2 Environmental monitoring The ubiquitous nature of most of the microbes of interest makes it essential to ensure that any organisms that are detected have originated from the sample being analysed and have not been introduced inadvertently during sampling or subsequent testing. It is also essential to protect laboratory users from any pathogenic microbes likely to be found in samples.
15

Laboratories should therefore consider appropriate microbiological monitoring of the environment, relating both to the sampling procedure and the analysis within the laboratory. The objective of this monitoring should be to ensure that the working environment meets suitable standards for hygiene. Such standards are defined to minimise the risk of cross contamination of samples and protect the health and safety of laboratory employees. More detailed information on environmental monitoring can be found elsewhere(11). The environmental monitoring programme should be designed to provide feedback about the efficacy of cleaning regimes including the disinfection of work surfaces and equipment. It should be relevant to the sample matrices and organisms being sought as well as the conditions under which the analysis is being performed. There are a number of techniques used within an appropriate programme to monitor both the air and surfaces. These include: • Air sampling devices • ‘Settle’ plates (Air settlement plates) • Contact plates • Surface swabs Dependent on the work being carried out by the laboratory and the monitoring strategy adopted these techniques are used in conjunction with non-selective and selective agar media to determine when and where contamination of samples and the working environment may have occurred. Settle and contact plates should be sterile and quality controlled before use. They should be checked visually for any sign of deterioration or contamination before use. The plates should be located so as to be relevant to the testing activities being performed but without interfering with them. The conditions of plate exposure and exposure time should ideally reflect those perceived to present the greatest risk of contamination, with testing activities in progress, and have regard to the potential deterioration or drying out of the plate during exposure. After exposure the plates should be incubated at temperatures and for times appropriate to the tests performed and the organisms of concern. Environmental monitoring is not a replacement for the routine practice of aseptic technique or good hygiene and cleaning practices. Monitoring provides a means of verifying the effectiveness of these activities and an alert mechanism when changes have occurred and improvements are necessary. The emphasis should be on maintaining the environment, work surfaces and equipment to a suitable standard defined within the laboratory. The monitoring programme should be sufficiently frequent to establish background counts, and be designed to demonstrate compliance with laboratory defined acceptable levels based on experience and appropriate to the scope and type of analysis performed. Trigger levels should be set for initiating further investigation and remedial action such as cleaning and disinfection where appropriate. The conclusions of the investigation may then be used to review and amend routine hygiene and cleaning practices and the environmental monitoring strategy. Records should be kept of all the environmental monitoring undertaken and the results should be reviewed regularly. Laboratories should consider the use of guidance charts (see Figure 4.2) which may aid the interpretation of results and facilitate the identification of trends or patterns of contamination.
16
Figure 4.2 An example guidance chart: 4.3 Management and disposal of waste Laboratories should have clear policies for the handling and segregation of waste and contaminated materials and equipment. Contaminated materials and waste cultures should be kept separate from preparation and testing areas. They should be discarded to suitable, labelled, receptacles which should not be overfilled. Consideration should be given to the categorisation and labelling of waste and the use of an appropriate recognised colour coding system. ISO 14001(12) contains information on environmental and waste management which may be of use to laboratories in formulating their own policies and procedures. In the UK, guidance on the management of healthcare waste has been provided by the Department of Health(13,14) including application to laboratory facilities such as those testing environmental samples. In general, unless a laboratory is involved with testing clinical specimens or dealing with category 3 containment level organisms, it is usually sufficient to autoclave the material and dispose of the suitably bagged residue along with general laboratory waste. Alternatively, it can be disposed of as offensive/hygiene waste, category code 18 01 04, 18 01 03 or equivalent in the appropriate colour coded waste bags. Depending on local policy it can also be described as ‘autoclaved laboratory waste’ and disposed of either by incineration or to non-hazardous landfill. It can also be sent for incineration without prior autoclaving.
17

5 Laboratory equipment In accordance with good laboratory practice it is important that all equipment is verified as being fit for purpose and installed so as to facilitate operation. All equipment should be clearly identified and uniquely labelled so that comprehensive records can be kept of all relevant information and data allowing it to be retrieved quickly when necessary. Equipment should be kept clean and checked regularly for correct operation, as detailed in sections below. Any spillages should be cleaned up immediately. Equipment should be maintained according to manufacturer’s instructions to ensure safety and reliability. Items of equipment that are critical to measurements and analytical performance should be catalogued and include records of, for example, the date of purchase, the name of the supplier, the frequency of servicing and calibration, and, where appropriate, the location of instruction manuals. Examples of the type of equipment typically covered would be; incubators, water baths, autoclaves, refrigerators and microscopes. Service records of such equipment should be stored and include reports and details of any calibration carried out on the equipment. Details of equipment faults, modifications, repairs and upgrades should also be kept. Equipment used for measurements or where specifications are important should be calibrated to ensure the appropriate degree of accuracy and reliability demanded for the analysis performed. Laboratories should have in place documented procedures for the calibration of all equipment involving, for example, recording weight, volume, temperature or time. Calibration equipment and standards used for monitoring of calibration for such equipment, for example thermometers, may include certified standards, and should include certification traceable to national standards. Certified standards need not be used routinely, but should be used to calibrate uncertified working standards to a regular programme. Certified standards and equipment used for this purpose (laboratory reference standards) should never be used for any other purpose. Once initially calibrated all certified standards, whether working or reference, should also be programmed for regular recalibration to national standards or replacement. In the case of reference standards this should always be carried out by a competent calibrating laboratory. Records of calibration and maintenance should be securely maintained. 5.1 Autoclaves The principle of sterilisation to destroy micro-organisms by autoclaving is based on moist heat transfer. Autoclaving is used to sterilise media, bottles and other equipment used in microbiological analysis. Heat is applied in the form of steam, under pressure in the absence of air. Steam may be generated in a boiler that is separate to the sterilisation chamber. Alternatively, steam can be generated by the direct heating of water in the bottom of the chamber. Where steam is generated in a boiler separate to the sterilisation chamber, air is displaced more quickly than it is when steam is generated in the bottom of a chamber. Hence, the medium heats up faster. Sterilisation is timed from the moment when materials in the autoclave attain the appropriate sterilisation temperature. In order for correct sterilisation to take place, it is essential that steam penetrates the load and that the heating time is not adversely affected by overloading the autoclave, both in terms of large numbers or volumes of objects placed in the autoclave. Autoclaves vary in complexity and range from simple pressure cooker systems to complex microprocessor-controlled machines capable of a variety of sterilisation cycles. The autoclave should be equipped with at least one safety valve, a drain cock, temperature regulation device, timer, temperature probe and recorder. A safety/thermal
18

lock is usually activated at temperatures above 80°C. Autoclaves are pressure vessels and are subject to annual inspections for safety and insurance purposes. The autoclave cycle comprises an initial heating period, a period of free steaming (where air is purged from the chamber), a further heating period (where the contents are raised to the sterilisation temperature), a holding period at the sterilisation temperature, and finally a cooling period. Guidance on use and performance of laboratory autoclaves is given elsewhere(14,15). For both autoclaves and media preparators (see 5.15 below) it is important that the correct time and temperature are achieved during each sterilisation cycle and that these are monitored and recorded. Details of the load, operator’s identity and batch number, where appropriate, may also be recorded and retained. Each operating cycle and load configuration should have a performance validation undertaken initially and after significant repair or modification and all data recorded and stored. This may also be repeated at set intervals and can be achieved, for example using a multi-point thermocouple calibration procedure traceable to national standards. Many media require a sterilisation cycle of 121°C for 15 minutes, although 115°C for 10 minutes and other cycles are also used. Sterilisation cycles for other materials may require a different holding time. The target temperature and time should have defined limits; typically the target temperature should be within +/- 3°C and the target time within +/-3 minutes for a 15 minute cycle. Autoclaves should not be overloaded and the loading pattern should not restrict the free passage of steam around the contents of the chamber. The internal temperature of the autoclave/preparator should be established and verified during a sterilisation cycle using thermocouples. These should be calibrated to national standards and details of each cycle of the autoclave should be recorded, together with the contents of the unit. A temperature cycle or sterilisation time-temperature record provides an audit trail to show the time/temperature used. Whether these are satisfactory can only be shown by subsequent tests for sterility. Individual autoclave loads can, in addition, be marked with heat-indicating tape to demonstrate that they have been subject to a moist heat process. Other heat treatment indicators, for example Brownes tubes, and spore tests may also be used. Spore tests are typically purchased as preparations of Geobacillus stearothermophilus spores which are resistant to heat, in vials containing the spores suspended in an indicating growth medium. If the sterilisation cycle results in the kill of these spores, then complete sterilisation has been achieved. (On cycles at temperature/times less than 121°C for 15 minutes this may not result in the total destruction of spores in all cases).Other types of spore tests are also available. Results of these tests and other evidence of sterilisation efficacy may be recorded and retained. Different types of loads such as contaminated materials and media should not be autoclaved together. Furthermore, bottles of media should not be filled completely, and caps or stoppers should be loose fitting. Failure to loosen the cap or stopper may result in the bottle exploding. It should not be possible to open autoclaves until the sterilisation cycle is complete and the temperature has cooled down to a designated safety level. Although the temperature inside the autoclave may register, for example 80 °C, the temperature of the contents may remain above this. It is important, therefore, that when the sterilisation cycle is complete, the autoclave is opened carefully and that appropriate safety equipment is used when the contents are removed. Some autoclaves have a holding temperature to keep agar molten if it is not possible to unload soon after the cycle has finished. It is not good practice though to hold prepared agar media for long as this can change the state of some ingredients and thereby the properties of the medium.
19

5.2 Balances and Gravimetric Devices Balances are generally used to weigh out components of culture media and test portions of samples. They may also be used for gravimetric checks of pipettes, pipettors, dispensers, etc. Other gravimetric devices may include gravimetric diluters consisting of a balance and programmable dispenser that can prepare dilutions and moisture analysers used to determine the moisture content of a sample. Weighing devices should possess a sensitivity that is appropriate for the substance being weighed. They should always be kept clean and serviced at pre-determined frequencies. They should be located in a suitable position on a level surface away from sources of excessive vibration, temperature variation and air movements. Balances used for general purposes, for example top pan balances, should be accurate to ± 0.01 g. Where greater accuracy is required, for example analytical balances used for weighing amounts of less than 1.0 g, an approach appropriate to the application should be taken. In many cases accuracy to at least ± 0.001 g is sufficient but accuracy to at least ± 0.0001 g may be necessary in specific instances. Verification of performance should be determined by using a range of calibrated weights, traceable to national standards, appropriate for the balance in use at least once a year. The permissible error will vary depending on the weight used and purpose for which the device is used. Further guidance on calibration of balances and weighing machines is given in UKAS publication 14(16). Calibration checks using working standard weights should be undertaken on a regular basis, for example daily or weekly, depending on use of the device. Continuity of calibration should also be demonstrated immediately following maintenance, relocation (including moving and replacing) or accidental movement of the balance. Balances and other gravimetric devices not within specified tolerances should not be used until re-calibrated. 5.3 Centrifuges Centrifuges provide a means of separating substances of different density by centrifugal force. In microbiology laboratories they are frequently used for the separation of micro-organisms, including algae, from their surrounding fluid. Bench top models are generally used in the microbiology laboratory and employ speeds in the range of 200-6000 rpm and different volume capacities. Micro-centrifuges are also available for handling bacterial cultures and accommodate Eppendorf tubes which are used in Cryptosporidium and Giardia analyses. If the speed, time and temperature of centrifuging are crucial to a method these should be independently verified at least annually or after significant repair or modification. Centrifugal force is determined by speed and rotor diameter, this is usually quoted in terms of rcf- relative centrifugal force. It is important that centrifuge tubes and their contents are equally balanced and rubber cushions (where required) are placed in buckets before use. Prevention of aerosol generation and cross-contamination by correct operation of the equipment is essential. Centrifuges should be cleaned and disinfected regularly especially after any spillage or breakage and be well maintained and serviced and records kept. 5.4 Colony counting devices These may be manual units or automated electronic devices.
20

5.4.1 Manual counting Tally counters can be used for simple manual counting either separate from or in association with marker pens. Many manual counters use an illuminated contact operated grid surface with an audible indication and digital readout. A magnifying screen aids colony detection. At least annually, the calibration of the tally counter should be checked and the result recorded. As an example this can be achieved by using a ‘standardised’ plate if available or creating a reference plate with a known number of coloured dots (for example 25 to 75) simulating colonies on the back of a petri dish. This may be used to ensure that the reader is not over or under sensitive and that the digital readout is functioning correctly. The plate should be counted by at least two analysts, for example using different coloured marker pens, and there should be no difference for either analyst compared to the known initial count. 5.4.2 Automated electronic counting devices Automated counters may be sophisticated image analysers which use a camera detection device connected to software that calculates the numbers of colonies present on a plate. The manufacturer’s instructions for set up and use should be carefully followed. Sensitivity can usually be adjusted manually to ensure all target colonies are counted. A compromise usually has to be reached for counting very small colonies to avoid the unit ‘counting’ air bubbles or imperfections in the agar plate. Each type of agar plate should be set up and verified to ensure adequate discrimination of target colonies. All units must be kept as clean and free of dust as possible and avoid scratching surfaces that are essential to the counting process. Although calibration plates, with a known number of countable particles present (for example 0, 1, 20, 100, 250), may be available it is usually better to compare an agreed manual count (for at least two analysts) to the count an automated instrument produces. Checks should be performed with these plates in addition to blank plates. 5.5 Dry Heat Sterilising Ovens A sterilising oven uses a temperature of around 160-180°C to destroy bacteria and other micro-organisms by dry heat. Glass and metal ware are generally sterilised by this method as the temperature employed makes it unsuitable for many other materials. All metal and glassware should be clean before placing in the oven. The sterility of these items can be maintained on removal by putting them in suitable canisters or wrapping items individually or in batches in foil or craft paper. The oven should be equipped with a thermostat, temperature recorder and timing device. When the oven reaches temperature it is usually held for one hour. Details (date, time, temperature setting, sterilisation time, oven contents and batch number where appropriate) of each load should be documented and maintained. The temperature controlling system should be calibrated to national standards. Steriliser control tubes are available that change colour to give a visual indication that the correct temperature has been achieved. These can be placed throughout the load. After sterilisation, glassware should be allowed to cool in the oven before removal. 5.6 Filtration systems Membrane filtration is a technique that is frequently employed in water microbiology for capturing bacteria in a liquid sample. Membrane filters having a pore size of 0.45µm are
21

often suitable and are the most frequently used but for some bacteria such as Campylobacter and Legionella a pore size of 0.2µm is required. In addition to filtration manifolds a vacuum source is required and a receiver to collect filtered water. This can consist of a fairly simple set up, up to a large plumbed-in commercial system with automated emptying of the water reservoir. Systems need to be well maintained and kept clean according to manufacturer’s instructions. It is recommended that back-up systems are available in case of break down. The vacuum source should not exceed 70 kPa (17) to avoid damaging the membranes and compromising their porosity and performance. Filtration funnels should be free from cracks and have visible calibration marks at appropriate intervals for the range of volumes typically filtered. Calibration checks to verify volumes should be carried out on a random selection of funnels at regular intervals. Funnels are sterilised before each use by autoclaving or disinfected between uses by boiling, steaming or other means suitable for the application, for example ultraviolet irradiation. Alternatively, pre-sterilised, single use units may be used. 5.7 Flow Cytometry Flow cytometry has numerous applications but in the context of water microbiology, it is a method by which suspensions of cells (for example bacteria or cryptosporidium oocysts) can be accurately enumerated and if required, separated out into known concentrations by particle characteristics (cell sorting). Cells can be fluorescently stained to identify distinguishing characteristics allowing analysis of communities of micro-organisms or categorised as to whether the cells are intact with implications for whether they are ‘live’ or dead cells. Cells are guided to an ‘interrogation point’ within a flow cell where the stream of fluid is so narrow that the cells move in single file. The cells pass ‘interrogation points’ where laser light is applied and scattered in response to fluorochromes applied to the cells. The light response generated is converted into an electrical signal by a photodiode or photomultiplier tube. The electronic signals are proportional to the amount of light detected and displayed using analysis software within the flow cytometer. The cells are displayed as scatter pattern on a graph with cells with similar properties, for example size or fluorescence signal, appearing as clusters. A definitive cell concentration is also calculated. 5.8 Gas burners Gas (Bunsen) burners have been used in microbiology laboratories from the earliest days to sterilise metal loops or straight wires and to flame necks of bottles and tubes as part of aseptic technique. Gas burners produce a narrow naked flame using either mains or bottled gas. The type of flame produced can be achieved by varying the gas/air mixture by the means of a collar at the base of the burner. As flaming loops can cause splatter disposable plastic loops may be used instead. (There are also advantages in terms of speed and efficiency as well as health and safety reasons for using plastic loops). In protective cabinets the use of burners should be avoided. Pipework and connections should be checked regularly. Gas detection devices are available to detect leaks.
22

5.9 Glassware All items of glassware, such as pipettes, flasks, beakers and Petri dishes etc., used in the preparation of media or handling of samples should be of suitable quality and not cracked, chipped or broken. They should also be free from inhibitory substances, adequately cleaned, and when appropriate, sterilised before use. Pipettes can be placed in canisters and other materials wrapped in special paper (such as craft paper) or foil, but generally access to free steam should be allowed to ensure sterilisation. Dry heat sterilisation in an oven can also be used. Glassware should be stored in such a way as to protect against dust and breakage and, if sterilised, protected to maintain its cleanliness. In many instances, pre-sterilised plastic items provide an acceptable alternative. The accuracy of volumetric equipment should be appropriate to the application and traceable to national standards. Class A glassware conforming to BS EN ISO 4788 is preferred where the accuracy is specified in the method(18). Calibrated glassware should never be heat sterilised as this invalidates the calibration. Any calibrated glassware that is subject to significant temperature change should have its calibration verified before it is used. 5.10 Glass washers Many different types of electronically controlled glass washers are available for washing general laboratory glassware and bottles. Because washers subject glassware to physical and temperature stress, they are not suitable for cleaning calibrated glassware. Some units can incorporate a purified water or acid/alkali rinse stage. Different cleaning agents can be used, the choice determined by the type of material being washed and the degree of soiling. All machines should be installed and serviced according to manufacturers’ instructions. The efficacy of cleaning is usually checked by visual inspection but if an acid/alkali rinse stage has been used a pH check may also be appropriate. 5.11 Hotplates and heating mantles Hotplates and heating mantles are thermostatically controlled heating devices and may incorporate magnetic stirring units. They may be of ceramic, glass halogen or other design. They are used to prepare volumes of culture media and reagents. Care should be exercised to ensure that only the appropriate quality of glassware is used on these units. They should have good heat resilience and be of robust construction with no chips or cracks (see section 5.9). Also ensure, even if stirring units are used, that localised charring does not occur at the base of a flask where solid media is not properly mixed with water. Any spillages should be cleaned up as soon as the unit is cool. Units should be clearly signed to alert to the danger when still hot.
23

5.12 Immunomagnetic separators Commercial units are available which are used to separate and concentrate target micro-organisms in liquid cultures by means of paramagnetic beads coated with an appropriate antibody. Manual and automated separators are available. Manual units consist of a rotary mixer and particle concentrator with removable magnetic bar. Automatic systems perform the whole operation in an enclosed environment. All equipment should be clean and free from inhibitory or interfering substances. 5.13 Incubators Incubators are temperature controlled insulated cabinets and are available in many sizes with, or without, internal fan assisted circulation to provide a more even temperature distribution inside the cabinet. The inside of the incubator should be made of material that facilitates easy cleaning for example stainless steel. A glass or perspex inner door helps to minimise temperature loss whilst the main door is opened, for example for viewing the contents of the incubator. If the ambient temperature is close to or higher than that of the incubator, it is necessary that the unit has a cooling system in addition to a heating system to achieve the required temperature. This is usually required, for example for incubators maintained at 22 °C. Incubators sited in draughts, bright sunlight or other locations where environmental temperature fluctuations occur may not be able to maintain temperature adequately. A temperature-controlled environment may be needed to maintain tight temperature tolerances in incubators. Specific maintenance and servicing arrangements are not usually required but units should be cleaned and disinfected inside and out regularly and particularly following any culture spillage. The approach to cleaning the inside of incubator chambers and fridge cabinets is similar. The inside may first be cleaned with warm tap water followed by liberally spraying all internal surfaces with a fresh solution of, for example, dilute sodium hypochlorite. It may be advantageous to alternate between two different disinfectants. If a suitable cleaning regime is followed it may only be necessary to use the disinfectant spray. The surfaces should be wiped dry immediately with absorbent paper towel. The disinfectant should leave no residue inside the chamber. For verification of cleanliness, if required, an appropriate programme of swab testing of internal surfaces may be undertaken, with swabs tested for a suitable range of bacteria and limits applied to the levels found for acceptance or triggering additional cleaning and disinfection. Incubation chambers should not be over-loaded, the pattern of loading can markedly affect heat distribution, and thereby temperature, around the chamber and for example within stacks of plates and trays or in secondary containers such as jars or boxes. The temperature of the incubator should be measured at regular intervals. The minimum number of readings that should be taken includes one at the beginning of the working day, before cultures have been removed, and one at the end of the working day or when samples are placed in the incubator, (these checks are particularly important with temperature cycling incubators), using a calibrated thermometer or temperature measuring device. An integral temperature display can only be used if its accuracy has been verified. Continuous temperature monitoring (with associated alarm systems) of the internal environment provides a complete appraisal of incubator performance, particularly for incubators with temperature cycling. On cycling incubators the rise in temperature from 30
24

°C to 37 °C or 44 °C should occur within 30 minutes and the time is counted as part of the higher incubation time. Monitoring throughout the incubation cycle allows a realistic assessment of temperature fluctuations within the incubator. Whether fan-assisted or not, it is important that an even temperature distribution is established within the incubator. This can be assessed by placing thermometers, or temperature recording devices, in different parts of the incubator over a period of time, for example over a 24h period, and recording the temperatures at regular intervals. This can also be achieved by using a multipoint instrument that is traceable to national standards. The temperature profile of the incubator should show no significant differences wherever the temperature measuring devices are placed. A loading pattern should be established and any unusually hot or cold areas within the incubator identified. Such areas should be avoided as far as possible and designated as places where plates, etc. should not be incubated. Repeat profiling should be undertaken at regular pre-scheduled intervals and when the incubator is moved to another location or following repair. The temperature distribution may also depend upon the manner in which the incubator is loaded. For example, stacking Petri dishes to greater than six dishes may affect the temperature distribution and result in the temperature profile of individual dishes being variable. Correct incubator temperature control is vital for the satisfactory performance of microbiological enumeration and detection. Maximum fluctuation around a given temperature for an incubator and thermometers and temperature measuring devices generally are described in section 5.26. 5.14 Media and reagent dispensers There are a variety of devices that are employed to dispense culture media and reagents to tubes, bottles or plates. These range from calibrated pipettes, syringes and glassware to peristaltic pumps and programmable electronic devices with variable automated delivery. All equipment must be clean and fit for purpose both in terms of volume delivered and suitability to the matrix being dispensed. For aseptic distribution of sterile culture media the parts of the equipment that will come into contact with the medium must be sterile. It is good practice to have separate tubing sets for selective media to minimise chances of tainting or carryover of inhibitory substances. The dispensing equipment must be calibrated either before use or at regular intervals and in each case if a change in volume is made. The accuracy of the volume being dispensed needs to be determined in proportion to the volume being dispensed, in general it should not exceed +/- 5% (for volumes of 5 ml or greater). 5.15 Media Preparators Media preparators operate on similar principals to autoclaves and are specially designed sterilising devices used to prepare larger volumes of media (>1 litre). Media preparators are stand-alone devices that allow controlled preparation, sterilisation, cooling and dispensing of culture media with minimal operator involvement. Advantages of such equipment include thorough mixing of the components during preparation, short heating and cooling stages which minimize denaturation of ingredients, improved safety for workers as handling of hot glassware is avoided and improved consistency of finished media. Like autoclaves they have a heating vessel, temperature and pressure gauge,
25

timer and safety valve. They are also fitted with a continuous stirring device. The entire process takes place within the sterilising unit once media ingredients and water have been added. Once started, the machine will heat the contents of the chamber to the target temperature whilst mixing. The medium is then held at this value for the specified duration of the sterilisation phase. After sterilisation is complete the instrument will enter the cooling phase and quickly bring the contents down to around 50 °C. The media preparator will then hold this temperature for the duration of the dispensing phase. At this stage additives or supplements may be aseptically added through the filling port. Addition at this stage ensures that heat-labile supplements are not deactivated and because the machine continues to mix, ensures homogeneity in the finished medium. A specially designed pouring and stacking unit may be used in conjunction with the sterilisation unit to aseptically dispense media to Petri dishes. The finished medium is usually dispensed by fitting a clean sterile dispensing tube to the integral peristaltic pump. It is good practice to have separate tubing sets for selective media to minimise chances of carryover of inhibitory substances. Spare sterile tubing sets should be kept bagged or wrapped in autoclave paper ready for use. Foil wrapping the connectors and dispensing nozzle may help to prevent contamination when fitting to the pump and stacker module. Many nozzle sets include a sliding sleeve to achieve this. To dispense the medium the tubing must first be primed and then calibrated to deliver the required volume per plate or bottle. Once dispensed, media may be allowed to remain on the stacker carousel until solidified; after which it should be promptly removed and stored as described in 6.8. Records for each cycle and performance criteria must be maintained as described in 5.2 above. Many media preparators have UV lamps which operate when dispensing to provide some protection from contamination. It is important that the equipment is kept very clean and that spills are cleaned up after each use. Tubing sets should be rinsed well with hot water to flush out any residual medium before bagging and re-autoclaving. The mixing chamber and stirrer should also be thoroughly rinsed and cleaned after every use. Before placing into service, media preparators should be validated for typical runs by an accredited engineer. Preparators should be regularly serviced and have an annual calibration which is traceable to national standards and all data recorded and stored. Media preparators are pressure vessels and like autoclaves, are subject to annual safety inspections. 5.16 Microscopes (optical) Microscopes are used for the detailed study of material too small to be seen with the eye. Such study may include the examination of sediments or colony morphology on agar plates, enabling of counting of very small colonies, performing counting and identification of algae and intestinal parasites or viewing Gram stained slides. There are many types of microscope including stereoscopic, inverted and immunofluorescent microscopes. The modern microscope has a number of easily identified parts many of which require optimisation if the microscope is to work correctly. The light source is usually a tungsten filament bulb at the base of the instrument to provide a constant source of light. The intensity of light can be controlled by a rheostat. The base of the light source usually has an iris diaphragm to vary the amount of light that reaches the condenser. The condenser, situated beneath the stage, contains lenses which allow light to be focused onto the specimen. The condenser contains two screws to permit it to be centred, and it can be focused up and down. It also has a diaphragm. The stage is the part where the specimen
26

rests. It usually contains a clip to hold the slide in place and a rack and pinion system to permit the slide to be moved in the x and y axes. Both axes have a micrometer to permit the user to take a positional reading during scanning to enable the user to go back and find objects of interest. The magnification is achieved by two lenses. The first of these is located in a rotating ‘nosepiece’ and is called the objective lens. This gathers light from the specimen. A number of objectives are usually screwed into the ‘nosepiece’. These can range in magnification from none at all to x 2, x 4, x 10 x, x 20, x 40 and x 100. The higher magnification objectives may be of a water or oil immersion type. The magnification is usually inscribed on each lens. In the binocular microscope the light from the objective lens is split by prisms to two eyepiece lenses. These usually have a magnification of x 10 and one may contain an eyepiece graticule to facilitate counting, or to allow measurement of the size of objects. The total magnification of the microscope is calculated by multiplying the magnification of the objective and eyepiece lenses. Most microscopes contain two focus knobs. The coarse focus is used to bring the objective lens into the focal plane of the specimen and the fine focus is used to make the image sharp. In binocular microscopes, the inter-pupillary distance can be set by moving the eyepieces towards or away from each other. This enables the user to see a single image from the two eyepieces. With the image focused with one eyepiece, it is usually possible to adjust the other eyepiece by focusing up and down to give a clear image with both eyes. Many objects, for example cells, contain water. When they are suspended in water they are difficult to see by bright field illumination. The contrast between the object and the fluid it is suspended in can be increased by modifying the light as it passes through the microscope. Dark field condensers produce a hollow cone of light which, under normal circumstances, does not enter the condenser. When a refractable object, for example a bacterium, enters the light path, the specimen appears intensely illuminated against a black background. In phase contrast microscopy, annular rings in the objective and the condenser separate the light into different phases. The light that travels through the central part of the light path is then combined with the light that travels round the periphery of the specimen. The interference produced by these two paths produces images in which the dense structure appears darker than the background. Objectives with annular rings can also be used for bright field microscopy. Differential interference contrast (DIC) uses polarising filters and prisms to separate and recombine the light paths giving a 3-dimensional appearance to the specimen. One of these systems is essential if unstained specimens are to be examined. An incident light fluorescence microscope uses a shorter wavelength of light (usually ultra-violet light) to illuminate the object. Some parts of the object change the wavelength of the light to a longer wavelength in the visible light spectrum. Alternatively, a sample can be stained with a specific stain which achieves the same objective. These stains which absorb light of one wavelength and emit it at a longer wavelength are called fluorochromes. The light source is usually a high pressure mercury vapour or xenon lamp, however light emitting diode (LED) lamps are now available, these do not contain mercury and are gaining in popularity due to their energy efficiency and extended lamp life. In epifluorescence, the light which is produced is focused by the objective onto the specimen. The wavelengths of visible light which are produced travel back through the objective to the eyepiece. Filters within the microscope are used to generate light of a specific wavelength. These are called exciter filters. A dichroic mirror is used to reflect this light onto the specimen. The dichroic mirror allows the longer wavelength light from the sample
27
to pass back up the microscope. Unwanted UV light is then removed by a barrier filter to prevent it reaching the users eyes. Fluorochromes can be used to stain micro-organisms. Alternatively, the fluorochromes can be conjugated with proteins, for example antibodies. In this way Cryptosporidium can be stained and rendered visible. When microscopes providing ultra-violet illumination are used, the period of use should be recorded and bulbs replaced at appropriate frequencies. When ultra-violet bulbs are replaced, safety gloves and eye protection should be worn as these types of bulb can explode during replacement. Correct disposal routes for bulbs should also be used. Direct contact between bulbs and fingers should be avoided. This minimises contamination or etching of the glass which would shorten the life of the bulb. Great care should also be taken not to scratch or otherwise damage glass optics. 5.16.1 Centring the light source and Kohler illumination To centre the light source, the condenser is placed as close to the stage as possible. A sample slide is placed on the stage and a low power objective, for example x 5 or x 10, is used to focus on a sample. The lamp iris is reduced until it is minimal then the condenser is focused to bring the edges of the iris into sharp relief. The condenser is then centred using the two screws positioned on either side of the condenser until the light appears to be in the middle of the field of view. The lamp iris is opened until the edges just touch the outer field of view and any finer adjustments necessary are made using the centring screws. The lamp iris is now opened until it is just outside the field of view. The extent to which the lamp iris is opened relates to the objective lens that will be used for examination of the specimen. The process should be repeated, for example when assessing a slide for Cryptosporidium oocysts using the x100 objective for DIC microscopy. This will minimise exposure of the specimen to intense light. The condenser iris may be adjusted to increase or decrease the image contrast. Once this is set the microscope has Kohler illumination. Specimen contrast is controlled by adjusting the condenser iris and light intensity by adjusting the rheostat on the lamp housing. 5.16.2 Calibration Objects viewed under a microscope can be measured to determine their size. Such measurements are done by using a graticule inserted into one of the eyepieces. This is a measuring scale placed in the eye-piece which is usually sub-divided into 100 units. The graticule can be calibrated using a stage micrometer. This allows the microscopist to determine the size of the eyepiece units by comparing them with a scale on the stage micrometer which is of known length. The microscope should be calibrated for each of the magnifications normally used for measuring. The stage micrometer usually contains a ruled length of 1 mm (1000 µm). The ruled length is divided into 100 units, numbered from 0 to 100, each measuring 10 µm. If the eyepiece graticule being used can be focused independently of the eyepiece, this should be undertaken prior to the calibration. The stage micrometer is placed on the microscope stage, the transmitted light turned on and the microscope focused on the micrometer image. Using the times 10 objective first, the microscope stage and the eyepiece are adjusted so that the zero line on the eyepiece graticule is exactly superimposed on the zero line of the stage micrometer. Without changing the stage adjustment, a point is found as distant as possible from the two zero lines where a line on the eyepiece graticule is again superimposed exactly on a line on the stage micrometer. The number of divisions on the eyepiece graticule and the number of divisions on the stage micrometer between the two points of superimposition is
28

determined. If, for example, 100 divisions on the eyepiece graticule measure 100 divisions (1000 µm) on the slide graticule, then one division on the eyepiece graticule measures 10 µm. This is usually the case for the x 10 objective. The procedure is followed for each objective. For example, with a x 20 objective, 1 eyepiece graticule calibrates to 5 µm and a with a x 100 objective, 1 eyepiece graticule calibrates to 1 µm. Calibration information should be recorded and kept with the microscope. The microscope should be calibrated at regular intervals, for example, annually. The microscope calibration should remain constant. If the calibration were to change, the reason for this should be investigated. 5.16.3 Care of the microscope Microscopes perform efficiently only when serviced regularly, at a frequency depending on usage and when correctly aligned (19). They should be protected from environmental contamination and used and set up according to manufacturer’s instructions. Details of servicing, including adjustments, replacement components and modifications should be recorded and the records maintained and stored. When not in use, the microscope should be protected with a dust cover to prevent optical surfaces from dust and other contaminants that might affect their performance. In addition, the optics and stage should be cleaned with lens tissue after use. 5.17 Microwave ovens Microwave ovens heat by using microwave energy and can be used to heat liquids, and melt agar quickly and easily before it is dispensed. However, certain precautions need to be taken when microwave ovens are used. When bottles of liquid are heated in a microwave oven, the liquid sometimes becomes super-heated and tends to boil, especially if the bottles are shaken when they are removed from the oven. Using low power for longer periods of time will minimise the risk of liquids becoming super-heated. Also, when bottles are removed from the oven they should not be shaken. Sealed containers can explode within the oven. Bottle caps or stoppers should therefore be loose before the bottles are placed into the oven, and bottles should not be removed from the microwave oven as soon as the heating process is complete, but should be left to cool down. If bottles of liquid are heated in a microwave oven they must always have an adequate headspace to allow expansion of contents without overflowing. Ovens fitted with a turntable can achieve better heat distribution. It is therefore important to establish, for each media type to be processed in a microwave, the power setting, time and number of bottles to be processed. These standard processing times and heat settings should also be verified to ensure that the performance of medium is not impaired. Microwave ovens should always be kept clean and any spillages that occur should be cleaned up immediately. Microwave ovens should be checked regularly for radiation leakage and to ensure that doors are well sealed. (Self-check devices are available but a recognised service engineer should be employed especially for high wattage devices). 5.18 Modified atmosphere incubation equipment Traditionally gas jars that can be sealed and that use commercially available gas generating packs to produce an anaerobic or micro-aerobic environment have been used. Systems are now available using sealed bags or other similar commercial products. These are suitable for the incubation of small numbers of petri dishes or similar items. For larger
29

quantities anaerobic cabinets and incubators are available. Commercial air-tight containers may be suitable providing they are of the correct volume for the gas generating pack (typically 2.5 or 3.5 litres). Anaerobic jars are used to encourage the growth of anaerobic and micro-aerobic bacteria. They usually comprise a polycarbonate jar with a close fitting lid held in place by a clamp. Older systems employed a catalyst which combined hydrogen with oxygen to produce water. Hydrogen was generated by adding water to a pouch containing sodium borohydride. Commercial (catalyst-free) gas generating paper sachets are now available. These use a selection of chemicals to remove oxygen and generate carbon dioxide. They are supplied sealed in packets and once the packet is opened, the reaction starts. Bottles and plates should be placed in the jar first followed by the anaerobic indicator (see below) before the packet is opened and the sachet is added. The reaction generates heat and condensation may appear on the inside of the jar. Great care should be taken to ensure the correct size of sachet for the appropriate volume of jar is used. Anaerobic jars should be cleaned after use and when contamination is suspected. Similar sachets are available for the generation of a micro-aerobic atmosphere for the isolation of Campylobacter. Cultures should be stacked loosely in the jar. Suitably vented petri dishes should be used (see section 6.7). These should be dried before use to prevent moisture collecting and inhibiting circulation. The caps of screw-topped containers should be loose enough to allow gas equilibration with the jar atmosphere. After loading the jar, the appropriate conditions are established, together with a means of establishing whether the conditions have been attained. This can be achieved using anaerobic indicator strips, or the inclusion of two QC bacterial cultures, one, which is aerobic, and another, which is micro-aerobic or anaerobic. The correct incubation of materials is only achieved if the indicator strip changes colour and the bacterial cultures show that suitable internal atmospheric conditions have been achieved. Before use, new batches of generators should be performance tested with appropriate anaerobic or micro-aerobic organisms. Larger anaerobic cabinets should be operated according to manufacturer’s instructions and serviced at regular intervals. In general anaerobic incubation requires an atmosphere of <1% oxygen and 9-13% carbon dioxide. Micro-aerobic incubation requires an atmosphere of 5-7% oxygen and ~10% carbon dioxide. 5.19 pH meters pH meters are designed to measure the hydrogen ion concentration at ambient temperature (i.e. 15 - 25 °C). They should be capable of measuring to +/- 0.1 pH units and have either manual or automatic temperature compensation. The measuring and reference electrodes are usually grouped together to form a combined electrode. When not in use, pH electrodes should be stored according to manufacturer’s instructions. In the microbiology laboratory the pH meter is mainly used to check the pH of each batch of culture media and reagents after sterilisation or preparation. On occasions it is used to adjust the pH of media before autoclaving. The pH meter calibration should be checked before each use. When in daily use, and supporting calibration stability data are available, it may be sufficient to undertake a full calibration weekly. This should be performed according to manufacturer’s instructions using 2 (or more) buffer solutions, compliant with ISO 17034, and covering the appropriate
30

pH range. Buffer solutions, if purchased pre-prepared, should be used within their expiry date. A third standard buffer, usually mid-range between the two calibration points, may be used to verify the performance of the meter and the validity of the calibration. The calibration should be checked daily using the same pH buffers. This check should be undertaken daily or before each use of the meter if used less frequently. A full recalibration should be undertaken if this check gives unsatisfactory results. Calibration details and the results of calibration checks should be recorded and retained. Unused buffer solution should be discarded and not returned to the stock bottle. The response of electrodes (for example slope and millivolt output) should be checked daily. The meter should also be subject to routine internal AQC using a different value buffer from a different manufacturer. If results of the AQC or other checks are outside acceptable values, the pH meter must not be used unless a full recalibration rectifies the situation. Flat-tip membrane electrodes or spear-tip electrodes are suitable for measuring pH values of solid media, simply by touching the surface or spearing the agar. Flat-tip membrane electrodes may require the filling solution to be replaced at regular intervals, according to the manufacturer’s instructions, as electrolyte can leach from the end of the electrode. Particular attention should be paid to rinsing the electrodes after use, as a build-up of organic material can severely inhibit electrode response. The electrode must not be allowed to dry out and wet storage, in a buffer or storage solution, recommended by the manufacturers should be used. 5.20 Pipettes and Pipettors Many laboratories use sterile glass or plastic disposable pipettes for routine microbiological purposes. These pipettes deliver the measured volume between the graduation and the tip of the pipette. Any pipettes that are damaged, or broken, should therefore be discarded. Volumes are usually dispensed with the aid of a pipette bulb or mechanical device and pipettes can be plugged with non-absorbent cotton wool to prevent contamination of the contents of the pipette and the bulb when pipetting samples and cultures. A representative number of pipettes from each new batch or manufacturer should be checked to confirm delivery of correct volumes. This can be achieved by weighing volumes of water and verifying the weights against set tolerances. Ten replicate weighings are usually performed, the standard deviation, percent coefficient of variation (%COV), also known as relative standard deviation (%RSD), and inaccuracy can then be determined. Automatic pipettors and pipette tips can be used to dispense fixed or adjustable volumes of liquids. This is achieved by air displacement using a manually operated or electrically powered piston within the pipettor. There is a risk of the pipettor barrel or piston becoming contaminated and, therefore, plugged pipette tips or a barrel filter should be used. A pipette tip of the correct size for the pipettor should be used in accordance with manufacturer’s recommendations. Loosely fitting tips may leak, may not deliver the correct volume or may fall off the end of the pipettor when being used. Automatic pipettors should not be laid down on a bench but stored in suitable holders/chargers when not in use. Some automatic pipettors are autoclavable but particular care is required with calibration checks. They must be kept clean, particularly if there is any hint of internal contamination for example when dispensing media. Ideally individual pipettors should be dedicated to a particular task and location. Pipette tips can be purchased sterile, packaged either as individually wrapped, or in small convenient numbers. Pipette tips can also be placed into suitable containers and sterilised by autoclaving at 121 °C for 15 minutes. If containers are wet on removal from the
31

autoclave they should be dried, by placing them in an incubator or plate dryer, before being used. Should the outside of the pipettor become contaminated during use it should be disinfected, by wiping with 70 % ethanol or 2-propanol, before further use. New pipettors should be calibrated before use, and at suitable intervals, according to manufacturer’s instructions. This can be achieved by weighing volumes of water, taking into account variations in the temperature and therefore density of the water used. The volumes chosen should represent the range of volumes for which the pipettor is likely to be used. For each volume chosen, the data are recorded and used to calculate mean volume dispensed, standard deviation and coefficient of variation. Ideally, the coefficient of variation should be less than 1 % and the bias should be less than 2 % of the volume chosen, or less than 1 % where accuracy may be more critical, for example in the preparation of a standard. The coefficient of variation and bias required will vary depending the use and the general advice given above may not be applicable in some circumstances. It is for the laboratory to set fitness for purpose criteria based on its requirements. Intermediate calibration checks should be undertaken on a regular basis, for example daily or weekly, depending on the use of the automatic pipetting device. Details, for example dates and staff undertaking calibrations, should be recorded and stored for each pipettor. Pipettors can also be sent away to approved suppliers for re-calibration. 5.21 Protective cabinets Protective cabinets can be either defined as a microbiological safety cabinet (MSC) or a laminar flow hood. A MSC can be defined as a ventilated enclosure intended to offer protection to the user and the environment, for example from aerosols arising from the handling of potentially hazardous and hazardous micro-organisms, with air discharged to the atmosphere being filtered. There are three classes of MSC. Class I cabinets are open fronted and designed to protect the operator by continuously drawing air into the front of the cabinet away from the worker then exhausting through a high efficiency particulate air (HEPA) filter. Class II is also open fronted and is designed so that the work area is kept clean by a down-flow of HEPA filtered air across the work. This protects the worker and the product but can be affected by air movements outside the cabinet. Class III cabinets are totally enclosed to contain hazardous agents on which work is conducted through gloves attached to ports. Air enters through a HEPA filter and is exhausted in a similar way to a class I cabinet. Laminar flow hoods provide a filtered air flow that protects the worker and removes dust and other particles depending upon the type of filter installed. They can be used as powder weighing cabinets and to provide an environment for handling sterile products. They can also be used to reduce smells, when handling sewage sludge samples for example and protect the worker against certain chemical vapours providing the correct type of filter is installed. This is in effect a class 1 cabinet exhausted through an activated carbon filter. The space inside cabinets should be kept as clear of equipment as possible and gas burners must not be used inside cabinets. Use of sterile disposable loops, etc., provide a suitable alternative to remove the need for a gas burner. Operators must be fully trained in the purpose for and operation of each cabinet and know the type of work that can be undertaken within it. All cabinets should be serviced, inspected and maintained according to the manufacturer’s instructions and records should be retained. Formal inspections are required on an annual basis by authorised persons where air flows and general efficiency of the cabinet are measured. Spent filters should be replaced as required. Cabinets should be kept clean and disinfected prior to inspection.
32

5.22 Refrigerators and freezers Refrigerators include chillers and cold storage rooms where the temperature is maintained at 5 ± 3 °C. They are used for the storage of media, reagents, cultures, materials & samples. Un-inoculated media, sterile materials and reagents should be stored in separate refrigerators or compartments to cultures, and should not be stored in such a manner that the temperature of the compartment is adversely affected. Ideally, samples should not be stored in the same refrigerator as media. Where this is not feasible they should be kept separate in dedicated areas so as to minimise the risk of contamination. Spark free units should be used for the storage of volatile or flammable reagents. Each refrigerator should contain a calibrated thermometer or temperature measuring device which is used to record the temperature on a regular basis. Continuous monitoring devices are preferable provided they are checked regularly. Even temperature distribution within the refrigeration space is important and for large capacity refrigerators should be established. This can be assessed by placing thermometers, or temperature recording devices, in different parts of the refrigerator over a period of time, for example over a 24-hour period, and recording the temperature at regular intervals. This can also be achieved by using a multipoint instrument that is traceable to national standards. The temperature profile of the refrigerator should show no significant differences wherever the temperature measuring devices are placed. A freezer is a chamber which allows frozen storage to take place. Freezers usually operate at a temperature of around - 20 °C ± 5 °C, but deep-freeze cabinets that operate at a temperature of - 70 °C ± 10 °C and below are available. Freezers are used to store microbiological cultures, some reagents and chemicals as well as samples and sample preparations for analysis. The freezer should be loaded and unloaded so that a low temperature is maintained. As with refrigerators, the temperature of freezers should be checked regularly. Modern refrigerators and freezers are usually available as frost-free items, but older equipment may require regular defrosting. Refrigerators and freezers should be defrosted when needed and kept clean. Routine cleaning should be undertaken, for example 3 monthly, with clean warm water and using a clean non-abrasive cloth. Detergents and disinfectants should only be used rarely, for example when a spillage has occurred or the cabinet is known to be contaminated. Spillages should be cleaned up immediately on discovery. Where detergents or disinfectants are used the surfaces should be thoroughly rinsed afterwards and allowed to air dry before reintroducing materials and cultures that might be affected by them. Periodically they should be inspected for leaks and damage. 5.23 Sample preparation devices (Blender, Homogeniser and Pulsifier®) Equipment of this type is used to prepare initial suspensions of a variety of solid and semi-solid substances that can then be analysed by standard microbiological techniques. The choice of equipment depends upon the matrix of the material being analysed. Unless forming part of an established procedure the recovery performance characteristics of the device to be used should always be ascertained for each new matrix. A blender has a blade in the base that rotates rapidly and samples are placed in a sterilisable metal or glass vessel that is placed on the base assembly.
33

A peristaltic homogenizer (stomacher) with suitable plastic bags can be used for the suspension of sewage sludge matrices. Digested sludge can be homogenized easily but sludge cake and derivatives may need to be multi bagged to prevent perforation and homogenized for a longer time to achieve homogeneity. Typical operating times are 1-3 minutes. The Pulsifier is a patented type of mixer, widely used in food sample preparation, employing high frequency shock waves to the material in a plastic bag. It is reported to be less destructive of the sample with less risk of bag burst. Operation should be according to the manufacturers’ instructions. Preparation devices should be kept clean and any spillages removed immediately. They should be disinfected regularly and particularly after potential contamination for example due to bag leakage. Servicing and calibration should be undertaken in accordance with manufacturers’ instructions. 5.24 Spiral platers Spiral platers can be fully or semi-automated and a spiral plate method can make rapid colony enumeration possible while avoiding all or some of the intermediary dilutions that would otherwise be required. The principle is that a logarithmically decreasing volume of sample is dispensed on the surface of a rotating Petri dish in an Archimedes spiral. After incubation colonies develop along the lines where the liquid was deposited. The volume is calibrated and known at every point of the Petri dish. Bacterial concentration is determined by dividing the number of colonies found by the volume dispensed in the same sector of the dish. A micro-processor in some units allows rapid calculation of bacterial numbers. The dispensing system should be sterilised and rinsed and the sterility of the unit should be verified by plating sterile water at the start of each run. The dispensing pattern can be verified using washable ink. The ink should be densest near the centre of the plate. A gravimetric check of the volume dispensed should be performed using water. The weight obtained should be within 5% of the expected weight for the volume dispensed. The equipment should be kept clean, any spillages being removed immediately and serviced and calibrated according to manufacturers’ instructions. 5.25 Steamers and boiling baths Steamers and boiling water baths may be used for melting agar and decontamination of small items of equipment such as filter funnels between uses. Steamers generate steam at atmospheric pressure and boiling baths heat a body of water to boiling point in a small vessel with a lid. In both cases, if permissible in the manufacturers’ instructions, distilled or deionised water should be used for preference otherwise regular descaling may be necessary depending upon the hardness of the water used. It is necessary to ensure that there is an adequate volume of water present in the unit so that it does not boil dry and for boiling baths that items to be decontaminated are fully immersed. Care should be taken in the operation of these units to prevent scalding.
34

5.26 Temperature recording devices, (thermometers and thermocouples), and temperature control Thermometers may be of the mercury-in-glass or alcohol-in-glass type and are available for a wide variety of temperature ranges and in sizes appropriate for monitoring temperature in diverse laboratory applications. They are available calibrated to national standards and un-calibrated. Certified and calibrated thermometers require re-calibration and certification at pre-determined intervals typically every 5 years. Certified thermometers can be used to calibrate laboratory reference thermometers that may subsequently be used to calibrate working thermometers used to measure temperatures within the laboratory. Electronic temperature recording devices include thermocouples and platinum resistance thermometers. The temperature reading is transferred to a display or recorder by wire or radio wave transmission. Depending on the system a visual, hardcopy or electronic record of temperature observations or data at set time intervals is made. Some units can initiate alarms that alert users to out of range temperatures both in the laboratory and via telecommunication networks. Digital thermometers are also available. When thermometers, or temperature recording devices, are used, they should be capable of measuring a given temperature within a specified tolerance. For temperatures between 20 - 40 °C, for example in incubators, the maximum fluctuation around the given temperature should be ± 1 °C. In these circumstances, thermometers, or temperature recording devices capable of measuring within ± 0.5 °C can be used, but those measuring to within ± 0.2 °C provide more accuracy. For regulatory drinking water compliance purposes, it may be more appropriate to use thermometers, or temperature recording devices that measure to within ± 0.1 °C. For incubators set at 40 °C or above, the maximum fluctuation around the given temperature should be ± 0.5 °C and thermometers, or temperature recording devices should measure to within ± 0.1 °C. For dual temperature incubation (for example, incubation at 30 °C and 44 °C) two thermometers may be required due to available ranges of thermometers. With such sensitive equipment and in order to prevent heat loss when the temperature is measured, thermometers, or temperature recording devices can be placed in suitable plastic or glass containers filled with an inert liquid. Suitable liquids comprise glycerol, liquid paraffin or propylene glycol. These liquids stabilise temperature measurements when the thermometer or items are removed from the incubator for reading. Bottles containing thermometers should be placed in the incubator in locations reflective of the incubated samples or materials. Mercury-in-glass thermometers are fragile and may, if broken, present a health hazard. Consequently, they should be placed inside protective cases that do not interfere with the temperature measurements. Thermometers should not be used if the mercury or alcohol column is broken. Working thermometers should be calibrated at regular intervals, usually on an annual basis, and any errors compared with the reference thermometers and should be no greater than the tolerance of the reference thermometer. It is essential that electronic temperature recording devices be regularly calibrated against certified thermometers or other calibrated temperature recording devices certified to national standards. No measurement is perfect it has an associated uncertainty arising from many factors including errors and imperfect reproducibility. Ideally each measurement should be quoted with an indication of the uncertainty, often as a ± figure, so that decisions based on the measurement are fully informed(17). The uncertainty must be within the tolerance for the
35

method, i.e. a reading of 30.9°C using a thermometer with a discrepancy of +0.2°C would be outside 30°C± 1°C. Where more than one uncertainty is known to apply the uncertainties must be added together. 5.27 Timing devices Timers and integral timing devices may be analogue or digital and are used in applications where a specified time interval is required. They must be kept clean and be capable of achieving the degree of accuracy required and verified depending upon application and usage against the national time signal. Timers which are integral to equipment such as autoclaves and incubators, etc. should be operated according to manufacturer’s instructions and checked / calibrated periodically during servicing. Replacement batteries and suitable arrangements for backup power should be available. 5.28 Ultra violet steriliser cabinets Ultraviolet (UV) steriliser cabinets can be used as an alternative means of disinfecting some equipment, for example membrane filtration funnels, between uses. However, this approach may not be suitable for all types of filter funnel base. The wavelength and intensity of UV irradiation and the length of time of exposure are critical to the success of this approach. The specifications of commercial UV sterilisers may vary and the user will need to verify the conditions suitable to achieve disinfection for their intended application. This approach may be effective to disinfect the units for example by inactivating coliforms, E. coli and Enterococci but more stringent conditions may be required for spore forming indicator organisms such as Clostridium perfringens. A record of the verification data and conditions used should be kept along with periodic checks on equipment performance. The timing device used to judge length of exposure should be calibrated regularly (section 5.27). There are particular health and safety risks when using UV and these should be assessed and suitable precautions taken. The equipment should be used in accordance with the manufacturer’s instructions. Daily checks should be made on performance and bulbs should be replaced annually and as necessary in between. Records should be maintained of performance checks, bulb replacements and any faults encountered. 5.29 Vortex mixers A vortex mixer is used for mixing the contents of tubes or bottle preparations such as decimal dilutions of a suspension of bacterial cells in a liquid. The base of the tube or container is pressed against the mixer head and a vortex forms in the liquid mixing the contents. The speed can be controlled on some models. Care should be taken that the container is large enough so that liquid does not spill out of the tube during mixing. Equipment should be kept clean and if spillage does occur the unit must be disinfected. Excessive use of hand held applications should be avoided due to the possibility of adverse vibrational health effects. 5.30 Water baths Thermostatically controlled water baths may be used to incubate certain cultures or keep agar media in a molten state until ready for use. They usually comprise a stirrer or
36

circulating pump with a heating element and thermostat. A sloping lid is usually fitted to minimise loss of water by evaporation. When water baths are used to incubate cultures, the water should be distilled or deionised, always be stirred or circulated within the bath and switched on only when the water is at the recommended level. When in continuous use over long periods they should be drained and cleaned at regular intervals and wiped out with a suitable disinfectant (for example 70 % ethanol or 2-propanol) before being refilled. When not in use, water baths should be drained and cleaned before storing according to manufacturer’s instructions. When in use, the temperature of the water should be measured at regular intervals. The minimum number of readings that should be taken includes one at the beginning of the working day, before cultures have been removed, and one at the end of the working day or when samples are placed in the bath, using a calibrated thermometer or temperature measuring device. An integral temperature display is usually for visual guidance and can only be used as a sole temperature reference if its accuracy has been verified. Continuous temperature monitoring may be considered, as for incubators. Care should be taken when loading the bath that the level of contents of a bottle or tube is below that of the water. Suitable racks or stabilising devices should be used to prevent water ingress or spillage of the contents of tubes or bottles. Spillages must be dealt with immediately as they can result in serious contamination of the water and bath contents. Even traces of culture media can promote significant growth of bacteria in the water. 5.31 Water purifiers - distillation units, deionisers, and Reverse Osmosis (RO) devices Water produced for preparing microbiological culture media, reagents and other laboratory applications must be of a suitable quality (see section 6.5). The choice of system depends on the quality requirements of the application, the volume required and the mineral content of source water to be treated. Apparatus varies from simple stills that produce distilled water to more complex units that may have a number of processes including pre-filters, deioniser columns and reverse osmosis units. Some systems including storage reservoirs may include re-circulation pumps and UV irradiation to preserve the quality of the treated water ready for use. Purified water left standing may deteriorate over time due to exposure to air, by dissolution of gases and trace organic chemicals which may result in changes in pH and conductivity or promote microbial growth. All equipment should be installed, maintained and used in accordance with manufacturer’s instructions. Stills should be de-scaled and cleaned as required depending upon the hardness of the water in the area used. Other units require filter changes depending upon usage. Some components may require replacing at intervals to ensure continued performance to specification. All water produced should be checked at regular intervals and after replacement of cartridges or cleaning. It is advisable to keep comprehensive records of maintenance.
37
6 Materials and techniques used in a microbiology laboratory Chemicals used in a microbiology laboratory should be of analytical grade quality where these are available. Where appropriate, reagents and chemicals should be stored and used in accordance with the manufacturer’s instructions. They should be discarded if the expiry date, i.e. the date by which the reagent should be used, has passed. Reagents and chemicals are usually supplied with a safety data sheet and toxicity data. Records of these data should be kept, and any specific hazards assessed and documented (8). Chemicals and reagents should always be handled with care and any spillages that occur should be cleaned up immediately. 6.1 Media Media have been formulated for the culture of micro-organisms including a wide range of bacteria but also yeasts and other microfungi. Most media are available commercially in powder form. Manufacturers may supply media and materials in a number of different formats which include: • Complete medium containing all the ingredients, for example membrane lauryl
sulphate broth (MLSB) for the enumeration of E. coli and coliform bacteria from a water matrix
• As an incomplete medium which contains most of the ingredients but requires the
addition of a supplement, for example the antibiotic kanamycin, to complete the medium as in kanamycin aesculin azide agar (KAAA) for the confirmation of enterococci
• Individual ingredients to be used in the preparation of a medium where the complete
medium is not available, for example yeast extract and skimmed milk powder used in the preparation of cetrimide milk agar for the confirmation of Ps. aeruginosa
• Supplementary ingredients to be added to a medium either to
• enhance microbial growth, for example horse blood
• a diagnostic supplement, for example urea for urea hydrolysis
• as a selective supplement, for example kanamycin • Complete ready prepared medium, either as sterile broth or agar in tubes or bottles or
Petri dishes containing pre-poured agar. Liquid media are often given the term “broth”. A broth may be either non-selective i.e. enabling most bacteria to grow in it, for example nutrient broth or selective allowing only certain bacteria to grow. For more fastidious bacteria, nutrient broth No. 2 or brain heart infusion broth may be used. Non-selective broth is used for the general cultivation of bacteria. Specific ingredients may be added to demonstrate particular characteristics, for example lactose and a pH indicator for lactose fermentation or to make the broth selective for the isolation of specific types of bacteria. Reagents and powders used to prepare broths should dissolve readily in water at room temperature to produce a clear solution. 38

Solid media are often given the term “agar”. An agar may be either non-selective i.e. enabling most bacteria to grow on it, for example nutrient agar or selective, enabling only certain bacteria to grow, for example M-enterococcus agar (MEA) for enterococci. Non-selective agar is used for the general cultivation of bacteria. For selective agars, specific ingredients may be added, for example sodium lauryl sulphate in membrane lactose glucuronide agar (MLGA) for the isolation of E. coli and coliforms. Reagents and powders used to prepare agar media should dissolve readily in water when boiled to produce a clear solution. Further guidance on the general requirements for the preparation, production, storage and performance testing can be found in EN ISO 11133(20). 6.1.1 Different types of media Nutrient media, either as broth or agar are designed to enable a wide range of bacteria to grow, including those routinely sought in water analysis. Broths or agars may be non-selective in the types of bacteria that can grow on or in them, for example yeast extract agar for the enumeration of heterotrophic bacteria. Chemicals or supplements can be added to non-selective media to make them selective for specific bacteria or to enable the differentiation of one bacterial species from another. Different types of media have been classified with their own terminologies and definition(20) for example: • A differential medium is one which enables the testing of one or more physiological or
biochemical characteristics of a micro-organism to be determined, for example the fermentation of lactose
• An enrichment medium, usually a liquid medium, contains chemicals which suppress
the growth of unwanted or non-target organisms whilst allowing target organisms to grow. Once incubation is complete, the number of target organisms usually exceeds those of unwanted or non-target organisms for example Rappaport broth for the isolation of Salmonella
• A selective medium, whether in solid or liquid form, enables target organisms to grow
whilst suppressing the growth of unwanted, non-target organisms. The medium may also contain chemicals which permit the differentiation of organisms, for example XLD agar for the isolation of Salmonella. As a solid medium, target organisms can grow on the surface of the medium and be identified and sub-cultured either to another medium or used for further biochemical or serological testing.
6.1.2 Basic constituents of media Most routine media, whether nutrient, enrichment or selective, comprise a basic set of ingredients which provide carbon, nitrogen, vitamins and minerals to support microbial growth. The commonest ingredients include peptones, either as an aqueous extract or an enzyme digest of meat. Other ingredients include yeast extract (an acid hydrolysis of yeast), meat extract and casein hydrolysate (an acid extract of casein). Tryptone (an enzyme digest of casein) is rich in the amino acid tryptophan, a pre-cursor for the production of indole. Tryptophan is, therefore, one of the basic constituents of the medium tryptone nutrient agar (TNA) used for demonstrating the production of indole for the confirmation of E. coli. Mycological peptone is a special peptone used for the growth
39

of fungi. For further information on the quality of ingredients that should be used for media preparation reference can be made to EN ISO 11133(20). 6.1.3 Agar Agar is a polysaccharide which is extracted from seaweed. It is commercially available as a powder and is usually added to a broth at a concentration of between 1 – 1.5% m/v depending on the purity of the agar. The addition of agar creates a gel which, when cooled to below approximately 42 °C, provides a solid surface, suitable for the support of growth and colony development. Colonies may then be counted and, for example by careful study of the morphology or colour, different species may be recognised and cultures identified as pure (i.e. of one colony type only) or mixed. Single isolated colonies can also be selected for sub-culture to new agar plates to provide pure cultures. Different manufacturers supply agar of different levels of purity. Agar is routinely used at a concentration of between 1.2 and 1.5% m/v in order to provide a gel of a suitable strength for agar plates. Lower concentrations, typically about 0.7 – 0.8% m/v may be used to produce a semi-solid agar which may be used, for example, for the assay of bacteriophages. A more purified agar will produce a gel of suitable strength at a lower concentration, usually about 1%. In addition, these agar plates will generally be clearer. Agar will only dissolve completely when heated in water to boiling point. On cooling agar solutions solidify or set, at approximately 42 °C. It is this property of agar that makes it particularly useful in microbiology for enumerating micro-organisms by either direct spread plate (on the solid surface) or as pour plates (within the agar). Failure to dissolve agar completely or to mix the solution adequately once the agar has dissolved, or melted, may result in an incorrectly formed gel, having weak gel strength, when transferred to a Petri dish. Following inversion of the Petri dish the medium may fall out. Agar should set to give a smooth, even, surface. Incorrectly prepared agar may give an uneven surface or lumpy appearance. 6.2 Storage of dry media Most manufacturers supply media as dehydrated formulated powders. They also provide data on batch numbers, expiry dates and details of the preparation of media. Whilst details of the preparation and sterilisation of media may be provided, these should also be documented in the analytical method (see section 7.1). Containers of media should be stored in a cool dry place, and labelled clearly with the date of receipt and the date when the container is opened. When a container is opened for the first time, the laboratory should allocate an expiry date to the formulation relative to its potential deterioration. Most powdered media are hygroscopic. After the container of medium has been opened and powder removed, the lid should be replaced and tightly secured to reduce the potential for absorption of moisture. Over a period of time, some media may absorb excessive amounts of water and may solidify. This usually results in discolouration of the media and deterioration of their nutrient or selective properties. Such media should be discarded even if the expiry date of the medium has not passed. Supplements for media can also be purchased from manufacturers. Most are in freeze-dried form and should be stored and used according to the manufacturer’s instructions. Supplements should also be labelled with the date of receipt and discarded when the expiry date has passed.
40

6.3 Preparation of media Media should be prepared by weighing out the appropriate amounts of the individual ingredients or the amount of material required for the formulated product and adding the appropriate volume of distilled, deionised or similar grade water (see section 6.5). Many media contain selective chemicals and where these are supplied as powders, appropriate containment measures should be taken for example, the use of respiratory protection to prevent powders being inhaled. Autoclaving may change the pH of the medium and whilst it is often not essential, the pH of the medium may require adjustment before sterilisation. The pH cannot be adjusted after sterilisation is complete. Adjustment of the pH should be carried out by the addition of small volumes of an appropriate concentration of hydrochloric acid or sodium hydroxide (for example 1 M) until the required pH value is achieved. For example, when membrane lauryl sulphate broth is used for the enumeration of coliform bacteria in water, it should have a pH of 7.4 ± 0.2 after sterilisation. Sterilising the solution by heating may cause the breakdown of lactose in the medium and a lowering of the pH. It may therefore be necessary to raise the initial pH of the medium by 0.2 - 0.4 pH units to ensure that, after sterilisation, the final pH of the medium is 7.4 ± 0.2. The pH of any prepared medium should be measured, using a specially kept sub-sample or sacrificial poured plate, as soon as practicable after it has reached room temperature. Media should not be allowed to stand at room temperature for significant periods of time (ideally not more than 2 hours) before testing, as the pH may change over time. All dehydrated media should be completely dissolved before being dispensed and sterilised as any un-dissolved powder in the bottom of containers may char and degrade during the sterilisation process. Broths, once dissolved, can be dispensed into suitable containers for autoclaving. Any medium which contains agar should be brought to its boiling point before it is dispensed. Un-dissolved agar is granular and quickly settles out from suspension. It is therefore impossible to dispense the correct amount of agar into containers unless the medium has been dissolved by boiling. Alternatively, powders containing agar may be dispensed into containers directly and thoroughly re-suspended before autoclaving. The agar will settle to the bottom of the bottle during autoclaving and, whilst it will dissolve, the concentration of agar in the bottom of the bottle will be much higher than the concentration at or near the surface (see white colouration in Figure 6.3.1). Bottles of media autoclaved in this way should be carefully mixed to distribute the agar after autoclaving and whilst the medium is still molten. Figure 6.3.1 A bottle of agar where the concentrated agar is at the bottom (white layer)
41

Bottles of medium prepared for sterilisation must always have sufficient headspace to minimise the risk during sterilisation of a build-up of pressure within the bottle or medium being lost through vigorous boiling. The headspace will also facilitate thorough mixing of the medium during cooling and dispensing. The procedure used for filling the bottles and for their sterilisation should be fully described to ensure consistency in the medium’s production and in its quality control. A suitable default starting point would be for bottles to be filled to no more than two thirds of the capacity of the bottle for example, 300 ml of medium in a 500 ml bottle. The maximum volume of medium sterilised in a single bottle or flask should normally be no more than 500 ml in, for example, a one litre bottle or flask. Larger volumes of medium will take much longer to warm up during the autoclave cycle and may fail to reach the correct temperature for the appropriate length of time during the sterilisation cycle. Some media constituents may be denatured if the sterilisation temperature or the holding time is increased. Autoclave and media preparator cycles should be validated taking account of the media volumes being sterilised to ensure that the correct conditions are being achieved. 6.4 Preparation using media preparators Operation of media preparators depends on the model purchased, but in general the sterilisation chamber is part -filled with distilled or deionised water and the correct weight of dehydrated medium added. The remaining water is added to make the final volume required. This helps to mix the powder and avoid clumping. An atomizer spray containing deionised water is useful to damp down any powder that may become airborne, and also to wet the seal to aid closure. Capacities for volume of medium prepared in a single cycle vary between preparators. 6.5 Water The quality of water used for the preparation of culture media is critical. Tap water should never be used because it may contain relatively high concentrations of ions such as calcium or phosphate causing cloudiness or precipitation to occur in the medium. In addition traces of toxic metals from plumbing materials, such as copper, may be present or the water may contain significant amounts of chlorine, both of which are inhibitory to the growth of micro-organisms. Pure water suitable for culture media may be produced by distillation, deionisation or reverse osmosis. Whichever process or combination of processes is used, the water should have the following properties: • It should not contain toxic metals or chlorine • It should have a low conductivity, ideally less than 10 micro-Siemens/cm (10 µS/cm) • It should have a low microbial load when examined by a heterotrophic plate count
(HPC) at 22 °C. Counts should ideally be less than 1000 cfu/ml and should not exceed 10,000 cfu/ml
Pure water should be stored in containers made from inert materials, for example glass or polyethylene. Pure water should be checked at regular intervals to ensure a constant water quality and where the quality fails to meet the above standards, an investigation should be undertaken to identify and remediate the problem. If, for example, the HPC exceeds 104 cfu/ml, consideration should be given to draining the container and cleaning
42

thoroughly before re-filling. More information on water quality for microbiological media can be found in ISO 11133(20). 6.6 Sterilisation of media Media should be sterilised, usually by autoclaving, within 2 hours of initial preparation. Leaving unsterilised media in a warm place for periods longer than 2 hours can lead to microbial growth and potentially to changes in the properties of the medium. Sufficient prepared medium should be kept in suitable separate portions to check its final pH and to determine its growth and selectivity characteristics before the remaining bulk of the medium is used. Once a batch of medium has been prepared, a batch number should be allocated to this medium before it is autoclaved. This batch number may then be used for quality control and analytical test recording purposes. Once prepared for sterilisation the caps, stoppers or screw tops of media containers should be loosened, for example by a quarter turn for a screw cap bottle, before loading into the autoclave or steamer. This prevents dangerous pressurisation of the container during sterilisation, which could otherwise cause rapid boiling when the container is moved, possibly resulting in explosion and/or the violent discharge of hot liquid. Typically, media are sterilised by autoclaving at 115 °C for 10 minutes, for example for MLSB, or 121 °C for 15 minutes, for example for nutrient agar. In a few instances, for example MEA, where the medium is highly selective, it is sufficient to bring the medium to the boil to dissolve the agar. The manufacturers’ instructions should be followed. It is important that media are not over-heated during sterilisation as this may lead to a breakdown of nutrient, selective or supplement properties. A medium should not be autoclaved more than once, even to melt it for use. Equivalent sterilisation cycles are used in a media preparator but in this case the medium is mixed during the cycle. Whilst sterilised media should be removed from the autoclave as soon as practicable after sterilisation is complete, care should be taken in handling media as it may be super-heated and boil rapidly once removed from the autoclave. The tops on the containers may be tightened and agar-containing media mixed carefully and allowed to set. Alternatively, once cooled, media may be dispensed into Petri dishes or tubes for use. A portion of these Petri dishes or tubes should undergo quality control tests to demonstrate that the medium is satisfactory for routine use (see section 6.10). After sterilisation is complete in a media preparator, the instrument will enter the cooling phase and quickly bring the contents down to around 50°C. The media preparator will then hold this temperature for the duration of the dispensing phase. At this stage additives or supplements may be aseptically added through the filling port. Addition at this stage ensures that heat-labile supplements are not deactivated. Since the machine continues to mix, this also ensures homogeneity in the finished medium. The finished medium is usually dispensed by fitting a clean sterile dispensing tube to the integral peristaltic pump. Spare bagged sterile tubing sets should be available in case contamination is suspected. Wrapping the connectors and dispensing nozzle suitably, for example in foil, helps prevent contamination when fitting to the pump and stacker module. To dispense the medium the tubing must first be primed and then calibrated to deliver the required volume per plate, bottle or tube. Once dispensed media may be allowed to
43

remain on the stacker carousel until solidified; after which it should be removed promptly and stored as described in section 6.8. Solidified and liquid media prepared in bottles as a bulk batch may be stored in the dark at room temperature (ideally, not more than 25 °C). Whenever practical these should be subjected to quality control tests and only used when the tests have shown that the medium gives satisfactory performance. Each batch of medium should be allocated a storage period, indicating the maximum period up to which the medium may be stored. This period should be stated in the method and confirmed through suitable testing in the laboratory to establish the shelf-life of the medium. Agar containing media can be melted by heating in a boiling water bath, in steam at normal atmospheric pressure or in a microwave oven at low power, for example, 300 watts. In each case a period of time just sufficient to ensure that the agar is thoroughly molten should be used. 6.7 Petri dishes Petri dishes may be made of glass or clear plastic and are available in a variety of diameters from 50 to 90 mm. Typically 50 to 60 mm dishes are used for membrane filtration and 90 mm dishes are used for colony counts, sub-culture and confirmation of bacteria. Glass Petri dishes can be re-used by sterilising, washing and re-sterilising after each use. Plastic Petri dishes are provided, typically as batches of 10 or 20 units, in sterile packages. They are used once, autoclaved and discarded. Plastic Petri dishes are available un-vented or as single or multiple vented dishes with vents on the underside of the lids. Multiple vented Petri dishes should be used when circulation of air or gases is required to create the correct atmosphere for micro-aerobic or anaerobic cultivation. 6.8 Cooling, storage and dispensing sterile media Molten media containing agar should be cooled, for example in an incubator or water bath, to approximately 50 °C before being dispensed into Petri dishes or sterile tubes. Media should not be dispensed at temperatures above 50 °C as this may lead to excessive condensation in the Petri dish during cooling and subsequent storage. Sterile supplements can be added at this point before the medium is dispensed. Media should not be left standing at 50 °C for long periods of time as to do so may impair their nutrient or selective properties. Media should be dispensed into Petri dishes on a flat, freshly cleaned and disinfected, work surface. Approximately 20 – 25 ml of medium should be poured into each 90 mm Petri dish or about 10 ml of medium into each 50 – 60 mm Petri dish to give a minimum depth of 3 mm and no more than 7 mm. Smaller volumes of medium may result in the medium drying out during storage or incubation. Once poured, the medium should be left to solidify, the dish then being inverted and the medium stored at 5 ± 3 °C(17) in such a way as to prevent excessive drying of the medium. Individual Petri dishes should be labelled with the medium reference, for example NA for nutrient agar, the batch number and an expiry date. If stored in an airtight container, this container may be labelled with the same information. When medium contained in a Petri dish shows signs of excessive dehydration such as thinning, deepening in colour or detachment, the dishes should be discarded. It would be prudent to ensure the preparation of media is planned to make sure that adequate supplies are available, and that the need to discard un-used media is kept to a minimum.
44

It is good practice not to leave plates of freshly prepared medium on the bench for long once poured and cooled. They should not be subject to exposure to sunlight and should not be left out for more than two hours. The action of sunlight on media produces superoxide radicals such as peroxides and other toxic substances which may inhibit the growth of certain bacteria. When a medium has been prepared, it should be transferred as quickly as possible to a dark environment. Media that show obvious signs of contamination or deterioration should be discarded.
Where small volumes (for example 9 ml) of diluent, for example Ringer’s solution, are required to dilute samples, these volumes should ideally be dispensed aseptically into sterile containers after the diluent has been sterilised. Diluents containing nutrients, for example MRD, should ideally be used immediately. They may be stored, for example at 5 ± 3 °C, but should then be used as soon as possible due to the risk of contaminant growth and deterioration. In some circumstances it may be preferable for a laboratory to dispense volumes of diluent prior to sterilisation, for example to minimise potential contamination in diluents containing nutrients, when for logistical reasons they will not be used immediately.
Dispensing the diluent into containers prior to autoclaving may result in changes during sterilisation and subsequently inaccurate strength and volume of diluent in the containers. This will lead to inaccuracies occurring in subsequent serial ten-fold dilutions. It is therefore essential, when diluent is dispensed before sterilisation, to verify that the correct volume is present before using it for performing test dilutions. In addition, a consistent approach is required to sterilisation conditions including, for example load size and distribution within the autoclave. The volume of diluent that needs to be dispensed prior to autoclaving to achieve the correct volume in the cooled sterile product must be established. A verification process should be applied to every batch prepared, before releasing it for use, to demonstrate within an acceptable tolerance that the diluent volumes are correct. The results of the verification should be retained with the batch preparation record. Media in Petri dishes that have been stored at 5 ± 3 °C should be dried before use. This may be achieved by leaving the media at room temperature, that is no greater than 25 °C, for 2 hours. Alternatively, dishes may be placed in an incubator at 37 °C for 30 minutes to assist drying but this should be carefully controlled to prevent contamination and excessive drying. During the pouring and subsequent cooling of media in a Petri dish, a thin film of moisture is often left on the surface of the solidified agar. The incubation of an agar medium that has not been dried may result in the growth of bacteria spreading across the agar surface. The use of unvented dishes and presence of motile bacteria are particular factors associated with the spreading of growth across the agar surface when there is a film of moisture. This may lead to no colonies being separated on the agar (see Figure 6.8) making subsequent sub-culture of individual colonies for purity impossible. This could mean that a sample may need to be sub-cultured twice before isolated colonies of a pure culture are obtained with subsequent delay in reporting of results. When large numbers of Petri dishes are being dried, the drying time may need to be extended or a small amount of drying agent (for example self-indicating silica gel) added to the drying chamber to adsorb excess moisture.
45

Figure 6.8 Spreading growth on MacConkey agar through failure to dry the plate
6.9 Sterilisation of solutions by membrane filtration Antibiotic solutions, growth supplements and some sugar solutions may be heat sensitive and are denatured by autoclaving. These supplements may be purchased from commercial manufacturers as sterile solutions or lyophilised powders. However, a laboratory may wish to prepare its own supplements. Solutions are usually sterilised by filtration through a 0.2 μm membrane filter. Small volumes of solution are best filtered through a sterile syringe filter. These are small disposable sterile filters which can be attached to a syringe (see Figure 6.9.1). A sterile syringe is loaded with solution and this is pushed through the filter and collected in a sterile container. The syringe filter is ideal for solutions up to 100 ml. Solutions sterilised in this way can then be dispensed aseptically into sterile containers in appropriate volumes for storage either at 5 ± 3 °C or frozen at - 20 ± 5 °C or lower if appropriate. Figure 6.9.1 Syringe filter
For larger volumes of solution, conventional membrane filtration equipment and a vacuum flask can be sterilised in an autoclave (see Figure 6.9.2). Once the equipment is cool a
46

sterile 0.2 μm membrane can be placed into the filter and the flask connected to a vacuum source. The solution to be sterilised is poured into the filter funnel and the vacuum applied to the flask. The sterile solution can then be dispensed into suitable containers for storage. Pre-sterilised single use plastic disposable filter units can be purchased from manufacturers with a membrane already in place. Figure 6.9.2 Disposable plastic filter units
As with autoclaved media, each filtered solution should be given a batch number and an aliquot tested for sterility, the selectivity of antibiotic solutions, appropriate growth for growth supplements and appropriate biochemical reactions for sugars and other differential reagents, for example urea solutions. 6.10 Quality control of culture media Microbiological media used for the analysis of samples of water and associated materials are designed to recover stressed organisms. Quality control is therefore important to ensure that there are no inhibitory substances in the medium that might adversely affect its properties and that selectivity is effective in enabling only target organisms to grow. All batches of prepared media should have quality control checks carried out and records of these should be kept. For some applications it may be appropriate to include checks on new batches of powdered media and ingredients, particularly when sourced from a different supplier, used for selective enumeration tests, for example MLGA or MEA, soon after receipt. The purpose being to demonstrate continuity by comparing performance characteristics against an ‘in use’ batch before being introduced to routine use. The records of this testing should also be kept. Freshly prepared media should, where
47

practical, be quarantined until such time as it has been demonstrated that the medium is fit for purpose. Each batch of prepared medium should be uniquely identifiable, for example, by a batch number. For complex media requiring the addition of supplements after sterilisation, each bottle of medium may need to be treated as a separate batch. The batch numbers of all constituent products of the medium batch should be recorded, for example where commercial media are used this should include the manufacturer’s batch number. Where the medium is made in-house from different constituents, prepared constituents should also be given a unique batch number and this recorded in the batch record when used to make the complete medium. When a medium has been prepared, it should be labelled with its batch number and expiry date. Details of sterilisation should be available for all media that require autoclaving and these should be recorded together with the results of any time cycle checks, for example autoclave temperature charts. The signatures of appropriate staff should also be included with these records at each stage of preparation to provide a suitable audit trail to demonstrate the correct preparation of media. 6.10.1 pH check Once preparation of the medium is complete, a small aliquot of each medium should be checked for pH. The pH of the medium should be within the tolerance stated in the method, typically ± 0.2 pH units. If the medium is outside of the stated pH range it should be discarded. The pH of the medium should not be adjusted after sterilisation because of the risk of introducing microbial contamination. Such effects may not be immediately obvious but may become significant during storage. 6.10.2 Microbial check Where agar media have been dispensed into Petri dishes, a representative number should be checked to ensure that they are satisfactory. Liquid media should also be dispensed aseptically into suitable containers for the same purpose. Media should be incubated at an appropriate temperature and for an appropriate time to demonstrate sterility and that they support the growth of the target organisms for which they are intended and differentiate or are selective against non-target organisms. In addition, where appropriate, quality control checks should record whether growth of target organisms displayed typical morphology. 6.10.2.1 Purchase and storage of reference cultures Reference materials for quality control can be obtained from recognised culture collections, for example, the National Collection of Type Cultures (NCTC) or the National Collection of Industrial and Marine Bacteria (NCIMB). Cultures may be supplied as freeze-dried suspensions in sealed ampoules or for example as Lenticules®, Vitroids™, ‘tablets’ or other equivalent products. For each type of reference material cultures are revived by addition to or addition of a small volume of sterile broth and re-suspension of the bacteria. Some of these can also be revived directly on solid media. The suppliers’ instructions should be followed carefully. The suspension can be inoculated onto Petri dishes containing a suitable nutrient agar and incubated at the appropriate temperature. Reference cultures should be sub-cultured only once(20). The resultant growth can be preserved as a stock culture by one of several means (see following bullet points) and then removed as required to prepare working cultures.
48

• The bacteria can be suspended in a suitable medium contained in an ampoule and
freeze-dried. A number of ampoules should be prepared to enable fresh working cultures to be prepared over subsequent years. To obtain a working culture, an ampoule should be opened and inoculated onto a suitable nutrient medium.
• The bacteria can be suspended and inoculated onto commercially available beads
according to the bead manufacturer’s instructions. Several vials may be prepared from one reference culture. These are labelled and should then be stored at a temperature for example below -20 °C in line with manufacturers’ recommendations. To obtain a working culture, a vial should be removed from cold storage, one bead quickly removed with sterile forceps or a loop and inoculated onto a nutrient medium. The vial should then be returned to cold storage as quickly as possible.
• Stock cultures may be preserved in liquid nitrogen if this is available. Alternatively, an
ultra-low temperature freezer, operated at - 150ºC, may be used. Reference cultures are suspended in a cryo-protectant medium and immersed in liquid nitrogen or stored in an ultra-low temperature freezer. To prepare a working culture, one ampoule should be removed, allowed to warm to room temperature and inoculated onto a suitable nutrient medium.
Whichever method is used for maintaining bacterial cultures, the preserved cultures should be checked for purity after storage and to ensure that they retain the phenotypic features for which they have been selected, for example E. coli retains the ability to ferment lactose at 37 and 44 °C. Environmental samples known to contain the organisms being sought can also be used for quality control, particularly during routine and investigative monitoring of environments. Environmental samples offer more of a challenge for the isolation procedure because they will contain competing organisms as well as the target bacteria. A disadvantage of using environmental samples is that the presence and number of environmental bacteria is unknown and this may result in quality control results being unacceptable because no target organisms were isolated. A laboratory may wish to add bacterial strains that have been isolated from previous environmental samples during routine or investigative water monitoring. Such isolates may exhibit unusual phenotypic characteristics and can be used as part of quality control or training programmes. These isolates may be stored and maintained in the same way described above for reference cultures. 6.10.2.2 Performance testing Control tests can be undertaken in a number of ways. Descriptions of suitable tests are also detailed in EN ISO 11133(20): • Qualitative control tests seek to demonstrate that a particular organism will or will not
grow on a particular medium. The test does not seek to demonstrate that the number of organisms that will grow from a given suspension or environmental sample may be enumerated. The tests may be carried out on media that have been purchased as ready prepared from a manufacturer who is able to supply evidence of sterility, microbial growth and, where required, selectivity. A scoring system may prove helpful to demonstrate where growth was absent, or where growth was assessed as weak or
49

where growth was assessed as being good. For example, a score of 0 can be used to represent no growth, 1 for weak growth and 2 for good growth (see Figure 6.10.1).
Figure 6.10.1 Example of qualitative microbial growth – Salmonella on XLD
agar demonstrating a score of 2
• Semi-quantitative control tests can provide differentiation of the quality of growth on a
medium using a numeric basis for a suspension applied using a streak and dilution approach. This type of quality control test can be used to assess growth in liquid media. For example, a Petri dish containing agar is divided into four quarters and each quarter is inoculated from a broth culture using a 1 μl loop. Each quarter is streaked four times without re-charging or flaming the loop producing 16 lines for potential growth. Growth on a line is scored as 1 giving a maximum score of 16 if each line produces growth. To demonstrate that growth in a medium is satisfactory a minimum score may be established for example 8 out of the 16 lines for a medium to be satisfactory (see Figures 6.10.2 and 3). Membrane lauryl sulphate broth is a typical example where the broth is incubated at 37 °C for 18 hours and then inoculated onto a suitable nutrient agar. A growth control would have a score of greater than 8 and a sterility check should have a score of 0. This type of quality control is ideal for liquid and non-selective media.
Figure 6.10.2 Semi-quantitative control test for microbial growth – E. coli on
MacConkey agar giving a score of 16
50

Figure 6.10.3 Semi-quantitative control test for microbial growth – E. coli on MacConkey agar giving a score of 2
• Quantitative control tests use a bacterial suspension of a known number of cells to
determine the number of colonies that will develop on a medium using a spread plate method (see Figure 6.10.4) or membrane filtration (see Figure 6.10.5). The suspension may be obtained from commercially prepared reference materials. Alternatively, it may be possible to use broth cultures stored in a refrigerator to provide suspensions for qualitative, semi-quantitative and quantitative reference materials.
Figure 6.10.4 Quantitative quality control – E. coli growing on nutrient agar
giving a direct count
Quantitative quality control will work with fixed numbers and over a period of time, limits can be set to accept or reject media. Performance of a medium may require 50% of the target organisms to be recovered for acceptance with no growth for non-target organisms. Alternatively, control charts can be prepared with limits beyond which batches of media or routine tests are not acceptable.
51

Figure 6.10.5 Quantitative quality control using membrane filtration
To enable meaningful comparisons to be made between different batches of media or membranes over a period of time, suspensions used for quantitative quality control must have reasonably stable numbers. Commercially prepared suspensions are available and these should be used according to the manufacturer’s instructions. As an alternative, for some applications, broth cultures may provide suspensions suitable for quantitative quality control provided their preparation is specifically documented and usage is supported by appropriate performance data. Working cultures, inoculated into broth and incubated for a standardised fixed time period under the same conditions should have a consistent number of countable organisms at a given dilution. At the end of the culture period, the organisms will be entering the stationary phase. Storage for a short period of time at 5 ± 3 °C, for example over a weekend, should ensure that all cells are from the stationary phase of the culture growth curve. Providing that the numbers are stable, such a suspension can be used for both semi-quantitative and quantitative quality control of media. Preliminary tests would suggest that the use of broth cultures would be an acceptable alternative for laboratories who would wish to use them. It permits the construction of quality guidance charts demonstrating acceptability of media quality control. The following quality control procedures are therefore suggested: • Selective broths and agar media should be assessed quantitatively either by
inoculation with a preserved commercial culture or a suitable dilution of a reference broth culture stored at 5 ± 3 °C. Providing that the count on the selective medium is within a defined target of the count on a non-selective medium, for example 50%, or as established by the laboratory, the medium is deemed satisfactory for use. Where the count on the selective medium is less than 50%, the medium should be discarded. Similarly, the target recovery, when for example using Lenticules® or Vitroids™ where there may be variability in batch performance, should be set based on the suppliers’ data and previous experience, ideally with the expectation of at least 50%. Alternatively, the Productivity Ratio (PR) approach described in ISO 11133(20) may be more appropriate than recovery. In some circumstances, for example selective media such as GVPC for Legionella, where a comparison between the test batch and a previously validated batch is used, the PR must be ≥0.7 (or 70% recovery). An upper limit for PR or recovery acceptability should also be specified.
52

• It is not necessary with nutrient media to demonstrate recovery quantitatively. However, nutrient agars can be assessed semi-quantitatively in the manner described above. Nutrient broths can also be assessed as described above by inoculating a target organism and assessing microbial growth using a semi-quantitative method.
6.11 Additional media and reagents A number of widely used additional media and reagents are referred to in The Microbiology of Drinking Water, The Microbiology of Recreational and Environmental Water and The Microbiology of Sewage Sludge where they are not described in detail. These are included here for reference. Where reference is made to pH adjustment this is not usually necessary when using complete commercial media. Media prepared from ingredients may require adjustment to a little above the required final pH to compensate for changes occurring during autoclaving. Unless otherwise stated, the accepted range of any measured value is the stated value ± 5%(17). 6.11.1 Nutrient broth
Beef extract powder 1 g Yeast extract 2 g Peptone 5 g Sodium chloride 5 g Water 1 litre
Dissolve the ingredients in the water and adjust the pH so that the pH of the sterile medium is 7.4 ± 0.2. Dispense into suitable containers and sterilise by autoclaving at 121 ± 3 °C for 15 minutes. Sterile medium may be kept for one month. Test tubes or universal containers containing the medium may be stored at temperatures between 5 ± 3 °C for up to one month. 6.11.2 Nutrient agar
Beef extract powder 1 g Yeast extract 2 g Peptone 5 g Sodium chloride 5 g Agar 15 g Water 1 litre
Dissolve the ingredients in the water and adjust the pH so that the pH of the sterile medium is 7.4 ± 0.2. Sterilise by autoclaving at 121 ± 3 °C for 15 minutes. Sterile medium may be kept for one month. Alternatively, allow the solution to cool, distribute in Petri dishes and allow it to solidify. Petri dishes containing the agar medium may be stored at a temperature of 5 ± 3 °C for up to one month, protected against dehydration.
6.11.3 MacConkey agar
Peptone 20 g Lactose 10 g Bile salts 5 g Sodium chloride 5 g
53

Neutral red 0.075 g Agar 15 g Water 1 litre
Dissolve the ingredients in the water and adjust the pH so that the pH of the sterile medium is 7.4 ± 0.2. Sterilise by autoclaving at 121 ± 3 °C for 15 minutes. Sterile medium may be kept for one month. Alternatively, allow the solution to cool, distribute in Petri dishes and allow to solidify. Petri dishes containing the agar medium may be stored at a temperature of 5 ± 3 °C for up to one month, protected against dehydration.
6.11.4 Blood agar
Beef extract powder 10 g Peptone 10 g Sodium chloride 5 g Agar 15 g Defibrinated horse or sheep blood 50 – 100 ml Water 1 litre
Dissolve the ingredients in the water and adjust the pH so that the pH of the sterile medium is 7.3 ± 0.2. Sterilise by autoclaving at 121 ± 3 °C for 15 minutes. Sterile medium may be kept for one month. Alternatively, allow the solution to cool to 45 – 50°C and add the horse blood warmed to room temperature. Mix carefully avoiding bubbles, distribute in Petri dishes and allow the agar to solidify. Petri dishes containing the agar medium may be stored at a temperature of 5 ± 3 °C for up to one month, protected against dehydration. Note 1: The basal medium without the blood is known as blood agar base and may be used as an alternative to nutrient agar for the general cultivation of bacteria. Columbia agar base may also be used as a base for blood agar. Note 2: Haemolysis may be easier to see if blood agar plates are ‘layered’. A thin layer of blood agar base is poured into each Petri dish and allowed to set. A second thin layer of blood agar is then poured onto the base.
6.11.5 Brain heart infusion broth
Calf brain infusion solids 12.5 g Beef heart infusion solids 5 g Proteose peptone 10 g Glucose 2 g Sodium chloride 5 g Di-sodium phosphate 2.5 g Water 1 litre
Dissolve the ingredients in the water and adjust the pH so that the pH of the sterile medium is 7.4 ± 0.2. Dispense into suitable containers and sterilise by autoclaving at 121 ± 3 °C for 15 minutes. Sterile medium may be kept for one month. Test tubes or universal containers containing the medium may be stored at a temperature of 5 ± 3 °C for up to one month, protected against dehydration.
54

Note The medium may be solidified by the addition of 15 g/l agar. 6.11.6 Quarter strength Ringer’s solution
Sodium chloride 2.25 g Potassium chloride 0.105 g Calcium chloride (hexahydrate) 0.12 g Sodium bicarbonate 0.05 g Water 1 litre
Dissolve the ingredients in the water and adjust the pH so that the pH of the sterile medium is 7.0 ± 0.2. Dispense into suitable containers and sterilise by autoclaving at 121 ± 3 °C for 15 minutes. Sterile solution may be kept for three months at ambient temperature in the dark. See section 6.8 for guidance on dispensing the solution for serial dilutions and the storage of dispensed solution. 6.11.7 Maximum recovery diluent
Peptone 1 g Sodium chloride 8.5 g Water 1 litre
Dissolve the ingredients in the water and adjust the pH so that the pH of the sterile medium is 7.0 ± 0.2. Dispense into suitable containers and sterilise by autoclaving at 121 ± 3 °C for 15 minutes. Sterile diluent may be kept for three months at ambient temperature in the dark. See section 6.8 for guidance on dispensing the solution for serial dilutions and the storage of dispensed solution. Once opened, any unused diluent should be discarded as it will support microbial growth. 6.11.8 Saline solution
Sodium chloride 8.5 g Water 1 litre
Dissolve the ingredients in the water and adjust the pH so that the pH of the sterile medium is 7.0 ± 0.2. Dispense into suitable containers and sterilise by autoclaving at 121 ± 3 °C for 15 minutes. Sterile solution may be kept for three months. See section 6.8 for guidance on dispensing the solution for serial dilutions and the storage of dispensed solution. Saline solutions required for slide agglutination tests or the preparation of Gram stain smears need not be sterile. 6.11.9 Oxidase reagent
N,N,N',N' -Tetramethyl-p-phenylene diamine dihydrochloride 0.1 g Water 10 ml
Dissolve the ingredient in the water and use immediately. Dry powder may be dispensed into suitable containers and stored at a temperature of 5 ± 3 °C for up to one month. The reagent should be prepared fresh daily and discarded when it becomes purple in colour.
55

6.11.10 Catalase reagent
Hydrogen peroxide 30% w/v 1 ml Water 9 ml
Mix the ingredients and use immediately. The reagent (3% w/v) should be prepared fresh daily and discarded once it has been used. Hydrogen peroxide solution should be stored at a temperature of 5 ± 3 °C. Note: Hydrogen peroxide solution will cause burns and should be handled with appropriate precautions. 6.12 Gram stain Grams’ stain is a traditional and widely used means of differentiating bacteria into two distinct groups on the basis of staining characteristics visualised by microscopy. Bacteria are generally described as Gram positive or Gram negative. Gram positive bacteria possess a thick peptidoglycan layer as part of their cell wall structure which stains permanently blue/violet when exposed to stain. Gram negative bacteria have cell walls comprised of a thinner peptidoglycan layer with high lipid content which fail to retain the stain when challenged with a decolourising agent. When viewing slides prepared for microscopy Gram negative bacteria are made visible by the use of a red/pink counterstain. Bacteria are usually further differentiated during microscopy on the basis of their morphology being either rod (bacillus) or round (coccal) shaped. There are a number of method varieties used, the details given below are based on the modified Hucker method and are provided as an example only. The staining process is often performed manually however, for health and safety reasons and for consistency it may be automated, particularly where larger numbers of slides are being prepared. (See also Section 5.16 Microscopes). In addition to the reagents listed below the following general laboratory equipment is required: Glass microscope slides, pipettes, inoculating loops, forceps and Bunsen burner. 6.12.1 Reagents Ready to use staining reagents are commercially available. Laboratories wishing to prepare the reagents themselves should refer to a standard textbook, for example Cowan and Steel’s ‘Manual for the identification of medical bacteria.’ Sterile distilled water Crystal violet stain (1% m/v solution, alternatively, Methyl or Gentian Violet may be used). When freshly prepared the stain should be filtered before use Grams’ or Lugols’ iodine solution Decolourising agent, Ethanol (96%) or Acetone Counterstain, for example Safranin (0.5% m/v solution) Immersion oil
56

6.12.2 Slide preparation A slide is labelled with the sample details, for example using the frosted end of the slide if present or a glass marking pen. The surface of the slide is clean and dry. A small drop of water or saline solution is delivered onto the slide. Using a sterile microbiological loop a small portion of bacterial growth from a single colony on a plate is picked off and transferred to the water drop. Using the loop the colony material is gently emulsified in the water or saline avoiding the creation of aerosols. The resulting smear should be slightly cloudy and homogeneous. The drop size, area of smear, and/or inoculum can be adjusted to achieve optimum results. Ideally colony material from fresh cultures, grown for example on Nutrient agar or similar, should be used since older cultures can give ambiguous results. The slides should be allowed to air dry on a flat surface, for example on an incubator shelf, before fixing. To fix the smear the slide should be held using forceps and the underside of the slide then passed once carefully through a Bunsen flame. A second passage may be required if the smear was not completely dry however, excessive heating should be avoided as this may damage the cells. The objective is to produce a monolayer of bacteria in a smear on the slide, sufficiently dense for visualisation but sparse enough to reveal characteristic morphology. Fixed slides should be allowed to cool thoroughly before staining. 6.12.3 Staining Procedure The staining process should be performed close to a suitable sink or waste disposal area, and appropriate gloves worn throughout. A calibrated timer should be used to monitor time periods during the staining process.
• Flood the slide with Crystal Violet stain and leave for 30 – 60 seconds.
• Decant the Crystal Violet and gently rinse under running tap water. Excessive flow and prolonged rinsing should be avoided as these may disrupt the smear and stain. In some instances, it may be preferable to skip the water rinse and rinse the Crystal Violet off directly with Gram’s or Lugol’s iodine solution.
• Rinse off residual water with Gram’s or Lugol’s Iodine solution and flood the slide
with iodine solution, leaving for 30 – 60 seconds.
• Rinse the slide briefly under running tap water.
• Hold the slide at an angle over the sink and carefully decolourise with a few drops of decolourising agent. Allow the decolourising agent to run down the surface of the slide, washing away the stain. Decolourisation occurs very quickly and the solution should not be left on the slide.
• Immediately wash the slide gently but thoroughly under running tap water to
remove residual decolourising agent. 57

• Flood the slide with counterstain and leave for 30 – 60 seconds.
• Rinse briefly under a gentle flow of running tap water.
• Drain the slide and blot gently or air dry in a vertical position.
Examine the slide under the microscope using bright field illumination and a X100 oil immersion objective lens. 6.12.4 Quality control Commercial stains should be stored and used according to the manufacturers’ instructions and should not be used beyond their stated expiry date. With each batch of slides undergoing Gram staining the laboratory should check reagents to ensure correct staining characteristics are being obtained. As an example slides of Escherichia coli (Gram-negative rods) and Staphylococcus aureus (Gram-positive cocci) can be stained and included with each batch as in Figures 6.12.1 and 2 below. Details of the quality controls performed should be recorded. Figure 6.12.1 Gram stain showing E. coli - Gram negative rods
Figure 6.12.2 Gram stain showing Staphylococcus aureus - Gram positive cocci
58

6.13 Microbial identification by MALDI-TOF In the context of microbiological analysis MALDI-TOF is a diagnostic mass spectrometer (MS) technique for the rapid identification of bacteria starting from colonies cultured from samples. It is increasingly being used in conjunction with other laboratory processes to aid in the identification of bacteria(21), often as an alternative confirmatory technique. Isolates are cultured to achieve discreet colonies which may be prepared and fixed to a target plate using a protective matrix. These are then analysed on the MALDI-TOF instrument which bombards the fixed colony with a laser, “vaporising” it and freeing protein molecules to become charged. The charged molecules are propelled through the MS tube to a detector. The mass of each protein molecule produced influences its “time of flight” along the MS tube. The make-up of protein molecules within the sample is then analysed by the instrument software, using the measured “times of flight”, and expressed as a profile or spectrum. Algorithms are then used to match the profile to a database of spectra, using proprietary software. The software determines an identity for the organism based on matches to profiles within the database. Different software platforms are used by manufacturers of these instruments using proprietary algorithms and databases with their own criteria for microbial identification A score is usually given indicating a confidence level for the identification. Typically, identifications to the species level can be achieved with lower confidence scores indicating identifications suitable to the genus level. An advantage of the technique is that strains presenting as atypical by traditional biochemical typing methods may be recognised by MALDI-TOF providing greater scope for identification, particularly as database libraries are extended over time. As with any new technique its performance should be verified and its performance assessed over the range of variables encountered in the course of the laboratories testing routine (including for example sample matrices and growth media) to identify any adverse impacts on the identifications achieved. Guidance on appropriate verification can be found in section 9.4 and 9.5 and further information on the technique, its application and verification for use in the laboratory, in Cook N., D'Agostino M. & Thompson K. C(22).
59

7 Analytical techniques There should be appropriate documentation of all analytical procedures in current use. Such documentation should be controlled, including for example with an issue number, date of issue, pagination and known document circulation. Where methods are revised, the original method should be stored for potential future reference. A master copy of all methods should be kept in a secure place and designated copies issued to the laboratory. Such copies need not contain all the methods and may include only those applicable to a particular section (for example, a drinking water or environmental microbiology section). Documented analytical methods should include detailed descriptions of the micro-organisms being detected by the method, the preparation of media, the test procedures and any confirmatory tests that may be required. Each method used in the laboratory should be held in a reference file and be available to all staff. Details of procedures for preparing suspensions of test organisms (for validation and verification of performance purposes) and the practical details of how validation and verification trials are conducted should be recorded. Methods should include reference to organisms used as positive and negative controls for isolation procedures and confirmatory tests, as well as the quality control tests for assessing media and the day-to-day operation of the method. As new methods are developed, test procedures will be replaced. Thus, it is important that new test procedures are properly validated and their performance assessed against the old test procedures. A new test procedure should only be adopted after it has been shown that it is equivalent to, or better than, the old test procedure. The new test procedures should be fully documented and a complete record kept of all validation and verification data generated. Details on how to validate and verify performance of new test procedures are given in section 9. 7.1 Standard operating procedures Laboratory methods should be described in detail in standard operating procedures that should include particulars of the scope of the method, the equipment required, the preparation of media and reagents, full analytical procedures and the calculation and reporting of results. Some laboratories may choose to keep their media and reagent activities separate and have a separate set of documented operating procedures. A suitable format for a standard operating procedure is given in section 7.1.1. This format has been used for the description of analytical methods published in this and related series. 7.1.1 Format of a standard operating procedure 1. Introduction - This section gives a brief discussion of the organism for which the method is designed. Details of its significance to drinking water, environmental waters or sewage sludge in terms of water quality, indicator value, pathogenicity and occurrence are also, generally, given. 2. Scope - Details of the sample matrix(23), for example type of water or sewage sludge, that can be analysed are given.
60

3. Definitions - The organism is defined with specific regard to the method being described. 4. Principle - Brief details of the method are given. 5. Limitations - Brief details of those circumstances where the method is not suitable are given. 6. Health and safety - References to relevant COSHH(8) information and special hazards associated with the method are noted. 7. Equipment - Details of equipment and special apparatus specific to the method. Reference to standard equipment requirements (and performance criteria) is given in general guidance to laboratories section 5. 8. Media and reagents - Details are given of all reagents and media that are employed in the method, together with instructions for their preparation and storage and, where appropriate, whether commercial formulations and kits are available. 9. Analytical procedure - This section gives details of the procedures that need to be carried out. The section is often sub-sectioned as follows:- 9.1 Sample preparation - guidance is given on volumes or masses, special storage conditions prior to analysis, and pre-treatment or dilution preparations. 9.2 Sample processing - Details are given on the technique (i.e. membrane filtration, MPN inoculation, pre-enrichment etc.) including incubation conditions. 9.3 Reading of results - Details of how results are read and recorded are noted (including colony counting, biochemical tests etc.). 9.4 Confirmation tests - Details of any biochemical, serological or other tests used in confirmation tests are referred to. 10. Calculations - Details of the procedures required for the calculation of results are presented. 11. Expression of results - Information is given on the terms and units used for the reporting of results. 12. Quality assurance - Information on media, reagents and specification of reference organisms is described along with method specific routine QC requirements. 13. References - Technical and allied references relevant to the method are given. 7.2 Methods for the isolation and enumeration of indicator and other organisms Two principal procedures for isolating and enumerating organisms are commonly used in water microbiology. These are the membrane filtration and the multiple tube most probable number (MPN) techniques. The media and incubation conditions differ with both methods according to the organism being sought. In practice, for most conventional
61

testing of clean and environmental waters, the membrane filtration procedure is the most widely used, as it is simple to conduct and can be applied to a wide range of organisms. For highly turbid samples, for example some wastewaters and semi-solid or solid materials, however, the MPN procedure may be a more appropriate technique. In addition to these two techniques, some analyses are performed by direct plating (for example, pour plate or spread plate) methods, heterotrophic plate counts in drinking water would be one example. Direct plating is also a method option for E. coli analyses in sewage sludge microbiology. 7.2.1 Preparation of samples The volume or mass of sample submitted to the laboratory should be sufficient to ensure that all routine examinations can be carried out. Any excess sample that is not required may be stored in a refrigerator until the initial examination has been completed. This sample can then be discarded or, if required and provided it is within 24 hours of sampling and has been stored appropriately, used for additional or repeat tests in the event of unexpected high counts or possible mishaps. The enumerated counts obtained for additional or repeat tests performed on stored samples older than 24 hours should either be used with caution and additional comment, or not reported, as they may not be comparable to those of the original sample examination obtained before storage. To facilitate mixing of water samples, an air space should be present in the sample bottle. The sample bottle is inverted rapidly several times to ensure adequate mixing. If ten-fold dilutions of water or sewage sludge samples are required, they can be prepared at this stage. Sterile solutions of quarter-strength Ringer’s solution or maximum recovery diluent (see sections 6.11.6 and 6.11.7) are suitable for preparing dilutions. Known volumes of sterile diluent solution are measured out (for example 90 ml or 9 ml) into sterile dilution bottles or tubes. Alternatively, volumes of diluent, pre-sterilised in screw-capped bottles can be used. In these cases however, it should be recognised that some bottles may suffer a loss of diluent on sterilisation or storage. Volumes should, therefore, be checked and any bottles showing obvious signs of incorrect quantities must be discarded. Whilst the bottle is held in one hand, the stopper or cap is removed with, and retained in, the other hand. A dilution of the original sample is then made, by transferring one volume of sample to nine volumes of diluent. The bottle cap is then replaced without touching the inside of the cap or the neck of the bottle. Using a fresh, sterile pipette each time, the process is repeated as often as is necessary to ensure the correct dilution range has been prepared. Each prepared dilution is carefully and thoroughly mixed before the next dilution is prepared. Tolerances for pipette performance are set out in section 5.20. A sufficient quantity of each dilution should be prepared to enable all tests to be carried out. A minimum of two dilutions should be used for environmental samples where dilutions are required. Where samples have not previously been tested, and the likely concentration of organisms is unknown, three dilutions may be necessary. 7.2.2 The multiple tube most probable number (MPN) technique In the multiple tube technique, measured volumes of sample, or diluted sample, are added to a series of tubes containing a liquid differential medium. It is assumed that on incubation, each tube with one (or more) target organism will exhibit growth in the medium, and produce characteristic changes in the medium. Provided that some of the
62

tubes exhibit no characteristic growth (i.e. the results are negative) and some of the tubes exhibit characteristic growth (i.e. the results are positive) then the MPN of organisms in the sample can be estimated from probability tables. Counts are typically expressed as the MPN of organisms per 100 ml of sample. Confirmation, that positive results are due to the growth of the targeted organism sought, can be obtained by sub-culture to appropriate confirmation media. There are commercially available MPN systems based on addition of the sample to reaction pouches which, when sealed, divide into 50 or more “wells”. The greater number of wells available for inoculation, compared to the traditional tube method, results in a more accurate MPN estimation over a wider MPN range. The multiple tube method is particularly suitable for the examination of sludges and waters containing sediment. 7.2.3 The membrane filtration method In the membrane filtration method, a measured volume of the sample, or diluted sample, is filtered through a membrane filter, typically composed of cellulose-based, or similar, fibres. The pore size of the membrane filter is such that the targeted organisms to be enumerated are retained on or near the surface of the membrane filter, which is then placed, normally face upward, on a differential medium, selective for the targeted organisms sought. The selective medium may be either an agar medium or an absorbent pad saturated with broth. After a specified incubation period, it is assumed that the targeted organisms retained by the membrane filter will form colonies of characteristic morphology and colour. The growth of non-target organisms is usually inhibited, but if they are present, they can be readily distinguished by their colonial appearance. The colonies of the target organism sought are counted and the result, taking into account any dilutions made, for water samples is typically expressed as the presumptive number of organisms per 100 ml of sample. The presumptive count may then be confirmed, by sub-culturing all, or a representative number, of colonies formed. The membrane filtration apparatus consists of a base supporting a porous disc. The filter funnel, which may be graduated, is secured to the base, for example by means of clamps, screw-threads or magnets. The filtration apparatus is connected to a vacuum source. For the examination of large numbers of samples, multiple filtration units may be used. The filtration apparatus should be sterilised on a regular basis between batches of analyses and if contamination is suspected. Spare funnels as required can be disinfected for example by immersion in boiling distilled water for at least one minute between samples. After disinfection, each funnel should be placed in a stand and allowed to cool before use. Alternatively, a fresh pre-sterilised funnel may be used for each sample. Disinfection of funnels by immersion in boiling water may not be sufficient when spore forming bacteria, for example Clostridium perfringens, are sought. Known polluted and non-polluted samples should be filtered using separate filtration equipment. Alternatively, polluted samples should be processed after non-polluted samples. For recreational waters, sewage sludges and similar polluted samples always process the highest dilution first and then process sequentially the series of dilutions down to the lowest dilution to be analysed. Membrane filters, typically 47 mm in diameter, with a nominal pore-size of 0.45 µm retain most of the bacteria commonly enumerated in water. A pore size of 0.2 µm is, however, necessary for the isolation of species of Campylobacter, Legionella and some environmental bacteria (for example, Vibrio species). The use of membrane filters with
63

grid-marks facilitates counting of colonies. Where there is a need to filter large volumes of sample (for example 500 ml of river water) which may block standard 47 mm diameter membrane filters, then a large volume filtration apparatus may be useful. Membrane filters of 90 mm or 142 mm diameter and appropriate porosity can be housed in stainless steel filtration units and the samples passed through the filter using a suitable pump. Periodically, it is necessary to check that membrane filters are suitable for the targeted organisms being sought. Quality assurance is important and membranes should be free from toxic substances that inhibit bacterial growth. When membrane filters with grid-marks are used, bacterial growth should not be inhibited or stimulated along the grid-marks. Membrane filters should be pre-sterilised before use and should not be re-used. Membrane filters have a shelf life and should not be used beyond their expiry date. Absorbent pads, for use with broth media, should be at least the same diameter as the membrane filters and approximately 1 mm in thickness. The pads should be made of high quality paper fibres, and be uniformly absorbent and free from any toxic substances that may inhibit bacterial growth. Absorbent pads need not be sterile if they are of the appropriate quality. This should be verified for each batch of pads prior to use. If necessary, pre-sterilised absorbent pads are available, or pads can be sterilised by autoclaving at 121 °C for 20 minutes, either in containers or wrapped in waterproof paper or metal foil. 7.2.4 Advantages and limitations of the membrane filtration method The key advantage of the membrane filtration technique, compared to the multiple tube MPN technique, is the speed with which results can be obtained. For example, presumptive coliform bacteria and Escherichia coli (E. coli) counts, and individual colonies for confirmatory testing, can be available after 18 hours incubation. In addition, there is considerable saving in labour and in the amount of media and glassware required when compared to traditional MPN techniques. Furthermore, false-positive reactions that may occur with some media in the multiple-tube technique are less likely to occur with membrane filtration. The membrane filtration technique, however, is unsuitable for use with waters of high turbidity. In these circumstances, the membrane filter may become blocked before sufficient water has been filtered. Also, the accumulated deposit on the membrane filter may inhibit the growth of the organisms being recovered or enumerated. A similar principle applies when testing dilutions of recreational waters and sludge. Whilst high dilutions may filter well, lower dilutions may contain significant particulate material. A membrane filtration technique may be unsuitable for use when waters are examined that contain small numbers of targeted organisms in the presence of large numbers of non-targeted bacteria that are also capable of growth on the medium used. 7.2.5 Alternative confirmation techniques The individual test methods in this series, each describe the confirmation requirements of the target organism being sought. Confirmation methods have traditionally been based on sub-culture to selective and/or non-selective broth or solid media, staining and slide examination (such as Gram stain) and biochemical tests or serological analysis.
64

Novel techniques, for example MALDI-TOF-MS (Section 6.13), are becoming more commonplace in laboratories and have been demonstrated to be beneficial and effective as alternatives to traditional approaches. As with all new methodologies, laboratories using them should be able to demonstrate the accuracy of application and interpretation in their hands. 7.3 Statistical considerations Statistical analysis of microbiological results must start with a clear understanding of the methods used to obtain the data and the context of the water sampling. This requires an appraisal of all aspects of the accuracy of the results. The following discussion primarily considers accuracy with respect to water samples. Additional aspects may need to be considered for other matrices (for example, sewage sludge and environmental sediments). For example, consideration may need to be given to the ability to achieve a dispersion of organisms in solid or semisolid matrices (i.e. effective homogenisation) prior to analysis. 7.3.1 Accuracy For the purposes of this section accuracy is the combination of both random and systematic errors to indicate the likely deviation from the true value. The accuracy of a microbiological result is an important issue and the result cannot be interpreted without some awareness of it. Experience and understanding are needed to allow an assessment of the reliability of a result. The basic definition of accuracy is the degree of agreement of a result of a measurement process to the ‘true’ result. Each sample yields a result which is quantitative to some degree. It may be a presence/absence test where either zero or one-or-more organisms are found; or it is a test where the result is a number. The latter, a numerical result, can be a count of organisms detected (e.g. by colony growth) or be a most probable number (MPN) derived from a series of presence/absence results from subsamples. This section considers the accuracy of numerical results, although many of the principles have relevance to presence/absence results. There are several aspects that contribute or influence the accuracy of a measurement:
(i) There is the accuracy in terms of how well the result answers the question that was being asked when the sample was collected (for example how many E. coli does this water source contain?). The variability in organism numbers at the water source can be very large. The accuracy in measuring this depends on sampling strategy.
(ii) The accuracy is affected by survival, without multiplication, of target organisms
within the sample from the time of collection to the time of processing the sample, i.e. the stability of the sample or organisms in the sample.
(iii) There is the inherent accuracy of the method chosen for processing the
sample.
65

(iv) There may be sources of inaccuracy introduced by selecting a sub-portion of the original sample, if the test procedure is not applied to the whole sample, and by confirming a sub-sample of colonies detected.
(v) There is inaccuracy during the application and reporting of the whole test
procedure (i.e. the accuracy in applying the method, the quality of equipment and materials together with the expertise of the analyst). As will be discussed, this is the portion of inaccuracy that is equivalent to the uncertainty of measurement (see 7.3.1.5) as used in other disciplines, such as chemical testing.
7.3.1.1 How accurate is the result in representing the source material? The examination of a single sample gives an indication of the count of relevant organisms in the sample at a particular location in the catchment area, or supply, at a particular time. The location where a sample is to be collected should be carefully chosen, and thus, a sample should be typical of the sampling area. The actual volume of water, sediment or sludge sampled may not however possess identical characteristics, with respect to microbiological quality, as those present in adjacent volumes of water, sediment or sludge. Indeed, only a very small volume of water is examined in the laboratory compared with the volume of source water in question. The confidence interval (CI) for the microbial density in a body of water cannot, generally, be estimated from a single sample. Multiple samples are required before a range, such as a 95 % CI, can be estimated. Such a CI describes the possible range of organisms in the source but assumes that the results for each sample are accurate. CIs about the accuracy of a result itself are discussed later. The only situation where a single sample can give such an estimate is when the organisms are distributed randomly; in this case the appropriate mathematical description is the Poisson distribution which has a single statistical parameter, i.e. the mean, μ, having the same value as the variance. However, there is at present no evidence that microbes are ever randomly distributed in any part of a water system, environment or sewage sludge. There can be enormous variation in the microbiological quality of untreated waters(24). For treated waters, contamination may be intermittent and organisms may be present as aggregates, often on particulate matter, rather than evenly or randomly distributed. Thus, samples from the same sampling point, even when taken closely adjacent in time, can show large differences in bacterial counts(25). The statistical parameters describing the distribution of bacteria may change over time and, therefore, a series of single samples collected at different times cannot be used to estimate confidence intervals for the bacterial content of the source of water at any one time. They should be used instead to indicate trends over time. 7.3.1.2 How is accuracy affected by collection, transport and storage of the sample? These factors are largely outside the scope of this document, but careful collection of samples together with appropriate storage during transport and storage at the laboratory will minimise any effect on microbial numbers in samples. Guidance on the collection, transport and storage of microbiological samples is given elsewhere in this series(26,27). The accuracy should be maximised by the choice of good procedures, expertise of staff and appropriate quality assurance checks.
66

7.3.1.3 Accuracy of the chosen method Samples of treated drinking waters should not contain indicator organisms. Very small numbers of such organisms in samples of water are capable of being detected, and enumerated with good precision (see 9.1.2), by methods described in this series. Untreated waters, sediments and sewage sludges, however, may yield moderate or high bacterial counts, and in these situations, the accuracy with which the count is made should be considered. The overall bias and precision of a method should be established by primary validation(28) and comparison of results obtained using a reference method. For drinking waters a detailed protocol for undertaking such a comparison, together with examples, is described in section 9. A similar approach may be applied to other matrices. Any bias or variability in the performance of the chosen method will, thereafter, affect all results, but be a hidden factor. It is important that the adequacy of the method is kept under review as part of AQC procedures (see section 8). 7.3.1.3.1 Accuracy of a membrane filtration method If a sample of water is filtered and the membrane filter incubated, and then every relevant colony on the membrane filter is counted, and every colony is tested and confirmed, then the presumptive and confirmed counts are as precise as this particular method allows. Further, non-method related imprecisions are possible as described in following sections. These include sample dilution, selecting colonies for confirmation and uncertainty of measurement (see 7.3.1.5). 7.3.1.3.2 Accuracy of a multiple tube (or MPN) method In the multiple tube method, a series of sub-samples is taken from the original sample, and processed to ascertain which of the sub-samples show the presence of the targeted organism. A mathematical formula, based on laws of probability, is then used to estimate the MPN of organisms present in the volume examined, and extrapolated to the whole sample(29,30,31). Confidence intervals have been suggested which relate specifically to the likely accuracy of the estimated MPN and reflect the other “counts” which could have given rise to the observed combination of tubes positive and negative. These various mathematical approaches and the principles involved in the estimation of bacterial densities by dilution methods have been reviewed(31,32) and tables have been developed(33,34) which give greater detail. However, in practice, the full extent of the tables are rarely used(35,36) (for example the most probable range information which may be misconstrued as confidence limits). Widely available computer programmes now enable the determination of the probability of counts associated with each dilution series to be quantified exactly(37,38,39). While the latest calculation of the MPN shows little discrepancy with previously published values, these new calculations have highlighted two issues: the variability of previously published confidence intervals and, for moderate or high bacterial density, the multiple tube methods which have only 11 or 15 tubes do not give a clear MPN. There is a “most probable range” (MPR) of counts, all of which are almost equally likely to be as correct as the MPN. Methods with large numbers of tubes achieve a clearer MPN, provided the dilution series gives a proportion of negative tubes.
67

All calculations are based on the assumption that the organisms present in the water are evenly or randomly distributed and the importance of thorough mixing of the sample cannot be over-emphasised. Although the multiple tube method is very sensitive for the detection of small numbers of indicator organisms, the MPN is not an exact value unless very large numbers of tubes are examined. This is more closely approached with recently developed multi-well MPN techniques. Apparent differences between results should, therefore, be interpreted with caution. 7.3.1.4 How is accuracy affected if only a sub-portion of the original sample is
tested? The result quoted will be a statement about the numbers estimated to be in the sample. Usually only a sub-portion of the sample is examined because of the requirements of the method and/or the sample needs to be diluted. The chosen method whether it is membrane filtration, plate count or multiple tube, will use a specified volume of water. The sample needs to be thoroughly mixed in the laboratory before the required volume is drawn off. The objective of mixing is to achieve a random distribution of the organism within the sample so that the number per 100 ml (or whatever volume is being analysed) is as close as possible to the average number per 100 ml in the whole sample. An example of random distribution is illustrated in section 9, Figure 9.1. It would be possible, in theory, to make statistical estimates of the likely numbers present in the original whole sample when only a specified portion of the sample has been examined. This would give a specific 95% CI relating just to this aspect of imprecision. This is not usually attempted but it is accepted that with good technique the result will be as representative as possible. If a sample requires dilution then this reduces the proportion of the sample examined and attempts have been made to illustrate the likely numbers in the undiluted portion(40). Some examples from the referenced work are given in Table 7.1. The background to these examples is described in the next three paragraphs, illustrating the potential imprecision introduced by the inherent random variation of numbers of organisms. It is usual practice to report the bacterial count of targeted indicator bacteria, as the number of organisms per 100 ml of sample. With undiluted waters, 100 ml of sample is examined by the membrane filtration technique, and 105 ml by the MPN technique, for example in the 11-tube series of 1 x 50 ml, 5 x 10 ml and 5 x 1 ml. If the sample requires dilution (prior to any additional dilution inherent in the multiple tube method) and this dilution is, for example 10-fold, then only 10 ml (or 10.5 ml) of the original sample will be examined. The count obtained is then multiplied by the appropriate dilution factor, and the calculated count per 100 ml is now an estimate of the number of organisms contained in 100 ml of sample. Confidence intervals of numbers present in an original volume V, given that x organisms have been observed in a sub-volume v, can be calculated on the assumption of random variation throughout V when test volume v was drawn off(40). Heterotrophic bacteria numbers in water analysed by the pour plate or spread plate method are typically quoted per millilitre of sample, and any dilutions prepared will have a similar effect. Dilutions prepared from solid or semi-solid matrices (for example sewage
68

sludge) will be similarly affected and will have the added contribution of the degree to which homogenisation has been effective of the sample prior to preparation of dilutions. Table 7.1 Illustrations of estimated count (EC) per 100 ml and 95 % confidence
intervals (CI) for the number of organisms reported in 100 ml of sample, where a sub-sample is examined, following dilution
Number of organisms found in sub-sample
10-fold dilution 100-fold dilution EC CI EC CI
10 100 50-180 1000 480-1830 50 500 380-650 5000 3750-6640 100 1000 820-1200 10000 8190-12200
EC = estimated count CI = 95 % confidence interval The variability introduced by dilution is likely to be relatively small compared with the variability in bacterial density in environmental waters, sediments and sewage sludges, where numbers are sufficiently high to require dilution of the sample before examination. Confidence intervals, as shown in Table 7.1, should not be stated when results are reported, as quoting such intervals may cause misunderstandings and be taken as a statement about the likely bacterial density in the water source. 7.3.1.4.1 Confirmation of isolated organisms Confirmatory tests of the presumptive colonies present on a membrane filter should be carried out. When multiple colonies are present, different approaches can be adopted when consideration is given to the number of colonies that should be tested for confirmation. If the aim is to estimate the count of relevant colonies, then consideration should be given to the variability that is introduced when only a fraction of the total number of colonies present is tested for confirmation. The colonies should be chosen at random and the number tested should be sufficient to provide an acceptable level of accuracy. This usually requires sub-culture of all the colonies on a membrane filter when fewer than ten presumptive colonies are present. However, this may not be practicable and may not be necessary, especially in the case of highly specific methods where a high proportion of the colonies are expected to confirm as positive. The colonies selected for confirmation should also be representative of the differing morphologies present on the membrane filter. Alternatively, if the aim is to demonstrate the presence or absence of the targeted organism, then a different approach may be chosen. The presence of the organism is demonstrated as soon as one colony is tested and a positive confirmation is made. Hence, a laboratory may choose to examine fewer colonies, initially, than when the aim is to estimate the count, rather than demonstrate presence or absence. However, if the colonies that are chosen and tested do not give a positive confirmation then the sample cannot be assumed, at this stage, to be free of confirmed organisms. This is because other colonies on the filter, which have not been chosen for confirmatory testing, may, if tested, prove positive. Hence, other colonies from the membrane filter should be tested until at least one positive confirmation is obtained, or all colonies have been tested and no confirmation has been shown. This sequential testing is acceptable only when
69

refrigerated storage of the membrane filter is not detrimental to the survival and/or recognition of the relevant organism. If all presumptive colonies are tested to confirm their nature, then no further imprecision (other than that due to the method) is introduced when the presumptive count is converted into a confirmed count. If only some of the colonies are tested by confirmatory methods, then further imprecision is introduced into the confirmed count. For example, if a presumptive count is made by counting all the typical colonies, N, on a filter then it is common practice to make confirmatory tests on some, but not all, of these colonies, unless N is small. If n is the number of colonies tested, and x is the number of colonies that are confirmed as the target organism, then the confirmed colony count is estimated as xN/n. For example, if 50 colonies were observed on the filter, and 10 colonies were selected at random for testing, and 5 of these colonies were confirmed, then the estimated confirmed count would be 5 x 50 / 10 = 25. The 95% CI, which reflects only the confirmation uncertainty and no other imprecision, for this result of 25 is 9 to 41 (see Table 7.2). The CI is calculated as follows: It is assumed that the “n” colonies are selected at random, or by some other procedure which ensures they represent a typical sub-sample of the “N” colonies. It is further assumed that all the “N” colonies are equally likely to be from the relevant organism group. The conditional probability that y is the true count, given that x colonies have confirmed can be calculated from: P(x | y) = yCx . N - yC n - x / NCn The 95 % CI for the confirmed count can be found by observation of the probabilities for all possible values of y, using the observed value of x. The CI will exclude “end of range” high and low values of y, such that their cumulative conditional probabilities sum to less than or equal to 0.05(38). Some examples are shown in Table 7.2. Table 7.2 Variation in the 95 % CI with variation in the proportion of tested
colonies confirmed
Colonies observed (presumptive count) i.e. N
Number tested, i.e. n
Number confirmed, i.e. x
Confirmed count 95 % CI
10 2 0 0 0-7 10 2 1 5 1-9 10 2 2 10 3-10 14 7 5 10 6-12 50 10 5 25 9-41
Wherever possible the number of colonies to be tested should be selected such that the confirmed count is a whole number. Where this is not the case the confirmed count should be rounded to the nearest whole number (for example, if there are 8 presumptive (N) colonies and 3 are tested (n) of which 1 confirmed (x) then the confirmed count is 3). With treated waters, where the vast majority will yield zero or very few presumptive colonies, then to improve accuracy, as many colonies as possible should be tested by confirmatory methods. For untreated waters, sediments and sludges, it may be worthwhile considering the use of the presumptive count rather than introduce the additional variation which accompanies confirmation of some but not all of the colonies. It
70

should be noted that the practice of confirming a maximum of 10 colonies can still introduce potentially significant variation, especially if the presumptive count is large and some colonies fail to confirm. However, a balance should be made between the benefits of improved accuracy and the capacity of the laboratory to undertake confirmatory tests for large numbers of colonies. For example, it may be better to take more samples analysed by a reliable presumptive test than fewer samples analysed by a less reliable test requiring a greater number of confirmation tests. 7.3.1.5 Inaccuracy introduced by the application of methods to the selected portion
of water (uncertainty of measurement) Once the water has been drawn off and processing starts with the chosen enumeration method then, at each stage, random or technical errors can occur which may affect the final result. These can be referred to as uncertainty of measurement (UM) which is defined as:
a parameter associated with the result of a measurement, that characterises the dispersion of the values that can reasonably be attributed to the measurand(41).
These errors should be minimal in a laboratory with good practice (for example with trained staff, well controlled methods, calibrated equipment and a comprehensive quality assurance programme, see section 8). They cannot be measured for an individual sample, and can be difficult to identify, even when special studies of replicate testing are undertaken, because of random variation in numbers of organisms present in different replicates. It is suggested that a typical QC programme includes enough replicate testing to allow assessment that these errors are acceptably small by checking that the variation is not greater than random as outlined in section 8.2. Further discussion on UM and guidance on this is available in BS 8496(42). 7.3.1.6 Summary of accuracy for sample processing within the laboratory It is now well understood that the natural random variation in microbial numbers, even in a well-mixed water, will be the dominant factor(24,36). This makes it much more difficult for microbiologists (compared with chemists or physicists) to describe fully the attributes of a water. It makes it even more difficult to measure inaccuracies caused by laboratory procedures. Good practice should keep these inaccuracies to a minimum. As has been described, the laboratory is responsible for storing the sample correctly, extracting the required portion for testing (which may include dilution stages), applying the chosen method and reporting the results. All stages may introduce inaccuracy. Experiments can be undertaken to measure, on average and with specially selected samples, particular affects (for example dilution process, differences between incubators, between analysts etc.) but these may not be practical in smaller laboratories. In all laboratories it is essential that a comprehensive QA programme is in place as an ongoing check on storage conditions, mixing the sample and selecting the portion for testing. Examples of natural variation (and, therefore, one inevitable component of inaccuracy), which affects examination of sub-portions have been presented here. Sound knowledge and application of the chosen method, supplemented by continued proficiency testing, will help to minimise any inherent inaccuracy. The cumulative errors, random and systematic, during application of the method to the portions examined (the UM) cannot be
71

measured routinely but QC programmes of replicate testing can assist in checking that they are kept acceptably low. 7.3.2 Comparing results with prescribed limits Typically, prescribed microbiological limits for drinking waters concentrate on the presence or absence of indicator organisms and pathogens. Therefore, the potential problem of how to compare actual counts enumerated and estimated counts calculated need not be addressed with respect to potable waters. For some environmental and effluent water samples, however, prescribed limits may be set as simple pass/fail criteria. An understanding of the implications of the accuracy of a method in fairly allocating a result based on a single measurement into a pass or fail category is necessary. For the analysis of sludge a result is often based on the average of several replicates, and any bias in a method may have a cumulative impact on the reported result. Consistency in the performance of a method is important in ensuring ongoing compliance with a standard. 7.3.3 Reporting results The report should be a clear statement of the findings. A further statement on sample error, to qualify these findings, should not be necessary for routine samples. The sampling strategy should be designed with the aim of acquiring an adequate level of information. If it is necessary that a report for a special or unusual sample warrants a statement on accuracy and precision, then a clear distinction should be made between the variability within the water source, uncertainty and error due to the choice and application of methods. Laboratories are required to be aware of accuracy. ISO 17025(2), specifies that “Testing laboratories shall have and shall apply procedures for estimating uncertainty of measurement”. This is difficult to apply to water microbiology because the distribution and behaviour of microbial cells in water is not uniform. BS 8496(42) provides practical guidance on how to interpret and implement these requirements within the context of a water microbiology laboratory. Each laboratory should accumulate information on accuracy within the laboratory, using special studies and/or quality control results, and prepare a statement which can be made available to clients upon request. Absence of organisms or immeasurably high counts should be reported according to the following criteria: No organisms detected. A water sample in which no relevant organisms are detected should be reported as “none found in the volume of sample examined”. It should be noted that in microbiological terms there is no equivalent to the chemical concept of “limit of detection”. An expression such as “less than 1 per unit volume” has no meaning. Overgrowth of membrane filter or all multiple tubes positive. This means that the analysis has failed to estimate the true count either because of insufficient pre-dilution or the
72

presence of high numbers of non-target organisms. With the multiple tube method it is customary to report this, in the appropriate units, as “> 180” for the 11 tube series or “> 1800” for the 15 tube series, but recognising that the count could be very much higher. With membrane filtration and other methods the report should be “count too high to be estimated at the dilution used”. Membrane filters or agar plates where overgrowth by competing organisms makes a count of target organisms impossible or uncertain, no count can be reported. A count should be obtained from another dilution with an acceptable count of target organisms if available otherwise the test is void. For environmental samples analysed by membrane filtration, it is customary for laboratories to report counts exceeding the upper limit for counting as a greater than value, for example >100 at the dilution used. In some instances, where the count is just above the limit, it may be possible to estimate the count and this should be clearly identified when reporting such a result. Where analyses are undertaken in relation to regulatory or other guidance standards the results should be reported in the units specified in the legislation or guidance. Where results have been obtained in a dilution series or MPN test they should be reported to the nearest whole integer.
73

8. Quality control Quality control should be understood and applied in the context of a comprehensive quality assurance programme covering every element of the process leading to the reporting of a microbiological result. Both qualitative and quantitative controls are essential components of such a programme. They can be applied at various stages to test the integrity of individual or multiple elements of the analytical process. Quality controls can, for example, include:
• demonstrating the suitability of a prepared medium, or reagent • use of quantitative reference materials as simulated samples and, • participation in a scheme designed to test the whole process such as the analysis
of an external quality assessment sample • System suitability checks to verify performance of instruments and equipment
A combination of internal and external quality controls is required for a comprehensive approach. Application of appropriate internal quality controls is necessary to systematically check each step of the process. This should ensure that a laboratory is capable of isolating, accurately identifying and enumerating target micro-organisms in a sample, while avoiding contamination of samples with extraneous micro-organisms. 8.1 Internal quality control This consists of including quality control samples to the isolation, enumeration, identification and confirmatory procedures in use for real samples. Quality control samples should contain micro-organisms similar to those being sought and, where appropriate, non-target organisms, as well as samples that are sterile. If the procedures function satisfactorily, such micro-organisms will be detected, or in the case of non-target organisms and sterile samples, no micro-organisms will be found. The control procedures should be undertaken with each batch of samples incubated, for each incubator used and, when reasonably practical, each analyst involved for that batch of samples. Control samples may be prepared separately but should, in every other respect, be processed in the same way as samples, being analysed as part of the batch of samples to which they relate. This may necessitate several positive and negative control samples, and blank samples being set up each day, with separate quantitative testing schemes to check enumeration. For environmental samples, inclusion of analysis of a sample in duplicate by each analyst on each day may also be appropriate (See Section 8.2). Positive control samples contain target organisms that produce typical colonies or positive reactions on isolation media and in confirmation tests. Negative control samples contain non-target organisms that do not produce colonies or positive reactions, or produce atypical colonies, on isolation media and in confirmation tests. Blank control samples are usually sterile samples used to test the integrity of the analytical procedure. Control organisms at the appropriate levels should, wherever possible, be produced from first generation cultures derived from a national collection of freeze-dried organisms. Alternatively, controls can be utilised either directly or following a rehydration procedure using commercially available reference materials. Control organisms should be derived from a pool of peer-accepted strains which exhibit typical growth patterns and biochemical reactions irrespective of their original source. A suitable list of strains can, for example, be found in EN ISO 11133(20). Rehydration and dilution should be undertaken 74

with maximum recovery diluent or a similar appropriate diluent to achieve suitable numbers of organisms. Care should be taken in the selection of these organisms as some have been shown to give atypical results when compared to genuine wild-type organisms. It is good practice if possible to avoid and in any event minimise the number of sequential sub-culture operations of the chosen reference strains. The reason for this is to reduce the risk of introducing contaminating organisms and because the biochemical characteristics of some organisms may change on repeated culturing. The use of natural waters, known to contain relevant organisms, may also be suitable as analytical control samples. All confirmatory tests should include positive, negative and blank control samples. 8.2 Quantitative internal quality control In addition to qualitative checks with positive, negative and blank control samples there should be checks on the enumeration procedures(43). In principle two approaches can be considered. These are the use of appropriate reference materials and the use of split sub-samples from a source known to contain the target organism. However, it should be noted that the information derived from these approaches, and its application, is different. Reference materials are generally used as preparations, either internally generated from cultures or obtained externally as commercial products, having, within reason, a known organism count. The split sub-sample approach compares the two counts obtained from a sample of unknown count and primarily tests the reproducibility of the analysis performed (see section 8.2.2). If automatic counting instruments are used these should be tested and calibrated against reference materials having known certified values. Quality control or Shewhart charts are used extensively in the water industry for demonstrating statistical control of laboratory chemical procedures. This practice can be extended for demonstrating microbiological control. However, the natural random variation in the number of organisms present in sub-samples of the same sample means that there can be a wide scatter of results between sub-sample analyses, which is to be expected. Many more samples are required for microbiological examination compared with chemical analyses in order to detect real “out of control” situations. Even then, these situations may better be described or classified as probably out of control rather than definitely out of control. Hence, for microbiological purposes, the term “guidance chart” has often been used where response lines, rather than action or warning limits, are applied to trigger further investigation or remedial action as appropriate. In this case the use of guidance charts could be said to provide a tool for continuous improvement, rather than a rigorous check on the validity of analytical data. The commercial development of quantitative preparations of reference organisms in stable formats, for example Lenticules® and Vitroids™, has significantly improved confidence in the reliability of the Shewhart chart approach. In the context of microbiological enumeration, particularly when using selective media, where, unlike chemistry, the ‘true’ value or count is an unknown the provision by suppliers of mean counts and confidence limits is of central importance. It is still essential however, that laboratories using such materials compare and verify the performance of these materials in their own hands.
75

Application of these two approaches is described below in more detail. 8.2.1 Reference materials Guidance charts can be plotted using regular counts enumerated on samples taken from a batch of suitable reference material that may be commercially obtained or internally prepared (See Figure 8.2.1 below). The usual practice is to plot the results sequentially over a period of time. If the reference material does not possess a statement of certified mean and variance values, then these values should be estimated from a suitable number of replicated analyses. For example, initially, a minimum of 20 results (two samples processed on each of ten successive days) may be required to construct a control chart, and a minimum of 60 data points to produce robust control values. However, for microbiological analysis this may not be sufficient and more data sets may be required to reliably establish the mean count and set suitable control limits. These analyses should be carried out under conditions that ensure the values are “in control” or assumed to be “in control”. The chart is plotted using the values determined or may be constructed using transformed data, for example square root or log counts, where such transformation makes the data more closely conform to the normal distribution. Response lines are then drawn on the chart at appropriate intervals. Appropriate response lines may be located at ± 2 standard deviations of the mean (equivalent to upper and lower “warning” limits) and at ± 3 standard deviations of the mean (equivalent to upper and lower “action” limits). However, appropriate response lines should be set on the basis of experience. In some cases, for example Legionella QC, greater variability in performance data may be observed resulting in a larger standard deviation. In this instance guidance charts based on percentage recovery may be more suitable. Regular samples of the reference material are then processed with routine samples and the counts plotted sequentially. Documented investigation and remedial action when appropriate should follow if values are recorded that fall outside the range of the response lines. The following guidance is often used as a basis for action(43). (i) One count falls outside an action limit: or (ii) Two out of three successive counts exceeding a warning limit, whether the same
side or different sides of the mean: or (iii) Nine consecutive counts fall on the same side of the mean: or (iv) Six consecutive counts show a trend that continuously rises or falls All charts should be checked regularly for correct use and operation and the mean and limits reviewed at least annually
76
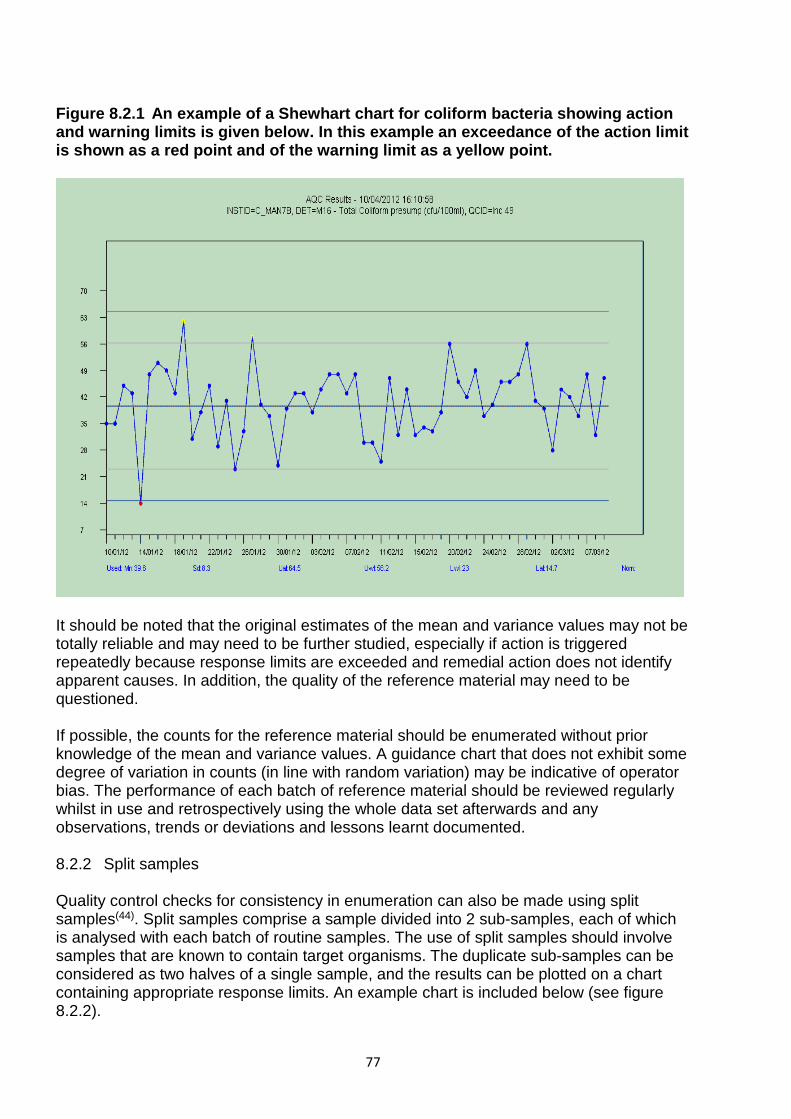
Figure 8.2.1 An example of a Shewhart chart for coliform bacteria showing action and warning limits is given below. In this example an exceedance of the action limit is shown as a red point and of the warning limit as a yellow point.
It should be noted that the original estimates of the mean and variance values may not be totally reliable and may need to be further studied, especially if action is triggered repeatedly because response limits are exceeded and remedial action does not identify apparent causes. In addition, the quality of the reference material may need to be questioned. If possible, the counts for the reference material should be enumerated without prior knowledge of the mean and variance values. A guidance chart that does not exhibit some degree of variation in counts (in line with random variation) may be indicative of operator bias. The performance of each batch of reference material should be reviewed regularly whilst in use and retrospectively using the whole data set afterwards and any observations, trends or deviations and lessons learnt documented. 8.2.2 Split samples Quality control checks for consistency in enumeration can also be made using split samples(44). Split samples comprise a sample divided into 2 sub-samples, each of which is analysed with each batch of routine samples. The use of split samples should involve samples that are known to contain target organisms. The duplicate sub-samples can be considered as two halves of a single sample, and the results can be plotted on a chart containing appropriate response limits. An example chart is included below (see figure 8.2.2).
77

Because of the manner in which micro-organisms are distributed in water, the examination of split samples can result in significant variation in the counts enumerated. For example, if the count reported for the first sub-sample is 5, then the 95 % CI for the count of the second sub-sample will be 0 - 14. The CIs for the count of the second sub-sample, given the count observed in the first sub-sample are given in Annex A. Thus, it may be expected that duplicate sub-samples will give counts outside of the 95 % CI, on 5 % of occasions, (i.e. once in every 20 samples). Anecdotally there is evidence that in practice exceedances often occur less frequently under laboratory conditions due to the difficulty of ensuring that quality control samples are treated in the same way as test samples. Procedures should be in place to ensure that this form of bias is minimised. Procedures should be adopted within the laboratory to deal with situations that occur too frequently (i.e. greater than 5 % of occasions) where sub-samples give counts outside of the 95 % CI. The count for the first sub-sample should be recorded on a control chart, together with the corresponding CI for the count of the second sub-sample (obtained from Table A1 in Annex A). The count of the second sub-sample is then recorded alongside these figures. If this count falls outside the range of the CI, then this fact should be recorded. If, over a period of time, the count of the second sub-sample falls outside the range of the CI on more than 5 % of occasions, then investigations should be carried out to determine the cause(44). Figure 8.2.2 Typical duplicate samples chart for coliforms The figure shows a typical chart for duplicate samples examined for coliform bacteria for one month using characterised natural river water samples. Note the two occasions that the second count was outside the 95% confidence intervals for the first count on the 4th and 14th of the month. This chart demonstrates that the analytical procedure is under control.
78

Alternatively, a more approximate statistical approach can be used with paired counts using the Index of Dispersion chi-squared test(45,46). For paired split samples, the formula for calculating the Index of Dispersion, D, is: D2 = (x1 – x2)2 / (x1 + x2) To construct a guidance chart, the median is plotted, as are values of the 99% and 95% confidence level limits, i.e. for p = 0.05 and p = 0.01 (i.e. 3.841 and 6.635 respectively, each with 1 degree of freedom). These values are approximately equivalent to 2 and 3 standard deviations, and act as appropriate “response” limits. The calculated values of D2 obtained for split samples should be equally distributed on either side of the median line. Periodic checks that there is not an excess (>5%) of individual D2 results exceeding the 3.841 level is a measurement of the repeatability of the method. Conducting reviews of the sum of D2 over longer periods of time (for example 10-30 results or 2-4 weeks) allows reproducibility to be assessed. Laboratories using split sample internal quality control should carry out analyses regularly, and plot the results on guidance charts. Each sub-sample should be treated as separate samples and analysed in the normal, routine manner. The sub-samples should be randomly positioned in the incubator, and these positions should be changed frequently when different batches of samples are examined. If possible, counts should be enumerated in such a manner so as to ensure that the sub-samples are not recognised as being connected. If the variation between the counts of the sub-samples is significantly less than would be expected, then operator bias may be suspected. 8.3 External quality assessment Laboratories should participate in an appropriate inter-laboratory external quality assessment (EQA) scheme that involves the examination of samples distributed by an independent external organisation. There are a number of EQA scheme providers to choose from and the choice of scheme should be guided by the sample matrices being analysed, the organisms sought, the range of counts experienced, the frequency and the scope of the analysis performed including, for example, whether confirmatory tests are undertaken. The laboratory’s results can be compared with those intended by the scheme organisers and those obtained by other participating laboratories to provide an independent assessment on the quality of the laboratory’s performance. It is essential that the instructions provided by the scheme organiser are carefully followed and that the samples distributed by them are treated and analysed in exactly the same way as routine samples, and that appropriate action is taken when results fall outside of the expected range. EQA scheme providers usually provide distribution interim and final reports and periodic performance assessment reports covering several distributions to assist participants in assessing their own performance. Self-assessment is essential to identifying poor performance in a timely manner and obtaining maximum benefit from participation. Care should be taken to ensure that data from EQA scheme reports includes details of the different methods used by participants as comparisons to all participants’ results, and comparisons only to results for participants using a specific method, may yield different assessments of performance.
79

Distribution reports generally include an array of statistics derived from participants’ data returns as well as scheme providers own intended and self-generated performance results. These may include the mean, median, minimum, maximum and range of participants’ counts and the derivation of an ‘assigned value’ or estimated true count. A scoring system may be applied. In addition to visual examination of scheme reports self-assessment can be facilitated by plotting of participant results against those of the scheme organiser and the mean or median of all participants. Three styles of plot have been suggested which are applied to a parameter and use cumulated results from samples which should have contained that parameter. Each gives visual prominence to a slightly different aspect of monitoring although all three use the same information. (i) A line graph with the time sequence of samples as the x-axis and the count as the
y-axis (Figures 8.3.1 and 8.3.2). One symbol plots the participant's results and another the median result calculated from the results returned by all participants. A visual aid is to join up the points with lines although strictly speaking the lines, do not represent anything as there are no "results" being reported between the times of samples. A simple assessment of performance would be to monitor whether there is a consistent trend of results on one side of the median. A satisfactory performance will be when the two lines criss-cross but are seldom widely separate and that the average separation does not increase over time. A large variability of results around the distribution medians could indicate poor control of the analytical process. This type of chart shows all available information – time sequence, actual value of counts and difference between this laboratory and the median. It is, therefore, quite complex to interpret at a glance but can be supplemented by information from the other two types of charts.
Figure 8.3.1: Line graph of laboratory count (blue triangle) and EQA median count (red rectangle) for positive count samples
0
10
20
30
40
50
60
Cou
nt/1
00 m
l
Sequence Number
80

Figure 8.3.2: Line graph of laboratory count (blue triangle) and EQA median count (red rectangle) for positive samples. This graph shows a significant negative deviation from the median counts
(ii) An x/y scatter plot of the median count (x-axis) against the laboratory's results (y-axis) (Figures 8.3.3 and 8.3.4). Satisfactory performance is when the scatter is around the diagonal line of equality with approximately similar numbers below and above. It will also be possible to spot whether the pattern changes for higher median values, although allowance must be made for the fact that the magnitude of the scatter will inevitably increase. Random scatter is proportional to the average count (with respect to Poisson distribution). This plot does not indicate time sequence and so will not provide an early warning that performance has changed. However, a laboratory may, for example, notice that they perform adequately with moderate or higher counts but tend to record a deficit with low counts.
Figure 8.3.3: XY plot of laboratory counts compared to EQA median counts with even dispersion of values around the line of equivalence
Cou
nt/1
00 m
l
Sequence Number
0
5
10
15
20
25
30
35
40
1 2 3 4 5 6 7 8 9 10 11 12 13 14 15 16 17 18 19 20 21 22 23
Lab
coun
t/100
ml
0
10
20
30
40
50
60
0 10 20 30 40 50 60
Median count/100 ml
81
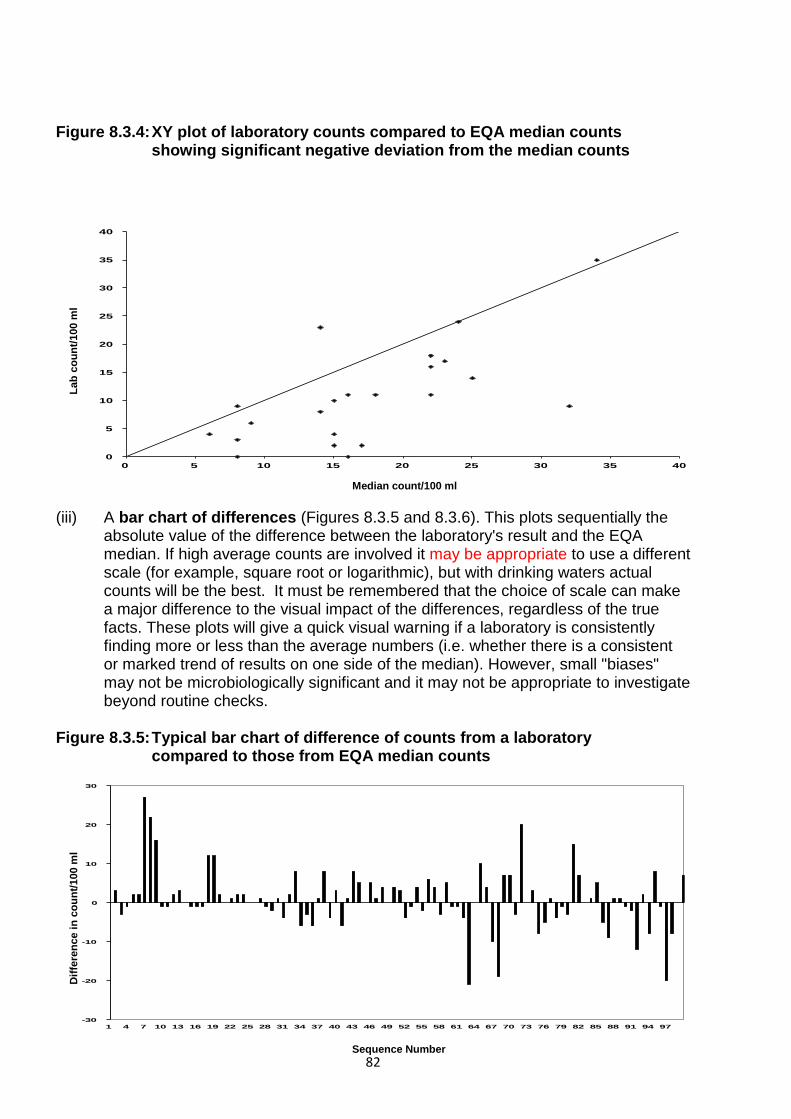
Figure 8.3.4: XY plot of laboratory counts compared to EQA median counts showing significant negative deviation from the median counts
(iii) A bar chart of differences (Figures 8.3.5 and 8.3.6). This plots sequentially the
absolute value of the difference between the laboratory's result and the EQA median. If high average counts are involved it may be appropriate to use a different scale (for example, square root or logarithmic), but with drinking waters actual counts will be the best. It must be remembered that the choice of scale can make a major difference to the visual impact of the differences, regardless of the true facts. These plots will give a quick visual warning if a laboratory is consistently finding more or less than the average numbers (i.e. whether there is a consistent or marked trend of results on one side of the median). However, small "biases" may not be microbiologically significant and it may not be appropriate to investigate beyond routine checks.
Figure 8.3.5: Typical bar chart of difference of counts from a laboratory compared to those from EQA median counts
Diff
eren
ce in
cou
nt/1
00 m
l
Sequence Number
Lab
coun
t/100
ml
-30
-20
-10
0
10
20
30
1 4 7 10 13 16 19 22 25 28 31 34 37 40 43 46 49 52 55 58 61 64 67 70 73 76 79 82 85 88 91 94 97
0
5
10
15
20
25
30
35
40
0 5 10 15 20 25 30 35 40
Median count/100 ml
82

Figure 8.3.6: Bar chart of difference counts from a laboratory compared to those from EQA median counts demonstrating pronounced negative bias In some cases scheme providers will provide a ‘z’ score, an approach commonly used for chemistry EQA schemes which allocates a statistically based score assuming that the results are ‘normally’ distributed about the mean value. It should be noted that counts may approximate to normal distribution in some schemes but this is not universally the case. It has been reported previously (47) that microbiological counts for drinking water schemes are subject to natural random variation and are better described by the Poisson distribution. In practice ‘z’ scores and measuring longer term trends in performance via ‘J’ scores(48) may provide useful information on a laboratory’s EQA scheme performance. If used it should be used in conjunction with other methods of self-assessment. The purpose of external quality assessment samples is to assist individual laboratories assess their own capabilities to undertake selected analyses and to correct any deficiencies which may be present. They should not be used for the purpose of determining whether one laboratory performs better or worse than another participating laboratory.
Diff
eren
ce in
cou
nt/1
00 m
l
-25
-20
-15
-10
-5
0
5
10
15
1 2 3 4 5 6 7 8 9 10 11 12 13 14 15 16 17 18 19 20 21 22 23 Sequence Number
83

9 Characterisation, verification of performance and comparison of microbiological cultural methods Methods for the bacteriological assessment of water and associated materials should be capable of serving their intended purpose, i.e. to detect and/or quantify target organisms or groups of target organisms with adequate precision and accuracy. In certain countries methods for drinking water quality assessment under legislation may be prescribed, in other countries, they are not. If alternative methods are used in place of statutory, regulatory or laboratory accredited methods, they should be of “equivalent or better” performance. Methods, capable of achieving a certain performance are published by a variety of sources, including those by the International Organisation for Standardisation (ISO), European Committee for Standardisation (CEN), individual national standards organisations (for example BSi, DIN, AFNOR) and the Standing Committee of Analysts (SCA). These methods can be considered as reference methods. The demonstration that new or alternative methods are at least as accurate and precise as reference methods is, however, a complex procedure. This section describes the three steps involved in the characterisation of a method, verification of its performance in a laboratory and the comparative assessment of the method compared to a statutory, regulatory or laboratory accredited method. This section is based on procedures set out in ISO/TR 13843(28) and ISO 17994(49), and describes a protocol for comparing the recoveries of confirmed target organisms by two or more methods, originally derived for the UK Drinking Water Inspectorate. Similar considerations apply to the comparison of methods for other matrices but the processing of some, such as heavily contaminated waters and sludge, may inherently present additional challenges. Sections 9.5.2, 9.5.3 and 9.5.4 describe aspects and approaches relevant for these other matrices. 9.1 Basic concepts and definitions A laboratory considering adopting a new or alternative method to the one currently in use should obtain sufficient comparative data to demonstrate the relative performance of the two methods before adopting the new method for routine use. If appropriate, other laboratories may then undertake the process of comparison of performance and the data from all laboratories may then be pooled and reviewed to establish robustness. 9.1.1 Microbiological cultural methods Methods are considered microbiological cultural methods when growth and multiplication of micro-organisms are the essential features for their detection and/or quantification. 9.1.2 Definitions Alternative or trial method - Any method which is to be tested for equivalence with a reference method(49). Characterisation - Establishment of the specifications for the performance of a new method and/or experimental verification that a method meets theoretically derived quality criteria(28). Confirmed count - The number of the presumptive count multiplied by the proportion confirmed that conform to the definition of the target organism.
84

Error - The statistical variation including natural variation and imprecision of the method. Expanded uncertainty - quantity defining an interval about the result of a measurement that may be expected to encompass a large fraction of the distribution of values that could reasonably be attributed to the measurand(49). Linearity – Linear dependence of the signal on concentration of the analyte(28). In method performance evaluation this is the ability of the method to maintain a proportional response over its working range. Measurand - Particular quantity subjected to measurement(28). Over-dispersion - The variation in excess of that shown by the Poisson distribution. Poisson distribution - Fully random distribution of particle numbers when sampling a perfectly mixed suspension(28), exhibiting no attraction or repulsion between micro-organisms. Precision - The closeness of agreement between independent test results obtained under stipulated conditions(28). Presumptive count - The number of organisms that produce a response typical of the target organism in or on a primary detection medium. Reference method - Prescribed analytical method to analyse a given group or species of micro-organisms(49). For example, methods published by ISO or SCA. Relative difference – Difference between two results, a and b, measured on a relative (natural logarithmic) scale, expressed in percent, i.e. x = [ln(a) – ln(b)] x 100 %(49). This is essentially the same as x = [2(a – b)/(a + b)] x 100 %(49) until the difference in counts become greater than three-fold. Repeatability - Closeness of the agreement between the results of successive measurements of the same measurand carried out under the same conditions of measurement(28). For example, this can be calculated from replicate counts from sub-samples obtained from a well-mixed sample, analysed by one analyst using the same reagents, materials and method. Reproducibility - Closeness of the agreement between the results of measurements on the same measurand carried out under changed conditions of measurement(28). For example, this can be calculated from replicate counts from sub-samples obtained from a well-mixed sample, analysed by more than one analyst or laboratory using different reagents, but the same method. Robustness - The insensitivity of an analytical method to small changes in procedure(28). For example, use of a method by different laboratories should not change the sensitivity of the method. Standard uncertainty – uncertainty of the result of a measurement expressed as a standard deviation(28, 49).
85

Under-dispersion – Variation below that expected by the Poisson distribution. Verification - Demonstration by experiment that an established method functions according to its specifications in the user’s hands(28). 9.2 Characterisation of methods Many methods used in water microbiology have not had substantial characterisation of performance, some having been developed 50 or more years ago (for example, membrane-lauryl sulphate broth for coliform bacteria and m-Enterococcus agar for enterococci). Their continued use is basically a result of their widespread (national or international) employment as well as frequent incorporation in national methods. However, many of these methods were originally adopted after only a review of data in scientific publications and limited in-house evaluation. Characterisation, validation and verification of performance of methods constitute a requirement of ISO 17025(2) for laboratories seeking accreditation. For methods in water microbiology guidance on characterisation is available in ISO/TR 13843(28), which defines (primary) validation as “an exploratory process with the aim of establishing the operational limits and performance characteristics of a new, modified or otherwise inadequately characterised method”. This would also apply for when only part of a method (for example a “confirmation” step) is changed. The standard describes the information required for the derivation of the numerical and descriptive specifications of a method. A key component in any characterisation is the unambiguous description of the target organism for the method. It is, therefore, essential to understand the analytical basis of methods (for example detection of coliforms by either lactose fermentation or the production of β-galactosidase), so that if differences are found when comparing a new method with an established one, they can be explained. Characterisation of a method will provide information on specification of performance, not only with respect to the recovery and enumeration of the target organism(s), but also the analytical requirements of the method (for example incubation temperature and time, media preparation and storage conditions, and sample storage or pre-treatment). Key information will relate to recovery efficiency, relative recovery (against a reference medium or a non-selective medium), repeatability and reproducibility of the method and counting of colonies, upper and lower working enumeration limits, linearity, selectivity and specificity (false-positives and false-negatives), counting uncertainty (methodological and analyst) and a general estimate of precision. Additionally, advice should be provided on and requirements stated for quality control of media and equipment. Protocols should provide laboratories with structured procedures to assist the application of the method and, therefore, the capability to generate valid results. Since these data will provide the initial assessment of performance of a new or modified method it is strongly recommended that analysts with experience in microbiological methods conduct the work. Although it may be unreasonable to expect characterisation work based upon ISO/TR 13843(28) to be undertaken for methods that have been widely used for several decades, it is appropriate that the new methods that are being developed to replace them should have full validation. Generation of appropriate characterisation data should be the responsibility of the research team or manufacturer developing the method, and laboratories should request such information from commercial suppliers before any consideration of verification of performance and adoption in their laboratory.
86

Further guidance is given in ISO/TR 13843(28). Before verifying the performance of a new method a laboratory should become familiar with the method and may wish to undertake some work to verify the characterisation data provided by the developers or suppliers. This may be a limited appraisal, typically verifying identification of target and non-target organisms and ascertainment of false-positive and false-negative results. Such an investigation can be conducted using selected strains of target and non-target organisms representative of those the method may be challenged with, as well as a selection of natural samples. This can be conducted as part of the verification of performance process (see section 9.3). 9.2.1 Identification of target and non-target organisms Microbiological methods should be designed to detect and/or enumerate particular types of micro-organisms, i.e. target organisms. All other micro-organisms, i.e. non-target organisms, that may be present in the sample should be “not detected”, or if they are, should be readily differentiated and, therefore, should not interfere with the detection or enumeration of the target organisms. Non-target organisms are often described as competitive or background flora. The method should provide sufficient suppression of these to prevent overgrowth and competitive inhibition or obscuration of target organisms. The definition of target organisms should reflect current microbiological understanding, and be sufficient to ensure common differentiation between target and non-target organisms when two different methods are being compared. Identification of target and non-target organisms can be achieved by challenging the method with reference strains of the target organism and selected strains of non-target organisms that may typically occur in the types of sample analysed using the method. Following this natural samples should be analysed and a selection of target colonies and non-target colonies be identified to confirm specificity. 9.2.2 False-positive and false-negative results If a non-target organism is mistakenly identified as a target organism, a false-positive result is obtained. Alternatively, a false-negative result is obtained when a target organism is not correctly identified. Note that a false-positive result or a false-negative result may be reported for individual colonies, as well as for the overall final result of a sample. The nature and concentration of target organisms and non-target organisms often vary considerably between samples taken from a specific location, and especially from those taken from different locations. A consequence of this is that a method that has been evaluated for a particular type of sample may not necessarily have universal applicability. 9.2.3 International or prescribed methods Methods have been described in international standards, or prescribed as legal requirements, as a means of achieving a standardised approach to analysis. If these methods are clearly and unambiguously described, then inter-method differences are eliminated. This does not mean that an international standard or prescribed method is suitable for all situations and samples. The laboratory is responsible for evaluating the performance of a method, especially when different types of samples are analysed by the same method. The temporal variation of the performance of a method, in relation to
87

variable characteristics of the micro-flora, should be evaluated as part of a quality assurance programme. 9.3 Verification of performance Verification of performance of a method in a laboratory is a simplified version of the characterisation process. Its purpose is to answer the basic question “Does this new method perform to its specification in my laboratory?” There is limited guidance on verification in ISO/TR 13843(28), simply that a number of natural samples should be used, analysed as split samples or replicate dilution series with duplicate counting to verify expected counting performance. A limited number of samples using an appropriate quantitative reference material can be initially used to confirm target and non-target colony morphology and colouration or reaction colour. This also allows the analysts to become acquainted with the new method without any issues of interferences associated with natural samples. Once the analysts are proficient, then natural samples appropriate to the laboratory are analysed. It should be remembered that these samples will typically contain target and non-target micro-organisms in some state of stress and probably reduced metabolic status. This may result in differing appearance or reactions compared to those using pure culture reference organisms. In addition, the species or strains in these samples are likely to be different from those encountered by the laboratory or manufacturer that undertook the original validation work. There is, therefore, the possibility of encountering atypical growth or reactions that may be specific to the laboratory. There is no recommendation on the number of natural samples that should be analysed for verification of performance, but at least 30, covering the range of water types or matrices typically analysed by the laboratory, is a reasonable starting point, more samples can be analysed if the results are equivocal. The laboratory should analyse several samples of each water type or matrix, as a single result from a sample source may not be truly reflective of how the method performed on that water type, and this may increase the total number needing to be analysed. Additionally, if the types of bacteria normally encountered by the laboratory with their current method are subject to seasonal variation, it may be appropriate to conduct the verification exercise over a period of time that would take that source of variability into account. Verification should also be over the full range of counts for which application is anticipated. Where the method is intended to serve for both presence/absence and enumeration of low numbers of organisms particular attention is required to these aspects (see sections 9.3.1 and 9.7). It is essential that the identity of the target organisms isolated by the method is confirmed and ISO/TR 13483(28) recommends that 100 presumptive positives should be isolated and their identity verified (using appropriate biochemical or serological protocols). A number of non-target presumptive isolates (for example, 50 isolates) should also be subject to identification to check the false-negative rate. Situations where verification of performance of a method is needed include:- i) adoption of a reference or statutory method, or previously validated method, by a new laboratory or by a laboratory that has not previously analysed for the target organisms (for example, by comparison against published performance data), ii) when a validated and verified method is transferred from one laboratory to another (for example, by comparison against previous performance data), and
88

iii) when a laboratory wishes to adopt a validated alternative to the method currently in use.
Successful performance of a new method after the verification exercise can result in a laboratory adopting the method. If, however, the new method were to replace one already being used by a laboratory, or a statutory method, it would be appropriate to assess the new method against the current or statutory method, and to generate verification of performance data at the same time. One of the key benefits of this would be the generation of data that can be used to explain to customers why the method has been changed (for example greater recovery or specificity/selectivity, etc.), any additional benefits (for example more rapid analyses) and any potential impact it may have on the results from their future samples. This approach should also be undertaken for any significant change in a method employed in a laboratory (for example implementation of a new confirmation procedure). 9.3.1 Verification for low number and presence/absence counts Many of the tests performed on drinking water are directed initially at a presence/absence outcome. However, in most routine instances, for example indicator counts, once present enumeration immediately becomes important. As a consequence, membrane filtration tests for indicator organisms need to perform well at detecting low levels of bacteria when present. It is essential that laboratories performing such tests understand the performance and limitations of their methods when the numbers present may be at the borderline of their ability to recover or detect them. Similar comments apply to other matrices, within water and associated materials, where the outcome of a presence/absence test or a low count may have significant consequences. Terminology used in this context has been, and continues to be, subject to change and controversy. It has already been pointed out for example (See section 7.3.3) that there is no equivalent in microbiology of the concept, used extensively in chemistry, of ‘limit of detection’. However, this and similar terms such as limit of determination do appear in accreditation documentation(4) and their inclusion in relevant revised ISO standards is anticipated. It is the experience of laboratories that they have been required to produce evidence of performance verification using such terminology. Statistical considerations around accuracy of counts are described in section 7.3 and the characteristics of bacterial dispersion in water in the context of comparing methods in section 9.4. Section 9.7 specifically addresses comparison of methods at low numbers of target organisms. The purpose of this section is to emphasise the legitimate objective of ensuring that laboratories understand the performance of their methods at low counts. Also, to provide some recommendations for good practice and consistency on suitable approaches that might be used to satisfy such requirements. All statements about the ability to detect or recover at low levels should recognise any limitations in extrapolating for example from a specific ‘laboratory culture’ to a ‘real sample’ context. Micro-organisms may vary in many ways as a result of circumstances in the test material, environmental sample or laboratory culture, and the selectivity of the test environment. They will behave differently depending for example on cell integrity, physiological state, nutritional status and dispersion within the sample.
89

Accreditation guidance(4) currently includes requirements for verification of methods recognising the difference between qualitative, presence/absence tests, emphasising the ability to detect the target organism (limit of detection) and quantitative tests. For quantitative tests the emphasis is on the level at which enumeration is reliable (limit of quantification). In both cases laboratories are expected to take account of matrix effects. Currently, the following definitions are given: “Limit of detection:- Applied to qualitative microbiological tests: The lowest number of micro-organisms that can be detected, but in numbers that cannot be estimated accurately. Limit of quantification:- Applied to quantitative microbiological tests: The lowest number of micro-organisms within a defined variability that may be determined under the experimental conditions of the method under evaluation.” These definitions, and those for other terms used in this context, give little practical assistance to laboratories on what is actually required. A limit of detection can be considered in terms either of the volume, or quantity, in which a single target micro-organism can be detected or as the smallest number of target micro-organisms detectable in a given volume, or quantity, of sample(50, 28). Examples of practical approaches that have been applied are described below. Although, in most cases actual tests are performed only once all of these examples require sufficient replicates to support statistical evaluation of the data. The frequency required for verification of low count performance to demonstrate consistency should be considered and the reference strain(s) and preparation conditions all need to be tightly specified for reproducibility. 9.3.1.1 A direct comparison of counts obtained for appropriately diluted reference strains of selected target organisms on a non-selective medium and on a selective test medium can provide basic information on relative recovery. 9.3.1.2 Recovery from samples spiked with laboratory reference cultures of target and non-target/competing organisms of known content assayed independently by a standard non-selective method. Samples spiked at 1, 10 and 100 cfu are analysed, for example in triplicate, by the test method. This approach may not be applicable for matrices where the sample matrix may need pre-treatment, for example autoclaving sludge, altering its character and where achieving homogeneity introduces additional uncertainty. 9.3.1.3 Dilution to extinction – analysis, for example in duplicate, of each dilution in an appropriate series arranged to go beyond the dilution at which target organisms are still detected. This could be applied for example to an environmental water or associated material matrix naturally containing both target and non-target organisms. 9.3.1.4 Spiking of samples with decimal dilutions of a known laboratory culture of reference target strain with analysis seeking to identify the last dilution from which the organism can be recovered, this dilution being designated the ‘limit of detection’. The result may be influenced by the number of replicates performed.
90

9.3.1.5 Analysis of sufficient pairs (for example 30 or more) of spiked samples having a low count, for example less than 10 per plate/membrane/MPN. The objective being to show that fewer than 5% of the pairs either has a D2 > 3.841 (see section 8.2.2) or second result outside the 95% confidence interval range (see section 7.3, Annex A or, for MPN counts, appropriate tables(51)). If these criteria are met then it can be assumed that over-dispersion is unlikely and therefore the lowest result for which the lower bound of the 95% CI for the ‘unobserved’ count is greater than zero is a reasonable estimate of the limit of quantification. For methods using selective media, for which recovery may be significantly lower than on non-selective media, it may be appropriate to multiply this figure by the ratio of counts obtained in 9.3.1.1 above. 9.4 Comparison of methods Adoption of alternative or new methods to replace a statutory, regulatory or laboratory accredited method should be undertaken only after a comparative assessment of their performance against the current laboratory method. This will involve analysing samples (either natural or spiked) in duplicate (one by each method) and statistically examining their respective paired results. This can be achieved for drinking waters by using the analytical protocol originally developed for the UK Drinking Water Inspectorate and the statistical procedures of ISO 17994(49). This section describes the procedures for establishing the relative performance of microbiological cultural methods used in water and associated materials. The examples used pertain to methods for drinking water analyses. Instructions, including the preparation of spiked samples and the recommended number of measurements, are described to evaluate whether a new method as a replacement for a reference method could be adopted for routine use in the laboratory. The new method should, before evaluation, preferably be thoroughly validated and its performance in the laboratory verified. The procedures compare the results of two methods using samples containing about 20 - 50 target organisms per test volume, usually 100 ml for water. Only paired samples with at least one positive result are considered, as paired samples with zero counts do not provide additional information on the comparative recovery of target organisms. 9.4.1 Statistical considerations As described in section 7.3, there are several sources of variation that may complicate the evaluation of the comparison between alternative and reference methods. These include sample variation, natural variation and systematic imprecision inherent in the methods. These may be expected to be even more significant for matrices other than drinking water. 9.4.1.1 Sample variation A water source, sampled for monitoring purposes, may exhibit enormous variation in its microbial content over time and between sampling sites(25). Samples, used in comparative trials of alternative methods, should, therefore, not be collected or prepared separately. A paired or split sample approach (see also section 8.2.2) should be used. A suitable sample should be thoroughly mixed, and two aliquots of this sample taken for analysis. The analysis of each aliquot should then be carried out at the same time, the first aliquot being analysed by one method and the second aliquot being analysed by the other
91
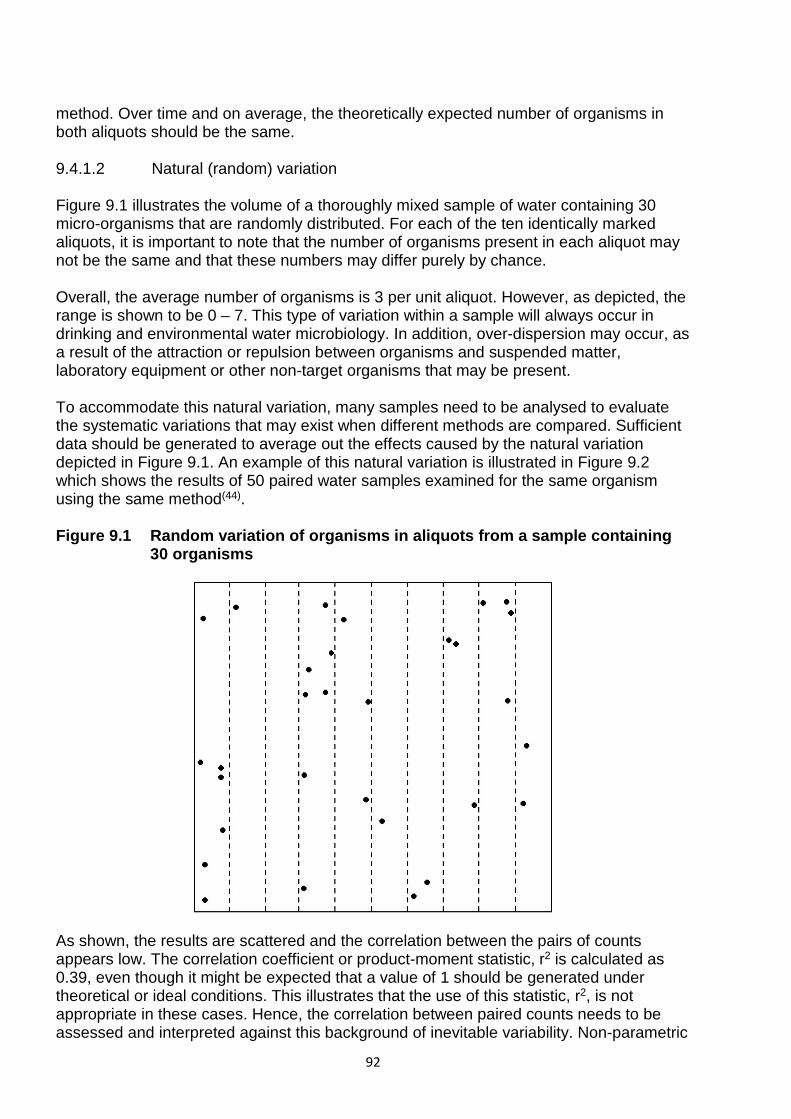
method. Over time and on average, the theoretically expected number of organisms in both aliquots should be the same. 9.4.1.2 Natural (random) variation Figure 9.1 illustrates the volume of a thoroughly mixed sample of water containing 30 micro-organisms that are randomly distributed. For each of the ten identically marked aliquots, it is important to note that the number of organisms present in each aliquot may not be the same and that these numbers may differ purely by chance. Overall, the average number of organisms is 3 per unit aliquot. However, as depicted, the range is shown to be 0 – 7. This type of variation within a sample will always occur in drinking and environmental water microbiology. In addition, over-dispersion may occur, as a result of the attraction or repulsion between organisms and suspended matter, laboratory equipment or other non-target organisms that may be present. To accommodate this natural variation, many samples need to be analysed to evaluate the systematic variations that may exist when different methods are compared. Sufficient data should be generated to average out the effects caused by the natural variation depicted in Figure 9.1. An example of this natural variation is illustrated in Figure 9.2 which shows the results of 50 paired water samples examined for the same organism using the same method(44). Figure 9.1 Random variation of organisms in aliquots from a sample containing
30 organisms
As shown, the results are scattered and the correlation between the pairs of counts appears low. The correlation coefficient or product-moment statistic, r2 is calculated as 0.39, even though it might be expected that a value of 1 should be generated under theoretical or ideal conditions. This illustrates that the use of this statistic, r2, is not appropriate in these cases. Hence, the correlation between paired counts needs to be assessed and interpreted against this background of inevitable variability. Non-parametric
92
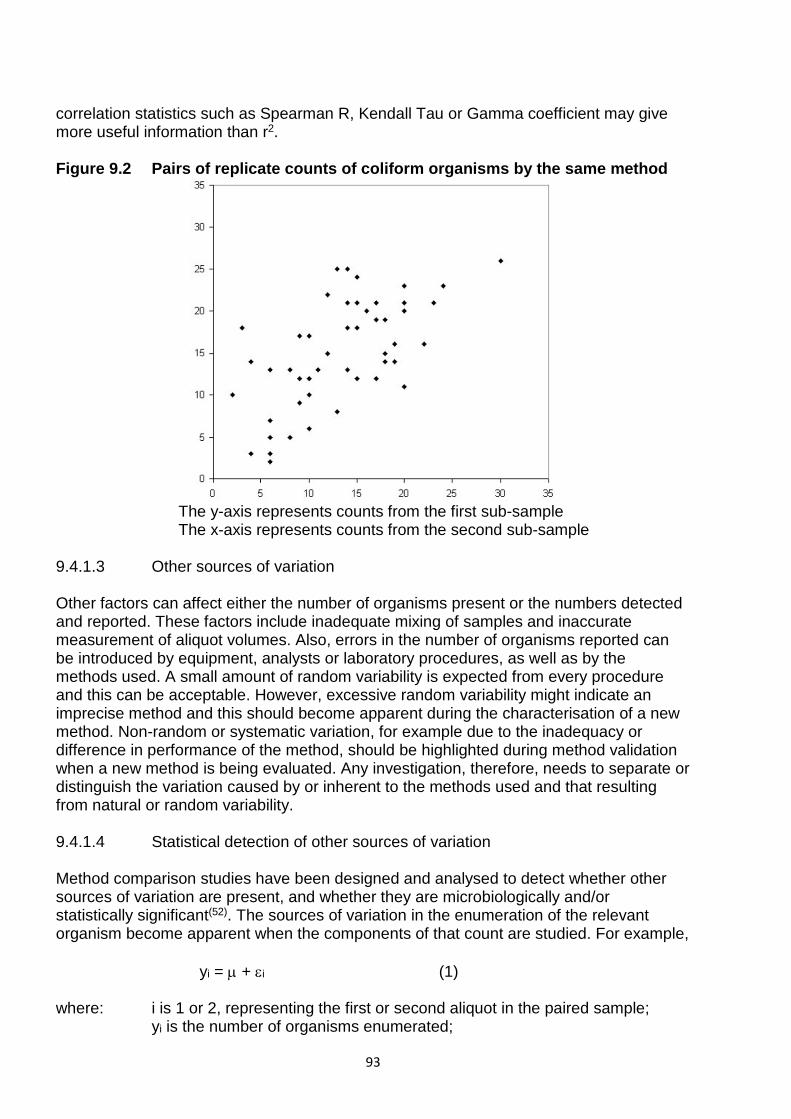
correlation statistics such as Spearman R, Kendall Tau or Gamma coefficient may give more useful information than r2. Figure 9.2 Pairs of replicate counts of coliform organisms by the same method
The y-axis represents counts from the first sub-sample The x-axis represents counts from the second sub-sample
9.4.1.3 Other sources of variation Other factors can affect either the number of organisms present or the numbers detected and reported. These factors include inadequate mixing of samples and inaccurate measurement of aliquot volumes. Also, errors in the number of organisms reported can be introduced by equipment, analysts or laboratory procedures, as well as by the methods used. A small amount of random variability is expected from every procedure and this can be acceptable. However, excessive random variability might indicate an imprecise method and this should become apparent during the characterisation of a new method. Non-random or systematic variation, for example due to the inadequacy or difference in performance of the method, should be highlighted during method validation when a new method is being evaluated. Any investigation, therefore, needs to separate or distinguish the variation caused by or inherent to the methods used and that resulting from natural or random variability. 9.4.1.4 Statistical detection of other sources of variation Method comparison studies have been designed and analysed to detect whether other sources of variation are present, and whether they are microbiologically and/or statistically significant(52). The sources of variation in the enumeration of the relevant organism become apparent when the components of that count are studied. For example,
yi = µ + εi (1) where: i is 1 or 2, representing the first or second aliquot in the paired sample;
yi is the number of organisms enumerated;
93

µ is the mean value for the sample; and εi is the random error.
Equation (1) can be expanded to:
yi = µt + ml + mm + εti + εli (2) where: µt is the true mean value of organisms present in the whole sample;
ml is the laboratory effect (independent of the two methods); mm is the method effect (mref = reference method and mnew = new (trial)
method); εti is the random or natural error between aliquots; εli is the random measurement error in the laboratory.
The values of the laboratory effect and of the two types of error can be negative or positive. The laboratory effect plus the method effect (i.e. ml + mm) is the systematic, average difference from the true mean when that method is used in that laboratory. It represents the bias and is inversely proportional to the “trueness” of the measurement. Random variation reflects precision and hence, the difference between the paired counts is: y1 – y2 = (µt + ml + mref + εt1 + εl1) – (µt + ml + mnew + εt2 + εl2) = (mref – mnew) + (ε1 – ε2) (3) If sufficient samples are examined then the random errors should average to zero. Thus, the expected value of y1 – y2 may be represented as:
E(y1 – y2) = mref – mnew (4) Any interaction between method and laboratory will be included in this expression but does not affect the conclusions about the effectiveness of the new (trial) method in a particular laboratory undertaking the trial. Because the absolute errors may be large (due to the natural random variation) the precision will be low and a large amount of data will be required for a powerful statistical estimate of (mref – mnew). 9.4.1.5 Limitation of errors Errors in measurement (i.e. those for which the laboratory is responsible) should be minimised or eliminated by implementing a quality assurance programme that includes the use of internal quality control samples and participation in an appropriate external inter-laboratory quality assessment scheme. In an attempt to minimise the effects of systematic and random “errors” it is essential that laboratories make use of appropriate reference materials and take part in inter-laboratory, external quality assessment or proficiency testing schemes. In addition, attention should be paid to media, incubators and membrane filters with appropriate quality control as described elsewhere in this publication. Where used, commercially available media, reagents and membrane filters from a single batch should be used when undertaking comparisons of microbiological methods.
94

9.5 Practical aspects of the comparison of two methods The comparison of a new method with a reference method should be undertaken with an appropriate diversity of target and competing non-target organisms (obtained from a variety of sources) relevant to the test methods. The preparation of suitable samples (see section 9.5.2) is very important and the waters used should be derived from several sources. Each source may be referred to as a “category of origin” or “water type”, and samples of water may be taken over different periods of time. Samples should be used which produce enumerated counts within the optimum ranges of both methods. These counts should yield sufficient numbers of organisms to provide a meaningful statistical comparison. For example, with a membrane filtration method, a suitable range of 20 - 50 target organisms per unit volume (typically, 100 ml for drinking water, but may be smaller for environmental waters for example 10 and 1 ml for surface water) is estimated to be sufficient. If the method enumerates more than one target group of organism (for example E. coli and coliform bacteria) then separate tests may be necessary to ensure that each target group is enumerated in the range. For environmental water samples additional comparisons may be required for each water type for example river water. This would include comparisons consisting of 10 replicates on both media at three levels of interest using real samples. These are low level, 5 – 15 cfu per membrane, medium level, 25 – 50 cfu per membrane and high level, 50 – 100 cfu per membrane. These comparisons require a clear presentation of the data, a statistical comparison between each category of origin of samples and/or laboratories, and finally, an overall statistical comparison. The alternative or trial method should be rejected if it is shown that significantly lower average counts are obtained than those obtained using the reference method. The new method may be accepted if it is shown to be better than the reference method or it is demonstrated that there is no statistically significant difference between the methods where the 95 % confidence interval for the average difference lies above the value which would indicate that the new method was finding 10 % fewer organisms than that found by the reference method. A procedure to ascertain this is the mean relative difference analysis of ISO 17994(49). For a trial method which is found to be acceptable, it may be appropriate to test it against the reference method with samples containing low counts of the target organism(s). This should then demonstrate that there are no major differences between the two methods when much lower counts are compared. This would be particularly appropriate for methods used for analysing drinking waters. The approach for comparing method A (for example, an alternative method, referred to as the trial method) with method B (for example, an existing or statutory method, referred to as the reference method) is made on the basis of recording the difference in results obtained for paired sub-samples of a sample processed at the same time. This data set, when complete, is then progressively evaluated to ascertain whether there are any differences between water types or laboratories and whether the average results are comparable and the confidence intervals are acceptable. The methods to be compared should be tested with the types of samples which it is anticipated will be routinely analysed by the two methods. For drinking water these samples, generally, will comprise waters that have been subject to some form of
95

treatment, usually including disinfection. Because of the high quality of most treated water supplies it will, generally, be necessary to prepare samples that mimic the effect of inadequate treatment. Protocols for the preparation of suitable drinking water samples, containing chlorine as disinfectant, are given in section 9.5.1.1 For alternative disinfectants, it will be necessary to determine by experiment those conditions appropriate for the survival of suitable numbers of target organisms. For a method for which there is no previous comparison data available it is estimated that a minimum of 150 samples and up to about 250 samples(49) may be needed in the comparison trial, which reflect the range of source waters. If a single laboratory is undertaking the study this will involve selecting a range of sources of water or water types (usually 5 to 10) for analysis. Alternatively, a group of laboratories may undertake the study with a smaller selection of sources selected for each laboratory, but still ensuring that the range of water types expected to be analysed by the trial method are included. The methods used should be tested with the appropriate volume of sample relevant to the target organism and the prescribed limit. For drinking water this is usually 100 ml and this volume is used in this section for illustrative purposes. For environmental waters a smaller volume (for example 10 ml or 1 ml) may be more appropriate. The samples should not be diluted and should be tested over a period of several days, generally testing approximately 10 - 15 samples per day. 9.5.1 Preparation of drinking water test samples to compare one selective medium with another There are a several ways of preparing suitable samples (based on chlorinated waters) for carrying out comparisons of microbiological methods and these are listed in order of preference. i) Chlorinated tap water plus river water with the addition of extra quantities of chlorine to produce chlorine-stressed organisms, to a final concentration of chlorine of approximately 0.1 - 0.5 mg/l (see section 9.5.1.1.1). ii) Through treatment samples (for example, following granulated activated carbon or post rapid gravity filter treatment) if necessary, with a final concentration of chlorine of approximately 0.1 mg/l. iii) Chlorinated tap water plus sewage effluent with the addition of extra quantities of chlorine to produce chlorine-stressed organisms, to a final concentration of chlorine of approximately 1.2 - 2.5 mg/l (see section 9.5.1.1.2). iv) Naturally contaminated un-chlorinated groundwater with the addition of extra quantities of chlorine to produce chlorine-stressed organisms, to a final concentration of chlorine of approximately 0.1 mg/l. In certain situations, it may be necessary to use environmentally stressed organisms instead of chlorine-stressed organisms. In these cases, suitable samples may be prepared by prolonged storage of sewage effluent or river water samples.
96

9.5.1.1 Preparation of spiked samples Spiked samples are prepared which contain chlorine-stressed target organisms, non-target organisms and organisms closely related to target organisms. Ideally, samples should contain 20 - 50 target organisms per test aliquot (for example, 100 ml). 9.5.1.1.1 Generation of chlorine-stressed target organisms using river water Collect approximately 10 litres of tap water from a supply that is representative of the water supplies to be tested (referred to below as the ‘original source’), and cool to 5 ± 3 °C (store overnight if necessary). Collect at least 1000 ml of river water. If the tap water being used is derived from surface water, then the water source from which the tap water is derived should be used. Remove a small quantity of the cooled tap water and determine the concentration of free and total chlorine in a suitable aliquot. This determination is used to calculate the amount of chlorine that should be added to the remaining volume of tap water, to produce a free chlorine concentration of approximately 0.1 - 0.5 mg/l. The calculated amount of chlorine can be added using a solution prepared from sodium hypochlorite or chlorine-generating tablets. The chlorinated tap water should be stoppered or capped and thoroughly mixed. Store the chlorinated tap water at 5 ± 3 °C. Add 900 ml of the cooled chlorinated tap water to a suitable container, bottle or flask. To the container, add 100 ml of the river water, mix well, leave for 5 minutes, and then determine the free and total chlorine concentration. To a second container, add 900 ml of the cooled chlorinated tap water and 100 ml of deionised or distilled water, mix well, leave for 5 minutes and then determine the free and total chlorine concentration. These two containers are used as controls for assessing whether the chlorine demand is too high. For example, if the concentration of chlorine in the mixed tap and river water falls to non-detectable levels within the 5 minutes, then 10 litres of tap water containing a higher concentration of chlorine, i.e. greater than 0.1 - 0.5 mg/l, will be required. The concentration of chlorine in the tap water, required to achieve the desired concentration of free chlorine in the mixed tap and river water solution, will vary according to the pH and organic and inorganic contents of the river and tap water. It may be necessary to carry out preliminary trials to determine the optimum concentration of chlorine in the tap water. When satisfactorily resolved and 10 litres of tap water of the correct concentration of chlorine have been prepared, add 900 ml of cooled tap water containing the correct level of chlorine to each of seven suitable containers, bottles or flasks. Add 100 ml of the river water to one of the containers and mix well. Allow the chlorination process to react for 1 minute ± 5 seconds, and then add 1 ml of 18 % m/v sodium thiosulphate pentahydrate solution to the container. Cap and mix well, and store at 5 ± 3 °C. Repeat the procedure using each of the remaining six containers and chlorination times of 1.5, 2.0, 2,5, 3.0, 3.5, and 4.0 minutes (± 5 seconds) respectively. Remove 10 ml of the mixed tap and river water from each container and analyse each of the seven samples for the target organism. A method should be used that will yield a presumptive result, ideally, within 24 hours. Store the containers at 5 ± 3 °C. After incubation, determine the number of organisms in each 10 ml aliquot, and identify those containers, bottles or flasks found to contain 30 - 90 target organisms in the
97

corresponding 10 ml aliquots. This number of organisms is higher than the target range of 20 - 50, in order to allow for some decay in the population of the organisms during overnight storage. For the number of identified containers possessing 30 - 90 target organisms in 10 ml aliquots, add 900 ml of fresh tap water from the original source to separate clean 1000 ml containers. To each of these containers, add sufficient sodium thiosulphate pentahydrate solution to neutralise any residual chlorine and mix well. To each separate container, add 100 ml of the corresponding mixed tap and river water samples from those identified containers possessing 30 - 90 target organisms in 10 ml aliquots. Cap and mix well. Each 1000 ml of diluted mixed tap and river water sample now enables up to 10 replicate 100 ml samples to be analysed by two or more methods used in parallel by one or more analysts. Alternatively, larger volumes of diluted mixed tap and river water samples can be prepared, by increasing proportionately the volumes of fresh tap water from the original source and mixed tap and river water. 9.5.1.1.2 Generation of chlorine-stressed target organisms using sewage effluent Collect 10 litres of tap water from a supply that is representative of the water supplies to be tested (referred to below as the ‘original source’), and cool to 5 ± 3 °C (store overnight if necessary). Collect at least 1000 ml of sewage effluent and store for one hour at 5 ± 3 °C to ensure solid material settles. Prepare a solution of chlorine, containing 12 - 25 mg/l by dissolving the appropriate amount of hypochlorite solution or chlorine-generating tablets in 1 litre of distilled or deionised water. Cap and mix well. Taking care not to disturb any settled solid material, transfer 500 ml of the sewage effluent into a clean 10 litre container (one fitted with a tap will make the following procedures easier to carry out) containing a magnetic stirrer bar, or other stirring mechanism. Add 8.5 litres of the tap water previously stored at 5 ± 3 °C. Cap the container, mix the contents thoroughly and stand the container on a magnetic stirrer and stir vigorously. Whilst maintaining the stirring action, add to the container, sufficient volume, up to 1000 ml, of the solution of chlorine to produce a free chlorine concentration in the mixed tap water-sewage effluent solution of 1.2 - 2.5 mg/l. (The exact volume of chlorine solution may have to be adjusted accordingly). Mix the contents vigorously. After 3 minutes, transfer 500 ml of the chlorinated mixed tap water-sewage effluent solution into a suitable vessel, bottle or flask containing 1 ml of 18 % m/v sodium thiosulphate pentahydrate solution. Stopper and mix well by inverting several times to ensure the chlorine is rapidly neutralised. Repeat the procedure at one-minute intervals, by transferring 500 ml of the chlorinated mixed tap water-sewage effluent solution into other, separate vessels, bottles or flasks each containing 1 ml of 18 % m/v sodium thiosulphate pentahydrate solution, until 16 samples have been taken and prepared. Remove 10 ml of the mixed tap water-sewage effluent solution from each container and analyse each of the 16 solutions for the target organism. A method should be used that will yield a presumptive result, ideally, within 24 hours. Store the containers at 5 ± 3 °C.
98

After incubation, determine the number of organisms in each 10 ml aliquot, and identify those containers, bottles or flasks found to contain 30 - 90 target organisms in the corresponding 10 ml aliquots. This number of organisms is higher than the target range of 20 - 50, in order to allow for some decay in the population of the organisms during overnight storage. For the number of identified containers possessing 30 - 90 target organisms in 10 ml aliquots, add 900 ml of fresh tap water from the original source to separate clean 1000 ml containers. To each of these containers, add sufficient sodium thiosulphate pentahydrate solution to neutralise any residual chlorine and mix well. To each separate container, add 100 ml of the corresponding mixed tap water-sewage effluent solution from those identified containers possessing 30 - 90 target organisms in 10 ml aliquots. Cap and mix well. Each 1000 ml diluted mixed tap water-sewage effluent solution now enables up to 10 replicate 100 ml samples to be analysed by two methods used in parallel by one or more analysts. Alternatively, larger volumes of diluted mixed tap water-sewage effluent solution can be prepared, by increasing proportionately the volumes of fresh tap water from the original source and mixed tap water-sewage effluent solution. 9.5.2 Preparation of environmental and recreational water test samples to compare one selective medium with another Environmental waters usually contain a natural flora of indicator organisms, particularly where significant wastewater or agricultural contamination occurs. These indicator organisms will already be stressed and further stressing, for example by storage at low temperature, is unnecessary. 9.5.2.1 Collect a minimum of 1 litre of water. Where the water is reasonably clear, mix it thoroughly. For turbid waters, store for one hour at 5 ± 3 °C to ensure that particulate material settles. 9.5.2.2 Process 10 ml, 1 ml and any dilutions considered necessary and analyse for the target organism. A method should be used that will yield presumptive results, ideally, within 24 hours. A guide value for Enterococci can also be obtained by reading plates at 24 hours. Store the sample at 5 ± 3 °C. 9.5.2.3 After incubation, determine the number of organisms in each volume of the sample analysed and identify the appropriate volume of sample, or dilution, found to contain 30 – 90 organisms. This number is higher than a target range of 20 – 50, in order to allow for some decay in the population of organisms during overnight storage. 9.5.2.4 The appropriate volume of sample, or dilution, can now be analysed by two or more methods used in parallel by one or more analysts. Several different environmental waters can be analysed in this way. 9.5.2.5 Where environmental waters do not contain sufficient target organisms, wastewater effluent can be used to provide sufficient numbers. Collect 100 ml of treated wastewater effluent and store for one hour at 5 ± 3 °C to ensure solid materials settle. Add 100 ml of settled effluent to 900 ml of environmental water sample and follow the steps from 9.5.2.2 to 9.5.2.4.
99

9.5.3 Preparation of environmental and recreational water samples to verify the performance of a selective medium using reference cultures 9.5.3.1 Verification of a reference method in, for example, a new laboratory can be undertaken using broth cultures of reference organisms. Recovery of target organisms by the reference method can be compared with recovery on a non-selective medium, for example, nutrient agar. Cultures of target organisms can be prepared by inoculating a suitable broth, for example, nutrient broth, with a reference culture, incubating at an appropriate temperature for 21 ± 3 hours and storing the broth culture at 5 ± 3 °C for several days to create ‘stressed’ organisms. Following storage, reference cultures can be counted using pour or spread plates or a suitable alternative counting method, for example, Miles and Misra(53). Once the numbers of target organisms are established, suitable dilutions can be prepared to give an appropriate range of target organisms for the test. 9.5.3.2 Environmental samples will contain large numbers of non-target organisms as well as target organisms and these may well interfere with counting on nutrient agar. This problem can be overcome by filtering out non-target organisms using a sterile 0.45 µm membrane and collecting the filtrate prior to inoculation with target bacteria. Enumeration may also be aided by adding an appropriate diagnostic chromogenic substrate, for example, BCIG (5-bromo-4-chloro-3-indolyl-β-D-glucuronide) to the nutrient agar for counting Escherichia coli. 9.5.3.3 Inoculate nutrient broth with the appropriate target organism and incubate at the appropriate temperature, typically 37 °C for 21 ± 3 hours. After incubation, store the broth culture at 5 ± 3 °C. After storage, count the broth culture using an appropriate enumeration method. 9.5.3.4 Collect a minimum of 1 litre of water. Where the water is reasonably clear, mix it thoroughly. For turbid waters, store for one hour at 5 ± 3 °C to ensure that particulate material settles. 9.5.3.5 Prepare dilutions of the target organism in Ringer’s solution or maximum recovery diluent such that when 1 ml of diluted culture is added to the water, the final concentration of organisms will be in the range of 20 – 50 organisms per ml or per 10 ml aliquot. 9.5.3.6 Membrane filter aliquots of the water sample, either 1 ml with some Ringer’s solution or 10 ml in duplicate to generate paired samples. Place one membrane on the selective medium and one membrane on the non-selective medium. Incubate the two media under the same temperature and time conditions and count the number of target organisms on each. 9.5.3.7 In this way a number of replicates, for example ten, can be prepared for each type of environmental water being examined. In addition, the reference method can be assessed with different concentrations of the target organisms, for example between 5 and 10 organisms for low level recovery and between 50 and 80 organisms for high level recovery.
100

9.5.4 Preparation of sewage sludge test samples Sewage sludge comprises a diverse range of materials from mostly liquid through varying states of semi-solid to almost solid. All are derived from wastewater but the consistency of the matrix and the numbers and types of organisms present depend on the character of the waste contributing from the sewerage catchment and the nature and extent of the treatment that has been applied. Liquid and semi-solid raw sludge can contain very large numbers of indicator bacteria as well as a diverse range of non-target and potentially competing micro-organisms. By contrast, sludge that has received enhanced treatment, for example by thermal drying, will have a very high solid content and very low numbers of organisms. Treatments such as anaerobic digestion, lime addition and thermal drying are intended to reduce the number of pathogens and indicator organisms and those remaining in the sludge are likely to be stressed. Some sludge may contain substances, for example certain metals, that are toxic or inhibitory. 9.5.4.1 The most important factor when comparing methods for sludge is the homogeneity of the sample under test. In all cases a robust preparation procedure to homogenise the sample is a pre-requisite to comparing methods indeed some comparisons may entirely relate to potential improvements in preparation methodology rather than the enumeration stage. Methods for the sampling and preparation of sludge samples for analysis are described elsewhere is this series(27). 9.5.4.2 As with other matrices comparisons for sludge should include samples from all the types of sludge for which the method is intended to be applied. This should include sludge consistency and derivation as well as geographical variation. The comparison should also encompass the range of intended numerical application with sufficient samples with low numbers of organisms to verify the practical lower limit of determination. 9.5.4.3 The particulate content of sludge dictates that dilution is normally a significant but variable factor prior to enumeration. Where a most probable number method is part of the comparison and low numbers are expected this will be to a lesser extent than for a membrane or plate count method. It should be borne in mind that practical applications may involve enumeration of sludge pre and post treatment for example for the estimation of log reduction in assessing performance or as a regulatory requirement. If the character of a sludge changes markedly during treatment and the treated sludge contains very few organisms different enumeration methods, having different uncertainties and limitations, may have been used. When comparing enumeration methods the sludge should be prepared as nearly as practical in the same manner for each method to be compared. The potential impact of differences between method conditions, such as incubation temperature, which are integral to target organism definition should be well understood. It is recommended that when log reductions are calculated these should include an uncertainty estimate. 9.5.4.4 Comparisons should identify any limitations encountered and take account of the uncertainties associated with preparation and dilution of samples when performing a statistical assessment of the data. Wherever possible these uncertainties should be quantified. 9.5.4.5 Preparation of sludge samples to compare one selective medium with another within a laboratory
101

Collect a representative sample of sludge, typically a minimum of 100 grams, thoroughly mix the sample and prepare a homogenised sub-sample according to a documented sample preparation protocol as the starting point for processing by the methods to be compared. The avoidance of cross contamination between samples is essential. Appropriate blank controls should be included. Prepare the range of dilutions considered necessary and analyse for the target organism. After incubation, determine the number of organisms in each dilution of the sample analysed and identify the appropriate sample dilution, found to contain 20 – 50 organisms for statistical analysis. Comparisons should ideally be performed using freshly prepared sludge and analysed immediately. The microbiological content of most sludge is likely to be highly unstable either because of biological activity or aggressive conditions such as those generated by the presence of lime and other bactericidal substances that may be used in sludge treatment. For statistical purposes comparisons should include 10 – 15 pairs of analyses for each sludge type and geographical location for which the methods are intended to be applied. In most instances it should be possible to achieve greater statistical confidence if replicate analyses, 3 or 5 replicates for example, are performed(54). This is likely to be a suitable approach where the application will involve replicates in practice but it should be borne in mind that this may not be appropriate when this is not the case. 9.5.4.6 Verification of the performance of a method for enumerating organisms in sludge using reference cultures and preparations Assessments of recovery efficiency provide valuable information and understanding about methods. However, the practical challenges when making quantitative additions either of freshly grown broth cultures of reference strains or commercially supplied reference materials to sludge should be well understood and taken into account when interpreting data. In view of the large numbers of target organisms likely to be present naturally, some form of treatment is usually required to eradicate these before adding the reference material. It is generally impractical to perform an assessment by known addition and subtraction of background. However, most treatments that might be applied to sludge, usually some form of heat treatment, carry the risk of changing the character of the sludge so that it is no longer representative and does not behave like the untreated material. Approaches that have been used include autoclaving and heating to 70°C for a defined period. Sludge that has been thermally dried may be suitable for direct addition. The sludge should be homogeneous for treatment and thoroughly mixed after addition of the reference material. The numbers of organisms added should be aimed at the range typical for the intended application. Procedures proposed for addition of reference materials should be extensively tried and tested during development to ensure that limitations and uncertainties are well understood and optimised before application to specific sludge matrices.
102

9.5.4.7 Preparation of sludge samples to compare the performance of one or more methods in more than one laboratory Comparisons between laboratories require the preparation of a homogeneous set of sub-samples. This is a key part of the preparation over and above ensuring appropriate and timely despatch, transport within an appropriate temperature range, arrival and appropriate storage of samples and suitable and consistent processing in the receiving laboratories. There are examples of inter-laboratory comparison involving: • despatch of sub-samples of digested sludge(55), • preparation and despatch of sludge cake and compost thoroughly mixed after spiking
with reference culture material(56) and • despatch of sludge and commercial reference material for spiking on receipt by each
laboratory(57). Inter-laboratory comparisons on this scale require careful planning and the development of detailed protocols to be followed by the issuing and receiving laboratories. These protocols should be designed with the type and quantity of data required together with the methods for data handling and analysis to be used in mind. 9.5.5 Confirmation tests If confirmation of presumptive target colonies is required, then this should be carried out according to the requirements of the method. Preferably all colonies should be selected for confirmation so as to produce the most reliable confirmed count. However, if the presumptive counts are high, it may be acceptable to select 10 presumptive colonies to be tested for confirmation if there are more than 10 presumptive colonies present, and all colonies should be tested, if there are 10 presumptive colonies or less. Colonies should always be chosen at random, but to avoid any bias from, for example, unconscious choice of similar colonies, all the colonies in a randomly chosen segment of appropriate size should be examined. If there are multiple types of presumptive colony then each type must be confirmed, with colonies of each type selected randomly as above (See also section 7.3.1.4.1) 9.5.6 Verification of identity of target and non-target organisms Methods should already have undergone validation that should have included a determination of the proportion of false-positive and false-negative results. However, this determination may have been carried out on a limited range of samples or sources of organisms. It is possible that different sources or categories of origin of water or sludge may contain different spectra of organisms from those examined in the initial validation trial and this may affect the proportion of false-positive and false-negative results. It can be useful, therefore, to carry out a more extensive identification of a selection of target or presumptive target colonies and non-target or presumptive non-target colonies(52). This identification is distinct from any confirmation steps that may be an integral part of the methods under test. A minimum of 100 target colonies and, where appropriate, 50 non-target colonies per method should be selected for full identification by a suitable method. For most purposes,
103

commercial identification kits may be adequate, but other approaches to identification may be more appropriate for some organisms. If the method under test is used for more than one target or presumptive target organism then at least 100 representative colonies of each organism should be examined. For example, if a method detects Salmonella species and E. coli simultaneously, then examination of 100 presumptive colonies of Salmonella and 100 presumptive colonies of E. coli would be required. The colonies should be selected so that they are evenly distributed over the sources of water or sludge examined. When confirmation tests are conducted, the most appropriate procedure of selecting target colonies for further identification is to choose the first one identified for confirmation. The advantage of this is that it will be known whether the colony confirmed or not. Non-target colonies should be selected at random, preferably one colony per Petri dish or plate and selected so that there are similar numbers examined from each sample source. The spectrum of target or non-target organisms detected should be compared with that expected from previous validation data. If a particular source, or category of origin of the sample from one source, exhibits differences from other sources then examination of the identification data may facilitate an interpretation of the differences. 9.6 Interpretation of data Pilot work with the preparation of samples is essential. It is necessary to ensure that as many samples as possible give counts within the required range of 20 - 50 target organisms. Once the study has commenced, all enumerated counts should be recorded. If any result is higher than expected, for example, a result is too numerous to count (such as greater than 100 for membrane filtration, or in the multiple tube technique, all tubes exhibit growth in the medium) then the subsequent data analysis may be biased if paired results are omitted where this is observed for only one of the methods. If the paired results obtained by both methods are too numerous to count, then both results can be omitted from the data analysis. This is because both results contribute little or no information about whether the trial method gives a higher or lower result than the reference method. When a zero count obtained by one method is reported but is associated with a non-zero count obtained by the other method, then both results must be recorded and included in the data analysis. If paired zero counts are reported by both methods then these results can be excluded from the data analysis because they contribute little or no information about whether the trial method gives a higher or lower result than the reference method. 9.6.1 Data collection For drinking water samples the procedures described in sections 9.5.1.1.1 and 9.5.1.1.2 should enable aliquots of samples to be prepared that contain 20 - 50 target organisms. However, samples with lower counts may be obtained and these should still be included. The samples may be stored and appropriate aliquots withdrawn and tested by both methods. This procedure should then be repeated on different days. However, on every occasion, the sample should be thoroughly mixed before the appropriate volumes are withdrawn for analysis by both methods. The results from both methods must be recorded as a “paired sample” result.
104
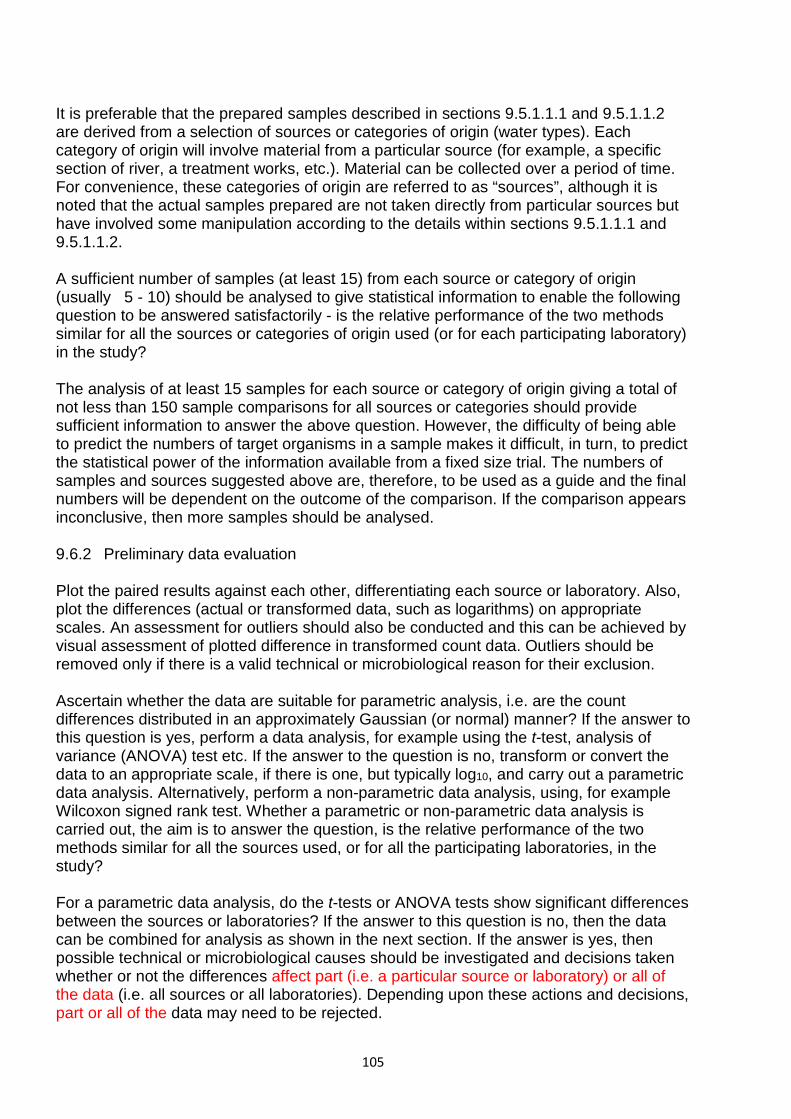
It is preferable that the prepared samples described in sections 9.5.1.1.1 and 9.5.1.1.2 are derived from a selection of sources or categories of origin (water types). Each category of origin will involve material from a particular source (for example, a specific section of river, a treatment works, etc.). Material can be collected over a period of time. For convenience, these categories of origin are referred to as “sources”, although it is noted that the actual samples prepared are not taken directly from particular sources but have involved some manipulation according to the details within sections 9.5.1.1.1 and 9.5.1.1.2. A sufficient number of samples (at least 15) from each source or category of origin (usually 5 - 10) should be analysed to give statistical information to enable the following question to be answered satisfactorily - is the relative performance of the two methods similar for all the sources or categories of origin used (or for each participating laboratory) in the study? The analysis of at least 15 samples for each source or category of origin giving a total of not less than 150 sample comparisons for all sources or categories should provide sufficient information to answer the above question. However, the difficulty of being able to predict the numbers of target organisms in a sample makes it difficult, in turn, to predict the statistical power of the information available from a fixed size trial. The numbers of samples and sources suggested above are, therefore, to be used as a guide and the final numbers will be dependent on the outcome of the comparison. If the comparison appears inconclusive, then more samples should be analysed. 9.6.2 Preliminary data evaluation Plot the paired results against each other, differentiating each source or laboratory. Also, plot the differences (actual or transformed data, such as logarithms) on appropriate scales. An assessment for outliers should also be conducted and this can be achieved by visual assessment of plotted difference in transformed count data. Outliers should be removed only if there is a valid technical or microbiological reason for their exclusion. Ascertain whether the data are suitable for parametric analysis, i.e. are the count differences distributed in an approximately Gaussian (or normal) manner? If the answer to this question is yes, perform a data analysis, for example using the t-test, analysis of variance (ANOVA) test etc. If the answer to the question is no, transform or convert the data to an appropriate scale, if there is one, but typically log10, and carry out a parametric data analysis. Alternatively, perform a non-parametric data analysis, using, for example Wilcoxon signed rank test. Whether a parametric or non-parametric data analysis is carried out, the aim is to answer the question, is the relative performance of the two methods similar for all the sources used, or for all the participating laboratories, in the study? For a parametric data analysis, do the t-tests or ANOVA tests show significant differences between the sources or laboratories? If the answer to this question is no, then the data can be combined for analysis as shown in the next section. If the answer is yes, then possible technical or microbiological causes should be investigated and decisions taken whether or not the differences affect part (i.e. a particular source or laboratory) or all of the data (i.e. all sources or all laboratories). Depending upon these actions and decisions, part or all of the data may need to be rejected.
105

For a non-parametric data analysis, does the tabulation of frequencies of paired results by source or laboratories show differences between the sources or laboratory? If the answer to this question is no, then the data can be combined for analysis as shown in the next section. If the answer is yes, then again possible technical or microbiological causes should be investigated and decisions taken as to whether or not the differences affect part, or all, of the data. Depending upon these actions and decisions, part or all of the data may need to be rejected. 9.6.3 Combined analysis of average difference When the preliminary data evaluation has been completed satisfactorily, and if the data are suitable for combining, then an average difference between the methods can be presented which will be a mean (for parametric analysis) or a median (for non-parametric) together with a 95% confidence interval for this average. The method for analysing the differences in counts presented in this section is based on ISO 17994, originally published in 2004 and revised in 2014,(49) which assumes that log transformation and parametric analysis are appropriate, which is the case in the majority of situations. This method is the mean relative difference analysis(49). In the ISO method the data are log-transformed to the base e (referred to as natural logarithms and abbreviated to “ln”). In the DWI examples logs were taken to the base 10 (abbreviated to “log”). The results are equivalent, apart from a constant multiplier. ln(x) = 2.3026 log(x) For example, log 10 = 1 with ln 10 = 2.3026 and log 100 = 2 with ln 100 = 4.6052. Logs to the base 10 have the advantage that when graphs are being labelled that the scale can be readily converted to the pre-transformation data scale, i.e. label 1 as 10, 2 as 100, 3 as 1000 etc. In ISO 17994(49) the relative difference (x) of each pair of counts is calculated and tabulated using the equation x = [ln(a) – ln(b)] x 100 %, where ln(a) is the natural logarithm of the count by the trial method and ln(b) is the natural logarithm of the count by the reference method, for each sample. Data with a zero count by one method has one added to each count prior to log normal-transformation. From these data the mean relative difference ( ) and standard uncertainty (standard deviation) (s) are calculated. From the standard uncertainty and the number of samples (n) the expanded uncertainty (U) is calculated using the equation:
The expanded uncertainty, when added to and subtracted from the mean relative difference provides the “confidence interval” of the expanded uncertainty around the mean (XL and XU). The mean relative difference and its “confidence interval” are compared with a theoretical mean difference with maximum acceptable deviation limits (2L). For drinking water samples these are typically set at ± 10 %(49). The principal potential outcomes of this analysis are:
106
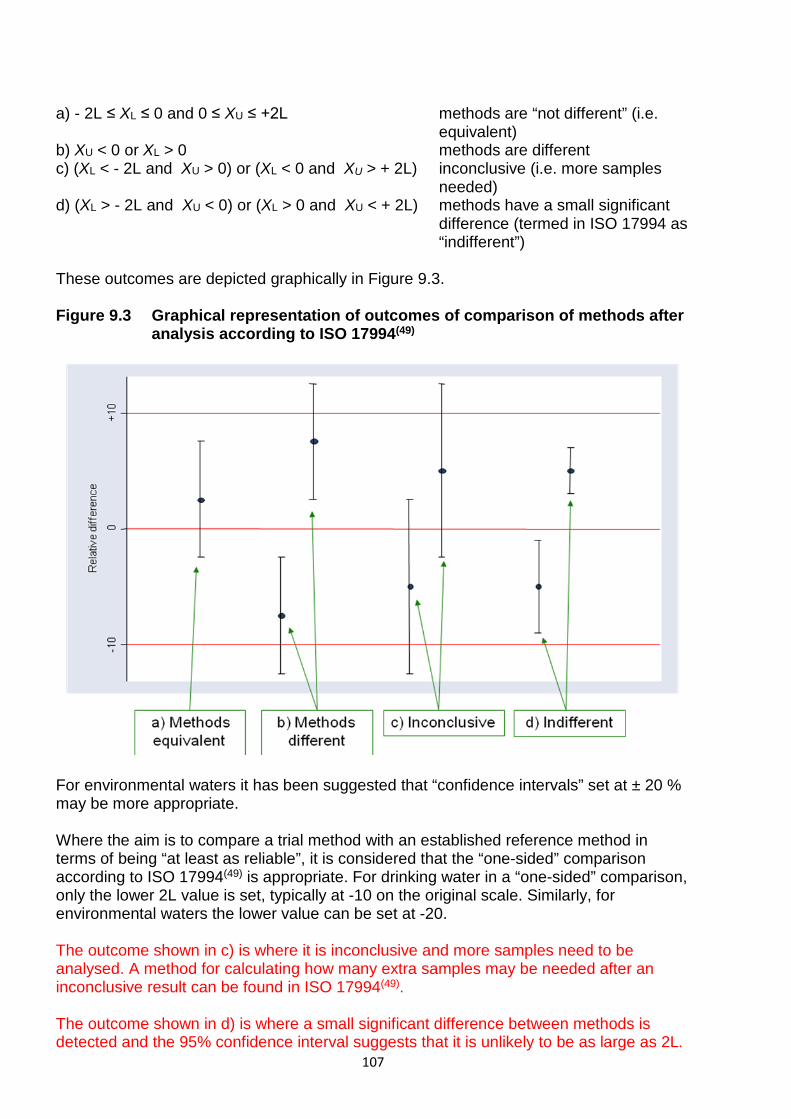
a) - 2L ≤ XL ≤ 0 and 0 ≤ XU ≤ +2L methods are “not different” (i.e. equivalent) b) XU < 0 or XL > 0 methods are different c) (XL < - 2L and XU > 0) or (XL < 0 and XU > + 2L) inconclusive (i.e. more samples
needed) d) (XL > - 2L and XU < 0) or (XL > 0 and XU < + 2L) methods have a small significant difference (termed in ISO 17994 as “indifferent”) These outcomes are depicted graphically in Figure 9.3. Figure 9.3 Graphical representation of outcomes of comparison of methods after
analysis according to ISO 17994(49)
For environmental waters it has been suggested that “confidence intervals” set at ± 20 % may be more appropriate. Where the aim is to compare a trial method with an established reference method in terms of being “at least as reliable”, it is considered that the “one-sided” comparison according to ISO 17994(49) is appropriate. For drinking water in a “one-sided” comparison, only the lower 2L value is set, typically at -10 on the original scale. Similarly, for environmental waters the lower value can be set at -20. The outcome shown in c) is where it is inconclusive and more samples need to be analysed. A method for calculating how many extra samples may be needed after an inconclusive result can be found in ISO 17994(49). The outcome shown in d) is where a small significant difference between methods is detected and the 95% confidence interval suggests that it is unlikely to be as large as 2L. 107

The difference in this case is less than the equivalence criteria and the methods can be regarded as equivalent. 9.7 Low count evaluation For some types of analyses (for example, drinking water) it may be appropriate to undertake a comparison of methods with low numbers of target organisms. This can be undertaken when satisfactory results are obtained from the main comparison. This evaluation comprises the comparison of results of paired analyses of samples containing less than 20 target organisms per unit test volume. This comparison is carried out to ensure that the results remain valid at lower levels of organisms, approaching those numbers closer to statutory limits, but not so low as to be based on presence/absence criteria. Such data may already be readily extracted from the main comparison study. Paired results of at least 30 samples are needed, where enumerated counts in the range 1 - 10 are recorded by at least one of the methods used. The samples can be prepared in the same way as described in sections 9.5.1.1.1 and 9.5.1.1.2 but with extra dilution steps. Successive two-fold dilutions of the same sample can be prepared, but samples should be derived from more than one source. In addition, samples should contain an appropriate diversity of organisms. If the paired results obtained in the main comparison study contain at least 30 samples giving counts in this lower range for all sources, then the data from these samples can be used for this evaluation. As for the main comparison, all the results should be plotted. With low counts it may be more of a problem to use a parametric data analysis approach, and it becomes more efficient to use a non-parametric analysis. The proportion of paired results where the count by the trial method exceeds the count given by the reference method should not be significantly lower than 50 % for the trial method to be considered to be acceptable. Thirty samples should give an estimate of the proportion, with an expanded uncertainty “confidence interval” that is not too large. For such a limited study it may be appropriate to set a maximum acceptable deviation limit of ± 20 on the count scale. If the “confidence interval” is large and there is evidence to suggest the trial method is not performing well, then more samples should be analysed to establish whether or not there is any significant difference within these bounds. 9.8 Comparison of an MPN method with an enumeration method The design of the study and the same procedures described in sections 9.5 and 9.6 should be used for comparing results obtained using an MPN method and those obtained using an enumeration method. When an MPN method is the new method, the aim of the comparison exercise is to show that the MPN method does not find significantly lower numbers of organisms than found by the enumeration method, and if this is the case, the average difference in counts is accurately established. However, the nature of the values obtained by the traditional 11- or 15-tube series MPN method may necessitate an alternative manipulation and statistical analysis of the data obtained. Appropriate tables(51) show the counts (MPNs) and ranges of counts (MPRs) corresponding to 11-tube series (1 x 50 ml, 5 x 10 ml, 5 x 1 ml) and 15-tube series (5 x10 ml, 5 x 1 ml, 5 x 0.1 ml). However, the range of values achievable with a multiple tube
108

method is discontinuous within the range of the method. For example, in an 11-tube series (1 x 50 ml, 5 x 10 ml, 5 x 1 ml) if 9 tubes exhibit growth in the medium (say 1, 5, 3) then from tables, the MPN is 91 per 100 ml. If 10 tubes exhibit growth in the medium (say 1, 5, 4) then the MPN is 160 per 100 ml. It is impossible to obtain a count between 91 and 160, whereas with an enumeration method all the values between the two results are theoretically available. One approach(58) to handle this difference in results obtained, especially where a tube series exhibits large gaps in MPNs is to group the results from the counting methods and compare them with the corresponding MPN. The grouping is carried out by consideration of each count and determining the tube combination that would be the most appropriate from a sample containing this number of organisms. This should not be confused with MPRs or confidence intervals published for MPNs(51) which are obtained from different conditional probabilities. Appropriate conditional probabilities have been published(58) and resulting ranges tabulated for tube combinations. For example, with the 11-tube series given above, it has been shown that counts between 69 and 110 would probably give a tube result of 1, 5, 3 and an MPN of 91. Counts between 111 and 175 would probably give a tube result of 1, 5, 4 and an MPN of 160. Enumerated counts of 69 to 110 could be interpreted as “equivalent” to an MPN of 91. Alternatively, especially with modern methods based on a greater number of tubes or wells, the MPN can be regarded as the end result and compared directly with the count from the paired result. Careful plots of the results should be made and consideration given to using non-parametric analyses. These problems can be reduced, by using suitable samples where less than half of the tubes in the series exhibit growth. If not, the MPN will be an approximate count, and the comparison with the enumeration method might become biased. Multiple tube methods that require large numbers of tubes (at several dilutions) are more reliable than multiple tube methods with fewer dilutions and tubes. 9.9 Comparison of two MPN methods The same procedures described in sections 9.5 and 9.6 should be used when two MPN methods are compared. The points raised in section 9.8 still apply to both MPN methods and the principles of the comparison remain the same. Again, factors may influence the choice of statistical methods, which should be decided after thorough scrutiny of the data summaries and plots. It is likely that non-parametric data analyses should be used. The preparation of samples should be such that the number of tubes in the series exhibiting growth in the medium for the reference MPN method should be less than half of those tubes inoculated. 9.10 Progression of a new method to national or international adoption On a national or international scale, the adoption of a new method involves a sequential series of events. These are: i) derivation or verification of validation data and comparison of the new method with a suitable reference method in one expert laboratory, ii) subsequent comparison of the new method with the reference method in five or more laboratories, iii) assessment of robustness, and iv) adoption of new method.
109

A new method should undergo full comparative testing, using the procedure outlined in this document, in at least five laboratories before being regarded as potentially of general applicability. Where adequate comparative assessments have been undertaken in a single laboratory and these assessments indicate that the results obtained using a new (trial) method are comparable or superior to the results obtained by a reference method, then the new method could be adopted for routine use by that laboratory. The adoption of the new method for routine use would not depend on whether other laboratories had carried out similar studies. When five, or more, laboratories have demonstrated that the performance of a new method is equivalent to, or better than the performance of a reference method, then wider adoption by other laboratories can be considered. In these cases, the comparison exercises undertaken by other laboratories may involve fewer samples. Ideally, the comparison studies carried out in the initial five, or more, laboratories may require the replicate analysis of about 180 samples (150 samples for main comparison and, if necessary 30 samples for the low count evaluation) in each laboratory. Ideally, all procedures described in sections 9.5.1 to 9.5.3 should be used, and samples should be representative of the sources of water or sludge that the laboratory is likely to analyse by the new method. Data from the comparison studies undertaken in the different laboratories should then be combined and reviewed following further statistical appraisal. By combining the data, it is possible to assess more confidently the robustness, repeatability and reproducibility of the new method. Once the robustness, repeatability and reproducibility of the new method have been satisfactory established, the new method is generally acceptable for adoption for routine use. Therefore, the numbers of samples that subsequent laboratories need to analyse by the new method can be reviewed in the light of the expanding database. However, for drinking waters, a minimum of 30 samples, containing low numbers of a variety of organisms, should be analysed and results compared with those obtained using the reference method.
110

10 References 1. The Drinking Water Inspectorate. Guidance on implementing of the Water Supply (Water Quality) Regulations 2016 in England and Wales. http://dwi.defra.gov.uk/stakeholders/guidance-and-codes-of-practice/wswq/05-monitoring-add-part3_v01.pdf 2. BS EN ISO/IEC 17025:2005 General requirements for the competence of testing and calibration laboratories. BSI 3. UKAS LAB 37 Accreditation Requirements for Sampling and Testing in Accordance with the Drinking Water Testing Specification (DWTS) http://www.ukas.com/library/Technical-Information/Pubs-Technical-Articles/Pubs-List/LAB37%20Edition%203%20Jun%2013%20final.pdf 4. Eurachem: Accreditation for Microbiological Laboratories. (2013) https://www.eurachem.org/index.php/publications/guides/microbiol 5 The Drinking Water Inspectorate (2007) Information letter 08/2007 Guidance on Interpretation of Regulation 16(2)(d)(i) of the Water Supply (Water Quality) Regulations http://www.dwi.gov.uk/stakeholders/information-letters/2007/08_2007ANNEX.pdf. 6 Biological agents: Managing the risks in laboratories and healthcare premises. HSE http://www.hse.gov.uk/biosafety/biologagents.pdf 7. The Approved List of biological agents. Advisory Committee on Dangerous Pathogens. HSE. http://www.hse.gov.uk/pubns/misc208.pdf 8. The Control of Substances Hazardous to Health Regulations 2002 (SI 2002/2677). 9. Infection at work: Controlling the risks. A guide for employers and the self-employed on identifying, assessing and controlling the risks of infection in the workplace. Advisory Committee on Dangerous Pathogens. 10. Laboratory biosafety manual WHO 3rd edition (2004) http://www.who.int/csr/resources/publications/biosafety/Biosafety7.pdf 11. NHS Scotland (2004). Guidelines on test methods for environmental monitoring for aseptic dispensing facilities 2nd edition. A working group of the Scottish Quality Assurance Specialist Interest Group, NHS Scotland. Available from http://www.sublimationscience.com/Validation/Regulatory%20Documents/environmental%20monitoring.pdf 12. BS EN ISO 14001:2015 Environmental management systems. Requirements with guidance for use. BSI 13. Health Technical Memorandum 07-01: Safe management of healthcare waste. Department of Health 2013
111

14. Safety requirements for autoclaves, Guidance Note PM73 (revision 3), London, Health and Safety Executive. Available at http://www.hse.gov.uk/pubns/guidance/pm73.pdf 15. BS 2646:1993 Autoclaves for sterilisation in laboratories, Part 1 - Specification for design, construction and performance; Part 3 - Guide to safe use and operation; Part 5 - Methods of test for function and performance. British Standards Institution, London. 16. UKAS LAB 14 In-house Calibration and Use of Weighing Machines. https://www.ukas.com/download/publications/publications-relating-to-laboratory-accreditation/LAB%2014%20-%20Edition%205%20-%20July%202015.pdf 17. BS EN ISO 8199 Water Quality - General guidance on the enumeration of micro-organisms by culture 18. BS EN ISO 4788 Laboratory glassware, graduated measuring cylinders 19. The Microbiology of Drinking Water (2010) - Part 14 - Methods for the isolation, identification and enumeration of Cryptosporidium oocysts and Giardia cysts. Environment Agency Standing Committee of Analysts 20. BS EN ISO 11133:2014 Microbiology of Food, animal feed and water. Preparation, production, storage and performance testing of culture media. BSI 21. Public Health England, UK Standards for Microbiology Investigations (SMI TP40): Matrix-Assisted Laser Desorption/Ionisation - Time of Flight Mass Spectrometry (MALDI-TOF MS) Test Procedure (Draft for Consultation 2015) 22. Molecular Microbial Diagnostic Methods - Pathways to Implementation for the Food and Water Industries – Chapter 9: MALDI-TOF: A rapid microbiological confirmation technique for food and water analysis. Elsevier ISBN 9780124169999, Capocefalo M., Ridley E. V., Tranfield E. Y. & Thompson K. C 2015 23. Guidance on Water Matrices Definitions for Sampling and Testing to ISO/IEC 17025. https://www.ukas.com/news/guidance-on-water-matrices-definitions-for-sampling-and-testing-to-isoiec-17025/ 24. Potential inaccuracy of microbiological counts from routine water samples. Water Science and Technology, Tillett, H. E., 1993, 27, 15-18. 25. Preliminary study of microbiological parameters in eight inland recreational waters, Letters in Applied Microbiology, Public Health Laboratory Service Water Surveillance Group, 1995, 21, 267-271. 26. Standing Committee of Analysts, The Microbiology of Drinking Water (2010) – Part 2 – Practices and procedures for sampling. Methods for the Examination of Waters and Associated Materials, in this series, Environment Agency. 27. Standing Committee of Analysts, The Microbiology of Sewage Sludge (2003) – Part 2 – Practices and procedures for sampling and sample preparation. Methods for the Examination of Waters and Associated Materials, in this series, Environment Agency.
112

28. Water Quality - Guidance on Validation of Microbiological Methods, Technical Report ISO/TR 13843:2000, International Organisation for Standardisation, Geneva. 29. The numerical interpretation of fermentation-tube results. Journal of Infectious Diseases, McCrady, M. H., 1915, 17, 183-212. 30. Tables for rapid interpretation of fermentation-tube results. Public Health Journal, Toronto, McCrady, M. H., 1918, 9, 201-220. 31. Estimation of bacterial densities by means of “the most probable number”, Biometrics, Cochran, W. G., 1950, 6, 105-116. 32. Statistical methods and control in bacteriology. Bacteriological Reviews, Eisenhart, C. & Wilson, P. W., 1943, 7, 57-137. 33. Numerical estimation of B. coli by dilution method. Indian Journal of Medical Research, Swaroop, S., 1938, 26, 353-378. 34. The range of variation of the most probable number of organisms estimated by the dilution method, Indian Journal of Medical Research, Swaroop, S., 1951, 39, 107-134. 35. How probable is the most probable number? Journal of the American Waterworks Association, Woodward, R. L., 1957, 49, 1060-1068. 36. The probability of most probable numbers. European Journal of Applied Microbiology, de Man, J. C., 1975, 1, 67-78. 37. Estimated numbers of bacteria in samples from non-homogeneous batches of water. Journal of Applied Bacteriology, Tillett, H. E. & Coleman, R. E., 1985, 59, 381-388. 38. Most probable numbers of organisms: revised tables for the multiple tube method. Epidemiology and Infection, Tillett, H. E., 1987, 99, 471-476. 39. ISO online MPN calculator Excel programme at http://standards.iso.org/iso/7218 40. Inaccuracy of counts of organisms in water or other samples: effects of pre-dilution. Letters in Applied Microbiology, Tillett, H. E. & Farrington, C. P., 1991, 13, 168-170. 41. Guide to the expression of uncertainty in measurement. 1995, International Organisation for Standardisation, Geneva 42. Water quality – Enumeration of micro-organisms in water samples – Guidance on the estimation of variation of results with particular reference to the contribution of uncertainty of measurement, BS8496:2007, British Standards Institution, London. 43. Microbiological Analysis of Food and Water: Guidelines for Quality Assurance, Lightfoot, N. F. & Maier, E. A. (eds.) 1998, Elsevier Science, Amsterdam.
113

44. Duplicate split samples for internal quality control in routine water microbiology. Letters in Applied Microbiology, Lightfoot, N. F., Tillett, H. E., Boyd, P. & Eaton, S., 1994, 19, 321-324. 45. Statistical methods and control in bacteriology. Bacteriological Reviews, Eisenhart, C. & Wilson, P. W., 1943, 7, 57-137. 46. Statistical concepts in microbiology, Bacteriological Reviews, Steerman, R. L., 1955, 19, 160-215. 47. Quality control in environmental microbiology compared with chemistry; What is homogeneous and what is random? Water Science and Technology, Tillett, H. E. & Lightfoot, N. F., 1995, 31, 471-477. 48. Proficiency testing: assessing z-scores in the longer term. Royal Society of Chemistry Analytical Methods Committee (amc) technical brief AMCTB No. 16 http://www.rsc.org/images/proficiency-testing-z-scores-technical-brief-16_tcm18-214838.pdf ) 49. Water Quality – Requirements for the comparison of the relative recovery of microorganisms by two quantitative methods, ISO 17994:2014, International Organisation for Standardisation, Geneva. 50. BS EN ISO 16140-1:2016 Microbiology of the food chain. Method validation. Vocabulary BSI 51. The Microbiology of Drinking Water 2009 – Part 4 – Methods for the isolation and enumeration of coliform bacteria and Escherichia coli (including E. coli O157:H7). Methods for the Examination of Waters and Associated Materials. Nottingham: Environment Agency. 52. Quality control in environmental microbiology compared with chemistry; What is homogeneous and what is random? Water Science and Technology, Tillett, H. E. & Lightfoot, N. F., 1995, 31, 471-477. 53. The estimation of the bactericidal power of the blood. Journal of Hygiene (London), Miles, A. A., Misra, S. S. & Irwin, J. O., 1938, 38(6), 732-749. 54. A comparison of methods used to enumerate E. coli in conventionally treated sewage sludge. Journal of Applied Microbiology, Eccles, J. P., Searle, R., Holt, D, & Dennis, P. J., 2004, 96, 375-383. 55. UKWIR Report Ref. No. 99/SL/06/3, A Survey of E. coli in UK Sludges (1999) 56. CEN Horizontal-Hyg Horizontal Standards on Hygienic Microbiological parameters for implementation of EU Directives on Sludge, Soil and Treated Biowastes (April 2008) Validation Study Report E. coli and Salmonella spp. Inter-laboratory study 57. Unpublished: E. coli Sludge Trial of the Colilert Method (2003) an inter-laboratory trial using commercial reference materials organised by K. C. Thompson, ALcontrol Laboratories, Rotherham, UK.
114

58. Water quality control trials: statistical tables for direct comparison between membrane filtration bacterial counts and multiple tube methods with a description of the bacteriological method. Epidemiology & Infection, Tillett, H. E., Wright, A. E.& Eaton, S., 1988, 101, 361-366. 59. WDCM http://refs.wdcm.org/home.htm 60. NCTC https://www.phe-culturecollections.org.uk/collections/nctc.jsp
115

Annex A 95 % Confidence intervals for the (unobserved) count from the second half-sample for the observed count from the first half-sample (see section 8.5.2)
Observed count in first half-sample
95 % CI for unobserved count in second half-sample
Observed count in first half-sample
95 % CI for unobserved count in second half-sample
0 0 – 5 51 33 – 73 1 0 – 7 52 33 – 75 2 0 – 9 53 34 – 76 3 0 – 11 54 35 – 77 4 0 – 12 55 36 – 78 5 0 – 14 56 37 – 79 6 1 – 16 57 38 – 80 7 1 – 17 58 38 – 82 8 2 – 19 59 39 – 83 9 2 – 20 60 40 – 84 10 3 – 22 61 41 – 85 11 3 – 23 62 42 – 86 12 4 – 24 63 42 – 88 13 5 – 26 64 43 – 89 14 5 – 27 65 44 – 90 15 6 – 28 66 45 – 91 16 6 – 30 67 46 – 92 17 7 – 31 68 47 – 93 18 8 – 32 69 47 – 95 19 8 – 34 70 48 – 96 20 9 – 35 71 49 – 97 21 10 – 36 72 50 – 98 22 10 – 38 73 51 – 99 23 11 – 39 74 52 – 100 24 12 – 40 75 52 – 102 25 13 – 41 76 53 – 103 26 13 – 43 77 54 – 104 27 14 – 44 78 55 – 105 28 15 – 45 79 56 – 106 29 16 – 47 80 57 – 107 30 16 – 48 81 58 – 108 31 17 – 49 82 58 – 110 32 18 – 50 83 59 – 111 33 19 – 52 84 60 – 112 34 19 – 53 85 61 – 113 35 20 – 54 86 62 – 114 36 21 – 55 87 63 – 115 37 22 – 56 88 63 – 117 38 22 – 58 89 64 – 118 39 23 – 59 90 65 – 119 40 24 – 60 91 66 – 120 41 25 – 61 92 67 – 121 42 26 – 63 93 68 – 122 43 26 – 64 94 69 – 123 44 27 – 65 95 69 – 125 45 28 – 66 96 70 – 126 46 29 – 67 97 71 – 127 47 29 – 69 98 71 – 128 48 30 – 70 99 73 – 129 49 31 – 71 100 74 – 130 50 32 – 72
116

Observed count in first half-sample
95 % CI for unobserved count in second half-sample
Observed count in first half-sample
95 % CI for unobserved count in second half-sample
101 75-131 151 118-188 102 75-133 152 119-189 103 76-134 153 120-190 104 77-135 154 121-191 105 78-136 155 122-192 106 79-137 156 123-193 107 80-138 157 124-194 108 81-139 158 125-195 109 82-140 159 125-196 110 82-142 160 126-198 111 83-143 161 127-199 112 84-144 162 128-200 113 85-145 163 129-201 114 86-146 164 130-202 115 87-147 165 131-203 116 88-148 166 132-204 117 88-149 167 133-205 118 89-151 168 134-206 119 90-152 169 134-208 120 91-153 170 135-209 121 92-154 171 136-210 122 93-155 172 137-211 123 94-156 173 138-212 124 95-157 174 139-213 125 95-159 175 140-214 126 96-160 176 141-215 127 97-161 177 142-216 128 98-162 178 142-217 129 99-163 179 143-219 130 100-164 180 144-220 131 101-165 181 145-221 132 102-166 182 146-222 133 102-167 183 147-223 134 103-169 184 148-224 135 104-170 185 149-225 136 105-171 186 150-226 137 106-172 187 151-227 138 107-173 188 151-229 139 108-174 189 152-230 140 109-175 190 153-231 141 110-176 191 154-232 142 110-178 192 155-233 143 111-179 193 156-234 144 112-180 194 157-235 145 113-181 195 158-236 146 114-182 196 159-237 147 115-183 197 160-238 148 116-184 198 160-239 149 117-185 199 161-241 150 118-186 200 162-242
117

Observed count in first half-sample
95 % CI for unobserved count in second half-sample
Observed count in first half-sample
95 % CI for unobserved count in second half-sample
201 163-243 251 209-297 202 164-244 252 209-298 203 165-245 253 210-300 204 166-246 254 211-301 205 167-247 255 212-302 206 168-248 256 213-303 207 169-249 257 214-304 208 169-250 258 215-305 209 170-252 259 216-306 210 171-253 260 217-307 211 172-254 261 218-308 212 173-255 262 219-309 213 174-256 263 219-310 214 175-257 264 220-312 215 176-258 265 221-313 216 177-259 266 222-314 217 178-260 267 223-315 218 179-261 268 224-316 219 179-263 269 225-317 220 180-264 270 226-318 221 181-265 271 227-319 222 182-266 272 228-320 223 183-267 273 229-321 224 184-268 274 230-322 225 185-269 275 230-323 226 186-270 276 231-325 227 187-271 277 232-326 228 188-272 278 233-327 229 188-273 279 234-328 230 189-275 280 235-329 231 190-276 281 236-330 232 191-277 282 237-331 233 192-278 283 238-332 234 193-279 284 239-333 235 194-280 285 240-334 236 195-281 286 241-335 237 196-282 287 241-336 238 197-283 288 242-338 239 198-284 289 243-339 240 199-285 290 244-340 241 199-287 291 245-341 242 200-288 292 246-342 243 201-289 293 247-343 244 202-290 294 248-344 245 203-291 295 249-345 246 204-292 296 250-346 247 205-293 297 251-347 248 206-294 298 252-348 249 207-295 299 253-349 250 208-296 300 253-350
118
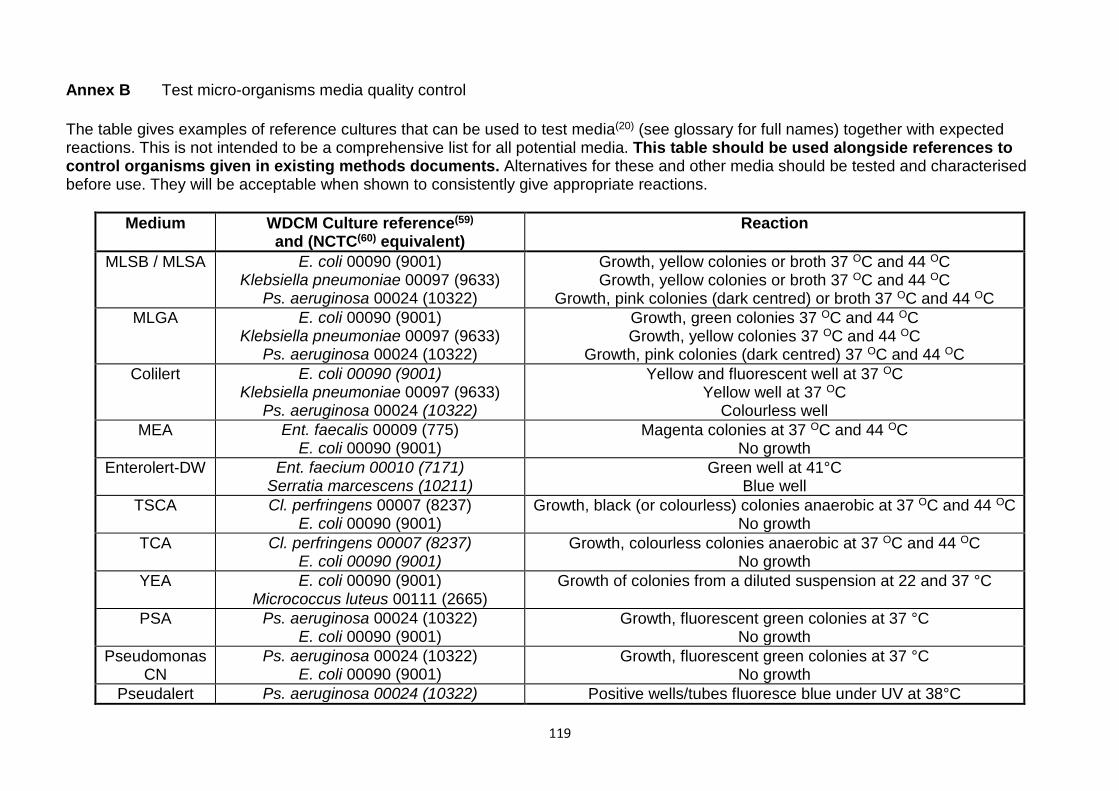
Annex B Test micro-organisms media quality control The table gives examples of reference cultures that can be used to test media(20) (see glossary for full names) together with expected reactions. This is not intended to be a comprehensive list for all potential media. This table should be used alongside references to control organisms given in existing methods documents. Alternatives for these and other media should be tested and characterised before use. They will be acceptable when shown to consistently give appropriate reactions.
Medium WDCM Culture reference(59)
and (NCTC(60) equivalent) Reaction
MLSB / MLSA E. coli 00090 (9001) Klebsiella pneumoniae 00097 (9633)
Ps. aeruginosa 00024 (10322)
Growth, yellow colonies or broth 37 OC and 44 OC Growth, yellow colonies or broth 37 OC and 44 OC
Growth, pink colonies (dark centred) or broth 37 OC and 44 OC MLGA E. coli 00090 (9001)
Klebsiella pneumoniae 00097 (9633) Ps. aeruginosa 00024 (10322)
Growth, green colonies 37 OC and 44 OC Growth, yellow colonies 37 OC and 44 OC
Growth, pink colonies (dark centred) 37 OC and 44 OC Colilert E. coli 00090 (9001)
Klebsiella pneumoniae 00097 (9633) Ps. aeruginosa 00024 (10322)
Yellow and fluorescent well at 37 OC Yellow well at 37 OC
Colourless well MEA Ent. faecalis 00009 (775)
E. coli 00090 (9001) Magenta colonies at 37 OC and 44 OC
No growth Enterolert-DW Ent. faecium 00010 (7171)
Serratia marcescens (10211) Green well at 41°C
Blue well TSCA Cl. perfringens 00007 (8237)
E. coli 00090 (9001) Growth, black (or colourless) colonies anaerobic at 37 OC and 44 OC
No growth TCA Cl. perfringens 00007 (8237)
E. coli 00090 (9001) Growth, colourless colonies anaerobic at 37 OC and 44 OC
No growth YEA E. coli 00090 (9001)
Micrococcus luteus 00111 (2665) Growth of colonies from a diluted suspension at 22 and 37 °C
PSA Ps. aeruginosa 00024 (10322) E. coli 00090 (9001)
Growth, fluorescent green colonies at 37 °C No growth
Pseudomonas CN
Ps. aeruginosa 00024 (10322) E. coli 00090 (9001)
Growth, fluorescent green colonies at 37 °C No growth
Pseudalert Ps. aeruginosa 00024 (10322) Positive wells/tubes fluoresce blue under UV at 38°C
119

Ps. fluorescens 00115 (10038) E. coli 00013 (12241)
No blue fluorescence No blue fluorescence
LPW E. coli NCTC 09001 Ps. aeruginosa NCTC 10322
Growth, yellow broth at 37 and 44 °C Growth, pink broth at 37 or 44 °C
TBXA E. coli 00090 (9001) Klebsiella pneumoniae 00097 (9633)
Growth, blue colonies 37 OC and 44 OC Growth, colourless colonies 37 OC and 44 OC
TW E. coli 00090 (9001) Klebsiella pneumoniae 00206
Growth, indole production at 37 and 44 °C Growth, no indole production at 37 or 44 °C
TNA E. coli 00090 (9001) Klebsiella pneumoniae 00206
Ps. aeruginosa (10322)
Growth, β-galactosidase (ONPG tablets), indole at 37 and 44 °C Growth, β-galactosidase (ONPG tablets), no indole at 37 and 44 °C Growth, no β-galactosidase (ONPG tablets), no indole 37 or 44 °C
KAAA Ent. faecalis 00009 (775)
E. coli 00090 (9001)
Aesculin hydrolysis on membrane transfer within 4 hours at 44 °C, growth and aesculin hydrolysis on subculture, 18 hours at 44 °C
No aesculin hydrolysis on membrane transfer within 4 hours at 44 °C, no growth or hydrolysis on subculture, 18 hours at 44 °C
BAA Ent. faecalis 00009 (775)
E. coli 00090 (9001)
Aesculin hydrolysis on membrane transfer within 4 hours at 44 °C, growth and aesculin hydrolysis on subculture, 18 hours at 44 °C
No aesculin hydrolysis on membrane transfer within 4 hours at 44 °C, no growth or hydrolysis on subculture, 18 hours at 44 °C
Milk agar Ps. aeruginosa (10322) E. coli 00090 (9001)
Growth and hydrolysis of casein at 37 °C within 24 hours Growth but no hydrolysis of casein within 24 hours.
1:10 phenanthroline
Ps. aeruginosa (10322) Ps. fluorescens 00115 (10038)
Growth of Ps. aeruginosa up to the disc within 24 hours at 37 °C Zone of inhibition around the disc within 24 hours at 37 °C
BPW Salmonella Enteritidis 00030 (12694) Growth 18 hours at 36 °C Brilliant Green
agar Salmonella Enteritidis 00030 (12694)
E. coli 00013 (12241) Ps. aeruginosa 00025 (12903)
Smooth red colonies Yellow colonies
Small crenated colonies Rapapports
broth Salmonella Enteritidis 00030 (12694)
E. coli 00013 (12241) Ps. aeruginosa 00025 (12903)
Growth (turbidity) 24 hours at 41.5 °C No growth No growth
XLDA Salmonella Enteritidis 00030 (12694) E. coli 00013 (12241)
Ps. aeruginosa 00025 (12903)
Black colonies 24 hours at 37 °C Yellow colonies 24 hours at 37 °C
Red or yellow colonies with grey/black centre 24 hours at 37 °C
120

Preston broth Campylobacter jejuni 00156 (11322) E. coli 00013 (12241)
Good typical growth when plated on CCDA No growth when plated on CCDA
Bolton broth Campylobacter jejuni 00156 (11322) E. coli 00013 (12241)
Good typical growth when plated on CCDA No growth when plated on CCDA
CCDA Campylobacter jejuni 00156 (11322) E. coli 00013 (12241)
Good typical growth No growth
Vogel Johnson agar
Staph. aureus 00032 (10788) E. coli 00013 (12241)
Black or grey colonies No growth
Ampicillin dextrin agar
Aeromonas hydrophila 00063 (8049) E. coli 00013 (12241)
Good growth yellow/yellow with green edge colonies 24 hours 30 °C No or poor growth
Shread’s medium
Aeromonas hydrophila 00063 (8049) E. coli 00013 (12241)
Growth of pale orange colonies 24 hours 30 °C Red colonies due to xylose fermentation
Ryan’s medium
Aeromonas hydrophila 00063 (8049) E. coli 00013 (12241)
Growth of yellow/yellow with green edge colonies 24 hours 30 °C No growth
TCBS Vibrio paraheamolyticus 00185 Vibrio furnissii 00186 E. coli 00013 (12241)
Growth of green colonies Growth of yellow colonies
Inhibited, no growth
121

Address for correspondence However well procedures may be tested, there is always the possibility of discovering hitherto unknown problems. Analysts with such information are requested to contact the Secretary of the Standing Committee of Analysts at the address given below. In addition, if users wish to receive advance notice of forthcoming publications, please contact the Secretary. Secretary Standing Committee of Analysts Environment Agency (National Laboratory Service) NLS Nottingham Meadow Lane Nottingham NG2 3HN (http://www.gov.uk/environment-agency) Standing Committee of Analysts Members assisting with this method Without the good will and support given by these individuals and their respective organisations SCA would not be able to continue and produce the highly valued and respected blue book methods. M Angell Thames Water N Barr Northern Ireland Water M Bedford South East Water Z Bickel South West Water P Boyd formerly Public Health England J Bryant formerly Anglian Water S Bullock Thames Water S Cole Wessex Water D Drury formerly DWI D Gaskell United Utilities J Green Scottish Water H Hawkins Affinity K Heaton Severn Trent Water P Holmes formerly Severn Trent Water P Johal ALS S Jones Wessex Water, formerly DWI A. Krzeminska Latis Scientific R Lawson Latis Scientific
J V Lee Leegionella Ltd K Moule formerly N. Ireland Water R.Morley formerly Health Protection Agency K Murray Scottish Water B Nielsen Alcontrol Laboratories M Reeve UKAS D Sartory SWM Consulting Ltd J Sellwood formerly Health Protection Agency H Shapland Wessex Water R Stephens Dwr Cymru Welsh Water R Stott NWL H Tillett SCOT S Vince DWI M Walters Environment Agency J Watkins formerly CREH Analytical Ltd J Yeo UKAS
122

123