Embed Size (px)
Citation preview

THE METROPOLITAN WATER DISTRICT OF SOUTHERN CALIFORNIA
Basic Financial Statements
Years ended June 30, 2017 and 2016
(With Independent Auditors' Report Thereon)


T H E M E T R O P O L I T A N W A T E R D I S T R I C T O F S O U T H E R N C A L I F O R N I A
T A B L E O F C O N T E N T S
June 30, 2017 and 2016
Independent Auditors' Report 1
Management's Discussion and Analysis – Unaudited 3
Basic Financial Statements – Audited
Statements of Net Position 16
Statements of Revenues, Expenses and Changes in Net Position 19
Statements of Cash Flows 20
Notes to Basic Financial Statements 23
Required Supplementary Information – Unaudited 84


www.mgocpa.com Macias Gini & O’Connell LLP 4675 MacArthur Court, Suite 600 Newport Beach, CA 92660
1
Independent Auditors’ Report
To the Board of Directors The Metropolitan Water District of Southern California: We have audited the accompanying financial statements of the Metropolitan Water District of Southern California (Metropolitan) as of and for the year ended June 30, 2017 and 2016, and the related notes to the financial statements, which collectively comprise Metropolitan’s basic financial statements as listed in the table of contents. Management’s Responsibility for the Financial Statements Management is responsible for the preparation and fair presentation of these financial statements in accordance with accounting principles generally accepted in the United States of America; this includes the design, implementation, and maintenance of internal control relevant to the preparation and fair presentation of financial statements that are free from material misstatement, whether due to fraud or error. Auditor’s Responsibility Our responsibility is to express an opinion on these financial statements based on our audits. We conducted our audits in accordance with auditing standards generally accepted in the United States of America. Those standards require that we plan and perform the audit to obtain reasonable assurance about whether the financial statements are free from material misstatement. An audit involves performing procedures to obtain audit evidence about the amounts and disclosures in the financial statements. The procedures selected depend on the auditor’s judgment, including the assessment of the risks of material misstatement of the financial statements, whether due to fraud or error. In making those risk assessments, the auditor considers internal control relevant to the entity’s preparation and fair presentation of the financial statements in order to design audit procedures that are appropriate in the circumstances, but not for the purpose of expressing an opinion on the effectiveness of the entity’s internal control. Accordingly, we express no such opinion. An audit also includes evaluating the appropriateness of accounting policies used and the reasonableness of significant accounting estimates made by management, as well as evaluating the overall presentation of the financial statements. We believe that the audit evidence we have obtained is sufficient and appropriate to provide a basis for our audit opinion. Opinion In our opinion, the financial statements referred to above present fairly, in all material respects, the financial position of the Metropolitan Water District of Southern California, as of June 30, 2017 and 2016, and the changes in its financial position and its cash flows for the fiscal years then ended in accordance with accounting principles generally accepted in the United States of America.

2
Emphasis of Matter As discussed in Note 9(h) to the basic financial statements, the San Diego County Water Authority (SDCWA) has filed various lawsuits against Metropolitan challenging Metropolitan’s rates and charges effective 2011 to 2018. On November 18, 2015, the Superior Court of California, County of San Francisco (the Court) issued a final judgment and a peremptory writ of mandate in favor of SDCWA with respect to certain of these cases awarding SDCWA $188.3 million in damages and $46.6 million of prejudgment interest for a total judgment of $234.9 million plus $8.9 million of attorney fees. Metropolitan filed a Notice of Appeal and on June 21, 2017, the California Court of Appeal ruled that Metropolitan may lawfully include its State Water Project transportation costs in the System Access Rate and System Power Rate and may lawfully include the System Access Rate in the wheeling rate but may not include its Water Stewardship Rate as a transportation cost in the Exchange Agreement price or the wheeling rates. The Court also ruled that inclusion of the Water Stewardship Rate in the Exchange Agreement price was a breach by Metropolitan of the Agreement. On July 31, 2017, SDCWA filed a petition for review with the California Supreme Court and on September 27, 2017, the California Supreme Court denied the petition. The 2010 and 2012 cases will now be returned to the trial court for a redetermination of damages. As the estimated liability is indeterminable at this time, no amounts have been presently recorded in the financial statements. Further, Metropolitan is unable to assess at this time the likelihood of success of the litigation or appeals on the rates and charges that became effective in 2013 to 2017 and on the rates and charges that will become effective in 2018. Metropolitan is also unable to assess at this time the likelihood of success of future claims. Our opinion is not modified with respect to this matter.
Other Matters Required Supplementary Information Accounting principles generally accepted in the United States of America require that the management’s discussion and analysis and information related to the pension and other postemployment benefits plans on pages 3-15 and 84-86, respectively, be presented to supplement the basic financial statements. Such information, although not a part of the basic financial statements, is required by the Governmental Accounting Standards Board, who considers it to be an essential part of financial reporting for placing the basic financial statements in an appropriate operational, economic, or historical context. We have applied certain limited procedures to the required supplementary information in accordance with auditing standards generally accepted in the United States of America, which consisted of inquiries of management about the methods of preparing the information and comparing the information for consistency with management’s responses to our inquiries, the basic financial statements, and other knowledge we obtained during our audit of the basic financial statements. We do not express an opinion or provide any assurance on the information because the limited procedures do not provide us with sufficient evidence to express an opinion or provide any assurance.
Newport Beach, California October 13, 2017

T H E M E T R O P O L I T A N W A T E R D I S T R I C T O F S O U T H E R N C A L I F O R N I A
MANAGEMENT’S DISCUSSION AND ANALYSIS—UNAUDITED June 30, 2017 and 2016
3
The following discussion and analysis of The Metropolitan Water District of Southern California’s (Metropolitan)
financial performance provides an overview of the financial activities for the fiscal years ended June 30, 2017 and
2016. This discussion and analysis should be read in conjunction with the basic financial statements and
accompanying notes, which follow this section.
DESCRIPTION OF BASIC FINANCIAL STATEMENTS
Metropolitan operates as a utility enterprise and maintains its accounting records in accordance with generally
accepted accounting principles for proprietary funds as prescribed by the Governmental Accounting Standards Board
(GASB). The basic financial statements include statements of net position, statements of revenues, expenses and
changes in net position, and statements of cash flows. The statements of net position include all of Metropolitan’s
assets, deferred outflows of resources, liabilities, and deferred inflows of resources, with the difference reported as
net position, some of which is restricted in accordance with bond covenants or other commitments. The statements
of revenues, expenses and changes in net position report all of Metropolitan’s revenues and expenses during the
periods indicated. The statements of cash flows show the amount of cash received and paid out for operating
activities, as well as cash received from taxes and investment income, and cash used for construction projects, State
Water Project costs and principal and interest payments on borrowed money. Certain amounts reported in fiscal
years 2015 and 2016 have been classified to conform to the fiscal year 2017 presentation. Such reclassification had no
effect on the previous reported change in net position.
During the fiscal year ended June 30, 2015, Metropolitan implemented Governmental Accounting Standards Board
Statement No. 68 (GASB 68), Accounting and Financial Reporting for Pensions - an amendment of GASB Statement No. 27,
which addresses the accounting and financial reporting for pensions. Metropolitan also implemented Governmental
Accounting Standards Board Statement No. 71 (GASB 71), Pension Transition for Contributions Made Subsequent to the
Measurement Date - an amendment of GASB Statement No. 68, which resolves transition issues in GASB 68. Metropolitan
did not restate the financial statements for the fiscal year ended June 30, 2014 because the necessary actuarial
information from the California Public Employees’ Retirement System was not provided for fiscal year 2014. As of
July 1, 2014, Metropolitan restated beginning net position in the amount of $491.0 million to record the beginning
deferred pension contributions and net pension liability.

T H E M E T R O P O L I T A N W A T E R D I S T R I C T O F S O U T H E R N C A L I F O R N I A
MANAGEMENT’S DISCUSSION AND ANALYSIS—UNAUDITED (CONTINUED)
June 30, 2017 and 2016
4
CONDENSED FINANCIAL INFORMATION
Condensed Schedule of Net Position
Capital Assets, Net
Net capital assets include plant, participation rights, and construction work in progress, net of accumulated
depreciation and amortization.
Fiscal Year 2017 Compared to 2016. At June 30, 2017, net capital assets totaled $10.5 billion, or 82.8 percent, of
total assets and deferred outflows of resources, and were $194.7 million higher than the prior year. The increase was
primarily due to a $174.1 million Board approved land purchase of the Delta Wetlands in July 2016. Additional
increases included Metropolitan’s continued expenditures on the capital investment plan of $268.5 million (including
$13.8 million of capitalized interest) and net capital payments for participation rights in the State Water Project and
other facilities of $134.3 million. The increase was offset by depreciation and amortization of $268.2 million and
$114.0 million retirement of capital assets and write-off of Mills Mods 1 and 2. See the capital assets section below
for additional information.
Fiscal Year 2016 Compared to 2015. At June 30, 2016, net capital assets totaled $10.3 billion, or 82.2 percent, of
total assets and deferred outflows of resources, and were $241.3 million higher than the prior year. The increase was
primarily due to a $256.4 million Board approved land purchase in the Palo Verde Irrigation District (PVID) in
July 2015. Additional increases included Metropolitan’s continued expenditures on the capital investment plan of
$254.5 million (including $24.7 million of capitalized interest) and net capital payments for participation rights in the
State Water Project and other facilities of $103.0 million. These increases were offset by depreciation and
amortization of $372.6 million. See the capital assets section below for additional information.
2017 2016 2015
(Dollars in millions) As Adjusted 1
Assets and deferred outflows of resourcesCapital assets, net 10,534.1$ 10,339.4$ 10,098.1$ Other assets 1,901.8 2,046.4 2,209.7 Deferred outflows of resources 224.5 191.5 178.3
Total assets and deferred outflows of resources 12,660.4 12,577.3 12,486.1
Liabilities and deferred inflows of resourcesLong-term liabilities, net of current portion 5,063.2 5,011.3 4,950.9 Other liabilities 817.6 842.1 544.3 Deferred inflows of resources 21.9 40.1 109.2
Total liabilities and deferred inflows of resources 5,902.7 5,893.5 5,604.4
Net positionNet investment in capital assets, including State Water Project costs 5,947.1 5,772.4 5,572.5 Restricted 406.8 382.8 442.0 Unrestricted 403.8 528.6 867.2 Total net position 6,757.7$ 6,683.8$ 6,881.7$ 1 Related to the adoption of GASB 68 and GASB 71.
June 30,

T H E M E T R O P O L I T A N W A T E R D I S T R I C T O F S O U T H E R N C A L I F O R N I A
MANAGEMENT’S DISCUSSION AND ANALYSIS—UNAUDITED (CONTINUED)
June 30, 2017 and 2016
5
Other Assets
Other assets include accounts receivable, inventories, prepaid costs, and cash and investments.
Fiscal Year 2017 Compared to 2016. At June 30, 2017, other assets totaled $1.9 billion and were $144.6 million
lower than the prior year. Included in the decrease were $120.5 million of lower cash and investments, $26.6 million
of lower water sales receivable as May and June 2017 sales were 78.0 thousand acre-feet (TAF) less than the prior
year’s comparable months, and $10.2 million of lower other receivables primarily due to the $13.9 million
postemployment benefits other than pensions (OPEB) reimbursement accrual in fiscal year 2016 was received prior
to June 30 in fiscal year 2017. These decreases were offset by $17.6 million more of water inventory due to an
increase in water storage of 279.9 TAF.
Fiscal Year 2016 Compared to 2015. At June 30, 2016, other assets totaled $2.0 billion and were $163.3 million
lower than the prior year. Included in the decrease were $129.2 million of lower cash and investments and
$45.7 million of lower deposits, prepaid costs, and other primarily due to $42.6 million of lower prepaid water costs
or 227.2 TAF. These decreases were offset by $22.8 million more of water inventory due to an increase in water
storage of 144.5 TAF.
Deferred Outflows of Resources
Deferred outflows of resources include deferred outflows related to loss on bond refundings and swap terminations,
deferred outflows related to the net pension liability, and deferred outflows for effective interest rate swaps.
Fiscal Year 2017 Compared to 2016. At June 30, 2017, deferred outflows totaled $224.5 million and were
$33.0 million higher than the prior year. The increase was primarily due to $82.0 million net difference in projected
and actual earnings related to the net pension liability. This increase was offset by $34.9 million lower deferred
outflows on effective swaps due to rising interest rates.
Fiscal Year 2016 Compared to 2015. At June 30, 2016, deferred outflows totaled $191.5 million and were
$13.2 million higher than the prior year. Included in the increase were $22.8 million more of deferred outflows on
effective swaps due to lower interest rates and $14.2 million higher deferred outflows related to the net pension
liability due to a $10.1 million difference between expected versus actual experience. These increases were offset by
$20.6 million less of deferred outflows related to loss on bond refundings due to $11.1 million of refunding
transactions and $9.5 million of scheduled amortization.
Long-term Liabilities, Net of Current Portion
Long-term liabilities, net of current portion include long-term debt, customer deposits and trust funds, net pension
liability, postemployment benefits other than pensions (OPEB), accrued compensated absences, obligations for off-
aqueduct facilities, workers’ compensation and third party claims, fair value of interest rate swaps, and other long-
term obligations.
Fiscal Year 2017 Compared to 2016. At June 30, 2017, long-term liabilities, net of current portion, totaled
$5.1 billion and were $51.9 million higher than the prior year. The increase included $108.1 million more of net
pension liability due to the decrease of actual pension plan investment earnings as compared to the prior year, offset
by $38.4 million of employer contributions. In addition, long-term debt, net of current portion was $25.7 million
T H E M E T R O P O L I T A N W A T E R D I S T R I C T O F S O U T H E R N C A L I F O R N I A
MANAGEMENT’S DISCUSSION AND ANALYSIS—UNAUDITED (CONTINUED)
June 30, 2017 and 2016
6
higher due to the issuance of $255.0 million revenue bonds offset by $147.3 million paydown of bond principal,
$21.8 million related to bond refundings, as the new debt issued was less than the amount of debt refunded,
$29.6 million of scheduled amortization of bond premiums and discounts and $30.6 million more current portion of
long-term debt than in prior year. See the other liabilities section below for more information. These increases were
offset by $43.1 million of lower customer deposits and trust funds, net of current portion primarily due to
$50.4 million termination of the San Luis Rey trust and $36.5 million of lower fair value of interest rate swaps due to
higher interest rates as compared to prior year. See the long-term debt section below for additional information.
Fiscal Year 2016 Compared to 2015. At June 30, 2016, long-term liabilities, net of current portion, totaled
$5.0 billion and were $60.4 million higher than the prior year. The increase included $72.8 million more of net
pension liability due to $82.3 million decrease of actual pension plan investment earnings as compared to the prior
year and $38.7 million of pension expense, offset by $34.3 million of employer contributions. In addition, fair value
of interest rate swaps increased $22.8 million due to lower interest rates as compared to the prior year. These
increases were offset by $39.8 million of lower long-term debt, net of current portion as $87.4 million of self-
liquidity bonds became current when the Revolving Credit Agreement (RCA) expired in March 2016. See the long-
term debt section below for additional information.
Other Liabilities
Other liabilities represent current liabilities that are due within one year. Current liabilities include accounts payable,
accrued liabilities, and the current portion of long-term liabilities.
Fiscal Year 2017 Compared to 2016. At June 30, 2017, other liabilities totaled $817.6 million, and were
$24.5 million lower than the prior year primarily due to $57.9 million of lower accounts payable and accrued
expenses, primarily due to $45.8 million of lower State Water Projects costs, which included $18.0 million of Flex
Storage pay down, $16.1 million of lower operating and maintenance costs resulting from the accrual of credit from
the State Water Project (SWP) in fiscal year 2017, and $14.3 million of lower variable costs due to a $9.0 million
credit for prior year adjustments. This decrease was offset by $30.6 million of higher current portion of long-term
debt as the required principal payments for some bond issues were higher than the prior year.
Fiscal Year 2016 Compared to 2015. At June 30, 2016, other liabilities totaled $842.1 million, and were
$297.8 million higher than the prior year primarily due to $250.0 million of revolving notes issued by Metropolitan
in fiscal year 2016. In addition, current portion of long-term debt increased $85.0 million as the RCA that covered
the $87.4 million 2013 Series D, Special Variable Rate Water Revenue Refunding Bonds expired in March 2016.
Offsetting these increases was $28.3 million lower accounts payable and accrued expenses, which included
$14.9 million less of various vendor costs and $14.9 million less of conservation credits due to lower participation in
the non-turf related conservation program.
Deferred Inflows of Resources
Deferred inflows of resources represent deferred inflows related to the net pension liability.
Fiscal Year 2017 Compared to 2016. At June 30, 2017, deferred inflows of resources totaled $21.9 million, and
were $18.2 million lower than the prior year. This decrease included $16.1 related to net difference between
projected and actual earnings and $10.9 million due to change in assumptions offset by $8.8 million higher
difference between actual and expected experience.

T H E M E T R O P O L I T A N W A T E R D I S T R I C T O F S O U T H E R N C A L I F O R N I A
MANAGEMENT’S DISCUSSION AND ANALYSIS—UNAUDITED (CONTINUED)
June 30, 2017 and 2016
7
Fiscal Year 2016 Compared to 2015. At June 30, 2016, deferred inflows of resources totaled $40.1 million, and
were $69.1 million lower than the prior year due to $93.2 million lower actual pension plan investment earnings as
compared to prior year partially offset by $24.1 million of deferred pension expenses due to change in assumptions.
Net Investment in Capital Assets, including State Water Project Costs
Net investment in capital assets, including State Water Project costs include amounts expended for capital
improvements and State Water Project, offset by debt issued for these purposes.
Fiscal Year 2017 Compared to 2016. At June 30, 2017, net investment in capital assets, including State Water
Project costs totaled $5.9 billion and was $174.7 million more than the prior year. This increase included
$194.7 million net increase in capital assets offset by $56.3 million net increase in outstanding debt. See discussions
of these items in the capital assets and long-term debt sections.
Fiscal Year 2016 Compared to 2015. At June 30, 2016, net investment in capital assets, including State Water
Project costs totaled $5.8 billion and was $199.9 million more than the prior year. This increase included
$241.3 million net increase in capital assets offset by $45.2 million increase in outstanding debt. See discussions of
these items in the capital assets and long-term debt sections.
Restricted Net Position
Restricted net position includes amounts restricted for debt service payments and operating expenses, both of which
are required by bond covenants.
Fiscal Year 2017 Compared to 2016. At June 30, 2017, restricted net position totaled $406.8 million which was
$24.0 million higher than fiscal year 2016 primarily due to $25.1 million of higher restricted for debt service.
Fiscal Year 2016 Compared to 2015. At June 30, 2016, restricted net position totaled $382.8 million which was
$59.2 million lower than fiscal year 2015 primarily due to $63.7 million of lower restricted for debt service.
Unrestricted Net Position Unrestricted net position consists of net position items that do not meet the definition of “restricted” or “net
investment in capital assets, including State Water Project costs.” Certain unrestricted net position items have been
designated for purposes authorized by the Board.
Fiscal Year 2017 Compared to 2016. Unrestricted net position of $403.8 million decreased $124.8 million from the
prior year, which included $174.7 million net investment in capital assets and $24.0 million of higher restricted net
position requirements for debt service and operating expenses partially offset by the fiscal year 2017 net income
before contributions of $73.9 million.
Fiscal Year 2016 Compared to 2015. Unrestricted net position of $528.6 million decreased $338.6 million from the
prior year, which included $199.9 million net investment in capital assets and the fiscal year 2016 net loss before
contributions of $200.0 million partially offset by $59.2 million of lower restricted net position requirements for
debt service and operating expenses.

T H E M E T R O P O L I T A N W A T E R D I S T R I C T O F S O U T H E R N C A L I F O R N I A
MANAGEMENT’S DISCUSSION AND ANALYSIS—UNAUDITED (CONTINUED)
June 30, 2017 and 2016
8
CHANGES IN NET POSITION
Condensed Schedule of Revenues, Expenses, and Changes in Net Position
2017 2016 2015
(Dollars in millions) As Adjusted 1
Water sales 1,150.5$ 1,166.0$ 1,382.9$
Readiness-to-serve charges 144.0 155.5 162.0
Capacity charge 39.7 44.7 37.5
Power sales 20.9 7.5 8.4
Operating revenues 1,355.1 1,373.7 1,590.8
Taxes, net 115.4 107.9 102.3
Investment income (loss) 6.2 19.4 (3.6)
Other 7.3 10.2 5.4
Nonoperating revenues 128.9 137.5 104.1
Total revenues 1,484.0 1,511.2 1,694.9
Power and water costs (455.4) (552.3) (473.6)
Operations and maintenance (487.5) (650.1) (543.4)
Depreciation and amortization (301.7) (376.5) (374.8)
Operating expenses (1,244.6) (1,578.9) (1,391.8)
Bond interest, net of amount capitalized (134.6) (126.9) (132.5)
Other (30.9) (5.4) (1.2)
Nonoperating expenses (165.5) (132.3) (133.7)
Total expenses (1,410.1) (1,711.2) (1,525.5)
Income (loss) before contributions 73.9 (200.0) 169.4
Capital contributions — 2.1 2.3
Changes in net position 73.9 (197.9) 171.7
Net Position
Beginning of year, as previously reported 6,683.8 6,881.7 7,201.0
Cumulative effect of change in accounting principle — — (491)
Beginning of year, as restated 6,683.8 6,881.7 6,710.0
Net position, end of year 6,757.7$ 6,683.8$ 6,881.7$
Fiscal Year Ended June 30,
1 Related to the adoption of GASB 68 and GASB 71.

T H E M E T R O P O L I T A N W A T E R D I S T R I C T O F S O U T H E R N C A L I F O R N I A
MANAGEMENT’S DISCUSSION AND ANALYSIS—UNAUDITED (CONTINUED)
June 30, 2017 and 2016
9
Operating Revenues
Metropolitan’s principal source of revenue is from water sales, which typically account for approximately 85 percent
of operating revenues. Metropolitan’s primary sources of water supply are the Colorado River and the State Water
Project.
Analytical Review of Operating Revenues
Fiscal Year 2017 Compared to 2016. Fiscal year 2017 operating revenues were $1.4 billion or $18.6 million less than the
prior year. The decrease included $15.5 million of lower water sales, of which $60.3 million related to 84.0 TAF of
lower volumes sold offset by $44.8 million from higher rates and $11.5 million of lower readiness-to-serve charges
as the Board approved amount was lower in fiscal year 2017 as compared to prior year. These decreases were offset
by $13.4 million more of power recoveries revenue due to higher SWP allocation resulting in higher power
generation.
Fiscal Year 2016 Compared to 2015. Fiscal year 2016 operating revenues were $1.4 billion or $217.1 million less than
the prior year primarily due to $216.9 million of lower water sales, of which $249.2 million related to 310.7 TAF of
lower volumes sold offset by $32.3 million from higher rates. The reduction in water sales was primarily due to the
Governor’s requirement that retail water agencies implement conservation programs to reduce water consumption
by an average of 25 percent statewide.

T H E M E T R O P O L I T A N W A T E R D I S T R I C T O F S O U T H E R N C A L I F O R N I A
MANAGEMENT’S DISCUSSION AND ANALYSIS—UNAUDITED (CONTINUED)
June 30, 2017 and 2016
10
Nonoperating Revenues
The primary source of nonoperating revenues is property taxes.
Analytical Review of Nonoperating Revenues
Fiscal Year 2017 Compared to 2016. Nonoperating revenues for fiscal year 2017 totaled $128.9 million and were
$8.6 million lower than the prior year. Investment income was $13.2 million lower primarily due to $13.0 million
unfavorable change in fair value. This decrease was offset by $7.5 million of higher property tax revenue due to
lower delinquencies and higher assessments resulting from increased property values.
Fiscal Year 2016 Compared to 2015. Nonoperating revenues for fiscal year 2016 totaled $137.5 million and were
$33.4 million higher than the prior year. Included in the increase was $23.0 million of higher investment income
primarily due to an $18.7 million loss on swap termination that did not occur in the current year. In addition,
property tax revenue increased $5.6 million from the collection of delinquent taxes and other, net was $4.8 million
more primarily due to $2.5 million of higher property rental revenue.

T H E M E T R O P O L I T A N W A T E R D I S T R I C T O F S O U T H E R N C A L I F O R N I A
MANAGEMENT’S DISCUSSION AND ANALYSIS—UNAUDITED (CONTINUED)
June 30, 2017 and 2016
11
Operating Expenses
Operating expenses fall into three primary cost areas: power and water, operations and maintenance, and
depreciation and amortization.
Analytical Review of Operating Expenses
Fiscal Year 2017 Compared to 2016. Fiscal year 2017 operating expenses of $1.2 billion were $334.3 million lower than
prior year. The decrease included $162.6 million of lower operations and maintenance costs primarily due to
$175.8 million lower conservation credits expenses as the $450.0 million budget approved in fiscal year 2015 is spent
down, $96.9 million less of power and water costs due to the $44.4 million purchase of water from Southern Nevada
Water Authority, which had a higher per acre-foot cost, did not occur in the current year and Metropolitan received
$37.0 million of credit related to the SWP in fiscal year 2017. In addition, depreciation and amortization decreased
$74.8 million due to the fact that the catch-up depreciation in fiscal year 2016 did not occur in the current year.
Fiscal Year 2016 Compared to 2015. Fiscal year 2016 operating expenses of $1.6 billion were $187.1 million higher
than prior year. The increase included $106.7 million of higher operations and maintenance costs primarily due to
$84.8 million higher conservation credits expenses as a result of the Board approving a historic $450.0 million
budget in fiscal year 2015 for conservation spending in response to the continued drought. In addition, power and
water costs increased $78.7 million primarily due to $48.0 million higher State Water Project operation, maintenance,
power and replacement (OMP&R) costs related to the Fish Restoration Program Agreement, biological opinions,
and increased labor costs.

T H E M E T R O P O L I T A N W A T E R D I S T R I C T O F S O U T H E R N C A L I F O R N I A
MANAGEMENT’S DISCUSSION AND ANALYSIS—UNAUDITED (CONTINUED)
June 30, 2017 and 2016
12
Nonoperating Expenses
The primary source of nonoperating expenses is interest expense on bonds and other, net.
Analytical Review of Nonoperating Expenses
Fiscal Year 2017 Compared to 2016. Fiscal year 2017 nonoperating expenses of $165.5 million were $33.2 million
higher than the prior year. The increase was primarily due to $25.5 million more of other expenses of which,
$20.4 million related to the write-off of construction in progress programs upon determination by the Engineering
Services Group that no operational asset would result from the costs incurred. In addition, bond interest, net of
amount capitalized increased $7.7 million due to a $10.9 million decrease in capitalized interest on assets
constructed.
Fiscal Year 2016 Compared to 2015. Fiscal year 2016 nonoperating expenses of $132.3 million were $1.4 million lower
than the prior year primarily due to lower interest expense on bonds as a result of bond refunding transactions to
take advantage of lower interest rates.

T H E M E T R O P O L I T A N W A T E R D I S T R I C T O F S O U T H E R N C A L I F O R N I A
MANAGEMENT’S DISCUSSION AND ANALYSIS—UNAUDITED (CONTINUED)
June 30, 2017 and 2016
13
CAPITAL ASSETS
Capital assets include Metropolitan’s water infrastructure, land and buildings, as well as participation rights in State
Water Project and various other water programs. More detailed information on capital assets and commitments for
construction contracts are presented in Note 2 and Note 9 (g) to the basic financial statements, respectively.
Schedule of Capital Assets
(Dollars in millions) 2017 2016 2015
Land, easements and rights-of-way 1,009.9$ 833.7$ 557.6$
Construction in progress 1,018.8 870.8 1,644.9
Parker power plant and dam 13.0 13.0 13.0
Power recovery plants 196.9 180.3 178.7
Other dams and reservoirs 1,549.8 1,542.2 1,541.7
Water transportation facilities 3,744.1 3,708.9 3,504.0
Pumping plants and facilities 294.3 293.5 240.7
Treatment plants and facilities 2,796.5 2,867.9 2,138.6
Buildings 138.9 136.1 136.1
Other plant assets 713.8 701.0 681.2
Pre-operating expenses original aqueduct 44.6 44.6 44.6
Participation rights in State Water Project 5,034.4 4,900.1 4,794.9
Participation rights in other facilities 459.7 459.7 461.9
Gross capital assets 17,014.7 16,551.8 15,937.9
Less accumulated depreciation and amortization (6,480.6) (6,212.4) (5,839.8)
Capital assets, net 10,534.1$ 10,339.4$ 10,098.1$
Net increase from prior year 194.7$ 241.3$ (6.5)$
Percent change 1.9% 2.4% (0.1%)
June 30,

T H E M E T R O P O L I T A N W A T E R D I S T R I C T O F S O U T H E R N C A L I F O R N I A
MANAGEMENT’S DISCUSSION AND ANALYSIS—UNAUDITED (CONTINUED)
June 30, 2017 and 2016
14
Fiscal Year 2017 Compared to 2016. Net capital assets totaled approximately $10.5 billion and increased $194.7 million
over the prior year. This increase included $174.1 million Delta Wetlands purchase, $268.5 million of new
construction activity, and a net increase of $134.3 million in participation rights in State Water Project and other
facilities. The increase was offset by depreciation and amortization of $268.2 million and $114.0 million retirement
of capital assets and write-off of Mills Mods 1 and 2.
The major capital asset additions for the current year, excluding capitalized interest, included:
• $58.7 million for the improvements in infrastructure reliability at the treatment plants.
• $45.9 million for the distribution system’s rehabilitation program.
• $26.8 million for the supply reliability and system expansion program; this program is designed to improve the
reliability and flexibility of delivering Colorado River water during drought or other State Water Project delivery
constraints.
• $22.7 million for the oxidation retrofit program at the filtration plants; this program is designed to reduce the
level of disinfection byproducts in the treated water supplied by these plants in order to meet state and federal
standards.
• $8.6 million for the pre-stressed concrete cylinder pipe reliability (PCCP) program; this program identifies
pipelines whose age, location and condition warrant refurbishment/replacement to ensure long-term reliability of
Metropolitan’s PCCP lines water delivery.
• $8.0 million for the information technology program, which is designed to ensure the reliability and efficiency of
the information technology infrastructure in support of Metropolitan’s operational and business applications.
Metropolitan’s fiscal year 2018 capital budget includes plans to spend $240.0 million principally for the water
treatment plants improvements program, the distribution system and rehabilitation projects, the Colorado River
Aqueduct reliability and containment programs, the water quality/oxidation retrofit program, and the supply
reliability and system expansion program.
Fiscal Year 2016 Compared to 2015. Net capital assets totaled approximately $10.3 billion and increased $241.3 million
over the prior year. This increase included $256.4 million PVID land purchase, $254.5 million of new construction
activity, and a net increase of $103.0 million in participation rights in State Water Project and other facilities. The
increase was offset by depreciation and amortization of $372.6 million.
The major capital asset additions for the current year, excluding capitalized interest, included:
• $61.5 million for the improvements in infrastructure reliability at the treatment plants.
• $31.7 million for the oxidation retrofit program at the filtration plants.
• $24.5 million for the supply reliability and system expansion program.
• $23.4 million for the distribution system’s rehabilitation program.
• $18.2 million for chlorine containment and handling facilities program, program which is designed to enhance
hazardous chemical safety, prevent a chlorine chemical release, and comply with security and safety regulations.
• $17.7 million for the information technology program.
• $15.5 million for the PCCP program.

T H E M E T R O P O L I T A N W A T E R D I S T R I C T O F S O U T H E R N C A L I F O R N I A
MANAGEMENT’S DISCUSSION AND ANALYSIS—UNAUDITED (CONTINUED)
June 30, 2017 and 2016
15
DEBT ADMINISTRATION – LONG-TERM DEBT
Schedule of Long-term Debt, Including Current Portion
Fiscal Year 2017 Compared to 2016. At June 30, 2017, there was $4.6 billion of outstanding bonds and other long-term
obligations, a net increase of $56.3 million or 1.2 percent from the prior year. The increase was due to the issuance
of $255.0 million in revenue bonds. This increase was offset by $147.3 million of scheduled principal payments,
$21.8 million related to bond refundings, as the new debt issued was less than the amount of debt refunded, and
$29.6 million of scheduled amortization of bond premiums and discounts.
Fiscal Year 2016 Compared to 2015. At June 30, 2016, there was $4.5 billion of outstanding bonds and other long-term
obligations, a net increase of $45.2 million or 1.0 percent from the prior year. The increase included the issuance of
$208.3 million in revenue bonds and $75.2 million of related bond premiums offset by $144.0 million of scheduled
principal payments, $49.9 million principal reduction related to refunding transactions, and $42.8 million of
scheduled amortization of bond premiums and discounts.
Additional information on Metropolitan’s long-term debt can be found in Note 5 to the basic financial statements.
CREDIT RATINGS
Metropolitan’s credit ratings at June 30, 2017, are shown below.
June 30,
(Dollars in millions) 2017 2016 2015
General obligation bonds (a) 74.9$ 92.9$ 110.4$
Revenue bonds (a) 4,302.0 4,188.9 4,157.1
State revolving loan — 9.1 10.7
Other, net (b) 202.8 232.5 200.0
4,579.7$ 4,523.4$ 4,478.2$
Increase (decrease) from prior year 56.3$ 45.2$ (138.2)$
Percent change 1.2% 1.0% (3.0%)
(a) Includes refunding bonds.
(b) Consists of unamortized bond discounts and premiums.
Moody's Standard
Investors & Poor's Fitch
Service Global Ratings
General obligation bonds Aaa AAA AAA
Water revenue bonds-fixed rate Aa1 AAA AA+
Water revenue bonds-variable rate VMIG 1 A-1+ F1+
Subordinate water revenue bonds-fixed rate N/A AA+ AA+
Subordinate water revenue bonds-variable rate N/A A-1+ F1+

T H E M E T R O P O L I T A N W A T E R D I S T R I C T O F S O U T H E R N C A L I F O R N I A
16
S T A T E M E N T S O F N E T P O S I T I O N
(Dollars in thousands) 2017 2016
ASSETS AND DEFERRED OUTFLOWS OF RESOURCESCurrent Assets:
Cash and investments, at fair value (Notes 1b and 3):Unrestricted (cost: $613,633 and $734,735 for
2017 and 2016, respectively) $ 613,937 $ 737,877 Restricted (cost: $437,092 and $399,088 for
2017 and 2016, respectively) 437,309 400,795
Total cash and investments 1,051,246 1,138,672
Receivables:Water sales 197,928 224,571 Interest on investments 3,675 4,481 Other, net (Note 1e) 20,020 30,256
Total receivables 221,623 259,308
Inventories (Note 1f) 110,533 92,545 Deposits, prepaid costs, and other (Note 11) 2,606 1,726
Total current assets 1,386,008 1,492,251
Noncurrent Assets:Cash and investments, at fair value (Notes 1b and 3):
Unrestricted (cost: $230,081 and $211,088 for2017 and 2016, respectively) 230,195 211,991
Restricted (cost: $90,545 and $138,338 for2017 and 2016, respectively) 94,014 145,262
Total cash and investments 324,209 357,253
Capital assets (Note 2):Plant and equipment - non depreciable (Notes 1g and 9g) 2,028,721 1,704,537 Plant and equipment - depreciable (Notes 1g and 9g) 9,491,865 9,487,454 Participation rights in State Water Project (Notes 1h and 10) 5,034,375 4,900,137 Participation rights in other facilities (Notes 1h and 4) 459,709 459,709
Total capital assets 17,014,670 16,551,837 Less accumulated depreciation and amortization (6,480,571) (6,212,401)
Total capital assets, net 10,534,099 10,339,436
Other assets, net of current portion:Deposits, prepaid costs, and other (Note 11) 191,525 196,927
Total other assets 191,525 196,927
Total noncurrent assets 11,049,833 10,893,616
Deferred Outflows of Resources:Loss on bond refundings (Note 1p) 59,929 69,090 Loss on swap terminations (Note 1p) 30,665 35,422 Pension related (Notes 1q and 7) 130,346 48,475 Effective swaps (Note 1p) 3,588 38,480
Total deferred outflows of resources 224,528 191,467 Total Assets and Deferred Outflows of Resources $ 12,660,369 $ 12,577,334
See accompanying notes to basic financial statements.
June 30,

T H E M E T R O P O L I T A N W A T E R D I S T R I C T O F S O U T H E R N C A L I F O R N I A
17
S T A T E M E N T S O F N E T P O S I T I O N
(Dollars in thousands) 2017 2016
Current Liabilities:Accounts payable and accrued expenses (Note 1i) $ 99,318 $ 157,237 Revolving notes (Note 5a) 262,250 250,000 Current portion of long-term debt (Notes 5 and 6) 343,681 313,093 Current portion of obligations for off-aqueduct
power facilities (Notes 6 and 9f) 1,203 3,265 Current portion of accrued compensated
absences (Notes 1j and 6) 19,800 19,600 Current portion of customer deposits and trust funds (Note 6) 5,455 10,387 Current portion of workers' compensation and third
party claims (Notes 6 and 14) 5,109 9,500 Current portion of other long-term liabilities (Note 6) 2,907 1,880 Accrued bond interest 76,086 75,363 Matured bonds and coupons not presented for payment 1,768 1,835
Total current liabilities 817,577 842,160
Noncurrent Liabilities (Note 6):
Long-term debt, net of current portion (Note 5) 4,236,057 4,210,342
Obligations for off-aqueduct power facilities,
net of current portion (Note 9f) 9,629 11,079
Accrued compensated absences, net of current portion (Note 1j) 26,523 27,297
Customer deposits and trust funds, net of current portion 40,302 83,371 Net pension liability (Note 7) 587,662 479,555
Postemployment benefits other than pensions (Note 8) 83,396 83,544
Workers' compensation and third party claims,
net of current portion (Note 14) 10,568 10,547
Fair value of interest rate swaps (Note 5f) 66,848 103,307
Other long-term liabilities, net of current portion 2,226 2,229
Total noncurrent liabilities 5,063,211 5,011,271
Total liabilities 5,880,788 5,853,431
Commitments and Contingencies (Note 9) — —
Deferred Inflows of Resources:
Pension related (Notes 1q and 7) 21,896 40,121
Net Position (Note 13):Net investment in capital assets, including State Water Project costs 5,947,122 5,772,364 Restricted for:
Debt service 224,625 199,476 Other 182,177 183,340
Unrestricted 403,761 528,602
Total net position 6,757,685 6,683,782
Total Liabilities, Deferred Inflows of Resources, and Net Position $ 12,660,369 $ 12,577,334
June 30,
LIABILITIES, DEFERRED INFLOWS OF RESOURCES, AND NET POSITION

T H E M E T R O P O L I T A N W A T E R D I S T R I C T O F S O U T H E R N C A L I F O R N I A
18
This page intentionally left blank.
T H E M E T R O P O L I T A N W A T E R D I S T R I C T O F S O U T H E R N C A L I F O R N I A
19
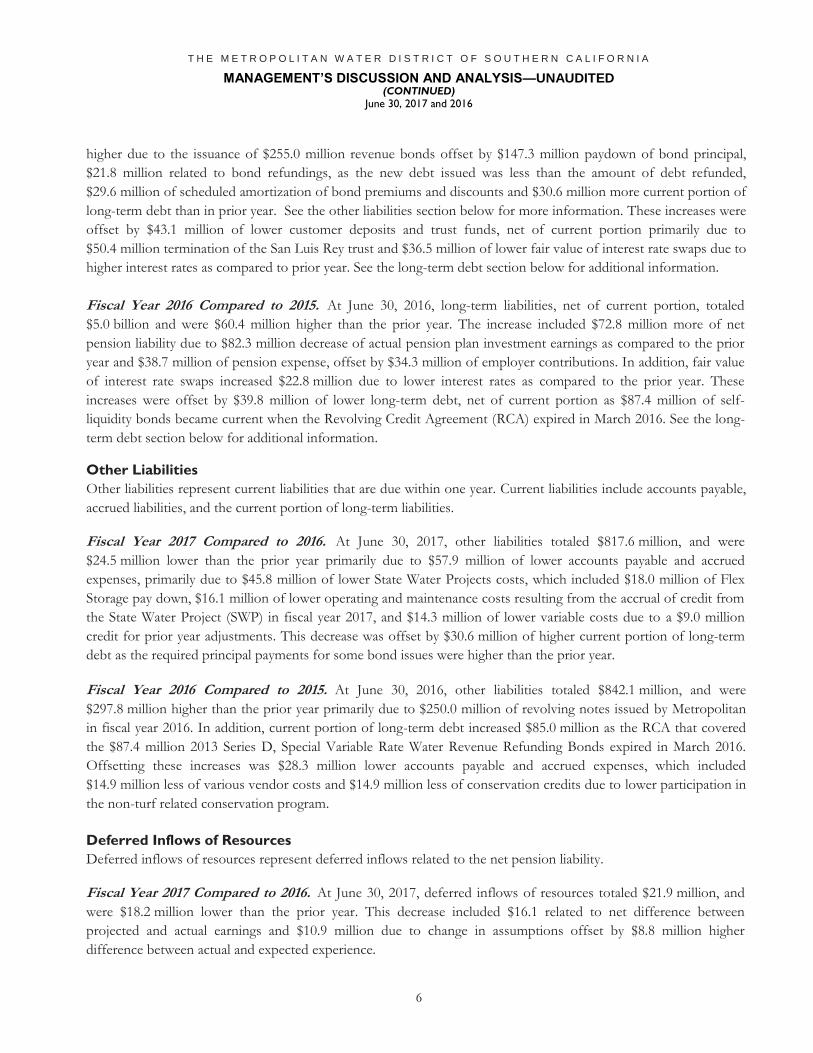
S T A T E M E N T S O F R E V E N U E S , E X P E N S E S
A N D C H A N G E S I N N E T P O S I T I O N
(Dollars in thousands) 2017 2016
Operating Revenues (Note 1c):
Water sales $ 1,150,533 $ 1,166,040
Readiness-to-serve charges 144,000 155,493
Capacity charge 39,717 44,705
Power sales 20,835 7,477
Total operating revenues 1,355,085 1,373,715
Operating Expenses:
Power and water costs 455,444 552,306
Operations and maintenance 487,538 650,127
Total operating expenses 942,982 1,202,433
Operating income before depreciation and amortization 412,103 171,282
Less depreciation and amortization (Note 2) (301,741) (376,522)
Operating income (loss) 110,362 (205,240)
Nonoperating Revenues (Expenses) (Note 1m):
Taxes, net (Note 1d) 115,417 107,922
Bond interest, net of $13,800 and $24,700 of interest
capitalized in fiscal years 2017 and 2016, respectively (Note 1g) (134,594) (126,945)
Investment income (loss), net 6,182 19,384
Other, net (23,464) 4,863
Total nonoperating revenues (expenses), net (36,459) 5,224
Income (Loss) Before Contributions 73,903 (200,016)
Capital contributions (Note 1l) — 2,178
Changes in net position 73,903 (197,838)
Net position, beginning of year 6,683,782 6,881,620
Net position, End of Year $ 6,757,685 $ 6,683,782
Fiscal Year Ended June 30,

T H E M E T R O P O L I T A N W A T E R D I S T R I C T O F S O U T H E R N C A L I F O R N I A
20
S T A T E M E N T S O F C A S H F L O W S
(Dollars in thousands) 2017 2016
Cash Flows from Operating Activities:
Cash received from water sales $ 1,082,747 $ 1,087,566
Cash received from readiness-to-serve charges 145,614 155,283
Cash received from capacity charge 40,562 44,662
Cash received from power sales 17,193 7,413
Cash received from other exchange transactions 93,583 77,323
Cash paid for operations and maintenance expenses (279,909) (446,871)
Cash paid to employees for services (198,979) (185,137)
Cash paid for power and water costs (513,992) (517,080)
Other cash flows for operating activities (1,640) (4,853)
Net cash provided by operating activities 385,179 218,306
Cash Flows from Noncapital Financing Activities:
Proceeds from other collections 7,923 8,880
Net cash provided by noncapital financing activities 7,923 8,880
Cash Flows from Capital and Related Financing Activities:
Acquisition and construction of capital assets (390,447) (551,436)
Payments for State Water Project costs (131,641) (108,637)
Proceeds from short and long-term debt 301,203 500,009
Payments for bond issuance costs (2,996) (1,762)
Principal paid on long-term debt (192,515) (144,025)
Interest paid on long-term debt (172,403) (174,801)
Payments for other long-term obligations (5,396) (5,486)
Proceeds from tax levy 115,137 110,654
Transfer to/from escrow trust accounts (39,908) 909
Payments for real estate sales (98) —
Collection of notes receivable - land sales — 139
Net cash used by capital and related financing activities (519,064) (374,436)
Cash Flows from Investing Activities:
Purchase of investment securities (10,621,702) (13,178,652)
Proceeds from sales and maturities of investment securities 10,733,292 13,303,690
Investment income 15,235 16,079
Net cash provided by investing activities 126,825 141,117
Net change in cash 863 (6,133)
Cash at July 1, 2016 and 2015 39 6,172
Cash at June 30, 2017 and 2016 (Note 1b) $ 902 $ 39
See accompanying notes to basic financial statements.
June 30,

T H E M E T R O P O L I T A N W A T E R D I S T R I C T O F S O U T H E R N C A L I F O R N I A
21
S T A T E M E N T S O F C A S H F L O W S
(Dollars in thousands) 2017 2016
RECONCILIATION OF OPERATING INCOME (LOSS) TO
NET CASH PROVIDED BY OPERATING ACTIVITIES
Operating Income (Loss) $ 110,362 $ (205,240)
Adjustments to Reconcile Operating Income to Net Cash
Provided by Operating Activities:
Depreciation and amortization expense 301,741 376,522
Decrease in accounts receivable 38,693 9,578
Increase in inventories (17,987) (23,502)
Decrease in deposits, prepaid costs, and other 3,833 37,668
Decrease in accounts payable and accrued expenses (33,834) (36,151)
(Decrease) Increase in other items (17,629) 59,431
Total Adjustments 274,817 423,546
Net cash provided by operating activities $ 385,179 $ 218,306
Significant Noncash Investing, Capital and Financing Activities
Refunding bonds proceeds received in escrow trust fund $ 366,116 $ 489,219
Debt defeased through escrow trust fund with refunding debt $ (309,095) $ (460,375)
RECONCILIATION OF CASH AND INVESTMENTS
TO CASH
Unrestricted cash and investments (at June 30, 2017 and 2016
include $902 and $39 of cash, respectively) $ 844,132 $ 949,868
Restricted cash and investments 531,323 546,057
Total cash and investments, at fair value 1,375,455 1,495,925
Less: carrying value of investments (1,374,553) (1,495,886)
Total Cash (Note 1b) $ 902 $ 39
June 30,

T H E M E T R O P O L I T A N W A T E R D I S T R I C T O F S O U T H E R N C A L I F O R N I A
22
This page intentionally left blank.

T H E M E T R O P O L I T A N W A T E R D I S T R I C T O F S O U T H E R N C A L I F O R N I A
NOTES TO BASIC FINANCIAL STATEMENTS June 30, 2017 and 2016
23
1. REPORTING ENTITY AND SUMMARY OF SIGNIFICANT ACCOUNTING POLICIES
(a) Reporting Entity
The Metropolitan Water District of Southern California (Metropolitan), a special district of the State of California,
was organized in 1928 by vote of the electorates of several Southern California cities following adoption of the
Metropolitan Water District Act (Act) by the California Legislature. Metropolitan’s primary purposes under the Act
are to develop, store and distribute water, at wholesale, to its member public agencies for domestic and municipal
purposes. Surplus water is sold for other beneficial uses, including agricultural use. Metropolitan’s service area
comprises approximately 5,200 square miles and includes portions of the six counties of Los Angeles, Orange,
Riverside, San Bernardino, San Diego, and Ventura. There are 26 independent member agencies of Metropolitan,
consisting of 14 cities, 11 municipal water districts, and one county water authority. Metropolitan has no financial
accountability for its member agencies. Metropolitan is governed by a 38-member Board of Directors (Board)
comprised of representatives of the member agencies. Representation and voting rights are based on assessed
valuations of property. Each member agency is entitled to have at least one representative on the Board plus an
additional representative for each full five percent of the assessed valuation of real property within the jurisdictional
boundary of each member agency. Changes in relative assessed valuation do not terminate any director’s term.
Accordingly, the Board may, from time to time, have more than 38 directors. No single member agency has a
voting majority.
The Metropolitan Water District Asset Financing Corporation (MWDAFC) was incorporated on June 19, 1996.
The MWDAFC is a California nonprofit public benefit corporation formed to assist Metropolitan by acquiring,
constructing, operating and maintaining facilities, equipment, or other property needed by Metropolitan and leasing
or selling such property to Metropolitan. The MWDAFC is governed by a board of five directors, each of whom
must be a member of Metropolitan’s Board. MWDAFC had no financial operations during fiscal years 2017 or
2016. MWDAFC is a component unit of Metropolitan and its activities will be blended with those of Metropolitan
for financial reporting purposes should it commence operations.
(b) Principles of Presentation
Metropolitan operates as a utility enterprise and the accompanying basic financial statements reflect the flow of
economic resources measurement focus and the full accrual basis of accounting. Under full accrual accounting,
revenues are recorded when earned and expenses are recorded at the time liabilities are incurred regardless of the
timing of related cash flows.
Metropolitan is accounted for as an enterprise fund and applies all applicable Governmental Accounting Standards
Board (GASB) pronouncements in its accounting and reporting.
For purposes of the statements of cash flows, Metropolitan defines cash as demand account balances and cash on
hand.
Certain amounts reported in fiscal year 2016 have been reclassified to conform to the fiscal year 2017 presentation.
Such reclassification had no effect on Metropolitan’s net position or change in net position.

T H E M E T R O P O L I T A N W A T E R D I S T R I C T O F S O U T H E R N C A L I F O R N I A
NOTES TO BASIC FINANCIAL STATEMENTS (CONTINUED)
June 30, 2017 and 2016
24
(c) Revenue Policies
Metropolitan’s principal source of revenue is from water sales, which include revenues received from charges for
the sale and availability of water, including water rates and other exchange transactions. Other sources of operating
revenue include readiness-to-serve charges, capacity charge, and hydroelectric power sales. Other revenues include
ad valorem property taxes and investment income.
Water rates are established by the Board on a biennial basis. Water rates are supported by cost of service studies.
Water rates are not subject to regulation by the California Public Utilities Commission or by any other local, state,
or federal agency. Water is delivered to the member agencies on demand and revenue is recognized at the time of
sale.
Metropolitan's rate structure includes separate rates for supply, treatment, conveyance and distribution, power, and
demand management. It is designed to improve regional water resources management and accommodate a water
transfer market. The rate structure also includes tiered pricing for supply, a capacity charge, and a readiness-to-serve
charge.
(d) Taxing Authority
Metropolitan is expressly empowered under the Act to levy and collect taxes on all taxable property within its
boundaries for the purpose of carrying on its operations and paying its obligations, subject to certain limitations in
the Act, the California Revenue and Taxation Code, and the California Constitution. Property taxes are levied
annually by the Board as of July 1, using a lien date of January 1, and are payable by property owners in two equal
installments that are due on November 1 and February 1, and become delinquent after December 10 and April 10,
respectively. Property taxes levied by Metropolitan are billed and collected by the counties in its service area and are
remitted to Metropolitan periodically throughout the year.
Property tax revenue is used to pay Metropolitan’s general obligation bond debt service and a portion of its
obligations under its contract with the state for a water supply (the State Water Contract). In setting the annual levy,
Metropolitan takes into account potential delinquencies, tax allocations to the successor agencies of former
redevelopment agencies, and supplemental tax collections. Metropolitan recognizes property taxes receivable on
July 1 of each fiscal year and recognizes revenue over the following 12-month period beginning July 1 through
June 30 (the period for which the tax is levied).
As a result of legislation enacted in 1984, tax levies in fiscal years 1991 to 2013, other than annexation taxes, were
limited to the amount needed to pay debt service on Metropolitan’s general obligation bonds and Metropolitan’s
proportionate share of general obligation bond debt service of the state under the State Water Contract. However,
under the terms of the 1984 legislation, the Board may suspend this particular restriction upon a finding that doing
so is essential to Metropolitan's fiscal integrity. During fiscal years 2017 and 2016, the Board suspended the tax rate
limitations and maintained the fiscal year 2013 tax rate for fiscal years 2017 and 2016 to pay a portion of State Water
Contract costs other than debt service.
(e) Other Receivables
Other receivables include amounts for taxes, hydroelectric power sales, readiness-to-serve charges, and other
billings.

T H E M E T R O P O L I T A N W A T E R D I S T R I C T O F S O U T H E R N C A L I F O R N I A
NOTES TO BASIC FINANCIAL STATEMENTS (CONTINUED)
June 30, 2017 and 2016
25
(f) Inventories
Metropolitan’s inventories are valued based on a moving-average cost. Expenses are recorded when inventories are
used. Components of inventories at June 30, 2017 and 2016 were as follows:
(g) Plant and Equipment
Metropolitan’s capital assets include plant and equipment, which are recorded at cost. Construction costs are
capitalized if they exceed $50,000 and the asset has a useful life of at least five years. The cost of constructed assets
may include labor, materials, certain general and administrative expenses, and interest incurred during construction
periods. Depreciation is calculated using the straight-line method based on the estimated average useful lives of the
assets, which are 10 to 80 years for buildings, storage, and distribution facilities, 10 to 50 years for treatment plants
and hydroelectric power recovery facilities, and 10 to 80 years for miscellaneous assets. Improvements or
refurbishments with aggregated costs that meet capitalization thresholds and that extend the useful life of an
existing asset by at least five years are capitalized.
Major computer systems software, whether purchased or internally developed, is capitalized if the cost exceeds
$250,000 and the useful life is at least three years. Vehicles and operating equipment are capitalized if the cost equals
or exceeds $5,000 and the useful life is at least four years. Depreciation is calculated using the straight-line method
based on the estimated useful lives and ranges from 3 to 10 years for major computer systems software and 4 to
10 years for vehicles and operating equipment.
(h) Participation Rights
Metropolitan participates in various storage and water management programs entitling it to certain water rights.
Projects include the State Water Project (SWP) and various storage and water management programs.
Metropolitan's participation in these projects is through cash payments. The value of participation rights is equal to
the amounts spent for the construction of capital assets, such as pipelines, pumping facilities, and storage facilities,
and amortized over the life of the agreements. These assets are not owned by Metropolitan. Certain projects also
require payments for ongoing maintenance; those payments are charged to expense as incurred. (See Notes 2, 4, and
10.)
June 30,
(Dollars in thousands) 2017 2016
Water in storage $ 99,152 $ 81,593
Operating supplies 11,381 10,952
Total inventories $ 110,533 $ 92,545

T H E M E T R O P O L I T A N W A T E R D I S T R I C T O F S O U T H E R N C A L I F O R N I A
NOTES TO BASIC FINANCIAL STATEMENTS (CONTINUED)
June 30, 2017 and 2016
26
(i) Disaggregation of Payable Balances
Accounts payable and accrued expenses at June 30, 2017 and 2016 were as follows:
(j) Compensated Absences
Metropolitan’s employees earn vacation, sick, and compensatory leave in varying amounts depending primarily on
length of service. Upon termination from Metropolitan service, employees are entitled to full payment for accrued
vacation and compensatory leave at their final pay rates, and are entitled to payment for approximately one-half of
their accrued sick leave at such rates. Metropolitan records its obligations for vacation, sick, and compensatory leave
earned by eligible employees based on current pay rates. The allocations to the current and long-term portions of
these vested obligations were based on experience and projections of turnover.
(k) Pension Accounting
For purposes of measuring the net pension liability, deferred outflows of resources and deferred inflows of
resources related to pensions, and pension expense, information about the fiduciary net position of the Plan and
additions to/deductions from the Plan’s fiduciary net position have been determined on the same basis as they are
reported by the California Public Employees’ Retirement System (CalPERS) Financial Office. For this purpose,
benefit payments (including refunds of employee contributions) are recognized when currently due and payable in
accordance with the benefit terms. Investments are reported at fair value.
(l) Capital Contributions
Capital contributions are comprised of federal, state, and private grants. These grants are typically of a reimbursable
nature: Metropolitan first pays for the project and then the granting agency reimburses Metropolitan for its eligible
expenses. The portion of the grants restricted for capital purposes are reflected as capital contributions in the
statements of revenues, expenses and changes in net position when they are earned, irrespective of the timing of the
receipts. Examples of capital projects where grants are received include water treatment plant improvements, such
as fluoridation, and water storage programs.
(m) Operating and Nonoperating Revenues and Expenses
Metropolitan’s primary purpose is to provide a supplemental supply of water for domestic and municipal uses.
Accordingly, Metropolitan defines operating revenues as water sales, readiness-to-serve charges, capacity charge,
and hydroelectric power sales. Operating expenses include the cost of sales and services, administrative expenses,
and depreciation and amortization of capital assets.
Revenues from property taxes and investment income, as well as interest expense on outstanding debt, are related
to capital and financing activities and are defined as nonoperating revenues and expenses.
June 30,
(Dollars in thousands) 2017 2016
Department of Water Resources (State Water Project):
Capital, operating, maintenance, power, replacement,
and variable power $ 55,852 $ 101,665
Vendors 26,617 38,524
Accrued power costs 1,277 2,160 Accrued salaries 8,358 7,232
Readiness-to-serve overcollection 1,291 1,182
Conservation credits 5,923 6,474
Total accounts payable and accrued expenses $ 99,318 $ 157,237

T H E M E T R O P O L I T A N W A T E R D I S T R I C T O F S O U T H E R N C A L I F O R N I A
NOTES TO BASIC FINANCIAL STATEMENTS (CONTINUED)
June 30, 2017 and 2016
27
(n) Restricted and Unrestricted Resources
When both restricted and unrestricted resources are available for use, it is Metropolitan’s practice to use restricted
resources first, then unrestricted resources as they are needed.
(o) Use of Estimates
The preparation of basic financial statements in conformity with U.S. generally accepted accounting principles
requires management to make estimates and assumptions that affect the reported amounts of assets and liabilities
and disclosures of contingent assets and liabilities at the date of the basic financial statements and reported amounts
of revenues and expenses during the reporting period. Actual results could differ from those estimates.
(p) Deferred Outflows/Inflows of Resources
GASB Statement No. 63, Financial Reporting of Deferred Outflows of Resources, Deferred Inflows of Resources and Net Position
(GASB 63) requires that the difference between assets, deferred outflows of resources, liabilities, and deferred
inflows of resources be reported as net position. In addition, the impact of a deferred outflow of resources on net
position must be explained as is done in the following paragraph.
The unrestricted net position amount of $403.8 million and $528.6 million at June 30, 2017 and 2016, respectively,
includes the effect of deferring the recognition of losses from bond refundings, swap terminations resulting in
defeasance of debt, and the decline in fair value of Metropolitan’s effective interest rate swaps. The deferred
outflows from losses on bond refundings at June 30, 2017 and 2016, respectively, were $59.9 million and
$69.1 million, respectively. The deferred outflows from losses on swap terminations resulting in debt defeasance at
June 30, 2017 and 2016, respectively, were $30.7 million and $35.4 million. Both deferred outflows of resources are
amortized and recognized as a component of interest expense in a systematic and rational manner over the
remaining life of the old debt or the life of the new debt, whichever is shorter.
The deferred outflows from the decline in fair value of interest rate swaps of $3.6 million and $38.5 million at
June 30, 2017 and 2016, respectively, would be recognized as an investment loss upon the early termination of the
swaps. Metropolitan will only terminate its interest rate swap agreements in advance of the contractual termination
dates if market conditions permit. The deferred outflow also would be recognized as an investment loss if the swaps
were determined no longer to be effective hedges. Finally, if the bond associated with a swap is refunded, the
deferred outflow would be reduced and the deferred loss on refunding increased by the same amount. The deferred
loss on refunding would be amortized as a component of interest expense over the life of the old debt or the new
debt, whichever is shorter.
The deferred outflows and inflows related to pension are discussed in detail in Note 7.
(q) Net Pension Liability, Deferred Outflows of Resources, Deferred Inflows of Resources,
Pension Expense
GASB Statement No. 68, Accounting and Financial Reporting for Pensions—an amendment of GASB Statement No. 27
(GASB 68), provides requirements for how pension costs and obligations are measured and reported in the basic
financial statements. When an organization’s pension liability exceeds the pension plan’s net position available for
paying benefits, there is a net pension liability which must be reported in the basic financial statements. In addition,
GASB 68 requires that projected benefit payments be discounted to their actuarial present value using a single rate
that reflects (1) a long-term expected rate of return on pension plan investments to the extent that the pension
plan’s fiduciary net position is projected to be sufficient to pay benefits and pension plan assets are expected to
achieve that rate and (2) a tax-exempt, high-quality municipal bond rate to the extent that the conditions under
(1) are not met.

T H E M E T R O P O L I T A N W A T E R D I S T R I C T O F S O U T H E R N C A L I F O R N I A
NOTES TO BASIC FINANCIAL STATEMENTS (CONTINUED)
June 30, 2017 and 2016
28
(r) Fair Value Measurement
GASB Statement No. 72, Fair Value Measurement and Application (GASB 72) requires a government to use valuation
techniques that are appropriate under the circumstances and for which sufficient data are available to measure fair
value. The techniques should be consistent with one or more of the following approaches: the market approach, the
cost approach, or the income approach. Metropolitan has been reporting its investments and liabilities at fair value
using market approach and cost approach therefore, there are no significant changes to its reporting resulting from
the implementation of GASB 72 in fiscal year 2016.
Additionally, GASB 72 establishes a hierarchy of inputs to valuation techniques used to measure fair value. This
hierarchy has three levels which are: Level 1 inputs are quoted prices (unadjusted) in active markets for identical
assets or liabilities that a government can access at the measurement date; Level 2 inputs are inputs—other than
quoted prices—included within Level 1 that are observable for the asset or liability, either directly or indirectly; and
Level 3 inputs are unobservable inputs, such as management’s assumption of the default rate among underlying
mortgages of a mortgage-backed security. The fair value hierarchy to Metropolitan’s assets and liabilities are
presented in Notes 3 and 5.
(s) New Accounting Pronouncements
Metropolitan implemented the following GASB Statement in fiscal year 2017:
In March 2016, the GASB issued Statement No. 82, Pension Issues – an amendment of GASB Statements No. 67, No. 68,
and No. 73 (GASB 82). This Statement addresses issues regarding (1) the presentation of payroll-related measures in
required supplementary information, (2) the selection of assumptions and the treatment of deviations from the
guidance in an Actuarial Standard of Practice for financial reporting purposes, and (3) the classification of payments
made by employers to satisfy employee (plan member) contribution requirements. GASB 82 requires the
presentation of covered payroll, which is payroll on which contributions to a pension plan are based, and ratios that
use that measure in required supplementary information instead of covered-employee payroll. In addition, GASB 82
clarifies that a deviation, as that term is used in Actuarial Standards of Practice, is not considered to be in conformity
with the requirements of Statement 67, Statement 68, or Statement 73 for the selection of assumptions used in
determining the total pension liability and related measures, based on the guidance in the Actuarial Standards of
Practice. GASB 82 further clarifies that payments that are made by an employer to satisfy contribution requirements
that are identified by the pension plan terms as plan member contribution requirements should be classified as plan
member contributions for purposes of Statement 67 and as employee contributions for purposes of Statement 68. It
also requires that an employer’s expense and expenditures for those amounts be recognized in the period for which
the contribution is assessed and classified in the same manner as the employer classifies similar compensation other
than pensions (for example, as salaries and wages or as fringe benefits).
Metropolitan is currently evaluating its accounting practices to determine the potential impact on the financial
statements for the following GASB Statements that will be implemented in a future fiscal year:
In June 2015, the GASB issued Statement No. 75, Accounting and Financial Reporting for Postemployment Benefits Other
Than Pensions (GASB 75), which establishes new accounting and financial reporting requirements for OPEB
improving the accounting and financial reporting by state and local governments for OPEB and provides
information provided by state and local government employers about financial support for OPEB that is provided
by other entities. This statement replaces the requirements of GASB Statement No. 45, Accounting and Financial
Reporting by Employers for Postemployment Benefits Other Than Pensions and GASB 57- OPEB Measurements by Agent Multiple-
Employer Plans. GASB 75 is effective for Metropolitan's fiscal year ending June 30, 2018.

T H E M E T R O P O L I T A N W A T E R D I S T R I C T O F S O U T H E R N C A L I F O R N I A
NOTES TO BASIC FINANCIAL STATEMENTS (CONTINUED)
June 30, 2017 and 2016
29
In March 2017, the GASB issued Statement No. 85, Omnibus 2017 (GASB 85). The objective of this Statement is to
address practice issues that have been identified during implementation and application of certain GASB
Statements. This Statement addresses a variety of topics including issues related to blending component units,
goodwill, fair value measurement and application, and postemployment benefits (pensions and other
postemployment benefits (OPEB)).
Specifically, this Statement addresses the following topics: (1) Blending a component unit in circumstances in which
the primary government is a business-type activity that reports in a single column for financial statement
presentation, (2) Reporting amounts previously reported as goodwill and “negative” goodwill, (3) Classifying real
estate held by insurance entities, (4) Measuring certain money market investments and participating interest-earning
investment contracts at amortized cost, (5) Timing of the measurement of pension or OPEB liabilities and
expenditures recognized in financial statements prepared using the current financial resources measurement focus
(6) Recognizing on-behalf payments for pensions or OPEB in employer financial statements, (7) Presenting payroll-
related measures in required supplementary information for purposes of reporting by OPEB plans and employers
that provide OPEB, (8) Classifying employer-paid member contributions for OPEB, (9) Simplifying certain aspects
of the alternative measurement method for OPEB, (10) Accounting and financial reporting for OPEB provided
through certain multiple-employer defined benefit OPEB plans. GASB 85 is effective for Metropolitan’s fiscal year
ending June 30, 2018.
The following pronouncements were issued by GASB but were determined to not have an impact on
Metropolitan’s financial statements:
GASB Statement No. 83, Certain Asset Retirement Obligations.
GASB Statement No. 84, Fiduciary Activities.
GASB Statement No. 86, Certain Debt Extinguishment Issues.
GASB Statement No. 87, Leases.
2. CAPITAL ASSETS
Capital asset activity for the fiscal years ended June 30, 2017 and 2016 was as follows:

T H E M E T R O P O L I T A N W A T E R D I S T R I C T O F S O U T H E R N C A L I F O R N I A
NOTES TO BASIC FINANCIAL STATEMENTS (CONTINUED)
June 30, 2017 and 2016
30
(Dollars in thousands) June 30, 2015 Additions
Capital assets not being depreciated:
Land, easements and rights of way 557,583$ $ 276,140
Construction in progress 1,644,948 229,419
Total capital assets not being depreciated 2,202,531 505,559
Other capital assets:
Parker Power Plant and Dam 13,009 —
Power recovery plants 178,636 1,665
Other dams and reservoirs 1,541,696 484
Water transportation facilities 3,504,032 205,118
Pumping plants and facilities 240,677 52,834
Treatment plants and facilities 2,138,579 729,770
Power lines and communciation facilities 33,807 —
Computer systems software 108,245 9,505
Buildings 136,096 —
Miscellaneous 445,718 7,323
Major equipment 93,462 6,170
Pre-operating interest and other expenses of original aqueduct 44,595 —
Participation rights in State Water Project (Note 10) 4,794,958 186,737
Participation rights in other facilities (Note 4) 461,909 —
Total other capital assets at historical cost 13,735,419 1,199,606
Accumulated depreciation and amortization:
Parker Power Plant and Dam (11,811) (163)
Power recovery plants (88,985) (4,243)
Other dams and reservoirs (322,528) (19,496)
Water transportation facilities (837,666) (74,165)
Pumping plants and facilities (78,917) (14,403)
Treatment plants and facilities (637,347) (96,636)
Power lines and communciation facilities (10,149) (414)
Computer systems software (100,194) (7,888)
Buildings (27,000) (1,816)
Miscellaneous (118,027) (5,740)
Major equipment (75,739) (5,776)
Pre-operating interest and other expenses of original aqueduct (38,382) (1,036)
Participation rights in State Water Project (Note 10) (3,330,533) (130,152)
Participation rights in other facilities (Note 4) (162,550) (13,893)
Total accumulated depreciation and amortization (5,839,828) (375,821)
Other capital assets, net 7,895,591 823,785 Total capital assets, net 10,098,122$ $ 1,329,344
Depreciation and amortization was charged as follows:
Depreciation of water related assets
Amortization of State Water Project entitlements (Note 10)
Amortization of participation rights (Note 4)
Depreciation and amortization expense related to capital assets
Plus: Net retirements adjusted to expenseTotal depreciation and amortization expense

T H E M E T R O P O L I T A N W A T E R D I S T R I C T O F S O U T H E R N C A L I F O R N I A
NOTES TO BASIC FINANCIAL STATEMENTS (CONTINUED)
June 30, 2017 and 2016
31
Reductions June 30, 2016 Additions Reductions June 30, 2017
$ — 833,723$ $ 176,210 $ — 1,009,933$
(1,003,553) 870,814 230,016 (82,042) 1,018,788
(1,003,553) 1,704,537 406,226 (82,042) 2,028,721
— 13,009 — — 13,009
— 180,301 17,175 (595) 196,881
— 1,542,180 14,554 (6,901) 1,549,833
(245) 3,708,905 41,814 (6,641) 3,744,078
— 293,511 2,921 (2,170) 294,262
(433) 2,867,916 16,046 (87,469) 2,796,493
— 33,807 — (1,129) 32,678
(1,057) 116,693 1,915 (3,552) 115,056
— 136,096 3,212 (371) 138,937
— 453,041 18,468 (5,219) 466,290
(2,232) 97,400 4,324 (1,971) 99,753
— 44,595 — — 44,595
(81,558) 4,900,137 174,230 (39,992) 5,034,375
(2,200) 459,709 — — 459,709
(87,725) 14,847,300 294,659 (156,010) 14,985,949
— (11,974) (163) — (12,137)
— (93,228) (5,542) 532 (98,238)
— (342,024) (38,481) 1,204 (379,301)
194 (911,637) (55,609) 5,241 (962,005)
— (93,320) (4,994) 1,350 (96,964)
188 (733,795) (65,878) 49,187 (750,486)
— (10,563) (413) 281 (10,695)
643 (107,439) (2,424) 3,552 (106,311)
— (28,816) (2,195) 329 (30,682)
— (123,767) (9,781) 1,627 (131,921)
2,223 (79,292) (5,689) 1,971 (83,010)
— (39,418) (1,036) — (40,454)
— (3,460,685) (127,419) — (3,588,104)
— (176,443) (13,820) — (190,263)
3,248 (6,212,401) (333,444) 65,274 (6,480,571)
(84,477) 8,634,899 (38,785) (90,736) 8,505,378 (1,088,030)$ 10,339,436$ $ 367,441 (172,778)$ 10,534,099$
231,776$ 192,205$
130,152 127,419
13,893 13,820
375,821 333,444
701 (31,703) 376,522$ 301,741$

T H E M E T R O P O L I T A N W A T E R D I S T R I C T O F S O U T H E R N C A L I F O R N I A
NOTES TO BASIC FINANCIAL STATEMENTS (CONTINUED)
June 30, 2017 and 2016
32
3. CASH AND INVESTMENTS
As a public agency, Metropolitan’s investment practices are prescribed by various provisions of the California
Government Code and the Act, as well as by administrative policies. Metropolitan’s statement of investment policy
is approved annually by the Board and describes the Treasurer’s investment authority, practices, and limitations.
The basic investment policy objectives, in order of importance, are safety of principal, liquidity, and return on
investment.
Cash and investments may or may not be restricted as to use, depending on the specific purposes for which such
assets are held (see Notes 3d and 13).
A summary of Metropolitan’s deposit and investment policies, information on interest and credit risks, and
restricted cash and investments is provided below.
(a) Deposits
The California Government Code requires California banks and savings and loan associations to secure a local
government agency’s deposits by pledging government securities as collateral.
As of June 30, 2017 and 2016, Metropolitan’s cash balances with financial institutions were $897,000 and $34,000
respectively, and cash on hand was $5,000 at each year-end.
(b) Investments
Metropolitan is permitted by State law and Board policy to invest in a variety of instruments including U.S. Treasury
securities, federal agencies, repurchase agreements, negotiable certificates of deposit, bankers’ acceptances, prime
commercial paper, asset and mortgage-backed securities, California local agency securities, including securities
issued by Metropolitan, medium-term corporate notes, time deposits, investment contracts, shares of beneficial
interest, and Local Agency Investment Fund (LAIF). As of June 30, 2017 and 2016, Metropolitan had the following
investments at fair value:
June 30,
(Dollars in thousands) 2017 2016
U.S. Treasury securities $ 366,159 $ 389,382 U.S. Guarantees – GNMAs 4 5 Federal agency securities 104,053 213,794 Prime commercial paper 289,029 309,112 Medium-term corporate notes 109,567 185,661 Negotiable certificates of deposit 368,239 221,050 Shares of beneficial interest 240 288 Government-sponsored enterprise (GSE) 64,327 67,288 Municipal bonds 22,935 44,306 Local Agency Investment Fund 50,000 65,000
Total investments $ 1,374,553 $ 1,495,886

T H E M E T R O P O L I T A N W A T E R D I S T R I C T O F S O U T H E R N C A L I F O R N I A
NOTES TO BASIC FINANCIAL STATEMENTS (CONTINUED)
June 30, 2017 and 2016
33
Metropolitan categorizes its fair value measurements within the fair value hierarchy established by generally accepted
accounting principles. The hierarchy is based on the valuation inputs used to measure fair value of the assets.
Level 1 are quoted prices in an active market for identical assets; Level 2 inputs are significant other observable
inputs; and Level 3 inputs are significant unobservable inputs.
The following is the summary of the fair value hierarchy of the fair value of investments of Metropolitan as of
June 30, 2017 and 2016:
Investments classified in Level 1 of the fair value hierarchy, valued at $1,028.3 million and $852.4 million as of June 30, 2017 and 2016, respectively, are valued using quoted prices in active markets. Prime commercial paper totaling $231.0 million and $309.1 million and negotiable certificates of deposit totaling $65.0 million and $221.1 million, as of June 30, 2017 and 2016, respectively, classified in Level 2 of the fair value hierarchy were valued using matrix pricing. Shares of beneficial interest totaling $0.2 million and $0.3 million as of June 30, 2017 and 2016, respectively, classified in Level 3 of the fair value hierarchy were valued at the Fund’s share price of $1.00. Federal agency securities totaling $0 and $48.0 million as of June 30, 2017 and 2016, respectively, were valued using cost.
Fair Value Measurement Using
Quoted Quoted
Prices in Prices in
Active Significant Active Significant
Markets for Other Significant Markets for Other Significant
Identical Obervable Unobservable Identical Obervable Unobservable
Assets Inputs Inputs Assets Inputs Inputs
(Dollars in thousands) 6/30/2017 (Level 1) (Level 2) (Level 3) 6/30/2016 (Level 1) (Level 2) (Level 3)
Investments by fair value level:
U.S. Treasury securities $ 366,159 $ 366,159 $ — $ — $ 389,382 $ 389,382 $ — $ —
U.S. Guarantees – GNMAs 4 4 — — 5 5 — —
Federal agency securities 104,053 104,053 — — 165,805 165,805 — —
Prime commercial paper 289,029 58,015 231,014 — 309,112 — 309,112 —
Medium-term corporate
notes 109,567 109,567 — — 185,661 185,661 — —
Negotiable certificates of
deposit 368,239 303,236 65,003 — 221,050 — 221,050 —
Shares of beneficial
interest (1)
240 — — 240 288 — — 288
Government-sponsored
enterprise (GSE) 64,327 64,327 — — 67,288 67,288 — —
Municipal bonds 22,935 22,935 — — 44,306 44,306 — —
Total investments by fair
value level $ 1,324,553 $ 1,028,296 $ 296,017 $ 240 $ 1,382,897 $ 852,447 $ 530,162 $ 288
Investments not subject
to fair value level:
Federal agency securities — 47,989
Local Agency Investment Fund 50,000 65,000
Total investments $ 1,374,553 $ 1,495,886
(1) As of June 30, 2017 and 2016, the balance was invested in BlackRock Treasury Trust (TTTXX) and Dreyfus Treasury & Agency Cash Management
(DTVXX), respectively.

T H E M E T R O P O L I T A N W A T E R D I S T R I C T O F S O U T H E R N C A L I F O R N I A
NOTES TO BASIC FINANCIAL STATEMENTS (CONTINUED)
June 30, 2017 and 2016
34
Interest rate risk. In accordance with Metropolitan’s investment policy, interest rate risk was managed by limiting the
duration of the various portfolio segments. Each segment has limitations on the amount of duration exposure (see
the following for specific durations). Internally Managed Segment
This segment of the portfolio was managed against the Bank of America Merrill Lynch 3-Month Treasury Bill
Index, approved by the Finance and Insurance Committee. For fiscal years 2017 and 2016, the benchmark
durations were 0.24 and 0.25, respectively, and the portfolio duration was permitted to vary from the duration by
plus or minus 0.20. As of June 30, 2017 and 2016, Metropolitan’s investments and portfolio durations for this
segment were as follows:
Externally Managed Segment
This segment of the portfolio was managed against the Bank of America Merrill Lynch, U.S. Corporate and
Government, one to five years, A-Rated and above index approved by the Finance and Insurance Committee. For
fiscal years 2017 and 2016, the benchmark durations were 2.70 and 2.71, respectively, and the portfolio duration
was permitted to vary from the duration by plus or minus 1.50. As of June 30, 2017 and 2016, Metropolitan’s
investments and portfolio durations for this segment were as follows:
Bond Reserves and Lake Mathews Segment
Investments in the bond reserves were managed based on the requirements of each of the bond issues. The Lake
Mathews trust funds were managed in a manner that preserved the principal and provided the necessary liquidity to
pay its operating expenses. Per Board authorization, the Treasurer was authorized to invest these monies in excess
of five years.
June 30,2017 2016
(Dollars in thousands) Fair value Duration Fair value DurationU.S. Treasury securities $ 143,361 0.64 $ 153,685 0.52 Federal agency securities 83,095 0.08 203,416 0.19 Prime commercial paper 288,594 0.04 309,112 0.06 Medium-term corporate notes 39,308 0.11 125,158 0.15 Negotiable certificates of deposit 367,604 0.20 221,050 0.15 Municipal bonds 1,759 3.20 7,663 0.19 Local Agency Investment Fund 50,000 — 65,000 — Portfolio duration 0.20 0.18
June 30,2017
(Dollars in thousands) Fair value Duration Fair value DurationU.S. Treasury securities $ 205,651 2.59 $ 213,453 2.83 U.S. Guarantees – GNMAs 4 4.40 5 5.04 Federal agency securities 7,175 5.33 7,595 6.25 Medium-term corporate notes 67,866 3.28 57,530 2.22 Shares of beneficial interest 236 — 288 — Government-sponsored enterprise (GSE) 64,327 2.37 67,288 1.82 Portfolio duration 2.74 2.61
2016

T H E M E T R O P O L I T A N W A T E R D I S T R I C T O F S O U T H E R N C A L I F O R N I A
NOTES TO BASIC FINANCIAL STATEMENTS (CONTINUED)
June 30, 2017 and 2016
35
As of June 30, 2017 and 2016, Metropolitan’s investments and portfolio durations for this segment were as follows:
Credit risk. Credit risk was managed by purchasing investments with the nationally recognized credit ratings
specified in Metropolitan's investment policy. Additionally, the policy required monitoring the credit ratings of
securities held in the portfolio, and if the securities' credit ratings were downgraded, evaluating for potential sale.
For certain securities, additional requirements included consideration of net worth, length of time in business, and
specified market values.
Presented in the following table is the minimum rating required, if applicable, by investment type pursuant to
Metropolitan’s investment policy and State law:
Metropolitan’s minimum rating for assets and mortgage-backed securities of ‘AAA’ is more restrictive than the
California Government Code requirement of ‘AA’.
June 30,2017 2016
(Dollars in thousands) Fair value Duration Fair value DurationU.S. Treasury securities $ 17,147 4.34 $ 22,244 5.35 Federal agency securities 13,783 0.01 2,783 1.20 Negotiable certificates of deposit 635 0.16 — — Medium-term corporate notes 2,393 0.12 2,973 0.17 Municipal bonds 21,176 5.63 36,643 5.82 Prime commercial paper 435 0.04 — — Shares of beneficial interest 4 — — — Weighted average duration 3.49 5.20
Investment Type Minimum Rating
U.S. Government and agencies Not applicable.
Bankers' acceptances
Prime commercial paper
Negotiable certificates of deposit
Time deposits
Repurchase agreementsOnly with primary dealers in government securities or financial institutions with
a Moody's Investors Service, Inc. or equivalent rating of 'A' or better.
Investment contractsNot applicable. Limited to guaranteed investment contracts, or agreements
collateralized with U.S. Treasury or agency securities.
Medium-term corporate notesRating category of at least 'A' or better, or the equivalent, by a nationally
recognized rating agency.
Government-sponsored enterprise
(e.g., FannieMae, FreddieMac)
Issuer's debt must be rated 'A' or higher as provided by a nationally recognized
rating agency and the security must be rated in a category of 'AAA' by a
nationally recognized rating agency.
Local Agency Investment Fund Not applicable.
Shares of beneficial interestHighest ranking of the highest letter and numerical rating provided by not less
than two nationally recognized rating agencies.
California local agency securities
Municipal bonds
Prime quality of the highest ranking or highest letter and numerical rating ('A1',
'P1', 'F1' or higher) as provided by Moody's Investors Service, Inc., Standard &
Poor's Ratings Services, and Fitch Ratings. Credit requirement may be waived
for the maximum deposit that is insured by the Federal Deposit Insurance
Corporation.
Securities with a maturity in excess of five years must have a credit rating of at
least 'AA' (may be insured) and an underlying credit rating of 'A' or better by a
nationally recognized rating agency.

T H E M E T R O P O L I T A N W A T E R D I S T R I C T O F S O U T H E R N C A L I F O R N I A
NOTES TO BASIC FINANCIAL STATEMENTS (CONTINUED)
June 30, 2017 and 2016
36
At June 30, 2017 and 2016, Metropolitan’s portfolio was invested in the following securities by rating:
(1) United States Treasuries and Federal Agencies are rated “AAA” by two nationally recognized rating agencies and “AA” by one nationally recognized rating agency.
(2) A or better e.g. F1+, A1+, AA, or AAA.
(3) Local Agency Investment Fund is not rated.
Concentration of credit risk. In accordance with Metropolitan’s investment policy, the minimum requirements for
limiting concentration of credit risk defined the maximum percent allowable for investment in each security type as
well as the percent allowable for investment by issuer per type. Generally, the maximum allowable for investment
by security type varied from 20 percent, for asset and mortgage-backed securities, to 100 percent for U.S. Treasury
and agency securities. The percentages of investments that can be purchased by a single issuer, within each security
type, ranged from 5 percent, for asset-backed securities, to 10 percent for bankers’ acceptances.
June 30,
2017 2016 (Dollars in thousands) Rating Fair value Fair value
U.S. Treasury securities AAA(1)
$ 366,159 $ 389,382 U.S. Guarantees – GNMAs AAA 4 5
Federal agency securities AAA(1)
104,053 213,794
Shares of beneficial interest AAA 240 288 Government-sponsored enterprise (GSE) AAA 64,327 67,288
Medium-term corporate notes A(2)
109,567 185,661
Prime commercial paper A1/P1(2)
289,029 309,112
Negotiable certificates of deposit F1(2)
368,239 221,050
Municipal bonds A(2)
22,935 44,306
Local Agency Investment Fund(3)
50,000 65,000
Total portfolio $ 1,374,553 $ 1,495,886

T H E M E T R O P O L I T A N W A T E R D I S T R I C T O F S O U T H E R N C A L I F O R N I A
NOTES TO BASIC FINANCIAL STATEMENTS (CONTINUED)
June 30, 2017 and 2016
37
The following table identifies Metropolitan’s limits and the percent invested by security type based on fair value, as
of June 30, 2017 and 2016.
At June 30, 2017, there were no investments representing five percent or more of total investments. At June 30,
2016, Metropolitan had the following investment (obligations of the U.S. government or obligations explicitly
guaranteed by the U.S. government not listed) representing five percent or more of its investments:
Custodial credit risk. At June 30, 2017 and 2016, Metropolitan’s investments were insured, registered or held, in
Metropolitan’s name, in safekeeping at Metropolitan’s bank, which was not a counterparty to the investment
transactions. The exceptions were $50.0 million and $65.0 million in deposits in the California State managed LAIF
as of June 30, 2017 and 2016, respectively.
The LAIF, created by California statute, is part of a pooled money investment account (PMIA). The LAIF has
oversight by the Local Investment Advisory Board, which consists of five members designated by statute. The
Chairman is the State Treasurer, or his designated representative.
The total amount invested by all public agencies in LAIF as of June 30, 2017 and 2016 was $22.8 billion and
$22.7 billion, respectively. At June 30, 2017 and 2016, the PMIA had a balance of $77.6 billion and $75.4 billion,
respectively, of which, 2.89 percent and 2.81 percent were invested in medium-term and short-term notes and asset-
backed securities, respectively. The average maturity of LAIF investments as June 30, 2017 and 2016 was 194 days
and 167 days, respectively.
Investment
Policy Percent of PortfolioLimits 2017 2016
U.S. Treasury securities 100% 26.64 % 26.03 %
Federal agency securities 100% 7.57 14.29
Shares of beneficial interest 20% 0.02 0.02 Government-sponsored enterprise (GSE) 20% 4.68 4.50
Medium-term corporate notes 30% 7.97 12.41
Prime commercial paper 25% 21.02 20.66
Negotiable certificates of deposit 30% 26.79 14.78
Municipal bonds 30% 1.67 2.96
Local Agency Investment Fund N/A 3.64 4.35
Total portfolio 100.00 % 100.00 %
(Dollars in thousands) June 30, 2016
Federal National Mortgage Association $ 89,912 6.06 %

T H E M E T R O P O L I T A N W A T E R D I S T R I C T O F S O U T H E R N C A L I F O R N I A
NOTES TO BASIC FINANCIAL STATEMENTS (CONTINUED)
June 30, 2017 and 2016
38
(c) Reverse Repurchase Agreements
Metropolitan is permitted, subject to conditions imposed by State law, to sell securities owned under written
agreements and to buy back the securities on or before a specified date for a specified amount. No such reverse
repurchase agreements were entered into during the fiscal years ended June 30, 2017 and 2016.
(d) Restricted Cash and Investments
Metropolitan has established a number of separate accounts, also referred to as funds, to provide for specific
activities in accordance with special regulations, bond covenants, and trust arrangements. The accounts are
classified as "restricted." Most restricted accounts have the minimum cash and investment balance requirements and
all are nondiscretionary in terms of the use of assets. Among other things, the restricted amounts provide for
payments of debt service on Metropolitan's bonds; reserves for principal and interest on outstanding bonds;
payments for arbitrage tax rebate; construction of capital assets; payment of Metropolitan's operations and
maintenance expenses; and payment of the costs related to the closure and postclosure maintenance of
Metropolitan's solid waste landfill facility.

T H E M E T R O P O L I T A N W A T E R D I S T R I C T O F S O U T H E R N C A L I F O R N I A
NOTES TO BASIC FINANCIAL STATEMENTS (CONTINUED)
June 30, 2017 and 2016
39
This page intentionally left blank.

T H E M E T R O P O L I T A N W A T E R D I S T R I C T O F S O U T H E R N C A L I F O R N I A
NOTES TO BASIC FINANCIAL STATEMENTS (CONTINUED)
June 30, 2017 and 2016
40
4. PARTICIPATION RIGHTS
Participation rights activity for the fiscal years ended June 30, 2017 and 2016 was as follows:
(Dollars in thousands) June 30, 2015 Additions
Participation rights:
Imperial Irrigation District $ 112,313 $ —
Palo Verde Irrigation District 82,804 —
Kern Water District 39,007 —
South County Pipeline 72,371 —
Semitropic Water Storage District 37,119 —
Arvin-Edison Water Storage District 47,187 —
Chino Basin 27,500 —
Orange County 23,000 —
Conjunctive Use Programs 20,608 —
Total 461,909 —
Accumulated amortization:
Imperial Irrigation District (52,152) (2,270)
Palo Verde Irrigation District (24,046) (2,343)
Kern Water District (10,771) (2,172)
South County Pipeline (20,371) (912)
Semitropic Water Storage District (14,898) (1,056)
Arvin-Edison Water Storage District (17,353) (1,467)
Chino Basin (9,085) (1,453)
Orange County (7,468) (1,195)
Conjunctive Use Programs (6,406) (1,025)
Total (162,550) (13,893)
Participations rights, net $ 299,359 $ (13,893)

T H E M E T R O P O L I T A N W A T E R D I S T R I C T O F S O U T H E R N C A L I F O R N I A
NOTES TO BASIC FINANCIAL STATEMENTS (CONTINUED)
June 30, 2017 and 2016
41
Reductions June 30, 2016 Additions Reductions June 30, 2017
$ — $ 112,313 $ — $ — $ 112,313
— 82,804 — — 82,804
— 39,007 — — 39,007
— 72,371 — — 72,371
(2,200) 34,919 — — 34,919
— 47,187 — — 47,187
— 27,500 — — 27,500
— 23,000 — — 23,000
— 20,608 — — 20,608
(2,200) 459,709 — — 459,709
— (54,422) (2,270) — (56,692)
— (26,389) (2,342) — (28,731)
— (12,943) (2,172) — (15,115)
— (21,283) (912) — (22,195)
— (15,954) (981) — (16,935)
— (18,820) (1,467) — (20,287)
— (10,538) (1,456) — (11,994)
— (8,663) (1,195) — (9,858)
— (7,431) (1,025) — (8,456)
— (176,443) (13,820) — (190,263)
$ (2,200) $ 283,266 $ (13,820) $ — $ 269,446

T H E M E T R O P O L I T A N W A T E R D I S T R I C T O F S O U T H E R N C A L I F O R N I A
NOTES TO BASIC FINANCIAL STATEMENTS (CONTINUED)
June 30, 2017 and 2016
42
(a) Imperial Irrigation District
In December 1988, Metropolitan and the Imperial Irrigation District (lID) entered into a water conservation
agreement that became effective in December 1989. Under the terms of the conservation agreement, Metropolitan
paid for capital costs and continues to pay annual costs for specific conservation projects within IID. From 1998 to
2003, Metropolitan diverted from the Colorado River a quantity of water equal to the amount of water conserved
by the conservation projects, which totaled between 104,940 and 109,460 acre-feet annually. Under the
October 2003 amendment to an agreement and at the request of the Coachella Valley Water District (CVWD), up
to 20,000 acre-feet of the total conserved volume was made available to CVWD. Under the May 2007 amendment
to the agreement and a December 2015 letter agreement, at least 85,000 and 90,374 acre-feet will be/was available
in calendar years 2017 and 2016, respectively (see Note 9c). The water must be used in the calendar year the water is
conserved, unless stored in a Colorado River reservoir pursuant to a separate agreement.
As capital projects were completed, the costs contributed by Metropolitan were capitalized as participation rights in
Metropolitan’s accounting records. The construction phase of this program was completed as of September 30,
1998, and the operation and maintenance phase commenced on October 1, 1998. The October 2003 amendment to
the agreement extended the term through December 31, 2041 or 270 days beyond the termination of the
Quantification Settlement Agreement plus any extension applicable over the agreement (see Note 9e).
Participation rights for this project totaled $112.3 million as of June 30, 2017 and 2016, and are amortized using the
straight-line method over the remaining life of the agreement. Amortization expense totaled $2.3 million in fiscal
years 2017 and 2016.
(b) Palo Verde Irrigation District
In August 2004, Metropolitan entered into an agreement with Palo Verde Irrigation District (PVID) to implement a
35-year land management and crop rotation program. This fallowing program commenced in January 2005 and will
extend through July 2040 and will make available up to 130,000 acre-feet of water in certain years for transfer to
Metropolitan from PVID.
Under the terms of the agreement, Metropolitan paid for all program start-up costs that have been capitalized as
participation rights. These costs included sign-up payments to individual landowners, funding for a community
improvement program and program setup costs.
Participation rights for this program totaled $82.8 million as of June 30, 2017 and 2016, and are being amortized
using the straight-line method over 35 years. Amortization expense totaled $2.3 million in fiscal years 2017 and
2016.
(c) Kern Delta Water District
Metropolitan entered into an agreement with the Kern Delta Water District for the development of a water
management program. The agreement includes a Regulation Program and a Transportation Program. Under the
terms of the Regulation Program, Kern Delta will regulate the storage and delivery for Metropolitan of up to
250,000 acre-feet of water and currently has 102,841 acre-feet in the program. The program is intended to provide a
minimum recharge and return capability of 50,000 acre-feet annually. Construction of infrastructure is required in
order to meet the program’s dry year minimum return. The transportation program provides Metropolitan with
priority rights to convey water acquired by Metropolitan from third parties through the Kern-Delta facilities to the
California Aqueduct for ultimate delivery to Metropolitan. This program terminates on December 31, 2029. The
facilities became operational in June 2010.

T H E M E T R O P O L I T A N W A T E R D I S T R I C T O F S O U T H E R N C A L I F O R N I A
NOTES TO BASIC FINANCIAL STATEMENTS (CONTINUED)
June 30, 2017 and 2016
43
Participation rights for the Kern Delta totaled $39.0 million as of June 30, 2017 and 2016, and are being amortized
using the straight-line method over the remaining life of the agreement. Amortization expense totaled $2.2 million
in fiscal years 2017 and 2016.
(d) South County Pipeline
In 1989, Metropolitan entered into an agreement with two member agencies and one of their subagencies to
participate in the construction of an upsized version of a 26-mile long pipeline serving the south Orange County
portion of its service area. Participation in this project provides Metropolitan capacity to transport its water in the
central part of its service area.
Participation rights for this project totaled $72.4 million as of June 30, 2017 and 2016. These participation rights are
amortized using the straight-line method over 80 years, which is the life of the agreement. Amortization expense
totaled $0.9 million in fiscal years 2017 and 2016.
(e) Semitropic Water Storage District
In December 1994, Metropolitan entered into a water banking and exchange program with Semitropic Water
Storage District and its improvement districts that entitles it to storage, withdrawal, and exchange rights for its State
Water Project supplies. The agreement terminates in November 2035.
In 1999, Metropolitan became fully vested for 35 percent of the one million acre-foot banking project. Metropolitan
has a storage allocation of 350,000 acre-feet and currently has 146,688 acre-feet in the program. Metropolitan is
entitled to a minimum of 31,500 acre-feet per year of pump back capacity. In addition, assuming a 100 percent State
Water Project allocation, Metropolitan is entitled to a minimum of 46,550 acre-feet per year of entitlement exchange
rights. Finally, Metropolitan has the ability to use other banking partners’ rights when they are not being used. As a
result, the potential maximum return capability for Metropolitan is estimated at 223,000 acre-feet per year assuming
a 100 percent State Water Project allocation and usage of the other banking partners’ rights. In fiscal year 2015,
Metropolitan spent $5.8 million to increase the return capacity by 13,200 acre-feet per year. In fiscal year 2016, that
return capacity was reduced by 5,000 acre-feet per year to 8,200 acre-feet per year when Metropolitan received
reimbursement of $2.2 million.
Participation rights for this program totaled $34.9 million as of June 30, 2017 and 2016. These participation rights
are amortized using the straight-line method over the remaining life of the agreement. Amortization expense totaled
$1.0 million and $1.1 million in fiscal years 2017 and 2016, respectively.
(f) Arvin-Edison Water Storage District
In December 1997, Metropolitan entered into an agreement for a water management program with Arvin-Edison
Water Storage District (Arvin-Edison). The agreement includes a regulation program, a transportation program, and
a water quality exchange program. Under the terms of the regulation program, Arvin-Edison will regulate the
storage and delivery for Metropolitan of up to 350,000 acre-feet of water and currently has 108,125 acre-feet in the
program. The minimum estimated return capability for the Arvin-Edison program varies from 40,000 acre-feet per
year to 75,000 acre-feet per year depending on hydrologic/groundwater conditions. Return water will be delivered
to Metropolitan upon request through a new intertie pipeline to the California Aqueduct and by exchange of
existing Arvin-Edison supplies in the California Aqueduct. In 2008, Metropolitan amended the agreement to
construct the south canal improvement project that will improve the operational flexibility of the program as well as
increase the ability to return high quality water to the California Aqueduct. The project was completed in early 2009.
The agreement terminates on November 4, 2035 with provisions for automatic extension if all stored water has not
been returned.

T H E M E T R O P O L I T A N W A T E R D I S T R I C T O F S O U T H E R N C A L I F O R N I A
NOTES TO BASIC FINANCIAL STATEMENTS (CONTINUED)
June 30, 2017 and 2016
44
The agreement also provides a transportation program whereby Metropolitan is provided priority rights to convey
water acquired by Metropolitan from third parties through the Arvin-Edison facilities to the California Aqueduct
for ultimate delivery to Metropolitan.
Participation rights for the Arvin-Edison program totaled $47.2 million as of June 30, 2017 and 2016. These
participation rights are amortized using the straight-line method over the longer life of the transportation program.
Amortization expense totaled $1.5 million in fiscal years 2017 and 2016.
(g) Chino Basin
In June 2003, Metropolitan entered into a groundwater storage agreement with Inland Empire Utilities Agency,
Three Valleys Municipal Water District, and the Chino Basin Watermaster. Under the terms of the agreement,
Metropolitan may store up to 25,000 acre-feet per year to a maximum of 100,000 acre-feet and may withdraw up to
33,000 acre-feet per year for overlying demand during dry, drought, or emergency conditions. The facilities became
operational during fiscal year 2009. As of June 2017, Metropolitan had 6,319 acre-feet water in storage. The
agreement terminates on March 1, 2028, unless the parties agree to extend for an additional maximum period of
25 years.
Participation rights in the Chino basin groundwater storage program totaled $27.5 million as of June 30, 2017 and
2016. These participation rights are amortized using the straight-line method over the remaining life of the
agreement. Amortization expense totaled $1.5 million in fiscal years 2017 and 2016.
(h) Orange County
In 2003, Metropolitan entered into a groundwater storage agreement with the Orange County Water District and
the Municipal Water District of Orange County to allow Metropolitan to store 66,000 acre-feet in the Orange
County Basin. Metropolitan may store up to 16,500 acre-feet per year and withdraw up to 22,000 acre-feet for
overlying demand during dry, drought, or emergency conditions. The facilities became operational during fiscal year
2009. As of June 2017, Metropolitan had 1,190 acre-feet in storage. The program included the construction of wells
and barrier improvements for protection of groundwater supplies from seawater intrusion. The agreement
terminates in June 2028, unless the parties agree to extend for an additional maximum period of 25 years.
Participation rights in the Orange County groundwater storage program totaled $23.0 million as of June 30, 2017
and 2016. These participation rights are amortized using the straight-line method over the remaining life of the
agreement. Amortization expense totaled $1.2 million in fiscal years 2017 and 2016.
(i) Conjunctive Use Programs
Conjunctive use is the operation of a groundwater basin in coordination with a surface water system to increase
total water supply availability, thus improving the overall reliability of supplies. Metropolitan has entered into seven
agreements with its member agencies for conjunctive use programs whereby Metropolitan provides funding for
construction of water storage and related facilities in exchange for water storage and withdrawal rights. The
conjunctive use programs were funded with State Proposition 13 grant dollars. The seven projects are with Long
Beach, Long Beach-Lakewood, Compton, Three Valleys, Three Valleys MWD-La Verne, Foothill MWD, and
Western MWD-Elsinore Valley MWD. Collectively, these seven projects allow Metropolitan to store up to
45,889 acre-feet with storage of 11,472 acre-feet per year and withdrawal of 15,296 acre-feet per year for overlying
demand during dry, drought, or emergency conditions. As of June 2017, Metropolitan had a total of 667 acre-feet in
storage in these seven accounts. The term of each agreement is 25 years, unless the parties agree to extend for an
additional maximum period of 25 years. Termination dates range from July 2027 to December 2031. The programs
became operational during fiscal year 2009.

T H E M E T R O P O L I T A N W A T E R D I S T R I C T O F S O U T H E R N C A L I F O R N I A
NOTES TO BASIC FINANCIAL STATEMENTS (CONTINUED)
June 30, 2017 and 2016
45
Participation rights in these projects totaled $20.6 million at June 30, 2017 and 2016. These participation rights are
amortized using the straight-line method over the remaining lives of the agreements. Amortization expense totaled
$1.0 million in fiscal years 2017 and 2016.
5. SHORT-TERM AND LONG-TERM DEBT
Metropolitan’s enabling Act specifies that its indebtedness shall be limited to 15 percent of the assessed value of all
taxable property within Metropolitan’s service area. Existing outstanding debt of $4.842 billion and $4.773 billion at
June 30, 2017 and 2016, respectively, represents less than one percent of the June 30, 2017 and 2016 total taxable
assessed valuation of $2,583 billion and $2,451 billion, respectively.
Metropolitan’s long-term debt consists of general obligation and revenue bond issues as well as other obligations.
The general obligation bonds are secured by Metropolitan’s authority to levy ad valorem property taxes. The
revenue bond obligations are special limited obligations of Metropolitan and are secured by a pledge of
Metropolitan’s net operating revenues. Such obligations contain certain restrictive covenants, with which
Metropolitan has complied. Substantially all of the bond issues contain call provisions. Substantially all of the debt
proceeds have been, and are expected to continue to be, utilized to fund new facilities, improvements and
betterments, and to refund outstanding bonds.
(a) Short-term Debt
Metropolitan may issue up to $400.0 million in commercial paper to fund a portion of its capital plan. During the
fiscal years ended June 30, 2017 and 2016, there were no commercial paper notes issued or outstanding.
Metropolitan may also issue other forms of short-term debt such as variable rate water revenue bonds (see
Note 5c).
In April 2016, Metropolitan entered into a noteholder’s agreement with RBC Municipal Products, LLC (“RBC”) for
the purchase by RBC and sale by Metropolitan of Metropolitan’s Index Notes, Series 2016 (“RBC Facility”). Also
in April 2016, Metropolitan entered into a note purchase and continuing covenant agreement with U.S. Bank
National Association (“US Bank”), for the purchase by US Bank and sale by Metropolitan of Metropolitan’s
Flexible Rate Revolving Notes, Series 2016 (“US Bank Facility,” and together with the RBC Facility, the “Short-
Term Revolving Credit Facilities”). Metropolitan is permitted to sell up to $200.0 million of notes under each of
the Short-Term Revolving Credit Facilities for an aggregate amount of available borrowings of $400.0 million.
Metropolitan may borrow, pay down and re-borrow amounts under each of the Short-Term Revolving Credit
Facilities. As of June 30, 2016, Metropolitan has sold $250.0 million of notes under the Short-Term Revolving
Credit Facilities ($125.0 million under the RBC Facility and $125.0 million under the US Bank Facility). On April 3,
2017, Metropolitan sold $250.0 million of notes under the Short-Term Revolving Credit Facility ($125.0 million
under the RBC Facility and $125.0 million under the US Bank Facility), to refund the notes issued in 2016. The
$125.0 million note issued in 2017 under the RBC Facility has a maturity date of April 5, 2020 and the
$125.0 million note issued in 2017 under the US Bank Facility has a maturity date of April 5, 2019. On July, 1 2016,
Metropolitan sold $45.8 million of Notes under the US Bank Facility to refund $31.2 million of Water Revenue
Refunding Bonds, 2012 Series E-3 and $14.6 million of Water Revenue Refunding Bonds, 2014 Series G-1. The
Notes were refunded on September 20, 2016 from proceeds of $103.7 million of Special Variable Rate Water
Revenue Refunding Bonds, 2016 Series B-1 and B-2. On June 1, 2017 Metropolitan sold $12.3 million of notes
under the US Bank Facility, to refund $12.3 million of Special Variable Rate Water Revenue Refunding Bonds, 2013
Series E. The notes mature on May 31, 2018.
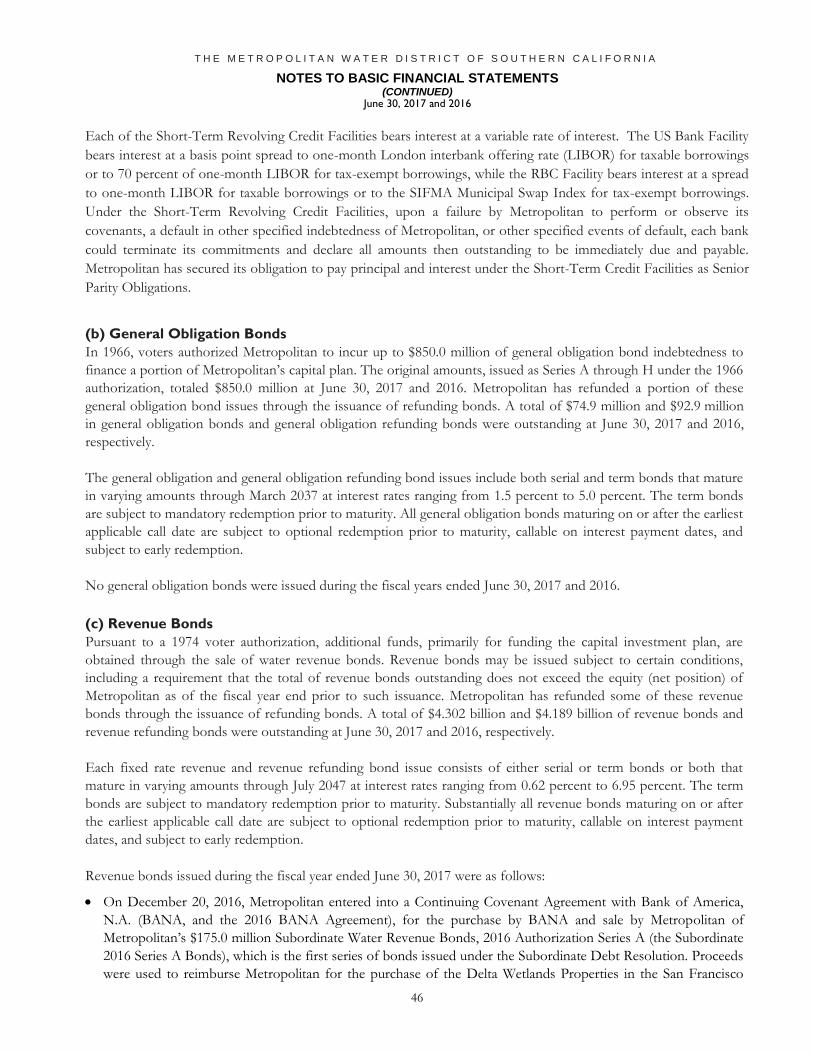
T H E M E T R O P O L I T A N W A T E R D I S T R I C T O F S O U T H E R N C A L I F O R N I A
NOTES TO BASIC FINANCIAL STATEMENTS (CONTINUED)
June 30, 2017 and 2016
46
Each of the Short-Term Revolving Credit Facilities bears interest at a variable rate of interest. The US Bank Facility
bears interest at a basis point spread to one-month London interbank offering rate (LIBOR) for taxable borrowings
or to 70 percent of one-month LIBOR for tax-exempt borrowings, while the RBC Facility bears interest at a spread
to one-month LIBOR for taxable borrowings or to the SIFMA Municipal Swap Index for tax-exempt borrowings.
Under the Short-Term Revolving Credit Facilities, upon a failure by Metropolitan to perform or observe its
covenants, a default in other specified indebtedness of Metropolitan, or other specified events of default, each bank
could terminate its commitments and declare all amounts then outstanding to be immediately due and payable.
Metropolitan has secured its obligation to pay principal and interest under the Short-Term Credit Facilities as Senior
Parity Obligations.
(b) General Obligation Bonds
In 1966, voters authorized Metropolitan to incur up to $850.0 million of general obligation bond indebtedness to
finance a portion of Metropolitan’s capital plan. The original amounts, issued as Series A through H under the 1966
authorization, totaled $850.0 million at June 30, 2017 and 2016. Metropolitan has refunded a portion of these
general obligation bond issues through the issuance of refunding bonds. A total of $74.9 million and $92.9 million
in general obligation bonds and general obligation refunding bonds were outstanding at June 30, 2017 and 2016,
respectively.
The general obligation and general obligation refunding bond issues include both serial and term bonds that mature
in varying amounts through March 2037 at interest rates ranging from 1.5 percent to 5.0 percent. The term bonds
are subject to mandatory redemption prior to maturity. All general obligation bonds maturing on or after the earliest
applicable call date are subject to optional redemption prior to maturity, callable on interest payment dates, and
subject to early redemption.
No general obligation bonds were issued during the fiscal years ended June 30, 2017 and 2016.
(c) Revenue Bonds
Pursuant to a 1974 voter authorization, additional funds, primarily for funding the capital investment plan, are
obtained through the sale of water revenue bonds. Revenue bonds may be issued subject to certain conditions,
including a requirement that the total of revenue bonds outstanding does not exceed the equity (net position) of
Metropolitan as of the fiscal year end prior to such issuance. Metropolitan has refunded some of these revenue
bonds through the issuance of refunding bonds. A total of $4.302 billion and $4.189 billion of revenue bonds and
revenue refunding bonds were outstanding at June 30, 2017 and 2016, respectively.
Each fixed rate revenue and revenue refunding bond issue consists of either serial or term bonds or both that
mature in varying amounts through July 2047 at interest rates ranging from 0.62 percent to 6.95 percent. The term
bonds are subject to mandatory redemption prior to maturity. Substantially all revenue bonds maturing on or after
the earliest applicable call date are subject to optional redemption prior to maturity, callable on interest payment
dates, and subject to early redemption.
Revenue bonds issued during the fiscal year ended June 30, 2017 were as follows:
On December 20, 2016, Metropolitan entered into a Continuing Covenant Agreement with Bank of America,
N.A. (BANA, and the 2016 BANA Agreement), for the purchase by BANA and sale by Metropolitan of
Metropolitan’s $175.0 million Subordinate Water Revenue Bonds, 2016 Authorization Series A (the Subordinate
2016 Series A Bonds), which is the first series of bonds issued under the Subordinate Debt Resolution. Proceeds
were used to reimburse Metropolitan for the purchase of the Delta Wetlands Properties in the San Francisco

T H E M E T R O P O L I T A N W A T E R D I S T R I C T O F S O U T H E R N C A L I F O R N I A
NOTES TO BASIC FINANCIAL STATEMENTS (CONTINUED)
June 30, 2017 and 2016
47
Bay\Sacramento-San Joaquin River Delta that was funded from Metropolitan’s reserves in July 2016. The
Subordinate 2016 Series A Bonds are Index Tender Bonds and bear interest at a variable rate of interest, at a
spread to one-month LIBOR. Under the 2016 BANA Agreement, upon a failure by Metropolitan to perform or
observe its covenants, a default in other specified indebtedness of Metropolitan, or other specified events of
default, BANA could terminate its commitments and declare all amounts then outstanding to be immediately
due and payable. Metropolitan has secured its obligation to pay principal and interest under the 2016 BANA
Agreement as a Subordinate Lien Parity Obligation.
The Subordinate 2016 Series A Bonds are subject to mandatory tender for purchase on the scheduled mandatory
tender date of December 21, 2018, or, if directed by BANA upon the occurrence and continuance of an event of
default under the 2016 BANA Agreement, five business days after receipt of such direction.
On March 1, 2017, Metropolitan issued $80.0 million of Water Revenue Bonds, 2017 Authorization Series A, at
variable rates, to finance a portion of Metropolitan’s capital expenditures. The maturities extend to July 1, 2047
and are subject to optional and mandatory redemption provisions.
Revenue bond issued during the fiscal year ended June 30, 2016 was as follows:
On December 17, 2015, Metropolitan issued $208.3 million of Water Revenue Bonds, 2015 Authorization Series
A, at a true interest cost of 3.11 percent, to finance a portion of the capital investment plan. The maturities
extend to July 1, 2045 and are subject to mandatory and optional redemption provisions.
(d) Bond Refundings and Defeasances
Metropolitan has issued Waterworks General Obligation Refunding Bonds, Water Revenue Refunding Bonds, and
Special Variable Rate Water Revenue Refunding Bonds to refund various issues of Waterworks General Obligation
Bonds, Waterworks General Obligation Refunding Bonds, Water Revenue Bonds, Water Revenue Refunding
Bonds, and Special Variable Rate Water Revenue Refunding Bonds previously issued. The net proceeds from these
sales were used to redeem the refunded bonds and fund certain swap termination payments or to purchase U.S.
Treasury securities that were deposited in irrevocable escrow trust accounts with a bank acting as an independent
fiscal agent to provide for all future debt service on the bonds being refunded. As a result, those bonds are
considered defeased and the related liabilities have been excluded from Metropolitan’s basic financial statements.
Refunding and defeasance transactions during fiscal year 2017 were as follows:
• On September 20, 2016, Metropolitan issued $103.7 million Special Variable Rate Water Revenue Refunding
Bonds, 2016 Series B-1 and series B-2, at variable rates, to refund $62.5 million of Water Revenue Refunding
Bonds, 2008 Series A-2 and $45.8 million Tax-Exempt Flexible Rate Revolving Notes, Series 2016 B-1. The
maturities of the 2016 Series B-1 and B-2 bonds extend to July 1, 2037 and are subject to optional and mandatory
redemption provisions.
• On June 1, 2017, Metropolitan issued $238.0 million of Subordinate Water Revenue Refunding Bonds, 2017
Series A, to refund $37.8 million Water Revenue Bonds, 2006 Authorization, Series A, $92.0 million of Water
Revenue Refunding Bonds, 2009 Series A-2, $6.0 million of Water Revenue Refunding Bonds, 2011 Series A-1,
$6.0 million of Water Revenue Refunding Bonds, 2011 Series A-3, $92.6 million of Special Variable Rate Water
Revenue Refunding Bonds, 2013 Series E, and $8.6 million State of California Department of Water Resources
Revolving Fund loan. The maturities of the 2017 Series A bonds extend to July 1, 2027 and are not subject to
optional or mandatory redemption provisions.

T H E M E T R O P O L I T A N W A T E R D I S T R I C T O F S O U T H E R N C A L I F O R N I A
NOTES TO BASIC FINANCIAL STATEMENTS (CONTINUED)
June 30, 2017 and 2016
48
Refunding and defeasance transactions during fiscal year 2016 were as follows:
• On July, 1, 2015, Metropolitan issued $188.9 million Special Variable Rate Water Revenue Refunding Bonds,
2015 Series A-1 and A-2, at variable rates, to refund $88.8 million of Water Revenue Bonds, 2000 Authorization,
Series B-4, $75.6 million of Water Revenue Bonds, 2005 Authorization, Series A, and $29.8 million of Water
Revenue Refunding Bonds, 2012 Series E-2 (Term Mode). The maturities of the 2015 Series A-1 and A-2 bonds
extend to July 1, 2035 and are subject to optional and mandatory redemption provisions.
• On June 30, 2016, Metropolitan issued $239.5 million Water Revenue Refunding Bonds, 2016 Series A, to refund
$175.0 million of Water Revenue Bonds, 2005 Authorization, Series C, $85.0 million of Water Revenue Bonds,
2006 Authorization, Series A, and $24.1 million of Water Revenue Refunding Bonds, 2006 Series B. The
maturities of the 2016 Series A bonds extend to July 1, 2037 and are subject to optional and mandatory
redemption provisions.
These refundings and defeasances were accomplished to take advantage of lower interest rates, to realize economic
savings or to eliminate or mitigate certain risks associated with managing its variable rate debt. The transactions
resulted in cash flow savings of $27.8 million and $48.2 million and economic gains (difference between the present
values of the debt service payments on the old debt and new debt) of $23.4 million and $34.7 million for fiscal years
2017 and 2016, respectively. The difference between the book value of the old debt and the amount required to
retire the debt is deferred and amortized over the original remaining life of the old debt or the life of the new debt,
whichever is less. Deferred outflows of loss on bond refundings at June 30, 2017 and 2016 were $59.9 million and
$69.1 million, respectively, and the deferred outflows on swap terminations for the same periods were $30.7 million
and $35.4 million, respectively.
(e) Other Long-term Debt
In November 2003, Metropolitan received $20.0 million through the state Department of Water Resources for
oxidation retrofit facilities at the Mills Water Treatment Plant in Riverside County. This 20-year State Revolving
Fund loan carries interest at 2.39 percent with the final payment due July 1, 2024. At June 30, 2017 and 2016, the
outstanding balance was $0 and $9.1 million, respectively.
(f) Interest Rate Swaps
Metropolitan has eight outstanding interest rate swap agreements as of June 30, 2017. These agreements require that
Metropolitan pay fixed interest rates and receive interest at variable interest rates which are Metropolitan’s hedging
derivative instruments.
Metropolitan’s interest rate swap portfolio as of June 30, 2017, 2016, and 2015 are summarized on the following
table.

T H E M E T R O P O L I T A N W A T E R D I S T R I C T O F S O U T H E R N C A L I F O R N I A
NOTES TO BASIC FINANCIAL STATEMENTS (CONTINUED)
June 30, 2017 and 2016
49
This page intentionally left blank.

T H E M E T R O P O L I T A N W A T E R D I S T R I C T O F S O U T H E R N C A L I F O R N I A
NOTES TO BASIC FINANCIAL STATEMENTS (CONTINUED)
June 30, 2017 and 2016
50
(Dollars in thousands)
Associated Notional Effective Fixed Variable Counterparty
Bond Issue 1
Amount Date Rate Paid Rate Received Credit Rating2
2002 A Payor $ 75,838 09/12/02 3.300%
57.74% of
1MoLIBOR4
A3/BBB+/A
2002 B Payor 28,372 09/12/02 3.300%
57.74% of
1MoLIBOR Aa3/A+/AA-
2003 Payor
C-1 C-3 158,597 12/18/03 3.257%
61.20% of
1MoLIBOR Aa2/AA-/AA
2003 Payor
C-1 C-3 158,597 12/18/03 3.257%
61.20% of
1MoLIBOR Aa3/A+/AA-
2004 C Payor 7,760 11/16/04 2.980%
61.55% of
1MoLIBOR A3/BBB+/A
2004 C Payor 6,350 11/16/04 2.980%
61.55% of
1MoLIBOR Baa1/BBB+/A
2005 Payor 29,058 07/06/05 3.360%
70.00% of
3MoLIBOR Aa3/A+/AA-
2005 Payor 29,058 07/06/05 3.360%
70.00% of
3MoLIBOR Baa1/A-/A
Total swaps $ 493,630
1 These swaps lock in a fixed rate for an equivalent amount of variable rate debt.
2 Credit Ratings - Moody's Investors Service, Standard & Poor's, Fitch Ratings, respectively.
3 Excludes accrued interest.
4 London Interbank Offered Rate.

T H E M E T R O P O L I T A N W A T E R D I S T R I C T O F S O U T H E R N C A L I F O R N I A
NOTES TO BASIC FINANCIAL STATEMENTS (CONTINUED)
June 30, 2017 and 2016
51
As with its investments, Metropolitan categorizes its liabilities using fair value measurements within the fair value
hierarchy established by generally accepted accounting principles and are discussed in Note 3.
Swap
Termination 2017 2016 2015 2017 2016
07/01/25 $ (7,991) $ (12,421) $ (10,962) $ 4,430 $ (1,459)
07/01/25 (2,989) (4,646) (4,097) 1,657 (549)
07/01/30 (22,570) (34,653) (26,897) 12,083 (7,756)
07/01/30 (22,570) (34,653) (26,897) 12,083 (7,756)
10/01/29 (996) (1,592) (1,156) 596 (436)
10/01/29 (816) (1,283) (938) 467 (345)
07/01/30 (4,458) (7,088) (4,805) 2,630 (2,283)
07/01/30 (4,458) (6,971) (4,761) 2,513 (2,210)
$ (66,848) $ (103,307) $ (80,513) $ 36,459 $ (22,794)
Fair Value as of 6/303
Change in Fair Value in FY

T H E M E T R O P O L I T A N W A T E R D I S T R I C T O F S O U T H E R N C A L I F O R N I A
NOTES TO BASIC FINANCIAL STATEMENTS (CONTINUED)
June 30, 2017 and 2016
52
Metropolitan has the following recurring fair value measurements as of June 30, 2017 and 2016:
Derivative instruments classified in Level 2 of the fair value hierarchy are valued using an income approach that considers benchmark interest rates, yield curves and credit spreads.
Pay-Fixed, Receive-Variable
Objective of the Swaps: In order to take advantage of low interest rates in the marketplace, Metropolitan entered into
eight separate pay-fixed, receive-variable interest rate swaps at costs that were less than what Metropolitan otherwise
would have paid to issue fixed rate debt in the tax-exempt municipal bond market.
Terms: The notional amounts of the swaps match the principal amounts of the associated debt in total.
Metropolitan’s swap agreements contain scheduled reductions to outstanding notional amounts that are expected to
approximately follow scheduled or anticipated reductions in the associated long-term debt.
Fair Values: At June 30, 2017, all pay-fixed, receive-variable swaps had a negative fair value. Because the coupons
on Metropolitan's variable rate bonds adjust to changing interest rates, the bonds do not have corresponding fair
value changes. The fair values of the swaps were estimated using the zero-coupon method and exclude accrued
interest. This method calculates the future net settlement payments required by the swap, assuming that the current
forward rates implied by the yield curve correctly anticipate future spot interest rates. These payments are then
discounted using spot rates implied by the current yield curve for hypothetical zero-coupon bonds due on the date
of each future net settlement on the swaps.
(Dollars in thousands)
Significant Significant
Other Other
Observable Observable
Associated Inputs Inputs
Bond Issue 6/30/2017 (Level 2) 6/30/2016 (Level 2)
2002 A Payor $ (7,991) (7,991) $ (12,421) $ (12,421)
2002 B Payor (2,989) (2,989) (4,646) (4,646)
2003 Payor C-1 C-3 (22,570) (22,570) (34,653) (34,653)
2003 Payor C-1 C-3 (22,570) (22,570) (34,653) (34,653)
2004 C Payor (996) (996) (1,592) (1,592)
2004 C Payor (816) (816) (1,283) (1,283)
2005 Payor (4,458) (4,458) (7,088) (7,088)
2005 Payor (4,458) (4,458) (6,971) (6,971)
Total swaps $ (66,848) $ (66,848) $ (103,307) $ (103,307)
Fair Value Measurements Using

T H E M E T R O P O L I T A N W A T E R D I S T R I C T O F S O U T H E R N C A L I F O R N I A
NOTES TO BASIC FINANCIAL STATEMENTS (CONTINUED)
June 30, 2017 and 2016
53
Credit Risks: As of June 30, 2017, Metropolitan was not exposed to credit risk on the outstanding pay-fixed,
receive-variable swaps that had negative fair values. However, should interest rates change and the fair values of the
swaps become positive, Metropolitan would be exposed to credit risk to each swap counterparty in the amount of
the derivatives' fair value. Should the counterparties to the transactions fail to perform according to the terms of the
swap contract, Metropolitan would face a maximum possible loss equal to the fair value of these swaps.
All swap agreements contain specific collateral requirements that are in effect for Metropolitan and the
counterparties. The swaps require different collateral levels based on credit ratings and the fair value of the swap.
Generally, the fair value threshold levels are also reduced as the credit ratings are reduced. Collateral on all swaps is
to be in the form of U.S. government securities that may be held by the party posting the collateral. Metropolitan
had no posted collateral as of June 30, 2017.
Each swap contains cross-default provisions that allow the nondefaulting party to accelerate and terminate all
outstanding transactions and to net the transactions’ fair values into a single sum to be owed by, or owed to, the
nondefaulting party.
As of June 30, 2017, Metropolitan has pay-fixed, receive-variable swap transactions with one counterparty in the
amount of $216.0 million or 43.8 percent of the notional amount of Metropolitan’s outstanding pay-fixed, receive-
variable swap transactions. This counterparty is rated Aa3/A+/AA- by Moody’s, Standard & Poor’s, and Fitch
Ratings, respectively.
Basis Risk: The interest rates on Metropolitan’s variable rate bonds are expected to be equivalent, but not
necessarily equal to the variable rate payments received from counterparties on pay-fixed, receive-variable interest
rate swaps. To the extent these variable payments differ, Metropolitan is exposed to basis risk. When the rates
received from the counterparties are less than the rates on variable rate bonds associated with the respective swap
transactions there is a basis loss. When the rates received from the counterparties are greater than the rates on
variable rate bonds associated with the respective swap transactions there is a basis gain. As of June 30, 2017, the
interest rates of the variable rate debt associated with these swap transactions range from 0.77 percent to
1.77 percent. Metropolitan’s variable rate payments received from the counterparties of these swaps ranged from
0.71 percent to 0.82 percent.
Termination Risk: Metropolitan may terminate any of the swaps if the other party fails to perform under the terms
of the swap agreements. If any of the swaps are terminated, the associated variable rate bonds would no longer
carry a synthetic fixed interest rate. Also, if at the time of termination the swap has a negative fair value,
Metropolitan would be liable to the counterparty for a payment equal to the swap’s fair value.
Tax Risk: As with other forms of variable rate exposure and the relationship between the taxable and tax-exempt
markets, Metropolitan is exposed to tax risk should tax-exempt interest rates on variable rate debt issued in
conjunction with the swaps rise faster than taxable interest rates received by the swap counterparties, due
particularly to reduced federal or state income tax rates, over the term of the swap agreement.

T H E M E T R O P O L I T A N W A T E R D I S T R I C T O F S O U T H E R N C A L I F O R N I A
NOTES TO BASIC FINANCIAL STATEMENTS (CONTINUED)
June 30, 2017 and 2016
54
(g) Swap Payments and Associated Debt
Using rates as of June 30, 2017, debt service requirements on Metropolitan’s swap-related variable rate debt and net
swap payments are as follows. As rates vary, variable rate bond interest payments and net swap payments will vary.
(h) Variable Rate Bonds
The variable rate bonds bear interest at daily and weekly rates ranging from 0.77 percent to 1.77 percent as of
June 30, 2017 and 0.36 percent to 1.00 percent as of June 30, 2016. Metropolitan can elect to change the interest
rate period of the bonds with certain limitations. With the exception of the Water Revenue Refunding Bonds, 2009
SIFMA Index Bonds Series A-2, 2011 SIFMA Index Bonds Series A-1, A-2, A-3, and A-4, 2012 SIFMA Index
Bonds Series B-1 and B-2, the bondholders have the right to tender bonds to the paying agent on any business day
with same day notice. The current terms of the 2009 SIFMA Index Bond Series A-2, and the 2011 SIFMA Index
Bonds Series A-1 and A-3, provide bondholders a right to tender bonds to the paying agent every 340 days and for
the 2011 SIFMA Index Bonds Series A-2 and A-4, and the 2012 SIFMA Index Bonds Series 2012 B-1 and B-2,
every three years. Metropolitan has entered into standby bond purchase agreements (SBPA) with commercial banks
to provide liquidity for three and two separate variable rate bond issues in the amount of $272.5 million and
$151.3 million as of June 30, 2017 and 2016, respectively. In addition, Metropolitan has ten and eleven series of
variable rate bonds in the amounts of $642.0 million and $876.4 million as of June 30, 2017 and 2016, respectively
that are not supported by an SBPA.
The Bank Bonds that would be issued under the SBPA would bear interest that is payable at a rate, depending on
the agreement, that is the higher of the “base rate”, which is based on the Fed Funds Rate plus 2.00% per annum,
or the Prime Rate plus 1.00% per annum, plus a spread of 7.0 percent, or LIBOR, plus a spread of 7.5 percent. The
principal of the Bank Bonds would be payable, depending on the agreement, either ten equal semi-annual
installments commencing 180 days after purchase by the bank, or in two equal semi-annual installments
commencing six months after purchase by the bank.
The $103.7 million 2016 Series B-1 and B-2 bonds have SBPAs that expire on September 19, 2019 and the
$80.0 million Water Revenue Bonds, 2017 Authorization, Series A, and the $88.8 million 2000 Series B-3, Water
Revenue Bonds, have SBPAs that expire on March 27, 2020. According to the provisions of the Paying Agent
Agreement for the bonds, the Paying Agent will draw on the SBPA two business days prior to the SBPA expiration
to redeem all outstanding bonds. Metropolitan is required to repay the bank in either ten or two semi-annual
installments commencing either 180 days or six months after the draw on the facility.
Interest Rate
(Dollars in thousands) Principal Interest Swaps, Net Total
Year ending June 30:
2018 $ — $ 5,825 $ 12,396 $ 18,221
2019 — 5,825 12,396 18,221
2020 — 5,825 12,396 18,221
2021 54,965 5,416 11,512 71,893
2022 32,715 4,861 10,327 47,903
2023-2027 270,020 16,106 34,084 320,210
2028-2031 135,930 2,019 4,207 142,156
Total $ 493,630 $ 45,877 $ 97,318 $ 636,825
Variable Rate Bonds

T H E M E T R O P O L I T A N W A T E R D I S T R I C T O F S O U T H E R N C A L I F O R N I A
NOTES TO BASIC FINANCIAL STATEMENTS (CONTINUED)
June 30, 2017 and 2016
55
For seven series of variable rate bonds not supported by SBPA in the amount of $537.3 million, if the purchase price
is not paid from the proceeds of remarketing or other funds, such bonds then will bear interest at a rate equal to the
lower of (i) 12.0 percent and (ii) the higher of 8.0 percent or Prime Rate plus 3.0 percent until purchased by
Metropolitan or redeemed pursuant to a special mandatory redemption. The principal amount of these new bonds
would be payable in three equal installments at 18 month increments from the conversion of the bonds to a fixed
rate.
The three series of self-liquidity variable rate bonds that were not supported by a SBPA at June 30, 2017 were the
$87.4 million, 2013 Series D, Special Variable Rate Water Revenue Refunding Bonds, the $38.5 million, 2014 Series
D, Special Variable Rate Water Revenue Refunding Bonds, and the $188.9 million, 2015 Series A-1 and A-2, Special
Variable Rate Water Revenue Refunding Bonds. At June 30, 2016, the outstanding self-liquidity variable rate bonds
that were not supported by a SBPA were the $87.4 million, 2013 Series D, Special Variable Rate Water Revenue
Refunding Bonds and the $63.6 million, 2014 Series D, Special Variable Rate Water Revenue Refunding Bonds.
These variable rate bonds outstanding at June 30, 2017 and 2016 had no long-term take out provisions therefore,
the entire principal amount of $314.8 million and $339.9 million, respectively, may be tendered for purchase upon
one week’s notice from bondholders. However, on July 1, 2015, Metropolitan entered into a Revolving Credit
Agreement (RCA), by which Metropolitan may borrow up to $180.0 million, to pay the purchase price (principal
and accrued interest) of any self-liquidity bonds tendered for purchase. The RCA permits repayment of any
borrowed funds over a term-out period beginning 120 days after the stated expiration date of June 24, 2018. As a
result of the RCA, only $134.8 million and $159.9 million of these self-liquidity bonds have been classified as
current liabilities as of June 30, 2017 and 2016, respectively.
Metropolitan has two series of taxable variable rate parity obligations, at June 30, 2017, the $125.0 million Taxable
Flexible Rate Refunding Notes, Series A-1 and the $125.0 million Taxable and Refunding Subseries 2017 Series B-1
Notes, pursuant to two Short-Term Revolving Credit Facilities with US Bank, and RBC. Both Notes pay a variable
rate at a basis point spread to One Month LIBOR. The US Bank Notes have maturity dates of April 5, 2019 and
April 5, 2020. The Short-Term Revolving Credit Facilities require US Bank and RBC to purchase refunding notes,
subject to certain terms and conditions, through the Facilities expiration date of April 5, 2019. The maturity date of
April 5, 2020 for the RBC Note will only be effective if RBC agrees, at its option, to extend the expiration of its
Credit Facility to April 5, 2020. In addition, at June 30, 2017, Metropolitan has one series of tax-exempt variable
rate parity obligations, the $12.3 million Tax-Exempt Flexible Rate Revolving Note, Series 2017 B-1, that pay a
variable rate at a basis point spread to 70 percent of One Month LIBOR, and matures on May 31, 2018.
(i) Long-term Debt Obligation Summary
Interest rates at June 30, 2017 on all outstanding fixed-rate obligations range from 0.943 percent to 6.947 percent.
Interest on the variable rate debt is reset either daily or weekly based upon market conditions. Future principal and
interest payments in accordance with the debt agreements as of June 30, 2017 are as follows:

T H E M E T R O P O L I T A N W A T E R D I S T R I C T O F S O U T H E R N C A L I F O R N I A
NOTES TO BASIC FINANCIAL STATEMENTS (CONTINUED)
June 30, 2017 and 2016
56
6. LONG-TERM LIABILITIES
Long-term liability activity for the fiscal years ended June 30, 2017 and 2016 is shown on the following table.
Payments on the bonds are made from the restricted debt service funds; other long-term debt, the off-aqueduct
power facilities obligation, and the compensated absences liability will be liquidated primarily with water revenues.
(Dollars in thousands) Principal Interest Total
Year ending June 30:
2018 $ 164,125 $ 177,391 $ 341,516
2019 161,155 171,792 332,947
2020 162,795 163,909 326,704
2021 153,375 154,899 308,274
2022 163,245 146,198 309,443
2023-2027 859,845 607,183 1,467,028
2028-2032 887,530 406,456 1,293,986
2033-2037 1,040,240 237,791 1,278,031
2038-2042 554,795 80,539 635,334
2043-2047 214,280 7,969 222,249
2048 15,505 27 15,532
$ 4,376,890 $ 2,154,154 $ 6,531,044
Unamortized bond discount and premium, net 202,848
Total debt 4,579,738
Less current portion (343,681)
Long-term portion of debt $ 4,236,057

T H E M E T R O P O L I T A N W A T E R D I S T R I C T O F S O U T H E R N C A L I F O R N I A
NOTES TO BASIC FINANCIAL STATEMENTS (CONTINUED)
June 30, 2017 and 2016
57
This page intentionally left blank.

T H E M E T R O P O L I T A N W A T E R D I S T R I C T O F S O U T H E R N C A L I F O R N I A
NOTES TO BASIC FINANCIAL STATEMENTS (CONTINUED)
June 30, 2017 and 2016
58
Maturity Range of(Dollars in thousands) Dates Interest Rates June 30, 2015 Additions
Waterworks general obligation refunding bonds (Note 5b):2009 Series A 3/1/16-3/1/28 3.75%-5.00% 33,485 —
2010 Series A 3/1/16-3/1/37 1.50%-5.00% 27,290 —
2014 Series A 3/1/16-3/1/21 2.00%-5.00% 49,645 —
Total general obligation and general obligation refunding bonds 110,420 —
Water revenue bonds (Note 5c):2000 Series B-1-B-4 7/1/29-7/1/35 Variable 177,600 —
2005 Series A 7/1/28-7/1/35 5.00% 75,620 —
2005 Series C 7/1/28-7/1/35 4.50%-5.00% 175,000 —
2006 Series A 7/1/15-7/1/37 4.00%-5.00% 391,355 —
2008 Series A 1/1/16-1/1/39 3.00%-5.00% 183,525 —
2008 Series B 7/1/15-7/1/20 2.50%-4.00% 15,035 —
2008 Series C 7/1/26-7/1/39 5.752%-6.250% 78,385 —
2008 Series D 7/1/21-7/1/39 5.906%-6.538% 250,000 —
2010 Series A 7/1/40 6.947% 250,000 —
2015 Series A 7/1/18-7/1/45 4.00%--5.00% — 208,255
2016 Subordinate Series A 7/01/41-7/1/45 Variable — —
2017 Series A 7/1/41-7/1/47 Variable — —
Water revenue refunding bonds (Note 5d):1993 Series A-B 8/14/15-7/1/21 5.75% 101,840 —
2006 Series B 7/1/30-7/1/37 4.375%-5.00% 24,055 —
2008 Series A-1-A-2 7/1/17-7/1/37 Variable 62,465 —
2008 Series B 7/1/15-7/1/22 4.00%-5.00% 127,200 —
2008 Series C 7/1/15-7/1/23 3.40%-5.00% 41,800 —
2009 Series A-1-A-2 7/1/20-7/1/30 Variable 104,180 —
2009 Series B 7/1/20-7/1/30 4.00%-5.25% 106,690 —
2009 Series C 7/1/29-7/1/35 5.00% 91,165 —
2009 Series D 7/1/15-7/1/21 2.75%-5.00% 64,740 —
2009 Series E 7/1/15-7/1/20 3.875%-5.00% 18,355 —
2010 Series B 7/1/15-7/1/28 2.25%-5.00% 84,175 —
2011 Series A-1-A-4 7/1/16-7/1/36 Variable 228,875 —
2011 Series B 7/1/15-7/1/20 3.00%-5.00% 73,230 —
2011 Series C 10/1/15-10/1/36 2.25%-4.00% 156,100 —
2012 Series A 10/1/23-10/1/36 3.25%-5.00% 181,180 —
2012 Series B 7/1/23-7/1/27 Variable 98,585 —
2012 Series C 7/1/16-7/1/21 3.00%-5.00% 190,600 —
2012 Series D 7/1/15-7/1/16 0.943%-1.28% 19,605 —
2012 Series E 7/1/27-7/1/37 2.50%-3.50% 61,040 —
2012 Series F 7/1/15-7/1/28 3.00%-5.00% 60,035 —
2012 Series G 7/1/20-7/1/31 3.00%-5.00% 111,890 —
2013 Series D 7/1/29-7/1/35 Variable 87,445 —
2013 Series E 7/1/20-7/1/30 Variable 104,820 —
2014 Series A 7/1/18-7/1/21 4.00%-5.00% 95,935 —
2014 Series B 7/1/18 1.49% 10,575 —
2014 Series C 7/1/22-7/1/27 3.00% 30,335 —
2014 Series D 7/1/15-7/1/32 Variable 79,770 —
2014 Series E 7/1/21-7/1/24 3.50%-5.00% 86,060 —
2014 Series G 7/1/37 2.00%-3.00% 57,840 —
2015 Series A-1, A-2 7/1/35 Variable — 188,900
2016 Series A 7/1/28-7/1/37 2.00%-5.00% — 239,455
2016 Series B-1, B-2 7/1/25-7/1/37 Variable — —
2017 Subordinate Series A 7/1/20-7/1/27 2.00%-2.50% — —
Total water revenue and water revenue refunding bonds 4,157,105 636,610
Other long-term debt (Note 5e):State revolving fund loans 7/1/15-7/1/24 2.39% 10,684 —
Unamortized bond discount and premiums, net 200,028 75,220
Total long-term debt 4,478,237 711,830
Other long-term liabilities (see table next page) 258,382 84,386Total long-term liabilities $ 4,736,619 $ 796,216

T H E M E T R O P O L I T A N W A T E R D I S T R I C T O F S O U T H E R N C A L I F O R N I A
NOTES TO BASIC FINANCIAL STATEMENTS (CONTINUED)
June 30, 2017 and 2016
59
Amounts Due Within
Reductions June 30, 2016 Additions Reductions June 30, 2017 One Year
(2,740) 30,745 — (3,745) 27,000 (6,135)(4,225) 23,065 — (4,330) 18,735 —
(10,590) 39,055 — (9,885) 29,170 (8,170)(17,555) 92,865 — (17,960) 74,905 (14,305)
(88,800) 88,800 — — 88,800 — (75,620) — — — — —
(175,000) — — — — — (87,120) 304,235 — (39,760) 264,475 (7,245)(4,410) 179,115 — (4,585) 174,530 (4,735)(2,300) 12,735 — (2,375) 10,360 (2,455)
— 78,385 — — 78,385 — — 250,000 — — 250,000 — — 250,000 — — 250,000 — — 208,255 — — 208,255 — — — 175,000 — 175,000 — — — 80,000 — 80,000 —
(15,300) 86,540 — (16,200) 70,340 (21,200)(24,055) — — — — —
— 62,465 — (62,465) — — (220) 126,980 — (7,150) 119,830 (7,485)
(7,100) 34,700 — (7,445) 27,255 (7,785)— 104,180 — (92,010) 12,170 (12,170)— 106,690 — — 106,690 — — 91,165 — — 91,165 —
(5,880) 58,860 — (8,855) 50,005 (9,265)(2,765) 15,590 — (2,875) 12,715 (2,985)(4,845) 79,330 — (5,005) 74,325 (5,170)
— 228,875 — (12,460) 216,415 (440)(37,470) 35,760 — (30,680) 5,080 (1,195)(8,165) 147,935 — (500) 147,435 (9,155)
— 181,180 — — 181,180 — — 98,585 — — 98,585 — — 190,600 — (14,965) 175,635 (70,705)
(19,000) 605 — (605) — — (29,820) 31,220 — (31,220) — —
(700) 59,335 — — 59,335 — — 111,890 — — 111,890 — — 87,445 — — 87,445 (87,445)— 104,820 — (104,820) — — — 95,935 — — 95,935 — — 10,575 — — 10,575 — — 30,335 — — 30,335 —
(16,195) 63,575 — (25,110) 38,465 (38,465)— 86,060 — — 86,060 — — 57,840 — (14,565) 43,275 — — 188,900 — — 188,900 (8,900)— 239,455 — — 239,455 — — — 103,670 — 103,670 — — — 238,015 — 238,015 —
(604,765) 4,188,950 596,685 (483,650) 4,301,985 (296,800)
(1,531) 9,153 — (9,153) — — (42,781) 232,467 3,815 (33,434) 202,848 (32,576)
(666,632) 4,523,435 600,500 (544,197) 4,579,738 (343,681)(60,306) 282,462 49,305 (141,197) 190,570 (34,474)
$ (726,938) $ 4,805,897 $ 649,805 $ (685,394) $ 4,770,308 $ (378,155)

T H E M E T R O P O L I T A N W A T E R D I S T R I C T O F S O U T H E R N C A L I F O R N I A
NOTES TO BASIC FINANCIAL STATEMENTS (CONTINUED)
June 30, 2017 and 2016
60
7. PENSION PLAN
(a) General Information about the Pension Plan
Plan Description All full-time Metropolitan employees are required to participate in Metropolitan’s Miscellaneous Plan with
CalPERS, an agent multiple-employer public employee defined benefit pension plan. CalPERS acts as a common
investment and administrative agent for participating public entities within the State of California. A menu of
benefit provisions as well as other requirements is established by State statutes within the Public Employee’s
Retirement Law. Metropolitan selects optional benefit provisions from the benefit menu by contract with CalPERS
and adopts those benefits through Board approval. CalPERS issues a separate comprehensive annual report. Copies
of CalPERS’ annual financial report may be obtained from its Executive Office, 400 Q Street, Sacramento, CA
95811.
Benefits Provided CalPERS provides retirement and disability benefits, annual cost-of-living adjustments, and death benefits to plan
members and beneficiaries. Benefits are based on years of credited service, equal to one year of full-time
employment. Employees hired prior to January 1, 2013 (Classic members) with five years of total service are
eligible to retire at age 50 with statutorily reduced benefits; employees hired after January 1, 2013 (PEPRA
members) with at least five years of credited service are eligible to retire at age 52 with statutorily reduced benefits.
All members are eligible for improved non-industrial disability benefits after five years of service. The death benefit
is one of the following: the Basic Death Benefit, the 1959 Survivor Benefit, or the Optional Settlement 2W Death
Benefit.
(Dollars in thousands)
June 30,
2015
June 30,
2016
June 30,
2017
Amounts
Due
Within
One Year
Off-aqueduct power
facilities (Note 9f) $ 17,993 $ — $ (3,649) $ 14,344 $ — $ (3,512) $ 10,832 $ 1,203
Compensated absences 46,464 20,060 (19,627) 46,897 19,353 (19,927) 46,323 19,800
Customer deposits and
trust funds 89,505 36,211 (31,958) 93,758 24,414 (72,415) 45,757 5,455
Workers' Compensation
and third party
claims (Note 14) 19,798 5,321 (5,072) 20,047 4,514 (8,884) 15,677 5,109
Fair value of interest
rate swaps (Note 5f) 80,513 22,794 — 103,307 — (36,459) 66,848 —
Other long-term
liabilities 4,109 — — 4,109 1,024 — 5,133 2,907
Total other long-term liabilities $ 258,382 $ 84,386 $ (60,306) $ 282,462 $ 49,305 $ (141,197) $ 190,570 $ 34,474
Additions Reductions Additions Reductions

T H E M E T R O P O L I T A N W A T E R D I S T R I C T O F S O U T H E R N C A L I F O R N I A
NOTES TO BASIC FINANCIAL STATEMENTS (CONTINUED)
June 30, 2017 and 2016
61
Contribution Description Section 20814(c) of the California Public Employees’ Retirement Law (PERL) requires that the employer
contribution rates for all public employers be determined on an annual basis by the actuary and shall be effective on
the July 1 following notice of a change in the rate. The total plan contributions are determined through CalPERS’
annual actuarial valuation process. The actuarially determined rate is the estimated amount necessary to finance the
costs of benefits earned by employees during the year, with an additional amount to finance any unfunded accrued
liability. Metropolitan is required to contribute the difference between the actuarially determined rate and the
contribution rate of employees. Metropolitan’s total employer contributions were $38.4 million and $34.3 million
for the fiscal years ended June 30, 2017 and 2016, respectively. The employee contribution rate was 7.0 percent of
annual pay for Classic members and 6.75 percent for PEPRA members for the measurement periods ended
June 30, 2016 and 2015. Metropolitan contributes the full 7.0 percent for Classic members while PEPRA members
contribute the full 6.75 percent. At June 30, 2017 and 2016, Metropolitan’s pickup of the employee’s 7.0 percent
share were $12.0 million and $12.4 million, respectively. Payments made by Metropolitan to satisfy contribution
requirements that are identified by the pension plan terms as plan member contribution requirements are classified
as plan member contributions.
The Plans’ provisions and benefits in effect at June 30, 2017 and 2016 are summarized as follows:
The following employees were covered by the benefit terms at June 30, 2017 and 2016:
Prior to On or after
Hire date January 1, 2013 January 1, 2013
Benefit formula 2.0% @ 55 2.0% @ 62
Benefit vesting schedule 5 years 5 years
Benefit payments Monthly for life Monthly for life
Final average compensation period 12 months 36 months
Sick leave credit Yes Yes
Retirement age 50-67 52-67
Monthly benefits as a % of eligible compensation 1.426% to 2.418% 1.0% to 2.5%
Cost of living adjustment 2.0% 2.0%
Required employee contribution rates
2017 7.0% 6.75%
2016 7.0% 6.75%
Required employer contribution rates
2017 20.747% 20.747%
2016 19.738% 19.738%
Miscellaneous
2017 2016
Inactive employees (or their beneficiaries) currently receiving benefits 1,976 1,907
Inactive employees entitled to but not yet receiving benefits 978 1,020
Active members 1,767 1,756
Total 4,721 4,683

T H E M E T R O P O L I T A N W A T E R D I S T R I C T O F S O U T H E R N C A L I F O R N I A
NOTES TO BASIC FINANCIAL STATEMENTS (CONTINUED)
June 30, 2017 and 2016
62
(b) Actuarial Methods and Assumptions Used to Determine Total Pension Liability
Metropolitan’s net pension liability is measured as the total pension liability, less the pension plan’s fiduciary net
position. The net pension liability at June 30, 2017 and 2016 was measured as of June 30, 2016 and 2015,
respectively, using an annual actuarial valuation as of June 30, 2015 and 2014, respectively. The actuarial valuations as
of June 30, 2015 and 2014 were rolled forward to June 30, 2016 and 2015, respectively, using standard update
procedures.
The total pension liabilities for the measurement dates of June 30, 2016 and 2015 were based on the following
actuarial methods and assumptions:
1 The mortality table used was developed based on CalPERS’ specific data. The table includes 20 years of mortality improvements using Society of
Actuaries Scale BB.
All other actuarial assumptions used in the June 30, 2015 and 2014 valuations were based on the results of an
actuarial experience study for the period from 1997 to 2011, including updates to salary increase, mortality and
retirement rates. The Experience Study report can be obtained at CalPERS’ website under Forms and Publications.
Change of Assumptions
There were no changes of assumptions.
Discount Rate
The discount rate used to measure the total pension liability at June 30, 2016 and 2015 measurement dates was
7.65 percent. To determine whether the municipal bond rate should be used in the calculation of a discount rate for
each plan, CalPERS stress tested plans that would most likely result in a discount rate that would be different from
the actuarially assumed discount rate. Based on the testing of the plans, the tests revealed the assets would not run
out. Therefore, the discount rate used at June 30, 2016 and 2015 measurement dates was appropriate and the use of
the municipal bond rate calculation was not deemed necessary. The long-term expected discount rate of
7.65 percent at June 30, 2016 and 2015 measurement dates was applied to all plans in the Public Employees
Retirement Fund. The cash flows used in the testing were developed assuming that both members and employers
will make their required contributions on time and as scheduled in all future years. The stress test results are
presented in a detailed report called “GASB Crossover Testing Report” that can be obtained at CalPERS’ website
under the GASB 68 section.
The long-term expected rate of return on pension plan investments was determined using a building-block method
in which best-estimate ranges of expected future real rates of return (expected returns, net of pension plan
investment expense and inflation) are developed for each major asset class.
Actuarial cost method
Actuarial assumptions
Discount rate
Inflation
Salary increases
Mortality rate table1
Post-retirement benefit
increase
Entry Age Normal in accordance with the requirements of GASB 68
7.65%
2.75%
Varies by entry age and service
Derived using CalPERS' Membership Data for all Funds
Contract COLA up to 2.75% until purchasing power protection allowance
floor on purchasing power applies, 2.75% thereafter

T H E M E T R O P O L I T A N W A T E R D I S T R I C T O F S O U T H E R N C A L I F O R N I A
NOTES TO BASIC FINANCIAL STATEMENTS (CONTINUED)
June 30, 2017 and 2016
63
In determining the long-term expected rate of return, CalPERS took into account both short-term and long-term
market return expectations as well as the expected pension fund cash flows. Taking into account historical returns
of all the funds’ asset classes (which includes the agent plan and two cost-sharing plans), expected compound
(geometric) returns were calculated over the short-term (first 10 years) and the long-term (11-60 years) using a
building-block approach. Using the expected nominal returns for both short-term and long-term, the present value
of benefits was calculated for each fund. The expected rate of return was set by calculating the single equivalent
expected return that arrived at the same present value of benefits for cash flows as the one calculated using both
short-term and long-term returns. The expected rate of return was then set equivalent to the single equivalent rate
calculated above and rounded down to the nearest one quarter of one percent.
The table below reflects long-term expected real rate of return by asset class. The rate of return was calculated using
the capital market assumptions applied to determine the discount rate and asset allocation. The target allocation
shown was adopted by the Board effective on July 1, 2015.
1 An expected inflation of 2.5 percent used for this period 2 An expected inflation of 3.0 percent used for this period
Asset Class 2016 2015 2016 2015 2016 2015
Global Equity 51.0 % 51.0 % 5.25 % 5.25 % 5.71 % 5.71 %
Global Fixed Income 20.0 19.0 0.99 0.99 2.43 2.43
Inflation Sensitive 6.0 6.0 0.45 0.45 3.36 3.36
Private Equity 10.0 10.0 6.83 6.83 6.95 6.95
Real Estate 10.0 10.0 4.50 4.50 5.13 5.13
Infrastructure and Forestland 2.0 2.0 4.50 4.50 5.09 5.09
Liquidity 1.0 2.0 (0.55) (0.55) (1.05) (1.05)
Total 100.0 % 100.0 %
Current Target
Allocation Real Return Years 1-10 1
Real Return Years 11+ 2

T H E M E T R O P O L I T A N W A T E R D I S T R I C T O F S O U T H E R N C A L I F O R N I A
NOTES TO BASIC FINANCIAL STATEMENTS (CONTINUED)
June 30, 2017 and 2016
64
(c) Changes in the Net Pension Liability
The following tables show the changes in net pension liability recognized over the measurement periods of June 30,
2016 and 2015:
1 The fiduciary net position includes receivables for employee service buybacks, deficiency reserves, fiduciary self-insurance and OPEB expense.
Total Pension
Plan Fiduciary
Net Position
Net Pension
Liability
(Dollars in thousands) Liability (a) (b) (c) = (a) - (b)
Balance at June 30, 2015 (VD)1
$ 2,038,577 $ 1,559,022 $ 479,555
Changes recognized for the measurement period:
Service cost 29,142 — 29,142
Interest on the total pension liability 152,500 — 152,500
Differences between expected and actual
experience (12,754) — (12,754)
Changes of assumptions — — -
Contributions from the employer — 38,393 (38,393)
Contributions from employees — 15,034 (15,034)
Net investment income — 8,304 (8,304)
Benefit payments, including refunds of
employee contributions (92,401) (92,401) —
Administrative expenses — (950) 950
Net Changes $ 76,487 $ (31,620) $ 108,107
Balance at June 30, 2016 (MD)1
$ 2,115,064 $ 1,527,402 $ 587,662
Increase (Decrease)

T H E M E T R O P O L I T A N W A T E R D I S T R I C T O F S O U T H E R N C A L I F O R N I A
NOTES TO BASIC FINANCIAL STATEMENTS (CONTINUED)
June 30, 2017 and 2016
65
1 The fiduciary net position includes receivables for employee service buybacks, deficiency reserves, fiduciary self-insurance and OPEB expense.
Sensitivity of the Net Pension Liability to Changes in the Discount Rate
The following presents the net pension liability of the Plan as of the June 30, 2016 and 2015 measurement dates,
calculated using the discount rate of 7.65 percent. The table also shows what the net pension liability would be if it
were calculated using a discount rate that is 1 percentage-point lower or 1 percentage-point higher than the current
rate:
Pension Plan Fiduciary Net Position Detailed information about the pension plan’s fiduciary net position is available in the separately issued CalPERS
financial report.
Total Pension
Plan Fiduciary
Net Position
Net Pension
Liability
(Dollars in thousands) Liability (a) (b) (c) = (a) - (b)
Balance at June 30, 2014 (VD)1
$ 1,969,332 $ 1,562,538 $ 406,794
Changes recognized for the measurement period:
Service cost 28,890 — 28,890
Interest on the total pension liability 146,852 — 146,852
Differences between expected and actual
experience 14,665 — 14,665
Changes of assumptions (35,008) — (35,008)
Contributions from the employer — 34,306 (34,306)
Contributions from employees — 14,787 (14,787)
Net investment income — 35,301 (35,301)
Benefit payments, including refunds of
employee contributions (86,154) (86,154) —
Administrative expenses — (1,756) 1,756
Net Changes $ 69,245 $ (3,516) $ 72,761
Balance at June 30, 2015 (MD)1
$ 2,038,577 $ 1,559,022 $ 479,555
Increase (Decrease)
(Dollars in thousands) 2016 2015
Discount Rate -1% 6.65 % 6.65 %
Net Pension Liability $ 856,334 $ 743,272
Current Discount Rate 7.65 % 7.65 %
Net Pension Liability $ 587,662 $ 479,555
Discount Rate +1% 8.65 % 8.65 %
Net Pension Liability $ 362,255 $ 258,415

T H E M E T R O P O L I T A N W A T E R D I S T R I C T O F S O U T H E R N C A L I F O R N I A
NOTES TO BASIC FINANCIAL STATEMENTS (CONTINUED)
June 30, 2017 and 2016
66
Subsequent Events
There were no subsequent events that would materially affect the results presented in this disclosure.
Amortization of Deferred Outflows and Deferred Inflows of Resources
Under GASB 68, gains and losses related to changes in total pension liability and fiduciary net position are
recognized in pension expense systematically over time.
The first amortized amounts are recognized in pension expense for the year the gain or loss occurs. The remaining
amounts are categorized as deferred outflows and deferred inflows of resources related to pensions and are to be
recognized in future pension expense.
The expected average remaining service lifetime (EARSL) is calculated by dividing the total future service years by
the total number of plan participants (active, inactive, and retired). The EARSL for the Plan for the period ending
June 30, 2016 is 3.2 years, which was obtained by dividing the total service years of 15,059 (the sum of remaining
service lifetimes of the active employees) by 4,721 (the total number of participants: active, inactive, and retired).
The EARSL for the Plan for the June 30, 2015 measurement date is 3.2 years, which was obtained by dividing the
total service years of 14,924 by the total number of participants of 4,683. Inactive employees and retirees have
remaining service lifetimes equal to zero and total future service is based on the members’ probability of
decrementing due to an event other than receiving a cash refund.
(d) Pension Expense, Deferred Outflows and Deferred Inflows of Resources Related to Pensions
For the year ended June 30, 2017 and 2016, Metropolitan recognized pension expense of $6.7 million and
$23.7 million, respectively. At June 30, 2017 and 2016, Metropolitan has deferred outflows and inflows of resources
related to pensions as follows:
The amortization period differs depending on the source of the gain or loss:
Net difference between projected
and actual earnings on penson
plan investments
All other amounts
5 year straight-line amortization
Straight-line amortization over the average expected remaining
service lives of all members that are provided with benefits
(active, inactive, and retired) as of the beginning of the
measurement period

T H E M E T R O P O L I T A N W A T E R D I S T R I C T O F S O U T H E R N C A L I F O R N I A
NOTES TO BASIC FINANCIAL STATEMENTS (CONTINUED)
June 30, 2017 and 2016
67
The amounts above are net of outflows and inflows recognized in the pension expense for the fiscal year ended
June 30, 2017 and 2016. At June 30, 2017 and 2016, the deferred outflows of resources related to contributions
subsequent to the measurement date of $42.8 million and $38.4 million, respectively, will be/was recognized as a
reduction of the net pension liability in the fiscal years ended June 30, 2018 and 2017, respectively.
The net differences between projected and actual earnings on pension plan investments, difference between
expected and actual experience, and changes of assumptions will be recognized in future pension expense as
follows:
8. POSTEMPLOYMENT BENEFITS OTHER THAN PENSIONS (OPEB)
(a) Plan Description
Through CalPERS, Metropolitan offers medical insurance to active and retired employees, as well as their qualified
dependents under the Public Employees’ Medical and Hospital Care Act (PEMHCA). Under PEMHCA, health
coverage for the employee continues into retirement. Current plans offered are PERS Care PPO, PERS Choice
PPO, PERS Select PPO, Blue Shield HMO, and Kaiser HMO. Metropolitan participates in the CalPERS California
Employers’ Retiree Trust (CERBT) Fund, which is an agent multiple-employer plan available to employers to pre-
fund OPEB benefits. Benefit provisions are established through negotiations between Metropolitan and its various
bargaining units, which also apply to retirees. This benefit was provided to 1,655 and 1,572 retired Metropolitan
employees at June 30, 2017 and 2016, respectively. CalPERS issues a separate comprehensive annual report that
includes financial statements for its CERBT Fund. Copies of CalPERS’ annual financial report may be obtained
from its Executive Office, 400 Q Street, Sacramento, CA 95811.
(Dollars in thousands) 2017 2016 2017 2016
Pension contributions subsequent to
measurement date $ 42,820 $ 38,393 $ — $ —
Differences between expected and actual
experience 5,500 10,082 (8,768) —
Changes of assumptions — — (13,128) (24,068)
Net difference between projected and actual
earnings on pension plan investments 82,026 — — (16,053)
Total $ 130,346 $ 48,475 $ (21,896) $ (40,121)
Deferred Outflows
of Resources
Deferred Inflows
of Resources
Deferred
of Resources
Fiscal year ending June 30,
2018 $ 627,759
2019 5,713,430
2020 37,478,386
2021 21,809,992
2022 —
Outflows/(Inflows)

T H E M E T R O P O L I T A N W A T E R D I S T R I C T O F S O U T H E R N C A L I F O R N I A
NOTES TO BASIC FINANCIAL STATEMENTS (CONTINUED)
June 30, 2017 and 2016
68
(b) Funding Policy
Contribution requirements are negotiated between Metropolitan and its various bargaining units. During fiscal
year 2017, Metropolitan contributed up to 100 percent of Blue Shield Access + HMO Bay area regional basic plan
rate for represented retirees and up to 90 percent of the PERS Care PPO Los Angeles regional basic plan rate for
unrepresented retirees. During fiscal years 2017 and 2016, Metropolitan contributed, net of participant
contributions as determined by CalPERS, $29.3 million and $23.1 million, respectively.
(c) Annual OPEB Cost and Net OPEB Obligation
Metropolitan’s annual other postemployment benefit (OPEB) cost is calculated based on the ARC of the employer,
an amount actuarially determined in accordance with the parameters of GASB Statement 45. The ARC represents a
level of funding that, if paid on an ongoing basis, is projected to cover normal cost each year and amortize any
unfunded actuarial liabilities over a defined period. In fiscal year 2008, a 30-year fresh start amortization replaced
the previous fiscal year’s 20-year amortization period. Gains and losses were amortized over an open 15-year period.
The annual OPEB cost and net OPEB obligation at June 30, 2017, and the two preceding fiscal years, were as
follows:
For fiscal years 2017 and 2016, Metropolitan’s annual OPEB cost was $29.1 million and $23.1 million, respectively.
In fiscal years 2017 and 2016, Metropolitan contributed $29.3 million and $23.1 million to the OPEB trust, which
included the pay-as-you-go amounts of $15.2 million and $13.9 million, respectively. In fiscal year 2015,
Metropolitan contributed $66.5 million to the OPEB trust in addition to the pay-as-you-go amount of $13.0 million.
These contributions represented 100.5, 99.9, and 287.4 percent of the annual OPEB cost in fiscal years 2017, 2016,
and 2015, respectively. Adjustments to the ARC include amortization of the unfunded UAAL and actuarial gains
and losses. The amortization period for the unfunded UAAL is 23 years closed and the amortization period of
actuarial gains and losses is 15 years closed. The required contribution for fiscal year 2017 was based on the June 30,
2015 actuarial valuation using the entry-age-normal actuarial cost method with contributions determined as a level
percent of pay. The actuarial assumptions included (a) a 7.25 percent investment rate of return, (b) a 3.0 percent
inflation component, and (c) healthcare cost trend rates as follows: (i) Medicare – starting at 7.2 percent, grading
down to 5.0 percent over five years, (ii) Non-Medicare – starting at 7.0 percent, grading down to 5.0 percent over
five years. The required contribution for fiscal year 2016 was based on the June 30, 2013 actuarial valuation using
the entry-age-normal actuarial cost method with contributions determined as a level percent of pay. The actuarial
assumptions included (a) a 7.25 percent investment rate of return, (b) a 3.0 percent inflation component, and
(c) healthcare cost trend rates as follows: (i) Medicare – starting at 7.8 percent, grading down to 5.0 percent over six
years, (ii) Non-Medicare – starting at 7.50 percent, grading down to 5.0 percent over six years. The assumptions
(Dollars in Thousands) 2017 2016 2015
Annual required contribution $ 29,272 $ 23,096 $ 29,457
Interest on net OPEB obligation 6,057 6,098 13,317
Adjustment to annual required contribution (6,205) (6,068) (15,126)
Annual OPEB cost 29,124 23,126 27,648
Contributions made (29,272) (23,096) (79,457)
(Decrease) increase in net OPEB obligation (148) 30 (51,809)
Net OPEB obligation, beginning of year 83,544 83,514 135,323
Net OPEB obligation, end of year $ 83,396 $ 83,544 $ 83,514
June 30,

T H E M E T R O P O L I T A N W A T E R D I S T R I C T O F S O U T H E R N C A L I F O R N I A
NOTES TO BASIC FINANCIAL STATEMENTS (CONTINUED)
June 30, 2017 and 2016
69
used in the actuarial valuations are subject to future revisions as actual results are compared to past expectations and
new assumptions are made about the future.
(d) Funded Status and Funding Progress
The funded status of the plan at June 30, 2015, was as follows:
Actuarial valuations of the ongoing plan involve estimates of the value of reported amounts and assumptions about
the probability of occurrence of events far into the future. Examples include assumptions about future employment,
mortality, and the healthcare cost trend. Projections of benefits for financial reporting purposes are based on the
substantive plan (the plan as understood by the employer and the plan members) and include the types of benefits
provided at the time of each valuation and the historical pattern of sharing of benefit costs between the employer
and plan members to that point. The actuarial methods and assumptions used include techniques that are designed
to reduce the effects of short-term volatility in actuarial accrued liabilities and the actuarial value of assets,
consistent with the long-term perspective of the calculations.
The schedule of funding progress, presented as RSI following the notes to basic financial statements, presents
multiyear trend information that shows whether the actuarial value of plan assets is increasing or decreasing over
time relative to the actuarial accrued liabilities for benefits.
9. COMMITMENTS AND CONTINGENCIES
(a) State Water Contract (see Note 10)
Estimates of Metropolitan’s share of the projected fixed costs of the State Water Project (SWP) are provided
annually by the State. The estimates are subject to future increases or decreases resulting from changes in planned
facilities, refinements in cost estimates, and inflation. During the next five years, payments under the State Water
Contract, exclusive of variable power costs, are currently estimated by the State to be as follows:
(Dollars in thousands)
Actuarial accrued liability (AAL) $ 423,420
Actuarial value of plan assets 164,669
Unfunded actuarial accrued liability (UAAL) $ 258,751
Funded ratio (actuarial value of plan assets/AAL) 38.9%
Covered payroll (active plan members) $ 214,476
UAAL as a percentage of covered payroll 120.6%
State Water
Contract Payments
Year ending June 30:
2018 $ 432,439,455
2019 448,303,024
2020 463,444,213
2021 458,433,243
2022 455,875,879

T H E M E T R O P O L I T A N W A T E R D I S T R I C T O F S O U T H E R N C A L I F O R N I A
NOTES TO BASIC FINANCIAL STATEMENTS (CONTINUED)
June 30, 2017 and 2016
70
According to the State’s latest estimates, Metropolitan’s long-term commitments under the contract, for capital and
minimum operations and maintenance costs, including interest to the year 2035, are as follows:
Metropolitan intends to exercise its option to extend its agreement with the State through 2052, which will result in
annual minimum operations and maintenance costs through 2052. In addition, the amounts shown above do not
contain any escalation for inflation, are subject to significant variation over time because the amounts are based on a
number of assumptions, and are contingent on future events. None of the estimated long-term commitments, other
than the $10.8 million obligation related to loss accruals on certain-off aqueduct power facilities (see Note 9f), are
recorded as liabilities in the accompanying basic financial statements.
(b) Bay/Delta Regulatory and Planning Activities
The State Water Resources Control Board (State Board) is the agency responsible for setting water quality standards
and administering water rights throughout California. Decisions of the State Board can affect the availability of
water to Metropolitan and other water users throughout California. The State Board exercises its regulatory
authority over Bay/Delta watershed supplies by means of public proceedings leading to regulations and decisions.
In September 2006, then Governor Schwarzenegger established a Delta Vision Process to identify a strategy for
managing the Delta as a sustainable resource. The process was tied to legislation that created a Blue Ribbon Task
Force (BRTF) and cabinet-level committee (Delta Vision Committee) tasked with developing a durable vision for
sustainable management of the Delta over the long-term which addressed a full array of issues, including land use,
infrastructure, flood protection, and natural resources including water supply. The BRTF released its final Delta
Vision Strategic Plan in October 2008 and a final implementation report was submitted to the Governor in
January 2009. Subsequently, the Delta Reform Act of 2009 was enacted, which created the Delta Stewardship
Council (DSC), a seven member appointed body charged with developing a Delta Plan to support carrying out the
Delta Vision, which the DSC completed on September 1, 2013. Currently, the DSC is considering amendments to
the Delta Plan in areas of Delta Conveyance, System Storage, and the Operation of Both. Also, the DSC proposed
Delta Levees prioritization strategy is being advanced as a Delta Plan amendment. All proposed Delta Plan
amendments are now undergoing the environmental review process.
The Bay Delta Conservation Plan (BDCP), which began in 2007, is a voluntary collaboration of state, federal, and
local water agencies, state and federal fish agencies, environmental organizations, and other interested parties to
provide a comprehensive habitat conservation and restoration program for the Delta. In addition, the BDCP would
provide the basis for permits under federal and state endangered species laws for activities covered by the plan
based on the best available science, identified sources of funding, and an adaptive management and monitoring
program. On April 30, 2015, the state announced its intent to include new alternatives separating the conveyance
State Water
Long-Term
Commitments
Transportation facilities $ 4,262,467,697
Conservation facilities 2,390,270,508
Off-aqueduct power facilities (see Note 9f) 9,264,191
East Branch enlargement 409,869,817
Revenue bond surcharge 741,194,673
Total long-term SWP contract commitments $ 7,813,066,886

T H E M E T R O P O L I T A N W A T E R D I S T R I C T O F S O U T H E R N C A L I F O R N I A
NOTES TO BASIC FINANCIAL STATEMENTS (CONTINUED)
June 30, 2017 and 2016
71
facilities and habitat restoration measures into two separate permitting efforts namely: California WaterFix and
California EcoRestore. Under the California WaterFix, the new water conveyance facilities with proposed design
changes would be constructed and operated. With the California EcoRestore, the focus would be on environmental
restoration programs. After two public review drafts and extensive public comment periods, the final environmental
document for the California WaterFix was released on December 22, 2016. This document ultimately proposed the
California WaterFix as the best option for meeting the State’s co-equal goals and ensuring water supply reliability
and ecosystem restoration while minimizing environmental impact. After extensive consultation with the California
Department of Water Resources (DWR) and U.S. Bureau of Reclamation (Reclamation), the National Marine
Fisheries Service (NOAA Fisheries) and U.S. Fish and Wildlife Service (USFWS) have released their biological
opinions for the proposed construction and operation of California WaterFix. These agencies are responsible for
the protection of species listed under the U.S. Endangered Species Act (ESA). Both biological opinions found the
construction and operation of California WaterFix as proposed would not jeopardize the continued existence of
ESA-listed species or destroy or adversely modify critical habitat for those species. Action on the final
Environmental Impact Report/Environmental Impact Statement (EIR/EIS) is expected in 2017, since the action
follows the approval of the biological opinions. The permits under the State Endangered Species Act are expected
shortly after the State action on the EIR.
(c) Imperial Irrigation District
As of June 30, 2017, Metropolitan had advanced to the Imperial Irrigation District (IID) a total of $318.2 million
for construction costs, operations and maintenance costs, and indirect costs of the conservation projects.
Metropolitan remains obligated to pay IID for actual operation and maintenance costs for the remainder of this
agreement through at least 2041. In return, Metropolitan will receive 85,000-105,000 acre-feet in 2018 and annually
thereafter depending upon the amount used by the Coachella Valley Water District. A total of at least 85,000 and
90,374 acre-feet will be/was available in calendar years 2017 and 2016, respectively, for diversion by Metropolitan
(see Note 4a).
(d) Sale of Water by the Imperial Irrigation District to San Diego County Water Authority
In April 1998, the San Diego County Water Authority (SDCWA) and IID executed an agreement (Transfer
Agreement) for SDCWA’s purchase from IID of Colorado River water that is conserved within IID. SDCWA is a
Metropolitan member agency and one of the largest water purchasers from Metropolitan. In October 2003 the
Transfer Agreement was revised as part of the Quantification Settlement Agreement (QSA) (see Note 9e). The
amended Transfer Agreement sets the maximum transfer amount at 205,000 acre-feet in 2021, with the transfer
gradually ramping up to that amount over an approximately twenty-year period, stabilizing at 200,000 acre-feet per
year beginning in 2023.
No facilities exist to provide for delivery of water directly from IID to SDCWA. The Transfer Agreement provides
that IID water be delivered to SDCWA through existing facilities owned by Metropolitan. On November 10, 1998,
the boards of directors of Metropolitan and SDCWA authorized execution of an exchange contract (the Exchange
Agreement), pursuant to which SDCWA makes available to Metropolitan at its intake at Lake Havasu on the
Colorado River the conserved Colorado River water acquired by SDCWA from IID and water allocated to SDCWA
that has been conserved as a result of the lining of the All-American and Coachella Canals. Metropolitan delivers an
equal volume of water from its own sources of supply through portions of its delivery system to SDCWA. The
deliveries to both Metropolitan and SDCWA are deemed to be made in equal monthly increments. In consideration
for the conserved water made available to Metropolitan by SDCWA, a lower price is paid by SDCWA for the
Exchange Agreement water delivered by Metropolitan. The price payable by SDCWA is based on the charges set by
Metropolitan’s Board from time to time to be paid by its member agencies for the conveyance of water through
Metropolitan’s facilities (see Note 1c). SDCWA has challenged the validity of Metropolitan’s charges for

T H E M E T R O P O L I T A N W A T E R D I S T R I C T O F S O U T H E R N C A L I F O R N I A
NOTES TO BASIC FINANCIAL STATEMENTS (CONTINUED)
June 30, 2017 and 2016
72
conveyance of water that became effective January 1, 2011 and January 1, 2012, in San Diego County Water
Authority v. Metropolitan Water District of Southern California; et al. On June 8, 2012, SDCWA filed a new lawsuit
challenging the rates adopted by Metropolitan on April 10, 2012 and effective on January 1, 2013 and January 1,
2014 (see Note 9h). On May 30, 2014, SDCWA filed a lawsuit challenging the rates adopted by Metropolitan on
April 8, 2014 and effective on January 1, 2015 and January 1, 2016. On April 13, 2016, SDCWA filed a new lawsuit
challenging the rates and charges adopted by Metropolitan on April 12, 2016 and effective on January 1, 2017 and
January 1, 2018. The Exchange Agreement requires Metropolitan to pay the disputed portion of the amount paid by
SDCWA under the Exchange Agreement and interest thereon to SDCWA, if SDCWA prevails in a dispute over the
price payable by SDCWA under the Exchange Agreement. See Claims and Litigation below.
(e) Quantification Settlement Agreement
The Quantification Settlement Agreement (QSA) is part of the California Plan, which is a plan to reduce
California’s use of Colorado River water to its basic apportionment of 4.4 million acre-feet per year when necessary
through water conservation, transfers from higher priority agricultural users to Metropolitan’s service area, and
storage programs. The QSA was executed in October 2003 and establishes Colorado River water use limits for IID,
the Coachella Valley Water District (CVWD), and Metropolitan. It also provides for specific acquisitions of
conserved water and water supply arrangements for up to 75 years and restores the opportunity for Metropolitan to
receive any special surplus water.
(f) Abandoned Off-Aqueduct Power Facilities
The California Department of Water Resources (DWR) has financed the construction of certain off-aqueduct
power facilities in order to provide power for water transportation purposes for the State Water Project system.
Two geothermal facilities have been abandoned by DWR due to insufficient steam supply to operate the plants at
their planned capacities. As a result of these actions by DWR, Metropolitan recorded losses of $204.1 million in
prior fiscal years. Metropolitan’s estimated remaining long-term contractual obligations for these facilities as of
June 30, 2017, which are based on the State’s latest estimates, including average interest of 5.2 percent through the
year 2027, are shown in the following table (see Note 6):
(Dollars in thousands) Principal Interest Total
Year ending June 30:
2018 $ 1,203 $ 467 $ 1,670
2019 1,236 428 1,664
2020 1,447 383 1,830
2021 1,973 328 2,301
2022 1,894 244 2,138
2023-2027 3,079 264 3,343
Total obligations 10,832 $ 2,114 $ 12,946
Less current portion (1,203)
Long-term portion of obligations $ 9,629

T H E M E T R O P O L I T A N W A T E R D I S T R I C T O F S O U T H E R N C A L I F O R N I A
NOTES TO BASIC FINANCIAL STATEMENTS (CONTINUED)
June 30, 2017 and 2016
73
(g) Construction Programs and Contracts
The estimated cost, excluding contingencies, of Metropolitan’s capital program for fiscal years 2018 through 2022 totals approximately $1.22 billion. However, due to various uncertainties such as lower than anticipated construction bids, permitting delays, and facility shutdowns constraints, anticipated spending is forecasted at $200 million per year for the next 4 years and $205 million in fiscal year 2022. Over the next three years, approximately $731 million is budgeted in the capital program, with over $600 million planned for major efforts such as seismic retrofits and mechanical and electrical refurbishments to major components of the Colorado River Aqueduct and three of Metropolitan’s oldest treatment plants, rehabilitation through relining of the Prestressed Concrete Cylinder Pipe portions of the Second Lower and Sepulveda feeders, replacement/upgrade to the Supervisory Control and Data Acquisition (SCADA) system, and construction of the Advanced Water Treatment Demonstration Plant, a pilot effort to evaluate the feasibility of developing a regional wastewater recycling facility as an additional source of water supply to Southern California. With the completion of all major construction under the Oxidation Retrofit Program, over the next 3 years the capital budget includes $7.6 million of estimated costs for facilities that may be required to meet current water quality standards (see Note 9i). Metropolitan had commitments under construction contracts in force as follows:

T H E M E T R O P O L I T A N W A T E R D I S T R I C T O F S O U T H E R N C A L I F O R N I A
NOTES TO BASIC FINANCIAL STATEMENTS (CONTINUED)
June 30, 2017 and 2016
74
(h) Claims and Litigation
SDCWA filed San Diego County Water Authority v. Metropolitan Water District of Southern California; et al. on
June 11, 2010. The complaint alleges that the rates adopted by the Board on April 13, 2010, which became effective
January 1, 2011 and January 1, 2012, misallocate certain State Water Contract costs to the System Access Rate and
the System Power Rate, and thus affect charges for transportation of water, resulting in an alleged overcharge to
SDCWA by at least $24.5 million per year. The complaint alleges that all State Water Project costs should be
allocated instead to Metropolitan’s Supply Rate, even though under the State Water Contract Metropolitan is billed
separately for transportation, power and supply costs. It states additionally that Metropolitan will overcharge
SDCWA by another $5.4 million per year by including the Water Stewardship Rate in transportation charges.
(Dollars in thousands) 2017 2016
Weymouth Oxidation retrofit project $ — $ 2,116
Weymouth solar power facilities — 21
Diemer electrical improvements — 1,357
Chemical unloading facility chlorine containment and handling facilities 191 3,370
Weymouth filter rehabilitation 862 15,271
Diemer east filter upgrades — 1,032
Jensen module 1 filter valve replacement — 598
LADWP lagoon replacement 88 884
Mills industrial wastewater handling improvement — 1,124
Hinds and Eagle mountain pumping plants washwater system replacement — 12
Diemer south slope revegetation and mitigation — 20
Jensen solids transfer system — 12
Diemer east basin rehabilitation 830 12,244
Weymouth chemical upgrades 1,461 8,146
Colorado River Aqueduct sand trap equipment replacement 695 7,996
Colorado River Aqueduct erosion protection curbing — 1,732
Palos Verdes reservoir cover and liner replacement 20,148 26,026
Jensen electrical upgrades - stage 1A 3,510 10,669
Etiwanda pipeline north, liner repair phase 2 — 9,365
Diamond Valley Lake inlet/outlet tower fish screen replacement 1,359 1,885
Jensen solar power facility 1,681 —
Second Lower Feeder PCCP Rehabilitation 9,134 —
Colorado River Aqueduct whitewater siphon erosion protection 5,175 —
Colorado River Aqueduct pumping plants delivery pipe expansion joint repairs phase 2 1,049 —
Furnishing horizontal axially split centrifugal pumps for the Greg Avenue pump station 1,419 —
Employee housing rehabilitation at Julian Hinds and Eagle Mountain pumping plants 1,220 —
Employee housing rehabilitation at Iron Mountain and Gene pumping plants 1,220 —
Diemer administration building seismic upgrades 3,536 —
Colorado River Aqueduct pumping plants seismic retrofit 6.9 kV switch houses 5,575 —
Other 2,919 2,982
Total $ 62,072 $ 106,862
These commitments are being financed with operating revenues and debt financing.
June 30,

T H E M E T R O P O L I T A N W A T E R D I S T R I C T O F S O U T H E R N C A L I F O R N I A
NOTES TO BASIC FINANCIAL STATEMENTS (CONTINUED)
June 30, 2017 and 2016
75
The complaint requested a court order invalidating the rates adopted April 13, 2010, and that Metropolitan be
mandated to allocate costs associated with the State Water Contract and the Water Stewardship Rate to water
supply charges. Rates in effect in prior years are not challenged in this lawsuit. Metropolitan contends that its rates
are reasonable, equitably apportioned among its member agencies and lawful and were adopted under a valid rate
structure and cost of service approach. Nevertheless, to the extent that a final court ruling invalidates Metropolitan’s
adopted rates, Metropolitan will be obligated to reconsider and modify rates to comply with any final ruling related
to Metropolitan’s rates. While components of the rate structure and costs may change as a result of any such ruling,
Metropolitan expects that aggregate rates and charges would still recover Metropolitan’s cost of service. As such,
revenues would not be affected. If Metropolitan’s rates are revised in the manner proposed by SDCWA in the
complaint, other member agencies may pay higher rates unless other actions are taken by the Board.
SDCWA filed its First Amended Petition for Writ of Mandate and Complaint on October 27, 2011, adding five new
claims to this litigation, two of which were eliminated from the case on January 4, 2012. The three remaining new
claims are for breach of the Exchange Agreement between Metropolitan and SDCWA (see Note 9d) due to a price
based on allegedly illegal rates; improper exclusion of SDCWA’s payments under this Exchange Agreement from
calculation of SDCWA’s preferential rights to purchase Metropolitan supplies and illegality of a “rate structure
integrity” provision in conservation and local resources incentive agreements between Metropolitan and SDCWA.
SDCWA filed a Second Amended Petition for Writ of Mandate and Complaint on April 17, 2012, which contains
additional allegations but no new causes of action.
On June 8, 2012, SDCWA filed a new lawsuit challenging the rates adopted by Metropolitan on April 10, 2012 and
effective on January 1, 2013 and January 1, 2014. The complaint contains allegations similar to those in the Second
Amended Petition for Writ of Mandate and Complaint and new allegations asserting Metropolitan’s rates, adopted
in April 2012, violate Proposition 26. Metropolitan contends that its rates adopted on April 10, 2012 are reasonable,
equitably apportioned among its member agencies and lawful and were adopted under a valid rate structure and cost
of service approach.
SDCWA filed a Third Amended Petition for Writ of Mandate and Complaint on January 23, 2013, to add new
allegations that Metropolitan’s rates adopted in April 2010 did not meet the requirements of Proposition 26. The
court granted Metropolitan’s motion to strike allegations relating to Proposition 26 on March 29, 2013. This ruling
does not affect SDCWA’s separate challenge to Metropolitan’s rates adopted in April 2012, which also includes
Proposition 26 allegations. On December 4, 2013, the court granted Metropolitan’s motion for summary
adjudication of the cause of action alleging illegality of the “rate structure integrity” provision in conservation and
local resources incentive agreements, dismissing this claim in the first lawsuit.
Trial of the first phase of both lawsuits concluded January 23, 2014. This phase concerned the challenges to
Metropolitan’s rates. On April 24, 2014, the court issued its “Statement of Decision on Rate Setting Challenges,”
determining that SDCWA prevailed on two of its claims and that Metropolitan prevailed on the third claim. The
court found that there was not sufficient evidence in the administrative record to support Metropolitan’s inclusion in
its transportation rates, and hence in its wheeling rate, of 100 percent of (1) payments it makes to the California
Department of Water Resources for transportation charges related to the State Water Project, or (2) the costs
incurred by Metropolitan for conservation and local water supply development programs recovered through the
Water Stewardship Rate. The court found that SDCWA failed to prove its “dry-year peaking” claim that
Metropolitan’s rates do not adequately account for variations in member agency purchases.

T H E M E T R O P O L I T A N W A T E R D I S T R I C T O F S O U T H E R N C A L I F O R N I A
NOTES TO BASIC FINANCIAL STATEMENTS (CONTINUED)
June 30, 2017 and 2016
76
SDCWA’s claims asserting breach of the Exchange Agreement and miscalculation of preferential rights were tried
in a second phase of the case which concluded April 30, 2015. On August 28, 2015, the trial court issued a final
statement of decision for the second phase. The decision found in favor of SDCWA on both claims and that
SDCWA is entitled to contract damages in the amount of nearly $188.3 million. On October 9 and 30, 2015, the
trial court granted SDCWA’s motion for prejudgment interest at the statutory rate of 10 percent on these damages.
The prejudgment interest award through entry of judgment was $46.6 million. Based on the trial court decision,
after entry of judgment, post-judgment interest began accruing at the statutory rate of 7 percent. On November 18,
2015, the court issued the Final Judgment and a Peremptory Writ of Mandate in the 2010 and 2012 SDCWA v.
Metropolitan cases. On January 21, 2016, the court awarded $320,084 in costs to SDCWA, after deducting amounts
based on Metropolitan’s motion. On March 24, 2016, the court awarded $8.9 million in attorneys’ fees to SDCWA,
rejecting its demand for over $17.0 million. Metropolitan filed a Notice of Appeal of the Judgment and Writ in each
case and SDCWA filed a Notice of Cross-Appeal of the court’s ruling on the rate structure integrity claim and the
attorneys’ fees order.
On June 21, 2017, the California Court of Appeal released its decision in the appeals and cross-appeal filed by
Metropolitan and SDCWA, respectively. The Court of Appeal ruled that Metropolitan may lawfully include its State
Water Project transportation costs in the System Access Rate and System Power Rate that are part of the Exchange
Agreement’s price term, and may lawfully include the System Access Rate in the wheeling rate, reversing the trial
court decision on this issue. The Court held Metropolitan’s allocation of the State Water Project transportation
costs as its own transportation costs is proper and does not violate the wheeling statutes (Water Code, § 1810, et
seq.), Proposition 26 (Cal. Const., art. XIII C, §1, subd. (e)), Government Code section 54999.7, the common law,
or the terms of the parties’ Exchange Agreement.
The Court of Appeal also ruled that, based on the record, Metropolitan may not include its Water Stewardship Rate
as a transportation cost in the Exchange Agreement price or the wheeling rate, under the wheeling statutes and the
common law. Having made that determination, the Court of Appeal stated it need not evaluate the issue under any
other law. The court noted, and in a subsequent modification confirmed, that its holding does not preclude
Metropolitan from including the Water Stewardship Rate in Metropolitan’s full service rate.
The Court of Appeal held that because the Water Stewardship Rate was included in the Exchange Agreement price,
there was a breach by Metropolitan of the agreement. The court remanded the case to the trial court for a
redetermination of damages in light of its ruling concerning the Water Stewardship Rate. The Court of Appeal
agreed with the trial court that statutory prejudgment interest applies with respect to any damages award, not a
lesser contractual interest. The court reversed the trial court by finding that the Exchange Agreement may entitle
SDCWA to attorneys’ fees for the second phase of the case concerning breach of contract, but directed the trial
court on remand to make a new determination of the prevailing party, if any. The cases were therefore remanded to
the trial court for a review of both damages and attorneys’ fees.
With respect to other issues considered on appeal, the Court of Appeal upheld the trial court’s ruling that
Metropolitan improperly excludes SDCWA’s payments under the Exchange Agreement in Metropolitan’s
calculation of SDCWA’s preferential rights. The court also ruled that SDCWA had the constitutional right to
challenge the rate structure integrity provision in Metropolitan’s conservation and local resources incentive
agreements, and found that the rate structure integrity provision was invalid and unenforceable as an
unconstitutional condition on the provision of a public benefit.

T H E M E T R O P O L I T A N W A T E R D I S T R I C T O F S O U T H E R N C A L I F O R N I A
NOTES TO BASIC FINANCIAL STATEMENTS (CONTINUED)
June 30, 2017 and 2016
77
On July 6, 2017, SDCWA filed a petition for rehearing with the Court of Appeal. On July 18, 2017, the Court of
Appeal modified the opinion to add one sentence, without a change in the judgment, and denied the petition. On
July 31, 2017, SDCWA filed a petition for review with the California Supreme Court on the issue “Whether a state
agency may charge its transportation-only customers costs associated with a service those customers do not
purchase.” Metropolitan filed its answer to SDCWA’s petition on August 21, 2017. On September 27, 2017, the
California Supreme Court denied SDCWA’s petition, declining to consider the Court of Appeal’s decision. The
Court of Appeal’s decision is therefore final. The 2010 and 2012 cases will now be returned to the trial court for a
redetermination of damages, interest, and attorney’s fees, including the question of whether there is a “prevailing
party” entitled to fees, as ordered by the Court of Appeal. Metropolitan is unable to assess at this time the outcome
of the matters to be redetermined by the trial court on remand.
In May 2014, SDCWA filed a new lawsuit asserting essentially the same rate claims and breach of contract claim in
connection with the Board's April 2014 rate adoption. Metropolitan filed its answer on June 30, 2014. On
February 9, 2015, pursuant to stipulation by the parties, the court ordered that the case be stayed. The stay may be
lifted upon motion by any party. On November 20, 2015, SDCWA filed a motion to partially lift the stay. On
December 21, 2015, the trial court denied that motion and the case remains stayed. Metropolitan is unable to assess
at this time the likelihood of success of this case, any possible appeal or any future claims.
On April 13, 2016, SDCWA filed a new lawsuit that alleges all rates and charges for 2017 and 2018 adopted by
Metropolitan’s Board on April 12, 2016 violate the California Constitution, statutes, and common law. The Petition
for Writ of Mandate and Complaint asserts misallocation of costs as alleged in the previous cases listed above and
additional claims of over-collection and misallocation of costs and procedural violations. On June 30, 2016, the nine
member agencies that are interested parties to the 2010, 2012, and 2014 cases filed answers to also join the 2016
case as interested parties in support of Metropolitan. On October 27, 2016, SDCWA filed a Motion for Leave to
File Amended Complaint alleging the same Exchange Agreement breach alleged in the previous cases listed above
and breach of a provision that requires Metropolitan to set aside disputed amounts, relating to the manner in which
Metropolitan has set aside the amounts. The proposed amended petition/complaint also requests a judicial
declaration that, if a judgment is owed to SDCWA under the Exchange Agreement, SDCWA will not be required to
pay any portion of that judgment; and requests a refund to SDCWA of any amount Metropolitan has collected in
excess of the reasonable costs of the services provided or, alternatively, a reduction in SDCWA’s future fees. On
November 10, 2016, pursuant to stipulation by the parties, the court ordered that the case be stayed pending final
resolution of the appeals of the 2010 and 2012 SDCWA v. Metropolitan cases. Metropolitan is unable to assess at
this time the likelihood of success of this case, any possible appeal or any future claims.
On June 9, 2017, SDCWA filed a new Petition for Writ of Mandate and Complaint challenging the Readiness-to-
Serve (RTS) Charge and Capacity Charge for 2018 adopted by Metropolitan's Board on April 11, 2017. These two
charges are set annually, and SDCWA’s 2016 lawsuit included a challenge to these two charges for 2017. The new
lawsuit similarly alleges the 2018 RTS Charge and Capacity Charge violate the California Constitution, statutes, and
common law. The petition/complaint asserts misallocation of costs. Metropolitan was served with the
petition/complaint on June 20, 2017. On July 18, 2017, SDCWA filed a first amended petition/complaint to add
the Metropolitan Board’s action of July 11, 2017 to make minor corrections to the RTS Charge.
A number of other suits and claims arising in the normal course of business are pending against Metropolitan. In
the opinion of Metropolitan’s General Counsel, the adverse results, if any, of such legal actions on these suits and
claims will not have a material effect on Metropolitan’s financial position, changes in net position, or liquidity.

T H E M E T R O P O L I T A N W A T E R D I S T R I C T O F S O U T H E R N C A L I F O R N I A
NOTES TO BASIC FINANCIAL STATEMENTS (CONTINUED)
June 30, 2017 and 2016
78
(i) Drinking Water Quality Standards
Under the Safe Drinking Water Act Amendments of 1996, Congress required the United States Environmental
Protection Agency to set new drinking water quality standards. New standards to control microbial pathogens and
disinfection byproducts (DBPs) became effective in 2002. These rules are known as the Interim Enhanced Surface
Water Treatment Rule and the Stage 1 Disinfectants/Disinfection By-Product Rule. These standards became more
stringent in a second set of regulations effective 2006. The second set of regulations (the Stage 2
Disinfectants/Disinfection Byproducts Rule and the Long-Term 2 Enhanced Surface Water Treatment Rule) did
not require additional capital investment by Metropolitan.
Metropolitan identified ozone disinfection as the most cost-effective option to minimize the production of DBPs
and achieve other water quality objectives. Ozone is now used as the primary disinfectant at the Diemer, Jensen,
Mills, and Skinner plants. Construction of ozonation facilities at the Weymouth plant is on-going and should be
completed in 2017. The estimated cost of implementing ozone treatment at all five plants is approximately
$1.1 billion.
(j) Reid Gardner Generating Station
Reid Gardner Generating Station (Plant) is a 557 megawatt coal-fired plant located near Moapa, Nevada. The Plant
is owned and operated by Nevada Energy (NE). In 1983, the California Department of Water Resources (DWR)
entered in to a Participation Agreement to import power from the Plant to serve the State Water Project energy
needs. DWR’s interest in the Plant terminated on July 25, 2013. DWR and NE negotiated the terms of the
divestiture including DWR’s obligations to mitigate any environmental impacts associated with the electricity
generated for DWR over the past thirty years. Metropolitan paid approximately 75.0 percent of DWR’s costs
associated with the generation of electricity at the Plant and will pay this proportion of DWR’s assigned mitigation
costs.
(k) Landfill Obligation
Federal and State laws and regulations require that Metropolitan perform certain maintenance and monitoring
functions at its sole landfill site for 30 years after closure. They further require that a separate funding mechanism
be established to ensure that sufficient funds are available for closure and postclosure costs. In October 1995, the
landfill was closed and management’s estimate of closure and postclosure costs for this site totaled approximately
$2.0 million. The required thirty-year postclosure maintenance and monitoring of the landfill officially started in
January 1998; after the installation of the landfill’s final cover was completed. No expenses were incurred for
postclosure maintenance and monitoring activities during fiscal years 2017 and 2016.
The actual cost of postclosure care may be higher due to inflation, changes in technology, or changes in landfill laws
or regulations. Funding of these costs has been derived from a separate trust account that has been established for
closure and postclosure costs. The balance of the trust account is sufficient to cover the landfill liability. At June 30,
2017 and 2016, approximately $810,000 and $811,000 net of interest receipts and disbursements were available,
respectively, in this account.
10. PARTICIPATION RIGHTS IN STATE WATER PROJECT
Metropolitan is one of 29 water suppliers contracting with the State of California for a system to provide water
throughout much of California. Under the terms of the State Water Contract, as amended, Metropolitan is obligated
to pay allocable portions of the cost of construction of the system and ongoing operations and maintenance costs
through at least the year 2035, regardless of the quantities of water available from the project (see Note 9a).
Metropolitan and the other contractors may also be responsible to the State for certain obligations of any contractor
who defaults on its payments to the State.

T H E M E T R O P O L I T A N W A T E R D I S T R I C T O F S O U T H E R N C A L I F O R N I A
NOTES TO BASIC FINANCIAL STATEMENTS (CONTINUED)
June 30, 2017 and 2016
79
Approximately 31 percent and 20 percent of Metropolitan’s total expenditures during fiscal years ended June 30,
2017 and 2016, respectively, pertained to its net payment obligations for the State Water Project. These payments
were primarily based on the contractual water delivery request, the annually requested and actual deliveries received,
and the cost of power required for such deliveries, offset by credits received from the project.
Management’s present intention is to exercise Metropolitan’s option to extend the contractual period to at least
2052, under substantially comparable terms. This corresponds to an estimated 80-year service life for the original
facilities. The State is obligated to provide specified quantities of water throughout the life of the contract, subject
to certain conditions.
The State has power generation facilities associated with its reservoirs and aqueducts. The power generated is
utilized by the system for water transportation purposes. Power generated in excess of system needs is marketed to
various utilities and California’s power market. The revenues resulting from sales of excess power reduce the costs
of pumping. Metropolitan and the other water contractors are responsible for repaying the capital and operating
costs of the power facilities regardless of the amount of power generated (see Note 9f).
Metropolitan capitalizes its share of system construction costs as participation rights when such costs are billed by
the State (see Notes 1h, 2, and 9a). Metropolitan’s share of system operations and maintenance costs is charged to
expense.
Metropolitan amortizes a portion of capitalized participation rights each month using a formula that considers the
total estimated cost of the project, the estimated useful life, and estimated production capacity of the assets based
upon information provided by the State of California. In fiscal year 2006, the formula was modified to use
maximum annual contracted deliveries as the production capacity estimate. Amortization expense totaled
$127.4 million and $130.2 million in fiscal years 2017 and 2016, respectively.
11. DEPOSITS, PREPAID COSTS, AND OTHER
Balances at June 30, 2017 and 2016 were as follows:
June 30,
(Dollars in thousands) 2017 2016
Prepaid water costs $ 107,024 $ 111,143
Prepaid costs-Delta Habitat conservation and conveyance 58,627 58,940
Prepaid costs-Bay/Delta — 2,252
Prepaid expenses 9,353 12,875
Preliminary design/reimbursable projects 11,771 8,705
Other 7,356 4,738
Total deposits, prepaid costs, and other 194,131 198,653
Less current portion (2,606) (1,726)
Noncurrent portion $ 191,525 $ 196,927

T H E M E T R O P O L I T A N W A T E R D I S T R I C T O F S O U T H E R N C A L I F O R N I A
NOTES TO BASIC FINANCIAL STATEMENTS (CONTINUED)
June 30, 2017 and 2016
80
(a) Prepaid Water Costs
Metropolitan has entered into several water exchange and storage agreements with other agencies. These
agreements provide Metropolitan with additional reliable water supplies to supplement deliveries of Colorado River
and State Water Project water. Metropolitan is also actively pursuing other agreements, both within and outside its
service area, to provide additional water supplies. The exchange and storage agreements generally provide for
advance delivery of water during periods when water is available. At a later time when water is needed, these
programs can then return water to improve Metropolitan’s reliability. Expenditures associated with these
agreements have been recorded as prepaid costs and are charged to cost of water as the water is withdrawn. At
June 30, 2017 and 2016, prepaid water costs totaled approximately $107.0 million and $111.1 million, respectively,
based on volumes of 540,000 acre-feet and 547,000 acre-feet, as of such dates.
(b) Prepaid Costs—Delta Habitat Conservation and Conveyance
In March 2009, Metropolitan, other State Water Project contractors, federal Central Valley Project contractors, and
the U.S. Department of Interior’s Bureau of Reclamation entered into funding agreements with the California
Department of Water Resources (DWR). The agreements are known collectively as the Delta Habitat Conservation
and Conveyance Program (DHCCP) Funding Agreement and the Bay Delta Conservation Plan and Delta Habitat
Conservation and Conveyance Plan (BDCP - DHCCP) Supplemental Funding Agreement. Metropolitan’s three-year
DHCCP agreement provides funding of approximately $35.0 million for Metropolitan’s share (24 percent).
Metropolitan’s two-year BDCP-DHCCP agreement provides funding of approximately $25.0 million (25 percent).
The funding provided by both agreements supports development of the BDCP through environmental analysis,
planning and design of Delta conservation measures including Delta water conveyance options. If the BDCP is
approved, including construction of new Delta water conveyance facilities, DWR intends to issue revenue bonds in
an amount sufficient to reimburse Metropolitan for funds advanced through these agreements for planning and
environmental studies. If the BDCP is not approved to proceed with construction, no reimbursement will occur.
(c) Prepaid Costs—Bay/Delta
In December 1994, representatives from state and federal resource agencies, and urban, agricultural, and
environmental agencies agreed to a set of principles to implement a protection plan for the San Francisco Bay/Delta
Estuary. Among the principles was a commitment by agricultural and urban water agencies to fund $60.0 million to
help initiate a comprehensive program to address nonoutflow-related impacts to the Bay/Delta environment. The
Secretary of the Interior requested Metropolitan to guarantee $10.0 million annually for three years, for a total of
$30.0 million, to be made available for the restoration fund created by the principles. Metropolitan’s final payment of
its $30.0 million commitment was made in June 1998. Metropolitan’s contributions are accounted for as prepaid
costs that are charged to expense based on expenses by the restoration fund. The amount charged to expense totaled
$2.3 million and $0 for fiscal years ended June 30, 2017 and 2016, respectively. During fiscal year 2001, Metropolitan
became trustee for the unspent funds, which totaled $0 and $2.3 million at June 30, 2017 and 2016, respectively.
(d) Preliminary Design/Reimbursable Projects
Metropolitan engages in preliminary design activities prior to obtaining Board approval of capital projects. The
costs of these designs are recorded as prepaid costs. Once Board approval is obtained, these costs are added to the
cost of the relevant construction project.
Reimbursable projects include work Metropolitan is contracted to perform for outside, non-related parties, and is
subsequently billed for reimbursement.

T H E M E T R O P O L I T A N W A T E R D I S T R I C T O F S O U T H E R N C A L I F O R N I A
NOTES TO BASIC FINANCIAL STATEMENTS (CONTINUED)
June 30, 2017 and 2016
81
12. DEFERRED COMPENSATION AND SAVINGS PLANS
For the benefit of its employees, Metropolitan has adopted a deferred compensation plan in accordance with
Section 457 of the Internal Revenue Code. Generally, eligible employees may defer receipt of a portion of their
salary until termination, retirement, death, or unforeseeable emergency. Until the funds are paid or otherwise made
available to the employee, the employee is not obligated to report the deferred salary for income tax purposes.
Investment of the funds is managed by a third-party administrator, accordingly, at June 30, 2017 and 2016, neither
the plan assets nor the related liability were included in the accompanying basic financial statements.
The third-party administrator coordinates the investment of the deferred amounts in available investment vehicles
per the instructions of each participant. Metropolitan’s Treasurer serves as Trustee for the deferred compensation
plan. Metropolitan is not liable to its employees for any losses that may be incurred in connection with their
participation in this plan.
Metropolitan has established another compensation deferral arrangement in accordance with Section 401(k) of the
Internal Revenue Code. The 401(k) Consolidated Savings Plan is available to substantially all employees. At June 30,
2017 and 2016, 1,770 and 1,667 employees participated in the consolidated 401(k) plan. Amounts deferred by
participants, Metropolitan matching contributions, and accumulated earnings thereon are fully vested. Deferred
amounts and matching contributions are transferred by Metropolitan each pay period to a third-party administrator
who coordinates the investment of such proceeds in a variety of investment vehicles in accordance with the
instructions of each participant. The Treasurer serves as Trustee for the savings plan. Metropolitan is not liable to
its employees for any losses that may be incurred in connection with their participation in this plan.
Metropolitan has established a matching contribution program on behalf of each participating employee in the
savings plan. Metropolitan’s contribution is subject to a maximum of 4.5 percent of the employee’s total cash
compensation.
Contributions to the savings plan were as follows:
June 30,
(Dollars in thousands) 2017 2016
Employees $ 20,828 $ 21,203
Metropolitan 8,644 8,669
$ 29,472 $ 29,872
Eligible payroll $ 214,476 $ 214,639
Employee contributions as percent of eligible payroll 9.7% 9.9%
T H E M E T R O P O L I T A N W A T E R D I S T R I C T O F S O U T H E R N C A L I F O R N I A
NOTES TO BASIC FINANCIAL STATEMENTS (CONTINUED)
June 30, 2017 and 2016
82
13. NET POSITION
Net position is classified as either restricted, unrestricted, or net investment in capital assets, including State Water
Project Costs.
Net investment in capital assets, including State Water Project costs consist of capital assets, net of accumulated
depreciation and amortization, and reduced by the outstanding balances of any bonds, notes, or other borrowings
attributable to the acquisition or construction of those assets and related deferred outflows and inflows of resources
related to debt. Metropolitan's capital assets, including State Water Project costs include plant and equipment
(Notes 1g and 2), participation rights in State Water Project (Notes 1h, 2, and 10), and participation rights in other
facilities (Notes 2 and 4). Net investment in capital assets, including State Water Project costs were approximately
$5.9 billion and $5.8 billion at June 30, 2017 and 2016, respectively.
The restricted component of net position are those items that have external constraints placed on them by
creditors, grantors, contributors, or laws or regulations of other governments, or imposed by law through
constitutional provisions of enabling legislation. Restricted net position totaled $406.8 million and $382.8 million at
June 30, 2017 and 2016, respectively, of which $224.6 million and $199.5 million, respectively, represents principal
and interest set aside for the next bond payment. The remaining $182.2 million and $183.3 million, respectively,
relates to estimated operating and maintenance expense for July and August of the subsequent fiscal year. Each of
these requirements is related to bond covenants.
The unrestricted component of net position are those items that do not meet the definition of “restricted” or “net
investment in capital assets, including State Water Project costs.” Unlike the restricted net position, the Board has
discretion in determining the use and establishing minimum/maximum balance requirements for the unrestricted
cash and investment portion of net position. The Board may at any time change or eliminate amounts established
for these purposes. Unrestricted net position totaled $403.8 million and $528.6 million at June 30, 2017 and 2016,
respectively.
14. RISK MANAGEMENT
Metropolitan is exposed to various risks of loss related to the design, construction, treatment, and delivery of water
resources. Metropolitan self-insures most of its property losses, the first $25.0 million for general liability, and
$5.0 million for workers’ compensation. Metropolitan supplements its self-insurance program with $75.0 million
excess general liability coverage, and statutory limits excess workers’ compensation coverage. Metropolitan also
carries coverage limits of $60.0 million for fiduciary liability, and $65.0 million for directors’ and officers’ liability.
Special insurance policies carried include aircraft hull and liability, a limited property damage policy, crime
insurance, specialty crime coverage, and travel accident coverage. Coverage types and limits for fiscal year 2017 were
unchanged from fiscal year 2016. Settlement amounts did not exceed the self-insurance or insurance coverage limits
in any of the past three years.
Liabilities are reported when it is probable that a loss has occurred and the amount of the loss can be reasonably
estimated. Liabilities include an estimated amount for claims that have been incurred but not reported (IBNR).
Claims liabilities are calculated considering the effects of inflation, recent claim settlement trends including
frequency and amount of payouts, and other economic and social factors. The present value of liabilities for unpaid
claims is based on a 1.5 percent annual interest rate over the life of the claims. Changes in the balances of claims
liabilities during the past three fiscal years were as follows:

T H E M E T R O P O L I T A N W A T E R D I S T R I C T O F S O U T H E R N C A L I F O R N I A
NOTES TO BASIC FINANCIAL STATEMENTS (CONTINUED)
June 30, 2017 and 2016
83
15. SUBSEQUENT EVENT
On July 3, 2017, Metropolitan issued, $178.2 million Subordinate Water Revenue Refunding Bonds, 2017 Series B
to refund $137.3 million of Water Revenue Bonds, 2006 Authorization, Series A, $12.2 million of Water Revenue
Refunding Bonds, 2009 Series A-2, and $52.4 million of Water Revenue Refunding Bonds, 2011 Series A-1 and
2011 A-3, and $12.3 million Tax-Exempt Flexible Rate Revolving Note, Series 2017 B-1. The maturity extends to
August 1, 2024 and is subject to optional redemption provisions; $80 million of Subordinate Water Revenue Bonds,
2017 Series C (SIFMA Index Mode), proceeds will fund a portion of Metropolitan’s capital expenditures. The
maturity extends to July 1, 2047 and is subject to optional and mandatory redemption provisions; $95.6 million of
Subordinate Water Revenue Refunding Bonds, 2017 Series D (SIFMA Index Bonds) and $95.6 million of
Subordinate Water Revenue Refunding Bonds, 2017 Series E (SIFMA Index Bonds), to refund $119.9 million of
Water Revenue Bonds, 2006 Authorization, Series A, $63.9 million of Water Revenue Refunding Bonds, 2011 Series
A-1 and 2011 A-3, and $14.3 million of Water Revenue Refunding Bonds, 2015 Series G-2. The maturities extend
to July 1, 2037 and are subject to optional and mandatory redemption provisions.
On October 10, 2017, Metropolitan’s Board voted to support the California WaterFix, a plan to modernize the
State Water Project and help improve water supply reliability. The Board approved Metropolitan’s participation in
the construction of California WaterFix, including the payment of costs limited to its 25.9% share of total project
costs, as well as moving forward on a governance structure and related documents to build and finance the
estimated $17.0 billion project. Metropolitan’s 25.9% share equals approximately $4.3 billion. The California
WaterFix would modernize the decades-old delivery system by building three new intakes in the northern Delta
along with two tunnels to carry water to the existing aqueduct system in the southern Delta.
(Dollars in Thousands) 2017 2016 2015
Unpaid claims, beginning of fiscal year $ 20,047 $ 19,798 $ 27,352
Incurred claims (including IBNR) 4,514 5,321 7,951
Claim payments and adjustments (8,884) (5,072) (15,505)
Unpaid claims, end of fiscal year 15,677 20,047 19,798
Less current portion (5,109) (9,500) (9,500)
Noncurrent portion $ 10,568 $ 10,547 $ 10,298
June 30,

T H E M E T R O P O L I T A N W A T E R D I S T R I C T O F S O U T H E R N C A L I F O R N I A
REQUIRED SUPPLEMENTARY INFORMATION—UNAUDITED June 30, 2017 and 2016
84
1 2015 amount was net of administrative expenses of $1,972. 2 GASB 68 requires ten years of information be presented but only three years are available at this time. Additional years’ information will be displayed as it becomes available.
Notes to Schedule:
Benefit Changes: The figures above do not include any liability impact that may have resulted from plan changes which occurred after June 30, 2015 valuation date. This applies for voluntary benefit changes as well as any offers of Two Years Additional Service Credit.
Changes of Assumptions: In 2017, there were no changes. In 2016, amounts reported reflect an adjustment of the discount rate from 7.5 percent (net of administrative expense) to 7.65 percent (without a reduction for pension plan administrative expense.) In 2015, amounts reported were based on the 7.5 percent discount rate.
Schedule of Changes in Net Pension Liability and Related Ratios
(Dollars in thousands) 2017 2016 2015
TOTAL PENSION LIABILITY
Service cost $ 29,142 $ 28,890 $ 28,505
Interest on total pension liability 152,500 146,852 139,190
Changes in benefit terms — — —
Changes of assumptions — (35,008) —
Difference between expected and actual experience (12,754) 14,665 —
Benefit payments, including refunds of employee contributions (92,401) (86,154) (81,391)
Net change in total pension liability 76,487 69,245 86,304
Total pension liability - beginning 2,038,577 1,969,332 1,883,028
Total pension liability - ending (a) $ 2,115,064 $ 2,038,577 $ 1,969,332
PLAN FIDUCIARY NET POSITION
Contribution - Employer $ 38,393 $ 34,306 $ 33,853
Contribution - Employee 15,034 14,787 15,185
Net investment income1
8,304 35,301 236,746
Benefit payments, including refunds of employee contributions (92,401) (86,154) (81,391)
Administrative expense (950) (1,756) —
Net change in fiduciary net position (31,620) (3,516) 204,393
Plan fiduciary net position - beginning 1,559,022 1,562,538 1,358,145
Plan fiduciary net position - ending (b) $ 1,527,402 $ 1,559,022 $ 1,562,538
Plan net pension liability - ending (a) - (b) $ 587,662 $ 479,555 $ 406,794
Plan fiduciary net position as a percentage of the total pension liability 72.22% 76.48% 79.34%
Covered payroll $ 214,476 $ 214,639 $ 207,512
Plan net pension liability as a percentage of covered payroll 274.00% 223.42% 196.03%

T H E M E T R O P O L I T A N W A T E R D I S T R I C T O F S O U T H E R N C A L I F O R N I A
REQUIRED SUPPLEMENTARY INFORMATION—UNAUDITED (CONTINUED)
June 30, 2017 and 2016
85
1 GASB 68 requires ten years of information be presented but only three years are available at this time. Additional years’ information will be displayed as it becomes available.
Notes to Schedule:
Methods and assumptions used to actuarially determine contributions rates for fiscal year 2017:
Valuation date: June 30, 2014
Schedule of Plan Contributions
(Dollars in thousands) 2017 2016 2015
Actuarially determined contribution $ 42,820 $ 38,393 $ 34,305
Contributions in relation to the actuarially determined contribution (42,820) (38,393) (34,305)
Contribution deficiency (excess) $ — $ — $ —
Covered payroll $ 214,476 $ 214,639 $ 207,512
Contributions as a percentage of covered payroll 19.96% 17.89% 16.53%
Actuarial Cost Method
Amortization Method/Period
Asset Valuation Method
Inflation
Salary Increases
Payroll Growth
Investment Rate of Return
Retirement Age
Mortality
7.50% net of pension plan investment and administrative expenses;
includes inflation
The probabilities of Retirement are based on the 2010 CalPERS
Experience Study for the period from 1997 to 2007.
The probabilities of mortality are based on the 2010 CalPERS Experience
Study for the period from 1997 to 2007. Pre-retirement and Post-
retirement mortality rates include 5 years of projected mortality
improvement using Scale AA published by the Society of Actuaries.
Entry Age Normal
For details, see June 30, 2014 Funding Valuation Report
Market Value of Assets
2.75%
Varies by entry age and service
3.00%

T H E M E T R O P O L I T A N W A T E R D I S T R I C T O F S O U T H E R N C A L I F O R N I A
REQUIRED SUPPLEMENTARY INFORMATION—UNAUDITED (CONTINUED)
June 30, 2017 and 2016
86
Funding Progress of Other Postemployment Benefits
The table below provides a history of the funded status of Metropolitan's OPEB obligation. The information
reflects the most recent biennial actuarial valuation and the preceding biennial valuations.
(Dollars in thousands)
Unfunded
Actuarial
Actuarial Liability as
Valuation Accrued Actuarial Unfunded Funded Covered Percentage of
Date Liability Asset Value Liability Ratio Payroll Covered Payroll
6/30/11 $ 367,719 $ — $ 367,719 0.00% $ 179,242 205.2%
6/30/13 $ 315,326 $ — $ 315,326 0.00% $ 182,937 172.4%
6/30/15* $ 423,420 $ 164,669 $ 258,751 38.89% $ 214,476 120.6%
* Most recent actuarial valuation date.