Embed Size (px)
Citation preview

1
Books as Capital Assets
By Rachel Soloveichik
Abstract
In 2007, I estimate that authors and publishers created original books with a value
of $9.1 billion. These books were first sold starting in 2008, and will continue to be sold
for decades to come. Because of their long working life, the international guidelines for
national accounts recommends that countries classify production of books and other
entertainment, literary and artistic originals as an investment activity and then depreciate
those books over time. However, BEA did not capitalize this category of intangible
assets until the July 2013 benchmark revision. In order to change the national accounts, I
collected data on book production from 1900 to 2010. I then calculated how GDP
statistics change when books are classified as capital assets.
To preview, my main empirical result are: 1) Books have a useful lifespan of at
least 50 years, with an annual depreciation rate of 12% per year; 2) Nominal book
investment has hovered around 0.06% of nominal GDP from the 1930’s until 2010.
Therefore, nominal GDP growth does not change much when book production is
classified as an investment activity; 3) After 1970, book investment prices rose faster
than overall GDP prices. Accordingly, average inflation rises slightly when book
production is classified as investment. Before 1970, book investment prices roughly
track overall GDP prices.
The views expressed here are those of the author and do not represent the Bureau of Economic Analysis or Department of Commerce. Email: [email protected]

2
Introduction
In 2007, I estimate that authors and publishers created original books with a value
of $9.1 billion. There are two possible methods for BEA to account for this $9.1 billion:
method 1 treats book production as a current or intermediate expense; method 2 treats
book production as a capital investment. Method 1 is generally used for items with a
useful lifespan of less than one year. According to method 1, final revenue from the sale
of original texts is all that matters for gross domestic production (GDP), and the BEA
does not need to track production costs for books separately than other costs such as
printing or advertising. Until the July 2013 benchmark revision, BEA used method 1 to
account for the $9.1 billion spent producing books.
In contrast, method 2 is generally used for items with a useful lifespan of more
than one year. According to method 2, initial production costs for books are a capital
investment, and added to GDP as part of private investment. That new capital investment
in books is then added to the pre-existing capital stock of books to get the total capital
stock of book originals. This capital stock of book originals then returns a flow of value
to its owner, and that flow is counted in GDP as part of capital services. By including
both the flow of value and the initial investment, GDP double-counts investment. As a
result, GDP is always higher when a good is changed method 1 to method 2. Finally, the
total capital stock of book originals is depreciated, which is known as consumption of
fixed capital. In addition to the well-known GDP, BEA also estimates net domestic
production. Net domestic production equals GDP minus consumption of fixed capital.
Because net domestic production does not double-count investment, it is generally
viewed as a better long-term measure of the total sustainable productivity of an economy.
In this paper, I will show that it is possible to calculate GDP when book
production is treated as a capital investment (method 2). Unlike physical capital, I can’t
directly observe the total amount of book capital or the flow of services it provides.
Nevertheless, I can observe the revenues earned by a book original over time. Therefore,
the value of a book is simply the net present value of the future revenues it will earn for
its owner, starting from the first time the book is published and ending when consumers
lose interest and switch to newer books. I also cannot directly observe the amount of

3
money authors and publishers spend creating their works. Instead, I assume that authors
and publishers spend $1 creating a book for every $1 in revenue they earn. These
creation costs include not only out of pocket expenses, but also time and energy spent by
authors writing the books. As a result, it is possible to account for book production and
book depreciation in the same framework that is already used to account for physical
capital production and depreciation. This is the framework recommended by the
international guidelines for national accounts, System of National Accounts 2008, for all
expenses related to the production of entertainment, literary and artistic originals (SNA
2008 10.115).
In order to provide a more accurate depiction of the book industry, I collected
data on book production and calculate GDP when book production is classified as an
investment activity. To preview, my empirical results are:
1) New books have a useful lifespan of at least 50 years, but they earn most of
their profits in the first few years. On average, books lose 12% of their value each year.
2) Nominal book investment has hovered around 0.06% of nominal GDP from the
1930’s until 2010. Therefore, nominal GDP growth does not change much when book
production is classified as an investment activity;
3) After 1970, book investment prices rose faster than overall GDP prices.
Accordingly, average inflation rises slightly when book production is classified as
investment. Before 1970, book investment prices roughly track overall GDP prices.
My efforts to capitalize book production are part of a broader effort by the BEA
to improve the treatment of intangible assets in the national income and product accounts.
Other researchers at the BEA have developed a satellite account measuring the annual
investment and capital value of R & D (Robbins and Moylan 2007), educational
investments (Fraumeni, Reinsdorf, Robinson and Williams 2008) and the role of
intangible assets in foreign direct investment (Bridgman 2008). I have companion papers
that estimate investment, prices and capital stock for theatrical movies, long-lived
television programs, music and miscellaneous artwork (Soloveichik 2013a, b, c and d).
This paper will consist of three sections. In section 1, I describe my data on
nominal revenues earned by the book industry and calculate the nominal value of book
production back to 1929. In section 2, I create a price index for books back to 1929, and

4
then use that price index to calculate real production of books back to 1929. In section 3,
I describe my data on book revenue and advertising costs by quarter since publication. I
then use that data to estimate the depreciation schedule for books. Finally, I use that
depreciation schedule to construct a historical time series measuring the aggregate value
of book originals from 1929 to 2010.
1. Nominal Book Production
What is a Book?
In this paper, I track the production of original books. I define original books as
any work that could reasonably be published in a book, regardless of what form it is
actually published in. This definition includes not only printed books, but also audio
books, digital books and books licensed to magazines for serial publication.1 There is no
requirement for literary critics to approve of the book – I include Harlequin romances and
textbooks along with great literary works. I also include works such as short stories,
poetry, etc. that could be collected and published in books.
On the other hand, I do not include texts with a short useful lifespan in my
analysis. For example, newspaper articles and magazine non-fiction are rarely
republished in books or any other medium. As a result, I exclude all revenue earned by
newspaper publishers and virtually all revenue earned by magazine publishers from the
industry definition. I also exclude licensing revenue earned by authors from movies,
television programs or other entertainment originals because those revenues are counted
in the value of movies, television programs, etc.
At first glance, my choice to include some magazine revenue seems contrary to
OECD’s recommendation to exclude newspapers and magazines entirely from the
category ‘literary original’ (OECD 2010 33.5). However, my treatment is in fact
consistent if we imagine a two stage process: first the author writes an original book, and
then he or she makes money by licensing that pre-existing book to a magazine for
1 I don not include comic strips published in newspapers because comics republished in books account for a relatively small fraction of total comic revenue. Newspaper comic strips and comic books are rarely republished, so they are considered a short-lived asset. Just like soap operas, comic strip formats are long-lived even though each individual strip is short-lived. Capitalizing formats is a project for another paper.

5
publication. This is similar to the treatment of music played on the radio. In the United
States, radio programs are very rarely replayed – and so radio programs are not
considered long-lived entertainment originals. Nevertheless, I count the revenue from
licensing music for radio airplay in the total value of a song (Soloveichik 2013b). The
song exists in its own right, and earns money from multiple sources. The fact that some
of the revenue sources are not long-lived entertainment originals is irrelevant.
Later in the paper, I will show that magazine licensing accounted for 40% of
revenues earned by authors from 1929 to 1945. After 1945, fiction magazines were
mostly replaced by paperback books (Goulart 1972). The new paperback books often
published the same type of material as fiction magazines had published previously and
were sold in the same retail outlets (Greco 2005). As a result, the switch from magazine
licensing to paperback printing had little impact on the creation of book originals. I
would significantly overestimate real growth of book writing 1940 to 1950 if I excluded
magazine licensing revenue from the industry definition. At the present time, magazine
licensing accounts for less than 3% of revenues earned by US authors.2
Tracking Nominal Book Revenues over Time
I use four main datasets to track book revenue from 1929 to 2010: a) The 2007
Economic Census; b) The Service Annual Survey from the Census Bureau; c) The
American Association of Publishers (AAP) survey and d) The periodic Census of
Manufactures survey. The 2007 Economic Census reports book sales in 2007. Those
sales statistics is used to calibrate all the other numbers in this paper. The Service
Annual Survey reports book sales from 2004 to 2010. The AAP survey reports annual
sales of books from 1986 to 2008. The Census of Manufactures was conducted less
frequently. I use the surveys from 1929, 1931, 1933, 1935, 1937, 1939, 1947, 1954,
1958, 1962, 1967, 1972, 1977 and 1982 to track nominal sales from 1929 to 1982
(interpolating between years with missing data).3 Because of interpolation, my sales
numbers before 1985 are artificially smooth. This does not affect my estimates of
2 Magazine licensing may increase in the near future. Over the last decade, graphic novels have dramatically increased their sales. Most of these graphic novels are reprints of non-US comic magazines (mostly Japanese), but some are US comics. 3 The Census Bureau provides its own interpolations after 1949. I use those interpolations when available.

6
average production, but it may change year to year production estimates significantly.
Finally, I benchmarked all estimates to the 2007 Economic Census.
I use a variety of datasets to estimate the revenue from licensing books for
magazine publication. I first used the Service Annual Survey, industry data and the
Census of Manufactures to estimate the total value of magazines sold for every year from
1929 to 2010. I then used data from the Audit Bureau of Circulation and a stratified
sample of magazine titles to estimate the annual market share for magazine fiction
(versus non-fiction like news).4 Finally, I benchmarked my estimates to the 1947 Census
of Manufactures, which reported magazine revenues by category.5
Figure 1 shows the annual sales of books for every year from 1929 to 2010. At
first glance, the most striking result from Figure 1 is the steady increase in nominal sales
from 1950 onwards. However, nominal GDP has also risen steadily over this time
period. In fact, the share of nominal GDP devoted to book sales has remained relatively
steady from 1950 to 2010.
Because my paper is focused on the production of new book manuscripts, I would
like to measure revenue by the year of first publication rather than year of sale. For
example a 2012 reprint of “Lord of the Rings” is attributed to 1937 – not 2012. Of
course, I don’t know how much books released in 2007 will earn in 2017. I use data on
current market shares for new books and old books to predict future earnings. This data
is described further in section 3. Given my predicted earnings, I calculate the net present
value (NPV) of new books:
Investment = (Sales of New Books)*[(NPV of all Sales)/ (Sales in First Year)]
In section 3, I calculate that new books account for 38% of total industry sales.6 I
also calculate that the net present value (NPV) of all future sales is 2.07 times sales in the
first year (at 7% real discount rate).7 Therefore, I calculate:
4 Many magazines published both fiction and non-fiction. I assumed that these mixed magazines had the same breakdown as the overall industry. For example, suppose that 1/3rd were straight fiction, 1/3rd were straight non-fiction and 1/3rd were mixed. 5This method treats all fiction magazine revenue as book licensing revenue. In fact, much of magazine revenue is spent to pay printing costs, sales costs, etc. However, the same holds true for book publishing revenue. For simplicity, I assume that magazine publishers had the same sales costs as book publishers. 6 In a previous version of this paper, I estimated the ratio of new book sales to total industry sales for each year from 1929 to 2008. My formula predicted that new books had very low sales during recessions and high sales during recoveries. Since then, I collected more data on sales after the financial crisis of 2008. I found that the market share for new books is relatively steady over the business cycle.

7
Investment = (Total Industry Sales)*.38*2.07 = 79% of Total Industry Sales.
At first glance, it might seem strange that investment is always lower than total
industry sales. However, this is a natural consequence of my discount rate. Original
books are long-lived assets, so many authors must wait five, ten or even fifty years before
they earn money. These future revenues occur far in the future, so they discounted
heavily when valuing a newly created book original.
Book Revenues After Subtracting Manufacturing and Advertising Costs
Of course, book revenues are not equal to returns on the original manuscript.
Publishers must pay for printing, sales and marketing before they can pay any royalties to
authors. According to the AAP survey data, manufacturing, shipping and billing
accounts for 45% of a book’s wholesale price. The AAP survey only applies to printed
books. Based on my research for music CDs and digital music, I estimate that audio
books spend 18% of their wholesale price on manufacturing and sales and e-books spend
1% of their wholesale price on physical costs (Soloveichik 2013b). E-books have grown
rapidly from 2009 to 2012, so the share of book revenue spent on physical costs has
fallen. After subtracting physical costs, the AAP survey reports that publisher spend 27%
of their revenue on marketing. I assume that the ratio of marketing costs to revenue after
physical costs is the same for printed books, audio books and e-books.
The remaining 33%-72% of wholesale book revenue is used to pay copyright
holders for the right to print their book. This includes publisher profits as well as author
royalties. It might seem that only author royalties should be counted when valuing book
copyrights. In practice, publishers are often unacknowledged contributors to the
production. For example, editors select pictures and lay-out text for clear reading and
other necessary editorial tasks. These editorial tasks cost money - and so it not
unreasonable for publishers to keep a portion of the profits from book sales to cover their
costs. I assume that publishers own 50% of books targeted towards the general public
7The 7% discount rate deflates future sales by the PCE deflator, not the book price index. Over the past 20 years, wholesale book prices have grown faster than the PCE. However, I believe investors holding book copyrights are concerned with revenues relative to GDP, not revenues relative to the book industry.

8
and independent authors own 50%. 8 Specialty books like textbooks or technical manuals
are often produced by entirely by publishers. I assume that publishers own 100% of
those books. Books targeted towards the general public account for approximately half
of the book industry, so I calculate that independent authors account for 25% (50%*50%)
of book investment. The remaining 75% of new investment is produced and owned by
publishing companies.9
As a robustness check on the AAP’s cost data, I also used retail price data for
books off copyright to estimate marketing costs and copyright owner profits. According
to standard monopoly theory, copyright owners maximize profits by selling their books at
a significant mark-up over manufacturing costs. In contrast, any publisher can print
books off copyright, and so those classic books should sell for approximately the
manufacturing costs plus bookstore costs.10 About 50% of the suggested retail price goes
to the bookstore for store costs (Greco 2005).11 Furthermore, the AAP cost data suggest
that physical costs account for about 22% of the suggested retail price. Therefore, prices
for classics off copyrights should be approximately 72% of copyrighted classic prices. I
checked this prediction with sales data from Nielsen Bookscan. I found that average
prices for classics off copyright are approximately 75% of average prices for copyrighted
classic prices. Heald (2007) also found similar results when he compared prices for a
sample of extremely popular classics on and off copyright.
The AAP cost survey runs from 1986 to 2007. Over that time period, printing
costs plus marketing costs are relatively steady around 64%. I was not able to find
comparable cost data before 1986. In the remainder of the paper, I will assume that
marketing costs plus manufacturing have been a constant share of publisher revenues
8 Authors typically retail legal ownership of their book copyright for fiction books. However, they are often contractually required allow publishers to reprint those books for a set time period in return for a set royalty. Therefore, the true economic ownership of a book is shared between authors and publishers. In contrast, it is common for publishers to hire writers for references books and textbooks. Because the authors are employees of the publisher, the publisher keeps ownership of the copyright. 9I assume independent authors own all books licensed for magazine publication 10Because each publisher has a small share of the classic book market, no single publisher is likely to advertise much. 11 Many bookstores offer substantial discounts from the suggested retail price. I include those discounts in the 50% store costs.

9
from 1929 to 2007.12 This assumption is consistent with the industry literature. For
example, a 1920 Atlantic article (Brett) on the book industry describes the cost
breakdown for a sample book. In that example, royalties were 25% of publisher revenue
and overhead costs were another 25%. If I attribute half of the overhead to book
production (deciding which books to produce, editing book manuscripts, etc.), then I
calculate that profits to the copyright holder were 37.5% of publisher revenues in 1920.13
This is extremely close to the 36% share given by the AAP data.
Figure 2 show the net present value of book production by year of initial release.
I calculate that the NPV of new books was $9.1 billion in 2007. Between 1929 and 2010,
the nominal value of new books rose by 5.7% per year. Unsurprisingly, I find that the
shape is very similar to the shape of Figure 1. The only difference is that Figure 2 is
always lower than Figure 1 because capital services from book originals are less than
book revenue.
Imports and Exports of Books
All of the sales data in Figure 1 are based on the Census survey of American
publishers. As a result, I miss royalties earned by US authors who license their works to
foreign publishers. Conversely, I improperly include the sales revenue from books
written by foreign authors and then printed by American publishers. In theory, the best
way to adjust data would be as follows:
(US Production in Year X) = (Value of Books printed in US) *(% US Authors in Year X)
+ (Future Value of Foreign Royalties Earned in Year X).
In practice, I have not been able to find any good data on the % US authors over
time. I experimented with constructing my own estimates of % US authors over time
using USA Today’s bestseller lists and Wikipedia, but that attempt only works for
12 The industry source “Books In Print” lists all editions for a particular book and their suggested retail price. I tried comparing suggested retail prices for books on and off copyright back to 1948. However, the results suggested that copyrighted books were actually cheaper. I believe that the problem is caused by collectors’ editions for classic books. These luxury printings sell very few copies, so they have little impact on average consumer prices. But they represent a larger percentage of ISBN numbers listed. 13 Relative to revenue, advertising was lower in 1920 and manufacturing was more, and the changes cancel.

10
authors famous enough to have Wikipedia pages.14 I have also been unable to find good
data on foreign royalties over time. The best data on foreign royalties that I could find
was a hypothetical profit breakdown for a high profile trade hardcover (Vogel 2004).
However, that hypothetical breakdown was for a single point in time, and so could not be
used to construct a reliable time series.15
I used Abebooks.com to get a rough idea of whether international trade in
royalties has changed over time. Abebooks is a website that allows potential booksellers
to list their used books and buyers to browse the used book listing. It is customary for
booksellers to post a brief description of the book containing any information they think
buyers might be interested in. I searched for descriptions containing the phrases:
“American author”, “English author”, “British author”, etc. for every year from 1914 to
2008. I then calculated the percentage American authors for US booksellers and non-US
booksellers over time. I found that neither percentage changed significantly over time.16
In other words, American authors now account for the same market share in the U.S. and
abroad as they did in the 1920s.17
Based on the stability seen in the Abebooks data, I can use US publisher sales as a
proxy for US author sales. As discussed earlier, U.S. publishers are not the same as U.S.
authors, and so my estimate may be biased. However, the potential bias from using U.S.
publisher data is the same for 1929, 1969 and 2009. Therefore, the growth rate of U.S.
writing over time should be correctly estimated.
Quarterly Book Production
This paper counts book investment when the book is first released, not when the
book was originally written. I make this choice for two related reasons: 1) It is extremely
14 I got pretty good coverage for recent books and top bestsellers, but authors who appeared lower on the list were very hard to track. 15 BEA does track book royalties in the trade in services survey. However, that survey is targeted towards large multinational companies and might not include independent authors. 16 Identified Americans account for 50% of books published by American publishers and 20% of books published by foreign publishers. I believe that these absolute statistics are skewed by the fact that American booksellers are more likely to mention nationality for foreign authors. I only look at changes over time. 17 Based on a linear regression from 1914 to 2008, with years clustered. I also experimented with splitting the sample at 1960. I found no significant trend before 1960, but a slight decrease in % American for foreign countries after 1960. For simplicity, I ignore the slight change.

11
difficult to measure book writing in real time. Accordingly, my quarterly numbers would
be too speculative to include in the NIPAs; 2) Conceptually, unreleased books could be
counted in inventories as “work in progress,” similar to the treatment of uncompleted
manufactured goods. This paper does not count unreleased books in inventory. Instead,
this paper is focused on how GDP changes when books are reclassified as capital assets.
2. Real Production
Defining A Price Index
In this analysis, I only consider the price of books sold. Therefore, I ignore free
digital books like fan fiction or blogs. I also ignore pirated books like illegal Xeroxes or
illegal transfers of electronic books. This definition is consistent with BEA’s general
practice of excluding illegal activity from the National Income statistics. At the present
moment, book piracy is relatively rare in the United States, so excluding pirated books
makes little difference. However, book piracy is rapidly increasing with the introduction
of digital books (Rich 2009), and so the treatment of pirated books may eventually
become important.
It is difficult to develop a price index for books. Each book is a unique artistic
creation, and so I can never compare the cost of producing two identical books over time.
Furthermore, the main input to producing a book is an author’s writing talent. Stephen
King can produce a far better story in one month than I could over my whole lifetime. In
this paper, I use producer price indexes (PPI) from the Bureau of Labor Statistics (BLS)
to create a price index for books from 1985 to 2007. I then use a variety of retail price
indexes for books to extend my time series back to 1929.
In my analysis, I assume that the quality of books has remained constant over
time. However, I do not assume that the quality of book consumption has remained
fixed. For example, audio books and electronic books have recently become very
popular. Similarly, modern textbooks often include websites, CD supplements and other
non-book elements. I believe that these changes are improvements in copying and
disseminating books. But the underlying book original is almost unaffected by the new

12
technology. In practice, this assumption is relatively mild. Book technology has not
changed nearly as much as other entertainment options such as music or television.
Recent Price Trends
Figure 3 shows the BLS’s producer price index for book publishers over time. On
average, the wholesale price of books rises by 3.9% per year. This inflation rate is
slightly higher than the overall inflation rate in the service sector, which averaged 3.2%
per year. The higher inflation rate is consistent with low productivity growth in the book
industry. After all, an author’s time is the main input to a great work of literature.
Computers and e-mail might make a few subsidiary tasks easier, but they don’t help an
author actually sit down and write the book. Furthermore, wages for highly skilled
workers have risen faster than low skilled wages in the last 20 years. As a result, prices
for services using highly skilled workers like authors and professors have risen faster
than services using low skilled workers like restaurant meals or cleaning.
As Figure 3 shows, the BLS’s PPI index does not match either of BEA’s pre-
existing price indexes for books. Recreation book prices are nearly flat from 1995 to
2010. In contrast, educational book prices rise very fast.18 When I weight the two
consumer price indexes by their wholesale revenue share, the BLS PPI tracks average
book prices reasonably closely. As a robustness check, I also collected wholesale price
data from the American Association of Publishers (AAP) has a yearly survey where they
ask publishers about wholesale prices for books. This yearly survey produces a
wholesale price index for consumer books that matches closely with the BLS’s PPI.
18The main reason for the different price trends is different inputs. Educational book authors tend to be highly skilled individuals. This group has experienced larger wage gains than the overall public. In contrast, recreational book authors are often ordinary people. Furthermore, recreational books benefited from chain book sales and internet sales driving down the average retail mark-up. Educational books are often sold directly to schools, so they had much less competition (Raff 2000). In addition, educational book prices may have been increased to compensate for used book sales. Finally, the BLS’s consumer book index uses a matched model technique to calculate inflation for books. This technique has been shown to underestimate inflation in other industries (Reinsdorf, Liegey and Stewart 1996).

13
Historical Price Trends
The BLS does not report book publisher’s PPI data before 1985.19 I will therefore
use a variety of price indexes as a proxy for wholesale book prices. From 1980 to 1984, I
use the BLS’s PPI for magazine publishers as a proxy for book publisher prices. From
1929 to 1979, I take my price indexes from BEA’s pre-existing deflators for recreational
books and educational books.20 Both price indexes are published in Table 2.4.4, (line 17
and line 22). The BEA’s deflators track retail prices, so they are not a perfect proxy for
wholesale book prices. As a robustness check, I experimented with calculating a price
index from the Census of Manufactures data. Overall, the Census of Manufactures
produced similar inflation to BEA’s price index, but the price series was more volatile
and only covered Census years.
Figure 4 combines the wholesale price index from Figure 3 and BEA’s retail
prices to create a time series from 1929 to 2010. The most striking result from Figure 4
is that inflation rates have not been constant over time. Between 1929 and 1959, book
prices rose by only 2.1% per year – about the same as the overall economy. Between
1959 and 1989, book prices rose by 5.3% per year – 0.8% higher than overall GDP
prices. Between1989 and 2010, book prices rose by 3.7% per year – 1.5% higher than
overall GDP prices. The results after 1959 are consistent with Baumol’s cost disease
hypothesis. According to that hypothesis, the price for goods with zero productivity
growth should rise much faster than overall inflation (Towse 2003). Before 1959,
printing technology improved rapidly (Genesove 1999) so book prices were able to stay
low. Between 1960 and 2005, printing technology did not change much. As a result,
book prices rose faster than overall inflation. In the past few years, e-readers like Kindle
have started to change the book industry. The new technology might lower book prices
going forward.
As a robustness check, I compared newspaper prices with my book price index. I
found that quality-adjusted newspaper prices track book prices closely. The match is not
always perfect, but they are generally close. These results are available upon request.
19 Between 1980 and 1985, the BLS reports a PPI for magazine publishers, but not book publishers. These two PPIs track very closely. I use the magazine PPI from 1980 to 1984. 20 Recreational books and educational books have very different price trends. Educational books are approximately half of the book market – so I average the two price series to get a single inflation rate.

14
Real Book Production
In Figure 5, I estimate real book production by combining the nominal production
index in Figure 2 with the price index in Figure 4. The most important result from Figure
5 is that real book production rose very slowly from 1970 to 2010. Over the same time
period, real GDP grew by 207%. Average GDP growth falls by 0.0014% (real) per year
when book production is classified as an investment activity. Between 1929 and 1970,
real book production rose at approximately the same rate as real GDP.
At first glance, the stagnant book production from 1970 to 2010 seems surprising.
US population grew by nearly 50% over that time period - so it might be expected that
the number of authors would also grow by 50%. In fact, technology changes have
dramatically changed the demand for books. Since 1970, the technology for listening to
music, watching movies and television has improved dramatically. Video games did not
even exist in 1970. Over the same time period, the technology for writing books, printing
books and enjoying books has changed little. Some creative people may have responded
to the new technologies by redirecting their energies from book writing to other forms of
entertainment. Newspapers have also experienced declining real sales and stagnant
readership since 1965 (Newspaper Association of America 2009).
Section 3: Depreciation of Book Originals Over Time
In this paper, I define the value of a book original as the expected present value of
future revenues minus future costs. I define the depreciation schedule as the rate at which
a book copyright declines in value over time. There are many possible reasons why a
book original might decrease in value over time. For example, all consumers in a target
market might have already bought the book. Alternatively, a book might fall out of
fashion because of cultural change. In this paper, I will not attempt to distinguish
between the various reasons a consumer might stop buying an old book. I simply attempt
to estimate the schedule at which authors and publishers earn money from their books,
and the costs associated with those revenues. In order to simplify my analysis, I track

15
only future sales of a particular book, and ignore the possible value of sequel rights or
movie licensing. I do not know if including sequel rights in my analysis would change
the depreciation schedule for books.
Which Books Are Used in My Sample?
My depreciation schedule is based only on the sales of non-revisable books. I
define a non-revisable book as one that is written once and then remains unchanged for
its entire lifespan. For example, Mark Twain wrote “Tom Sawyer” in the 1800’s, and
publishers have been reprinting the book since then.21 Similarly, a popular history book
like ‘John Adams’ by David Mccullough can be reprinted year after year. In contrast,
many genres are revised frequently. For example, textbook publishers generally publish
a new edition every few years. The new edition might be 90% the same as the old edition
– but it has all new page numbers and a few new chapters. Similarly, a self-help book
might reprint the same basic advice with a few new anecdotes.
It would be very hard to calculate depreciation rates for revisable books. The new
edition might be virtually the same as an old book, or it might be completely different.
There’s no way to tell without reading both books side by side. In this analysis, I assume
that revisable books follow the same depreciation profile as non-revisable books.
Because publishers are periodically editing the revisable books, the future revenues are
always higher for revisable books – but so are the future costs.22
Datasets Used
My main dataset for estimating sales over time is Nielsen’s Bookscan data. This
dataset provides weekly sales data for a sample of more than seven hundred thousand
separate books. Nielsen’s Bookscan data is based on store scanner data, and so it tracks
21 Many publishers do minor edits like updating spelling, removing controversial words or adding pictures. I used my judgment to date translations. For off copyright books like the Bible, I dated the book to the date of translation. For newer books, I dated it to the original publication. 22 In other words, suppose that $1 spent writing a mystery book in 2009 produces $0.75 revenue net of sales costs in 2010, $0.38 revenue net of sales costs in 2011, $0.19 revenue net of sales costs in 2012, etc. An encyclopedia writer might spend $1 researching in 2009 for a brand-new encyclopedia and then earn $0.75 in 2010 from the first edition. In 2010 he’ll spend $0.50 updating the new encyclopedia and then earn $0.75 from the 2011 version, etc. This revenue stream could be explained by the same depreciation profile for encyclopedia writing as for mystery books.
16
actual retail sales across the US. The Bookscan data includes online retailers like
Amazon, physical bookstores like Barnes & Nobles and non-traditional bookstores like
Starbucks or Toys R’ Us.23 Furthermore, Bookscan data includes audio books as well as
printed books.24 Early in the sample, Nielsen was rapidly adding stores to their dataset,
and so data across time may not be consistent. I therefore focus on sales since 2004,
when Nielsen stabilized their sample. In my empirical analysis, I selected a stratified
subsample of approximately 7,000 books, with an over sample of popular book editions.
I then downloaded weekly sales for the books in my sample.
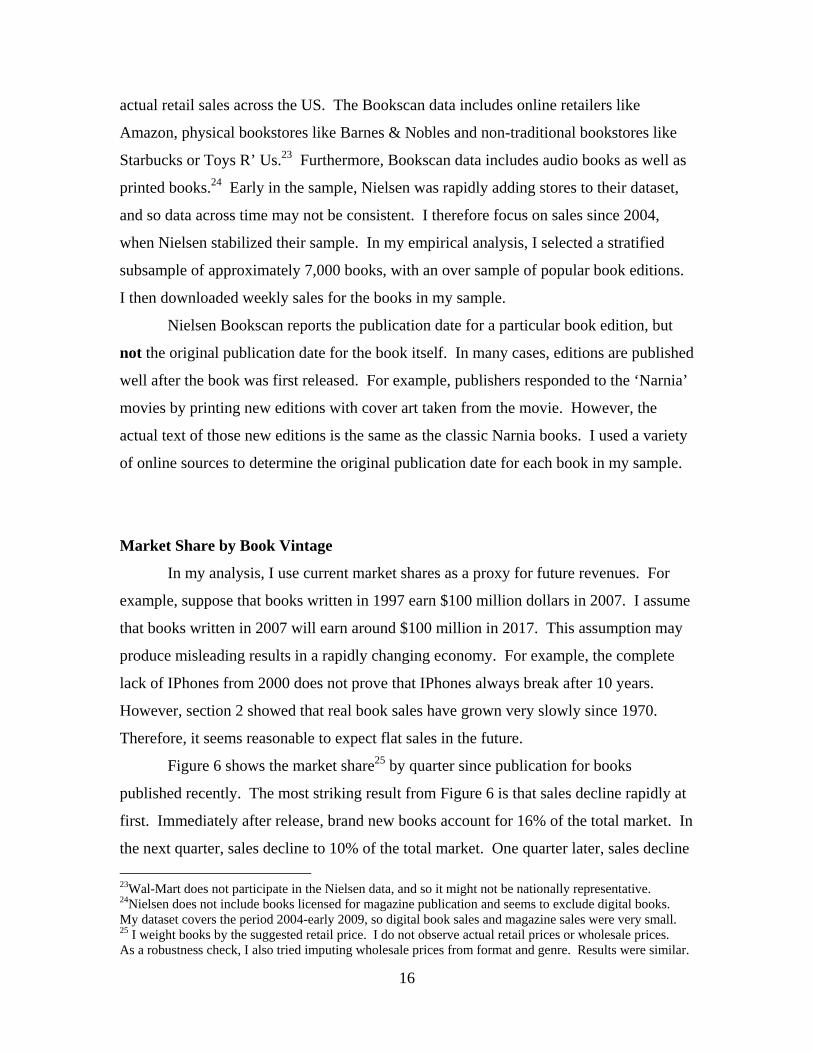
Nielsen Bookscan reports the publication date for a particular book edition, but
not the original publication date for the book itself. In many cases, editions are published
well after the book was first released. For example, publishers responded to the ‘Narnia’
movies by printing new editions with cover art taken from the movie. However, the
actual text of those new editions is the same as the classic Narnia books. I used a variety
of online sources to determine the original publication date for each book in my sample.
Market Share by Book Vintage
In my analysis, I use current market shares as a proxy for future revenues. For
example, suppose that books written in 1997 earn $100 million dollars in 2007. I assume
that books written in 2007 will earn around $100 million in 2017. This assumption may
produce misleading results in a rapidly changing economy. For example, the complete
lack of IPhones from 2000 does not prove that IPhones always break after 10 years.
However, section 2 showed that real book sales have grown very slowly since 1970.
Therefore, it seems reasonable to expect flat sales in the future.
Figure 6 shows the market share25 by quarter since publication for books
published recently. The most striking result from Figure 6 is that sales decline rapidly at
first. Immediately after release, brand new books account for 16% of the total market. In
the next quarter, sales decline to 10% of the total market. One quarter later, sales decline
23Wal-Mart does not participate in the Nielsen data, and so it might not be nationally representative. 24Nielsen does not include books licensed for magazine publication and seems to exclude digital books. My dataset covers the period 2004-early 2009, so digital book sales and magazine sales were very small. 25 I weight books by the suggested retail price. I do not observe actual retail prices or wholesale prices. As a robustness check, I also tried imputing wholesale prices from format and genre. Results were similar.

17
further to 5%. After the first year, sales stabilize and the depreciation rate becomes
much smaller. Because I use means, these results are heavily influenced by a few
successful books. The “typical” book sells only a few copies right after publication and
then disappears forever (Greco 2005). However, I believe it is appropriate to focus my
attention on the small number of successful books. These books account for the majority
of industry revenue and profits. Accordingly, depreciation for those books accounts for
the majority of total industry depreciation.
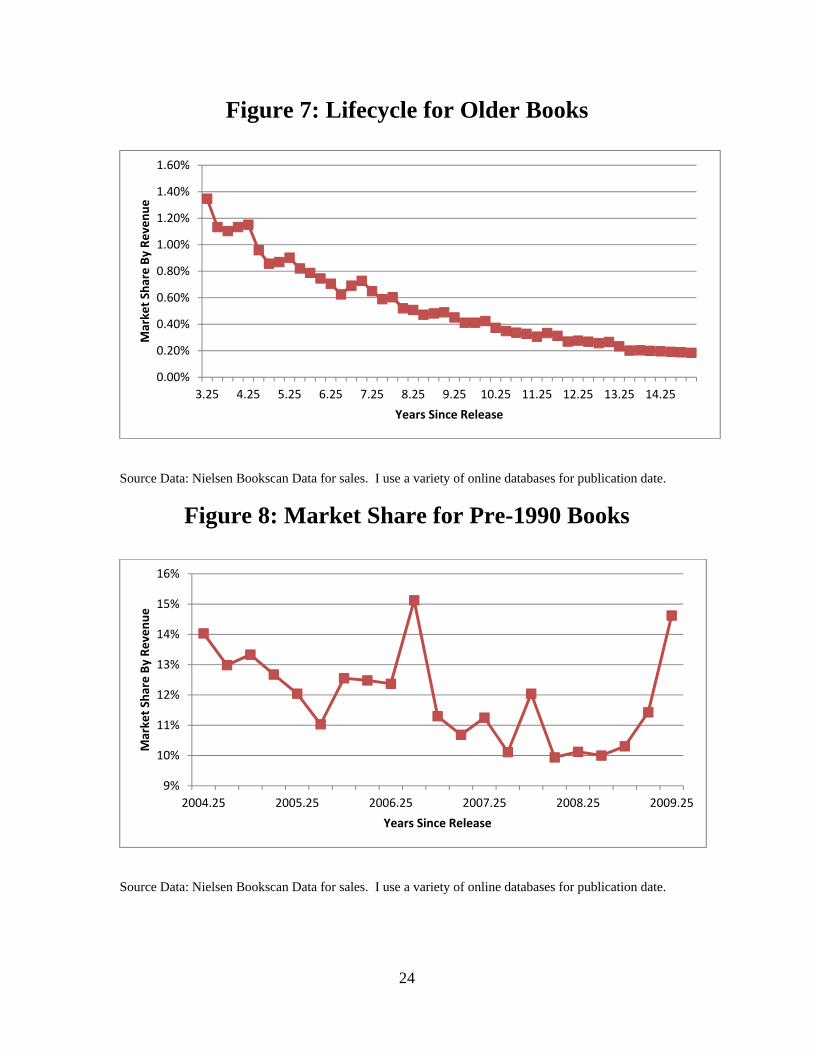
Figure 7 shows the market share by quarter for slightly older books. I find that
sales decrease slower than in Figure 6, but still reasonable fast. Between age 3 and age
13, sales decrease by more than 80%. This is equivalent to a depreciation rate of 15% per
year. After age 13, the depreciation rate slows significantly. Figure 8 shows the market
share for a fixed sample of books published before 1990. Between 2004 and 2008, sales
for these classic books drop from 14% of the total market to 10% of the total market.
This works out to a depreciation schedule of 7% per year. Results are similar if I graph
the market share for older books at a single point in time.
The main sample used in this paper tracks book sales from January 2004 to early
2009. The economy was booming over that time period, and so book sales were
relatively high. Book sales dropped dramatically when the financial crisis hit and have
been down since then. It is possible that depreciation schedules are different in a
booming economy and a bust economy. To check, I downloaded a smaller sample of
book sales from January 2004 to May of 2010. I found that the market share for new
books was almost identical in the 2009 as in better economic times. Therefore, my
depreciation schedule is not sensitive to the time period studied.
Sales Costs by Book Vintage
According to the American Association of Publishers, marketing accounts for
19% of total publisher costs.26 I use advertising data from Kantar Media to track
marketing expenses over time. Kantar Media tracks advertising $’s by individual book
editions and non-specific advertising by publishing houses. In my empirical analysis, I
26 The American Association of Publishers probably counts publishers’ costs for author tours, but not the value of author’s time. Marketing costs might be higher if those time costs were included.

18
selected a stratified sample of 1,000 separate items and then looked up the publication
date for each individual book edition. Kantar Media does not track non-advertising
marketing like author tours, salesmen visiting retail stores or catalogues featuring a new
book. Kantar Media also omits within-company advertising such as sample chapters in
the back of a book. In my analysis, I assume that all marketing has the same profile over
time as out-of-pocket advertising for individual books.
Figure 9 shows the market share for advertising by quarters since release. I find
that 68% of marketing occurs in the first quarter after release and 87% of marketing
occurs within the first year.27 After the first year, there is a steady trickle of marketing.
According to the American Association of Publishers, book production and sales
account for 45% of wholesale prices for print books. I do not have any direct data on
printing costs by book vintage. However, hardcover books (which are mostly new) and
paperbacks (which are often older) spend approximately the same percentage of revenue
on printing. In my analysis, I assume that production spending is 45% of revenue for
every quarter from release until the copyright expires.
Figure 10 calculates the depreciation schedule for book originals. Book originals
depreciate rapidly regardless of whether I track revenue or profits. When I track revenue,
book originals lose 80% of their value in the first five years of life. Depreciation is
slightly slower when I track profits, but original books still lose 64% of their value in the
first five years of life. In the national accounts, I approximate the depreciation schedule
shown in Figure 10 with a geometric depreciation rate of 12.06% per year. This
geometric rate produces similar estimate of aggregate capital stock
At first glance, the short lifespan for book originals suggests that almost nobody
reads classic books. In fact, book copies are durable goods. Accordingly, a library might
purchase a book copy soon after release, and then lend it for decades to come. Similarly,
consumers who discover an old author can often buy used copies of his or her works
without the author or publisher making any new money. In this paper, I am focused on
27 This includes marketing before a book is released.

19
estimating the lifespan of a book original to the author or publisher. The lifespan of an
already purchased book in the consumer’s library is irrelevant to my research.28
Figure 11 calculates the total capital stock of books from 1929 to 2010 using the
real production estimates given in Figure 6 and the depreciation schedule given in Figure
11. I find that the real capital stock grew rapidly from 1929 to 1965, grew slowly from
1965 to 1990 and then stabilized at around $66 billion real from 2001 to 2007. Both the
geometric rate and the complex depreciation schedule produce similar trends over time.
Conclusion
In this paper, I constructed NIPA estimates when production of original books is
treated as an investment activity rather than an intermediate expense. This change helps
bring the NIPAs in line with SNA 2008, which recommended that entertainment originals
be treated as capital assets.
In order to construct the NIPAs, I collected a great deal of data. I first estimated
the nominal production of books from 1929 to 2010. I then constructed a price index for
books from 1929 to 2008. Finally, I estimated the depreciation schedule for books.
To review, my empirical results were
1) New books have a useful lifespan of at least 50 years, but they earn most of
their profits in the first few years. On average, books lose 12% of their value each year.
2) Nominal book investment has hovered around 0.06% of nominal GDP from the
1930’s until 2010. Therefore, nominal GDP growth does not change much when book
production is classified as an investment activity;
3) After 1970, book investment prices rose faster than overall GDP prices.
Accordingly, average inflation rises slightly when book production is classified as
investment. Before 1970, book investment prices roughly track overall GDP prices.
28 BEA calculates the capital stock of consumer durables. In order to do this, BEA estimates consumer purchases of books and their lifespan. This lifespan was estimated using very different techniques than described in my paper.

20
Table 1: List of Main Datasets Used and How They Are Used
Dataset Description of Dataset Used to Create
Service Annual Survey
This survey is conducted by the Census every year from 2004 onwards. It reports revenues for the book industry Nominal Book Sales
Census of Manufactures
This survey was conducted periodically by the Census. I interpolate between missing years to get annual sales of books Nominal Book Sales
2007 Economic Census
This survey reports book sales in 2007. All the investment numbers are benchmarked against this survey Nominal Book Sales
American Association of
Publishers Surveys
This survey is conducted by the American Association of Publishers for every year from 1985 onwards. It reports annual sales, cost of production, average prices for books and other information.
Nominal Book Sales, Nominal Book Production
Nielsen Bookscan
This dataset tracks consumer book sales from 2000 to 2009.
Depreciation Schedules, Nominal Production, Real Production
Audit Bureau of Circulation
This dataset tracks magazine sales from 1914 to 2009. They also give information about the magazine’s genre, average price, etc.
Revenue from Books Licensed to Magazines
Online databases, including Amazon, Barnes & Nobles and Wikipedia
These databases were used to determine the original publication dates for books in my Nielsen sample. Depreciation Schedules

21
Figure 1: Nominal Books Sales Over Time
Source Data: AAP, Surveys of Manufacturers, Service Annual Survey, Audit Bureau of Circulation
Figure 2: Book Revenues Over Time (Nominal)
Source Data: Figure 1 revenues, printing costs from the AAP surveys and other cost research
100
200
400
800
1,600
3,200
6,400
12,800
25,600
201020001990198019701960195019401930
Millions of $'s
Wholesale Book Revenue NPV of Future Revenue from New Books
50
200
800
3,200
12,800
201020001990198019701960195019401930
Millions of $'s
Wholesale Book Revenue NPV of Future Revenue from New Books

22
Figure 3: Book Prices from 1985 to 2010
Source Data: BLS website, BEA website
Figure 4: Book Prices from 1929 to 2010
Source Data: BLS website, BEA website
30
50
70
90
110
130
150
201020052000199519901985
Base Year 2005 = 100
BEA Price Index for Educational Books BEA Price Index for Recreational Books
BLS PPI PCE Services
4.00
8.00
16.00
32.00
64.00
128.00
201020001990198019701960195019401930
Base Year 2005 = 100
Price Index for Books Overall GDP Prices

23
Figure 5: Real Book Revenues Over Time
Source Data: Nominal production from Figure 2. Price Index from Figure 5
Figure 6: Lifecycle for New Books
Source Data: Nielsen Bookscan Data for sales. I use a variety of online databases for publication date.
0
2,000
4,000
6,000
8,000
10,000
12,000
201020001990198019701960195019401930
Millions of $'s (2005)
Wholesale Book Revenue NPV of Future Revenue from New Books
0%
2%
4%
6%
8%
10%
12%
14%
16%
18%
20%
0 1 2 3
Market Share By Revenue
Years Since Release
24
Figure 7: Lifecycle for Older Books
Source Data: Nielsen Bookscan Data for sales. I use a variety of online databases for publication date.
Figure 8: Market Share for Pre-1990 Books
Source Data: Nielsen Bookscan Data for sales. I use a variety of online databases for publication date.
0.00%
0.20%
0.40%
0.60%
0.80%
1.00%
1.20%
1.40%
1.60%
3.25 4.25 5.25 6.25 7.25 8.25 9.25 10.25 11.25 12.25 13.25 14.25
Market Share By Revenue
Years Since Release
9%
10%
11%
12%
13%
14%
15%
16%
2004.25 2005.25 2006.25 2007.25 2008.25 2009.25
Market Share By Revenue
Years Since Release

25
Figure 9: Lifecycle of Advertising for Recent Books
Source Data: Kantar Media for marketing. I use a variety of online database for publication date.
Figure 10: Depreciation Schedule for Books
Source Data: Sales data from Figure 6-8, marketing data from Figure 9, printing costs from industry data.
0%
10%
20%
30%
40%
50%
60%
70%
80%
0.00 1.00 2.00 3.00
Advertising Share By Revenue
Years Since Release
0.00
0.20
0.40
0.60
0.80
1.00
1.20
1.40
0 1 2 3 4 5 6 7 8 9 10 11 12 13 14 15
Market Share By Revenue
Years Since Release
Depreciation, Revenue before Costs Depreciation, Profits

26
Figure 11: Real Capital Stock of Book Originals
Source Data: Real sales from Figure 5, depreciation schedule from Figure 9
0
10
20
30
40
50
60
70
201120011991198119711961195119411931
Billions of $'s (2005)
Capital Stock from Complex Depreciation Capital Stock With Geometric Depreciation Rate
27
Bibliography
Brett, George. (1920). Making of Many Books The Atlantic Monthly, October, 471-476
Bridgman, Benjamin. (2008). Do Intangible Assets Explain High U.S. Foreign Direct
Investment Returns? BEA Working Paper 2008-06
Fraumeni, Barbara, Robinson, Brooks, Reinsdorf, Marshall and Williams, Matthew.
(2008). Price and Real Output Measures for the Education Function of Government:
Exploratory Estimates for Primary and Secondary Education. NBER Working Paper
14099.
Genesove, David. (1999). The Adoption of Offset Presses in the Daily Newspaper
Industry in the United States NBER Working paper 7076
Goulart, Ron. (1972). Cheap Thrills: An Informal history of the Pulp Magazines
Arlington House Production
Greco, Albert. (2005). The Book Publishing Industry, Second Edition Lawrence Erlbaum
Associates
Heald, Paul. (2007). Property Rights and the Efficient Exploitation of Copyrighted
Fiction Bestsellers. chapter in New Directions in Copyright Law. Edward Elgar Press
Newspaper Association of America. (2009). Trends & Numbers. Accessed June 30, 2009.
http://www.naa.org/
OECD. (2010). Handbook on Deriving Capital Measures for Intellectual Property
Production. Accessed May 15, 2013. http://www.oecd.org/std/na/44312350.pdf
Raff, Daniel. (2000). Superstores and the Evolution of Firm Capabilities in American
Bookselling. Strategic Management Journal, 21, 1043-1059

28
Reinsdorf, Marshal, P. Liegey and K. Stewart. (1996). New Ways of Handling Quality
Changes in the US Consumer Price Index. BLS Working Paper No. 276
Rich, Motoko. (2009). With E-Readers Comes Wider Piracy of Books. New York Times.
May 12, 2009. Accessed May 15 2013.
http://www.nytimes.com/2009/05/12/technology/internet/12digital.html
Robbins, Carol and Moylan, Carol. (2007). Research and Development Satellite Account
Update. Survey of Current Business October 2007, 16-27
Soloveichik, Rachel. (2013a). Long-Lived Television Programs As Capital Assets.
manuscript
Soloveichik, Rachel. (2013b). Music As Capital Assets. manuscript
Soloveichik, Rachel. (2013c). Miscellaneous Artwork As Capital Assets. manuscript
Soloveichik, Rachel. (2013d). Theatrical Movies as Capital Assets. manuscript
Towse, Ruth. (2003). A Handbook of Cultural Economics. Edward Elgar Publishing
United Nations Statistics Division. (2008). Updated System of National Accounts 2008.
Accessed May 19 2013. http://unstats.un.org/unsd/nationalaccount/sna2008.asp