Embed Size (px)
Citation preview
The Measurement and Trends of Unemployment in Indonesia: The Issue of Discouraged Workers
The findings, views, and interpretations published in this report are those ofthe authors and should not be attributed to the SMERU Research Institute or any of the agencies providing financial support to SMERU. For further information, please contact SMERU, Phone: 62-21-31936336; Fax: 62-21-31930850; E-mail: [email protected]; Web: www.smeru.or.id
Daniel Suryadarma
Asep Suryahadi
Sudarno Sumarto
July 2005
Working Paper
The Measurement and Trends of Unemployment in Indonesia:
The Issue of Discouraged Workers
Daniel Suryadarma
Asep Suryahadi
Sudarno Sumarto
SMERU Research Institute
Jakarta
July 2005
SMERU Research Institute, July 2005
Suryadarma, Daniel The Measurement and trends of unemployment in Indonesia: the issue of discouraged workers/Daniel Suryadarma, Asep Suryahadi, Sudarno Sumarto. – Jakarta: the SMERU Research Institute, 2005. – ii, 23 hal.: ilus; 31 cm. – SMERU Working Paper. – ISBN 979-3872-11-X 1. Suryahadi, Asep i. Title 2. Sumarto, Sudarno ii. Unemployment 331.137/DDC 21
SMERU Research Institute, July 2005 i
TABLE OF CONTENTS
Abstract ii
I. Introduction 1
II. Studies on Unemployment in Indonesia: An Overview 3
III. Data 5
IV. The (Open) Unemployment 6
V. The Discouraged Workers 10 A. The Profile of Discouraged Workers 10 B. The Willingness to Work 12 C. Should Discourage Workers be Included in the Labor Force? 15 D. Why do They Become Discouraged? 18
VI. Conclusion 21
References 22
SMERU Research Institute, July 2005 ii
The Measurement and Trends of Unemployment in Indonesia:
The Issue of Discouraged Workers
Daniel Suryadarma Asep Suryahadi
Sudarno Sumarto
SMERU Research Institute, Jakarta
Abstract
This study provides an overview of the concepts used to measure unemployment in Indonesia and their consequences for the measured unemployment trends. One finding shows that BPS’s decision in 2001 to relax the definition of labor force by including discouraged workers has resulted in an artificially high open unemployment rate and disguises the actual decline in traditionally-measured open unemployment rates post-crisis. Another finding indicates that discouraged workers in Indonesia are not confined only to the poor and those who are denied access to the proper job market. We recommend that, if Indonesia still wants to utilize a broader definition of the labor force, the measurement of open unemployment should adhere to the ILO’s recommendation of only including those discouraged workers who are still willing to work. The discouraged workers who are unwilling to work should be left in the “out of labor force” category.
Key words: discouraged workers; open unemployment; measurement; Indonesia.
SMERU Research Institute, July 2005 1
I. INTRODUCTION
In just seven years between 1994 and 2001, Statistics Indonesia (BPS) changed its definition of open unemployment twice.1 Both of these changes resulted in significant jumps in the reported unemployment rates. First, in 1994, BPS removed the qualifying time period of actively seeking work. Prior to 1994, a person was considered to be actively looking for work if s/he had actually looked for work during the week preceding the survey. Starting from 1994, a person is considered to be actively looking for work if s/he had looked for work, regardless of when the last time s/he actually actively looked for work, as long as s/he is still waiting for the result of the job search. This change of definition explained most of the increase in the open unemployment rate from 2.78% in 1993 to 4.37% in 1994.2 Furthermore, it renders the unemployment rates between the period preceding 1994 and the period from 1994 onward incomparable. It is impossible to calculate the unemployment rates for the latter period based on a definition of unemployment that would be comparable to the earlier period, or vice versa, since the survey question has been completely modified. In 2001, BPS once again altered their definition of unemployment to include three more groups of the unemployed on top of the traditionally measured-unemployed, which is defined as part of the labor force who are not working and actively looking for work. The three additional groups of unemployed people are: (i) those who are not working and are not actively looking for work because they do not believe work is available (discouraged workers), (ii) those who already have jobs but have not started working, and (iii) those who are preparing a business. Prior to 2001, these groups of people would be considered out of the labor force, hence not included in the unemployment rate calculation. The first group makes up the majority of the additional persons considered unemployed under this new definition of open unemployment. This study provides a critical overview on the measurements of unemployment that have been used in Indonesia and their consequences on the measured trends of unemployment rates in the country. The data used in the analysis is based on Sakernas, the national labor force survey, which spans an 18-year period, covering the high growth pre-crisis period between 1986 and 1997, the economic crisis period of 1997-1999, as well as the post-crisis period up to 2003. Specifically, this paper discusses the open unemployment rates in Indonesia between 1986 and 2003, using both the official rates and our attempt to calculate comparable rates.
1 Statistics Indonesia or Badan Pusat Statistik (BPS) is the Indonesian Government agency responsible for collecting and publishing statistical data. 2 Manning & Junankar (78-79).
SMERU Research Institute, July 2005 2
The rest of the paper is organized as follows: section two provides a brief overview of unemployment in Indonesia based on various studies available, section three discusses the data that we use in this study, section four discusses the changes in the official definition of open unemployment and their consequences on the measured unemployment rates, section five discusses the discouraged workers phenomenon, while section six provides the conclusions.
SMERU Research Institute, July 2005 3
II. STUDIES ON UNEMPLOYMENT IN INDONESIA: AN OVERVIEW
During the period covered in our study, there were two substantial shocks to the Indonesian economy that significantly affected the unemployment situation in the country.3 The most widely known shock is, of course, the economic crisis which commenced in 1997-98 and constituted a large negative shock in the labor market.4 Since there have already been many studies about the crisis,5 we will not discuss the crisis per se. The other shock, and this one had a direct impact on reducing unemployment, was the deregulation of the banking industry in 1988, an initiative that is more widely known as Pakto 88. This deregulation package reduced the requirements for establishing banks in Indonesia and resulted in increased competition among banks. The direct effect on the labor market was a significant decrease in unemployment in urban areas and especially among highly educated workers.6 Other than Pakto 88, there was also widespread deregulation in other sectors of the economy in the 1990s. In facing the economic crisis, according to Ahmed & Dhanani, workers responded to the initial shock between August 1997 and August 1998 by flooding the labor market, shown by a 3.5% increase in the size of the labor force. Most of the increase came notably from females, who had been engaged in housekeeping activities prior to the crisis, entering the labor force to support their family. In total, there was an increase of 4.8% in female labor force participation, twice the increase in male labor force participation (Ahmed & Dhanani, 17). Shortly after that, however, faced by the difficulties in finding jobs, many workers became discouraged.7 Between August and December in 1998, the labor force shrank by 2.5%, while the non-economic activity of housekeeping experienced a 22% increase (Ahmed & Dhanani, 17). Furthermore, the crisis caused a movement of people back into informal-rural employment as evidenced by the increase in the share of the agricultural sector in employment. In fact, this sector was the only sector that experienced employment expansion during the crisis. More evidence is provided by the informal sector’s employment share in the economy as a whole, which increased by almost four percentage points from 61% to 64.7% between 1997 and 1998. On the other hand,
3 Actually there is another shock that in the long run may affect unemployment significantly. This is the decentralization process that started in 2001. It is not discussed in this paper, however, since we might not yet be able to see any impact after such a short period. 4 For discussions on the Indonesian economic crisis and its impact on the labor market, see Ahmed & Dhanani, “Indonesia’s Recovery”; Feridhanusetyawan & Gaduh, “Indonesia’s Labor Market”; and Manning “Labour Market Adjustment.” 5 For example Kenward, From the Trenches; Levinsohn et. al., “Impacts”; Strauss et al., Indonesian Living Standards; and Suryahadi & Sumarto, “Poverty and Vulnerability”. 6 Suryahadi et al., “Openness.” 7 Discouraged workers are defined as jobless workers who want jobs but do not look for one because they do not believe a job is available for them.
SMERU Research Institute, July 2005 4
the hardest hit sector was manufacturing, where 1 million workers lost their jobs (Ahmed & Dhanani, 19). Another study by Dhanani criticizes BPS’s measure of open unemployment, because he believed the strict measure of defining a person to be unemployed when s/he is currently not working and is actively looking for work lends to an understatement of the unemployment rate in Indonesia. He argued that the definition misses out on the discouraged workers (Dhanani, 28).8 This is also the main finding of Ahmed & Dhanani, where they estimated that there were an extra 10 million unemployed ‘missing workers’ in the Indonesian economy in 1998 (Ahmed & Dhanani, 4, 5, 8, 33).
8 It is interesting that although Dhanani’s study was published in 2004, it did not mention BPS’s decision in 2001 to change the definition of unemployment to include discouraged workers.
SMERU Research Institute, July 2005 5
III. DATA
In this paper we mainly use Sakernas, the annual National Labor Force Survey, for every year between 1986 and 2003 except in 1995 when Sakernas was not conducted. We use the labor force module of Supas, the Inter-Census Population Survey, to substitute for Sakernas in 1995. In addition, in section V we use Susenas, the National Socio-economic Survey, since the calculations in this section require socio-economic variables that are not available in Sakernas. All of these surveys are conducted by BPS. Sakernas is an annual, nationally representative, repeated cross-section, labor force survey that collects activity data of individuals in the sampled households, although the depth of its representativeness varies by year. Every year, on average Sakernas has around 200,000 observations on individuals at or above 15 years of age, the labor force age threshold that is used in Indonesia. Supas is a survey that is conducted in the middle of the period between two population censuses. Since it is intended as a mid-term check of trends data based on census, Supas has a much larger sample than Sakernas. In 1995, it has more than 600,000 observations on individuals that are suitable for our purposes. Due to this different sampling nature, however, the unemployment rate obtained from Supas is significantly higher than that from Sakernas. We take this difference into account in our analyses. Susenas, meanwhile, is a nationally representative household survey, which has two main components. The first one is Core Susenas, which collects basic socio-demographic information on households and individuals and is conducted annually. The second component, Module Susenas, gathers detailed information on households. There are three different modules – consumption, health and education – which are conducted alternately every year, so each module is conducted every three years. The Core covers about 200,000 households and 800,000 individuals, while the Module covers a sub-sample of about 65,000 households. In this paper we use Susenas 2002 because it was the most recent Consumption Module year and, therefore, enables us to examine quite detailed household consumption expenditure data. Since we have merged the Core and Module Susenas, we have a total observation of around 65,000 households.
SMERU Research Institute, July 2005 6
IV. THE (OPEN) UNEMPLOYMENT
While we believe the modification of unemployment definition in 2001 is a BPS attempt to accommodate the ILO’s definition of “discouraged workers” as defined in Hussmanns et al. (107-108), there is a fundamental difference between the two. ILO defines discouraged workers as those who fulfill all the conditions set out by BPS and are willing to work. In contrast, BPS’ discouraged workers do not differentiate whether a discouraged worker is willing to work or not. So in BPS’ discouraged worker classification, there are actually two groups of workers who are not looking for work: those who are willing to work, and hence fall within the ILO’s definition of discouraged workers, and those who are not willing to work. In section V we will discuss this issue further. In contrast, Ahmad & Dhanani’s definition of “missing workers” (8) is slightly different to both the ILO and BPS because it only measures those who want work but are not looking for one, regardless of the reason why they do not look for work.9
To determine whether a person who is not working and not actively looking for work is to be included in the “out of labor force” or “discouraged worker” category, a question in the Sakernas questionnaire asks the respondent to state the main reason why s/he is not looking for work. The question is in a closed form with several options to choose from. If the respondent chooses the answer “because s/he does not believe a job is available for her/him”, then s/he is classified as a discouraged worker. Otherwise s/he is considered not in the labor force. This means that choice between “out of labor force” and “discouraged worker” depends on the subjective answer of the respondent. It might not be so easy or straightforward for a respondent to choose the main reason why s/he is looking for work, in particular if s/he has multiple reasons.
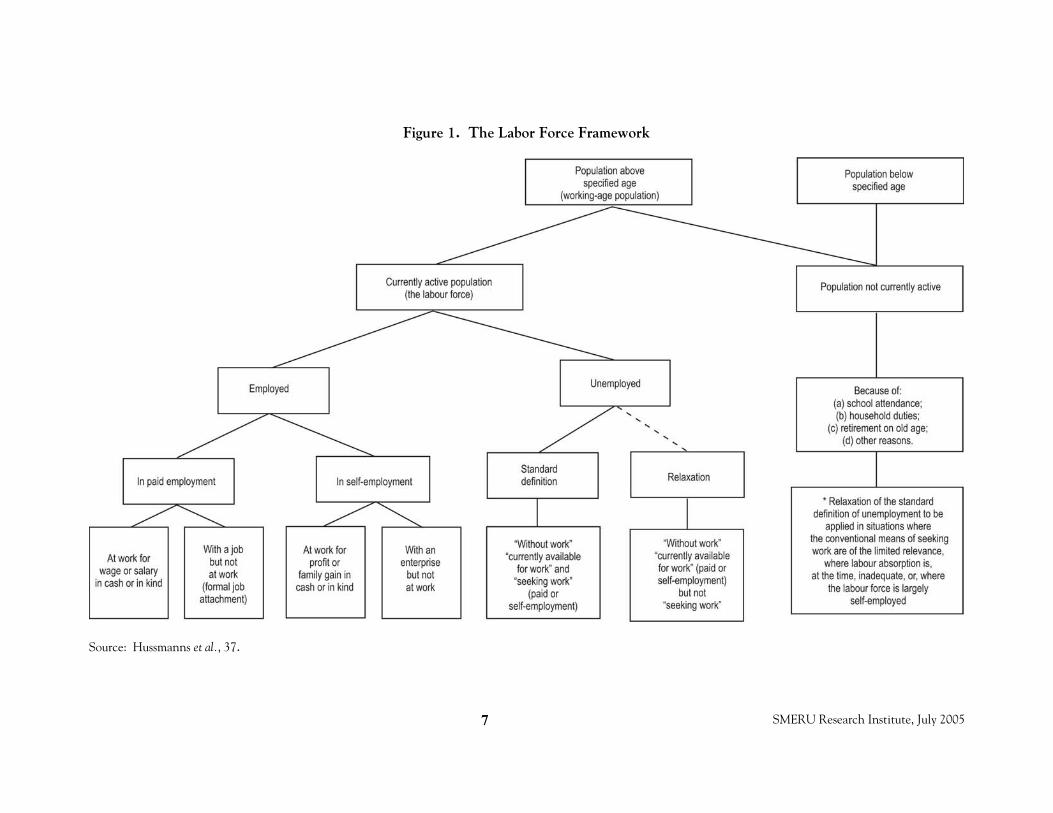
Figure 1 shows the internationally recognized labor force framework published by ICLS10 (Hussmanns et al., 37). As shown in the figure, all of the extra labor force included in the new BPS definition is out of work, so their inclusion in the labor market will automatically increase the open unemployment rate.
9 In South Africa, the unemployment measure that includes missing workers is called broad unemployment (Kingdon & Knight, 1). 10 ICLS: International Conference of Labour Statisticians.
SMERU Research Institute, July 2005 7
Figure 1. The Labor Force Framework
Source: Hussmanns et al., 37.
SMERU Research Institute, July 2005 8
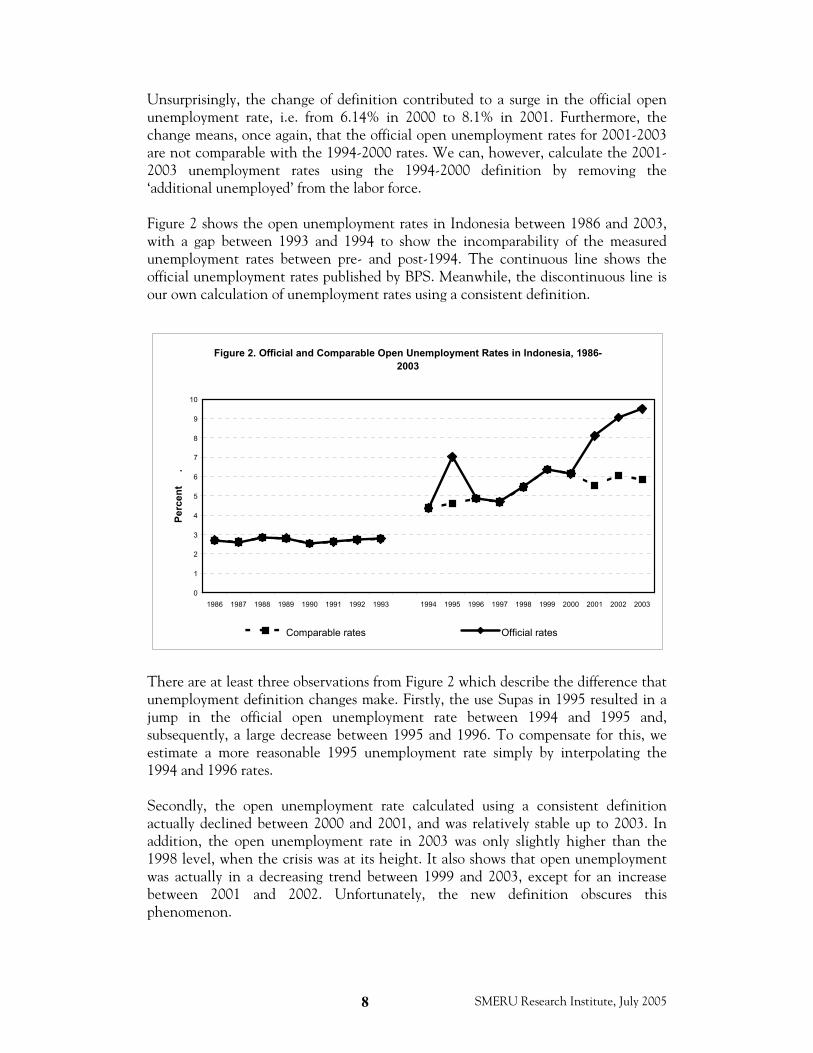
Unsurprisingly, the change of definition contributed to a surge in the official open unemployment rate, i.e. from 6.14% in 2000 to 8.1% in 2001. Furthermore, the change means, once again, that the official open unemployment rates for 2001-2003 are not comparable with the 1994-2000 rates. We can, however, calculate the 2001-2003 unemployment rates using the 1994-2000 definition by removing the ‘additional unemployed’ from the labor force. Figure 2 shows the open unemployment rates in Indonesia between 1986 and 2003, with a gap between 1993 and 1994 to show the incomparability of the measured unemployment rates between pre- and post-1994. The continuous line shows the official unemployment rates published by BPS. Meanwhile, the discontinuous line is our own calculation of unemployment rates using a consistent definition.
Figure 2. Official and Comparable Open Unemployment Rates in Indonesia, 1986-
2003
0
1
2
3
4
5
6
7
8
9
10
1986 1987 1988 1989 1990 1991 1992 1993 1994 1995 1996 1997 1998 1999 2000 2001 2002 2003
Perc
ent
.
Comparable rates Official rates
There are at least three observations from Figure 2 which describe the difference that unemployment definition changes make. Firstly, the use Supas in 1995 resulted in a jump in the official open unemployment rate between 1994 and 1995 and, subsequently, a large decrease between 1995 and 1996. To compensate for this, we estimate a more reasonable 1995 unemployment rate simply by interpolating the 1994 and 1996 rates. Secondly, the open unemployment rate calculated using a consistent definition actually declined between 2000 and 2001, and was relatively stable up to 2003. In addition, the open unemployment rate in 2003 was only slightly higher than the 1998 level, when the crisis was at its height. It also shows that open unemployment was actually in a decreasing trend between 1999 and 2003, except for an increase between 2001 and 2002. Unfortunately, the new definition obscures this phenomenon.
SMERU Research Institute, July 2005 9
Thirdly, the large and increasing gap between the official and the comparable rate for 2001-2003 actually shows the rapidly increasing number of ‘new definition unemployed’ in the labor market in Indonesia. Since they are dominated by discouraged workers, this implies that there is an increasing trend of discouraged workers – as currently defined by BPS – in Indonesia. By presenting an open unemployment rate evolution that is comparable between 1994 and 2003, one can now look at open unemployment from a consistent perspective. For the purpose of this paper, the next section discusses discouraged workers phenomenon during the period of 2001-2003.
SMERU Research Institute, July 2005 10
V. THE DISCOURAGED WORKERS The ILO has discussed the issue of discouraged workers as one of the relaxations available to its definition of actively seeking employment (see Figure 1). It acknowledged that, although discouraged workers may represent unutilized labor resources, drawing a clear distinction between personal and labor market related reasons for one’s discouragement is difficult (Hussmanns et al., 107). Arguments to include discouraged workers in the labor force mainly center around the fact that these workers behave similarly to the unemployed during an economic recovery and are likely to enter the labor force should an opportunity arise. Meanwhile, arguments against including discouraged workers are exactly the opposite, that discouraged workers exhibit similar labor force attachments as other groups outside the labor force and show no special tendency to re-enter the labor force during an economic recovery (Hussmanns et al., 107-108). In Indonesia’s case, Ahmed & Dhanani argued that including these workers into the labor force is necessary since excluding them would lead to an understatement of the actual labor force size and the true magnitude of unemployment (8). The ILO, however, points out that the inclusion of discouraged workers in the labor force is not a common practice and including them would make the open unemployment rate incomparable with other countries that use the standard definition of open unemployment. Hence, it recommends that the inclusion of discouraged workers should be made once a study has been conducted to determine whether the discouraged workers have any previous employment record and whether their labor force attachment is similar or not with groups that are usually excluded from the labor force (Hussmanns et al., 108). As for BPS’s decision to include them in the new definition of labor force, we cannot find any documentation explaining such a move. BPS published a document in 2003 that mentioned the change of definition, but it did not explain the reason other than to claim that it was in accordance with the ILO’s recommendation (vii).11 The ILO publication that they referred to, however, did not recommend the change and rather introduced it as a form of relaxation that may or may not be adopted since the issue of discouraged workers varies across countries (Hussmanns et al.,107-108). Therefore, in this section we discuss further the characteristics of discouraged workers in Indonesia, including their labor market attachment. A. The Profile of Discouraged Workers
As we have already discussed in the previous section, discouraged workers in Indonesia consist of two groups: those who are willing to work and those who are unwilling to work. Table 1 compares the characteristics of the two groups. The table shows that the total number of discouraged workers is quite sizable. In 2003, they amounted to more than three million people, which means that discouraged workers made up around a third of the official BPS open unemployment number of 9.5 million workers. There were 2.2 million, or more than 70%, discouraged workers who were willing to accept work, while the remaining 870 thousand or 30% were unwilling to work.
11 BPS, Pengembangan Metode.
SMERU Research Institute, July 2005 11
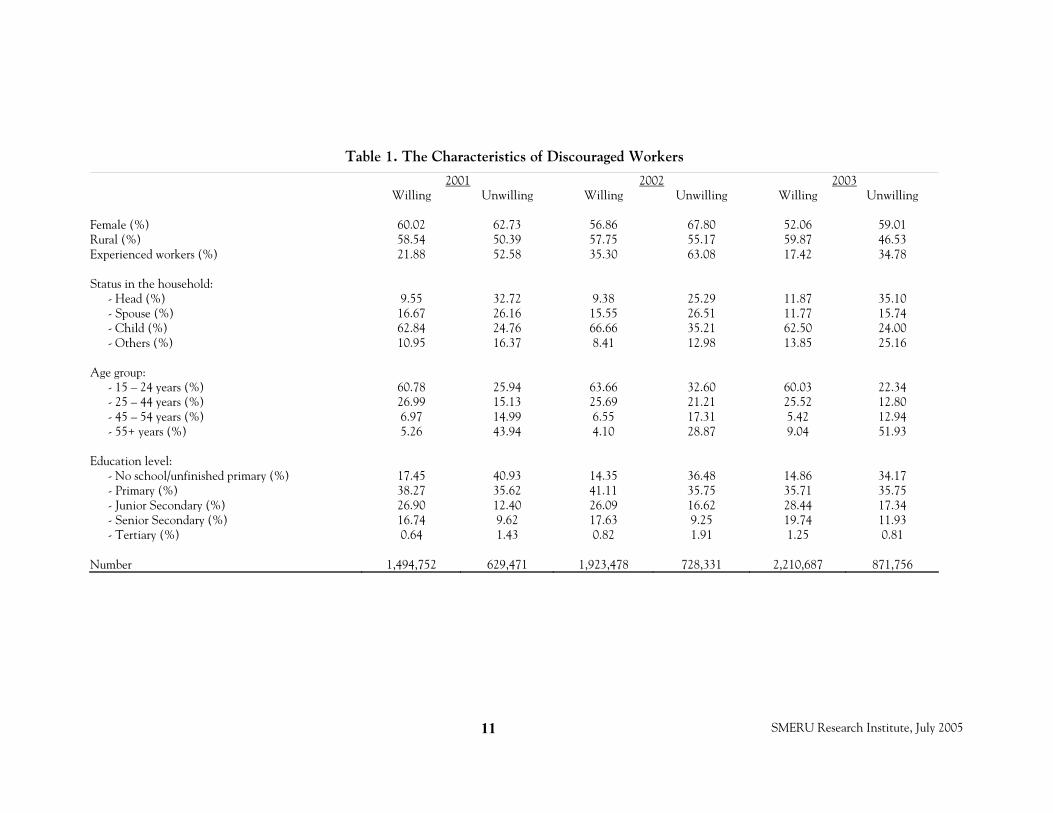
Table 1. The Characteristics of Discouraged Workers
2001 2002 2003 Willing Unwilling Willing Unwilling Willing Unwilling Female (%) 60.02 62.73 56.86 67.80 52.06 59.01 Rural (%) 58.54 50.39 57.75 55.17 59.87 46.53 Experienced workers (%) 21.88 52.58 35.30 63.08 17.42 34.78 Status in the household:
- Head (%) 9.55 32.72 9.38 25.29 11.87 35.10 - Spouse (%) 16.67 26.16 15.55 26.51 11.77 15.74 - Child (%) 62.84 24.76 66.66 35.21 62.50 24.00 - Others (%) 10.95 16.37 8.41 12.98 13.85 25.16
Age group:
- 15 – 24 years (%) 60.78 25.94 63.66 32.60 60.03 22.34 - 25 – 44 years (%) 26.99 15.13 25.69 21.21 25.52 12.80 - 45 – 54 years (%) 6.97 14.99 6.55 17.31 5.42 12.94 - 55+ years (%) 5.26 43.94 4.10 28.87 9.04 51.93
Education level:
- No school/unfinished primary (%) 17.45 40.93 14.35 36.48 14.86 34.17 - Primary (%) 38.27 35.62 41.11 35.75 35.71 35.75 - Junior Secondary (%) 26.90 12.40 26.09 16.62 28.44 17.34 - Senior Secondary (%) 16.74 9.62 17.63 9.25 19.74 11.93 - Tertiary (%) 0.64 1.43 0.82 1.91 1.25 0.81
Number 1,494,752 629,471 1,923,478 728,331 2,210,687 871,756
SMERU Research Institute, July 2005 12
In terms of gender, females form the majority of discouraged workers, both among those who are willing and unwilling to work. There is, however, a tendency for this female domination, in particular among those who are willing to accept jobs, to decline over time. In terms of location, most of the discouraged workers are found in rural areas, in particular among those who are willing to accept jobs, where around 60% of them are rural residents. In terms of prior work experience, there is a stark contrast between those who are willing and unwilling to accept jobs. Among those who are willing to work, the large majority are inexperienced workers. On the other hand, among those who are unwilling to work, the large majority are experienced workers, except in 2003. Looking at their status in the household, there was also a big difference between discouraged workers who are willing and unwilling to work. Among those who are willing to accept jobs, the largest fraction is children. Meanwhile, among those who are unwilling to work, they are more evenly distributed among household head, spouse, and children. These distributions of discouraged workers by their status in the household are consistent with their distributions by age group. Unsurprisingly, the highest proportion of discouraged workers who are willing to accept jobs is in the 15-24 years old and the second largest group is those aged 25-44 years. Meanwhile, the discouraged workers who are unwilling to accept jobs are more evenly distributed across the age groups, with older workers dominating. In terms of education levels, the majority of discouraged workers, both those who are willing and unwilling to work, have low levels of education.12 In both groups, only around 1% had a university degree and less than 20% have a senior secondary education. Comparing the two groups of discouraged workers, however, on average those who are unwilling to work have lower levels of education than those who are willing to work. The majority of those who are willing to work have completed primary and junior secondary education, while the majority of those who are unwilling to work were confined to the lowest two education categories. B. The Willingness to Work
Table 1 provides a picture of the differences in the characteristics between discouraged workers who are still willing to work and those who are unwilling to work. In this section, we formally examine the factors that determine whether a discouraged worker will be willing to accept a job offered or not. In order to do this, we estimate a probit model with a dummy variable of willingness to work as the dependent variable and various socioeconomic and community level variables as independent variables.13 Since Sakernas does not, however, include enough socioeconomic variables, we use Susenas 2002 as the data source for the estimation instead.14
12 For comparison, in 2002, 10% of the working age population in Indonesia had no education and 59% had less than nine years of education. 13 This is similar to the estimation done by Kingdon & Knight (“Are Searching”), however, they used a logit estimation method and for a different purpose. 14 A variable that is unavailable in Susenas is work experience. We approximate this variable by age controlled by educational attainment.
SMERU Research Institute, July 2005 13
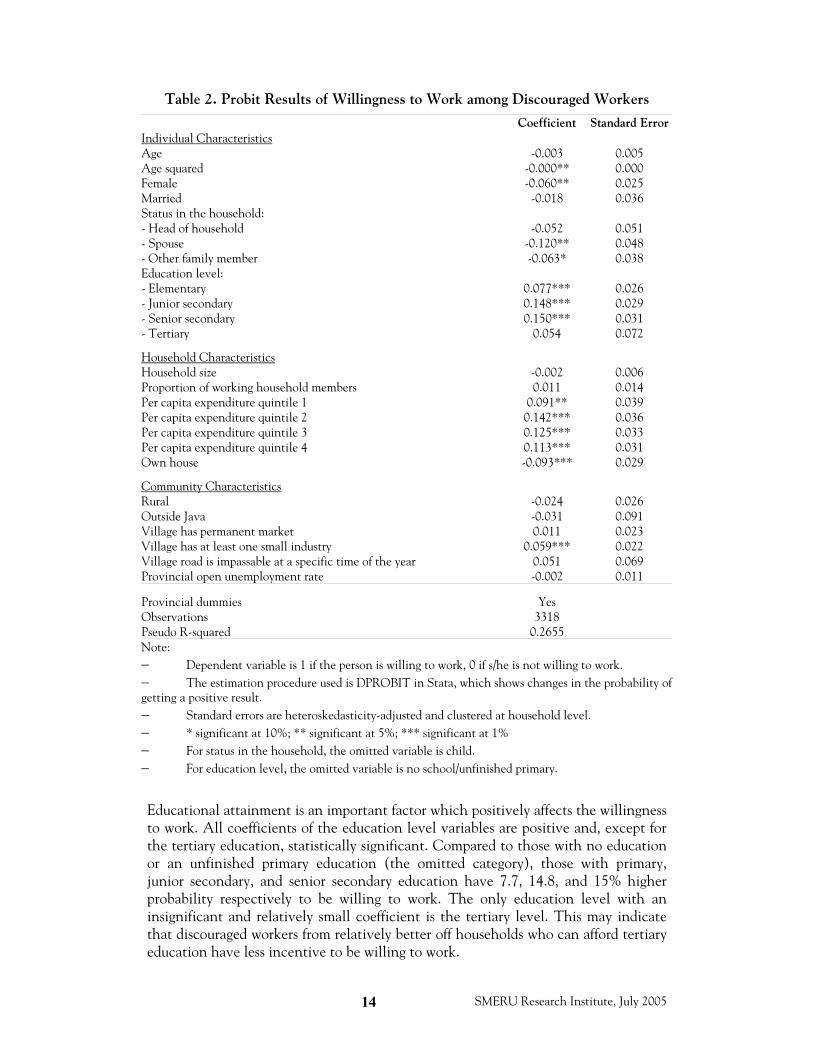
Table 2 presents the results of the probit estimation. The age and age-squared variables are both negative, but only the square is significant. This implies that the older a discouraged worker, the more likely it is that s/he would not accept a job offer. This tendency increases more as a discouraged worker gets older, which is indicated by the significance of the square variable. The effects of gender and status in the household are also significant. Marital status, however, has no significant effect on the willingness to work. Female discouraged workers have 6% less chance of being willing to work than males. Spouses and other family members have a lower propensity to be willing to work than a child (the omitted category), as shown by the coefficients of these variables that are negative and significant.
SMERU Research Institute, July 2005 14
Table 2. Probit Results of Willingness to Work among Discouraged Workers
Coefficient Standard ErrorIndividual Characteristics Age -0.003 0.005 Age squared -0.000** 0.000 Female -0.060** 0.025 Married -0.018 0.036 Status in the household: - Head of household -0.052 0.051 - Spouse -0.120** 0.048 - Other family member -0.063* 0.038 Education level: - Elementary 0.077*** 0.026 - Junior secondary 0.148*** 0.029 - Senior secondary 0.150*** 0.031 - Tertiary 0.054 0.072
Household Characteristics Household size -0.002 0.006 Proportion of working household members 0.011 0.014 Per capita expenditure quintile 1 0.091** 0.039 Per capita expenditure quintile 2 0.142*** 0.036 Per capita expenditure quintile 3 0.125*** 0.033 Per capita expenditure quintile 4 0.113*** 0.031 Own house -0.093*** 0.029
Community Characteristics Rural -0.024 0.026 Outside Java -0.031 0.091 Village has permanent market 0.011 0.023 Village has at least one small industry 0.059*** 0.022 Village road is impassable at a specific time of the year 0.051 0.069 Provincial open unemployment rate -0.002 0.011
Provincial dummies Yes Observations 3318 Pseudo R-squared 0.2655 Note: − Dependent variable is 1 if the person is willing to work, 0 if s/he is not willing to work. − The estimation procedure used is DPROBIT in Stata, which shows changes in the probability of getting a positive result. − Standard errors are heteroskedasticity-adjusted and clustered at household level. − * significant at 10%; ** significant at 5%; *** significant at 1% − For status in the household, the omitted variable is child. − For education level, the omitted variable is no school/unfinished primary.
Educational attainment is an important factor which positively affects the willingness to work. All coefficients of the education level variables are positive and, except for the tertiary education, statistically significant. Compared to those with no education or an unfinished primary education (the omitted category), those with primary, junior secondary, and senior secondary education have 7.7, 14.8, and 15% higher probability respectively to be willing to work. The only education level with an insignificant and relatively small coefficient is the tertiary level. This may indicate that discouraged workers from relatively better off households who can afford tertiary education have less incentive to be willing to work.
SMERU Research Institute, July 2005 15
This conjecture is supported by the coefficients of household level variables. First, the coefficients of per capita expenditure quintiles 1 through 4 are all positive and significant. This implies that all discouraged workers from these per capita expenditure quintiles have a higher propensity to be willing to work than discouraged workers from the richest quintile (the omitted category). In fact, the magnitude of the coefficient increases as one goes down from quintile 4 to quintile 2. This indicates that the poorer a discouraged worker, the higher her/his willingness to work. The coefficient of the poorest quintile is, however, even smaller than that of quintile 4, although it is still significant.15 This means that while discouraged workers who have the lowest willingness to work come from the richest quintile, the second lowest group comes from the poorest quintile. Second, the coefficient of house ownership is negative and significant. Workers living in a house that they own have almost 10% less chance of willing to work. Meanwhile, the household size and proportion of household members who are working have no significant effect on willingness to work. All community level variables, except for the availability of small industry in a village, are insignificant. Discouraged workers in rural or off Java locales have no significantly different a willingness to work compared to those in urban or Java areas, although both coefficients are negative. The provincial-level open unemployment rate, although negative, is also insignificant. The coefficients of village-level infrastructures – market, industry, roads – are all positive, but it is only the availability of small industry in a village which is statistically significant. This may indicate a positive correlation between relative job availability and willingness to work.
In conclusion, in addition to individual demographic characteristics such as age and gender, the main conditions that separate discouraged workers who are willing to work from those unwilling to work are economic conditions and opportunities. Discouraged workers from relatively better-off and secured households have a significantly higher probability of refusing work if one is offered to them. Furthermore, highly-educated workers are very specific about the work that they want to do such that they may refuse work that is not in accordance with their expectations. Finally, discouraged workers in villages with more job opportunities, indicated by availability of small industry, have a higher probability to be willing to work. C. Should Discouraged Workers be Included in the Labor Force?
According to Kingdon & Knight (1-2), there are two basic explanations of why workers stop looking for work although they want one. The first explanation is called ‘taste for unemployment’. This usually occurs in high-income households, where non-working members receive high intra-household transfers without exerting any effort themselves. This way the non-working members are able to enjoy a stream of income without relinquishing any leisure time. Under this condition, excluding discouraged workers from the labor force is justifiable. The second explanation is the bias against the poor in searching for jobs, such as the high cost of job seeking and
15 Further statistical tests found, however, that there is no significant difference between the estimated coefficients of these variables.
SMERU Research Institute, July 2005 16
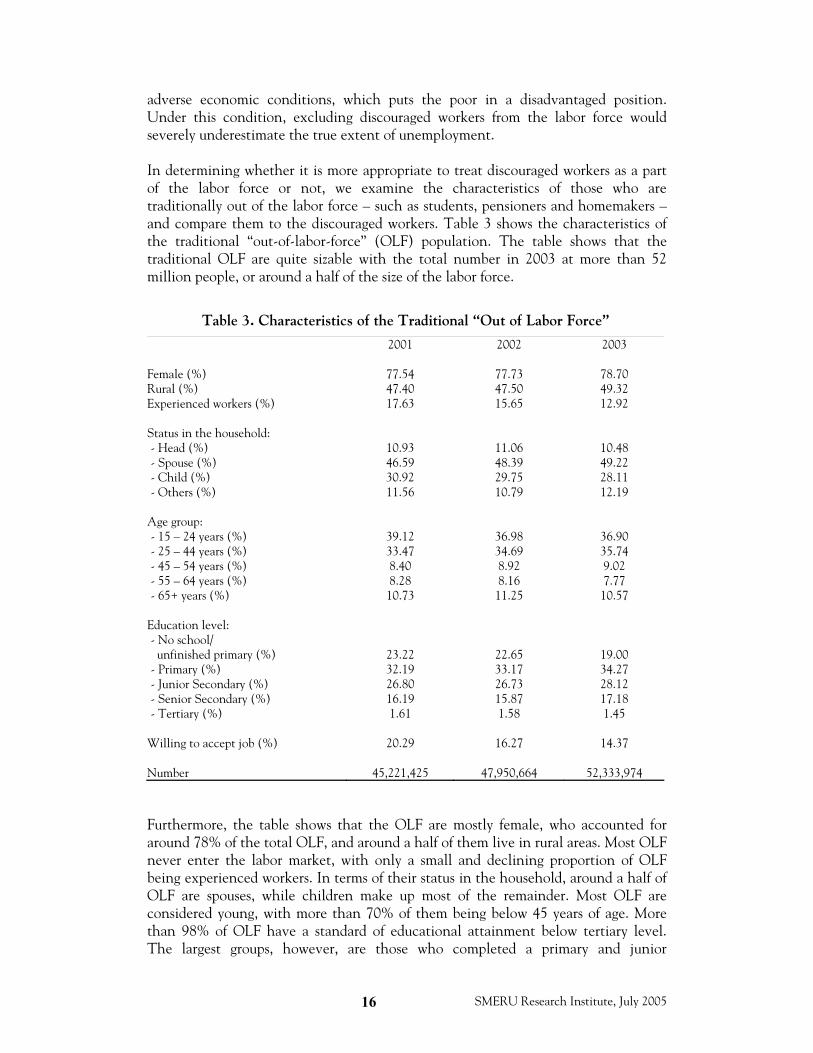
adverse economic conditions, which puts the poor in a disadvantaged position. Under this condition, excluding discouraged workers from the labor force would severely underestimate the true extent of unemployment. In determining whether it is more appropriate to treat discouraged workers as a part of the labor force or not, we examine the characteristics of those who are traditionally out of the labor force – such as students, pensioners and homemakers – and compare them to the discouraged workers. Table 3 shows the characteristics of the traditional “out-of-labor-force” (OLF) population. The table shows that the traditional OLF are quite sizable with the total number in 2003 at more than 52 million people, or around a half of the size of the labor force.
Table 3. Characteristics of the Traditional “Out of Labor Force”
2001 2002 2003 Female (%) 77.54 77.73 78.70 Rural (%) 47.40 47.50 49.32 Experienced workers (%) 17.63 15.65 12.92 Status in the household: - Head (%) 10.93 11.06 10.48 - Spouse (%) 46.59 48.39 49.22 - Child (%) 30.92 29.75 28.11 - Others (%) 11.56 10.79 12.19
Age group: - 15 – 24 years (%) 39.12 36.98 36.90 - 25 – 44 years (%) 33.47 34.69 35.74 - 45 – 54 years (%) 8.40 8.92 9.02 - 55 – 64 years (%) 8.28 8.16 7.77 - 65+ years (%) 10.73 11.25 10.57
Education level: - No school/ unfinished primary (%) 23.22 22.65 19.00 - Primary (%) 32.19 33.17 34.27 - Junior Secondary (%) 26.80 26.73 28.12 - Senior Secondary (%) 16.19 15.87 17.18 - Tertiary (%) 1.61 1.58 1.45
Willing to accept job (%) 20.29 16.27 14.37 Number 45,221,425 47,950,664 52,333,974
Furthermore, the table shows that the OLF are mostly female, who accounted for around 78% of the total OLF, and around a half of them live in rural areas. Most OLF never enter the labor market, with only a small and declining proportion of OLF being experienced workers. In terms of their status in the household, around a half of OLF are spouses, while children make up most of the remainder. Most OLF are considered young, with more than 70% of them being below 45 years of age. More than 98% of OLF have a standard of educational attainment below tertiary level. The largest groups, however, are those who completed a primary and junior
SMERU Research Institute, July 2005 17
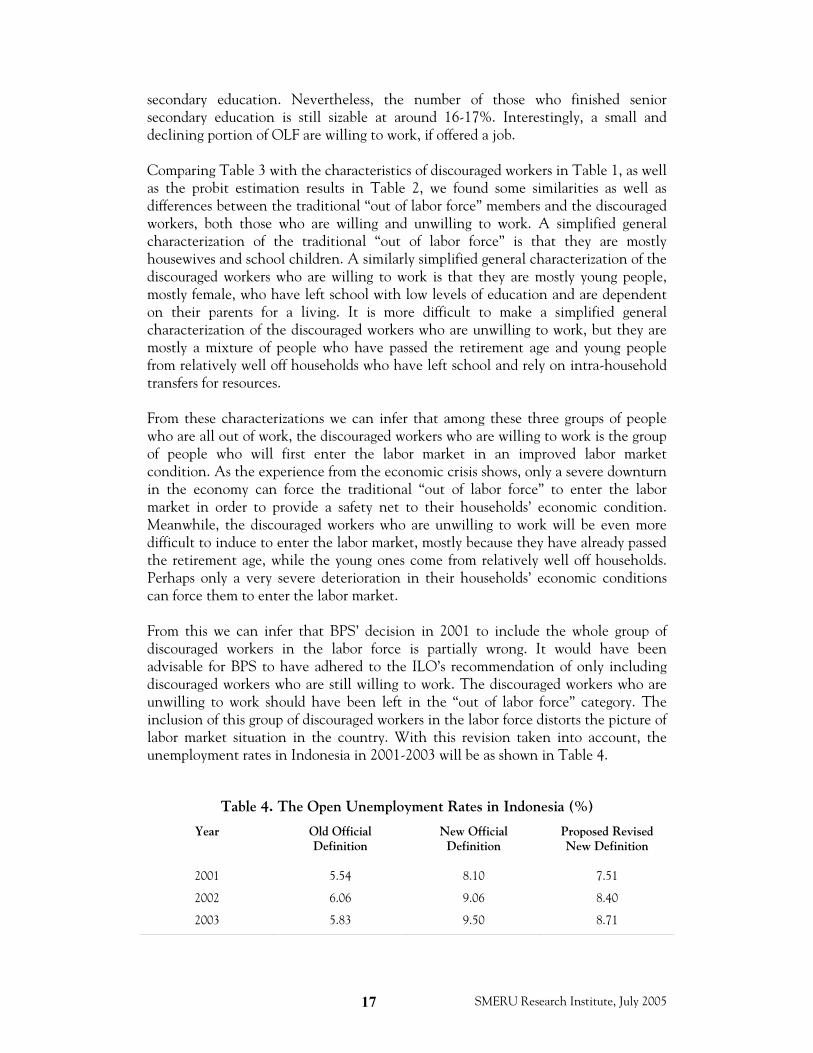
secondary education. Nevertheless, the number of those who finished senior secondary education is still sizable at around 16-17%. Interestingly, a small and declining portion of OLF are willing to work, if offered a job. Comparing Table 3 with the characteristics of discouraged workers in Table 1, as well as the probit estimation results in Table 2, we found some similarities as well as differences between the traditional “out of labor force” members and the discouraged workers, both those who are willing and unwilling to work. A simplified general characterization of the traditional “out of labor force” is that they are mostly housewives and school children. A similarly simplified general characterization of the discouraged workers who are willing to work is that they are mostly young people, mostly female, who have left school with low levels of education and are dependent on their parents for a living. It is more difficult to make a simplified general characterization of the discouraged workers who are unwilling to work, but they are mostly a mixture of people who have passed the retirement age and young people from relatively well off households who have left school and rely on intra-household transfers for resources. From these characterizations we can infer that among these three groups of people who are all out of work, the discouraged workers who are willing to work is the group of people who will first enter the labor market in an improved labor market condition. As the experience from the economic crisis shows, only a severe downturn in the economy can force the traditional “out of labor force” to enter the labor market in order to provide a safety net to their households’ economic condition. Meanwhile, the discouraged workers who are unwilling to work will be even more difficult to induce to enter the labor market, mostly because they have already passed the retirement age, while the young ones come from relatively well off households. Perhaps only a very severe deterioration in their households’ economic conditions can force them to enter the labor market. From this we can infer that BPS’ decision in 2001 to include the whole group of discouraged workers in the labor force is partially wrong. It would have been advisable for BPS to have adhered to the ILO’s recommendation of only including discouraged workers who are still willing to work. The discouraged workers who are unwilling to work should have been left in the “out of labor force” category. The inclusion of this group of discouraged workers in the labor force distorts the picture of labor market situation in the country. With this revision taken into account, the unemployment rates in Indonesia in 2001-2003 will be as shown in Table 4.
Table 4. The Open Unemployment Rates in Indonesia (%)
Year Old Official Definition
New Official Definition
Proposed Revised New Definition
2001 5.54 8.10 7.51
2002 6.06 9.06 8.40
2003 5.83 9.50 8.71
SMERU Research Institute, July 2005 18
D. Why do They Become Discouraged?
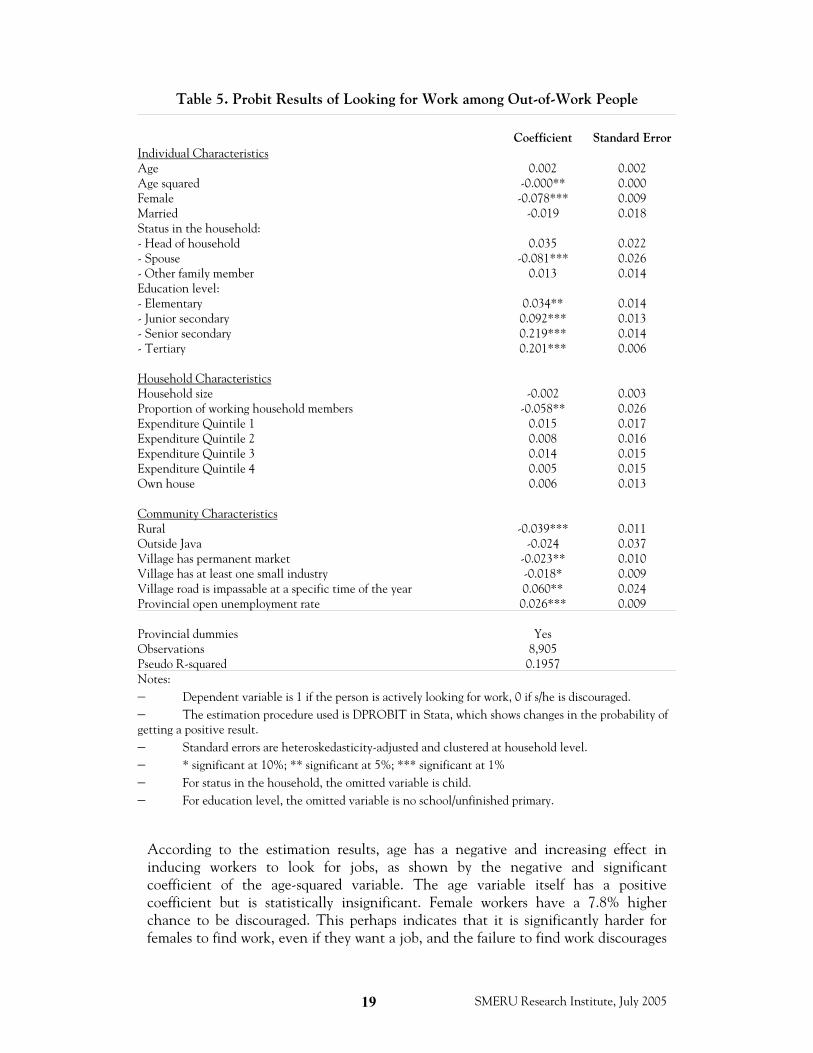
According to the job search theory, the rate of time preference is an important component of job search choices. This means the level of patience among the out-of-work population plays an important role as impatient workers exit unemployment faster, while patient workers, who usually have higher wage preferences, might stay unemployed relatively longer. This result depends, however, on the worker’s personal time preference as a different time preference might make impatient workers stay unemployed longer (DellaVigna & Paserman, 1-2). In this light, discouraged workers are perhaps the type of workers who are relatively impatient, but choose to stop looking for jobs rather than accepting employment that offers lower wage levels than their preferred level of wages. By merging the data of the socioeconomic conditions of both the unemployed (who are still looking for jobs) and the discouraged workers (who have stopped looking for jobs), we estimate a probit model of the probability an out-of-work worker will look for a job. The model is similar to the probit model we estimated in Table 2. The estimation results are shown in Table 5.
SMERU Research Institute, July 2005 19
Table 5. Probit Results of Looking for Work among Out-of-Work People
Coefficient Standard ErrorIndividual Characteristics Age 0.002 0.002 Age squared -0.000** 0.000 Female -0.078*** 0.009 Married -0.019 0.018 Status in the household: - Head of household 0.035 0.022 - Spouse -0.081*** 0.026 - Other family member 0.013 0.014 Education level: - Elementary 0.034** 0.014 - Junior secondary 0.092*** 0.013 - Senior secondary 0.219*** 0.014 - Tertiary 0.201*** 0.006 Household Characteristics Household size -0.002 0.003 Proportion of working household members -0.058** 0.026 Expenditure Quintile 1 0.015 0.017 Expenditure Quintile 2 0.008 0.016 Expenditure Quintile 3 0.014 0.015 Expenditure Quintile 4 0.005 0.015 Own house 0.006 0.013 Community Characteristics Rural -0.039*** 0.011 Outside Java -0.024 0.037 Village has permanent market -0.023** 0.010 Village has at least one small industry -0.018* 0.009 Village road is impassable at a specific time of the year 0.060** 0.024 Provincial open unemployment rate 0.026*** 0.009 Provincial dummies Yes Observations 8,905 Pseudo R-squared 0.1957 Notes: − Dependent variable is 1 if the person is actively looking for work, 0 if s/he is discouraged. − The estimation procedure used is DPROBIT in Stata, which shows changes in the probability of getting a positive result. − Standard errors are heteroskedasticity-adjusted and clustered at household level. − * significant at 10%; ** significant at 5%; *** significant at 1% − For status in the household, the omitted variable is child. − For education level, the omitted variable is no school/unfinished primary.
According to the estimation results, age has a negative and increasing effect in inducing workers to look for jobs, as shown by the negative and significant coefficient of the age-squared variable. The age variable itself has a positive coefficient but is statistically insignificant. Female workers have a 7.8% higher chance to be discouraged. This perhaps indicates that it is significantly harder for females to find work, even if they want a job, and the failure to find work discourages
SMERU Research Institute, July 2005 20
them. Marriage status has no significant impact, while the status in the household coefficients shows that spouses have 8.1% more chance to be discouraged compared to children. In terms of education attainment, every education level has a positive and significant coefficient, which gets larger with higher education levels. This shows that education plays an important role in determining whether a worker will be discouraged or not. An unemployed worker with a senior secondary or university level education has more than a 20% probability to still be looking for work compared to an unemployed worker with no education at all. This shows that workers with higher education levels have higher expectations to find employment. On the other hand, this may also indicate that people with low levels of education are being more and more left out by the demand of the labor market. Among household variables, the only significant variable is the proportion of working household members, which has a negative sign. This proves one’s increasing distaste for employment if other members in one’s household are already working. Similarly, an increase in household size will tend to decrease a person’s probability of looking for work, although the coefficients are insignificant. Household economic status does not play a significant role, although the positive coefficients for the first through the fourth expenditure quintiles show the tendency that members of households in the highest quintile have a lower urgency for looking for work than people from poorer households. For community characteristics, workers in rural areas are 4% more likely to be discouraged than those in urban areas. Interestingly, villages with a permanent market reduced out-of-work workers’ likeliness to be looking for work, as is the case if the village has a small industry. This may be caused by the relatively abundant opportunities for getting money here and there in markets or small industries, so there is little need to find actual meaningful work.16 On the other hand, workers in villages with inadequate roads are 6% more likely to be looking for employment, which perhaps indicates the opposite situation from villages with markets and small industries. Finally, the provincial open unemployment rate has a significant and positive coefficient. This means that during periods of high unemployment it is more likely that people will be looking for work rather than becoming discouraged. This means out-of-work workers do not become discouraged by the open unemployment rate, but are even encouraged by it. This result is different to the result of a study in South Africa that shows people become discouraged in high unemployment conditions (Kingdon & Knight, 9). This is, however, consistent with the evidence during the economic crisis in Indonesia.
16 Manning & Junankar stated that many non-working youth in Indonesia are probably engaged in petty crime or are self-employed as traffic directors or intermediaries (69).
SMERU Research Institute, July 2005 21
VI. CONCLUSION
This paper aims to contribute to the macro-level discussion on the measurement of open unemployment in Indonesia. The main findings of this study are twofold. First, the decision by BPS to change the definition of open unemployment in Indonesia in 2001 results in an artificially high open unemployment rate and disguises the actual decline in open unemployment as traditionally measured. When the open unemployment rates for 2001 onwards are recalculated using the old definition, it shows that unemployment in 2003 was actually lower than the peak during the crisis in 1999. Second, our analysis shows that discouraged workers in Indonesia are actually not confined to only the poor and those who are denied access to the proper job market. In contrast, when we look at the discouraged workers and try to determine which factors differentiate between those willing and unwilling to work, we found that those unwilling to work are mostly confined to the most well off group. These conditions make the inclusion of discouraged workers who are unwilling to work in the openly unemployed category unnecessary and has little merit. In fact, it distorts the picture of the true labor market condition. If Indonesia still wants to adhere to the relaxed labor force definition as described by ILO, we recommend that the measurement of open unemployment should adhere to the ILO’s recommendation of only including discouraged workers who are still willing to work. The discouraged workers who are unwilling to work should, therefore, be left in the “out of labor force” category. This study also reveals that there has been a rapid increase in the number of discouraged workers over the past three years in Indonesia. This may reflect a fundamental change that is going on in the Indonesian labor market. It is also possible however, that this may just reflect the problematic nature in the measurement of disguised workers. Hence, we recommend this phenomenon to be investigated seriously in future studies.
SMERU Research Institute, July 2005 22
REFERENCES
Ahmed, Iftikhar, and Shafiq Dhanani. 1999. ‘Indonesia’s Recovery: Employment Optimism or Statistical Illusion?’ Occasional Discussion Paper Series No. 2. International Labour Office, Jakarta.
BPS. 2003. Pengembangan Metode Perhitungan Pengangguran: Pengangguran Terbuka dan Setengah Pengangguran di Indonesia 2000-2002 [Development of Unemployment Calculation Method: Open and Disguised Unemployment in Indonesia 2000-2002]. Katalog BPS 3425. Badan Pusat Statistik, Jakarta.
DellaVigna, Stefano, and M. Daniele Paserman. 2004. ‘Job Search and Impatience.’ NBER Working Paper No. 10837. National Bureau of Economic Research, Cambridge MA.
Dhanani, Shafiq. 2004. ‘Unemployment and Underemployment in Indonesia, 1976-2000: Paradoxes and Issues.’ mimeo. International Labour Office, Geneva.
Feridhanusetyawan, Tubagus, and Arya B. Gaduh. 2000. ‘Indonesia’s Labor Market During the Crisis: Empirical Evidence from the Sakernas, 1997-1999.’ The Indonesian Quarterly, 28(3).
Hussmanns, Ralf, Farhad Mehran, and Vijay Verma. 1990. Surveys of Economically Active Population, Employment, Unemployment, and Underemployment: An ILO Manual on Concepts and Methods. International Labour Office, Geneva.
Kenward, Lloyd. 2002. From the Trenches: the First Year of Indonesia’s Crisis of 1997/98 As Seen From the World Bank’s Office in Jakarta. Centre for Strategic and International Studies, Jakarta.
Kingdon, Geeta, and John Knight. 2000. ‘Are Searching and Non-searching Unemployment Distinct States when Unemployment is High? The Case of Africa.’ Centre for the Study of African Economies WPS/2000-2. University of Oxford, Oxford.
Levinsohn, James, Steven Berry, and Jed Friedman. 1999. ‘Impacts of the Indonesian Economic Crisis: Price Changes and the Poor.’ NBER Working Paper No. 7194. National Bureau of Economic Research, Cambridge, MA.
Manning, Chris 2000. ‘Labour Market Adjustment to Indonesia’s Economic Crisis: Context, Trends and Implications.’ Bulletin of Indonesian Economic Studies, 36(1), pp. 105-136.
Manning, Chris, and P.N. Junankar. 1998. ‘Choosy Youth or Unwanted Youth? A Survey of Unemployment.’ Bulletin of Indonesian Economic Studies, 34(1), pp. 55-93.
SMERU Research Institute, July 2005 23
Solimano, Andres, and Guillermo Larrain. 2002. ‘From Economic Miracle to Sluggish Performance: Employment, Unemployment and Growth in the Chilean Economy.’ mimeo.
Strauss, John, Kathleen Beegle, Agus Dwiyanto, Yulia Herawati, Daan Pattinasarany, Elan Satriawan, Bondan Sikoki, Sukamdi, and Firman Witoelar. 2004. Indonesian Living Standards Before and After the Financial Crisis. Institute of Southeast Asian Studies: Singapore.
Suryahadi, Asep, Paul Chen, and Rod Tyers. 2001. ‘Openness, Technological Change and Labour Demand in Pre-Crisis Indonesia’. Asian Economic Journal, 17(1), pp. 45-64.
Suryahadi, Asep, and Sudarno Sumarto. 2003. ‘Poverty and Vulnerability in Indonesia Before and After the Economic Crisis’. Asian Economic Journal, 15(3), pp. 239-274.