Embed Size (px)
Citation preview
For comments, suggestions or further inquiries please contact:
Philippine Institute for Development StudiesSurian sa mga Pag-aaral Pangkaunlaran ng Pilipinas
The PIDS Discussion Paper Seriesconstitutes studies that are preliminary andsubject to further revisions. They are be-ing circulated in a limited number of cop-ies only for purposes of soliciting com-ments and suggestions for further refine-ments. The studies under the Series areunedited and unreviewed.
The views and opinions expressedare those of the author(s) and do not neces-sarily reflect those of the Institute.
Not for quotation without permissionfrom the author(s) and the Institute.
The Research Information Staff, Philippine Institute for Development Studies5th Floor, NEDA sa Makati Building, 106 Amorsolo Street, Legaspi Village, Makati City, PhilippinesTel Nos: (63-2) 8942584 and 8935705; Fax No: (63-2) 8939589; E-mail: [email protected]
Or visit our website at http://www.pids.gov.ph
April 2008
DISCUSSION PAPER SERIES NO. 2008-14
Industrial Agglomerationin the Philippines
Mari-Len Reyes-Macasaquit

1
Industrial Agglomeration in the Philippines
Mari-Len Reyes-Macasaquit*
Abstract
The economic reform process in the Philippines was accelerated in the 1980s and 1990s.
The reforms were found to have yielded positive results in terms of the nature of
industrial agglomeration in the country as this was found to have occurred in the 1990s
based on the results of the survey and econometrics analyses. The latter also identified
the factors that influenced firms to agglomerate in the country, referring to economic
fundamentals and deliberate policy and public action by government. However,
industrial upgrading and innovation in the country was found to be weak. Expenditures
on R&D are low and linkages between stakeholders are not strong. There are firms that
have undergone upgrading in terms of introduction of new goods, upgrading of
machineries, and opening of new markets but they tended to rely more on their in-house
capabilities probably due to inadequate support from the government’s institutional
infrastructure and financial system, which came out from the estimation results. The
agglomeration strategies that are currently being pursued in the Philippines –
establishment of economic zones and industry clustering – have the potential to address
some of the issues and problems identified.
Keywords: industrial agglomeration, industrial clusters, economic zones, industrial
upgrading, innovation
__________________ This paper is a component of the Economic Research Institute for ASEAN and East Asia (ERIA) project on, Industrial Agglomeration, Production Networks and FDI Promotion that was funded by the Institute of Developing Economies/Japan External Trade Organization and completed in March 2008. This paper has come out as one of the articles in ERIA Research Project Report No. 3 edited by Dr. Mohamed Ariff.
2
INTRODUCTION
Deepening international economic integration or globalization, started to gain
impetus in the last two to three decades of the twentieth century. In fact, analysts point
to the years between 1970 and 1995 as the period when greater economic harmonization
among nations of the world economy became remarkable. They point to 1995 as the
year when the global economic system we now know has emerged, that is, via the World
Trade Organization. Nevertheless, increasing economic relations between and among
countries, primarily in the form of international trade and direct investments, were
found to have accelerated throughout the 1970s and the 1980s (Sachs and Warner, 1995).
Participation to this type of trade regime necessitated the institution of trade
liberalization and investment reforms as key policy areas. Many developing countries
adopted an outward orientation in order to participate in this prevailing global order and
reap the benefits of economic integration. This is consistent with the hypothesis of
endogenous growth models that claims, international trade and foreign investment are
determinants of self-sustaining growth. These two factors bring about greater access to
foreign markets and new technology. If successful in penetrating the international
market and technology is absorbed, technological progress within a nation is assumed to
accelerate leading to increased levels of productivity spawning economic growth (Yap,
2002).
In recent years, an emerging body of ideas has pointed to the importance of
selected regions as hubs of economic activities in influencing the economic
development of the nation as a whole. In particular, the role of those regions, which
serve as hosts to industries engaged in extensive international networks of production.
Loosely termed “new economic geography,” scholars have and continue to explore the
relationship between industrial agglomeration and economic performance, particularly
in the developing world.1
In the Asian context, a large body of work has been started by, among others, Fujita,
Krugman and Venables (1999) in their book on spatial economy, Fujita and Thisse
(2002) in their exploration of the economics of agglomeration, Kuchiki (2005) in
relation to his development of a theory of a flowchart approach in industrial cluster
3
policy, and Tsuji, et al (2007) in the most recent book they edited compiling relevant
examples of industrial agglomeration in Asia, Italy and the Americas. Indeed, the
pragmatic examples of the booming Information Technology (IT) industry concentration
in Bangalore affecting the positive growth of the Indian economy or the well-touted
automobile industry in Thailand show that industrial clusters can be considered drivers
of regional and consequently national economic growth. However, this aspect can be
facilitated more aggressively if these industrial clusters, whether concentrated by
geography or by specific industry, could attract not only huge domestic investments but
foreign capital as well. The literature abounds with discussions on centripetal forces that
influence decisions of firms to locate in the cluster, while there are also centrifugal
forces that act as deterrent. These opposing forces lead to a “spatial structure of an
economy that is a result of a tug-of-war between external economies and diseconomies,
between the linkages and information spillovers that foster concentration, and between
congestion and other diseconomies that discourage it” (Fujita et al, 1999 as cited in
Tsuji et al, 2007, p. 3).
The fundamental question therefore in the development of industrial
agglomerations relates to the factors that influence firms to cluster or locate in a specific
area. The answers to this question would allow decision makers to make informed
policies and programs that could promote these factors while at the same time,
addressing those issues that deter and cause these firms to divert and set up shop in
other places instead. In addition, there is a need to identify the elements leading to the
success of industrial agglomerations. Intuitively, one can point to the overall economic
environment in a country that makes it conducive for firms to agglomerate in and
sustain or even expand operations. Such environment could pertain to economic
fundamentals that attracts investments and to industrial policies that not only serve as
magnets for firms to cluster but allow them to thrive via an enabling framework that
helps them to maximize the opportunities available in industrial agglomerations.
Trade liberalization is only one of the many policy actions of the government for
its economy to face head on the challenges posed by globalization. Other policy areas
may be in terms of liberalization, privatization, deregulation, and social protection to
those that will be adversely affected. Attractive incentive structures to lure in foreign
direct investments (FDIs) are also part of the policy package as well as export oriented
4
strategies. These are a few of the policy fundamentals that contributed to the growth of
the so-called East Asian miracle economies.
Compared to its Asian neighbors, notably other ASEAN 2 countries such as
Malaysia, Thailand and Singapore, the levels of FDIs and exports in the Philippines
remain miniscule. Its exports, though fast growing in the decades of the 1980s, 1990s
and 2000s have seemed to have fallen behind these three countries.3 This implies that
there are still numerous issues that need to be addressed in order to allow the nation to
latch onto the globalization bandwagon and plausibly reap its benefits. Not least of its
concerns is the requisite to ensure the competitiveness of its economy.
1. PHILIPPINE INDUSTRIAL DEVELOPMENT: POLICY
PERSPECTIVE
1.1. Trade Liberalization
Even before globalization fully took effect, there was already recognition on the
part of Philippine policy makers that three decades of protectionist regime starting in the
1950s, via high tariffs was hurting the economy and that it is not aligned with the
country’s development aspirations. Official policy then shifted from import substitution
to an outward-oriented, export promotion policy. The structural adjustment program that
was instituted in the 1980s aimed at pursuing a more efficient and internationally
competitive economy and one of the main instruments that were utilized was the so-
called Tariff Reform Program.
Since 1981, four Tariff Reform Programs had been implemented, with each one
staged on a five-year period (except TRP-IV) to cushion the impact of the changes in
the tariff structure. These Tariff Reform Programs were rationalized by the objectives of
liberalizing the trade environment, improving access to essential inputs, making
available more choices of goods for the consumers, enhancing competitiveness of local
industries in the domestic and export markets, and simplifying the tariff structure for
ease of customs administration, among others.
As member of the ASEAN Free Trade Area (AFTA), this move of the Philippines
towards greater openness is aligned (or at least runs parallel) with its international
5
commitments, which in this case relate to accelerating the liberalization of intra-
ASEAN trade and investment through the Common Effective Preferential Tariff Scheme
(ASEAN Secretariat, 2008). This example indicates that trade liberalization has indeed
become a matter of utmost policy manifested by both unilateral initiative and in
compliance with vital international commitments.
The top trading partners of the Philippines are the U.S., Japan, Hong Kong, Taiwan,
Malaysia, China, Netherlands, and Singapore. In 2004, the top 3 trading partners were
the United States (U.S.), Japan and Singapore but in 2005 and 2006, the latter was
dislodged by China. It may also be noted that the country had deficits with the U.S. and
Japan in 2004 and 2005 but by 2006; the Philippines had more exports than imports in
these countries. Meanwhile, the country continued to enjoy a fairly large surplus with
China.4
1.2. Privatization
Also during the decades of reforms, a three-pronged policy of privatization,
liberalization and deregulation was implemented aggressively starting in 1994. This is
in line with the objectives of continued economic openness; divestment of state owned
and operated enterprises that are most likely being run inefficiently; removal of the hold
of monopolies in vital utilities in the country; and promotion of competition to
maximize consumer welfare. Republic Act 7721 or the Foreign Bank Liberalization Act
authorized the entry of 10 foreign banks in the country subject to three different modes
of entry.
In 1995, three major policies were instituted to liberalize three sectors of the
economy: telecommunications, water and power. Each is backed by a legal framework
manifesting the country’s commitments towards pursuing these reforms. For instance,
Republic Act 7925 or the Public Telecommunications Policy Act of the Philippines, was
enacted in March 1995 highlighting the policy agenda that telecommunications services
will be provided by private enterprises to foster a healthy competitive environment. In
June 1995, Republic Act 8041 otherwise known as the National Water Crisis Act of
1995 was enacted that led to the privatization of state-run water facilities. In 2001,
another vital legislation was passed, Republic Act 9136, also known as the Electric
Power Industry Reform Act of 2001 called for key reforms in the sector.
6
1.3. Foreign Direct Investment Policies
Another major component of the market-oriented reforms that were implemented
in accelerated fashion in the 1980s through the 1990s was foreign investment
liberalization. The Foreign Investments Act of 1991 or Republic Act 7042 allowed
foreign equity participation of up to 100 percent in all areas, whether catering to the
domestic or export markets, except those that are included in the Foreign Investment
Negative List (FINL). Prior to this law, participation of 100 percent foreign equity was
subject to the discretion of the Board of Investments (BOI) as the prevailing law then
allows for only up to 40 percent foreign ownership in general. In 1996 however, the
FINL was significantly reduced to allow for greater foreign participation in previously
prohibited sectors.
Data shows that from 1980 to 1989, average percentage growth rate of FDI inflows
in the country was only 0.2 percent, while the average for 1990 to 1999 was a high 29
percent. This coincides with the period when liberalization policies were taking place.
Figures for the last three years had shown marked improvement after significant
contractions were experienced in 2001 and 2003. In terms of FDI as percentage of Gross
Domestic Product (GDP), it was observed that the highest level was achieved in 2000 at
almost 3 percent. Meanwhile, average FDI inflows increased by 1.1 percent of GDP in
the 1990s as compared to 0.59 percent in the 1980s. Performance has been looking up
in the current decade with the increase in FDI inflows as percentage of GDP averaging
1.47 percent.5
1.4. Investment Incentives
The current Philippine investment incentives program is primarily drawn from
Executive Order 226 (EO 226) or the Omnibus Investments Code of 1987. A host of
incentives have been made available through this law to registered investments and
outlines the systematic procedures on how to avail of these incentives. Such incentives
are applicable to both Filipino owned and foreign owned investments.
In particular, the Code provides access to fiscal and non-fiscal incentives to
preferred areas of investments, categorized as either pioneer or non-pioneer, and to
export production as well as to rehabilitation or expansion of existing operations.
7
Pioneer enterprises are registered enterprises engaged in the manufacture and processing
of products or raw materials that are not yet produced in the Philippines in large volume.
It also involves the design, formula or system applied as well as agricultural, forestry
and mining activities, the services and energy sectors. Non-pioneer enterprises refer to
all registered producer enterprises not included in the pioneer enterprise list.
Qualified investments, depending on their category, are granted with incentives
that include income tax holidays, tax credits, tax and duty exemption for imported raw
materials and equipment, hiring of foreign labor, exemption from contractors’ tax,
simplified customs procedure, and other tax incentives. Also provided for under the law
are incentives to multinational companies (MNCs) establishing regional or area
headquarters, regional operating headquarters and regional warehouses in the country.
There is a number of investment regimes in the country, foremost of which is the
BOI. Others are the Philippine Export Zone Authority (PEZA), Subic Bay Metropolitan
Authority (SBMA) and Clark Development Corporation (CDC), which will be
discussed in more detail in the coming sections.
The performance of the different investment agencies based on data on total
approved FDIs by agency, from the late 1990s to 2006, and by nationality are insightful.
From 1998 to 2003, total approved investments by these promotion agencies had
decreased from 375.1 billion pesos to about 63.8 billion pesos. However, investment
inflows started to pick up in 2004 and have steadily increased until 2006. The BOI had
approved the most amounts of investments in the aggregate particularly in the years
1998, 2001, 2004 to 2006. The agency mainly approved investments from Filipinos. On
the other hand, PEZA had overtaken BOI in terms of value of approved investments in
the periods 1999 to 2000, and 2002 to 2003. In contrast to the BOI but not surprising,
PEZA had approved the most foreign investments. Meanwhile, the distinction for
having approved the most foreign investments in 2006 went to the SBMA at a value of
68.9 billion pesos.6
1.5. Export Promotion Strategy
Export orientation as a national strategy for sustainable agro-industrial
development received a boost with the enactment of Republic Act (RA) 7844, otherwise
known as Export Development Act of 1994. In its policy declaration, this law situates
8
the private sector as lead in the effort to promote exports and as partner of the
government in the concerted effort to increase the country’s share in the export market
by promoting leading industries or the so-called export champions. The law likewise
calls upon the Department of Trade and Industry (DTI) to prepare a three-year
Philippine Export Development Plan (PEDP), the implementation of which shall be
overseen by the Export Development Council (EDC). Said Council is comprised of
representatives of relevant government agencies and 9 representatives of the private
sector indicating that the pursuit of export development is essentially a public-private
partnership. The granting of incentives were likewise provided for in the law taking
various forms such as tax and duty exemptions, tax credits and availability of credit
facilities from government financial institutions for purposes of plant and equipment
expansion, among others.
1.6. Industrial Clustering in the Philippines
To be sure, the Philippines has been attracting investments from foreign sources
based on its comparative and competitive advantages. The policy reforms and programs
implemented that opened up the economy to investors did increase the level of
investments and attracted a more diverse country composition of investors. The main
question here is on whether the prevailing policy environment was able to sustain this
level of investments. Recent FDI figures do not support an affirmative response to this
question, particularly when compared with the performance of other ASEAN countries.
As a response, deliberate efforts to increase the attraction of the country to domestic and
foreign investments alike continue to be implemented. Two such policies and programs
being pursued by the government and in parallel to each other is the formation of
industrial zones across the country and industry clustering. In the Philippine
configuration, both relate to the export promotion program as the industrial zones
include special economic zones dedicated to exporting firms, while industry clusters are
tied to the so called export revenue streams or industry champions of the country and
are being pursued actively by the National Cluster Management Team (NCMT) of the
Export Development Council. The formation and promotion of these industrial zones is
also a mechanism to disperse industrialization to other parts of the country to stimulate
economic growth, while clustering is hoped to spur the growth of small and medium
9
enterprises across the country in partnership with other government agencies, the private
sector and local governments.
1.6.1. Industrial Zones in the Philippines
In 1995, the Special Economic Zone Act was passed under RA 7916, which
reiterated the objective of accelerating a sound and balanced industrial, economic and
social development of the country through the establishment of special economic zones
(ecozones) in strategic locations and through mechanisms that would attract foreign
investments. Moreover, under this legislation, firms are no longer required to be either
wholly export-oriented or engaged only in industries being promoted. All firms can then
choose to locate in these industrial parks regardless of market orientation, while a
distinct group of export processing zones (EPZs) will continue to be predominantly
oriented to export production while being considered virtually located outside customs
territory.
Governance of the special ecozones rests with the Philippine Economic Zone
Authority (PEZA). It is notable that the Special Economic Zone Act called for greater
private sector participation in zone development and management through incentive
offerings to private zone developers and operators. Meanwhile, the local government
units are being encouraged to participate more actively in the development and
sustenance of specially designated economic zones.
In terms of performance, the PEZA declared that as of July 2007, there are: four
public economic zones with 423 operating firms combined; forty-five private economic
zones located all over the country but many of them found in Laguna and Cavite, with
528 operating firms; seventy IT parks/centers/buildings mostly situated in Metro Manila,
catering to 265 operating firms; and, five tourism economic zones with equal number of
operating firms.
There are two other major special economic zones culled out from former U.S.
military bases in the country, namely the Subic Bay Freeport Zone and the Clark
Freeport Zone. To manage and implement these special ecozones, primarily
transforming them from military bases to investment havens, the Subic Bay
Metropolitan Authority was created in 1992 and the Clark Development Corporation in
1993.
10
1.6.2. Industry Clustering Strategy
The National Science and Technology Plan for 2001-2020 has elucidated the
clustering approach together with the concept of product niching as a way of linking
science and technology (S&T) policy to industrial policy. Soon after, clustering became
one of the key elements of the Philippine Export Development Plan since 2002. In fact,
the NCMT under the EDC was created specifically to sustain this program (Export
Development Council, 2007).
The 2002-2004 PEDP defined the roles of relevant government agencies in
bringing the clustering strategy into fruition and called for closer coordination among
them, highlighting the fact that this initiative is not the sole responsibility of the DTI.
It espoused for the involvement of the private sector, particularly as champions for
forming and sustaining the clusters.
Meanwhile, the latest PEDP spanning the years 2005-2007 called for sustaining the
clustering approach to industry development with special emphasis on regions and
provinces with export-oriented cities/municipalities covered by the One-Town, One-
Product (OTOP) initiative.
As stated in this latest incarnation of the Plan, national clusters shall be created and
promoted to serve as models of this strategy. Since the criteria for their selection
included impact on the economy in terms of revenue and employment generation, the
industries considered as national clusters come from the so-called export revenue
streams of the PEDP. The NCMT under the EDC currently monitors the performance of
the national priority clusters. The Team’s role is to harmonize and complement all
interventions needed by the clusters and to influence relevant agencies to align their
programs with the clusters. Currently, the national clusters are electronics; information
and technology services; automotive; minerals; food and marine products; organics;
design driven products and services (home furnishings, giftware, holiday décor, and
wearables); construction services and materials; logistics services; health and wellness;
and tourism.
Supplementing these national clusters are regional and provincial clusters, which
were identified as a result of a participatory approach led by the NCMT in collaboration
with DTI-EDC. Composite teams went around the country to conduct seminars of
11
industry clustering and consultations with various stakeholders, such as those that
represent business and industry, academic and research institutions, relevant government
agencies, local government units, and non-government organizations.
As a result of these activities undertaken between 2001 to 2002, the following
priority sectors where clustering will be promoted were identified: at the regional level –
palm oil, rubber, coffee, fiber-based industries, fruit production and processing, high-
value vegetables, seaweeds and carrageenan, meat processing, marine, furniture, and
bamboo-based industries. At the provincial level, the following came out as priority
industries: lime, muscovado sugar, cassava, horticulture, corn-feed livestock, cattle, fine
jewelry, fashion accessories, handmade paper, and metalworking and engineering.
The clustering strategy is also being linked to the government’s One-Town, One-
Product program but only in terms of industries or products that can be considered as
export ready as far as the EDC is concerned. The OTOP-Philippines is a flagship
program of President Arroyo as the development strategy that would promote
entrepreneurship and jobs creation in the countryside.
2. INDUSTRIAL AGGLOMERATION AND INNOVATION IN
GREATER MANILA AREA
2.1. Industrial Concentration in Greater Manila Area
The primacy of Metro Manila can be traced back in history and despite the rising
of other metropolises in the country; its importance to the economic and social fabric of
the Philippines remains. Over the years, with the unchecked population explosion and
other host of problems attendant to urban areas, regions in the immediate periphery of
what is also known as the National Capital Region became the choice location for
expansion of residential, social and economic activities. Industrial areas in Laguna,
Cavite and Batangas in the south and Bulacan and Pampanga in the north and Rizal in
the east sprouted and have become extensions of the prime metropolis.
Not a few urban experts have opined that practically, the legal basis defining the
geographical jurisdiction of Metro Manila is no longer applicable as the demarcation
line defining the metropolis has blurred and indeed, already covers the immediate
12
industrial areas of Cavite, Laguna and Bulacan. In order to capture this reality, this
paper expanded the legally defined geographical coverage as case study for determining
industrial agglomeration in Metro Manila to encompass the industrial areas of at least,
Cavite and Laguna to form what is dubbed as Greater Manila Area (GMA).
Industry-wise, the 2000 Census of Establishments provided details on the
composition of industrial concentration in Metro Manila. In terms of manufacturing
establishments, we find that the top five activities dominating the Metro Manila
economic landscape (in terms of number of establishments) are the production of ready-
made garments; plastic products; printing and service activities related to printing;
manufacture of other chemical products; and, production of basic iron and steel. Those
engaged in metal products and metal working; manufacture of pulp, paper and
paperboard; manufacture of structural metal products, tanks, reservoirs, and steam
generators; food products; and bakery products round up the top ten industries
concentrating in the metropolis (National Statistics Office, 2004).
There are 70 industrial zones scattered over Metro Manila. These industrial zones
fall under the purview of the PEZA but are mainly private sector led industrial
agglomerations. These are mostly technology parks as 57 out of 70 have explicitly
indicated preference for IT-enabled industries. A few are intended for the electronics
industry, aviation, solar panel fabrication, or mixed use. This implies that as
manufacturing production are moved by companies in areas in the periphery of Metro
Manila, higher forms of industrial activities – knowledge based, technology based
industries – are getting concentrated in the metropolis. These IT-enabled industries
mainly take the form of business process outsourcing such as call centers, data centers,
medical transcriptions, and software development. Among the local government units
(LGUs) in Metro Manila, Makati City hosts many of the technology
parks/centers/buildings. Meanwhile, a university-based technology park has recently
been established with funding support coming from a private company. There are
actually two locations of the University of the Philippines Science and Technology Park,
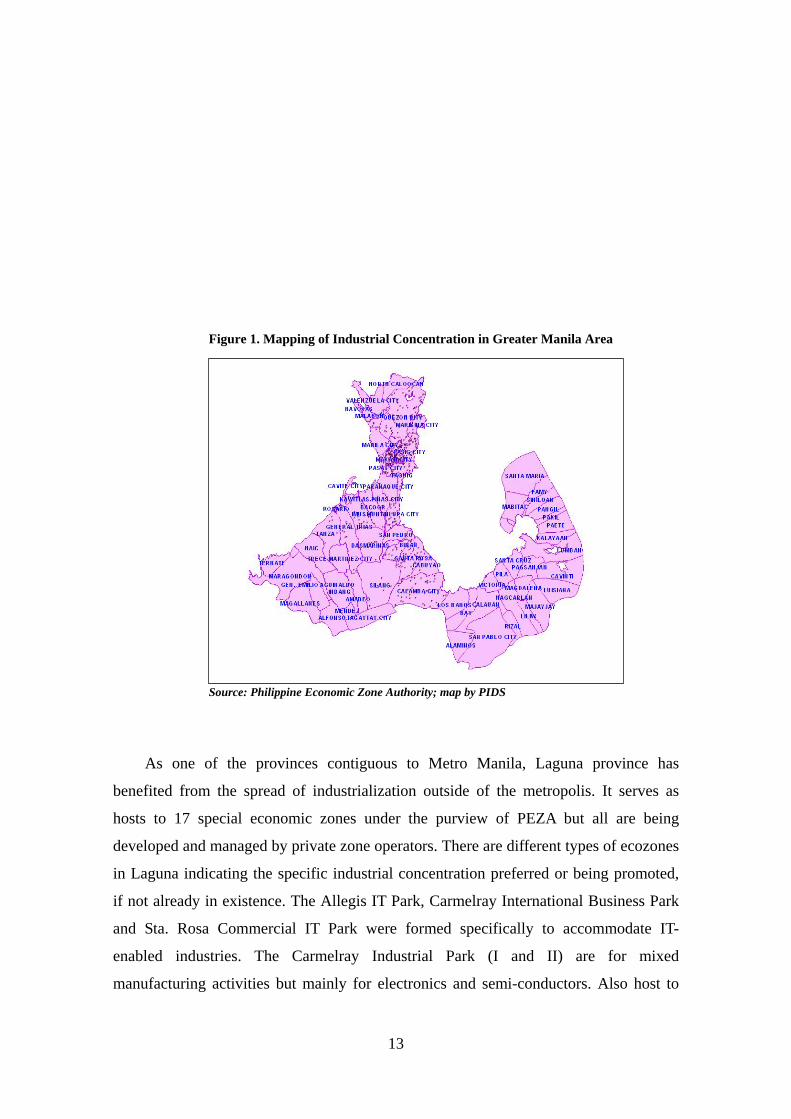
one in the North and the other, in the South. Figure 1 presents a mapping of the
concentrations of these industrial zones, not only in Metro Manila but including Laguna
and Cavite as well.
13
Figure 1. Mapping of Industrial Concentration in Greater Manila Area
Source: Philippine Economic Zone Authority; map by PIDS
As one of the provinces contiguous to Metro Manila, Laguna province has
benefited from the spread of industrialization outside of the metropolis. It serves as
hosts to 17 special economic zones under the purview of PEZA but all are being
developed and managed by private zone operators. There are different types of ecozones
in Laguna indicating the specific industrial concentration preferred or being promoted,
if not already in existence. The Allegis IT Park, Carmelray International Business Park
and Sta. Rosa Commercial IT Park were formed specifically to accommodate IT-
enabled industries. The Carmelray Industrial Park (I and II) are for mixed
manufacturing activities but mainly for electronics and semi-conductors. Also host to
14
mixed industries and mainly for manufacturing activities are the Laguna International
Industrial Park, the four Laguna Technopark, and the two Light Industry and Science
Parks. The Filinvest Technology Park and the Calamba Premiere International Park is
for light to medium scale, non-polluting industries. Meanwhile, there are industry
specific zones like the Greenfield Automotive Park for firms engaged in automotive
manufacturing; Toyota Sta. Rosa Special Economic Zone for automotive parts and
YTMI Realty Special Economic Zone for automotive wiring harness. In the Laguna area,
Figure 1 indicates that the ecozones are concentrating in Biñan, Sta. Rosa and Calamba
cities.
Meanwhile, industrial agglomeration in Cavite province can be found in its 13
economic zones. The Cavite Economic Zone, which is host to manufacturing industries
engaged in the production of a diverse mix of products, is the only publicly owned
industrial estate in the province. The same type of activities could be found in Fil-Estate
Industrial Park, First Cavite Industrial Estate and People’s Technology Complex.
Meanwhile, those that prefer light to medium scale, non-pollutant industries are the
Cavite Eco-Industrial Estate, EMI Special Economic Zone and Golden Mile Business
Park. Those that are engaged in the production of electronics, semiconductors and
similar products are the Cavite Productivity and Economic Zone and Gateway Business
Park. Daiichi Industrial Park is host to mixed production but mainly related to plastic
products, design of equipment for automation and energy conservation. Cavite is also
host of one tourism zone, the Island Cove Tourism Economic Zone that features the
resort facilities in the area. SM City Bacoor, a mall, is also considered as an ecozone,
while Filoil Special Economic Zone did not specify preferred or existing industries.
Referring back to Figure 1, it can be noted that the ecozones are more scattered unlike in
Laguna but still concentrated in the areas nearest to Metro Manila cities such as Bacoor,
Imus, Rosario, and General Trias.
2.2. Stylized Facts from the Industrial Clustering Survey of Philippine Business
and Industry in Greater Manila Area
The results presented in this section are derived from the 2007 Industrial Clustering
Survey of Philippine Business and Industry undertaken in the last quarter of 2007
focusing on Greater Manila Area as survey domain. The National Statistics Office
15
(NSO) was commissioned to conduct this survey on behalf of the Philippine Institute for
Development Studies. In particular, the survey would help determine the current
structure and conditions of industrial agglomerations in the case study area; identify the
nature and characteristics of the existing production networks of industrial
agglomerations; pinpoint the factors that influence the location decision of firms; and,
determine types and sources of technological innovation undertaken by firms, among
others.
The formulation of the sampling frame and the distribution of the survey
instrument were likewise undertaken by the NSO. This decision was made in
consideration of the NSO’s established and long standing relationship with the firms in
various industries in the country by virtue of their regular conduct of census of
establishments and industry surveys. .
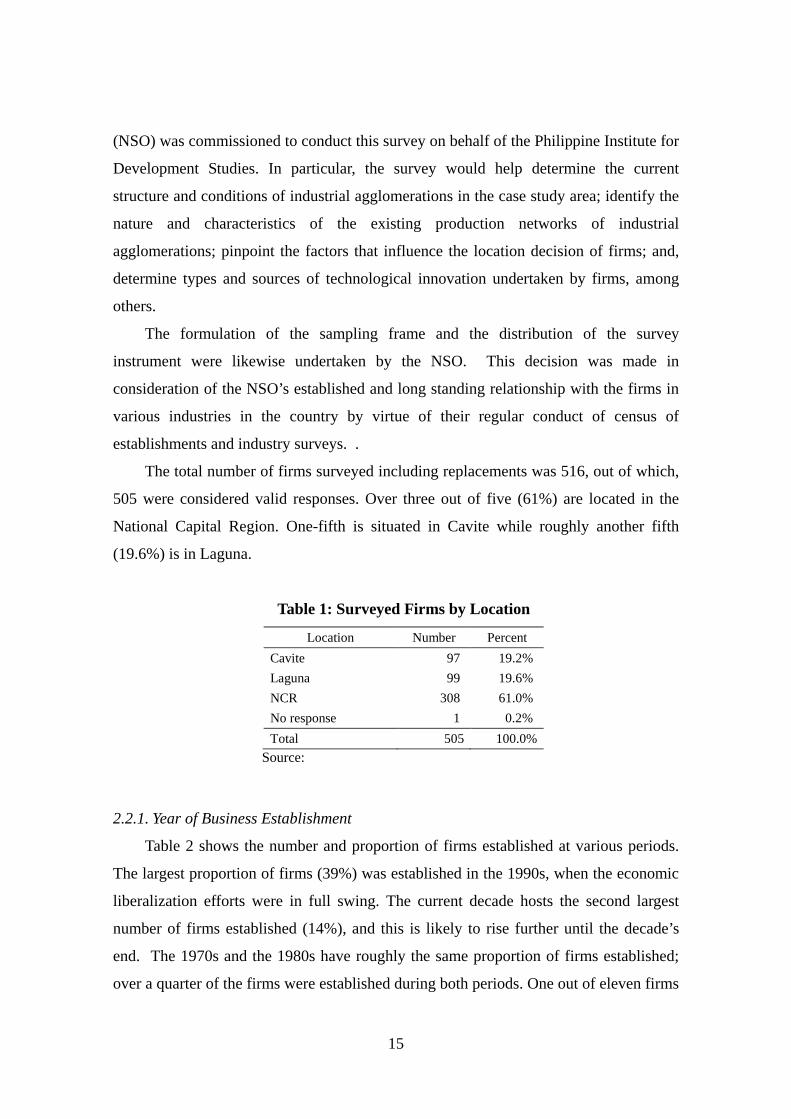
The total number of firms surveyed including replacements was 516, out of which,
505 were considered valid responses. Over three out of five (61%) are located in the
National Capital Region. One-fifth is situated in Cavite while roughly another fifth
(19.6%) is in Laguna.
Table 1: Surveyed Firms by Location
Location Number Percent Cavite 97 19.2% Laguna 99 19.6% NCR 308 61.0% No response 1 0.2% Total 505 100.0%
Source:
2.2.1. Year of Business Establishment
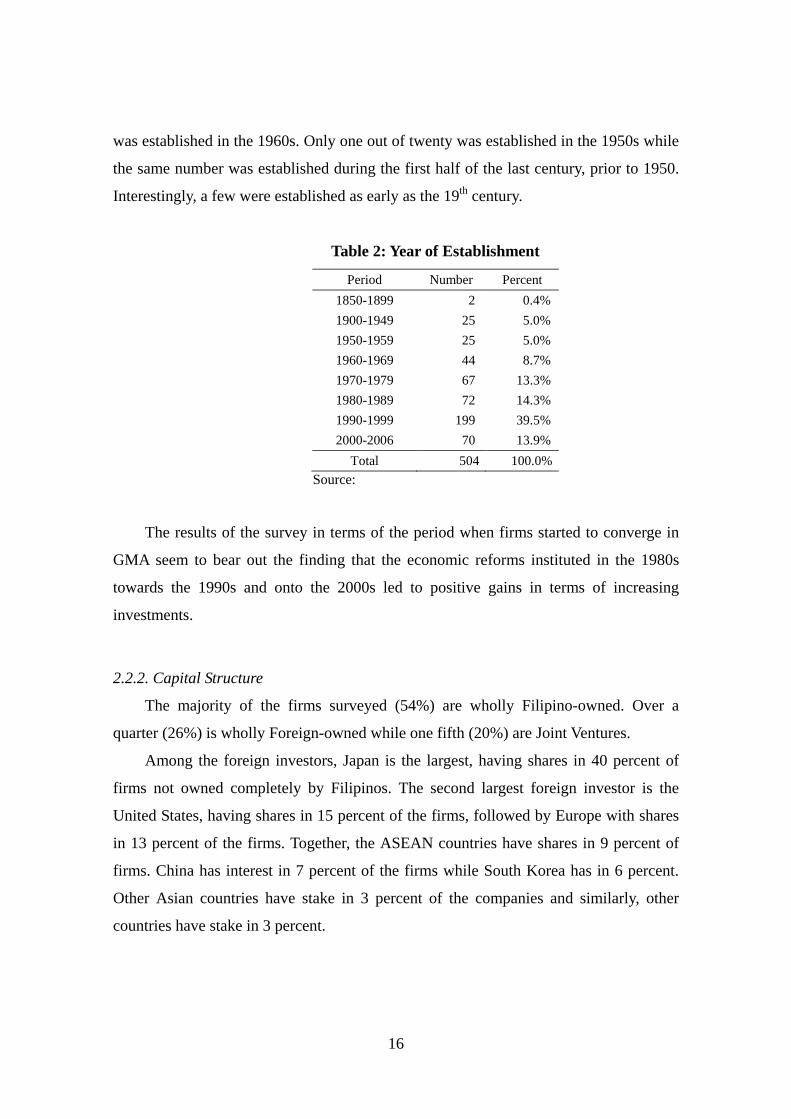
Table 2 shows the number and proportion of firms established at various periods.
The largest proportion of firms (39%) was established in the 1990s, when the economic
liberalization efforts were in full swing. The current decade hosts the second largest
number of firms established (14%), and this is likely to rise further until the decade’s
end. The 1970s and the 1980s have roughly the same proportion of firms established;
over a quarter of the firms were established during both periods. One out of eleven firms
16
was established in the 1960s. Only one out of twenty was established in the 1950s while
the same number was established during the first half of the last century, prior to 1950.
Interestingly, a few were established as early as the 19th century.
Table 2: Year of Establishment
Period Number Percent 1850-1899 2 0.4% 1900-1949 25 5.0% 1950-1959 25 5.0% 1960-1969 44 8.7% 1970-1979 67 13.3% 1980-1989 72 14.3% 1990-1999 199 39.5% 2000-2006 70 13.9%
Total 504 100.0% Source:
The results of the survey in terms of the period when firms started to converge in
GMA seem to bear out the finding that the economic reforms instituted in the 1980s
towards the 1990s and onto the 2000s led to positive gains in terms of increasing
investments.
2.2.2. Capital Structure
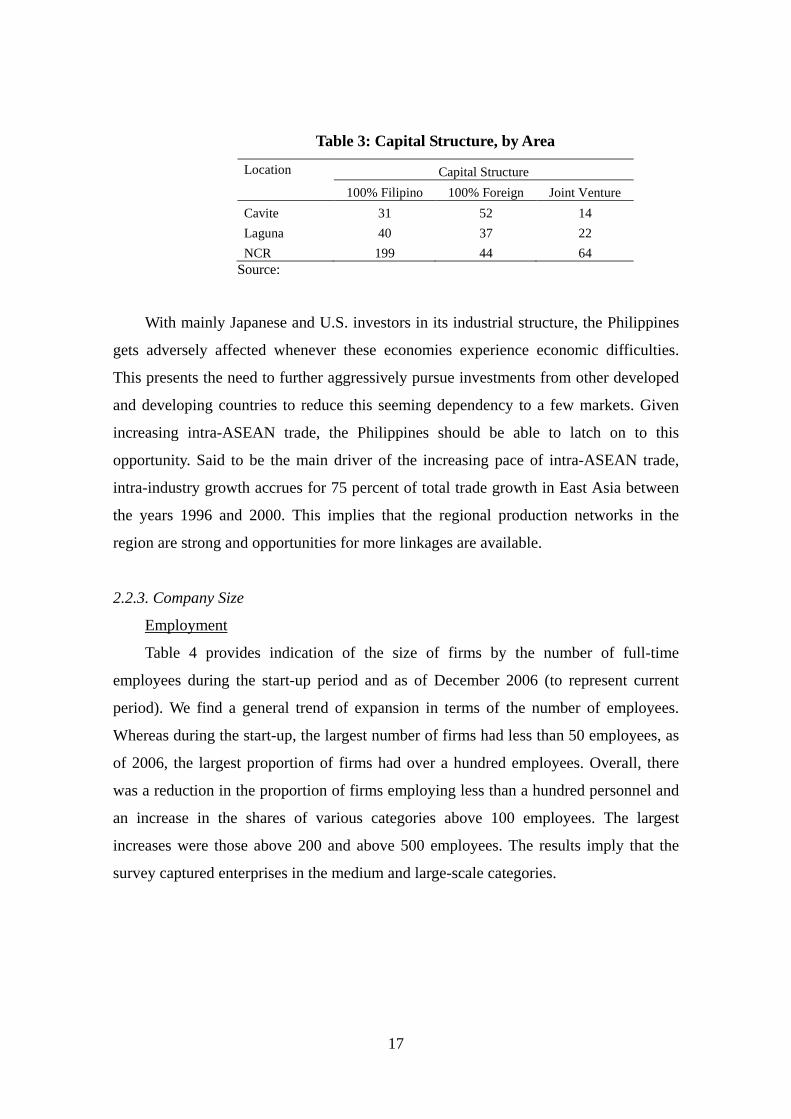
The majority of the firms surveyed (54%) are wholly Filipino-owned. Over a
quarter (26%) is wholly Foreign-owned while one fifth (20%) are Joint Ventures.
Among the foreign investors, Japan is the largest, having shares in 40 percent of
firms not owned completely by Filipinos. The second largest foreign investor is the
United States, having shares in 15 percent of the firms, followed by Europe with shares
in 13 percent of the firms. Together, the ASEAN countries have shares in 9 percent of
firms. China has interest in 7 percent of the firms while South Korea has in 6 percent.
Other Asian countries have stake in 3 percent of the companies and similarly, other
countries have stake in 3 percent.
17
Table 3: Capital Structure, by Area
Location Capital Structure 100% Filipino 100% Foreign Joint Venture
Cavite 31 52 14 Laguna 40 37 22 NCR 199 44 64
Source:
With mainly Japanese and U.S. investors in its industrial structure, the Philippines
gets adversely affected whenever these economies experience economic difficulties.
This presents the need to further aggressively pursue investments from other developed
and developing countries to reduce this seeming dependency to a few markets. Given
increasing intra-ASEAN trade, the Philippines should be able to latch on to this
opportunity. Said to be the main driver of the increasing pace of intra-ASEAN trade,
intra-industry growth accrues for 75 percent of total trade growth in East Asia between
the years 1996 and 2000. This implies that the regional production networks in the
region are strong and opportunities for more linkages are available.
2.2.3. Company Size
Employment
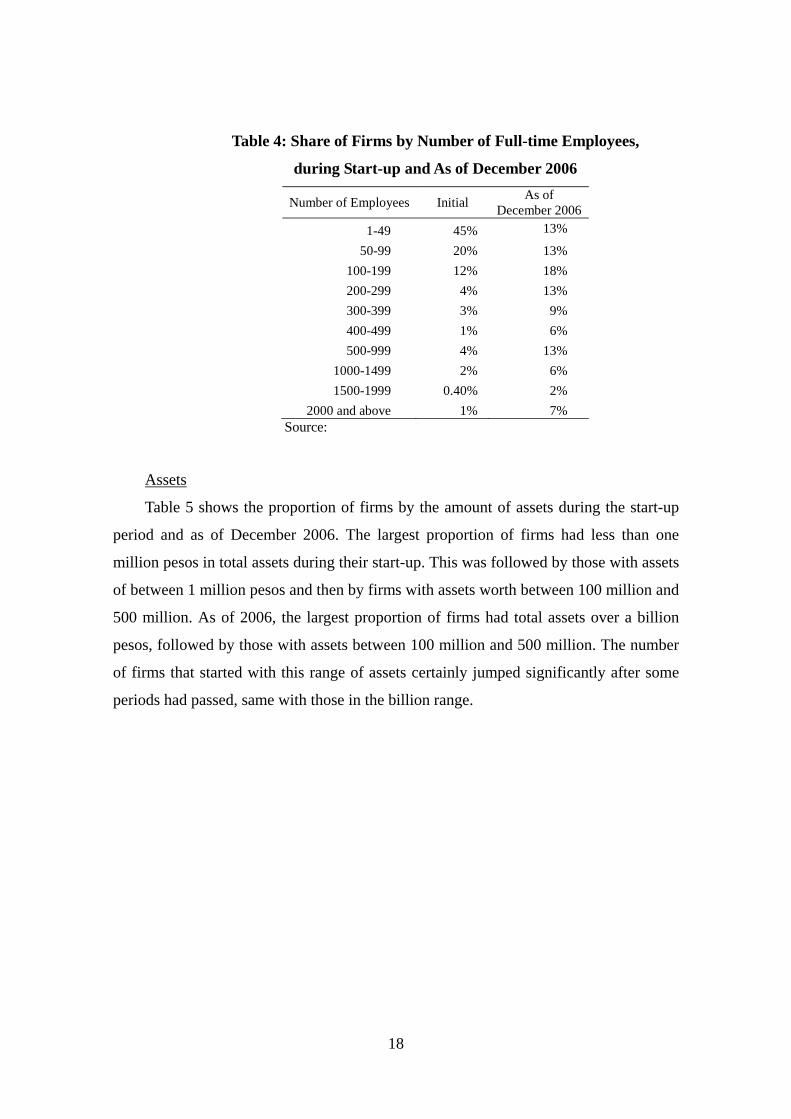
Table 4 provides indication of the size of firms by the number of full-time
employees during the start-up period and as of December 2006 (to represent current
period). We find a general trend of expansion in terms of the number of employees.
Whereas during the start-up, the largest number of firms had less than 50 employees, as
of 2006, the largest proportion of firms had over a hundred employees. Overall, there
was a reduction in the proportion of firms employing less than a hundred personnel and
an increase in the shares of various categories above 100 employees. The largest
increases were those above 200 and above 500 employees. The results imply that the
survey captured enterprises in the medium and large-scale categories.
18
Table 4: Share of Firms by Number of Full-time Employees,
during Start-up and As of December 2006
Number of Employees Initial As of December 2006
1-49 45% 13%
50-99 20% 13% 100-199 12% 18% 200-299 4% 13% 300-399 3% 9% 400-499 1% 6% 500-999 4% 13%
1000-1499 2% 6% 1500-1999 0.40% 2%
2000 and above 1% 7% Source:
Assets
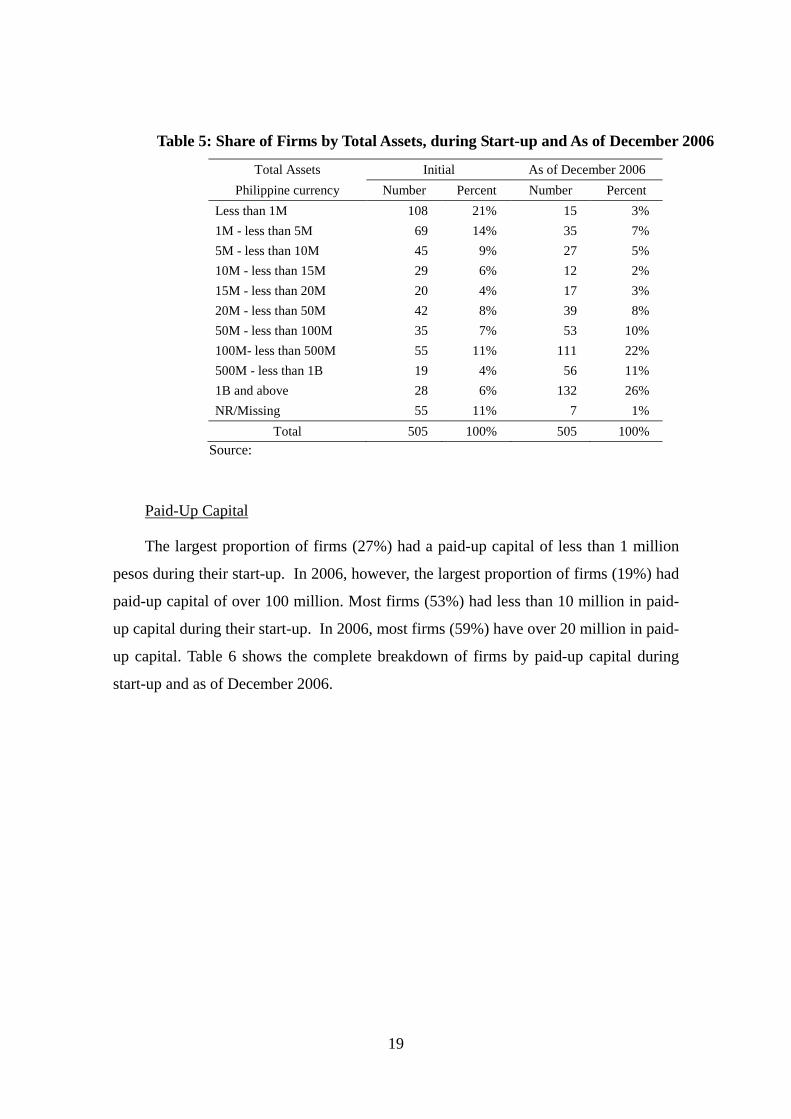
Table 5 shows the proportion of firms by the amount of assets during the start-up
period and as of December 2006. The largest proportion of firms had less than one
million pesos in total assets during their start-up. This was followed by those with assets
of between 1 million pesos and then by firms with assets worth between 100 million and
500 million. As of 2006, the largest proportion of firms had total assets over a billion
pesos, followed by those with assets between 100 million and 500 million. The number
of firms that started with this range of assets certainly jumped significantly after some
periods had passed, same with those in the billion range.
19
Table 5: Share of Firms by Total Assets, during Start-up and As of December 2006
Total Assets Initial As of December 2006 Philippine currency Number Percent Number Percent
Less than 1M 108 21% 15 3% 1M - less than 5M 69 14% 35 7% 5M - less than 10M 45 9% 27 5% 10M - less than 15M 29 6% 12 2% 15M - less than 20M 20 4% 17 3% 20M - less than 50M 42 8% 39 8% 50M - less than 100M 35 7% 53 10% 100M- less than 500M 55 11% 111 22% 500M - less than 1B 19 4% 56 11% 1B and above 28 6% 132 26% NR/Missing 55 11% 7 1%
Total 505 100% 505 100% Source:
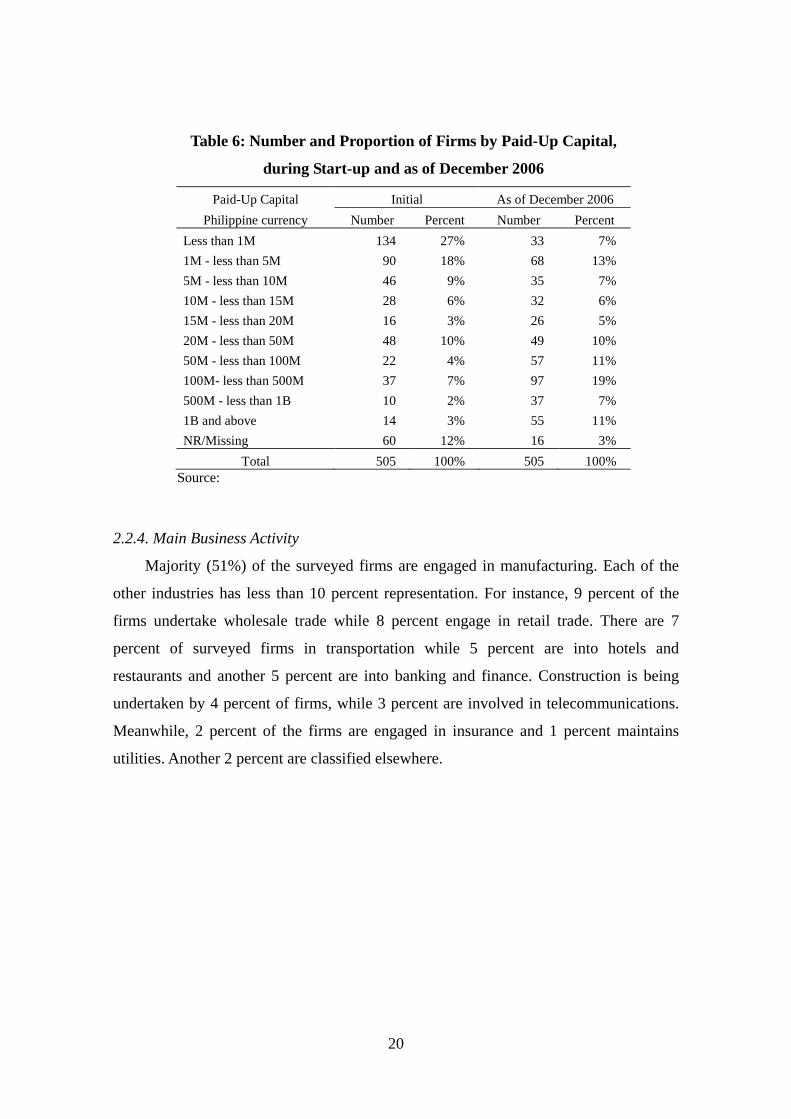
Paid-Up Capital
The largest proportion of firms (27%) had a paid-up capital of less than 1 million
pesos during their start-up. In 2006, however, the largest proportion of firms (19%) had
paid-up capital of over 100 million. Most firms (53%) had less than 10 million in paid-
up capital during their start-up. In 2006, most firms (59%) have over 20 million in paid-
up capital. Table 6 shows the complete breakdown of firms by paid-up capital during
start-up and as of December 2006.
20
Table 6: Number and Proportion of Firms by Paid-Up Capital,
during Start-up and as of December 2006
Paid-Up Capital Initial As of December 2006 Philippine currency Number Percent Number Percent
Less than 1M 134 27% 33 7% 1M - less than 5M 90 18% 68 13% 5M - less than 10M 46 9% 35 7% 10M - less than 15M 28 6% 32 6% 15M - less than 20M 16 3% 26 5% 20M - less than 50M 48 10% 49 10% 50M - less than 100M 22 4% 57 11% 100M- less than 500M 37 7% 97 19% 500M - less than 1B 10 2% 37 7% 1B and above 14 3% 55 11% NR/Missing 60 12% 16 3%
Total 505 100% 505 100% Source:
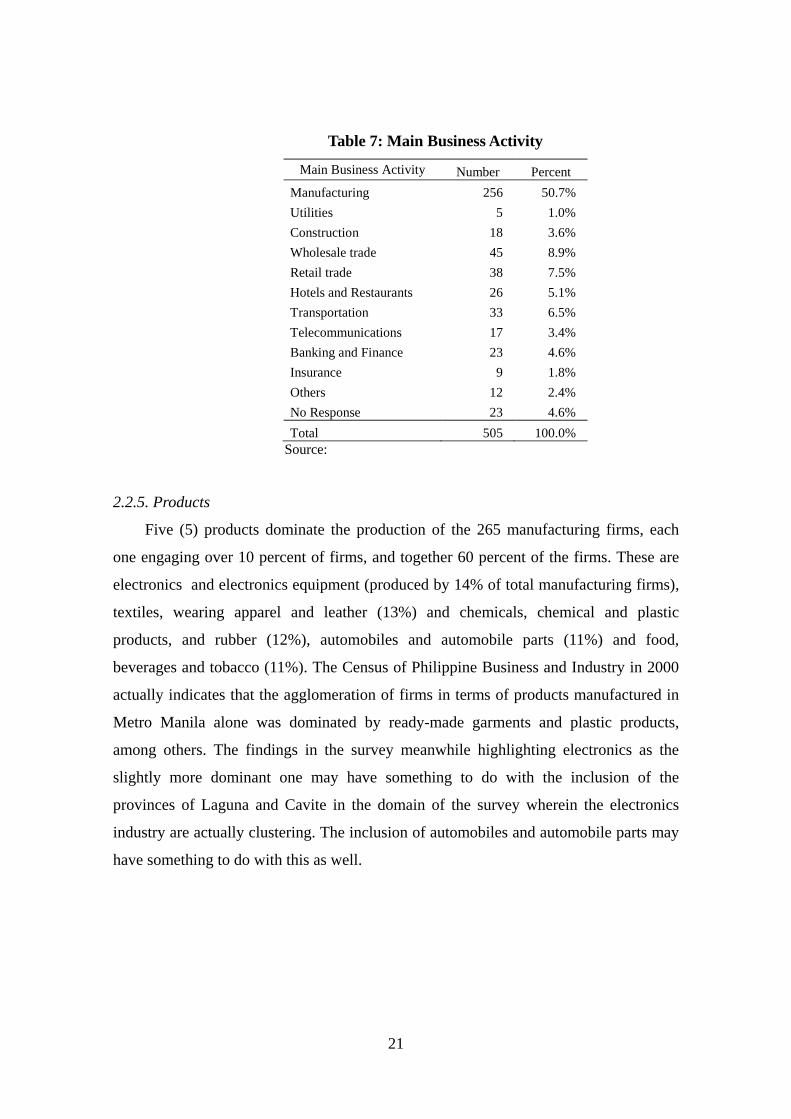
2.2.4. Main Business Activity
Majority (51%) of the surveyed firms are engaged in manufacturing. Each of the
other industries has less than 10 percent representation. For instance, 9 percent of the
firms undertake wholesale trade while 8 percent engage in retail trade. There are 7
percent of surveyed firms in transportation while 5 percent are into hotels and
restaurants and another 5 percent are into banking and finance. Construction is being
undertaken by 4 percent of firms, while 3 percent are involved in telecommunications.
Meanwhile, 2 percent of the firms are engaged in insurance and 1 percent maintains
utilities. Another 2 percent are classified elsewhere.
21
Table 7: Main Business Activity
Main Business Activity Number Percent Manufacturing 256 50.7% Utilities 5 1.0% Construction 18 3.6% Wholesale trade 45 8.9% Retail trade 38 7.5% Hotels and Restaurants 26 5.1% Transportation 33 6.5% Telecommunications 17 3.4% Banking and Finance 23 4.6% Insurance 9 1.8% Others 12 2.4% No Response 23 4.6% Total 505 100.0%
Source:
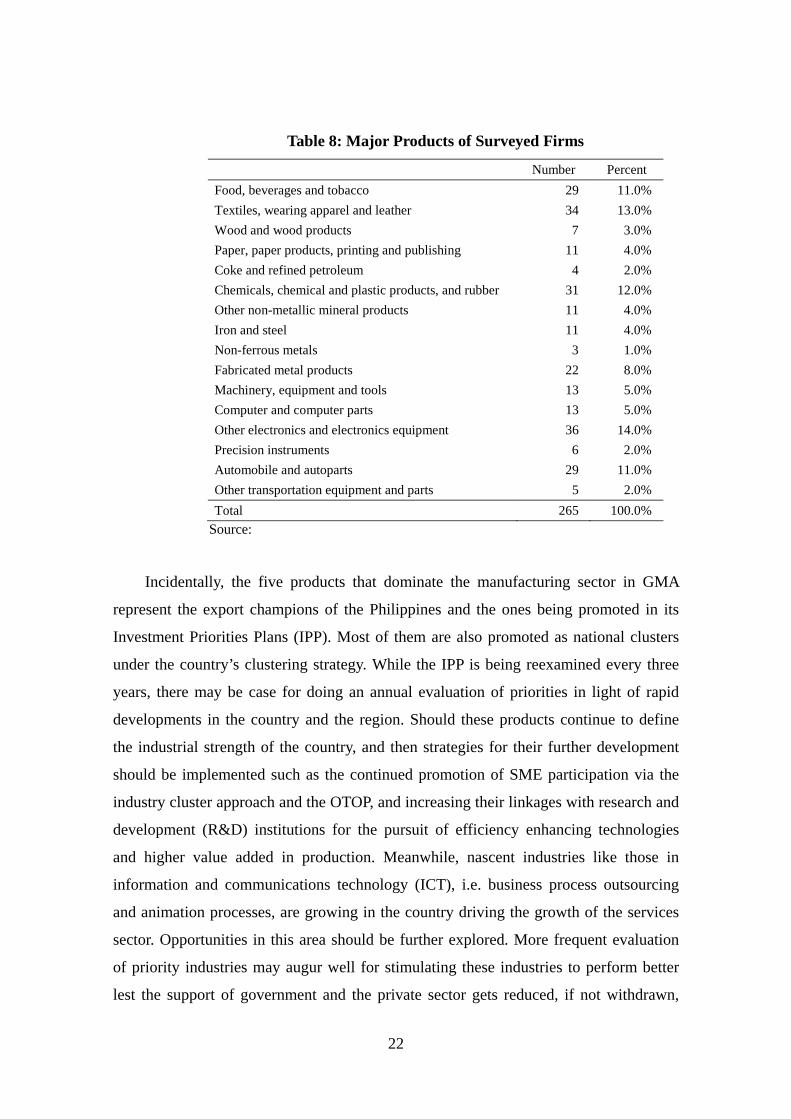
2.2.5. Products
Five (5) products dominate the production of the 265 manufacturing firms, each
one engaging over 10 percent of firms, and together 60 percent of the firms. These are
electronics and electronics equipment (produced by 14% of total manufacturing firms),
textiles, wearing apparel and leather (13%) and chemicals, chemical and plastic
products, and rubber (12%), automobiles and automobile parts (11%) and food,
beverages and tobacco (11%). The Census of Philippine Business and Industry in 2000
actually indicates that the agglomeration of firms in terms of products manufactured in
Metro Manila alone was dominated by ready-made garments and plastic products,
among others. The findings in the survey meanwhile highlighting electronics as the
slightly more dominant one may have something to do with the inclusion of the
provinces of Laguna and Cavite in the domain of the survey wherein the electronics
industry are actually clustering. The inclusion of automobiles and automobile parts may
have something to do with this as well.
22
Table 8: Major Products of Surveyed Firms
Number Percent Food, beverages and tobacco 29 11.0% Textiles, wearing apparel and leather 34 13.0% Wood and wood products 7 3.0% Paper, paper products, printing and publishing 11 4.0% Coke and refined petroleum 4 2.0% Chemicals, chemical and plastic products, and rubber 31 12.0% Other non-metallic mineral products 11 4.0% Iron and steel 11 4.0% Non-ferrous metals 3 1.0% Fabricated metal products 22 8.0% Machinery, equipment and tools 13 5.0% Computer and computer parts 13 5.0% Other electronics and electronics equipment 36 14.0% Precision instruments 6 2.0% Automobile and autoparts 29 11.0% Other transportation equipment and parts 5 2.0% Total 265 100.0%
Source:
Incidentally, the five products that dominate the manufacturing sector in GMA
represent the export champions of the Philippines and the ones being promoted in its
Investment Priorities Plans (IPP). Most of them are also promoted as national clusters
under the country’s clustering strategy. While the IPP is being reexamined every three
years, there may be case for doing an annual evaluation of priorities in light of rapid
developments in the country and the region. Should these products continue to define
the industrial strength of the country, and then strategies for their further development
should be implemented such as the continued promotion of SME participation via the
industry cluster approach and the OTOP, and increasing their linkages with research and
development (R&D) institutions for the pursuit of efficiency enhancing technologies
and higher value added in production. Meanwhile, nascent industries like those in
information and communications technology (ICT), i.e. business process outsourcing
and animation processes, are growing in the country driving the growth of the services
sector. Opportunities in this area should be further explored. More frequent evaluation
of priority industries may augur well for stimulating these industries to perform better
lest the support of government and the private sector gets reduced, if not withdrawn,
23
particularly as these incentives and other types of support would be contingent on
performance.
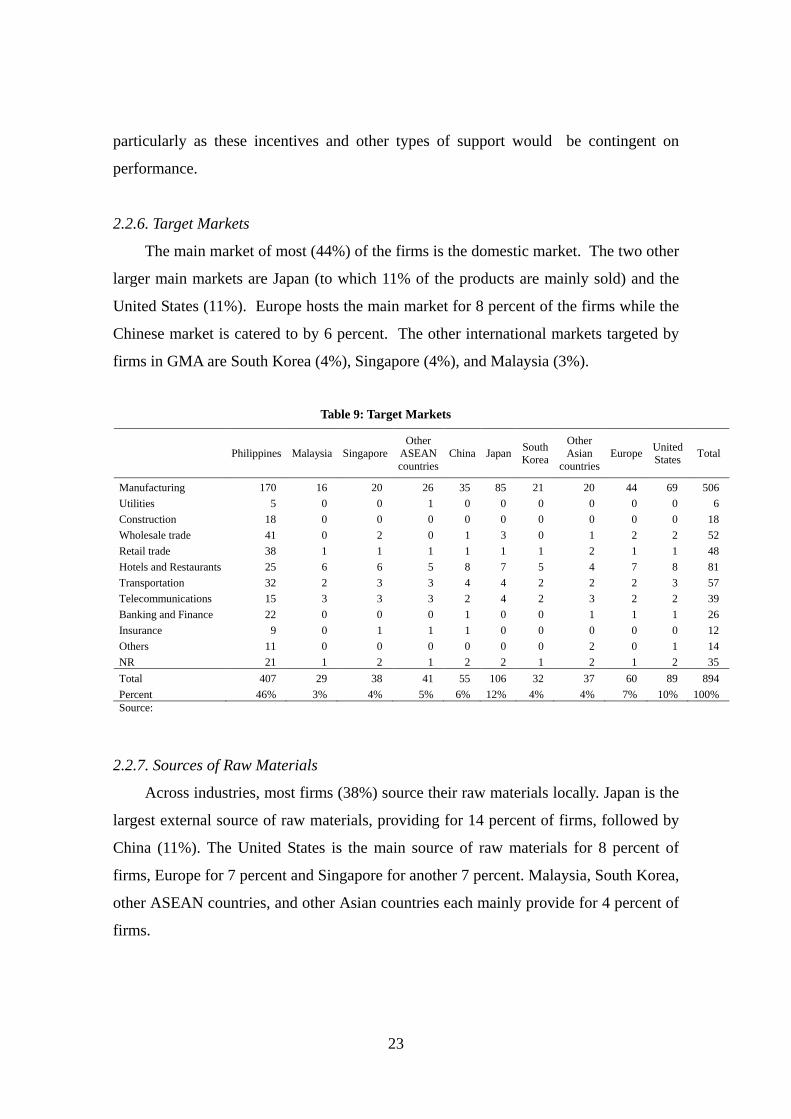
2.2.6. Target Markets
The main market of most (44%) of the firms is the domestic market. The two other
larger main markets are Japan (to which 11% of the products are mainly sold) and the
United States (11%). Europe hosts the main market for 8 percent of the firms while the
Chinese market is catered to by 6 percent. The other international markets targeted by
firms in GMA are South Korea (4%), Singapore (4%), and Malaysia (3%).
Table 9: Target Markets
Philippines Malaysia SingaporeOther
ASEAN countries
China Japan South Korea
Other Asian
countries Europe United
States Total
Manufacturing 170 16 20 26 35 85 21 20 44 69 506 Utilities 5 0 0 1 0 0 0 0 0 0 6 Construction 18 0 0 0 0 0 0 0 0 0 18 Wholesale trade 41 0 2 0 1 3 0 1 2 2 52 Retail trade 38 1 1 1 1 1 1 2 1 1 48 Hotels and Restaurants 25 6 6 5 8 7 5 4 7 8 81 Transportation 32 2 3 3 4 4 2 2 2 3 57 Telecommunications 15 3 3 3 2 4 2 3 2 2 39 Banking and Finance 22 0 0 0 1 0 0 1 1 1 26 Insurance 9 0 1 1 1 0 0 0 0 0 12 Others 11 0 0 0 0 0 0 2 0 1 14 NR 21 1 2 1 2 2 1 2 1 2 35 Total 407 29 38 41 55 106 32 37 60 89 894 Percent 46% 3% 4% 5% 6% 12% 4% 4% 7% 10% 100% Source:
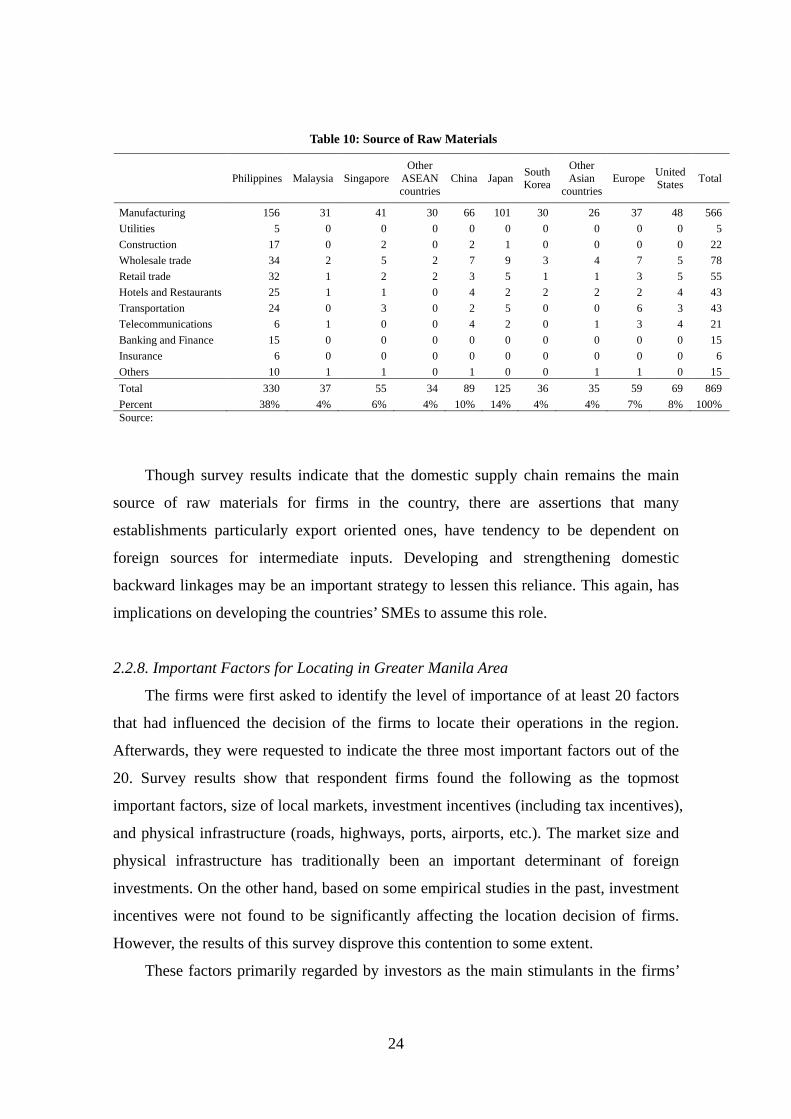
2.2.7. Sources of Raw Materials
Across industries, most firms (38%) source their raw materials locally. Japan is the
largest external source of raw materials, providing for 14 percent of firms, followed by
China (11%). The United States is the main source of raw materials for 8 percent of
firms, Europe for 7 percent and Singapore for another 7 percent. Malaysia, South Korea,
other ASEAN countries, and other Asian countries each mainly provide for 4 percent of
firms.
24
Table 10: Source of Raw Materials
Philippines Malaysia SingaporeOther
ASEAN countries
China Japan South Korea
Other Asian
countries Europe United
States Total
Manufacturing 156 31 41 30 66 101 30 26 37 48 566 Utilities 5 0 0 0 0 0 0 0 0 0 5 Construction 17 0 2 0 2 1 0 0 0 0 22 Wholesale trade 34 2 5 2 7 9 3 4 7 5 78 Retail trade 32 1 2 2 3 5 1 1 3 5 55 Hotels and Restaurants 25 1 1 0 4 2 2 2 2 4 43 Transportation 24 0 3 0 2 5 0 0 6 3 43 Telecommunications 6 1 0 0 4 2 0 1 3 4 21 Banking and Finance 15 0 0 0 0 0 0 0 0 0 15 Insurance 6 0 0 0 0 0 0 0 0 0 6 Others 10 1 1 0 1 0 0 1 1 0 15 Total 330 37 55 34 89 125 36 35 59 69 869 Percent 38% 4% 6% 4% 10% 14% 4% 4% 7% 8% 100%Source:
Though survey results indicate that the domestic supply chain remains the main
source of raw materials for firms in the country, there are assertions that many
establishments particularly export oriented ones, have tendency to be dependent on
foreign sources for intermediate inputs. Developing and strengthening domestic
backward linkages may be an important strategy to lessen this reliance. This again, has
implications on developing the countries’ SMEs to assume this role.
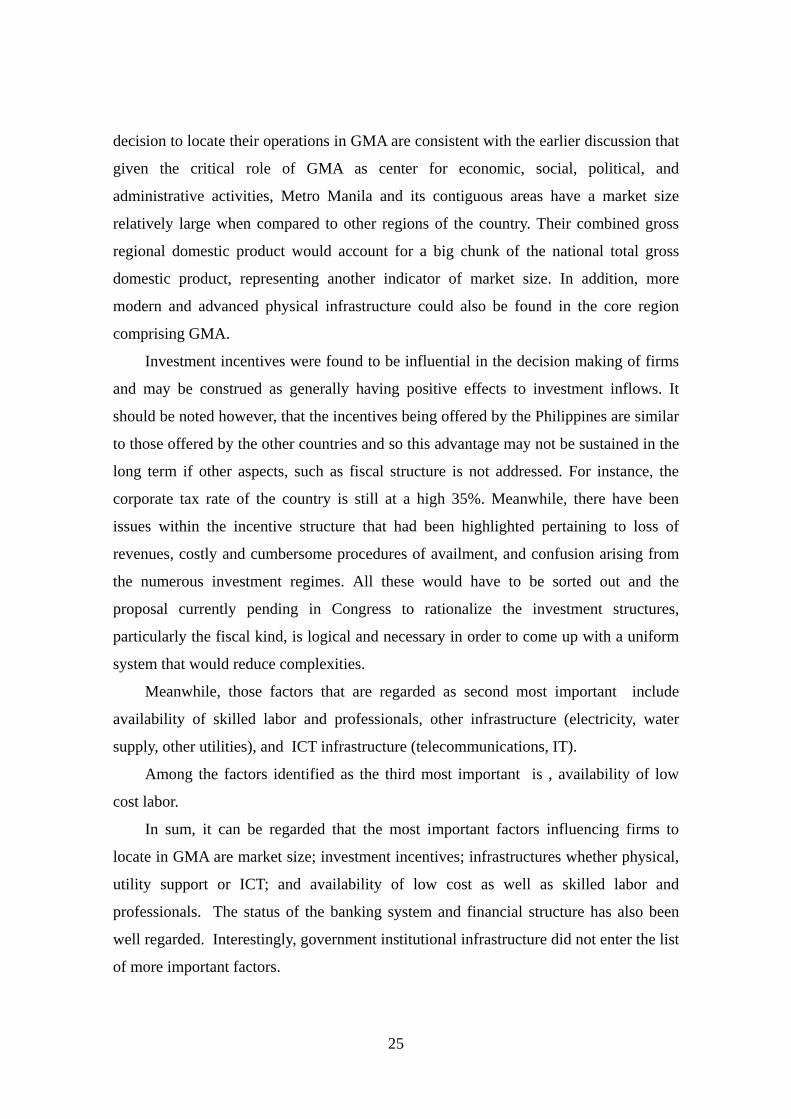
2.2.8. Important Factors for Locating in Greater Manila Area
The firms were first asked to identify the level of importance of at least 20 factors
that had influenced the decision of the firms to locate their operations in the region.
Afterwards, they were requested to indicate the three most important factors out of the
20. Survey results show that respondent firms found the following as the topmost
important factors, size of local markets, investment incentives (including tax incentives),
and physical infrastructure (roads, highways, ports, airports, etc.). The market size and
physical infrastructure has traditionally been an important determinant of foreign
investments. On the other hand, based on some empirical studies in the past, investment
incentives were not found to be significantly affecting the location decision of firms.
However, the results of this survey disprove this contention to some extent.
These factors primarily regarded by investors as the main stimulants in the firms’
25
decision to locate their operations in GMA are consistent with the earlier discussion that
given the critical role of GMA as center for economic, social, political, and
administrative activities, Metro Manila and its contiguous areas have a market size
relatively large when compared to other regions of the country. Their combined gross
regional domestic product would account for a big chunk of the national total gross
domestic product, representing another indicator of market size. In addition, more
modern and advanced physical infrastructure could also be found in the core region
comprising GMA.
Investment incentives were found to be influential in the decision making of firms
and may be construed as generally having positive effects to investment inflows. It
should be noted however, that the incentives being offered by the Philippines are similar
to those offered by the other countries and so this advantage may not be sustained in the
long term if other aspects, such as fiscal structure is not addressed. For instance, the
corporate tax rate of the country is still at a high 35%. Meanwhile, there have been
issues within the incentive structure that had been highlighted pertaining to loss of
revenues, costly and cumbersome procedures of availment, and confusion arising from
the numerous investment regimes. All these would have to be sorted out and the
proposal currently pending in Congress to rationalize the investment structures,
particularly the fiscal kind, is logical and necessary in order to come up with a uniform
system that would reduce complexities.
Meanwhile, those factors that are regarded as second most important include
availability of skilled labor and professionals, other infrastructure (electricity, water
supply, other utilities), and ICT infrastructure (telecommunications, IT).
Among the factors identified as the third most important is , availability of low
cost labor.
In sum, it can be regarded that the most important factors influencing firms to
locate in GMA are market size; investment incentives; infrastructures whether physical,
utility support or ICT; and availability of low cost as well as skilled labor and
professionals. The status of the banking system and financial structure has also been
well regarded. Interestingly, government institutional infrastructure did not enter the list
of more important factors.
26
Table 11: Number and Share of Firms by Most Important Factors for Locating in GMA
Factors First Second Third Number Percent Number Percent Number PercentInvestment incentives including tax incentives 105 21% 31 6% 31 6% Liberal trade policy 17 3% 25 5% 23 5% Customs procedure 5 1% 14 3% 11 2% Local content requirements, rules of origin 7 1% 6 1% 6 1% Physical infrastructure (roads, highways, ports, airports, etc.) 53 11% 57 11% 54 11% Infrastructure (telecommunications, IT) 19 4% 46 9% 36 7% Infrastructure (electricity, water supply, other utilities) 28 6% 51 10% 53 11% Government institutional infrastructure 8 2% 7 1% 12 2% Financial structure/Banking system 31 6% 28 6% 26 5% Legal system 0 0% 6 1% 0 0% Protection of intellectual property rights 4 1% 0% 9 2% Size of local markets 111 22% 40 8% 32 6% Access to export markets 11 2% 20 4% 16 3% Proximity to suppliers/subcontractor 16 3% 32 6% 23 5% Request by large/related company 7 1% 8 2% 14 3% Availability of low cost labor 24 5% 35 7% 42 8% Availability of skilled labor and professionals 20 4% 56 11% 64 13% Presence of other companies from the same country as this company (synergy) 5 1% 9 2% 10 2% Access to high value technology and information 5 1% 16 3% 20 4% Living conditions 0 0% 0 0% 0 0% Others 15 3% 2 0% 1 0% No response 11 2% 13 3% 17 3% Total 502 100% 502 100% 500 100% Source:
2.2.9. Innovations
Among the top three innovations undertaken by the firms during the last 3 years
were the introduction of new products and services (18%), upgrading of machineries
and equipment (17%), and opening of a new market (15%). These innovations are also
among those that were claimed to being planned to be undertaken in the next three
years: upgrading of machineries and equipment (17%) followed by introduction of new
products and services (16%) and opening of a new market (15%).
A slightly different pattern however, can be observed among the types of
innovation undertaken by major business activity. Those firms which have undergone
the most innovations are those engaged in manufacturing, wholesale trade, retail trade,
hotels and restaurant, and transportation. While firms engaged in manufacturing have
mostly introduced new products and services, upgrading of machineries and equipment,
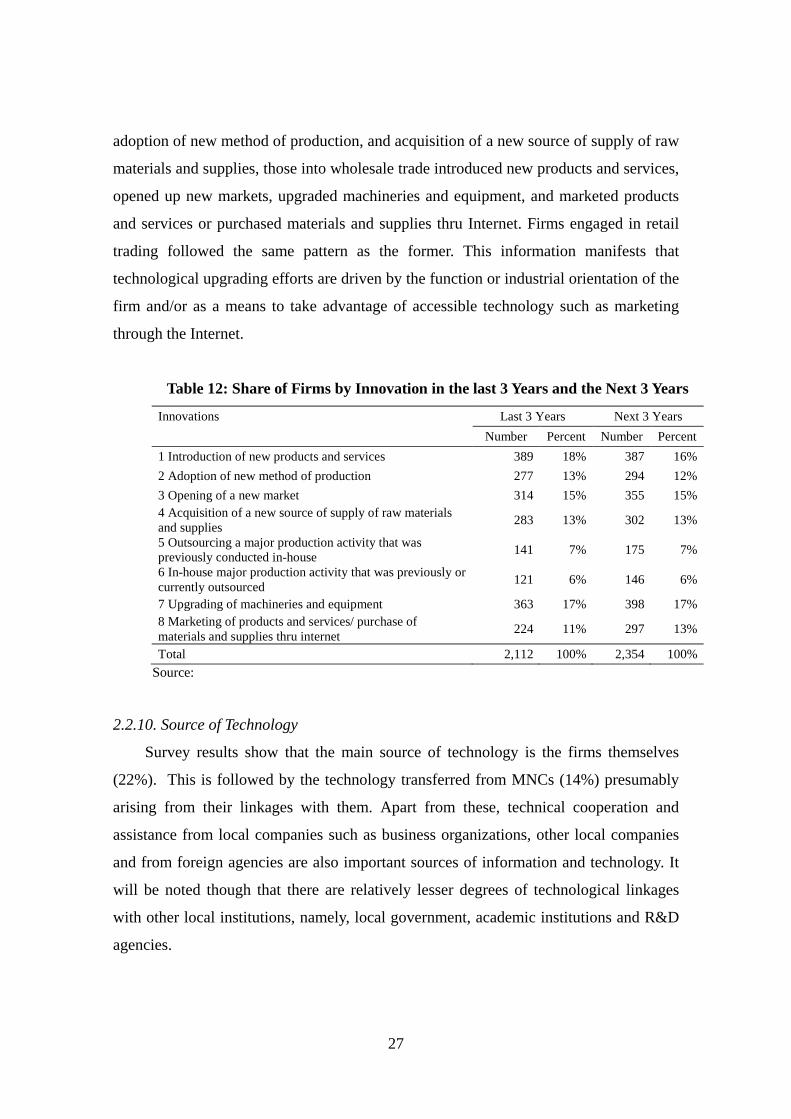
27
adoption of new method of production, and acquisition of a new source of supply of raw
materials and supplies, those into wholesale trade introduced new products and services,
opened up new markets, upgraded machineries and equipment, and marketed products
and services or purchased materials and supplies thru Internet. Firms engaged in retail
trading followed the same pattern as the former. This information manifests that
technological upgrading efforts are driven by the function or industrial orientation of the
firm and/or as a means to take advantage of accessible technology such as marketing
through the Internet.
Table 12: Share of Firms by Innovation in the last 3 Years and the Next 3 Years
Innovations Last 3 Years Next 3 Years Number Percent Number Percent 1 Introduction of new products and services 389 18% 387 16%2 Adoption of new method of production 277 13% 294 12%3 Opening of a new market 314 15% 355 15%4 Acquisition of a new source of supply of raw materials and supplies 283 13% 302 13%
5 Outsourcing a major production activity that was previously conducted in-house 141 7% 175 7%
6 In-house major production activity that was previously or currently outsourced 121 6% 146 6%
7 Upgrading of machineries and equipment 363 17% 398 17%8 Marketing of products and services/ purchase of materials and supplies thru internet 224 11% 297 13%
Total 2,112 100% 2,354 100%Source:
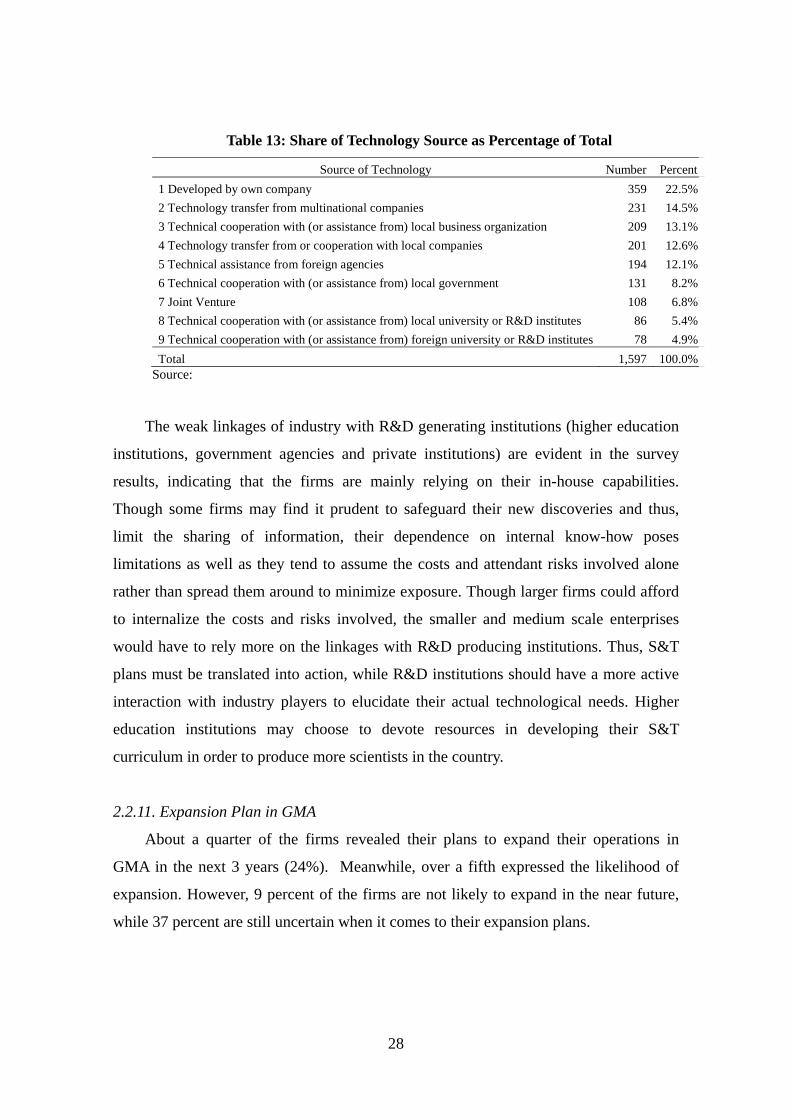
2.2.10. Source of Technology
Survey results show that the main source of technology is the firms themselves
(22%). This is followed by the technology transferred from MNCs (14%) presumably
arising from their linkages with them. Apart from these, technical cooperation and
assistance from local companies such as business organizations, other local companies
and from foreign agencies are also important sources of information and technology. It
will be noted though that there are relatively lesser degrees of technological linkages
with other local institutions, namely, local government, academic institutions and R&D
agencies.
28
Table 13: Share of Technology Source as Percentage of Total
Source of Technology Number Percent1 Developed by own company 359 22.5%2 Technology transfer from multinational companies 231 14.5%3 Technical cooperation with (or assistance from) local business organization 209 13.1%4 Technology transfer from or cooperation with local companies 201 12.6%5 Technical assistance from foreign agencies 194 12.1%6 Technical cooperation with (or assistance from) local government 131 8.2%7 Joint Venture 108 6.8%8 Technical cooperation with (or assistance from) local university or R&D institutes 86 5.4%9 Technical cooperation with (or assistance from) foreign university or R&D institutes 78 4.9%Total 1,597 100.0%
Source:
The weak linkages of industry with R&D generating institutions (higher education
institutions, government agencies and private institutions) are evident in the survey
results, indicating that the firms are mainly relying on their in-house capabilities.
Though some firms may find it prudent to safeguard their new discoveries and thus,
limit the sharing of information, their dependence on internal know-how poses
limitations as well as they tend to assume the costs and attendant risks involved alone
rather than spread them around to minimize exposure. Though larger firms could afford
to internalize the costs and risks involved, the smaller and medium scale enterprises
would have to rely more on the linkages with R&D producing institutions. Thus, S&T
plans must be translated into action, while R&D institutions should have a more active
interaction with industry players to elucidate their actual technological needs. Higher
education institutions may choose to devote resources in developing their S&T
curriculum in order to produce more scientists in the country.
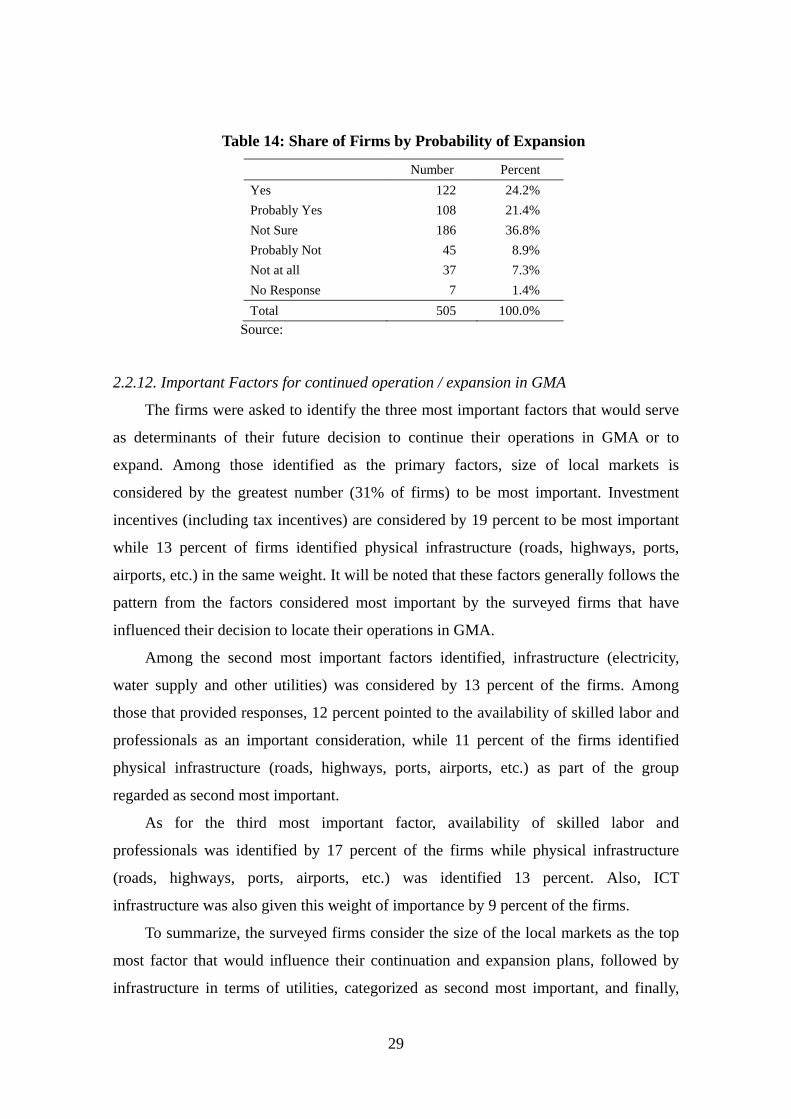
2.2.11. Expansion Plan in GMA
About a quarter of the firms revealed their plans to expand their operations in
GMA in the next 3 years (24%). Meanwhile, over a fifth expressed the likelihood of
expansion. However, 9 percent of the firms are not likely to expand in the near future,
while 37 percent are still uncertain when it comes to their expansion plans.
29
Table 14: Share of Firms by Probability of Expansion
Number Percent Yes 122 24.2% Probably Yes 108 21.4% Not Sure 186 36.8% Probably Not 45 8.9% Not at all 37 7.3% No Response 7 1.4% Total 505 100.0%
Source:
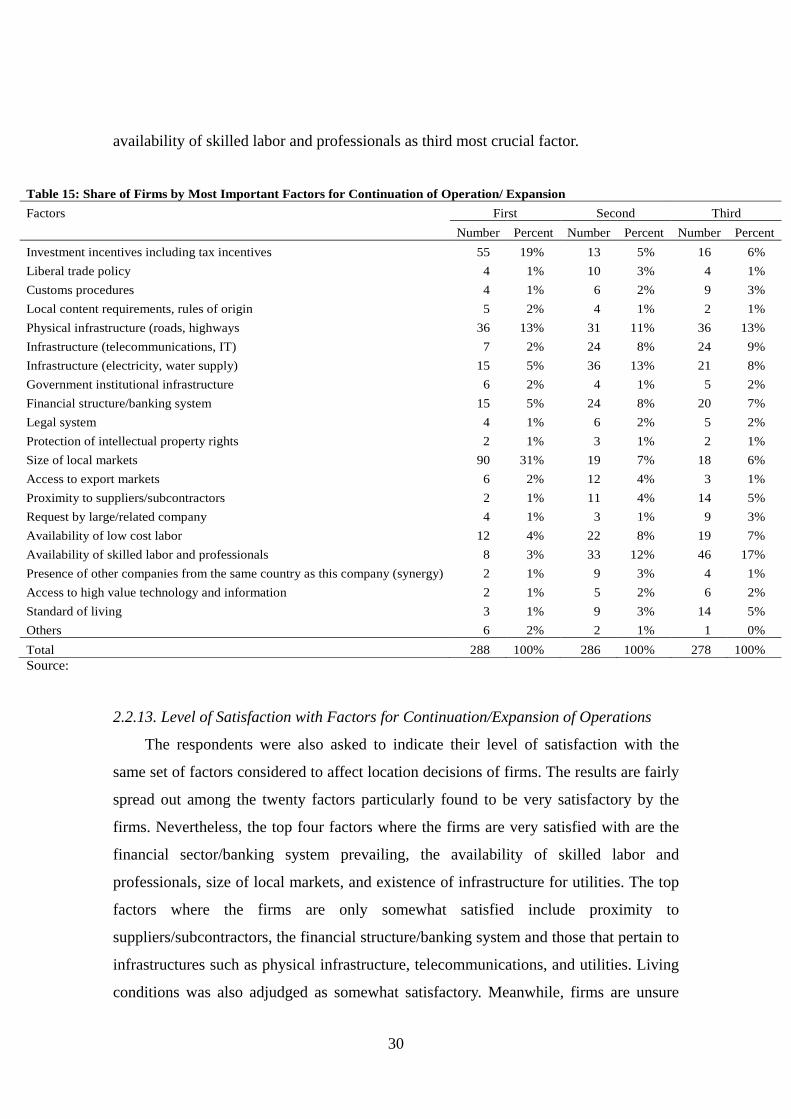
2.2.12. Important Factors for continued operation / expansion in GMA
The firms were asked to identify the three most important factors that would serve
as determinants of their future decision to continue their operations in GMA or to
expand. Among those identified as the primary factors, size of local markets is
considered by the greatest number (31% of firms) to be most important. Investment
incentives (including tax incentives) are considered by 19 percent to be most important
while 13 percent of firms identified physical infrastructure (roads, highways, ports,
airports, etc.) in the same weight. It will be noted that these factors generally follows the
pattern from the factors considered most important by the surveyed firms that have
influenced their decision to locate their operations in GMA.
Among the second most important factors identified, infrastructure (electricity,
water supply and other utilities) was considered by 13 percent of the firms. Among
those that provided responses, 12 percent pointed to the availability of skilled labor and
professionals as an important consideration, while 11 percent of the firms identified
physical infrastructure (roads, highways, ports, airports, etc.) as part of the group
regarded as second most important.
As for the third most important factor, availability of skilled labor and
professionals was identified by 17 percent of the firms while physical infrastructure
(roads, highways, ports, airports, etc.) was identified 13 percent. Also, ICT
infrastructure was also given this weight of importance by 9 percent of the firms.
To summarize, the surveyed firms consider the size of the local markets as the top
most factor that would influence their continuation and expansion plans, followed by
infrastructure in terms of utilities, categorized as second most important, and finally,
30
availability of skilled labor and professionals as third most crucial factor.
Table 15: Share of Firms by Most Important Factors for Continuation of Operation/ Expansion Factors First Second Third Number Percent Number Percent Number Percent Investment incentives including tax incentives 55 19% 13 5% 16 6% Liberal trade policy 4 1% 10 3% 4 1% Customs procedures 4 1% 6 2% 9 3% Local content requirements, rules of origin 5 2% 4 1% 2 1% Physical infrastructure (roads, highways 36 13% 31 11% 36 13% Infrastructure (telecommunications, IT) 7 2% 24 8% 24 9% Infrastructure (electricity, water supply) 15 5% 36 13% 21 8% Government institutional infrastructure 6 2% 4 1% 5 2% Financial structure/banking system 15 5% 24 8% 20 7% Legal system 4 1% 6 2% 5 2% Protection of intellectual property rights 2 1% 3 1% 2 1% Size of local markets 90 31% 19 7% 18 6% Access to export markets 6 2% 12 4% 3 1% Proximity to suppliers/subcontractors 2 1% 11 4% 14 5% Request by large/related company 4 1% 3 1% 9 3% Availability of low cost labor 12 4% 22 8% 19 7% Availability of skilled labor and professionals 8 3% 33 12% 46 17% Presence of other companies from the same country as this company (synergy) 2 1% 9 3% 4 1% Access to high value technology and information 2 1% 5 2% 6 2% Standard of living 3 1% 9 3% 14 5% Others 6 2% 2 1% 1 0% Total 288 100% 286 100% 278 100% Source:
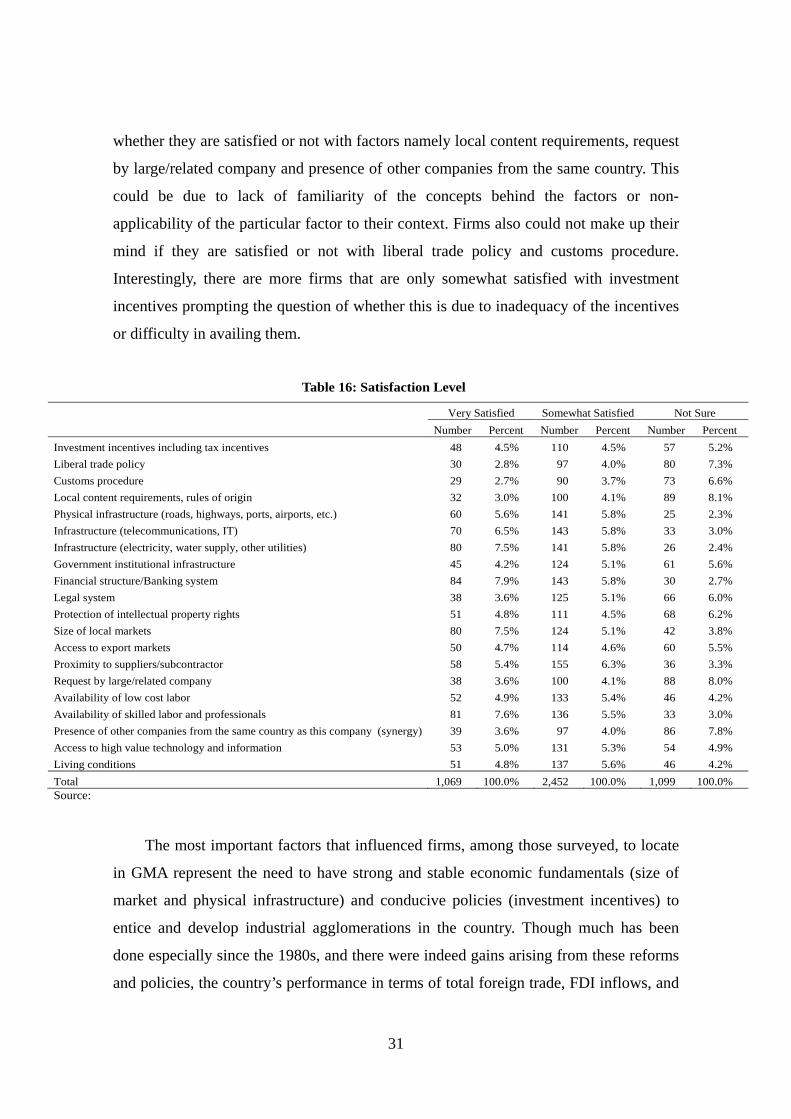
2.2.13. Level of Satisfaction with Factors for Continuation/Expansion of Operations
The respondents were also asked to indicate their level of satisfaction with the
same set of factors considered to affect location decisions of firms. The results are fairly
spread out among the twenty factors particularly found to be very satisfactory by the
firms. Nevertheless, the top four factors where the firms are very satisfied with are the
financial sector/banking system prevailing, the availability of skilled labor and
professionals, size of local markets, and existence of infrastructure for utilities. The top
factors where the firms are only somewhat satisfied include proximity to
suppliers/subcontractors, the financial structure/banking system and those that pertain to
infrastructures such as physical infrastructure, telecommunications, and utilities. Living
conditions was also adjudged as somewhat satisfactory. Meanwhile, firms are unsure
31
whether they are satisfied or not with factors namely local content requirements, request
by large/related company and presence of other companies from the same country. This
could be due to lack of familiarity of the concepts behind the factors or non-
applicability of the particular factor to their context. Firms also could not make up their
mind if they are satisfied or not with liberal trade policy and customs procedure.
Interestingly, there are more firms that are only somewhat satisfied with investment
incentives prompting the question of whether this is due to inadequacy of the incentives
or difficulty in availing them.
Table 16: Satisfaction Level
Very Satisfied Somewhat Satisfied Not Sure Number Percent Number Percent Number Percent Investment incentives including tax incentives 48 4.5% 110 4.5% 57 5.2% Liberal trade policy 30 2.8% 97 4.0% 80 7.3% Customs procedure 29 2.7% 90 3.7% 73 6.6% Local content requirements, rules of origin 32 3.0% 100 4.1% 89 8.1% Physical infrastructure (roads, highways, ports, airports, etc.) 60 5.6% 141 5.8% 25 2.3% Infrastructure (telecommunications, IT) 70 6.5% 143 5.8% 33 3.0% Infrastructure (electricity, water supply, other utilities) 80 7.5% 141 5.8% 26 2.4% Government institutional infrastructure 45 4.2% 124 5.1% 61 5.6% Financial structure/Banking system 84 7.9% 143 5.8% 30 2.7% Legal system 38 3.6% 125 5.1% 66 6.0% Protection of intellectual property rights 51 4.8% 111 4.5% 68 6.2% Size of local markets 80 7.5% 124 5.1% 42 3.8% Access to export markets 50 4.7% 114 4.6% 60 5.5% Proximity to suppliers/subcontractor 58 5.4% 155 6.3% 36 3.3% Request by large/related company 38 3.6% 100 4.1% 88 8.0% Availability of low cost labor 52 4.9% 133 5.4% 46 4.2% Availability of skilled labor and professionals 81 7.6% 136 5.5% 33 3.0% Presence of other companies from the same country as this company (synergy) 39 3.6% 97 4.0% 86 7.8% Access to high value technology and information 53 5.0% 131 5.3% 54 4.9% Living conditions 51 4.8% 137 5.6% 46 4.2% Total 1,069 100.0% 2,452 100.0% 1,099 100.0% Source:
The most important factors that influenced firms, among those surveyed, to locate
in GMA represent the need to have strong and stable economic fundamentals (size of
market and physical infrastructure) and conducive policies (investment incentives) to
entice and develop industrial agglomerations in the country. Though much has been
done especially since the 1980s, and there were indeed gains arising from these reforms
and policies, the country’s performance in terms of total foreign trade, FDI inflows, and
32
exports performance, as well as overall competitiveness, viz-a-viz its ASEAN
neighbours indicate that there are still major barriers and bottlenecks that have to be
addressed. Not least of these are low investments in infrastructure, low productivity,
political instability, unstable regulatory and contract enforcement, high cost of doing
business, and corruption.
These stylized facts derived from the survey provided useful inputs in determining
the characteristics of firms that have agglomerated in Greater Manila Area: the types of
business activities they undertake and the products they manufacture; the most
important factors that influenced or attracted them to locate their business in the region;
the types of innovations they have conducted and their sources indicating their desire to
continue or expand operations; and their satisfaction to the conditions that drew them to
establish their business in the region. However, to derive richer information as to the
nature and characteristics of industrial agglomeration and industrial upgrading or
innovation processes in the country, a more rigorous method utilizing the data set
collected from the survey will have to be done. It will place particular focus on the
policy measures and the economic environment that has so far influenced these firms to
agglomerate and those that may be required for future agglomeration and upgrading.
The next section provides insights on the results of the econometrics analysis
undertaken by the Japanese team of experts who are also part of this study’s mother
project.
3. INDUSTRIAL AGGLOMERATION AND INNOVATION IN THE
PHILIPPINES: ECONOMETRICS ANALYSIS
The econometrics component of this analysis on the Philippines focuses on two
major aspects: industrial agglomeration and innovation. In particular, the objectives of
this rigorous statistical method are: to determine the nature of industrial agglomeration
in the country; distinguish between first movers and latecomers in the agglomeration
context; and identify the characteristics of each category in terms of size of the firms
involved, the functions for which they established presence in the region, and the factors
that attracted them in the first place to locate in the area.
33
On the innovation aspect, the purpose of the study is to find out the factors that
promote innovation and determine the differences between firms that have propensity to
innovate and those firms that may be considered non-innovative.
Simply put, the econometric analysis will be based on the framework that the
establishment of new business is a function of three major factors, (1) market conditions,
(2) policy demand, based on the importance and satisfaction being attributed to it, and
(3) firm characteristics. The same rough framework can be used for explaining the
process of innovation (Tsuji, et al, 2008).
The data used for econometrics analysis are from the 2007 Industrial Clustering
Survey of Philippine Business and Industry conducted from October to December 2007
using the Greater Manila Area as domain of said survey. The total valid responses
considered in the estimations was 504.
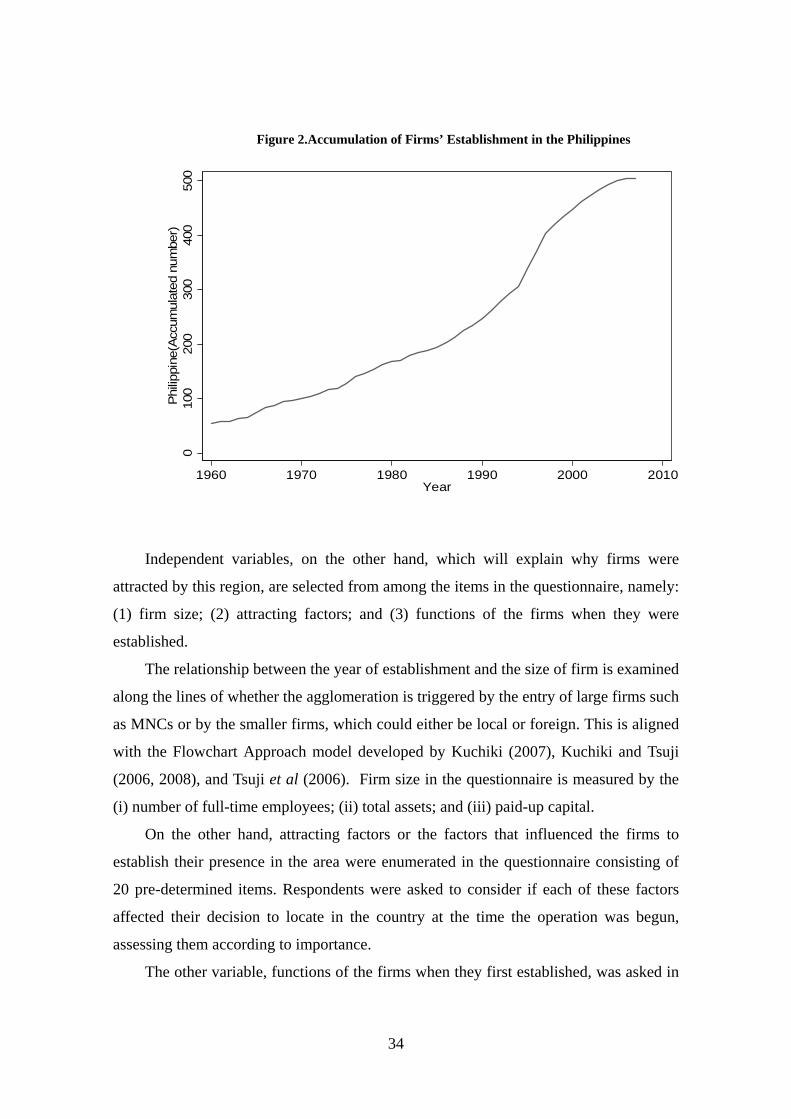
3.1. Nature of Industrial Agglomeration in the Philippines
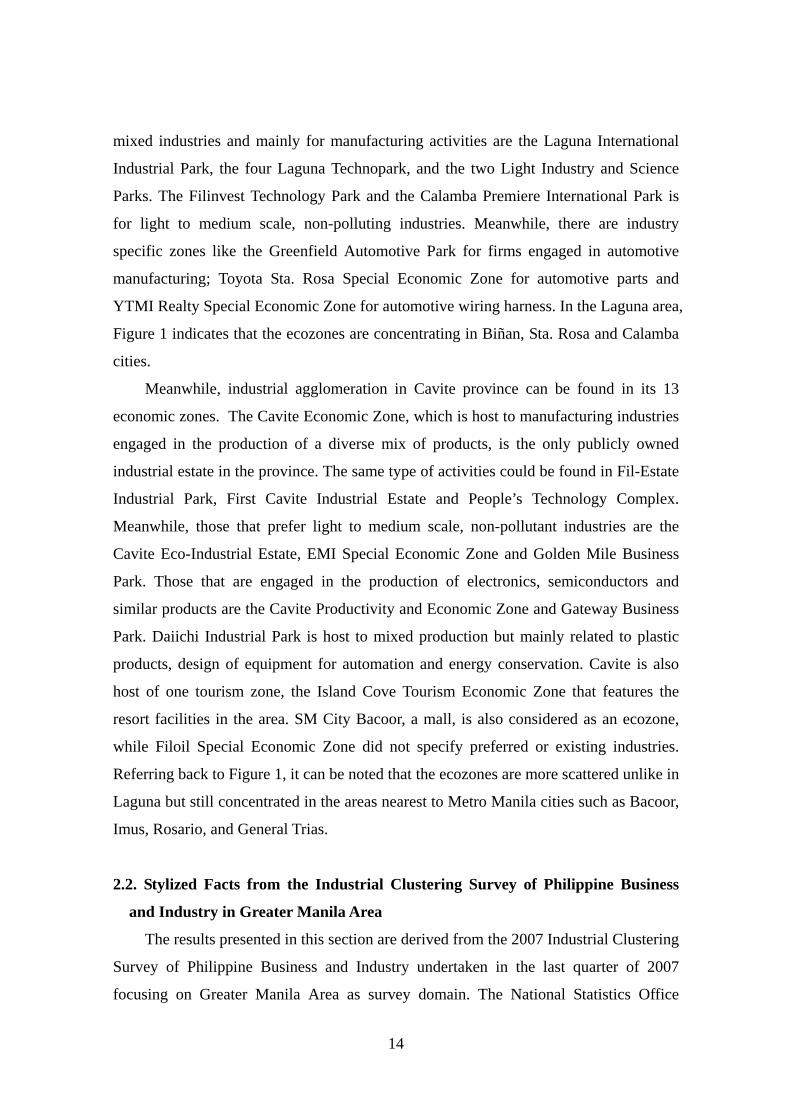
The nature of industrial agglomeration refers to the periods in the country’s history
when firms have established their presence. For analytical simplicity, the focus was on
the accumulated number of firms established in the Philippines, dividing the entire
period into three according to the trend in accumulation starting from the year the
earliest firm was established to the year the latest firm came about. These three key
periods are: (1) before 1986; (2) 1987-1994; and (3) after 1995. The year of
establishment of firm or business activities in the Philippines is taken as a dependent
variable in the econometric analysis. The firms established in the earlier period are
referred to as “first movers,” and those that came in the later period as “latecomers”.
This pattern of accumulation is presented in Figure 2.
34
Figure 2.Accumulation of Firms’ Establishment in the Philippines
010
020
030
040
050
0Ph
ilippi
ne(A
ccum
ulat
ed n
umbe
r)
1960 1970 1980 1990 2000 2010Year
Independent variables, on the other hand, which will explain why firms were
attracted by this region, are selected from among the items in the questionnaire, namely:
(1) firm size; (2) attracting factors; and (3) functions of the firms when they were
established.
The relationship between the year of establishment and the size of firm is examined
along the lines of whether the agglomeration is triggered by the entry of large firms such
as MNCs or by the smaller firms, which could either be local or foreign. This is aligned
with the Flowchart Approach model developed by Kuchiki (2007), Kuchiki and Tsuji
(2006, 2008), and Tsuji et al (2006). Firm size in the questionnaire is measured by the
(i) number of full-time employees; (ii) total assets; and (iii) paid-up capital.
On the other hand, attracting factors or the factors that influenced the firms to
establish their presence in the area were enumerated in the questionnaire consisting of
20 pre-determined items. Respondents were asked to consider if each of these factors
affected their decision to locate in the country at the time the operation was begun,
assessing them according to importance.
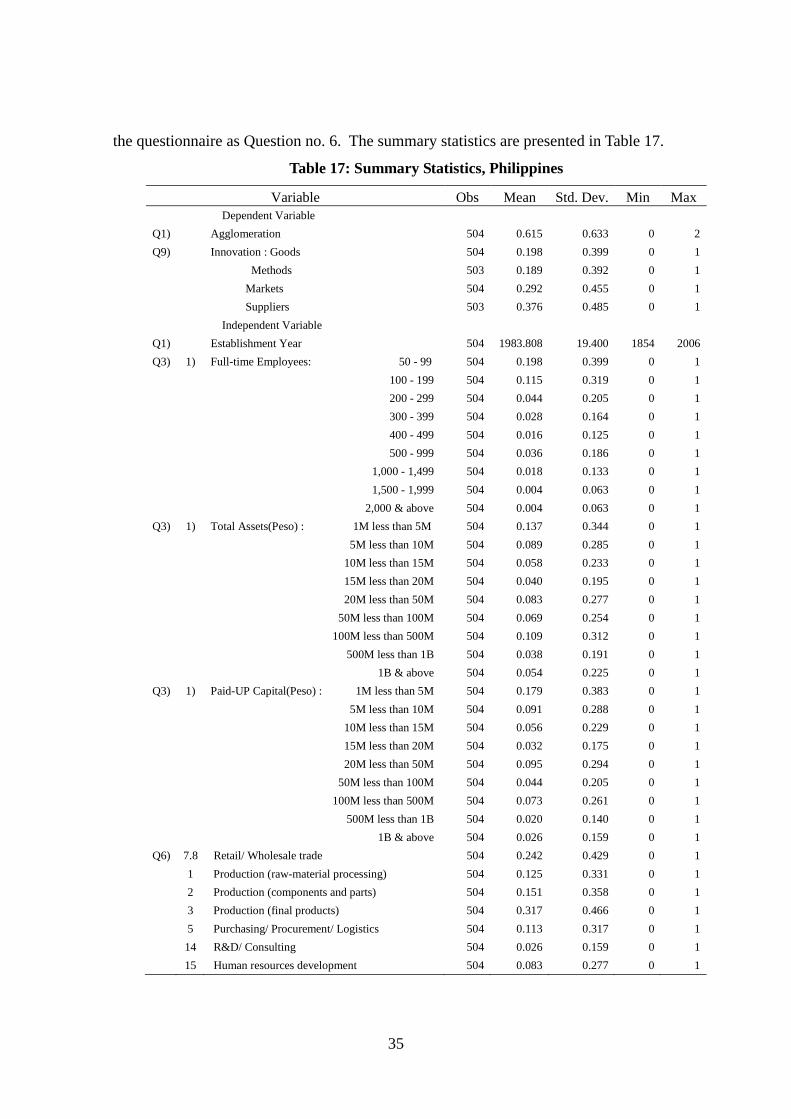
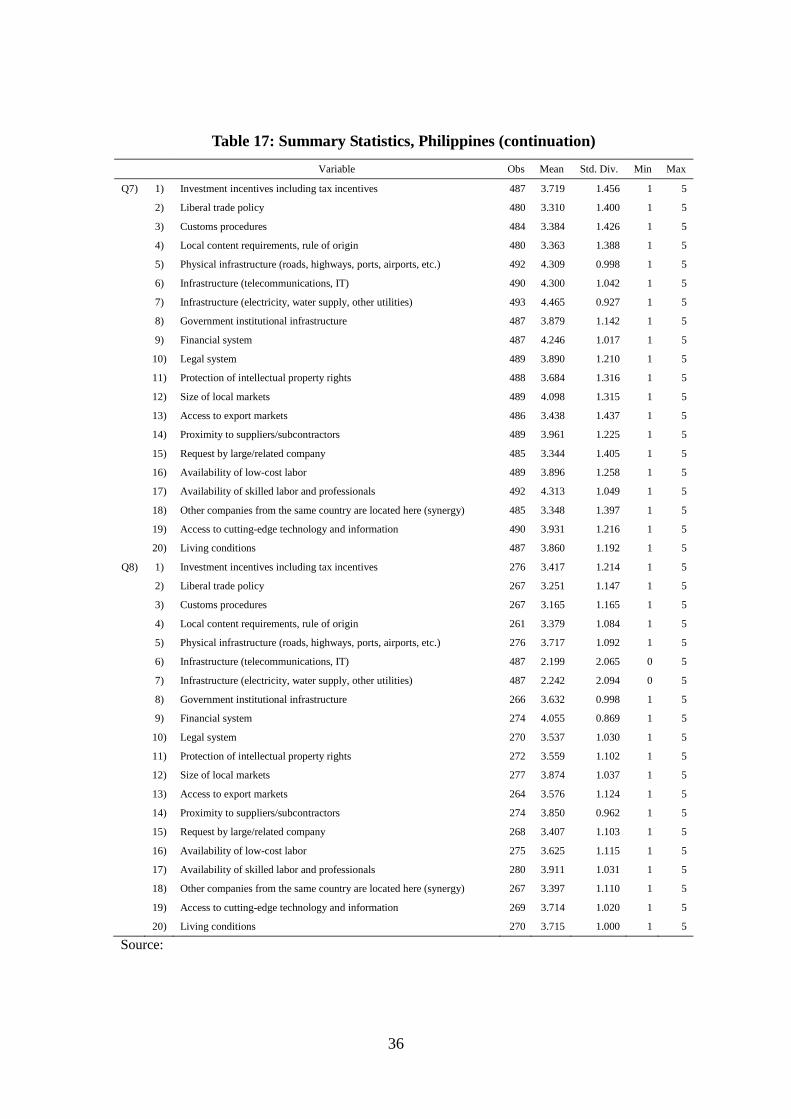
The other variable, functions of the firms when they first established, was asked in
35
the questionnaire as Question no. 6. The summary statistics are presented in Table 17.
Table 17: Summary Statistics, Philippines
Variable Obs Mean Std. Dev. Min Max Dependent Variable Q1) Agglomeration 504 0.615 0.633 0 2 Q9) Innovation : Goods 504 0.198 0.399 0 1
Methods 503 0.189 0.392 0 1 Markets 504 0.292 0.455 0 1 Suppliers 503 0.376 0.485 0 1
Independent Variable Q1) Establishment Year 504 1983.808 19.400 1854 2006 Q3) 1) Full-time Employees: 50 - 99 504 0.198 0.399 0 1
100 - 199 504 0.115 0.319 0 1 200 - 299 504 0.044 0.205 0 1 300 - 399 504 0.028 0.164 0 1 400 - 499 504 0.016 0.125 0 1 500 - 999 504 0.036 0.186 0 1 1,000 - 1,499 504 0.018 0.133 0 1 1,500 - 1,999 504 0.004 0.063 0 1 2,000 & above 504 0.004 0.063 0 1
Q3) 1) Total Assets(Peso) : 1M less than 5M 504 0.137 0.344 0 1 5M less than 10M 504 0.089 0.285 0 1 10M less than 15M 504 0.058 0.233 0 1 15M less than 20M 504 0.040 0.195 0 1 20M less than 50M 504 0.083 0.277 0 1 50M less than 100M 504 0.069 0.254 0 1 100M less than 500M 504 0.109 0.312 0 1 500M less than 1B 504 0.038 0.191 0 1 1B & above 504 0.054 0.225 0 1
Q3) 1) Paid-UP Capital(Peso) : 1M less than 5M 504 0.179 0.383 0 1 5M less than 10M 504 0.091 0.288 0 1 10M less than 15M 504 0.056 0.229 0 1 15M less than 20M 504 0.032 0.175 0 1 20M less than 50M 504 0.095 0.294 0 1 50M less than 100M 504 0.044 0.205 0 1 100M less than 500M 504 0.073 0.261 0 1 500M less than 1B 504 0.020 0.140 0 1 1B & above 504 0.026 0.159 0 1
Q6) 7.8 Retail/ Wholesale trade 504 0.242 0.429 0 1 1 Production (raw-material processing) 504 0.125 0.331 0 1 2 Production (components and parts) 504 0.151 0.358 0 1 3 Production (final products) 504 0.317 0.466 0 1 5 Purchasing/ Procurement/ Logistics 504 0.113 0.317 0 1 14 R&D/ Consulting 504 0.026 0.159 0 1 15 Human resources development 504 0.083 0.277 0 1
36
Table 17: Summary Statistics, Philippines (continuation)
Variable Obs Mean Std. Div. Min Max
Q7) 1) Investment incentives including tax incentives 487 3.719 1.456 1 5
2) Liberal trade policy 480 3.310 1.400 1 5
3) Customs procedures 484 3.384 1.426 1 5
4) Local content requirements, rule of origin 480 3.363 1.388 1 5
5) Physical infrastructure (roads, highways, ports, airports, etc.) 492 4.309 0.998 1 5
6) Infrastructure (telecommunications, IT) 490 4.300 1.042 1 5
7) Infrastructure (electricity, water supply, other utilities) 493 4.465 0.927 1 5
8) Government institutional infrastructure 487 3.879 1.142 1 5
9) Financial system 487 4.246 1.017 1 5
10) Legal system 489 3.890 1.210 1 5
11) Protection of intellectual property rights 488 3.684 1.316 1 5
12) Size of local markets 489 4.098 1.315 1 5
13) Access to export markets 486 3.438 1.437 1 5
14) Proximity to suppliers/subcontractors 489 3.961 1.225 1 5
15) Request by large/related company 485 3.344 1.405 1 5
16) Availability of low-cost labor 489 3.896 1.258 1 5
17) Availability of skilled labor and professionals 492 4.313 1.049 1 5
18) Other companies from the same country are located here (synergy) 485 3.348 1.397 1 5
19) Access to cutting-edge technology and information 490 3.931 1.216 1 5
20) Living conditions 487 3.860 1.192 1 5
Q8) 1) Investment incentives including tax incentives 276 3.417 1.214 1 5
2) Liberal trade policy 267 3.251 1.147 1 5
3) Customs procedures 267 3.165 1.165 1 5
4) Local content requirements, rule of origin 261 3.379 1.084 1 5
5) Physical infrastructure (roads, highways, ports, airports, etc.) 276 3.717 1.092 1 5
6) Infrastructure (telecommunications, IT) 487 2.199 2.065 0 5
7) Infrastructure (electricity, water supply, other utilities) 487 2.242 2.094 0 5
8) Government institutional infrastructure 266 3.632 0.998 1 5
9) Financial system 274 4.055 0.869 1 5
10) Legal system 270 3.537 1.030 1 5
11) Protection of intellectual property rights 272 3.559 1.102 1 5
12) Size of local markets 277 3.874 1.037 1 5
13) Access to export markets 264 3.576 1.124 1 5
14) Proximity to suppliers/subcontractors 274 3.850 0.962 1 5
15) Request by large/related company 268 3.407 1.103 1 5
16) Availability of low-cost labor 275 3.625 1.115 1 5
17) Availability of skilled labor and professionals 280 3.911 1.031 1 5
18) Other companies from the same country are located here (synergy) 267 3.397 1.110 1 5
19) Access to cutting-edge technology and information 269 3.714 1.020 1 5
20) Living conditions 270 3.715 1.000 1 5
Source:
37
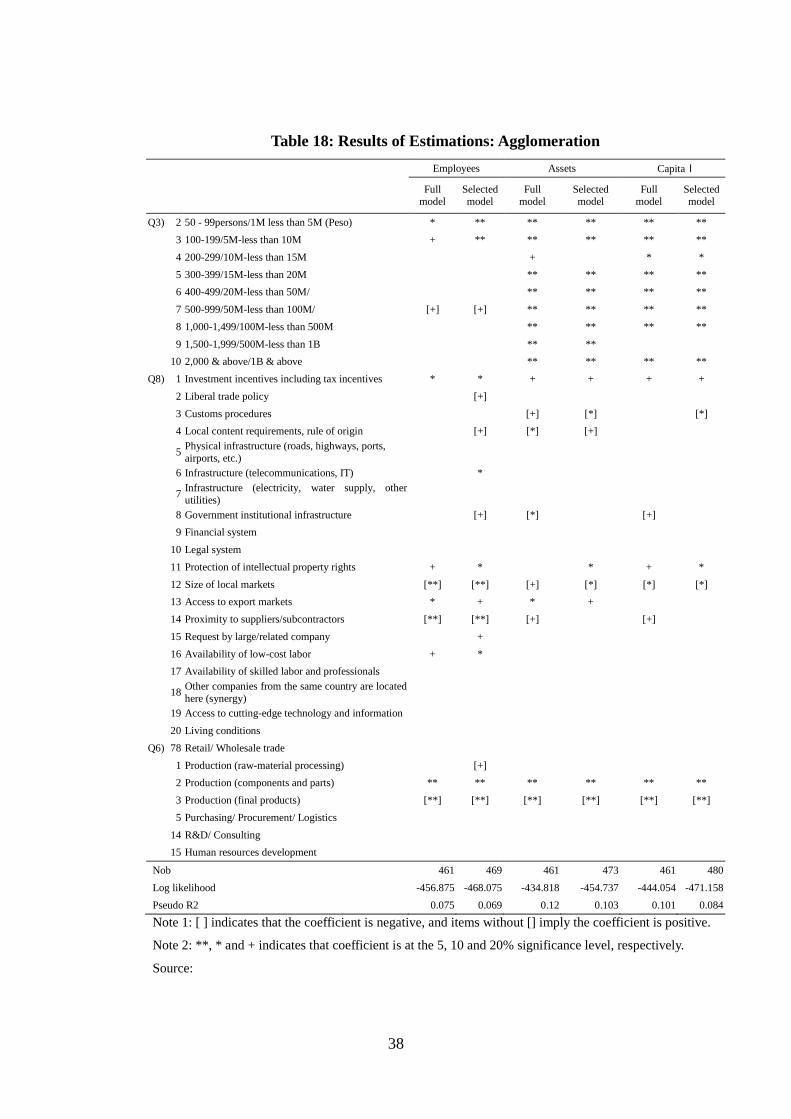
3.2. Results of Estimation on Industrial Agglomeration in the Philippines
With the dependent and independent variables already identified, three models
were estimated according to the definition of firm size. We find here what is called, full
time employees model, the assets model and the paid-up capital model. Estimations
were conducted under each model and adopting the Ordered Logit Estimation, utilized
the Full model, which takes all variables into account, and the Selected Model, which
made use of selected variables only that are considered to significantly influence the
dependent variables. A summary of estimations is provided in Table 18, which to
facilitate understanding shows signs of estimated coefficients and their significance
levels only. Detailed estimation results are in the Appendix section of this paper.
38
Table 18: Results of Estimations: Agglomeration Employees Assets Capital Full
model Selected model
Full model
Selected model
Full model
Selected model
Q3) 2 50 - 99persons/1M less than 5M (Peso) * ** ** ** ** ** 3 100-199/5M-less than 10M + ** ** ** ** ** 4 200-299/10M-less than 15M + * * 5 300-399/15M-less than 20M ** ** ** ** 6 400-499/20M-less than 50M/ ** ** ** ** 7 500-999/50M-less than 100M/ [+] [+] ** ** ** ** 8 1,000-1,499/100M-less than 500M ** ** ** ** 9 1,500-1,999/500M-less than 1B ** ** 10 2,000 & above/1B & above ** ** ** ** Q8) 1 Investment incentives including tax incentives * * + + + + 2 Liberal trade policy [+] 3 Customs procedures [+] [*] [*] 4 Local content requirements, rule of origin [+] [*] [+]
5 Physical infrastructure (roads, highways, ports, airports, etc.)
6 Infrastructure (telecommunications, IT) *
7 Infrastructure (electricity, water supply, other utilities)
8 Government institutional infrastructure [+] [*] [+] 9 Financial system 10 Legal system 11 Protection of intellectual property rights + * * + * 12 Size of local markets [**] [**] [+] [*] [*] [*] 13 Access to export markets * + * + 14 Proximity to suppliers/subcontractors [**] [**] [+] [+] 15 Request by large/related company + 16 Availability of low-cost labor + * 17 Availability of skilled labor and professionals
18 Other companies from the same country are located here (synergy)
19 Access to cutting-edge technology and information 20 Living conditions Q6) 78 Retail/ Wholesale trade 1 Production (raw-material processing) [+] 2 Production (components and parts) ** ** ** ** ** ** 3 Production (final products) [**] [**] [**] [**] [**] [**] 5 Purchasing/ Procurement/ Logistics 14 R&D/ Consulting 15 Human resources development
Nob 461 469 461 473 461 480Log likelihood -456.875 -468.075 -434.818 -454.737 -444.054 -471.158Pseudo R2 0.075 0.069 0.12 0.103 0.101 0.084
Note 1: [ ] indicates that the coefficient is negative, and items without [] imply the coefficient is positive.
Note 2: **, * and + indicates that coefficient is at the 5, 10 and 20% significance level, respectively.
Source:
39
In these Ordered Logit models, latecomers are taken to be standard by the
normalization, and accordingly, a positive sign of estimated coefficients indicates that
they influence only latecomers. Needless to say, a negative sign of the coefficients refer
to the first movers.
3.2.1. Estimation Results under the Full time Employees Model
Full Model
(a) Firm size
The results show that only firms with employees of less than 100 is significant (at
10%). With the sign being positive, the implication is that these small companies are
latecomers but in general, no significant relationship between firm size and the year of
business establishment is found.
(b) Attracting factors
In terms of the factors that influenced firms to locate in the Philippines, it was
found that “Size of local markets” and “Proximity to suppliers/subcontractors” have
negative signs and significant at the 5 percent level, indicating that these are the factors
that influenced the first movers. On the other hand, “Investment incentives including tax
incentives” and “Access to export markets” are positive and significant at the 10 percent
level while “Protection of intellectual property rights” and “Availability of low-cost
labor” were also found to be positive at the 20 percent significance level. These results
imply that these four factors were the ones out of the 20 that had influenced latecomers
to agglomerate in the Philippines.
(c) Functions of firms
When it comes to the estimates with functions of firms when they first established
as independent variable, we find that “Production (final products)” has a negative sign
and significant at the 5 percent level. This indicates that the first movers’ activities were
along the lines of producing final products. Meanwhile, “Production (components and
parts)” was found to be positive and equally significant at the 5 percent level implying
that the late comers were into production of components and parts.
40
Selected Model
In the Selected Model, the number of independent variables is reduced by
eliminating those factors that are considered irrelevant in order to increase the accuracy
of the estimation in terms of log likelihood, for instance. This model was found to have
raised the significance levels of many of the variables in the estimation. For instance,
we now find that when it comes to firm size, the significant categories are those firms
with employees less than 100 and those with 100 to 199 employees (5% level of
significance). Since both signs are positive, the results imply that these smaller firms
represent the late comers.
As to the attracting factors, this model raised the significance of “Protection of
intellectual property rights,” “Availability of low-cost labor” and “Infrastructure
(telecommunications, IT)” but reduced that of the “Access to export markets.” With the
first three factors having positive signs, they confirm that they are the factors that
influenced late comers to come to the Philippines while adding telecommunications and
IT infrastructure to the equation.
Though significant only at the 20 percent level, factors such as “Liberal trade
policy,” “Local content requirements, rule of origin,” and “Government institutional
infrastructure” showed up with negative signs. This somewhat indicate that the first
movers were also influenced with these factors when they decided to come to the
Philippines, in addition to their primary reasons as size of local markets and proximity
to related industries.
3.2.2. Estimation Results under the Total Assets and Paid-up Capital Model
Upon running the estimates, it was found that the total assets and paid-up capital
models showed almost the same results. Thus, they will just be treated as one in this
analysis.
Full Model
(a) Firm size
With almost all categories showing positive significance at the 5 percent level as
indicated in Table 18, it can be deduced that most of these firms agglomerated in the
Philippines in the later period. This validates the data implied by Figure 2 wherein the
41
number of accumulated firms showed a sharp increase in the middle of the 1990s. This
is also consistent with the findings of the survey that indicates that there were more
firms showing up between 1990 and 1999, which was the period when the policy
reforms instituted in the late 1980s through the 1990s were claimed to have taken effect.
However, the result of this estimation does not indicate the situation in the earlier
period. What is found in the results lead one to infer that the Flow Chart approach does
not explain the nature of agglomeration in the Philippine case. Apparently, based on the
estimation, the firms have agglomerated in the Philippines during this latter period
regardless of size and therefore, may not have been significantly influenced by the
presence of first movers. In this case and based on the inference on above,
agglomeration in the Philippines may be considered as policy driven rather than as a
result of a possible synergy between, for instance, MNCs locating first and supporting
industries following them as the Flow Chart approach suggests.
(b) Attracting factors
Common to both the assets and capital models are such factors as “Government
institutional infrastructure,” “Size of local markets,” and “Proximity to
suppliers/subcontractors,” this showed up with negative signs indicating therefore that
they were the factors that influenced the first movers. Another common factor but with a
positive sign is “Investment incentives including tax incentives” significant at the 20
percent level. This implies that this factor exerted some influence to late comers.
Meanwhile, factors such as “Customs procedure,” “local content requirements, rule
of origin,” and “Access to export markets” were found to be significant only at the
assets model. The first two factors showed up negative indicating that they influenced
the first movers, while the latter had presented attraction to the late comers.
(c) Functions of firms
In both models, “Production (final products)” and “Production (component and
parts) were the only significant categories (at 5% level of significance). Showing up
with all positive signs, it can be inferred that the latecomers’ business activities when
they came in to the Philippines were focused on the production of components and parts,
while the first movers concentrated on the production of final products since the signs of
42
the coefficients were all negative. From Table 18 it can be noted that the results for this
category are the same with those coming out from the full time employees model.
Selected Model
When it comes to firm size, the selected model showed the same results for both
the assets and the capital models in almost all categories except for two categories.
Moreover, almost all conformed to the results of the full model.
As to attracting factors found significant, common to both models are “Customs
procedures” and “Size of local markets;” and because of their negative signs indicate
that they were influential to the decision of first movers. On the other hand, coming out
with positive signs that are common to both models are “Protection of intellectual
property rights” and “Investment incentives including tax incentives.” These are the
factors that affected the late comers. Meanwhile, “Access to export markets” only came
out in the assets model and was positive. These results conform to the findings in the
full time employees’ model.
Summary of the Results
At the early stage of agglomeration, firms entered the Philippine industrial
structure to produce final products in collaboration with supporting industries found to
be present such as suppliers and subcontractors, and in compliance with local content
requirements, for the local market. Their entry to the Philippines was further influenced
by the liberal trade policy, the institutional infrastructure of the government and customs
procedures prevailing.
At the later stage of agglomeration, firms in all sizes mainly in the production of
parts and components clustered in the country due to the investment incentives offered,
access to export markets, availability of low-wage labors, presence of
telecommunications and IT infrastructure, and the legal framework and programs
protecting intellectual property rights.
3.3. Results of Estimation on Industrial Upgrading and Innovation
It is claimed that as a result of agglomeration, the closer interaction between and
among firms lead to transfer of technology and know-how from more advanced firms
43
such as MNCs. A flow of denser information among them as well as the nurturing of
human resources has created endogenous forces of industry upgrading and the
innovation process for all firms in the region.
In order to examine this industry upgrading or innovation, four categories of
upgrading or innovation are defined according to Schumpeter’s concepts, namely, (1)
introduction of new goods/services; (2) adoption of a new technology; (3) opening a
new market and (4) acquisition of a new source of a supply of raw materials.
In the survey, the questions in regard upgrading of business operations asked on
whether the respondent has undergone the specified types of upgrades in the last 3 years
and which ones do said firm intends to achieve in the next 3 years. The respondent need
only to indicate “yes” or “no” in this portion of the questionnaire for each type of
innovations. In the econometrics analysis of upgrading and innovation, these four types
became the four models of innovation. The two types of replies, “yes” or “no,” were the
dependent variables, while independent variables consisted of the following: (1)
satisfaction with the Philippine’s economic circumstances such as policy measures and
economic conditions, which occupied a separate item in the questionnaire; (2)
function(s) carried out at the time of establishment of the first office; and (3) year of
establishment of the firm. Two types of estimation were again made in terms of the full
and selected models. The summary results of the estimation are presented in Table 19.
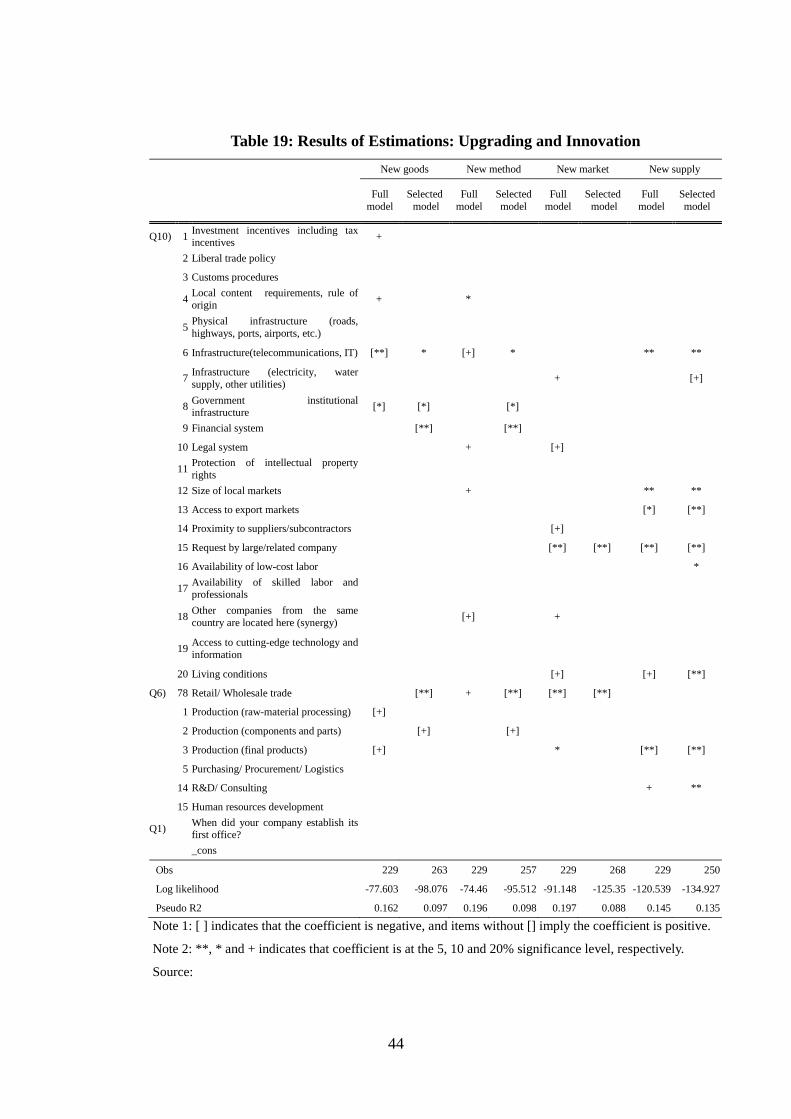
44
Table 19: Results of Estimations: Upgrading and Innovation
New goods New method New market New supply
Full model
Selected model
Full model
Selected model
Full model
Selected model
Full model
Selected model
Q10) 1 Investment incentives including tax incentives +
2 Liberal trade policy
3 Customs procedures
4 Local content requirements, rule of origin + *
5 Physical infrastructure (roads, highways, ports, airports, etc.)
6 Infrastructure(telecommunications, IT) [**] * [+] * ** **
7 Infrastructure (electricity, water supply, other utilities) + [+]
8 Government institutional infrastructure [*] [*] [*]
9 Financial system [**] [**]
10 Legal system + [+]
11 Protection of intellectual property rights
12 Size of local markets + ** **
13 Access to export markets [*] [**]
14 Proximity to suppliers/subcontractors [+]
15 Request by large/related company [**] [**] [**] [**]
16 Availability of low-cost labor *
17 Availability of skilled labor and professionals
18 Other companies from the same country are located here (synergy) [+] +
19 Access to cutting-edge technology andinformation
20 Living conditions [+] [+] [**]
Q6) 78 Retail/ Wholesale trade [**] + [**] [**] [**]
1 Production (raw-material processing) [+]
2 Production (components and parts) [+] [+]
3 Production (final products) [+] * [**] [**]
5 Purchasing/ Procurement/ Logistics
14 R&D/ Consulting + **
15 Human resources development
Q1) When did your company establish its first office?
_cons
Obs 229 263 229 257 229 268 229 250
Log likelihood -77.603 -98.076 -74.46 -95.512 -91.148 -125.35 -120.539 -134.927
Pseudo R2 0.162 0.097 0.196 0.098 0.197 0.088 0.145 0.135
Note 1: [ ] indicates that the coefficient is negative, and items without [] imply the coefficient is positive.
Note 2: **, * and + indicates that coefficient is at the 5, 10 and 20% significance level, respectively.
Source:
45
3.3.1. Estimation of New Goods Model
Full Model
From Table 19, it would be noted that only significant variables were indicated,
with stars and a cross indicating significance levels, while each has either a bracket or
without. Those enclosed in brackets denote the negative sign, which means that the
particular variable discourages innovation. In contrast, those without brackets are
positive signs denoting that the variable is an encouraging factor for innovation.
Under the new goods/full model combination, we find that only “Investment
incentives including tax incentives” and “Local content requirement, rule of origin” are
significant at the 20 percent level. Since they indicate positive signs, these two
variables are said to encourage upgrading and innovation. On the other hand,
“Infrastructures (telecommunications, IT)” was found to be significant at 5 percent level
as well as “Government institutional infrastructures” significant at 10 percent level but
the negative signs of both variables indicate that they discourage innovation.
In terms of functions of firms, only two variables were found to be significant
namely, “Production (raw-material processing)” and “Production (final products).”
Both are denoted as negative and are now said to be factors discouraging the conduct of
innovation.
Selected Model
Under the selected model estimation, only three policy factors were found to be
significant finding the same result as in the previous model in terms of “Government
institutional infrastructure” (significant at 5% level and negative); reversing the result
for “Infrastructure (telecommunications, IT)” into positive at 10 percent level of
significance; and finding the “Financial system” significant (at 5% level) with a
negative sign. Meanwhile, this model has an entirely different result than the other
model as it finds the functions “Retail/wholesale trade” and “Production (components
and parts) as the significant variables, both with negative signs.
Summary of Results
Estimation results tell us that the availability of investment incentives in the
country does encourage innovation as there is a corresponding reward or benefit from
46
doing so. It may be recalled that the Omnibus Investment Code of the Philippines
distinguishes between pioneer and non-pioneer, wherein the former pertains to activities
not yet produced in the country in large volumes (new goods) and those that involves
new design, formula or system applied. The requirement for local content via rules of
origin was also found to be a significantly encouraging factor for upgrading since it
stimulates firms to find ways and means to incorporate this requisite into their
operations possibly leading to the production of new goods. Under the selected model,
telecommunications and IT infrastructure became positive denoting that indeed, the
presence of knowledge-based technology enables the introduction of new goods or
services to the market.
On the other hand, discouraging the discovery of new goods to be introduced to the
market are such factors as the institutional infrastructure of government and the
prevailing financial system. Again, this validates the earlier finding that the weak
support or linkages with R&D producing institutions including in the public sector do
not stimulate innovation among firms. This also has implications on the requirements
and procedures attendant to discovery or innovation such as the patent system and
appropriate recognition of innovators that may have to be examined further. Meanwhile,
the financial system may not be too encouraging of innovation in the sense that it may
not be offering the appropriate support and facilities for innovative activities.
In terms of functions, the result show that limiting the firms’ value added to
producing final products or raw materials would not encourage innovation as there is no
need to do so. Introduction of new goods in the market requires design, R&D and
incubation of ideas before it can be successfully done so. The functions of
retail/wholesale trade, which only involves buying and selling of ready-made goods and
production of components and parts alone, would not encourage much innovation as
well.
3.3.2. Estimation of New Technology Model
Full Model
Under this model referring to the adoption of new method or technology in
production, Table 19 shows that under the full model, three significant and positive
variables were found in the policy environment category. “Local content requirements,
47
rule of origin” is significant at 10 percent level, while the “Legal system” and “Size of
local markets” are significant at the 20 percent level. Given their positive signs, these
variables denote the encouraging factors for innovation in this area. On the other hand,
“Infrastructure (telecommunications, IT) and the variable “Other companies from the
same country are located here (synergy)” are found to be significant at the 20 percent
level. Indicating negative signs, these represent the factors that do not drive innovation
for new method or technology. When it comes to functions of firms, only the variable
“Retail/wholesale trade” is found to be significant (at 20% level) and positive denoting
its possible contribution to innovation.
Selected Model
In contrast, the selected model was able to identify only one significant variable
with a positive sign and that is “Infrastructure (telecommunications, IT)” which was
found to have a negative sign in the previous model. Meanwhile, the two variables that
are estimated to be significant under this model are “Government institutional
infrastructure” and “Financial system.” Since they indicate negative signs, they can be
regarded as factors that discourage the adoption of new method or technology in the
firms’ business operations. In terms of functions, those variables that are significant
with negative signs are “Retail/wholesale trade” and “Production (components and
parts).” The results under this model are the same as those provided under the new
goods model.
Summary of Results
Since the full model and selected model only have two variables in common
coming out with opposite signs, it may be regarded that the estimation of this particular
model of innovation, that is adoption of new method/technology, does not show good
results.
3.3.3. Estimation of New Market Model
When it came to the innovation model of opening up a new market, estimation
results indicate the following as encouraging factors (significant at 20% level and
positive): “Infrastructure (electricity, water supply, other utilities)” and “Other
48
companies from the same country are located here (synergy).” Meanwhile, those
variables that are found to be significant at various levels and indicating negative signs
are: “Legal system,” “Proximity to suppliers/subcontractors,” “Request by large/related
company,” and “Living conditions.” These are the factors discouraging the opening of
new market.
In terms of functions, “Retail/wholesale trade” is significant at 5 percent level and
indicates negative sign, while “Production (final products)” comes in with positive sign.
The estimation under the selected model comes out with only two significant
variables, “Requested by large/related company” (5% significance level) and
“Retail/wholesale trade” (5% level of significance), both having negative signs and
coinciding with those from the full model.
Summary of Results
Upgrading business operations by opening up a new market is encouraged by the
availability of basic infrastructure and the presence of other companies from the same
country of origin. The former denotes a basic requirement or factor for establishing
presence in a market, while the latter refer to the supporting institution that the firms
would find in a new market that would somehow reduce the transaction costs in terms
of getting market information and the possibility for collaboration in some aspects of
operations. On the other hand, the factors that hinder firms from adopting this model of
innovation are the legal system and living conditions that are found in a market’s
business environment; and presence of related institutions such as
suppliers/subcontractors and larger company. Firms engaged in retail/wholesale trade
do not see the need to open a new market, while those that produce final products are
driven to upgrading in terms of going to another market.
3.3.4. Estimation of New Input Model
Under this model of innovation, firms undertake the acquisition of a new source of
supply of inputs. The full model identifies variables that are encouraging for this kind of
upgrading. These are “Infrastructure (telecommunications, IT)” and “Size of local
markets.” On the other hand, those variables found to be hindering firms from
undertaking this innovation are: “Access to export markets,” “Request by large/related
49
company,” and “Living conditions.” As to the functions, “R&D/consulting” is positive,
while “Production (final products)” is negative. Except for finding “Infrastructure
(electricity, water supply, other utilities)” and “Availability of low-wage labor”
significant but the former variable with negative sign and the latter with positive sign,
the estimation under the selected model has closely similar results while raising the
significant levels of variables such as “Living conditions” (negative sign) and “R&D/
consulting” (positive sign).
Summary of Results
We find that telecommunications and IT infrastructure and size of local markets are
conducive for the acquisition of new sources of inputs. Perhaps, the former facilitates
the sourcing out of information for the availability of these inputs, while the latter drives
the demand for the product requiring firms to get supplies from other sources in order to
produce more. On the other hand, quality and standard considerations may hinder firms
which have access to export markets from sourcing out new sources of inputs, while
affiliation with a large/related company may not be driving the need to find new
suppliers. In addition, satisfaction with the living conditions in their present location
may be another consideration for not expanding sources of inputs.
In terms of functions, it seems fitting that those firms performing R&D/consulting
functions encourage the acquisition of new inputs, either as a result of their research or
to provide inputs to their activities.
4. POLICY ISSUES AND RECOMMENDATIONS
4.1. Issues on Industrial Policy
The policy reforms that were instituted starting in the 1980s and the 1990s
involving trade liberalization episodes, shift to outward-looking export oriented strategy,
investment liberalization, privatization and deregulation have had positive effects on the
economy to some extent, particularly coming from the difficulties of the 1970s and the
early 1990s. These reforms and their positive impact to the economy in general and
industrial development in particular may have been some of the factors that encouraged
50
agglomeration of firms in the country. However, although it is encouraging that almost
half of the firms surveyed have expressed the probability of expanding their operations
in their present locations, the country remains to be a laggard when it comes to
attracting FDIs compared with its neighbors, while its export performance has still not
reached the higher levels of the other countries.
Indeed, there are requisite aspects in the economic fundamentals of the country that
have to be addressed. For one, availability and modernization of infrastructures is a
pressing need. Apart from increasing its investments in infrastructure, rates of utilities
would have to come down particularly when they are not even commensurate to the
quality of the services. Macroeconomic fundamentals will have to be kept stable
particularly in light of developments in the world market and the current problems in the
United States. The rapid appreciation of the pesos is hurting the exporters as well as the
families of overseas Filipino workers. It is likewise imperative that there is stability at
the political front so that there is consistency in policies while commitments, contracts
and agreements are adhered to.
The unilateral trade reforms that have been implemented, despite not having
further developments lately, are being sustained by the bilateral and regional free trade
agreements and economic partnerships that the country has entered into. It is however,
imperative that to continue addressing the negative social impacts of such adjustment
policies especially among players in local industries, those engaged in micro, small and
medium enterprises and those that are regarded to be at the bottom of the pyramid.
Meanwhile, the investment incentives that the Philippines have been offering had
actually enticed firms to locate their business in the country particularly in Metro
Manila and the industrial areas in its periphery. The increasing rate of approved
investments and firms actually operating in both the public and private economic zones
and industrial estates is an indication that these incentives are certainly attractive to
them. However, issues that pertain to the hidden costs associated with incentives in
terms of foregone revenues and the recent findings of the high redundancy rate of this
incentives, i.e. investments would have been carried out even without the incentives,
would have to be continuously examined so further rationalization can be effected.
The linkages between institutions producing knowledge via R&D and the industrial
sector will have to be strengthened. The survey results manifest the weak linkages as
51
firms tend to depend on their own efforts. Research and knowledge creation in local
universities should reach the appropriate users for their application.
The local governments have an increasing role to play in the country’s industrial
development, particularly since they have been granted increased autonomy to manage
the economic and social affairs of their areas of jurisdiction. Some LGUs have enacted
their own investment codes in an effort to develop indigenous industries. The OTOP
program and industry clustering initiatives are promising developments in the area of
local economic development that should be aggressively pursued.
On the other hand, barriers or disincentives to investments still exist in the
Philippines. Land ownership among foreigners is prohibited in the Constitution. Its
labor force is beset with problems of low productivity, high wages, militancy of labor
unions, and declining quality of education. Exporters are still beset with weak backward
linkages as competitive support industries are still lacking and thus, forcing them to
continue importing their intermediate inputs. These gaps would have to be addressed in
order to minimize the barriers to industrial development.
4.2. Issues from the Survey
The results of the survey conducted in Greater Manila Area revealed the most
important factors that influenced firms to locate in the country. They represent the vital
importance of having strong and stable economic fundamentals (size of market and
physical infrastructure) and conducive policies (investment incentives) to entice and
develop industrial agglomerations in the country. These are the areas where continued
public investments should be allocated to ensure that this competitive advantage is
sustained. Meanwhile, it is also quite telling that government institutional infrastructure
did not figure prominently on the list of important encouraging factors from the point of
view of the firms surveyed. Combined with the findings from the case study that its
competitiveness is adversely being affected by the huge transaction costs of doing
business in the country, the current state of some of the aspects of the government’s
institutional infrastructure actually seem to pose a deterrent to further agglomeration.
The country’s performance in terms of exports and FDI compared to those of its
neighbors show that economic fundamentals and attractive investments (which
incidentally is similar to those offered by other ASEAN countries) and programs are not
52
enough to build up the country’s competitive advantage. Factor in a more stable,
progressive minded, professional, and efficient government infrastructure in the
equation and it is quite possible that an influx of investments could come in the county.
Another important issue that relates directly to productivity and therefore,
competitiveness of the country’s business environment is the capacity to innovate and
upgrade. Although the survey did determine that firms in the Philippines do innovate in
terms of introduction of new products and services, upgrading of machineries and
equipment, and opening of a new market, they tended to rely on their own in-house
capabilities for their source of technology as revealed by the survey. Since there appears
to be a much less degree of collaboration with other local institutions in terms of
financial support and actual R&D outputs, this is an area that should be looked at more
by the policy makers and these respective institutions themselves including industry
representatives. On the other hand, the fact that there is actual technology transfer
occurring between firms and MNCs is a good indication of the level of linkages existing
that goes beyond simple principal-sub-contactor or buyer-supplier relationships. More
of this sort is needed to increase the sophistication of industrial activities being
undertaken by local firms. The survey shows that the main activities of firms – even
some clusters – relate to assembly of goods and products or manufacturing of
components and parts. With the emergence of low-cost locations like Vietnam, China,
and soon perhaps, Cambodia, the country would eventually lose its advantage in this
regard. Thus, it is vital that the activities of its industries should move up the value
chain. The clustering strategy, particularly if all stakeholders optimize their potential
and their collaboration, may prove to be a step in this direction with the knowledge
exchange and spillovers that are supposed to happen.
4.3. Issues from the Econometrics Analysis
In terms of the estimation results on agglomeration in the Philippines, the analysis
shows that when it comes to the relationship between year of establishment and firm
size, the Philippine case does not appear to be consistent with the Flowchart Approach.
Using number of full time employees as indicator of firm size provided the general
finding that the latecomers in the Philippines are smaller firms. However, no significant
relationship was found. When asset size and capital were used as indicators (they have
53
the same results), the significance level increased and in almost all categories of firm
size. With the sign coming out as positive, the result implies that all firms agglomerated
in the latter period (1990s). Since it appears that it is not the larger (or smaller) firms
that triggered their influx, it can be deduced that the agglomeration was policy driven or
came about as a result of the opening up of the economy and the availability of
incentives for investments and physical infrastructure present. These are even borne out
by the survey results as the latter two factors were identified as those that influenced the
decision of firms to locate in the area.
In terms of the particular factors that attracted firms to locate in the Philippines,
those that were found to be significant in all three models (employees, assets, capital)
are investment incentives, protection of intellectual property rights, size of local markets,
and proximity to suppliers/subcontractors. Meanwhile, those that were found to have
influenced first movers who were more into production of final products, were the
supporting industries found to be present such as suppliers and subcontractors, local
content requirements, and size of the local market. Their entry to the Philippines was
further influenced by the liberal trade policy, the institutional infrastructure of the
government and customs procedures prevailing. The latecomers are firms in all sizes
mainly into production of parts and components that clustered in the country due to the
investment incentives offered, access to export markets, availability of low-wage labors,
presence of telecommunications and IT infrastructure, and the legal framework and
programs protecting intellectual property rights.
Some key variables such as legal systems, skilled labor, cutting-edge technology
and information were not found to be significant in the Philippines, although these are
claimed to have influenced the agglomeration in other countries.
Given these findings, particularly the policy driven agglomeration of firms in the
country, it becomes more imperative that those policies that yield good results in terms
of the investment potential of the country should be continued and pursued. Key factors
that are equally important but were not identified as significant should be reviewed and
when policy gaps are determined, addressed in order to add into the competitive
advantage of the Philippines.
In terms of the estimates in upgrading and innovation, the results were found to be
not robust to the different models. In particular, some variables are significantly positive

54
in one model, but they become significantly negative in other models. However, it can
still be deduced that the positive factors for upgrading are local content requirement and
the size of the market as those firms that have undergone innovation were satisfied with
these variables. On the other hand, firms were not satisfied with government
institutional infrastructures, financial systems, and living conditions that can be
regarded as discouraging factors for innovation. These hurdles to upgrading should be
addressed in order to improve the productivity and competitiveness of industries in the
Philippines.
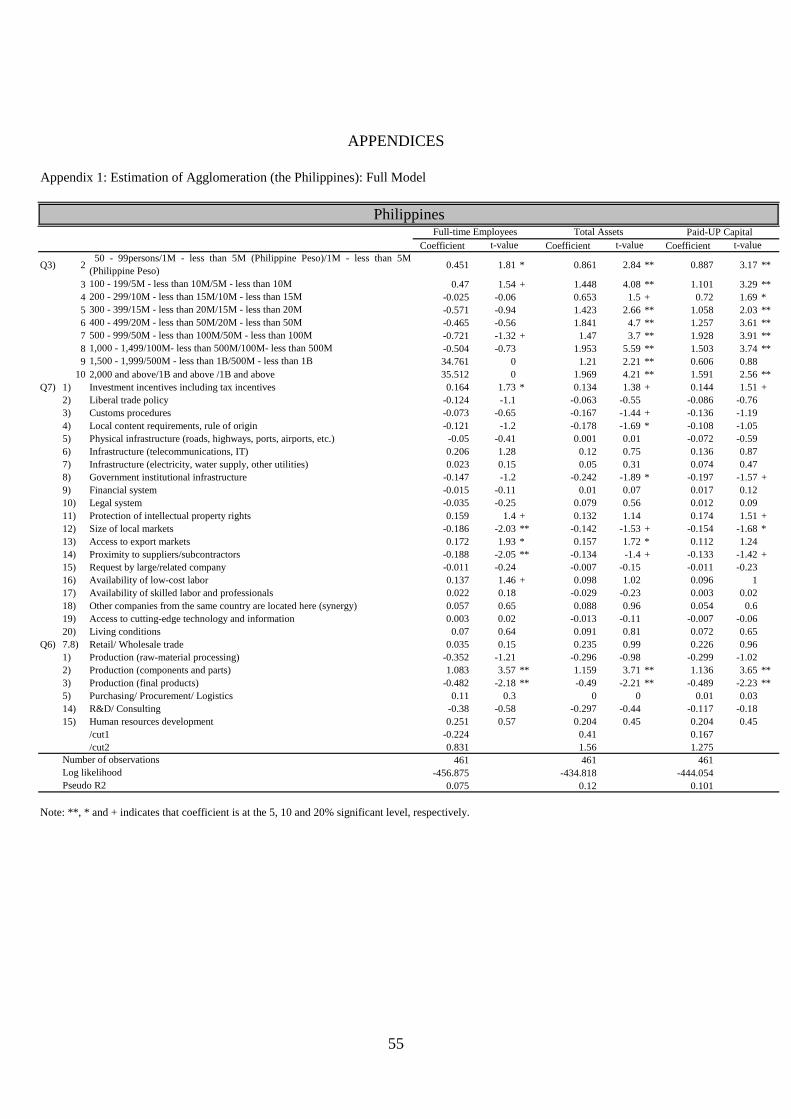
55
APPENDICES
Appendix 1: Estimation of Agglomeration (the Philippines): Full Model
Coefficient Coefficient Coefficient
Q3) 250 - 99persons/1M - less than 5M (Philippine Peso)/1M - less than 5M
(Philippine Peso) 0.451 1.81 * 0.861 2.84 ** 0.887 3.17 **
3 100 - 199/5M - less than 10M/5M - less than 10M 0.47 1.54 + 1.448 4.08 ** 1.101 3.29 **4 200 - 299/10M - less than 15M/10M - less than 15M -0.025 -0.06 0.653 1.5 + 0.72 1.69 *5 300 - 399/15M - less than 20M/15M - less than 20M -0.571 -0.94 1.423 2.66 ** 1.058 2.03 **6 400 - 499/20M - less than 50M/20M - less than 50M -0.465 -0.56 1.841 4.7 ** 1.257 3.61 **7 500 - 999/50M - less than 100M/50M - less than 100M -0.721 -1.32 + 1.47 3.7 ** 1.928 3.91 **8 1,000 - 1,499/100M- less than 500M/100M- less than 500M -0.504 -0.73 1.953 5.59 ** 1.503 3.74 **9 1,500 - 1,999/500M - less than 1B/500M - less than 1B 34.761 0 1.21 2.21 ** 0.606 0.88
10 2,000 and above/1B and above /1B and above 35.512 0 1.969 4.21 ** 1.591 2.56 **Q7) 1) Investment incentives including tax incentives 0.164 1.73 * 0.134 1.38 + 0.144 1.51 +
2) Liberal trade policy -0.124 -1.1 -0.063 -0.55 -0.086 -0.76 3) Customs procedures -0.073 -0.65 -0.167 -1.44 + -0.136 -1.19 4) Local content requirements, rule of origin -0.121 -1.2 -0.178 -1.69 * -0.108 -1.05 5) Physical infrastructure (roads, highways, ports, airports, etc.) -0.05 -0.41 0.001 0.01 -0.072 -0.59 6) Infrastructure (telecommunications, IT) 0.206 1.28 0.12 0.75 0.136 0.87 7) Infrastructure (electricity, water supply, other utilities) 0.023 0.15 0.05 0.31 0.074 0.47 8) Government institutional infrastructure -0.147 -1.2 -0.242 -1.89 * -0.197 -1.57 +9) Financial system -0.015 -0.11 0.01 0.07 0.017 0.12 10) Legal system -0.035 -0.25 0.079 0.56 0.012 0.09 11) Protection of intellectual property rights 0.159 1.4 + 0.132 1.14 0.174 1.51 +12) Size of local markets -0.186 -2.03 ** -0.142 -1.53 + -0.154 -1.68 *13) Access to export markets 0.172 1.93 * 0.157 1.72 * 0.112 1.24 14) Proximity to suppliers/subcontractors -0.188 -2.05 ** -0.134 -1.4 + -0.133 -1.42 +15) Request by large/related company -0.011 -0.24 -0.007 -0.15 -0.011 -0.23 16) Availability of low-cost labor 0.137 1.46 + 0.098 1.02 0.096 1 17) Availability of skilled labor and professionals 0.022 0.18 -0.029 -0.23 0.003 0.02 18) Other companies from the same country are located here (synergy) 0.057 0.65 0.088 0.96 0.054 0.6 19) Access to cutting-edge technology and information 0.003 0.02 -0.013 -0.11 -0.007 -0.06 20) Living conditions 0.07 0.64 0.091 0.81 0.072 0.65
Q6) 7.8) Retail/ Wholesale trade 0.035 0.15 0.235 0.99 0.226 0.96 1) Production (raw-material processing) -0.352 -1.21 -0.296 -0.98 -0.299 -1.02 2) Production (components and parts) 1.083 3.57 ** 1.159 3.71 ** 1.136 3.65 **3) Production (final products) -0.482 -2.18 ** -0.49 -2.21 ** -0.489 -2.23 **5) Purchasing/ Procurement/ Logistics 0.11 0.3 0 0 0.01 0.03 14) R&D/ Consulting -0.38 -0.58 -0.297 -0.44 -0.117 -0.18 15) Human resources development 0.251 0.57 0.204 0.45 0.204 0.45
/cut1 -0.224 0.41 0.167/cut2 0.831 1.56 1.275
461 461 461-456.875 -434.818 -444.054
0.075 0.12 0.101
t-value
Note: **, * and + indicates that coefficient is at the 5, 10 and 20% significant level, respectively.
Number of observations
PhilippinesFull-time Employees Total Assets Paid-UP Capital
Pseudo R2Log likelihood
t-value t-value
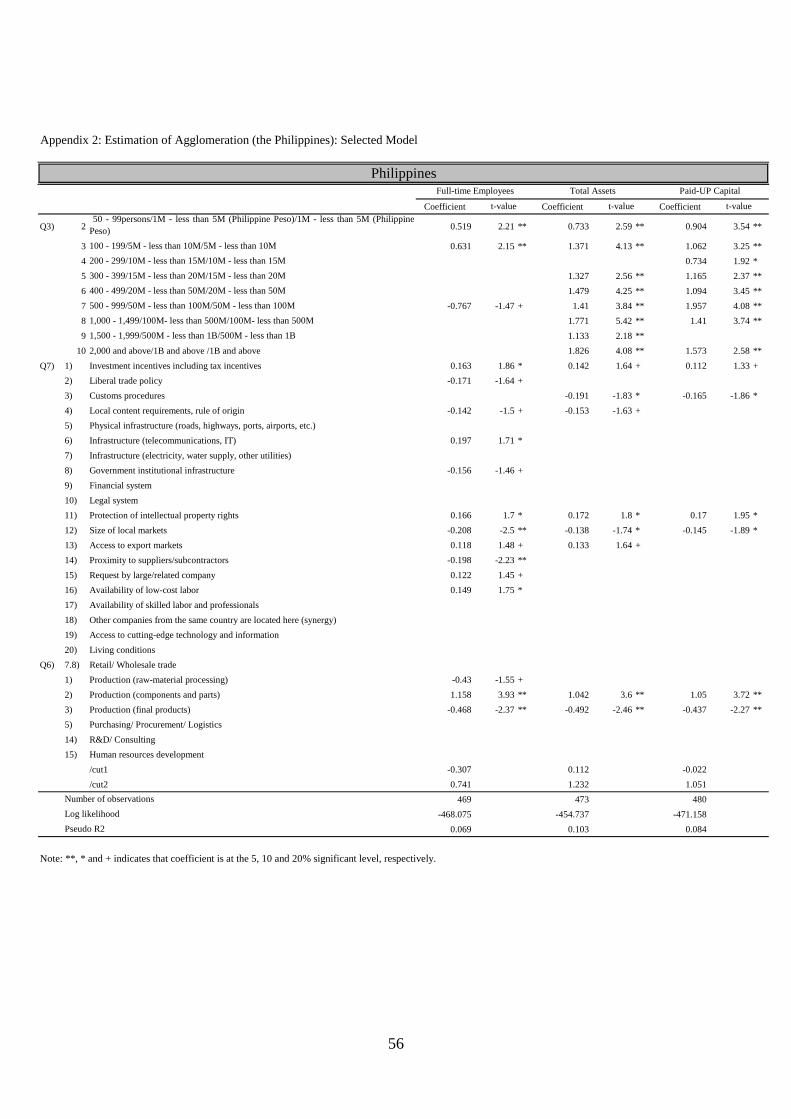
56
Appendix 2: Estimation of Agglomeration (the Philippines): Selected Model
Coefficient Coefficient Coefficient
Q3) 250 - 99persons/1M - less than 5M (Philippine Peso)/1M - less than 5M (Philippine
Peso) 0.519 2.21 ** 0.733 2.59 ** 0.904 3.54 **
3 100 - 199/5M - less than 10M/5M - less than 10M 0.631 2.15 ** 1.371 4.13 ** 1.062 3.25 **4 200 - 299/10M - less than 15M/10M - less than 15M 0.734 1.92 *5 300 - 399/15M - less than 20M/15M - less than 20M 1.327 2.56 ** 1.165 2.37 **6 400 - 499/20M - less than 50M/20M - less than 50M 1.479 4.25 ** 1.094 3.45 **7 500 - 999/50M - less than 100M/50M - less than 100M -0.767 -1.47 + 1.41 3.84 ** 1.957 4.08 **8 1,000 - 1,499/100M- less than 500M/100M- less than 500M 1.771 5.42 ** 1.41 3.74 **9 1,500 - 1,999/500M - less than 1B/500M - less than 1B 1.133 2.18 **
10 2,000 and above/1B and above /1B and above 1.826 4.08 ** 1.573 2.58 **Q7) 1) Investment incentives including tax incentives 0.163 1.86 * 0.142 1.64 + 0.112 1.33 +
2) Liberal trade policy -0.171 -1.64 +3) Customs procedures -0.191 -1.83 * -0.165 -1.86 *4) Local content requirements, rule of origin -0.142 -1.5 + -0.153 -1.63 +5) Physical infrastructure (roads, highways, ports, airports, etc.)6) Infrastructure (telecommunications, IT) 0.197 1.71 *7) Infrastructure (electricity, water supply, other utilities)8) Government institutional infrastructure -0.156 -1.46 +9) Financial system10) Legal system11) Protection of intellectual property rights 0.166 1.7 * 0.172 1.8 * 0.17 1.95 *12) Size of local markets -0.208 -2.5 ** -0.138 -1.74 * -0.145 -1.89 *13) Access to export markets 0.118 1.48 + 0.133 1.64 +14) Proximity to suppliers/subcontractors -0.198 -2.23 **15) Request by large/related company 0.122 1.45 +16) Availability of low-cost labor 0.149 1.75 *17) Availability of skilled labor and professionals18) Other companies from the same country are located here (synergy)19) Access to cutting-edge technology and information20) Living conditions
Q6) 7.8) Retail/ Wholesale trade1) Production (raw-material processing) -0.43 -1.55 +2) Production (components and parts) 1.158 3.93 ** 1.042 3.6 ** 1.05 3.72 **3) Production (final products) -0.468 -2.37 ** -0.492 -2.46 ** -0.437 -2.27 **5) Purchasing/ Procurement/ Logistics14) R&D/ Consulting15) Human resources development
/cut1 -0.307 0.112 -0.022/cut2 0.741 1.232 1.051
469 473 480-468.075 -454.737 -471.158
0.069 0.103 0.084
PhilippinesFull-time Employees Total Assets Paid-UP Capital
t-value t-value t-value
Log likelihoodPseudo R2
Note: **, * and + indicates that coefficient is at the 5, 10 and 20% significant level, respectively.
Number of observations
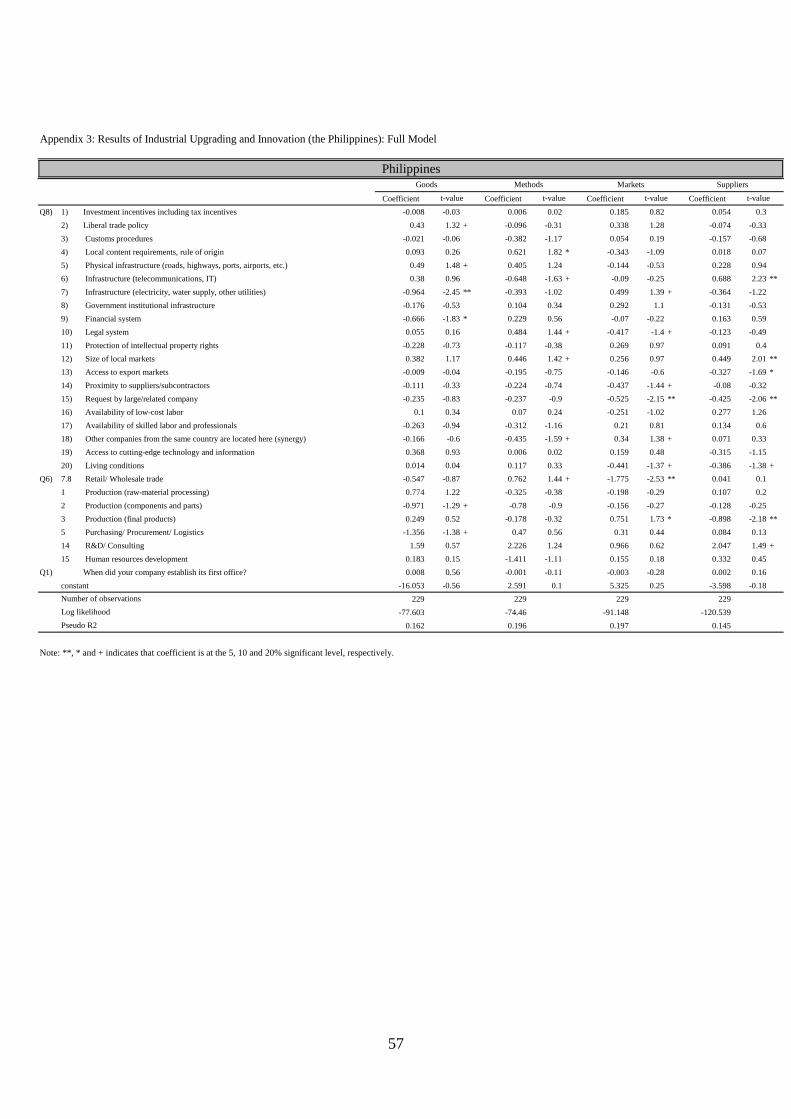
57
Appendix 3: Results of Industrial Upgrading and Innovation (the Philippines): Full Model
Coefficient Coefficient Coefficient CoefficientQ8) 1) Investment incentives including tax incentives -0.008 -0.03 0.006 0.02 0.185 0.82 0.054 0.3
2) Liberal trade policy 0.43 1.32 + -0.096 -0.31 0.338 1.28 -0.074 -0.33 3) Customs procedures -0.021 -0.06 -0.382 -1.17 0.054 0.19 -0.157 -0.68 4) Local content requirements, rule of origin 0.093 0.26 0.621 1.82 * -0.343 -1.09 0.018 0.07 5) Physical infrastructure (roads, highways, ports, airports, etc.) 0.49 1.48 + 0.405 1.24 -0.144 -0.53 0.228 0.94 6) Infrastructure (telecommunications, IT) 0.38 0.96 -0.648 -1.63 + -0.09 -0.25 0.688 2.23 **7) Infrastructure (electricity, water supply, other utilities) -0.964 -2.45 ** -0.393 -1.02 0.499 1.39 + -0.364 -1.22 8) Government institutional infrastructure -0.176 -0.53 0.104 0.34 0.292 1.1 -0.131 -0.53 9) Financial system -0.666 -1.83 * 0.229 0.56 -0.07 -0.22 0.163 0.59 10) Legal system 0.055 0.16 0.484 1.44 + -0.417 -1.4 + -0.123 -0.49 11) Protection of intellectual property rights -0.228 -0.73 -0.117 -0.38 0.269 0.97 0.091 0.4 12) Size of local markets 0.382 1.17 0.446 1.42 + 0.256 0.97 0.449 2.01 **13) Access to export markets -0.009 -0.04 -0.195 -0.75 -0.146 -0.6 -0.327 -1.69 *14) Proximity to suppliers/subcontractors -0.111 -0.33 -0.224 -0.74 -0.437 -1.44 + -0.08 -0.32 15) Request by large/related company -0.235 -0.83 -0.237 -0.9 -0.525 -2.15 ** -0.425 -2.06 **16) Availability of low-cost labor 0.1 0.34 0.07 0.24 -0.251 -1.02 0.277 1.26 17) Availability of skilled labor and professionals -0.263 -0.94 -0.312 -1.16 0.21 0.81 0.134 0.6 18) Other companies from the same country are located here (synergy) -0.166 -0.6 -0.435 -1.59 + 0.34 1.38 + 0.071 0.33 19) Access to cutting-edge technology and information 0.368 0.93 0.006 0.02 0.159 0.48 -0.315 -1.15 20) Living conditions 0.014 0.04 0.117 0.33 -0.441 -1.37 + -0.386 -1.38 +
Q6) 7.8 Retail/ Wholesale trade -0.547 -0.87 0.762 1.44 + -1.775 -2.53 ** 0.041 0.1 1 Production (raw-material processing) 0.774 1.22 -0.325 -0.38 -0.198 -0.29 0.107 0.2 2 Production (components and parts) -0.971 -1.29 + -0.78 -0.9 -0.156 -0.27 -0.128 -0.25 3 Production (final products) 0.249 0.52 -0.178 -0.32 0.751 1.73 * -0.898 -2.18 **5 Purchasing/ Procurement/ Logistics -1.356 -1.38 + 0.47 0.56 0.31 0.44 0.084 0.13 14 R&D/ Consulting 1.59 0.57 2.226 1.24 0.966 0.62 2.047 1.49 +15 Human resources development 0.183 0.15 -1.411 -1.11 0.155 0.18 0.332 0.45
Q1) When did your company establish its first office? 0.008 0.56 -0.001 -0.11 -0.003 -0.28 0.002 0.16 constant -16.053 -0.56 2.591 0.1 5.325 0.25 -3.598 -0.18
229 229 229 229-77.603 -74.46 -91.148 -120.539
0.162 0.196 0.197 0.145
t-value
Note: **, * and + indicates that coefficient is at the 5, 10 and 20% significant level, respectively.
Goods
Log likelihoodPseudo R2
PhilippinesMethods Markets Suppliers
t-value t-value t-value
Number of observations
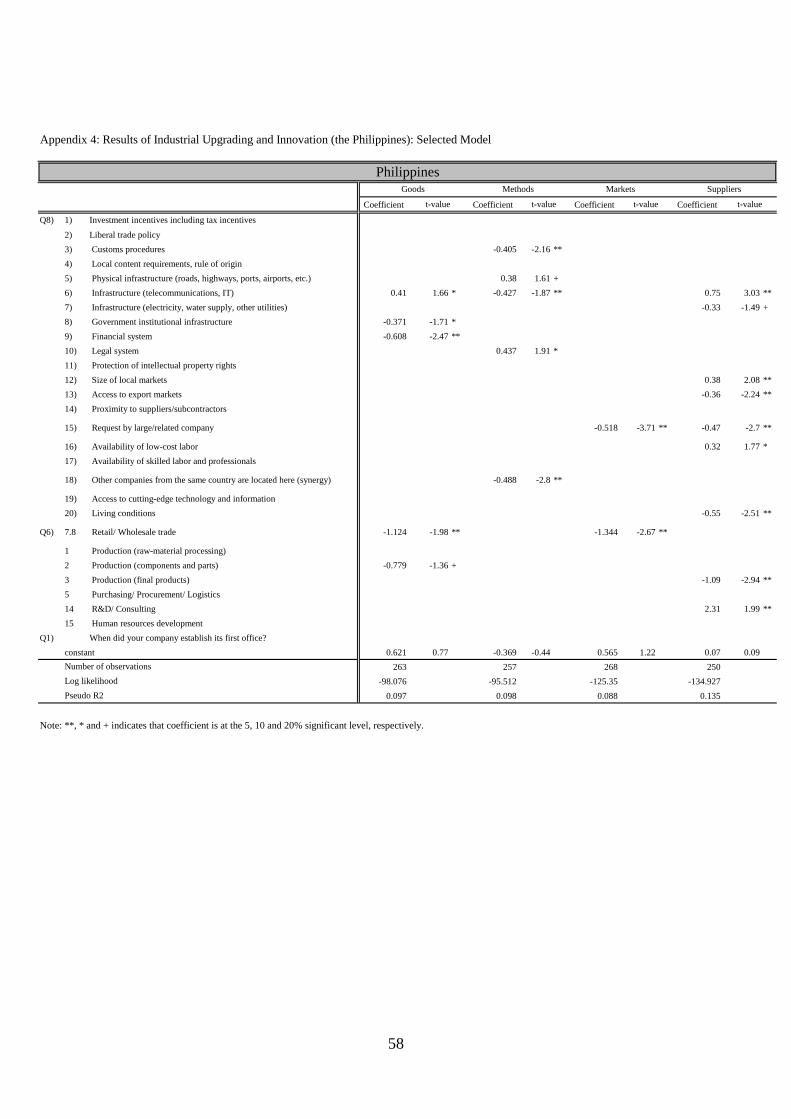
58
Appendix 4: Results of Industrial Upgrading and Innovation (the Philippines): Selected Model
Coefficient Coefficient Coefficient Coefficient
Q8) 1) Investment incentives including tax incentives
2) Liberal trade policy3) Customs procedures -0.405 -2.16 **4) Local content requirements, rule of origin5) Physical infrastructure (roads, highways, ports, airports, etc.) 0.38 1.61 +6) Infrastructure (telecommunications, IT) 0.41 1.66 * -0.427 -1.87 ** 0.75 3.03 **7) Infrastructure (electricity, water supply, other utilities) -0.33 -1.49 +8) Government institutional infrastructure -0.371 -1.71 *9) Financial system -0.608 -2.47 **10) Legal system 0.437 1.91 *11) Protection of intellectual property rights12) Size of local markets 0.38 2.08 **13) Access to export markets -0.36 -2.24 **14) Proximity to suppliers/subcontractors
15) Request by large/related company -0.518 -3.71 ** -0.47 -2.7 **
16) Availability of low-cost labor 0.32 1.77 *17) Availability of skilled labor and professionals
18) Other companies from the same country are located here (synergy) -0.488 -2.8 **
19) Access to cutting-edge technology and information20) Living conditions -0.55 -2.51 **
Q6) 7.8 Retail/ Wholesale trade -1.124 -1.98 ** -1.344 -2.67 **
1 Production (raw-material processing)2 Production (components and parts) -0.779 -1.36 +3 Production (final products) -1.09 -2.94 **5 Purchasing/ Procurement/ Logistics14 R&D/ Consulting 2.31 1.99 **15 Human resources development
Q1) When did your company establish its first office?constant 0.621 0.77 -0.369 -0.44 0.565 1.22 0.07 0.09
263 257 268 250-98.076 -95.512 -125.35 -134.927
0.097 0.098 0.088 0.135
PhilippinesGoods Methods Markets Suppliers
t-value t-value
Log likelihoodPseudo R2
t-value
Note: **, * and + indicates that coefficient is at the 5, 10 and 20% significant level, respectively.
Number of observations
t-value
59
NOTES * This paper draws heavily from the final report submitted by the Philippine Institute for Development Studies to the Bangkok Research Center, IDE-JETRO and the econometrics report of the Japanese study team, which are both part of the ERIA Cluster Study project. She is thankful for the comments and support of Dr. Josef Yap and Dr. Rafaelita Aldaba, the assistance provided by Mr. Michael Cabalfin in the survey results and the excellent research assistance of Ms. Fatima Lourdes E. del Prado and Ms. Christine Ruth Salazar. 1 Fan, Cindy C. and Allen Scott (2003) cited such scholars as Krugman (1991) and Porter (2001) in their article appearing in the journal, Economic Geography. 2 ASEAN is acronym for Association of South East Asian Nations. 3 Figures based on data collected from the ASEAN Secretariat’s FDI Database; Global Development Finance, 2005; UNCTAD FDI Interactive Database; and, IMF Direction of Trade Statistics, 2005. 4 Data from the National Statistics Office and National Statistical Coordination Board. 5 Aldaba, R.M. (2006) “FDI Investment Incentive System and FDI Inflows: The Philippine Experience.” PIDS Discussion Paper; Bangko Sentral ng Pilipinas; International Monetary Fund. 6 Board of Investments and National Statistical Coordination Board.
REFERENCES Aldaba, Rafaelita (2006) “FDI Investment Incentive System and FDI Inflows: The Philippine Experience.” Discussion Paper Series No. 2006-20. Makati City: Philippine Institute for Development Studies. Austria, Myrna (1998) “The Emerging Philippine Investment Environment.” Discussion Paper Series No. 98-27. Makati City: Philippine Institute for Development Studies. Balboa, Jenny and Erlinda Medalla (2006) “State of Trade and Investments in the Philippines.” Discussion Paper No. 2006-15. Makati City: Philippine Institute for Development Studies. Board of Investments (2007) Investment Priorities Plan 2007. Makati City: Board of Investments, Philippines. Caloocan City Government (2008) http://www.caloocancity.gov.ph/ (accessed January 3, 2008). Department of Trade and Industry and the Export Development Council (2005). Philippine Export Development Plan, 2005-2007. Makati City: Department of Trade and Industry.
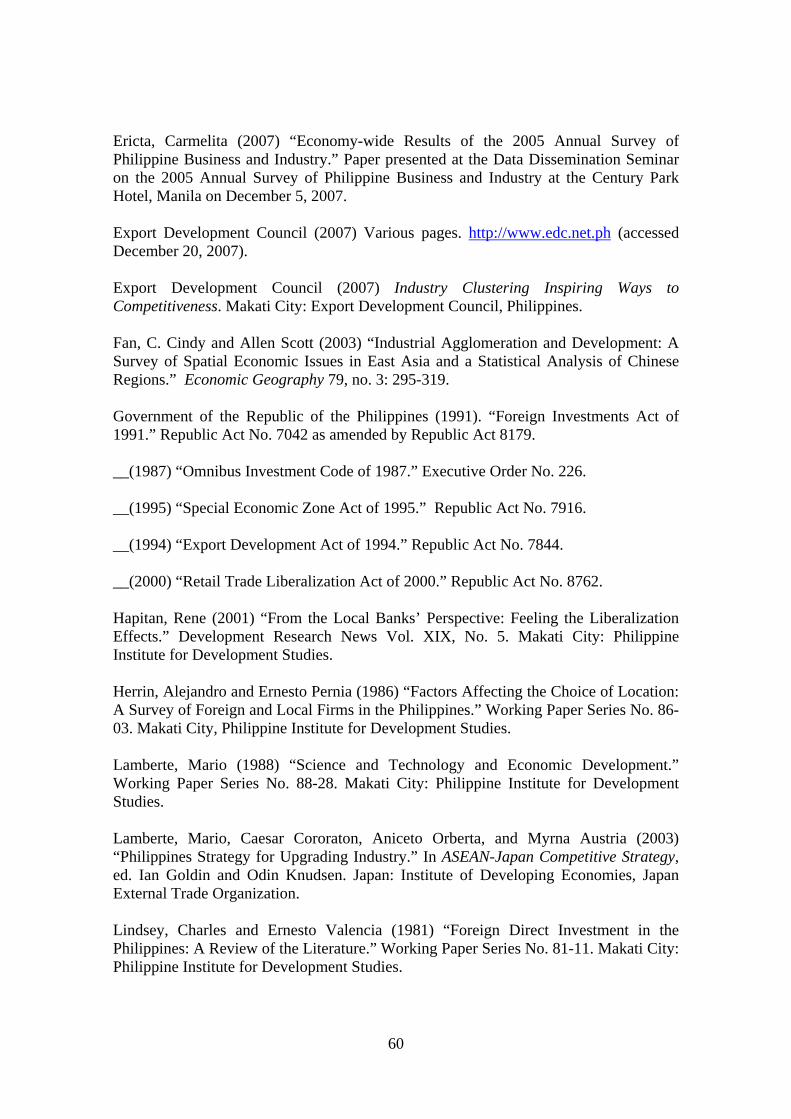
60
Ericta, Carmelita (2007) “Economy-wide Results of the 2005 Annual Survey of Philippine Business and Industry.” Paper presented at the Data Dissemination Seminar on the 2005 Annual Survey of Philippine Business and Industry at the Century Park Hotel, Manila on December 5, 2007. Export Development Council (2007) Various pages. http://www.edc.net.ph (accessed December 20, 2007). Export Development Council (2007) Industry Clustering Inspiring Ways to Competitiveness. Makati City: Export Development Council, Philippines. Fan, C. Cindy and Allen Scott (2003) “Industrial Agglomeration and Development: A Survey of Spatial Economic Issues in East Asia and a Statistical Analysis of Chinese Regions.” Economic Geography 79, no. 3: 295-319. Government of the Republic of the Philippines (1991). “Foreign Investments Act of 1991.” Republic Act No. 7042 as amended by Republic Act 8179. __(1987) “Omnibus Investment Code of 1987.” Executive Order No. 226.
__(1995) “Special Economic Zone Act of 1995.” Republic Act No. 7916.
__(1994) “Export Development Act of 1994.” Republic Act No. 7844.
__(2000) “Retail Trade Liberalization Act of 2000.” Republic Act No. 8762. Hapitan, Rene (2001) “From the Local Banks’ Perspective: Feeling the Liberalization Effects.” Development Research News Vol. XIX, No. 5. Makati City: Philippine Institute for Development Studies. Herrin, Alejandro and Ernesto Pernia (1986) “Factors Affecting the Choice of Location: A Survey of Foreign and Local Firms in the Philippines.” Working Paper Series No. 86-03. Makati City, Philippine Institute for Development Studies. Lamberte, Mario (1988) “Science and Technology and Economic Development.” Working Paper Series No. 88-28. Makati City: Philippine Institute for Development Studies. Lamberte, Mario, Caesar Cororaton, Aniceto Orberta, and Myrna Austria (2003) “Philippines Strategy for Upgrading Industry.” In ASEAN-Japan Competitive Strategy, ed. Ian Goldin and Odin Knudsen. Japan: Institute of Developing Economies, Japan External Trade Organization. Lindsey, Charles and Ernesto Valencia (1981) “Foreign Direct Investment in the Philippines: A Review of the Literature.” Working Paper Series No. 81-11. Makati City: Philippine Institute for Development Studies.
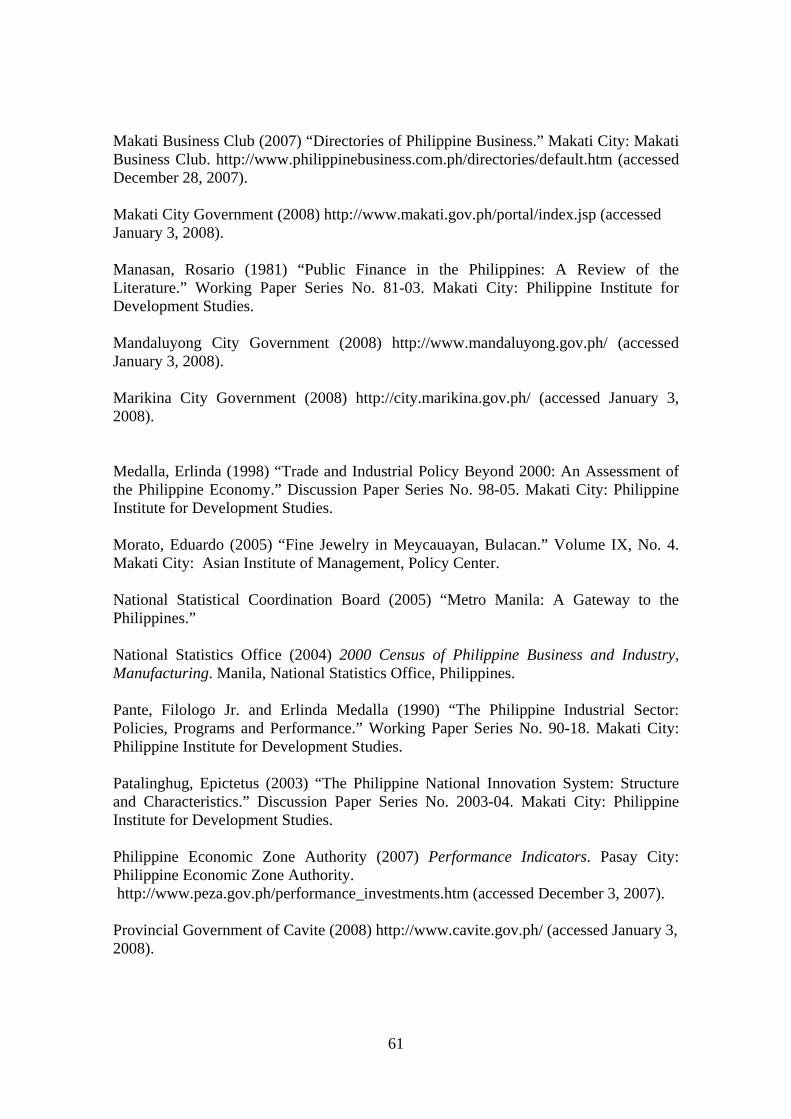
61
Makati Business Club (2007) “Directories of Philippine Business.” Makati City: Makati Business Club. http://www.philippinebusiness.com.ph/directories/default.htm (accessed December 28, 2007). Makati City Government (2008) http://www.makati.gov.ph/portal/index.jsp (accessed January 3, 2008).
Manasan, Rosario (1981) “Public Finance in the Philippines: A Review of the Literature.” Working Paper Series No. 81-03. Makati City: Philippine Institute for Development Studies. Mandaluyong City Government (2008) http://www.mandaluyong.gov.ph/ (accessed January 3, 2008). Marikina City Government (2008) http://city.marikina.gov.ph/ (accessed January 3, 2008).
Medalla, Erlinda (1998) “Trade and Industrial Policy Beyond 2000: An Assessment of the Philippine Economy.” Discussion Paper Series No. 98-05. Makati City: Philippine Institute for Development Studies. Morato, Eduardo (2005) “Fine Jewelry in Meycauayan, Bulacan.” Volume IX, No. 4. Makati City: Asian Institute of Management, Policy Center. National Statistical Coordination Board (2005) “Metro Manila: A Gateway to the Philippines.” National Statistics Office (2004) 2000 Census of Philippine Business and Industry, Manufacturing. Manila, National Statistics Office, Philippines. Pante, Filologo Jr. and Erlinda Medalla (1990) “The Philippine Industrial Sector: Policies, Programs and Performance.” Working Paper Series No. 90-18. Makati City: Philippine Institute for Development Studies. Patalinghug, Epictetus (2003) “The Philippine National Innovation System: Structure and Characteristics.” Discussion Paper Series No. 2003-04. Makati City: Philippine Institute for Development Studies. Philippine Economic Zone Authority (2007) Performance Indicators. Pasay City: Philippine Economic Zone Authority. http://www.peza.gov.ph/performance_investments.htm (accessed December 3, 2007). Provincial Government of Cavite (2008) http://www.cavite.gov.ph/ (accessed January 3, 2008).
62
Provincial Government of Laguna (2008) http://www.laguna.gov.ph/ (accessed January 3, 2008). Sachs, Jeffrey and Andrew Warner (1995). “Economic Reform and the Process of Global Integration.” Brookings Paper on Economic Activity. Tariff Commission (2007) Tariff Reform Program. Quezon City: Philippine Tariff Commission. http:www.tariffcommission.gov.ph/tariff1.html (accessed December 3, 2007). Tsuji, Masatsugu; Emanuele Giovannetti; and Mitsuhiro Kagami (2007) Industrial Agglomeration and New Technologies A Global Perspective. Northampton, MA: Edward Elgar Publishing, Inc. United Nations Economic and Social Commission for Asia and the Pacific (UNESCAP) (2007) Linking Greater Mekong Subregion Enterprises to International Markets: The Role of Global Value Chains, International Production Networks and Enterprise Clusters. Studies in Trade and Investment No. 59. United Nations. World Bank, The (2007) “The Doing Business Project.” Washington DC: The World Bank Group. http://www.doingbusiness.org/ (accessed December 30, 2007). World Economic Forum (2007) “The Global Competitiveness Report 2007-2008.” Geneva: World Economic Forum. http://www.weforum.org/en/initiatives/gcp/Global%20Competitiveness%20Report/index.htm (accessed December 30, 2007). Yap, Josef (2002). “Assessment of Economic Performance and An Agenda for Sustainable Growth,” in The Philippines Beyond 2000: An Economic Assessment, edited by Josef T. Yap, Makati, Philippine Institute for Development Studies.