Embed Size (px)
Citation preview
8/6/2019 The Master Schedule
http://slidepdf.com/reader/full/the-master-schedule 1/79
V i s u a
l 4-1
Chapter 4 - The Master Schedule 4.1 Background and links to the S&OP
4.2 Master schedule horizon 4.3 Time fences
4.4 Sources of demand
4.5 Basic methodology
4.6 Impact of product environment
4.7 General approach to master schedule development
4.8 Available-to-promise logic
4.9 Planning options in an ATO environment
4.10 The two-level master schedule
4.11 Some notes on the master scheduling responsibility
4.12 Demand management overview
4.13 Elements of demand management
8/6/2019 The Master Schedule
http://slidepdf.com/reader/full/the-master-schedule 2/79
V i s u a
l 4-2
Introduction
Developing and managing the master schedule It is the next step in production planning
Assumes that S&OP has properly planned resources
Contains more detail than the S&OP
The time horizon is typically shorter than S&OP
S&OP plans in terms of families
Master schedule represents final, sellable items
– is a major interface between prod’n and customer Service firms may not have one
– master scheduled operating rooms???
8/6/2019 The Master Schedule
http://slidepdf.com/reader/full/the-master-schedule 3/79
V i s u a
l 4-3
4.1 Background and Links to S&OP
S&OP lines up the proper resources S&OP aggregates forecast demand
– seldom includes actual input from customer orders
– planning is not done on the final product level
More planning is then needed to…
8/6/2019 The Master Schedule
http://slidepdf.com/reader/full/the-master-schedule 4/79
V i s u a
l 4-4
4.1 Background and Links to S&OP
Break down the aggregated plans – into buildable products
Serve as a plan to include forecast and actual
orders
Serve as a source of info to develop capacity
plans
Serve as a vehicle to translate customer orders
into effectively timed factory orders Serve as a tool to plan inventory levels
– especially finished goods
8/6/2019 The Master Schedule
http://slidepdf.com/reader/full/the-master-schedule 5/79
V i s u a
l 4-5
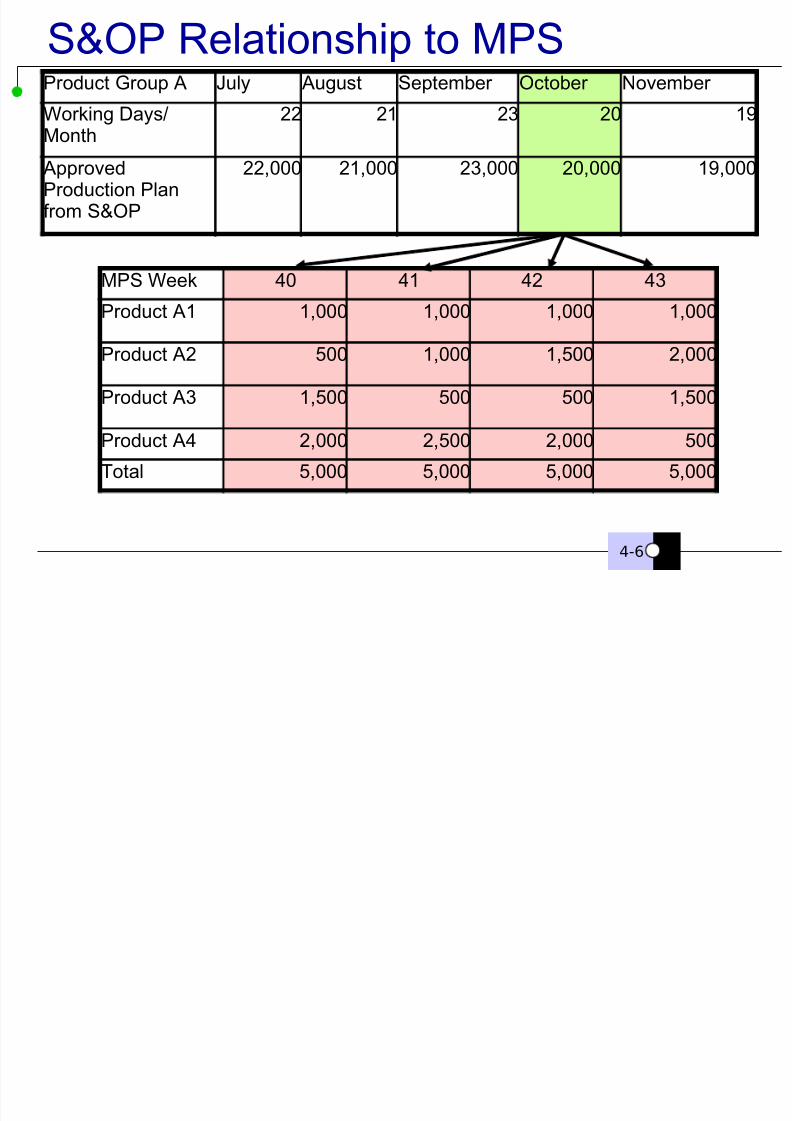
4.1 Background and Links to S&OP
This planning activity is the master schedule It starts with a detailed product forecast
Develops a set of rules for the consumption of
the forecast
Translates the requirements into actual orders
The master schedule has more detail than S&OP
The master schedule has a shorter time horizon
The master schedule quantities or values should
equal those developed in the S&OP
8/6/2019 The Master Schedule
http://slidepdf.com/reader/full/the-master-schedule 6/79
8/6/2019 The Master Schedule
http://slidepdf.com/reader/full/the-master-schedule 7/79
V i s u a
l 4-7
Product Groups/Families
Represent how the product or service ispresented to the market
Logical groupings based on similar sales and
manufacturing requirements
Should be meaningful in terms of volume of
sales generated
Ideally should be no more than 6-12 product
groups per business unit
Source: Wallace, Tom F. Sales and Operations Planning, A How-To Guide, T.F. Wallace & Co. 1999.
8/6/2019 The Master Schedule
http://slidepdf.com/reader/full/the-master-schedule 8/79
8/6/2019 The Master Schedule
http://slidepdf.com/reader/full/the-master-schedule 9/79
V i s u a
l 4-9
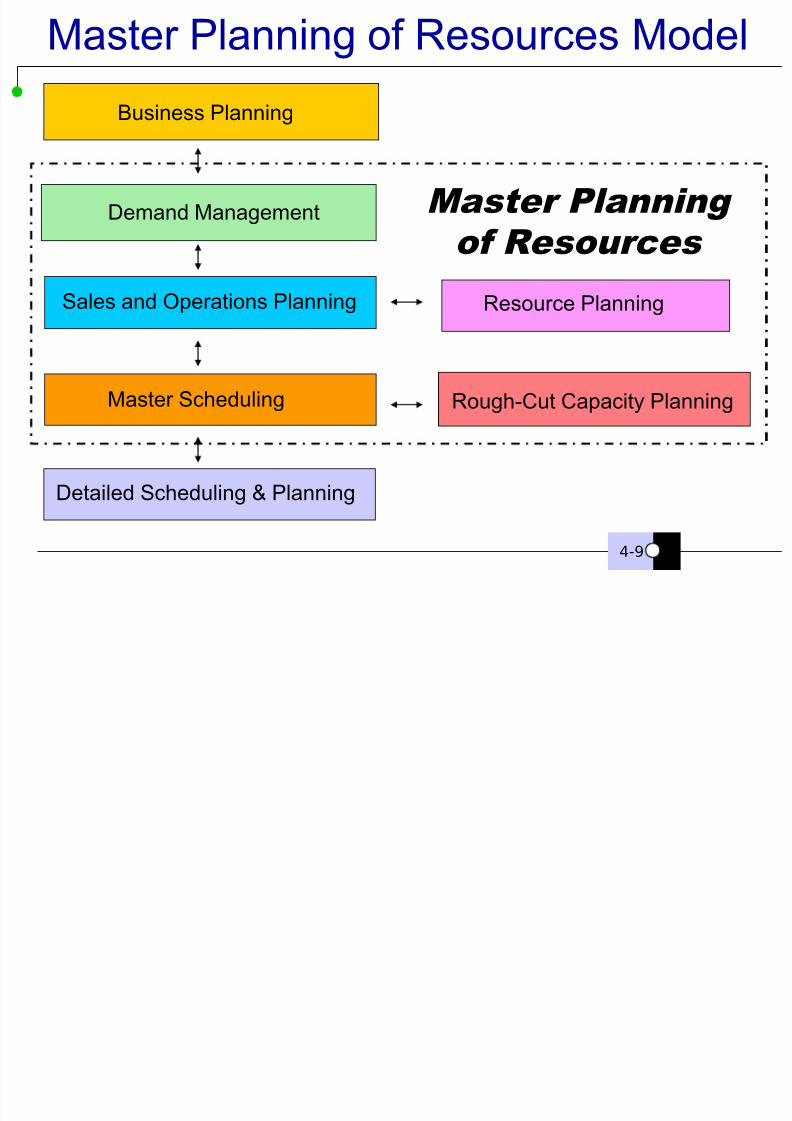
Master Planning of Resources Model
Demand Management
Sales and Operations Planning Resource Planning
Master Scheduling Rough-Cut Capacity Planning
Business Planning
Detailed Scheduling & Planning
Master Planning
of Resources
8/6/2019 The Master Schedule
http://slidepdf.com/reader/full/the-master-schedule 10/79
V i s u a
l 4-10
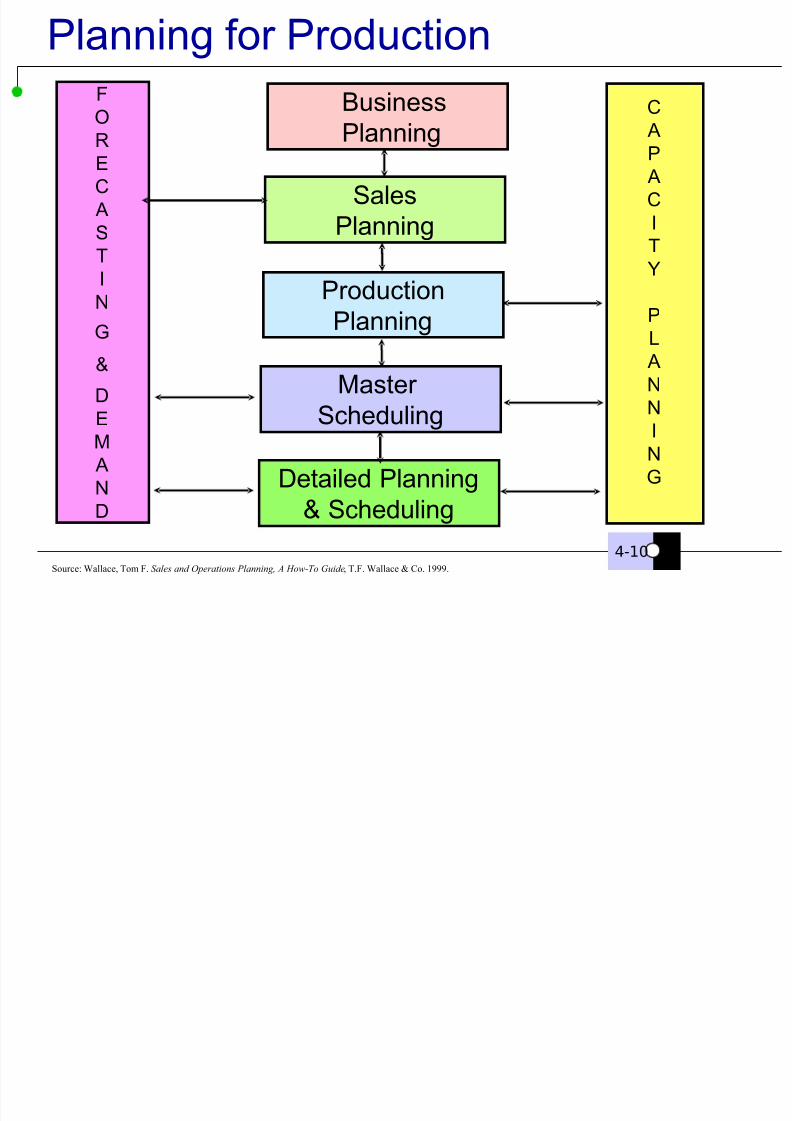
Planning for Production
Sales
Planning
Production
Planning
Master
Scheduling
Detailed Planning
& Scheduling
C
AP
A
C
I
T
Y
P
L
A
N
NI
N
G
F
O
RE
C
A
S
T
I
N
G
&
D
E
M
A
N
D
Business
Planning
Source: Wallace, Tom F. Sales and Operations Planning, A How-To Guide, T.F. Wallace & Co. 1999.
8/6/2019 The Master Schedule
http://slidepdf.com/reader/full/the-master-schedule 11/79
V i s u a
l 4-11
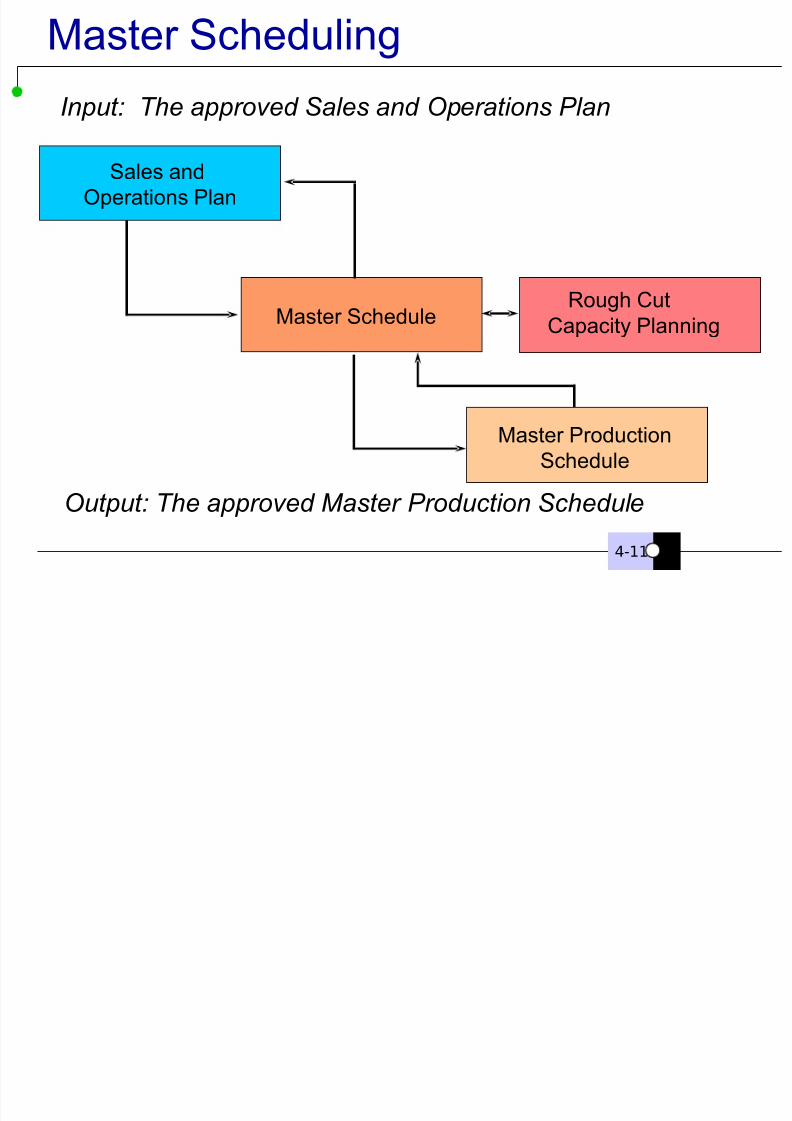
Master Scheduling
Sales and
Operations Plan
Master Schedule
Master Production
Schedule
Rough Cut
Capacity Planning
Input: The approved Sales and Operations Plan
Output: The approved Master Production Schedule
8/6/2019 The Master Schedule
http://slidepdf.com/reader/full/the-master-schedule 12/79
V i s u a
l 4-12
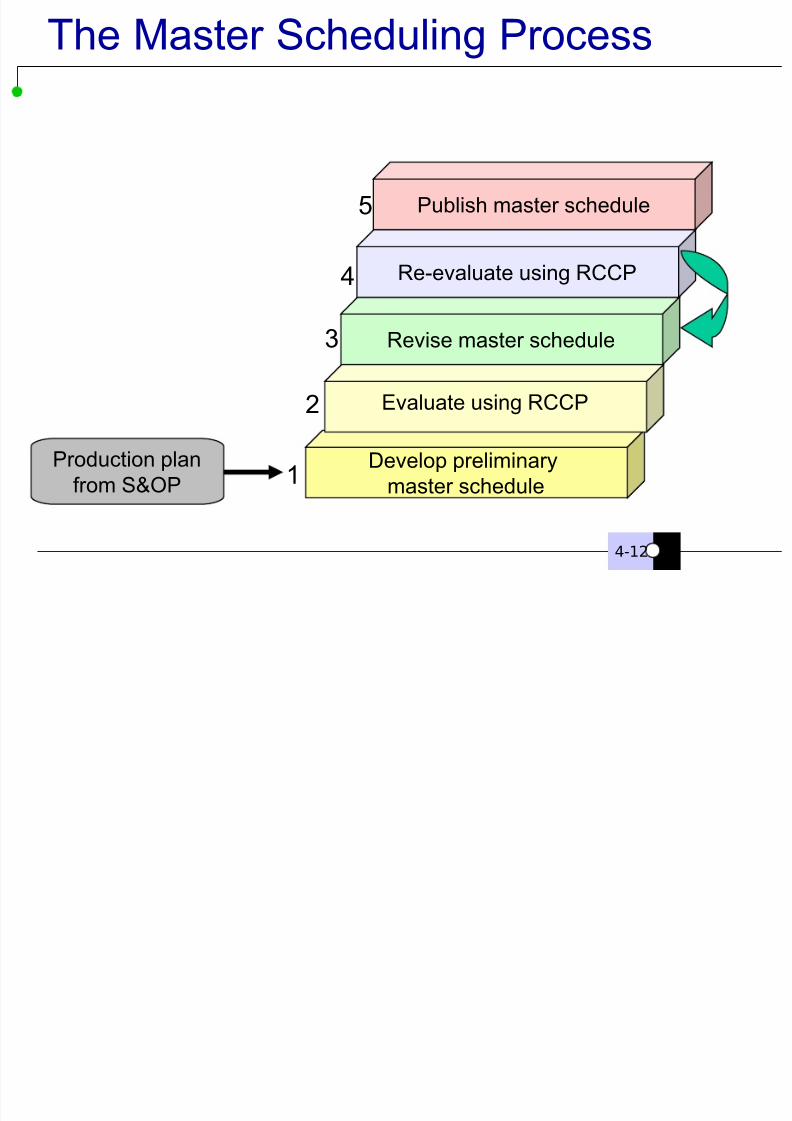
The Master Scheduling Process
Develop preliminary
master schedule
Evaluate using RCCP
Revise master schedule
Re-evaluate using RCCP
1
2
3
4
5
Production plan
from S&OP
Publish master schedule

8/6/2019 The Master Schedule
http://slidepdf.com/reader/full/the-master-schedule 13/79
V i s u a
l 4-13
4.2 Master Schedule Horizon
The master schedule must have a horizonthat is equal to or longer than the
cumulative lead time of the product or
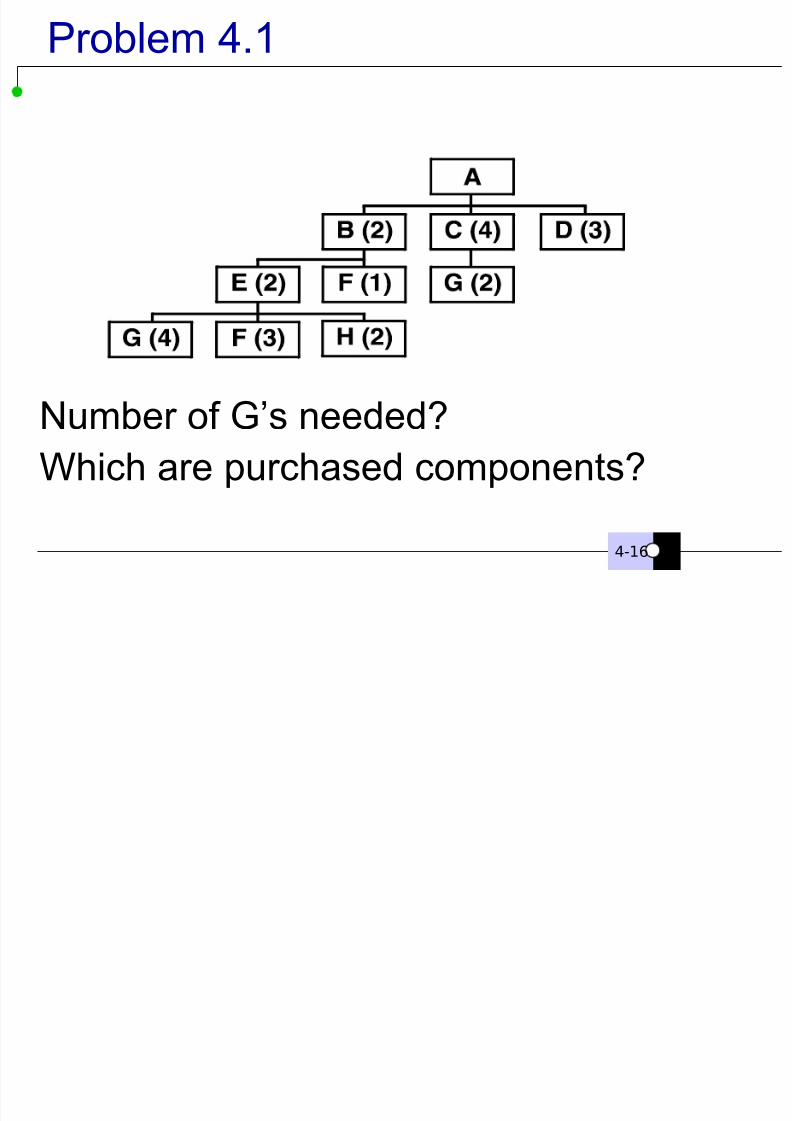
service being planned. First examine the bill of material
– shows components required to assemble a product
– shows the relationship between products
– shows the quantity to build one product – contains lead times

8/6/2019 The Master Schedule
http://slidepdf.com/reader/full/the-master-schedule 14/79
V i s u a
l 4-14
4.2 Master Schedule Horizon
Cumulative lead time is the amount of time it takes to make a product from
start to finish
Figure 4.1

8/6/2019 The Master Schedule
http://slidepdf.com/reader/full/the-master-schedule 15/79
V i s u a
l 4-15
Bill of Materials
SingleLevel
Multilevel
I n n e
B 1 2 1
O u t e
B 1 2 1
H a r d
K i t
B e a r
A 1 2 1
B a l l S e a g r e a
H a r dK i t
f o r g f a s t e
I n n eB 1 2 1
B 1 2 1O u t
B e a
A 1 2 1
8/6/2019 The Master Schedule
http://slidepdf.com/reader/full/the-master-schedule 16/79
8/6/2019 The Master Schedule
http://slidepdf.com/reader/full/the-master-schedule 17/79
V i s u a
l
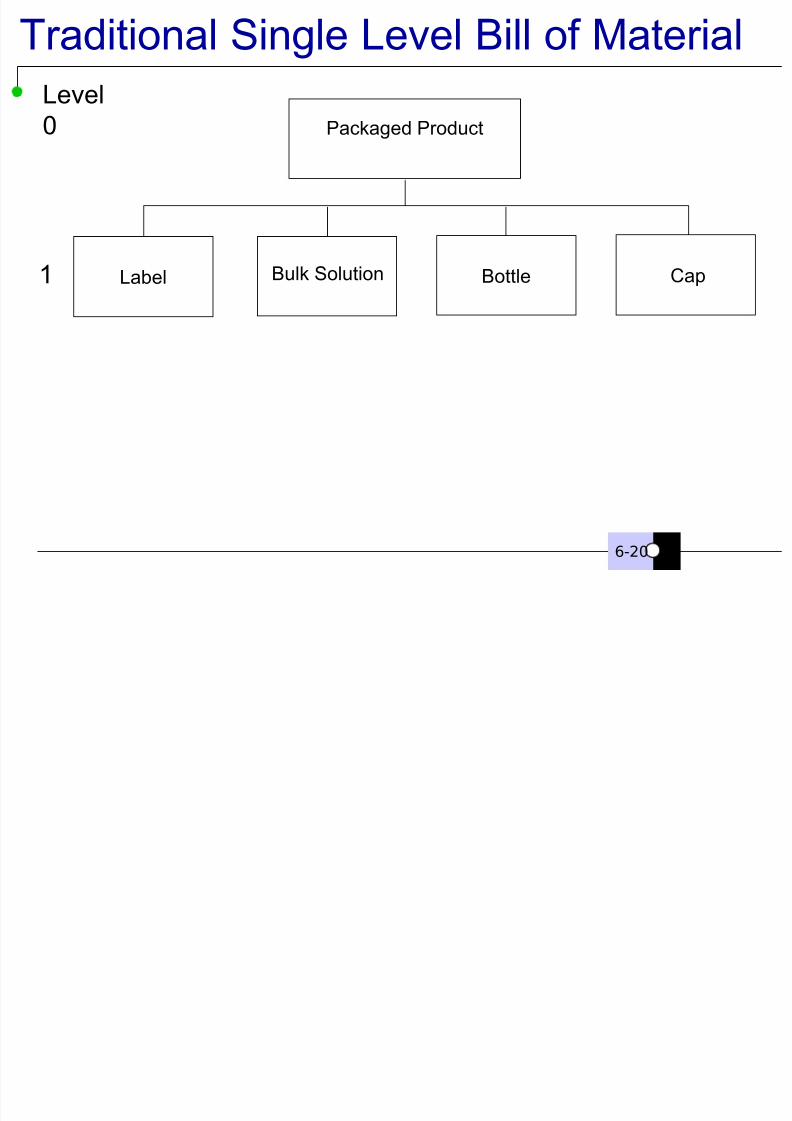
Traditional Single Level Bill of Material
Level
0
1
6-20
Packaged Product
Label Bottle CapBulk Solution

8/6/2019 The Master Schedule
http://slidepdf.com/reader/full/the-master-schedule 18/79
V i s u a
l
Packaged Product
Label Bottle Cap
Active Filler
Bulk Solution
Base
Level
0
1
2
6-21
Multi-Level Bill of MaterialMulti-Level Bill of MaterialMulti-Level Bill of Material
8/6/2019 The Master Schedule
http://slidepdf.com/reader/full/the-master-schedule 19/79
V i s u a
l
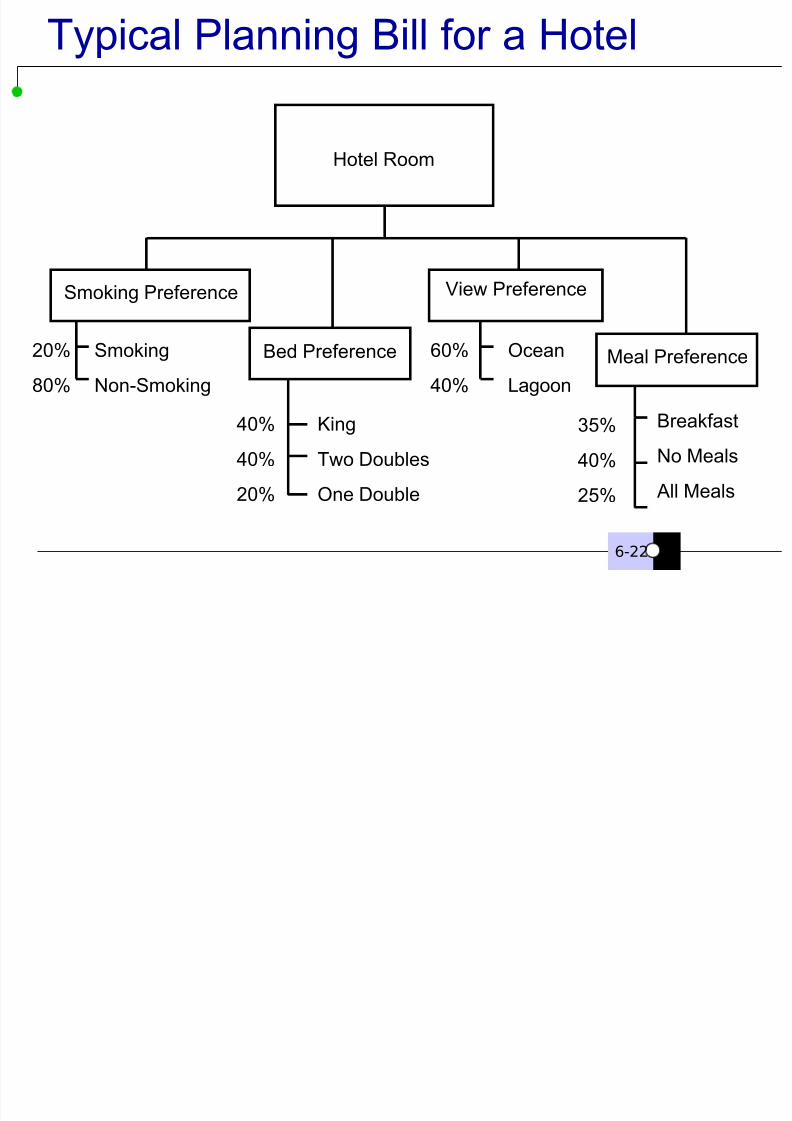
Typical Planning Bill for a Hotel
Hotel Room
Smoking Preference
Bed Preference
View Preference
Meal PreferenceSmoking
Non-Smoking
King
Two Doubles
One Double
Ocean
Lagoon
Breakfast
No Meals
All Meals
20%
80%
40%
40%
20%
60%
40%
35%
40%
25%
6-22
8/6/2019 The Master Schedule
http://slidepdf.com/reader/full/the-master-schedule 20/79
V i s u a
l
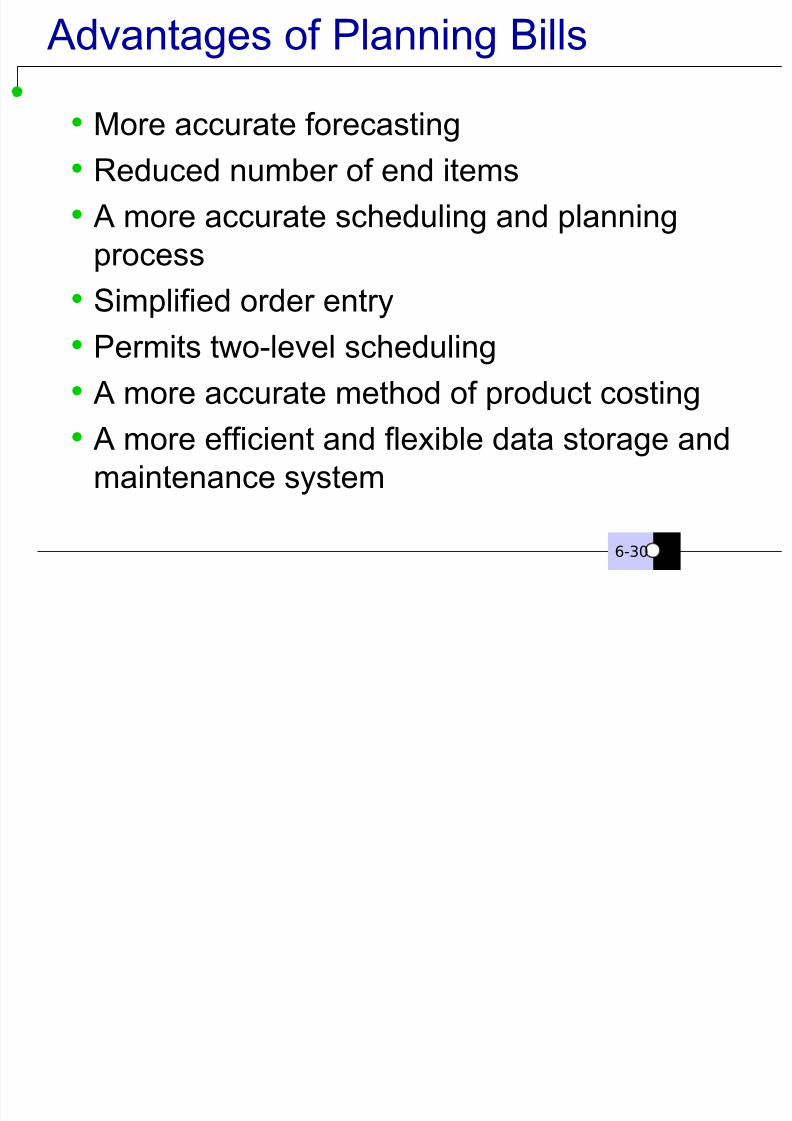
Advantages of Planning Bills
More accurate forecasting Reduced number of end items
A more accurate scheduling and planning
process
Simplified order entry
Permits two-level scheduling
A more accurate method of product costing A more efficient and flexible data storage and
maintenance system
6-30
8/6/2019 The Master Schedule
http://slidepdf.com/reader/full/the-master-schedule 21/79
V i s u a
l 4-21
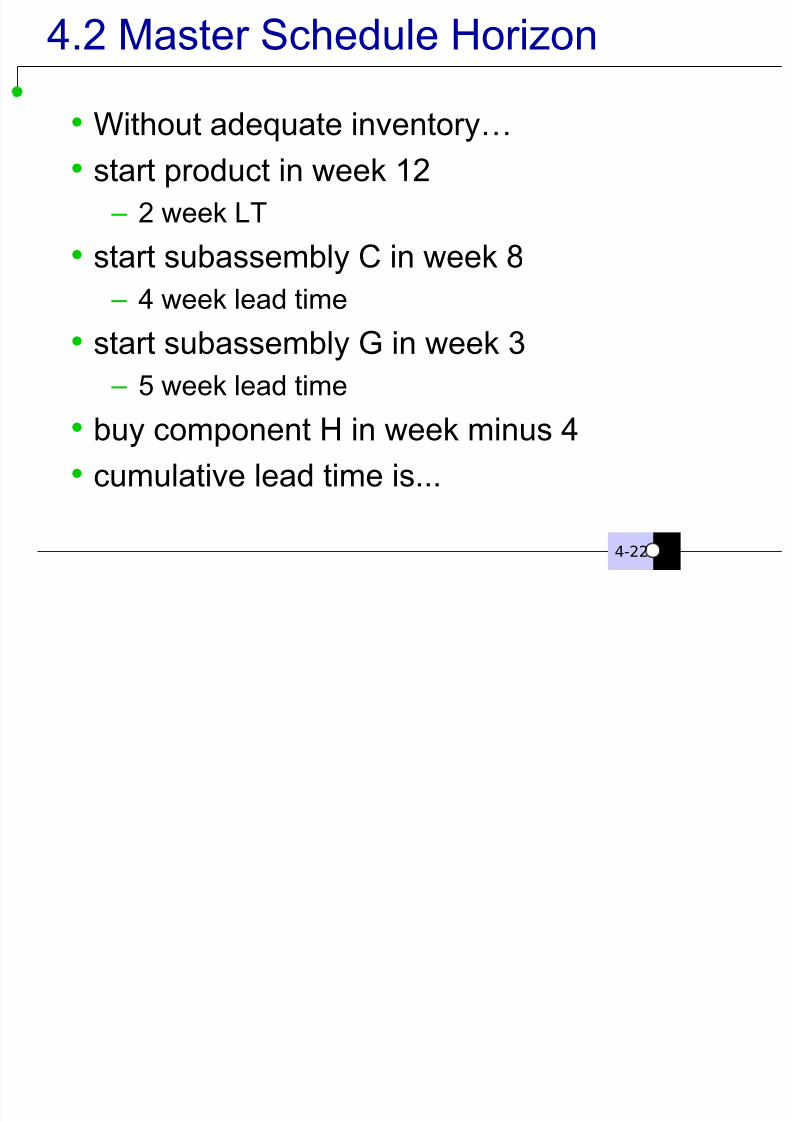
4.2 Master Schedule Horizon
We must plan beyond the cumulative leadtime
– promise of 1 product in week 14
– what about other components?
8/6/2019 The Master Schedule
http://slidepdf.com/reader/full/the-master-schedule 22/79
8/6/2019 The Master Schedule
http://slidepdf.com/reader/full/the-master-schedule 23/79
V i s
u a
l 4-23
4.3 Time Fences
One problem with using forecasts… – they are almost always wrong
The master schedule uses time fences
– they establish rules to manage the master schedule
Demand time fence
Planning time fence
8/6/2019 The Master Schedule
http://slidepdf.com/reader/full/the-master-schedule 24/79
V i s
u a
l 4-24
4.3 Time Fences
Within the demand time fence... The forecast data is ignored
Actual customer orders are used
Schedule is considered “frozen”
– no changes to the schedule
• impossible or impractical
• bake a loaf of bread and change the schedule during baking
The demand time fence is the closest to thepresent time in the schedule
8/6/2019 The Master Schedule
http://slidepdf.com/reader/full/the-master-schedule 25/79
V i s
u a
l 4-25
4.3 Time Fences
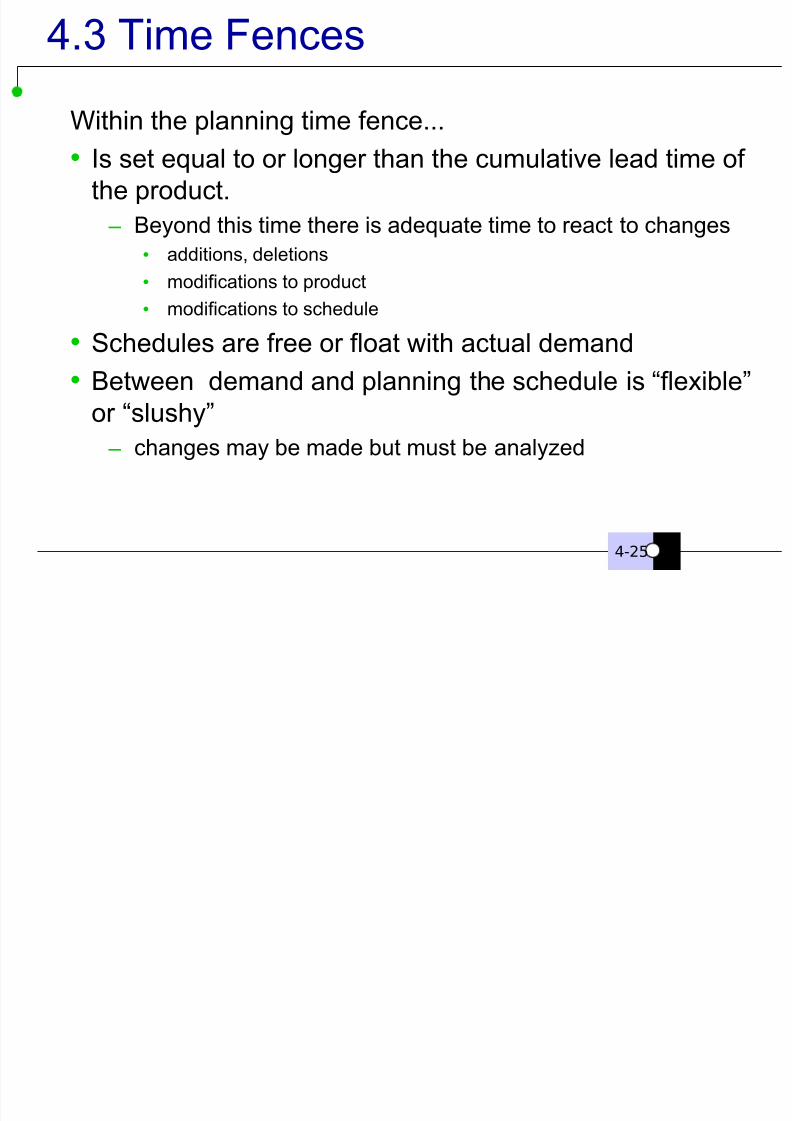
Within the planning time fence...
Is set equal to or longer than the cumulative lead time of
the product.
– Beyond this time there is adequate time to react to changes
• additions, deletions
• modifications to product
• modifications to schedule
Schedules are free or float with actual demand
Between demand and planning the schedule is “flexible”
or “slushy” – changes may be made but must be analyzed
8/6/2019 The Master Schedule
http://slidepdf.com/reader/full/the-master-schedule 26/79
V i s
u a
l 4-26
Time Fences
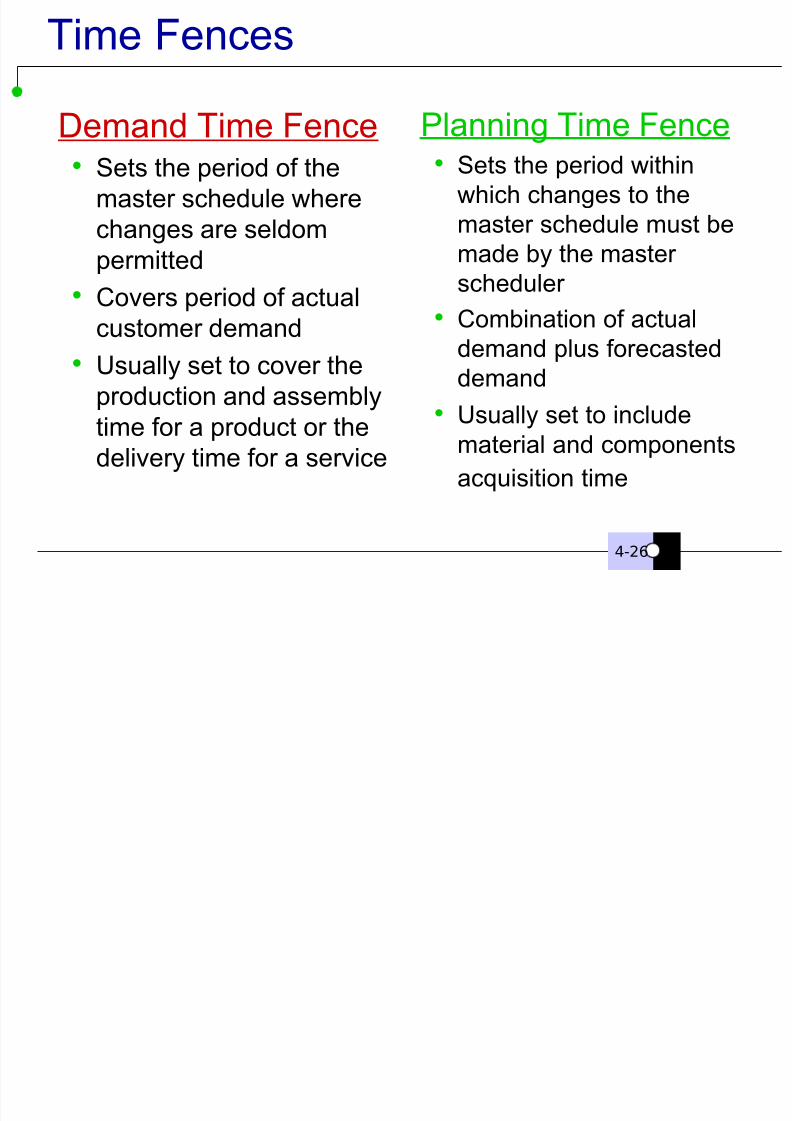
Demand Time Fence Sets the period of the
master schedule where
changes are seldom
permitted
Covers period of actual
customer demand
Usually set to cover the
production and assemblytime for a product or the
delivery time for a service
Planning Time Fence Sets the period within
which changes to the
master schedule must be
made by the master
scheduler
Combination of actual
demand plus forecasted
demand
Usually set to includematerial and components
acquisition time
8/6/2019 The Master Schedule
http://slidepdf.com/reader/full/the-master-schedule 27/79
V i s
u a
l 4-27
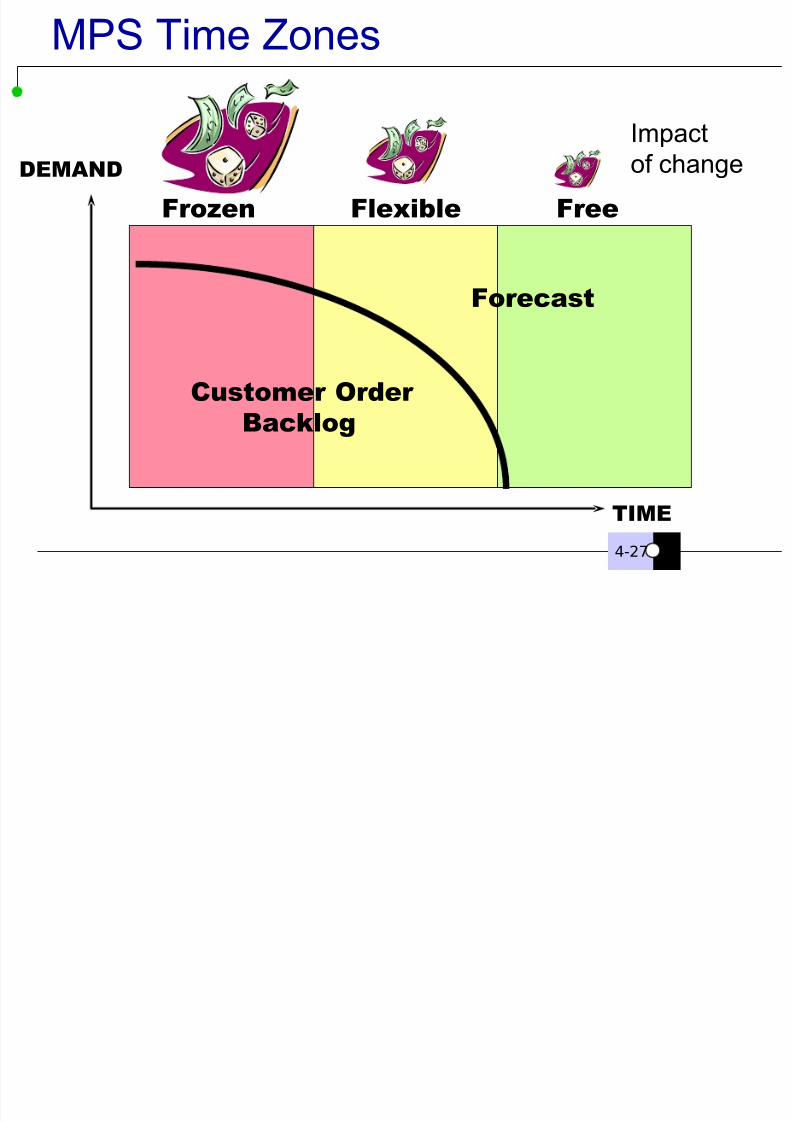
MPS Time Zones
DEMAND
TIME
Frozen Flexible Free
Customer Order
Backlog
Forecast
Impactof change
8/6/2019 The Master Schedule
http://slidepdf.com/reader/full/the-master-schedule 28/79
V i s
u a
l 4-28
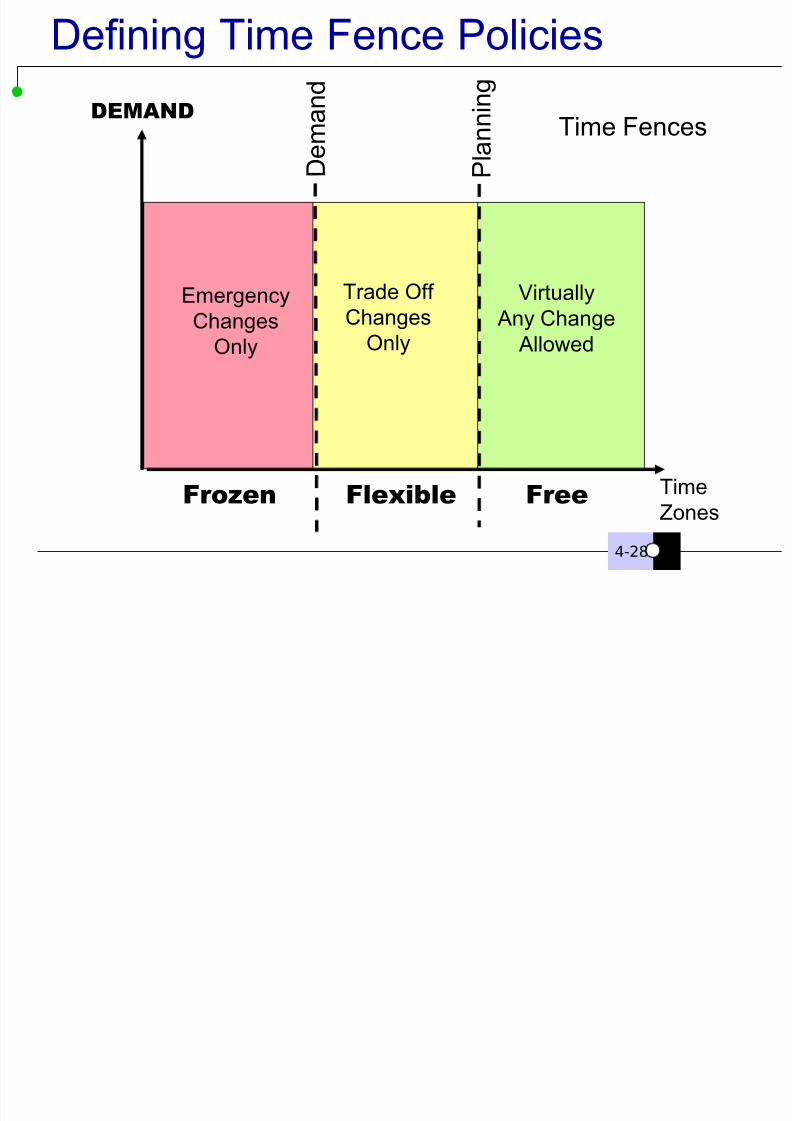
Defining Time Fence Policies
DEMAND
Time
ZonesFrozen Flexible Free
D e m
a n d
P l a n
n i n g
Emergency
Changes
Only
Trade Off
Changes
Only
Virtually
Any Change
Allowed
Time Fences
C i Fi Pl d O d

8/6/2019 The Master Schedule
http://slidepdf.com/reader/full/the-master-schedule 29/79
V i s
u a
l 4-29
Released
Orders
Computer Generated
Planned
Orders
Creating Firm Planned Orders
DEMAND
TIME
Frozen Flexible Free
FirmPlanned
Orders
4 4 S f D d
8/6/2019 The Master Schedule
http://slidepdf.com/reader/full/the-master-schedule 30/79
V i s
u a
l 4-30
4.4 Sources of Demand
The master schedule is said to “disaggregate” the
S&OP...
Important that the numbers must agree with the
S&OP numbers
The forecasting methods are often different
– S&OP are long-range, often using causal
techniques
– Master schedule is shorter and typicallywould use quantitative methods
• actual customer orders
4 5 B i M th d l
8/6/2019 The Master Schedule
http://slidepdf.com/reader/full/the-master-schedule 31/79
V i s
u a
l 4-31
4.5 Basic Methodology
The master schedule uses demand (orders
and forecast) in its development It considers…
– inventory plans
– labor plans
– new product introductions
Now considers
– meeting the customers needs per the S&OP – balancing demand v. capacity
– establishing inventory levels per the S&OP
4 5 B i M th d l

8/6/2019 The Master Schedule
http://slidepdf.com/reader/full/the-master-schedule 32/79
V i s
u a
l 4-32
4.5 Basic Methodology
Figure 4.4 shows a simple master
schedule. The actual schedule that includes specific
quantities and models is the master
production schedule or MPS
review of schedule
– on hand = 70
– lot size = 80
– dates are completion dates
4 6 I t f P d t E i t

8/6/2019 The Master Schedule
http://slidepdf.com/reader/full/the-master-schedule 33/79
V
i s u a
l 4-33
4.6 Impact of Product Environment
The master schedule may need to be
developed and managed very
differently depending on the product
environment... Make-to-Stock (MTS)
Assemble-to-Order (ATO)
Make-to-Order (MTO)
S h d li D i i
8/6/2019 The Master Schedule
http://slidepdf.com/reader/full/the-master-schedule 34/79
V
i s u a
l
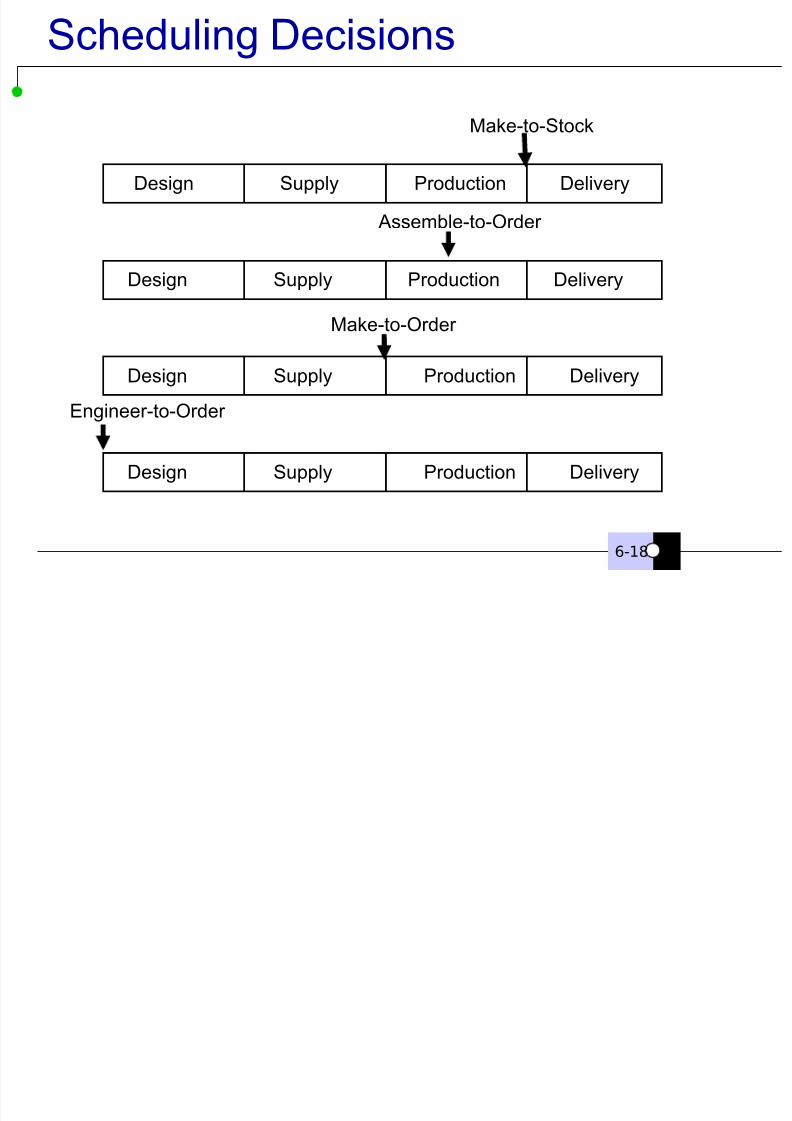
Scheduling Decisions
Assemble-to-Order
Engineer-to-Order
Design Supply Production Delivery
Design Supply Production Delivery
Make-to-Order
Design Supply Production Delivery
Make-to-Stock
Design Supply Production Delivery
6-18
4 6 I t f P d t E i t
8/6/2019 The Master Schedule
http://slidepdf.com/reader/full/the-master-schedule 35/79
V
i s u a
l 4-35
4.6 Impact of Product Environment
Make-to-Stock environment... Customer has no influence on final design
Master schedule serves as a final
assembly schedule (FAS) Relatively few final products
– significant raw materials or components
Order promising not done through MPS – orders filled directly from stock
4 6 I t f P d t E i t
8/6/2019 The Master Schedule
http://slidepdf.com/reader/full/the-master-schedule 36/79
V
i s u a
l 4-36
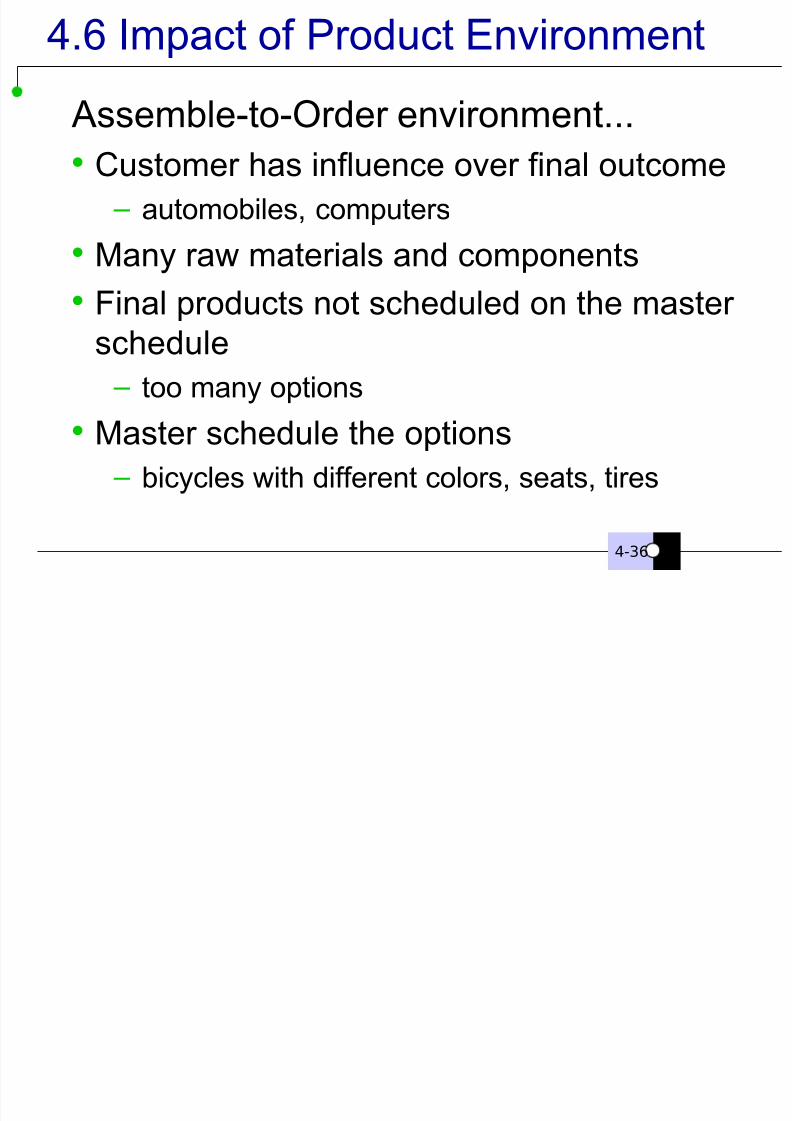
4.6 Impact of Product Environment
Assemble-to-Order environment... Customer has influence over final outcome
– automobiles, computers
Many raw materials and components
Final products not scheduled on the master
schedule
– too many options
Master schedule the options
– bicycles with different colors, seats, tires
4 6 I t f P d t E i t
8/6/2019 The Master Schedule
http://slidepdf.com/reader/full/the-master-schedule 37/79
V
i s u a
l 4-37
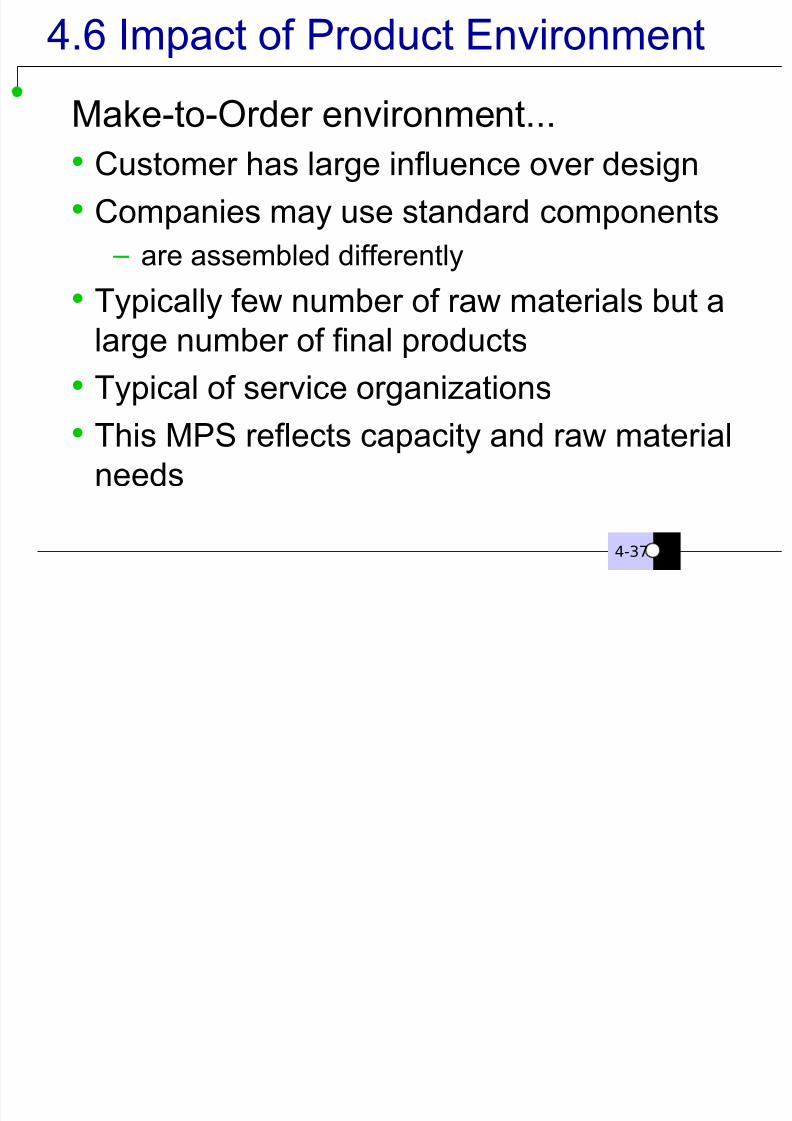
4.6 Impact of Product Environment
Make-to-Order environment... Customer has large influence over design
Companies may use standard components
– are assembled differently
Typically few number of raw materials but a
large number of final products
Typical of service organizations
This MPS reflects capacity and raw material
needs
4 7 G l A h t D l t
8/6/2019 The Master Schedule
http://slidepdf.com/reader/full/the-master-schedule 38/79
V
i s u a
l 4-38
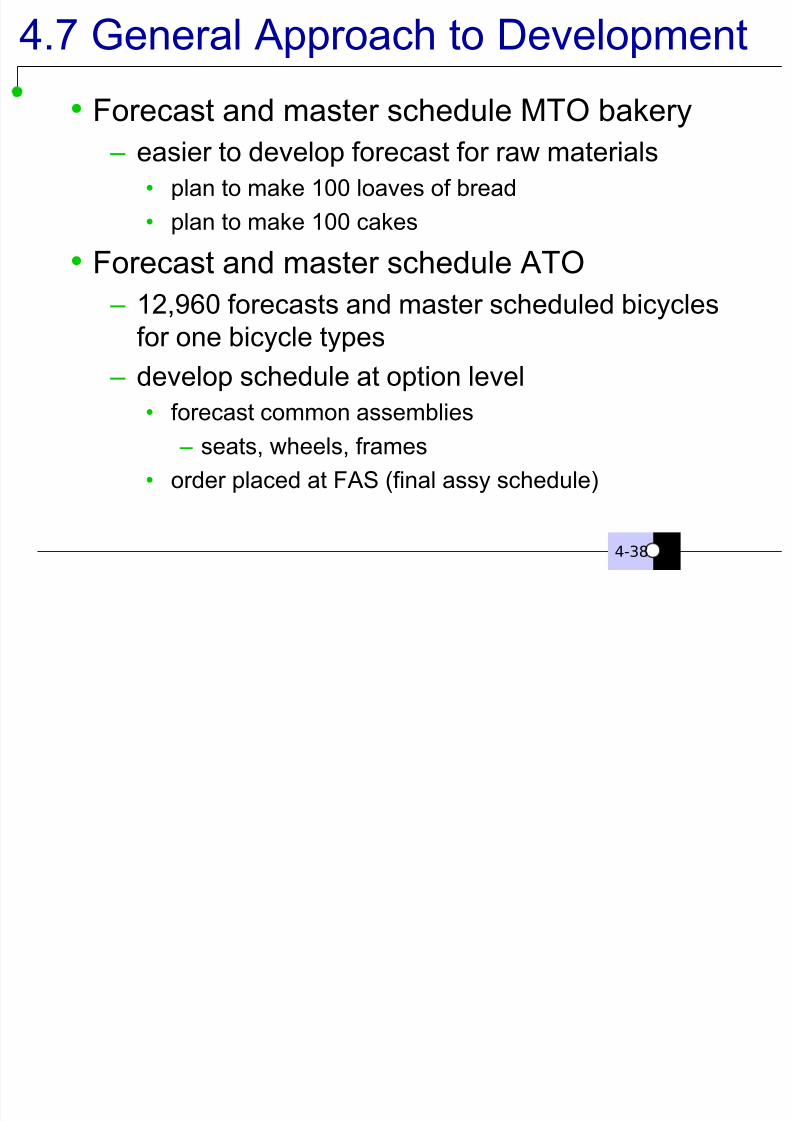
4.7 General Approach to Development
Forecast and master schedule MTO bakery
– easier to develop forecast for raw materials
• plan to make 100 loaves of bread
• plan to make 100 cakes
Forecast and master schedule ATO – 12,960 forecasts and master scheduled bicycles
for one bicycle types
– develop schedule at option level
• forecast common assemblies – seats, wheels, frames
• order placed at FAS (final assy schedule)
4 7 G l A h t D l t
8/6/2019 The Master Schedule
http://slidepdf.com/reader/full/the-master-schedule 39/79
V
i s u a
l 4-39
4.7 General Approach to Development
Figure 4.5 master schedule development
The master schedule is usually designed to
operate at the level that has the fewest
items that need to be scheduled.
4 8 A ailable to Promise Logic
8/6/2019 The Master Schedule
http://slidepdf.com/reader/full/the-master-schedule 40/79
V
i s u a
l 4-40
4.8 Available-to-Promise Logic
Available-to-promise (ATP) allows a firm to
quickly and realistically promise delivery of product to customers
– typically not used in MTS environment
– not used as much in the MTO environment – very valuable in the ATO environment
For any MPS, the ATP is how many items arenot promised to specific customer orders
The Projected Available Balance
8/6/2019 The Master Schedule
http://slidepdf.com/reader/full/the-master-schedule 41/79
V
i s u a
l 4-41
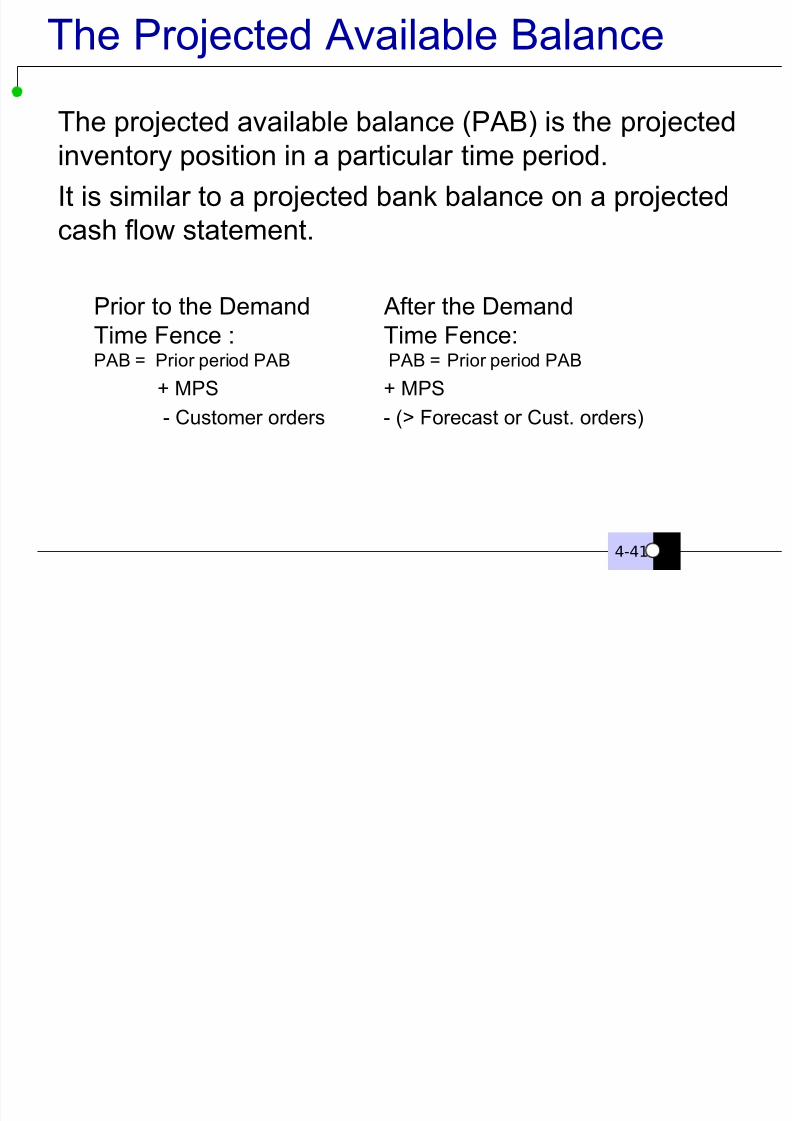
The Projected Available Balance
The projected available balance (PAB) is the projected
inventory position in a particular time period.
It is similar to a projected bank balance on a projected
cash flow statement.
Prior to the Demand After the Demand
Time Fence : Time Fence:PAB = Prior period PAB PAB = Prior period PAB
+ MPS + MPS
- Customer orders - (> Forecast or Cust. orders)
Figure 4 6 ATP

8/6/2019 The Master Schedule
http://slidepdf.com/reader/full/the-master-schedule 42/79
V
i s u a
l 4-42
Figure 4.6 ATP
product: A demand time fence: 2 weeks
lead time: 2 weeks on hand: 56
Lot size: 60
Period 1 2 3 4 5 6 7 8 9 10 11 12Forecast 22 25 20 20 18 18 32 30 28 28 29 35
Customer orders 24 23 17 22 15 14 17 16 12 16 13 11
projected avail. Balance 32 9 49 27 9 51 19 49 21 53 24 59
ATP
MPS 60 60 60 60 60
Figure 4 6 ATP Solution
8/6/2019 The Master Schedule
http://slidepdf.com/reader/full/the-master-schedule 43/79
V
i s u a
l 4-43
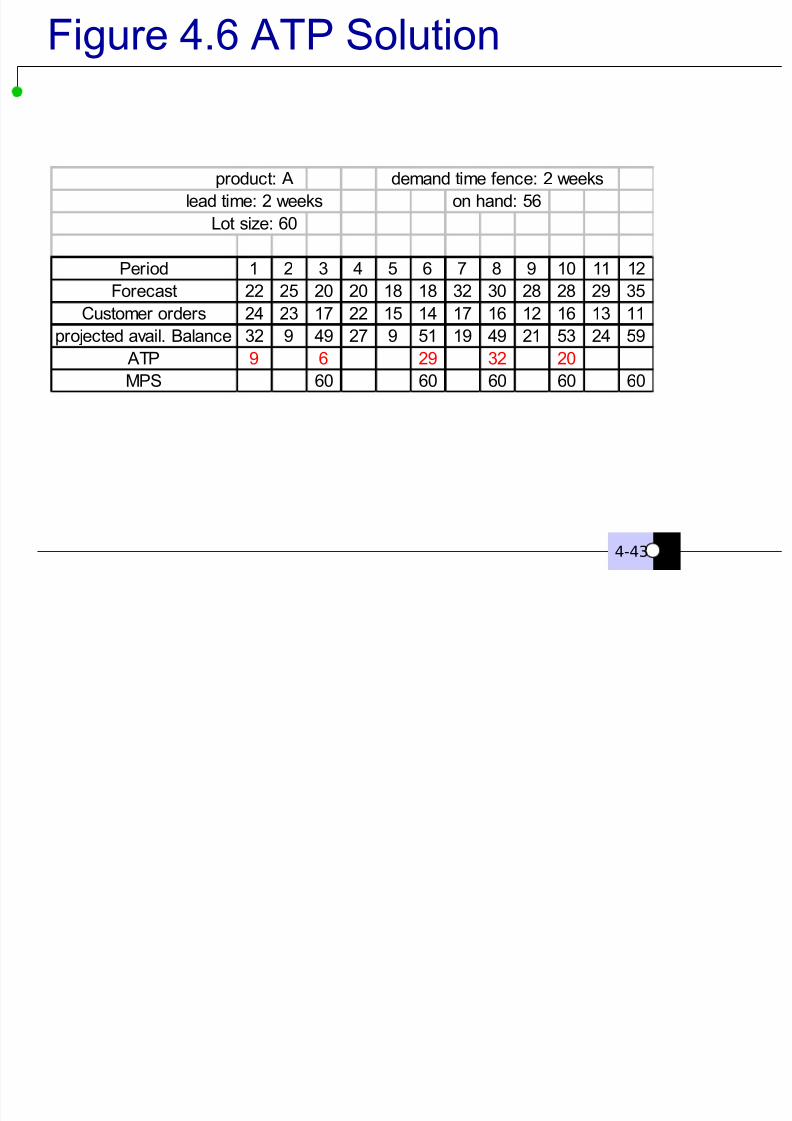
Figure 4.6 ATP Solution
product: A demand time fence: 2 weeks
lead time: 2 weeks on hand: 56
Lot size: 60
Period 1 2 3 4 5 6 7 8 9 10 11 12Forecast 22 25 20 20 18 18 32 30 28 28 29 35
Customer orders 24 23 17 22 15 14 17 16 12 16 13 11
projected avail. Balance 32 9 49 27 9 51 19 49 21 53 24 59
ATP 9 6 29 32 20
MPS 60 60 60 60 60
4 8 Available to Promise (ATP)
8/6/2019 The Master Schedule
http://slidepdf.com/reader/full/the-master-schedule 44/79
V
i s u a
l
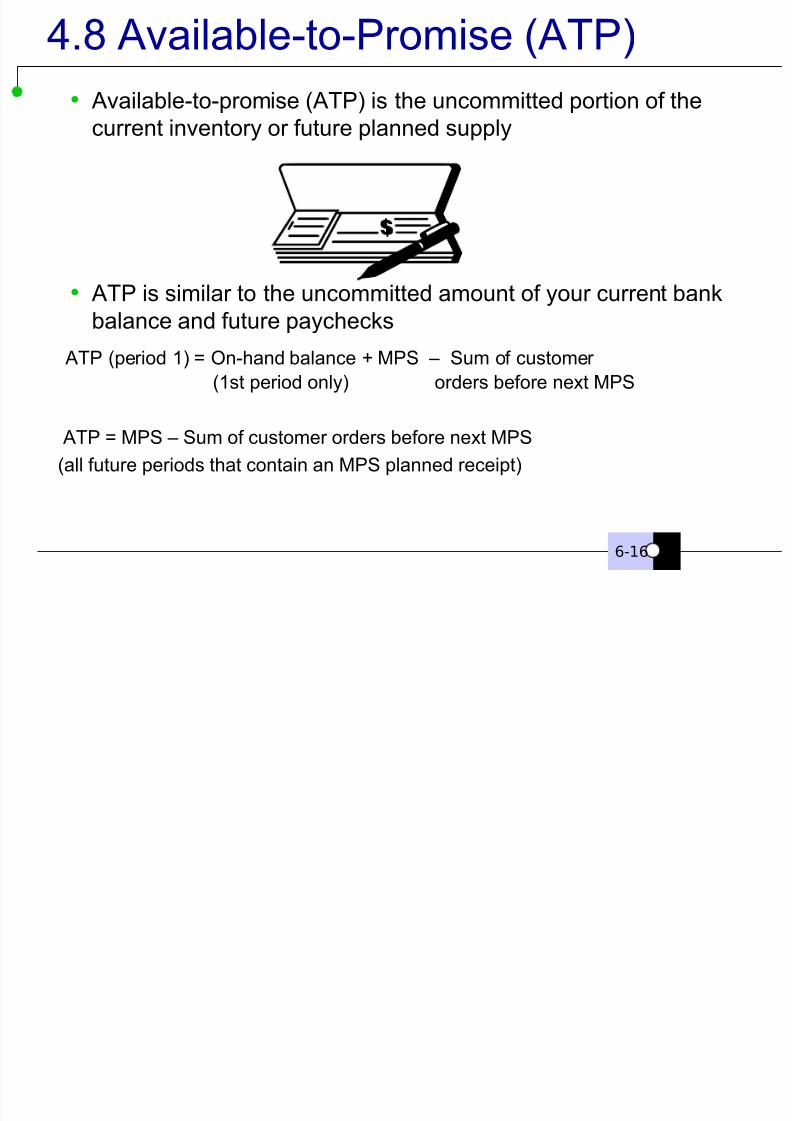
4.8 Available-to-Promise (ATP)
Available-to-promise (ATP) is the uncommitted portion of the
current inventory or future planned supply
ATP is similar to the uncommitted amount of your current bank
balance and future paychecks
ATP (period 1) = On-hand balance + MPS – Sum of customer
(1st period only) orders before next MPS
ATP = MPS – Sum of customer orders before next MPS
(all future periods that contain an MPS planned receipt)
6-16
Available to Promise
8/6/2019 The Master Schedule
http://slidepdf.com/reader/full/the-master-schedule 45/79
V
i s u a
l
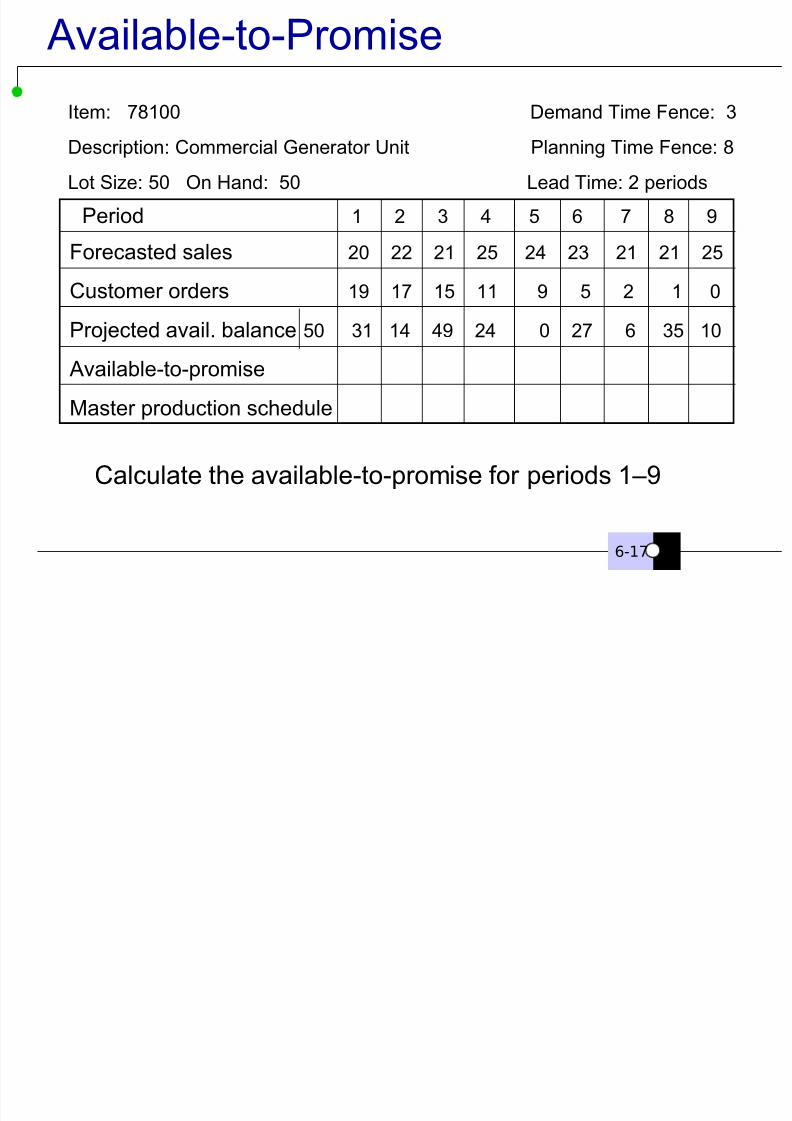
Available-to-Promise
Forecasted sales 20 22 21 25 24 23 21 21 25
Customer orders 19 17 15 11 9 5 2 1 0
Projected avail. balance 50 31 14 49 24 0 27 6 35 10
Available-to-promise
Master production schedule
Item: 78100 Demand Time Fence: 3
Description: Commercial Generator Unit Planning Time Fence: 8
Lot Size: 50 On Hand: 50 Lead Time: 2 periods
Calculate the available-to-promise for periods 1–9
6-17
Period 1 2 3 4 5 6 7 8 9
Available to Promise (Solution)
8/6/2019 The Master Schedule
http://slidepdf.com/reader/full/the-master-schedule 46/79
V
i s u a
l
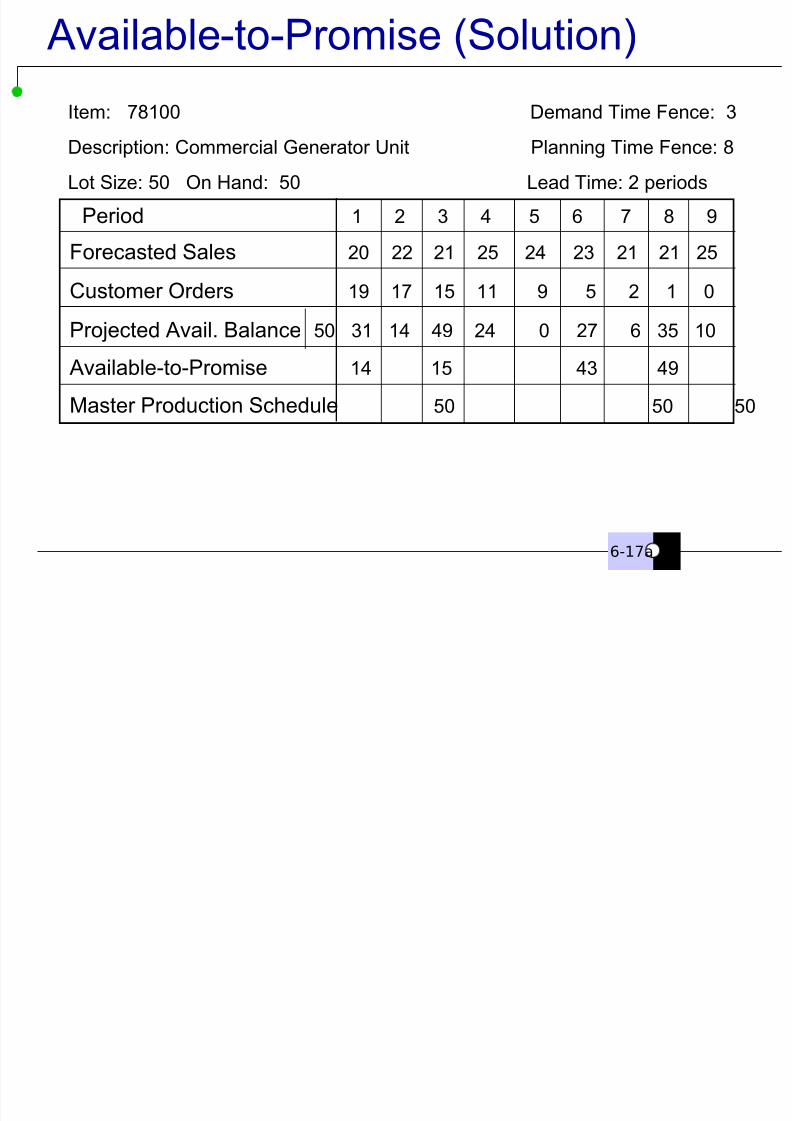
Forecasted Sales 20 22 21 25 24 23 21 21 25
Customer Orders 19 17 15 11 9 5 2 1 0
Projected Avail. Balance 50 31 14 49 24 0 27 6 35 10
Available-to-Promise 14 15 43 49
Master Production Schedule 50 50 50
Item: 78100 Demand Time Fence: 3
Description: Commercial Generator Unit Planning Time Fence: 8
Lot Size: 50 On Hand: 50 Lead Time: 2 periods
Available-to-Promise (Solution)
Period 1 2 3 4 5 6 7 8 9
6-17a
4 8 Available to Promise Logic

8/6/2019 The Master Schedule
http://slidepdf.com/reader/full/the-master-schedule 47/79
V
i s u a
l 4-47
4.8 Available-to-Promise Logic
Key points about ATP…
It is calculated from customer orders, not
from forecasts at any time
– the idea is it shows the availability to promise
a product to customers, not to forecasts ATP provides a valuable tool to
communicate immediately and honestly
with customers
4 9 Planning Options in ATO
8/6/2019 The Master Schedule
http://slidepdf.com/reader/full/the-master-schedule 48/79
V
i s u a
l 4-48
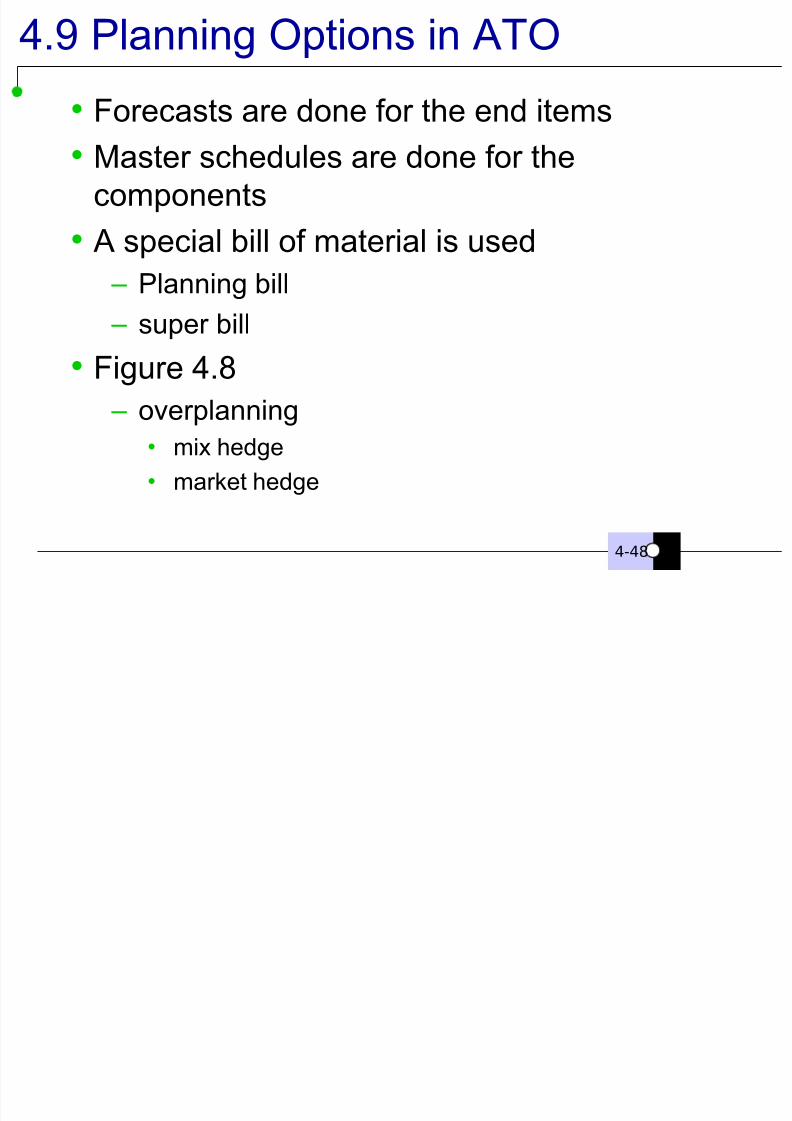
4.9 Planning Options in ATO
Forecasts are done for the end items
Master schedules are done for the
components
A special bill of material is used
– Planning bill
– super bill
Figure 4.8
– overplanning• mix hedge
• market hedge
4 10 The Two Level Master Schedule

8/6/2019 The Master Schedule
http://slidepdf.com/reader/full/the-master-schedule 49/79
V
i s u a
l 4-49
4.10 The Two-Level Master Schedule
Figure 4.9 sample two-level master
schedule
4 11 Master Scheduling Responsibility
8/6/2019 The Master Schedule
http://slidepdf.com/reader/full/the-master-schedule 50/79
V
i s u a
l 4-50
4.11 Master Scheduling Responsibility
Master Scheduler job is high visibility and very
important The master schedule is a major link to the
customer orders
It should reflect policy issues tied to the S&OPsuch as Chase, Level, or Combination
strategies
The MPS reflects the completion of an order
It must be realistic
4 11 Master Scheduling Responsibility
8/6/2019 The Master Schedule
http://slidepdf.com/reader/full/the-master-schedule 51/79
V
i s u a
l 4-51
4.11 Master Scheduling Responsibility
Lot sizes are established
– a tradeoff between carrying costs and customer service
– ordering just what is needed is lot-for-lot
Safety stocks can be planned as an absolute
number or a percentage of orders
– avoid system nervousness
firm planned orders
– orders that are firm planned and no changes to theorder are permitted
• the system may suggest a change
4 12 Demand Management Overview

8/6/2019 The Master Schedule
http://slidepdf.com/reader/full/the-master-schedule 52/79
V
i s u a
l 4-52
4.12 Demand Management Overview
Some demand is internal to the company
– service requirements
– new product prototypes
– quality assurance testing
–internal repairs
– distribution requirements
marketing and sales are flexible
changing capacity
changing human capacity
suppliers, inventory, phased out designs
4 11 Master Scheduling Responsibility
8/6/2019 The Master Schedule
http://slidepdf.com/reader/full/the-master-schedule 53/79
V
i s u a
l 4-53
4.11 Master Scheduling Responsibility
Valuable for what-if scenarios
– evaluate major changes to production volume
or mix change requests
MPS represents a major part of the
planning system for a company – generates production orders
– generates purchase orders
– recommended to be operated by computer control
Types of Supply Orders

8/6/2019 The Master Schedule
http://slidepdf.com/reader/full/the-master-schedule 54/79
V
i s u a
l 4-54
Planned Orders
Firm Planned Orders
Released Orders
Production Orders Purchase Orders
Types of Supply Orders
4 13 Elements of Demand Mgmt

8/6/2019 The Master Schedule
http://slidepdf.com/reader/full/the-master-schedule 55/79
V
i s u a
l 4-55
4.13 Elements of Demand Mgmt.
Four major elements of demand:
prediction
communication
influence prioritization and allocation
4 13 Elements of Demand Mgmt
8/6/2019 The Master Schedule
http://slidepdf.com/reader/full/the-master-schedule 56/79
V
i s u a
l 4-56
4.13 Elements of Demand Mgmt.
Prediction... forecasting customer demand
– different methods may be used
– track the forecast
– lessen the impact of error • communication
• influence
• lead time reduction
• production flexibility• S&OP / Master Schedule policies
• safety stock
4 13 Elements of Demand Mgmt
8/6/2019 The Master Schedule
http://slidepdf.com/reader/full/the-master-schedule 57/79
V
i s u a
l 4-57
4.13 Elements of Demand Mgmt.
Prediction... Set safety stock levels
– must be aligned with customer service levels
set by S&OP
– must be understood by all employees
4 13 Elements of Demand Mgmt
8/6/2019 The Master Schedule
http://slidepdf.com/reader/full/the-master-schedule 58/79
V
i s u a
l 4-58
4.13 Elements of Demand Mgmt.
Prediction... Track and compare actual v. planned
– make adjustments and forecast more
accurately
Bill of Resources
8/6/2019 The Master Schedule
http://slidepdf.com/reader/full/the-master-schedule 59/79
V
i s u a
l 4-59
Bill of Resources
A bill of resources is a listing of the required amount
of constraining resources needed to manufacture
one unit of a selected item or family.
These could include:
– Labor – Materials or components
– Facilities
– Equipment
– Research and development assets – Finances
Master Scheduling Policy
8/6/2019 The Master Schedule
http://slidepdf.com/reader/full/the-master-schedule 60/79
V
i s u a
l 4-60
Master Scheduling Policy
Master scheduling policy
– Describes organizational responsibilities
– Defines approval cycle for the master schedule
– Establishes time fences and change management
procedures
Establishes methods of forecast review
– Establishes methods of forecast relief
– Defines forecast review guidelines
Defines master scheduling techniques – Order promising guidelines
– Make-to-stock, make-to-order strategies
What Is an Effective Schedule?
8/6/2019 The Master Schedule
http://slidepdf.com/reader/full/the-master-schedule 61/79
V
i s u a
l 4-61
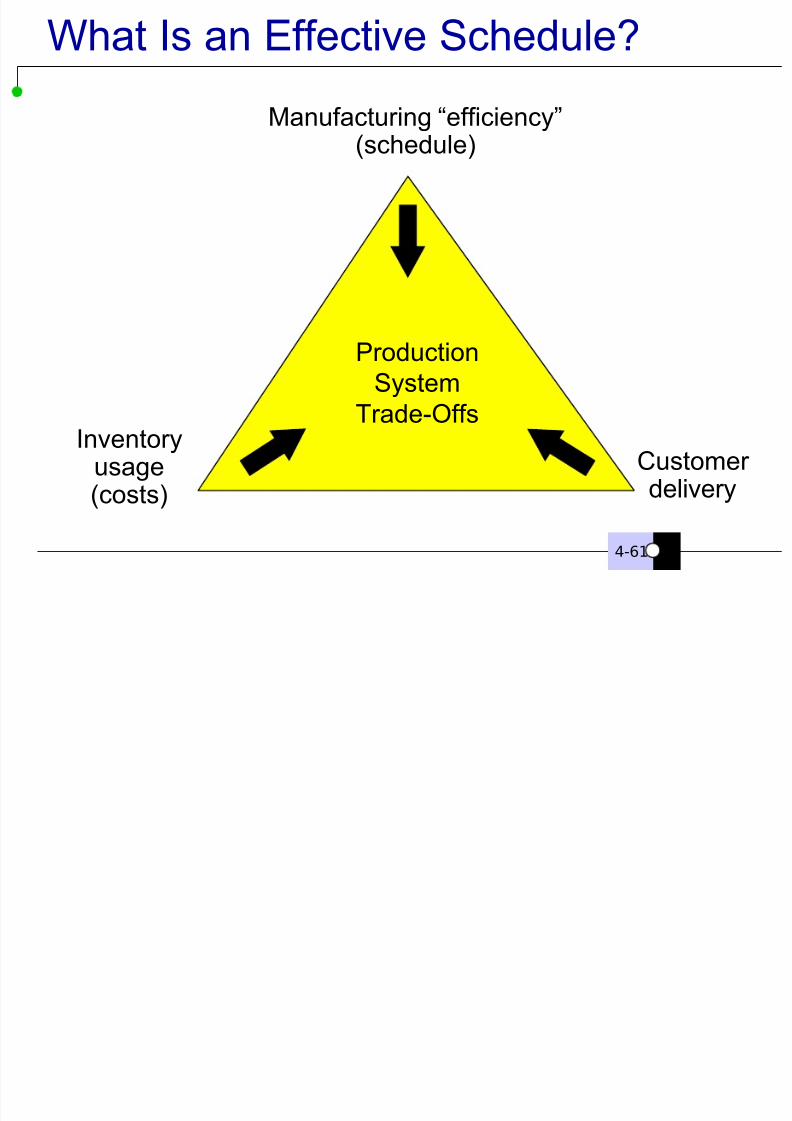
What Is an Effective Schedule?
Production
System
Trade-OffsInventory
usage(costs)
Customer delivery
Manufacturing “efficiency”
(schedule)
The Goals of Master Scheduling

8/6/2019 The Master Schedule
http://slidepdf.com/reader/full/the-master-schedule 62/79
V
i s u a
l 4-62
The Goals of Master Scheduling
To balance supply and demand priorities
To develop practical solutions to supplyconstraints
To prioritize and allocate supply to customer
demands To establish a strategy to avoid overloaded
schedules and unbalanced conditions
To create a schedule with attainable completion
dates that satisfy customer needs
Master Scheduler Functions
8/6/2019 The Master Schedule
http://slidepdf.com/reader/full/the-master-schedule 63/79
V i
s u a
l 6-32
Master Scheduler Functions
Understand the forecasting approach and its limitations
Participate in the development of the sales and
operations plan
Manage the constraints of supply capacity
Maintain a realistic master schedule
Monitor consistency with the sales and operations plan
Execute master schedule policies, such as time fences,
safety stocks, subcontracting, and lot-sizing
Identify, negotiate, and resolve conflicts
Master Scheduler Job Qualifications

8/6/2019 The Master Schedule
http://slidepdf.com/reader/full/the-master-schedule 64/79
V i
s u a
l 6-33
Master Scheduler Job Qualifications Experienced with products and customers
A good communicator
Good with numbers
Cool under pressure
Disciplined—maintains data accuracy
Assertive—makes things happen A problem solver rather than a firefighter
Creative—finds innovative ways to balance supply and
demand
Genuinely interested in products and customer service
Who Brings What to the Table?
8/6/2019 The Master Schedule
http://slidepdf.com/reader/full/the-master-schedule 65/79
V i
s u a
l 4-65
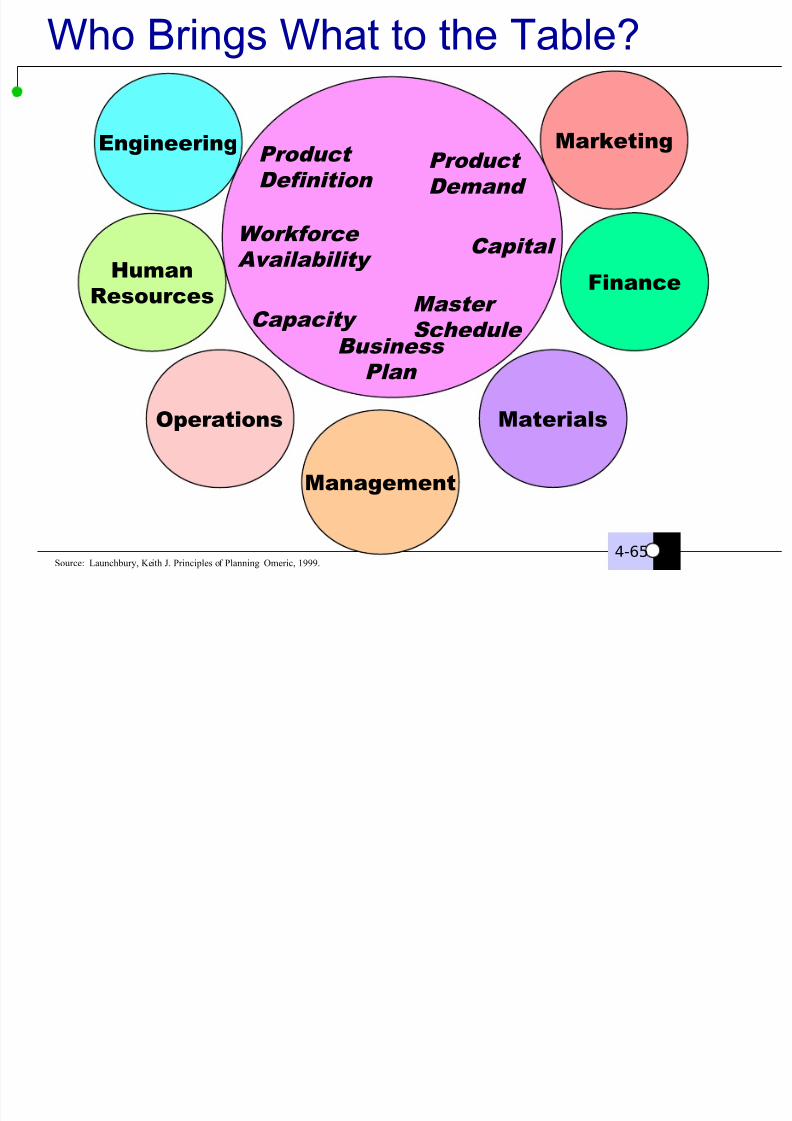
Who Brings What to the Table?
MarketingProduct
Definition Product
Demand
Capital
Master
Schedule Business
Plan
Workforce
Availability
Source: Launchbury, Keith J. Principles of Planning Omeric, 1999.
Finance
MaterialsOperations
HumanResources
Engineering
Management
Capacity
Symptoms of Poor Master Schedules
8/6/2019 The Master Schedule
http://slidepdf.com/reader/full/the-master-schedule 66/79
V i
s u a
l 4-66
Symptoms of Poor Master Schedules
Unreliable delivery promises
Persistent past due orders
Excess inventory
Expediting selected orders
Excessive schedule changes Upper management scheduling
intervention
Excessive overtime or idle time
End of month shipping surge Lack of accountability
MPS Performance Measurements
8/6/2019 The Master Schedule
http://slidepdf.com/reader/full/the-master-schedule 67/79
V i
s u a
l 4-67
MPS Performance Measurements Customer service
Inventory turns
Schedule reliability
Respect for time fences
Excess and slow moving inventory
Level of backlog Lead time reduction
Cycle time reduction
Credibility of promise information
Keeping the MPS Realistic

8/6/2019 The Master Schedule
http://slidepdf.com/reader/full/the-master-schedule 68/79
V i
s u a
l 4-68
Keeping the MPS Realistic
Adapting the MPS to changing demand
conditions
Adapting the MPS to changing supply
conditions
Rescheduling
Bottom-up replanning and pegging
Testing for feasibility Regular review and revisions
Common Changes in Demand
8/6/2019 The Master Schedule
http://slidepdf.com/reader/full/the-master-schedule 69/79
V i
s u a
l 4-69
Common Changes in Demand
Customer schedule changes
Rush orders
Order cancellations
Changes to specifications
Common Changes in Supply
8/6/2019 The Master Schedule
http://slidepdf.com/reader/full/the-master-schedule 70/79
V i
s u a
l 4-70
Common Changes in Supply
Nonconformance to schedule
– Production downtime
– Capacity availability
– Over- or undersupply
Nonconformance to specifications
– Scrap
– Effect of quality
Engineering Changes

8/6/2019 The Master Schedule
http://slidepdf.com/reader/full/the-master-schedule 71/79
V i
s u a
l 4-71
g ee g C a ges
Mandatory or immediate
Phased-in or optional
Process
– Set up a review board
– Determine the procedure for instituting change – Set effective dates
– Ensure change process deals with multiple items
– Assess the cost and impact of the change
– Maintain the status for each revision
Managing Change

8/6/2019 The Master Schedule
http://slidepdf.com/reader/full/the-master-schedule 72/79
V i
s u a
l 4-72
g g g
Is the change
necessary?
Is the change
feasible?
Are resourcesavailable?
What are the costs
and the risks?
The S&OP and the Master Schedule
8/6/2019 The Master Schedule
http://slidepdf.com/reader/full/the-master-schedule 73/79
V i
s u a
l 4-73
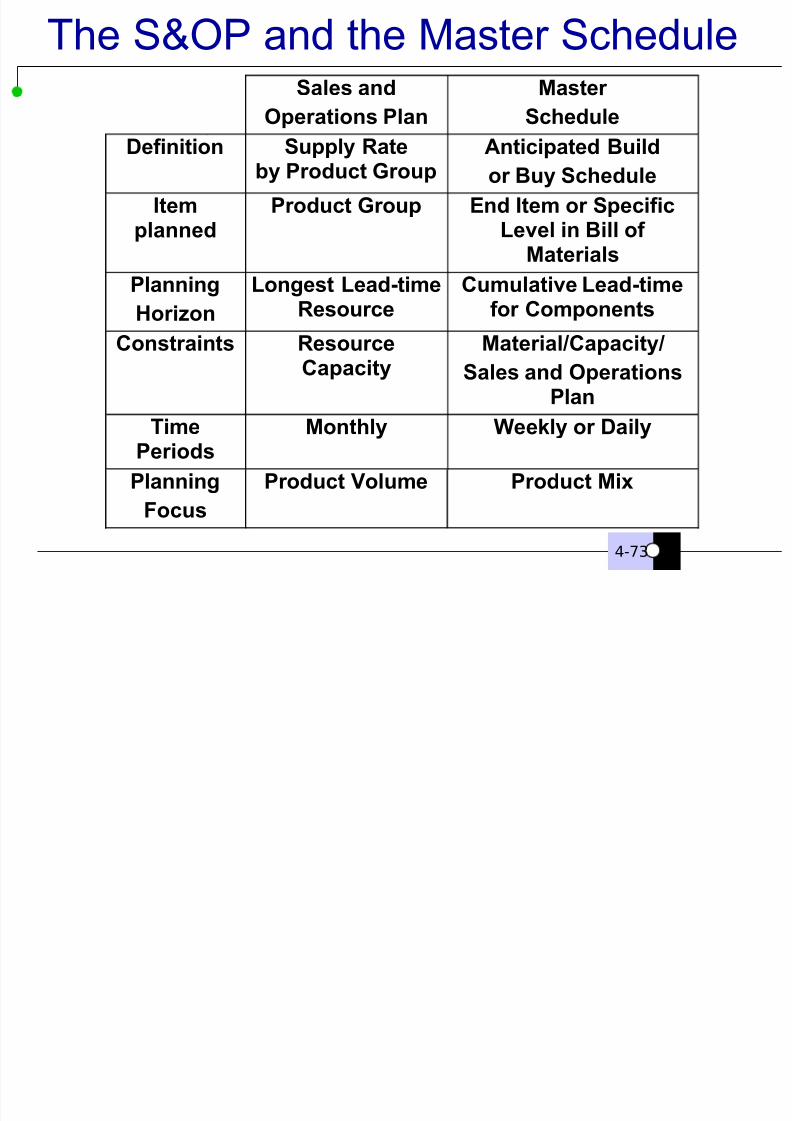
Sales and
Operations Plan
Master
Schedule
Definition Supply Rateby Product Group
Anticipated Buildor Buy Schedule
Itemplanned
Product Group End Item or SpecificLevel in Bill of
Materials
PlanningHorizon
Longest Lead-timeResource
Cumulative Lead-timefor Components
Constraints ResourceCapacity
Material/Capacity/
Sales and OperationsPlan
TimePeriods
Monthly Weekly or Daily
Planning
Focus
Product Volume Product Mix
Uses of the Master Schedule

8/6/2019 The Master Schedule
http://slidepdf.com/reader/full/the-master-schedule 74/79
V i
s u a
l 4-74
The anticipated build or buy schedule
For independent demand items
Projects inventory/backlog position
Drives material and capacity plans Order promising
Assigning priorities
NOT a sales forecast!
The Inputs to the Master Schedule
8/6/2019 The Master Schedule
http://slidepdf.com/reader/full/the-master-schedule 75/79
V i
s u a
l 4-75
p
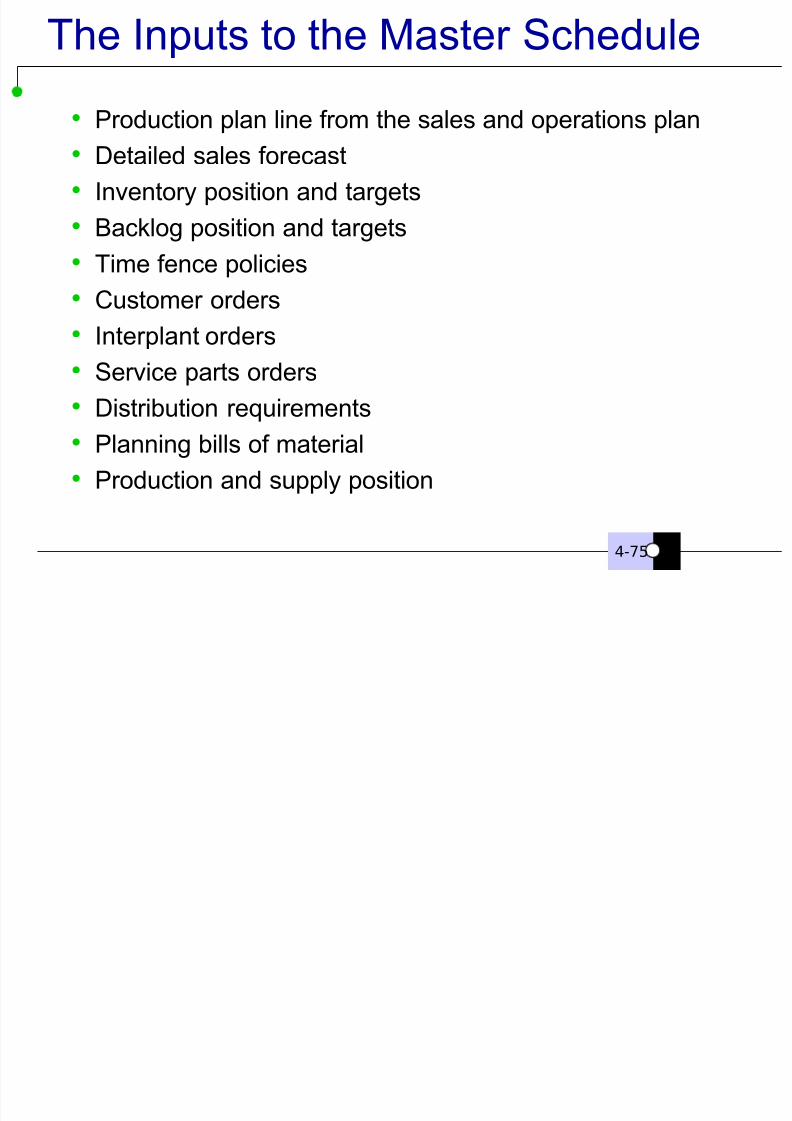
Production plan line from the sales and operations plan
Detailed sales forecast Inventory position and targets
Backlog position and targets
Time fence policies
Customer orders
Interplant orders
Service parts orders
Distribution requirements Planning bills of material
Production and supply position
The Outputs from the Master Schedule

8/6/2019 The Master Schedule
http://slidepdf.com/reader/full/the-master-schedule 76/79
V i
s u a
l 4-76
p
Master production schedule
Master purchasing schedule
Projected inventory position
Projected backlog position Product availability information
Valuable order promising information
Possible Solutions
8/6/2019 The Master Schedule
http://slidepdf.com/reader/full/the-master-schedule 77/79
V i s
u a
l
Overloading
Overtime Extra shifts
Transfer people Reroute work Subcontract Hire temporary help Install more equipment Add additional capacity
7-23
Possible Solutions
8/6/2019 The Master Schedule
http://slidepdf.com/reader/full/the-master-schedule 78/79
V i s
u a
l
Underloading
Increase sales demand Use time for training
Use time for maintenance Reduce shifts Transfer people Reroute work
Reduce subcontracting Lay off temporary help Reduce capacity
7-24
Chapter 4 Homework

8/6/2019 The Master Schedule
http://slidepdf.com/reader/full/the-master-schedule 79/79
p
Problem 5