Embed Size (px)
Citation preview

The Marketing Engineering Approach
GARY L. LLIEN Pennsylvania State Universify
1 Pennsylvania State University
arketing managers make ongoing decisions about product features, prices, distribution options, sales
compensation plans, and so on. In making these decisions, managers choose from among alter- native courses of action in a complex and uncertain world. Like all decisions that people make, marketing decision making involves judgment calls. Most traditional marketing decision making, while sometimes guided by the concepts of our literature, has been largely based on managers' mentaI models, intuition, and experience.
In many cases, such mental models, perhaps backed up by market research data, may be all that managers need to feel psycho- logically comfortable with their decisions. Yet, mental models are prone to systematic errors (Bazeman. 1998). While we all recognize the
AUTHORS'NOTE: Portions of this chapter are drawn from 1
value of experience, that experience is unique to every person and can be confounded with responsibility bias: Sales managers might choose lower advertising budgets in favor of .,
higher expenditures on personal selling, while advertising managers might prefer larger adver- tising budgets.
Consider an alternative approach to the men- tal model for a decision involving setting adver- tising expenditures: Managers might choose to build a spreadsheet decision model of how the market would respond to various expenditure levels. They could then use this model to explore the sales and profit consequences of alternative : expenditure levels before making a decision. The systematic translation of data and knowledge (including judgment) into a tool that is used for decision support is what we call marketing engi- neering. In contrast, relying solely on the mental
Lilien and Ranpswarny (2004) and are used with permission. i

Marketing Decision Support Models 231
mode] of the particular decision maker without using any support system is what we refer to as conceptual marketing. A third option would be to automate the decision process. For example, coverSto~ (Schmitz, Armstong, & Little, 1990) automatically analyzes scanner data. If a mar- keter would directly follow Coverstory's recom- mendation~, we would calI this automated marketing. Bucklin, Lehman, and Little (1998) foresee considerable opportunities for the com- puter taking over many of the traditionally human tasks associated with marketing deci- sions. However, given the intrinsic complexity of marketing problems (many instwments; a large number of environmental factors, including competition; and substantial uncertainty in each of these factors), for many marketing decisions, a combination of marketing support tools and the judgment of the decision maker provide the best results. We call approaches that systematically combine judgment with formal models as the marketing engineering (ME) approach. More specifically, we define ME as a systematic approach to harness data and knowledge to drive marketing decision making and implementation through a technology-enabled and model- supported interactive decision process.
The ME approach relies on the design and construction of decision models and implement- ing such decision models within organizations in the form of marketing management support systems (MMSSs). In this chapter, we focus pri- marily on describing the marketing engineering approach and its potential benefits, as well as illustrating how some leading companies use ME. Specifically, we (a) summarize the major trends shaping the environment for marketing decision making; (b) outline the benefits associ- ated with the ME approach; (c) provide an overview of the ME approach, focusing particu- 1 ~ 1 ~ on describing various market response nlodels that form the core of marketing models; (dl offer managerial suggestions for implement- ing ME; and (e) sketch future developments regarding ME deployment and use. Chapter 3 1 by Van Bruggen and Wierenga in this book pro- vides a broad perspective on the various types of MMSSS (ranging from optimization-focused systems to creativity enhancement systems) and explores the success factors associated with MMSS.
Although there have been attempts to employ aspects of NIE in organizations since the 1950s, the pace has accelerated in the past decade because of the range of technologies that have made the approach not only feasible but, increasingly, an imperative in competilive markets. Past attempts to engineer marketing generaIly Ied only to short-lived successes, not because of poor models but generally because of the lack of technology to embed that success in the fiber of the organization. Within the past decade, technology has advanced to a stage where it now makes it possible for model-based decision making to be an integral part of the repertoire of skills of the marketing manager.
For several decades, researchers and prac- titioners have developed and implemented pow- erful systems that facilitate decision making in real-world marketing settings (for case stud- ies and examples, see Assad, WasiI, & Lilien, 1992; Lilien, Kotler, & Moorthy, 1992; Little, 1970; Wierenga & Van Bruggen, 2000). Yet, until recently, much of the knowledge about marketing decision models resided primarily in specialized academic journals or required con- siderable technical expertise to use, thus making it available only with the help of specialized consi~ltants. Major changes began with the development of stand-alone models to support marketing analytics, embedded within the hundreds of commercially available canned software packages. With the advent of enter- prise-wide systems for resource planning (ERP) and customer relationship management (CRM), marketing analytics have increasingly become an integrated aspect of the decision-making architectures that leading firms employ. As an indication, an IDC report in 2005 projected annual growth of 4.5% in marketing automation applications for the years 2004-2009 (IDC, 2005).
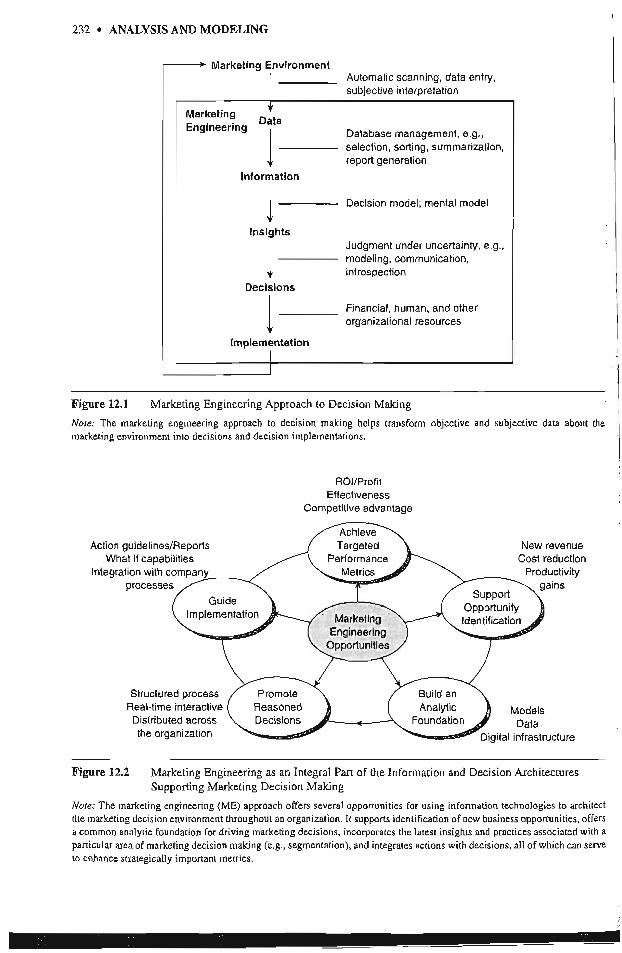
Figure 12.1 shows how the ME approach transforms objective and subjective data about the marketing environment into insights, deci- sions, and actions. Figure 12.2 sketches how ME can become an integral part of the infor- mation and decision architechrres supporting marketing decision making.
232 ANALYSIS AND MODELING
Marketing Environment Automatic scanning, data entry, subjecttve interpretation
Marketing + Engineering
Dale
I Database management, e-g., selection, sorting, summarization, report generation
information
I Declsion model; mental model
Ins ights
I Judgment under uncertainly, e.g., modeling, communication, introspection
Decisions
I Financial, human, and other organizalional resources
fmplementation
Figure 12.1 Marketing Engineering Approach to Decision Making
Note: The marketing engineering appmach to decision making helps transCorm objective and subjecilve data about he maketing envirol~ment inlo decisions and decision implementations.
ROllProfil Effectlveness
Competlllve advantage
Action guidelines/Reports New revenue What If capabilities Cost reduction
Structured process Real-lime interactive Distributed across the organization
Figure 12.2 Marketing Engineering as an Integral Pan of the Information and Decision Architectures Supporting Marketing Decision Making
Nore: The marketing engineering (ME) approach offers several opportunities for using information technologies Lo architcct the marketing decision environment throughout an organizalion. It supports identification of new business opportunities. offers a common analytic foundation for driving marketing decisions, incorporates the larest insighu and practices associated with a panicular area of marketing decision making (e.g., segmentation), and integrates actions with decisions, all of which can serve a enhance strategically important melrics.

Marketing Decision Support Models 0 233
Table 12.1 Degree of Correlation With the True Outcomes of Three Types of Models, Showing That Even Subjective Decision Models Are Superior to Mental Models but That Formal, Objective Models Do Far Better
Subjective Objective
npes of Judg~nents Experts Had to Make Menial ModeP Decision Moclelb Decision Modelc
Academic performance of graduate students Life expectancy of cancer patients Changes in stock prices Mental iuness using personality tests Grades and attitudes in psychology course Business failures Wing financial ratios Students' ratings of teaching effectiveness performance of life insurance salesman IQ scores using Ro~xchach tests
Mean (across many studies) .33 .39 .64
So~rrce: Russo and Shoemaker (1989, p. 137).
a. Outcomes directly predicted by expens. b. Subjective decision model: outcomes predicted by subjective h e a r regression model, formalizing past predictions made by
experts. c. Objective decision model: linear model developed directly from data.
Although marketing engineering could encompass all the elements shown in Figures 12.1 and 12.2, in this chapter, we focus more narrowly on how marketing engineering helps transform data, information, and insights into decisions. This aspect has traditionally been the realm of marketing academia, and it continues to be the core component where academic contributions have the potential to improve both theory and practice.
Several trends, both on the supply side and demand side, favor the wider acceptance of the marketing engineering approach:
I . High-powered personal computers connected to networks are everywhere.
2. The volume of data is exploding.
3. Firms are reengineering marketing such that marketing managers are increasingly dealing directly with market information and using computers to do tasks that were once done by staff support people.
4. Marketing is being held to higher standards of accountability.
Marketing engineering is a way to capitalize 0" the above trends that favor both the supply
and demand for marketing analytics. ME enables us to capture the essence of marketing problems in well-specified models, and it improves our ability to make decisions that influence market outcomes. For example, with the large number of installations of Microsoft Excel (about 300 million users in 2005), Java applets, and other software components, companies can easily inte- grate ME into their information and decision archtecture. That integration will increase man- agers' ability to gather, process, and share infor- mation and to apply marketing models at the point of decision making.
Next, we briefly outline the potential benefits that firms gain by adopting and using marketing analytics. At the outset, note that the mere avail- ability, or the use, of marketing analylics need not necessarily significantly affect managerial or organizational performance; it is far more important to make analytics a p a t of the com- pany's basic capability in managerial decision making. In Table 12.1, we present summaries of studies that have evaluated the impact of models in improving managers' prediction accuracy in various decision contexts.
Consider the first row of Table 12.1, where the formalized intuition of experts captured in a simple linear model outperforms the experts

234 0 ANALYSIS AND MODELING
themselves. Accuracy here improved from 19% correlation between direct expert judgments of student performance to 25% correlation using a linear, descriptive model relating past judg- ments to the data available to make those judg- ments. An explanation for this improvement is that the decision model more consistently applies the expertise of the experts to new cases.
The third column in Table 12.1 lists the accuracy of an "objective" linear regression model. For the academic performance study, the independent variables for the regression model were the same factors used by the experts, but the dependent variable was a known measure of the academic performance of the graduate students. The predictions in this case were based on a holdout sample of data to which the objec- tive model was applied. For this model, the cor- relation of predictions with true outcomes was 54%. Table 12.1 also shows the average correla- tions between predictions and true outcomes across several studies. We see that subjective decision models had an average correlation of 39% with true outcomes as compared to 33% for the intuitive mental models
These results point to a few interesting conclusions: (a) When managers can build an objective model based on actual data, they will generally predict the best. However, in many decision situations, we do not have data that show the accuracy or the consequences of past decisions made in the same context. In such cases, the next best option is to codify the men- tal model that decision makers use into a formal decision model. The calibrating of response models using the decision calculus method (Little, 1970) is a way to formalize the mental models of decision makers. (b) Among these three types of models, the least accurate is the mental model. However, on average, all three types of models had a positive correlation with the truth, while a model with random pre- dictions would have zero con-elation with the truth. (c) Managers should focus their attention on finding variables useful for prediction but should use decision models to combine the variables in a consistent fashion.
Managers recognize that models are incom- plete, and therefore, they correctly believe that model results cannot be implemented without being modified by judgments. If model results
are to be tempered by intuitive judgments, why not rely on judgments in the first place? The latter conclusion, however, does not follow j from the first. As Hogarth (1987) notes, "When driving at night with your headlights on you do not necessarily see too well. However, turning your headlights off will not improve the situa- tion" (p. 199).
Decision support tools and mental models should be used in conjunction, so that each works to strengthen the areas where the other is weak. Mental models can incorporate idiosyncratic aspects of a decision situation, but they also over- fit new cases to old patterns. On the other hand, decision models are consistent and unbiased but underweight idiosyncratic aspects. In a forecast- ing task, Blattberg and Hoch (1990) found that predictive accuracy could be improved by com- bining the forecasts generated by decision models with forecasts from mental models. Furthermore, they reported that a 50-50 (equal weighting) combination of these two forecasts provided the highest predictive accuracy.
Marketing engineering can be both data driven and knowledge driven. A data-driven support tool can answer "what-if' questions, based on a quantified market response model. A knowledge- driven decision support tool captures the qualita-. tive knowledge that is available about a particular domain. An example is the ADCAD expert sys- tem for advertising design (Burke, Rangaswamy, Wind, & Eliashberg, 1990). Other knowledge- driven decision support technologies reIevant for marketing include case-based reasoning, neural networks, and creativity support systems (see Wierenga & Van Bruggen, 2000).
There are other benefits to the marketing engineering approach. Managers using this approach could explore more decision options, consider decision options that are farther away from "historical norms,'' more precisely assess the relative impact of different marketing deci- sion variables, facilitate group decision making, and enhance their own subjective mentaI models of market behavior. In essence, the marketing engineering approach can lead to better and more systematic marketing decision making.
Several weI1-documented examples have demonstrated that companies can derive sub- stantial benefits from the application of the marketing engineering approach to decision

Marlceti~~g Decision Support Modek 235
making: see ABB Electric (Gensch, Aversa, & Moore, 1990), Marriott Corporation (Wind, Green, ShiKlet, & Scarbrough, 1989), Syntex Laboratories (Lodish. Curtis, Ness, 8r Simpson, ]988), The German Railroad Corp. (Dolan & Simon, 1996), and Rhenania (Elsner, Krafft, & ~uchzermeier, 2004).
Each of the above examples involves a complex and unstructured decision problem, a model, some data, managerial judgment, and a successful, profitable outcome for the firm. Staelin (1999) and Lilien and Rangaswamy (2001) provide many additional examples in areas such as sales promotion planning, movie scheduling, industrial product line development. sales force management, product design, and forecasting new product diffusion.
The wide availability of spreadsheet software, such as Excel, has made it easier to work with mathematical representations of marketing phe- nomena. For example, marketing spreadsheets typically include planned marketing expendi- @res and the associated gross and net revenues. However, in most cases, the model developer does not establish a relationship, within the spreadsheet, between marketing inputs (e.g., advertising) and sales revenues. Thus, market- ing inputs only affect net revenue as a cost item. We refer to such spreadsheets as "dumb" models. They make little sense as marketing models because they we silent about the nature of the relationship between marketing inputs and outputs. For the spreadsheet model to make sense, the model developer must define objec- fives and variables explicitly and specify the relationships between variables. In a "smart" model, an equation or "response modeI" will be embedded in the spreadsheet. The manager Can then look at the effect of advertising on both sales and revenues to see i f increases or decreases in advertising can be justified. Hence, the design environment (knowledge, software, and data) facilitates marketing engineering. : h this section, we explore the nature of
m'vket response models, which provide the basic 'Ools for marketing analytics (i.e., the ingredients
chat can transform a dumb spreadsheet model into a smart model). Response models are critical for systematically addressing many recurring strategic and tactical decision problems in marketing, such as marketing budgeting and mix allocations, customer targeting, and product/ company positioning. Without models that describe how customers and markets might respond to various marketing actions, it is very difficult to fully assess the opportunity costs of the decision at hand. Marketing Engineering &&en & Rangaswamy, 2004) provides addi- tional details about how response models are integrated into various marketing decision models. That book also includes an extensive set of software tools to gain a hands-on learning of these models.
Market response models require that the following be made explicit:
Inputs: The marketing actions that the marketer can control, such as price, advertising, selling effort, and h e like-the so-called marketing mix-as well as noncontroIlable variables, such as the market size, competitive environment, and the like
Respome n~odel: The linkage from those inputs to the measurable outputs of concern to the firm (customer awareness levels, product perceptions, sales Levels, and profits)
Objec~ives: The measure that the firm uses for monitoring and evaluating those actions (e.g., the level of sales in response to a promotion, the per- centage of a target audience that recalls an ad)
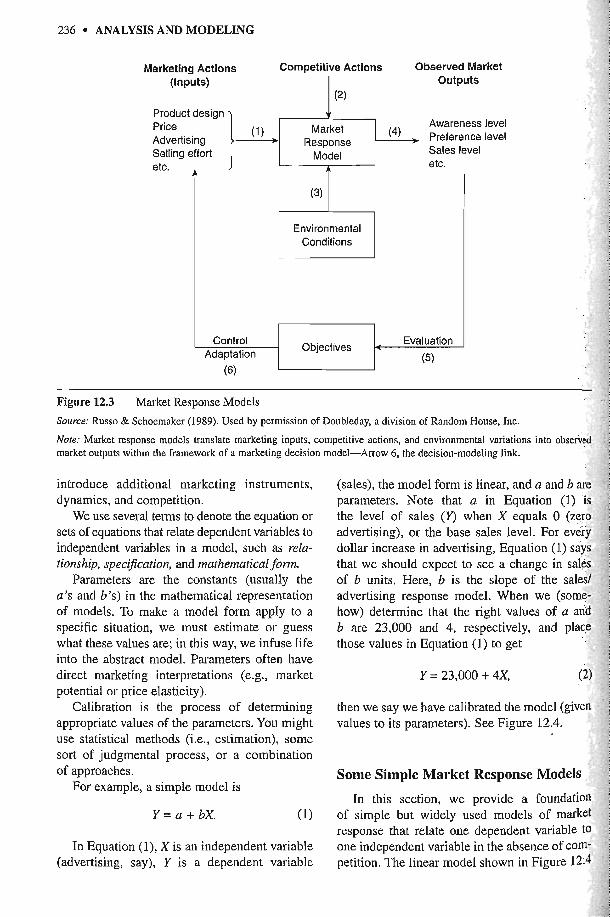
Response models function within the frame- work of marketing decision models (Figure 12.3). A firm's marketing actions (Arrow 1) along with the actions of competitors (Arrow 2) and environ- mental conditions (Arrow 3) combine to drive the market response, leading to key outputs (Arrow 4). Those outputs are evaluated relative to the objectives of the firm (Arrow 5) , and the lirm then adapts or changes its marketing actions depending on how well it is doing (Arrow 6)-the decision-modeIing link.
In this chapter, we will focus hrst on the simplest of the model types: aggregate response to a single marketing instrument in a static, noncompetitive environment. Then we will
236 ANALYSIS AND MODELING
(2)
Market 13 Resplnse Model (4)
A
(3)
Environmental Conditions
Marketing Actions Competitive Actions Observed Market
, Figure 12.3 Market Response Models
Source: Russo & Schoernaker (1989). Used by permission of Doubleday, a division of Random House, Inc.
(Inputs)
Product design -
Note: Market response models translate marketing inputs, cornpelitive actions, and environmental variations into observed r market outputs withrn the Framework of a marketing decision model-Arrow 6, the decision-modeling link.
Outputs
. .
Price Advertising Selling effort
introduce additional marketing instruments, dynamics, and competition.
We use several terms to denote the equation or sets of equations that relate dependent variables to independent variables in a model, such as rela- tionship, speci$cntion, and mathematical form.
Parameters are the constants (usually the a's and b's) in the mathematical representation of models. To make a model form apply to a specific situation, we must estimate or guess what these values are; in this way, we infuse life into the abstract model. Parameters often have direct nlarketing interpretations (e.g., market potential or price elasticity).
Calibration is the process of determining appropriate values of the parameters. You might use statistical methods (i.e., estimation), some sort of judgmental process, or a combination of approaches.
For example, a simple model is
Awareness level Preference level Sales level
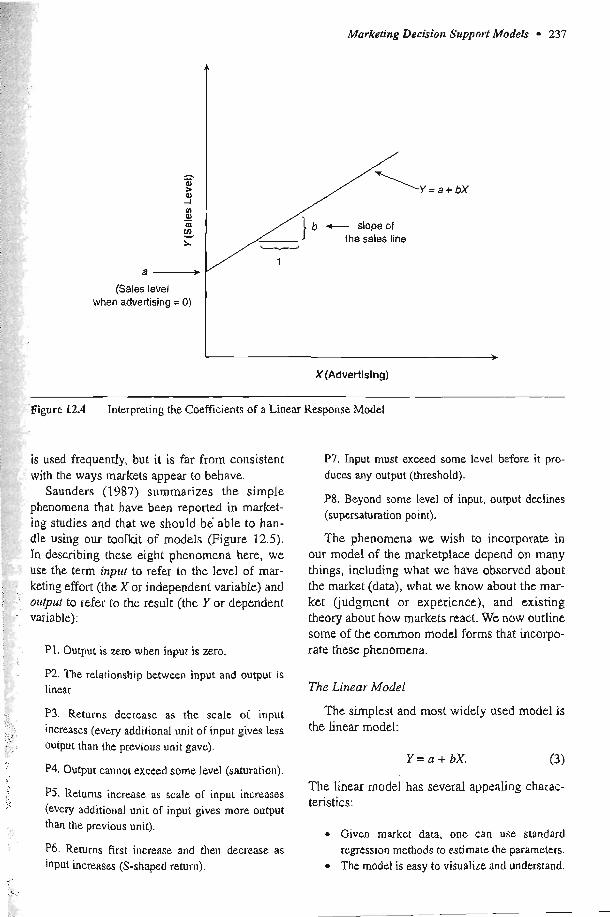
In Equation (I), Xis an independent variable (advertising, say), Y is a dependent variable
(sales), the model form is linear, and a and b are parameters. Note that a in Equation (I) is the level of sales (Y) when X equals 0 (zero advertising), or the base sales level. For every dollar increase in advertising, Equation (1) says that we should expect to see a change in sales of b units. Here, b is the slope of the sales/ advertising response model. When we (some- how) determine that the right values of a and b are 23,000 and 4, respectively, and place those values in Equation (1) to get
etc. etc.
then we say we have caIi brated the model (given values to its parameters). See Figure 12.4.
Control Adaptation
Some Simple Market Response Models
In this section, we provide a foundation of simple but widely used models of market response that relate one dependent variable to one independent variable in the absence of com- petition. The linear model shown in Figure 12;4
(6)
Object~ves 4 Evaluation
(5)
Marketing Decisiort Support Models 237
(Sales level when advertising = 0)
I b
X (Advertlsing)
"Figure 12.4 Interpreting the Coeff~cients of a Linear Response Model
is used frequently, but it is far from consistent with the ways markets appear to behave.
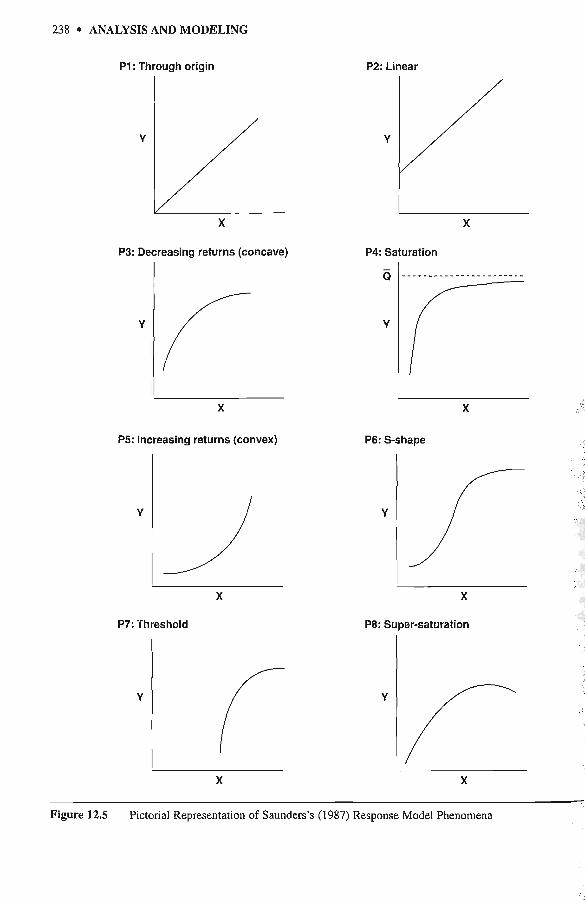
Saunders ('L987) summarizes the simple phenomena that have been reported in market- ing studies and that we should b e able to han- dle using our t o o k t of models (Figure 12.5). In describing these eight phenomena here, we use the term input to refer to the level of mar- keting effort (the X or independent variable) and otctpul to refer to the result (the Y or dependent variable):
P 1. Output i s zem when input is zero.
P2. The relationship between input and output is linear.
P3. Returns decrease as the scale of input increases (every additional unit of input gives less output than the previous unit gave).
P4. Output cannot exceed some level (saturation).
PS. Returns increase as scak of input increases (every additional unit of input gives more output than the previous unit).
P6. Returns first increase and then decrease as input increases (S-shaped return).
P7. Input must exceed some level before it pro- duces any output (threshold).
P8. Beyond some level of input, output declines (supersabration point).
The phenomena we wish to incorporate in our model of the marketplace depend on many things, including what we have observed about the rnaxket (data), what we know about the mar- ket (judgment or experience), and existing theory about how markets react. We now outline some of the common model forms that incorpo- rate these phenomena.
The Linear Model
The simplest and most widely used model is the linear model:
The linear model has several appealing charac- teristics:
Given market data, one can use standard regression methods to estimate the parameters. The model is easy to visualize and understand.
238 ANALYSIS AND MODELING
PI: Through origin P2: Linear
P3: Decreasing returns (concave) P4: Saturation
PS: Increasing returns (convex)
P7: 'ihreshold
I P8: Super-saturation
Figure 12.5 Pictorial Representation of Saunders's (1987) Response Model Phenomena
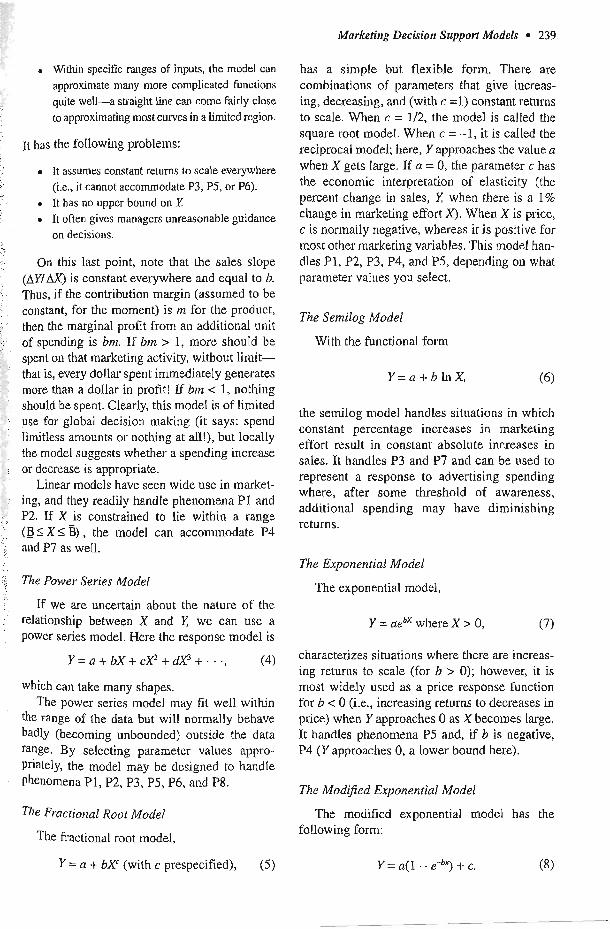
Marketing Decision Support Models * 239
Within specific ranges of inputs, the model can appro~imate many more complicated functions quite well-+ straight line can come fairly close to approximating most curves in a limited region.
It has the following problems:
o It assumes constant returns to scale everywhere (i.e.. it cannot accommodate P3, PS, or P6).
0 It has no upper bound on I! a It often gives managers unreasonable guidance
on decisions.
On this last point, note that the sales slope (AYIAX) is constant everywhere and equal to b. Thus, if the contribution margin (assumed to be constant, for the moment) is m for the product, then the marginal profit from an additional unit of spending is bm. If bm > 1, more sho111d be spent on that marketing activity, without limit- that is, every dollar spent immediately generates more than a dollar in profit! If bm < 1 , nothing should be spent. Clearly, this model is of limited use for global decision making (it says: spend limitless amounts or nothing at all!), but locally the model suggests whether a spending increase or decrease is appropriate.
Linear models have seen wide use in market- ing, and they readily handle phenomena PI and P2. If X is constrained to lie within a range (B S X S B) , the model can accom~nodate P4 and P7 as well.
The Power Series Model
If we are uncertain about the nature of the relationship between X and E: we can use a power series model. Here the response model is
which can take many shapes. The power series model may fit well w i t h
the range of the data but will normally behave badly (becoming unbounded) outside the data range. By selecting parameter values appro- priately, the model may be designed to handle phenomena PI, P2, P3, P5, P6, and PX.
Tlie Fructiotzal Root Model
The fractional root model,
Y = a + bXc (with c prespecified), ( 5 )
has a simple but flexible form. There are combinations of parameters that give increas- ing, decreasing, and (with c =I ) constant returns to scale. When c = 1/2, the model is called the square root model. When c = -1, it is cailed the reciprocal model; here, Y approaches the value a when X gets large. If a = 0, the parameter c has the economic interpretation of elasticity (the percent change in sales, E: when there is a 1% change in marketing effort X). When X is price, c is normally negative, whereas it is positive for most other marketing variables. This model han- dles PI, P2, P3, P4, and P5, depending on what parameter values you select.
The Semilog Model
With the functional form
the se~nilog mode1 handles situations in which constant percentage increases in marketing effort result in constant absolute increases in sales. It handles P3 and P7 and can be used to represent a response to advertising spending where, after some threshold of awareness, additional spending may have diminishing returns.
The Exponential Model
The exponential model,
characterizes situations where there are increas- ing returns to scaIe (for b > 0); however, it is most widely used as a price response function for b < 0 (i.e., increasing returns to decreases in price) when Y approaches 0 as X becomes large. It handles phenomena P5 and, if b is negative, P4 (Y approaches 0, a Lower bound here).
The Mod$ed Exponential Model
The modified exponential model has the following form:

240 ANALYSIS AM) MODELING
It has an upper bound or saturation level at a + c and a lower bound of c, and it shows decreasing returns to scale. The model bandles phenomena P3 and P4 and is used as a response function for selling effort; it can accommodate PI when c = 0.
The Logistic Model
Of the S-shaped models used in marketing, the logistic model i s perhaps the most common. It has the form
This model has a saturation level at a + d and has a region of increasing returns followed by decreasing return to scale; it is symmetrical around d + aI2. It handles phenomena P4 and P6, is easy to estimate, and is widely used.
The ADBUDG Model
The ADBUDG model, popularized by LittIe (1 970), has the form
The model is S-shaped for c > 1 and concave for 0 < c c 1. It is bounded between b (lower bound) and a (upper bound). The model handles phenomena PI, P3, P4. and P6, and it is used widely to model response to advertising and selling effort.
Calibration
Calibration means assigning good values to the parameters of the model. Consider the simple linear model (Equation 3). If we want to use that model, we have to assign values to o and b. We would want those values to be good ones. But what do we mean by good? A vast sta- tisticaI and economthic literature addresses this question, but we will try to address it simply and intuitively.
Calibration Goal
We want estimates of a and b tbat male the relationship Y = a + bX a good approximation of how Y varies wlth values of X, which we know something about from data or intuition.
People often use least squares regression to calibrate a model. In effect, ~f we have a number of observations of X (call them x , , x,, etc.) and associated observations of Y (called y , , y,, etc.], regression estimates of a and b are those values that minimize the sum of the squared differ- ences between each of the observed Y values and the associated "estimate" provided by the model. For example, a I- bx, would be our esti- mate of y,, and we would want y, and a + bx, to be close to each other. We may have actual data about these pars of Xs and Ys, or we may use our best judgment to generate them ("What level of sales wouId we get if our advertising was I0 times what it is now? What if it was half of what it IS now?').
When the data that we use for calibration are actual experimental or market data, we call the calibrntion task objective calibration (or objec- trve parameter estimation). When the data are subjective judg menrs, we call the task subjecfive calibrafion.
In either case, we need an idea of how well the model represents the data. One frequently used ~ndex 1s R2, or R-square. If each of the esli- mated values of Y equals the actual value of ): then R-square has a maximum value of 1; if the estimates of Y do only as well as the average of the Y values, then R-square has a value of 0. If R-square is less than 0, then we are doing worse than we would by simply assigning the average value of Y to every value of X In that case, we have a very poor model indeed!
Formally, R-square 1s defined as
(Sum of squared differences between actual Y s and estimated Y s)
I ? = = ] - (Sum of squared differences between
.(I 1)
Ys and'the average value of Y)
Example: Suppose we have run an advertising experiment across a number of regions with the following results:
Marketirtg Decisiotr Support Models 24 1
4
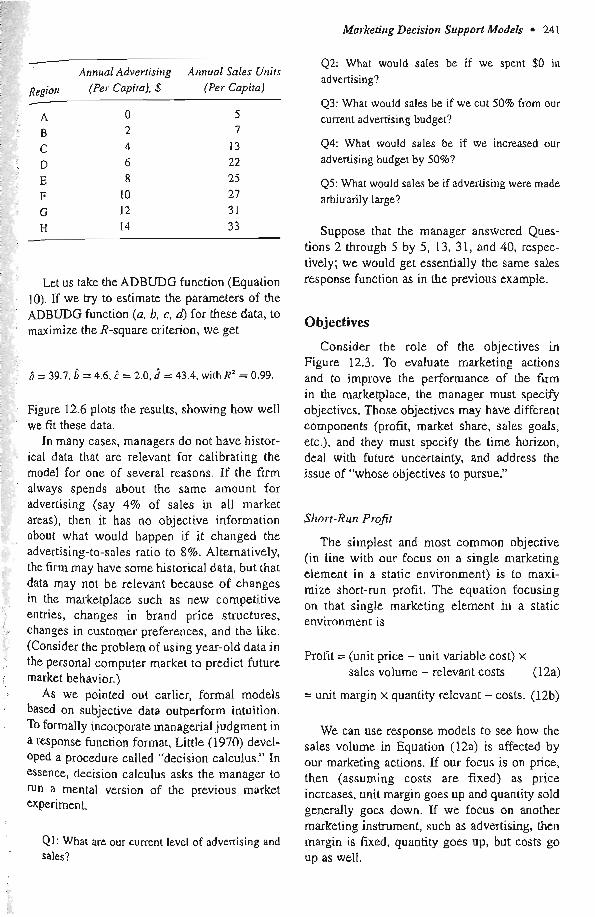
A n n u l Adver~rsing Annual Subs U~lirs Re&l (Per Capita). $ (Per Capita)
A 0 5 €3 2 7 C 4 13
D 6 22 E 8 25 F 10 27 G 12 3 1 H 14 3 3
Let us take the ADBUDG function (Equation 10). If we fry to estimate the parameters of the
. ADBUDG function (a, b, c, d) for these data, to
' maximize the R-square criterion, we get
Figure 12.6 plots the results, showing how well ' we fit these data.
In many cases, managers do not have histor- ; ical data that are relevant for calibrating the : model for one of several reasons. If the firm
always spends about the same amount for advertising (say 4% of sales in all market areas), then it has no objective information about whal would happen if it changed the advertising-to-sales ratio to 8%. Alternatively, the firm may have some historical data, but that data may not be relevant because of changes in the marketplace such as new competitive
' entries, changes in brand price structures, 1.;. changes in customer preferences. and the like. :
(Consider the problem of using year-old data in : the personal computer market to predict future , market behavior.)
As we pointed out earlier, formal models based on subjective data outperform intuition.
. To formally incorporate managerial judgment in a response function format, Little (1970) devel- Oped a procedure called "decision calculus." In essence, decision calculus asks the manager to run a mental version of the previous market experiment.
Q1: What are our current level of advertising and sales?
Q2: What would sales be if we spent $0 in advertising?
43: What would sales be if we cut 50% from our current advertising budget?
44: What would sales be if we increased our
advertising budget by SO%?
Q5: What would sales be if advertising were made arbitrarily large?
Suppose that the manager answered Ques- tions 2 through 5 by 5, 13, 31, and 40, respec- tively; we would get essentially the same sales response function as in the previous example.
Objectives
Consider the role of the objectives in Figure 12.3. To evaluate marketing actions and to improve the performance of h e firm in the marketplace, the manager must specify objectives. Those objectives may have different components (profit, market share, sales goals, etc.), and they must specify the time horizon, deal with future uncertainty, and address the issue of "whose objectives to pursue."
Sliort-Run Profit
The simplest and most common objective (in line with our focus on a single marketing element in a static environment) is to maxi- mize short-run profit. The equation focusing on that single marketing element in a static environment is
Profil= (unit price - unit variable cost) x sales volume - relevant costs (124
= unit margin x quantity relevant - costs. (12b)
We can use response models to see how the sales volume in Equation (124 is affected by our marketing actions. Lf our focus is on price, then (assuming costs are fixed) as price increases, unit margin goes up and quantity sold generally goes down. If we focus on another marketing instrument, sucb as advertising, then margin is fixed, quantity goes up, but costs go up as well.

242 ANALYSIS AND MODELING
Sales Response Function
0 I I
$ 0 $2 $4 $6 $8 UO $12 Advertising
+ Actual + Fit
Figure 12.6 Calibration Example Using ADBUDG Function, With R2 = 0.99
Relevant costs generally consist of two com- ponents: fixed and discretionary. Discretionary costs are those associated with the marketing activity under study and should always be con- sidered. Fixed costs include those plant and overhead expenditures that should be appropri- ately aIlocated to the marketing activity. Allocating fixed costs is thorny and difficult; it keeps accountants employed and frequently frustrates managers of profit centers.
For our purposes, only two questions are relevant concerning fixed costs:
Are the fixed costs really fixed? Suppose that tripling advertising spending leads to a 50% sales increase, leading in turn to the need to increase plant size. These costs of capacity expansion must be taken into account. Nor- mally, fixed costs are locally fixed; that is, they are fixed within the limits of certain levels of demand and shift to different levels outside those regions. As with our response models, as long as we focus locally, most fixed costs are indeed fixed.
Are profits greater than fixed costs? If the allocated fixed costs are high enough, absolute profitability may be negative. In this case, the decision maker may want to consider dropping the product, not entering the market, or some other action.
Long-Run Profit
If a marketing action or set of actions causes sales that are realized over time, we may want to consider profit over a longer time horizon. If we look at the profit stream over time, then an appropriate way to deal with long-run profits is to take the present value of that profit stream:
where Z, is the profit for period i, and r = 1/(1 + 4, with d being the discount rate. The discount rate d is often a critical variable; the closer d is to 0, the more oriented to the long term the firm is, whereas a high value of d (over -25 or so)
Marketitzg Decision Support Models 0 243
reflects a focus on more immediate returns. In practice, the more certain the earnings flow, the lower the discount rate that firms use.
Dealitlg With Uncertainty
Managers know few outcomes of marketing actions with certainty.
Consider the following example: Conglomerate, Inc., is considering two
possible courses of action: continuing with its current laser pointer, whose profit of $100,000 for the next year is known (almost for sure), or bringing out a replacement that would yield a profit of $400,000 if it is successful (1ikeIihood = 50%) or a loss of $100,000 if it is unsuccess- ful (likelihood = 50%). What should it do?
If the firm had lots of money and the ability to make many decisions of this type, on average it would make 50% x $400,000 + 50% x ($100,000) or $150,000 with the new product, and so it seems clear that this is the better deci- sion. But if the firm (like capital markets) values more certain returns over less certain ones, then the decision is not that clear. What about a $310,000 gain versus the $100,000 loss for an average gain of $105,000 but a 50% chance of losing $100,000? Is it worth the risk?
Suppose that Conglomerate's managers would be just indifferent between the 50-50 chance of a $400,000 profit or a $100,000 loss and a $125,000 gain for sure. We calt the $125,000 in this case the certainty monetary equivalent for the risky investment. The differ- ence between the average gain ($150,000) and the certainty monetary equivalent ($125,000) is called the risk premium.
Either formally through utility theory (Lilien et al., 1992) or info~mally by applying some com- bination of high discount rates or risk premiums,
' Conglomerate's managers should incorporate their attitude toward risk in evaluating potential actions when the outcomes are uncertain.
Mliltiple Goals
Although profit of some sort is an ovel~iding : goal of many organizations, it is not the only
factor managers consider in trying to decide among possible courses of action. Managers may say, "We want to maximize our market share and our profitability in this market!" or
"We want to bring out the best product in the shortest possible time." Such statements are attractive rhetoric but faulty logic. For example, one can almost always increase market share by lowering price; after some point, however, profit will be decreasing while market share continues to increase. And when price becomes lower than cost, profit becomes negative even though market share is still increasing!
If a firm has two or more objectives that possibly conflict, how can the decision maker weight those goals to rank them unambiguously? A sophisticated branch of analysis called rnulti- criteria declsion making deals with this problem. The sinlplest and most common approach is to choose one (the most important) objective and to make all the others constraints; then manage- ment optimizes one (e.g., a profit criterion) while considering others to be constraints (e.g., marltet share must be at least 14%).
A second approach is goal programming, in which managers set targets for each objective, specify a loss associated with the difference between the target and actual performance, and try to minimize that loss. Trade-off analysis (Keeney & Raiffa, 1976) and the analytic hier- achy process (Lilien & Rangaswarny, 2004, chap. 6) are additional procedures for handling multiple objectives and trade-offs among objec- tives. Ragsdale (2000) provides a nice discus- sion of how to implement multiobjective optimization in a spreadsheet framework.
Whether you use a simple formal method, such as the approach employing a single goal plus constraints, ox a more sophisticated method of dealing with trade-offs among goals, it is crit- ical that you neither ignore nor poorly assess important goals.
After you have specified goals or objectives, the ME approach facilitates the process of deci- sion making-suggesting those values of the independent variables (such as level of advertis- ing, selling effort, or promotional spending) that will best achieve these goals(s) (such as maximize profit, meet target levels of sales, or maximize market share).
Multiple Marketing-Mix Elements: Interactions
In the section on calibration, we dealt with market response models of one variable. When
244 ANALYSlS AND MODELING
we consider multiple marketing-mix variables, we should account for their interactions. As Saunders (1987) points out, interactions are usually treated in one of three ways: (1) by assuming they do not exist, (2) by assuming that they are muitiplicative, or (3) by assuming they a e multiplicative and additive. For example. if we have two marketing-mix variables XI and X, with individual response functions f (XI) and g (X,), then assumption (1) gives us
Assumption (2) gives us
And assumption (3) gives us
In practice, when multiple marketing-mix ele- ments x e involved, we can resort to one of two forms: the (full) linear interactive form or the mul- tiplicative form. The full linear interactive model (for two variables) takes the following form:
Note here that AYIAX, = b + dX,, so that sales response to changes in marketing-mix element XI is affected by the level of the second variable, X,.
The multiplicative form is as follows:
Here, AYIAX, = abXflX; so that the change in the response at any point is a function of the levels of both independent variables. Note here that b and c are the constant elasticities of the first and second marketing-mix variables, respectively, at all effort levels XI and X,.
Dynamic Effects
Response to marketing actions does not often take place instantly. The effect of an ad campaign does not end when that campaign is over; the effect, or part of if will continue in a diminished way for some b e , Many customers purchase more than they can consume of a
product during a short-term price promotion.: This action leads to inventoly buildup in cus-. torners' homes and lower sales in subsequent periods. Furthermore, the effect of that s a b promotion will depend on how much inventoly buildup occurred in past periods (i.e., how much potential buildup is left). If customers stocked up on Brand A cola last week, a new promotion this week is likely to be less effective than one a long period after the last such promotion.
Carryover effects is the general term used to describe the influence of a current market- ing expenditure on sales in future periods' (Figure 12.7). We can distinguish severaI types of canyover effects. One type, the delayed- response effect, arises from deIays between when marketing dollars are spent and their impact. Delayed response is often evident in industrial markets, where the delay, especially for capital equipment, can be a year or more. Another type of effect, the customer holdover effect, arisdi when new customers created by the marketing expenditures remain customers for many subse- quent periods. Their later purchases should be credited to some extent to the earlier matketing expenditures, Some percentage of such new customers will be retained in each subsequent period; this phenomenon gives rise to the notion- of the customer retention rate and its converse, the customer decay rate (also called the attrition or erosion rate).
A third form of delayed response is hystere- sis, the asymmetry in sales buildup compared with sales decline. For example, sales may rise quickly when an advertising program begins and then remain the same or decline slowIy after the program ends. New hjer effects, in which sales reach a
peak before settling down to steady state, a& common for frequently purchased products, for which many customers try a new brand b i t only a few become regular users. . ,
Stocking effects occur when a sales prd; motion not only attracts new customers but also encourages existing customers to stock up O r
buy ahead. The stocking effect often leads to a sales trough in the period following the promo- tion (Figure 12.7). The most common dynamic or carryover-effect model used in marketing is

Marketing Decision Srcpport Models 245
Spending Level
1. Marketing Effort e.g., Sales Promotion T - I t
---L-_-_-----_.----__-- ----..---" - - - - - - - - - Time
Sales - - - - - - - - - - - - - -
2. conventions, pi\ 1 "delayed response" and "customer holdout" effects - - - - - . - - - - - - - - - - - - - - * - - - - - - - - - - - - - Time
Sales A
3. "Hysteresis effect" ; , I
- - - - - - - - " - - - - - - - - - - - - - - - - - - - - - - - - - - :- 1 Time
Sales
I
4. "New trier" I t
'hear out" effect I I
I I I
+ Time
Sales
Figure 12.7 Some Types of Dynamic Marketing Responses
Sourre: Saunders (1987, p. 33).
Equation (19) says that sales at time i (Y,) are Market-Share Models made up of a constant minimum base (a,), an and Competitive Effects effect of current activity a,X,, and a proportion of last period's sales (h) that carries over to this period. Note that Y, is influenced to some extent by all previous effort levels X,- ,, X,- , . . ., X0 because Y, -, depends on X,- , and Y,- ,, and in turn, Y,-, depends on X,-, and Y,-, and so on.
simple form of Equation (19) makes Cali-
Thus far, we have ignored the effect of com- petition in our models, assuming that product sales result directly from marketing activities. Yet, if the set of product choices characterizing a market is well defined, we can specify three types of models that might be appropriate:
bration easy-managers can either guess h dkectly as the proportion of sales that carries Brand sales models (Y) Over from one period to the next or estimate it 8 Product class sales models (V)
by Using linear regression. 0 Market-share models (M)
246 ANALYSIS AND MODELING
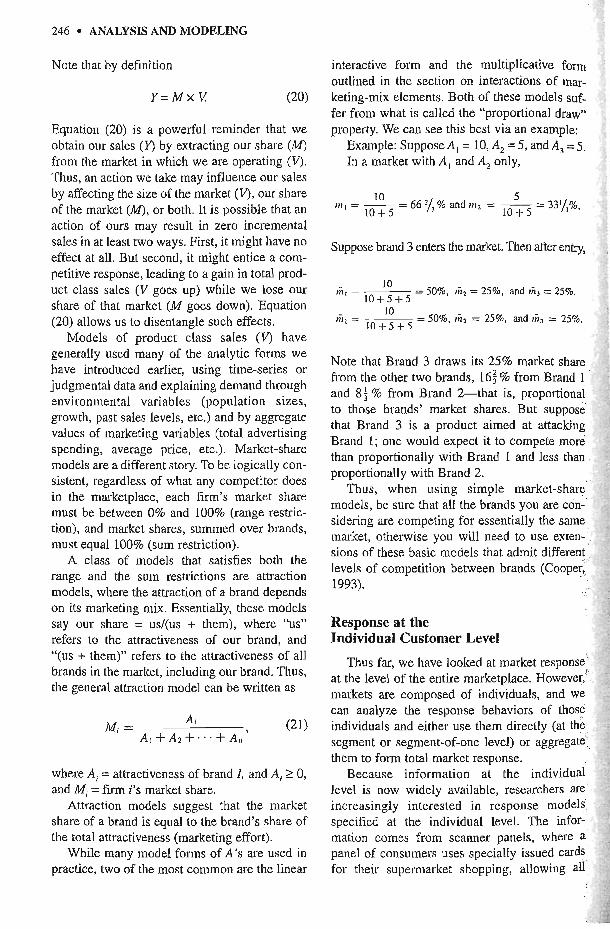
Note that by definition
Equation (20) is a powerful reminder that we obtain our sales (Y) by extracting our share (M) from the market in which we are operating (V). Thus, an action we take may influence our sales by affecting the size of the market (V), our share of the market (M), or both. It is possible that an action of ours may result in zero incremental sales in at least two ways. First, it might have no effect at all. But second, it might entice a com- petitive response, leading to a gain in total prod- uct class sales (V goes up) while we lose our share of that market (M goes down). Equation (20) allows us to disentangle such effects.
Models of product class sales (V) have generally used many of the analytic forms we have introduced earlier, using time-series or judgmental data and explaining demand through environmental variables (population sizes, growth, past sales levels, etc.) and by aggregate values of marketing variabIes (total advertising spending, average price, etc.). Market-share models are a different story. To be logically con- sistent, regardless of what any competitor does in the marketplace, each firm's market share must be between 0% and 100% (range restric- tion), and market shares, summed over brands, must equal 100% (sum restriction).
A class of models that satisfies both the range and the sum restrictions are attraction models, where the attraction of a brand depends on its marketing mix. Essentially, these models say our share = us/(us + them), where "us" refers to the attractiveness of our brand, and "(us + them)" refers to the attractiveness of a11 brands in the market, including our brand. Thus, the general attraction model can be written as
where A, = attractiveness of brand I, and Ai 2 0, and Mi = fwm i's market share.
Attraction models suggest that the market share of a brand is equal to the brand's share of the total attractiveness (marketing effort).
While many model forms of A's are used in practice, two of the most common are the linear
interactive foim and the multiplicative form ' outlined in the section on interactions of mar- keting-mix elements. Both of these models suf- fer from what is called the "proportional draw" property. We can see this best via an example:
Example: Suppose A, = 10, A, = 5, and A, = 5. In a market with A, and A, only,
10 5 Inl = - = 66 % % and rlrz = - -
10+5 lo + 5 - 33'13%.
Suppose brand 3 enters the market. Then aRer entry,
10 - 50%, inl = 25%. and = 25%. ~ n , = - -
10+5+5 10
m, = = 50%. t i l = 2 5 6 , and G, = 25%. , I O + 5 + 5
Note that Brand 3 draws its 25% market share from the other two brands, 16: % from Brand 1 and 8; % from Brand 2-that is, proportional to those brands' market shares. But suppose that Brand 3 is a product aimed at attacking Brand 1; one would expect it to compete more than proportionally with Brand I and Iess than proportionally with Brand 2.
Thus, when using simple market-share models, be sure that all the brands you are con- sidering are competing for essentially the same market, otherwise you will need to use exten- sions of these basic models that admit different levels of competition between brands (Cooper, 1993).
Response at the Individual Customer Level
Thus far, we have looked at market response* at the level of the entire marketplace. However, markets are composed of individuals, and we can analyze the response behaviors of those individuals and either use them directly (at the segment or segment-of-one level) or aggregate them to folm total muket response.
Because information at the individual level is now widely available, researchers are increasingly interested in response models specified at the individual level. The infor- mation comes from scanner panels, where a panel of consumers uses speciaIIy issued cards for their supermarket shopping, allowing all
Marketing Decision Support Models 247
purchase information~aptured by bar-code scnnner~-by that consumex to be stored and tracked; database marketing activities, which ,,pture purchase information at the individual level; and other sources such as customer rela- tionship management (CRM) databases and Web logs.
Whereas aggregate market response models focus, appropr~ately, either on brand sales or market share, modeIs at the individual level focus on purchase probabihty. Purchase pro- bability at the ind~vidual level 1s equivalent to market share a1 the market level; indeed, by summing purchase probabilities across indi- viduals (suitably weighled for individual differ- ences in purchase quant~ties, purchase timing, and the like), one gets an estlrnate of market share. Hence, it should not be surprising that the mosl commonly used individual response modeis have forms that are like Equation (21), our general market-share response model. At the individual level, the denominator represents all those brands tha~ an individual is w~lling to consider before making a purchase.
The specific functional form most com- a ~nonly used to characterize individual choice
behavior is the mulnnornial logit model (MNL) This model is derived from a strong theoretlcd framework, which assumes that each customer i's ut~lities for each alternative product varies randomly (according to a well-specified distrib- ution) from one purchase occaslon to another but that each customer always chooses the alter- native that provides the highest utility on each pu~chase occasion (see Chapter 14, this volume, for a more complete description of the MNL model). The MNL model has been widely used in various marketing applications.
A simple form of the multinomial logit model is
',
- . where
A4 = attractiveness of product j for individual i
bii, = individual i's evaluation of producl j on product attribute k (product quality, for example), where the summation is over all products that individual i is considering purchasing; and
w,= importance weight associated with attribute k in Forming product preferences.
Choosing, Evaluating, and Benefiting horn a Marlceting Response Model
The model forms we have described in this chapter present a number of wade-offs. One model form is not better than another. Each is good in some situations and for some pur- poses. We need to consider the model's use. Although a number of criteria are usefuf in selecting a model, here are four we suggest that apply specifically to response models.
Model Specification
Does the model include the right variables to represent the decision situation? k e the variables, ns represented, managerially actionable? Does the model incorporate the expected behavior of individual variables (e.g., dimin- ishing returns, carryover effects, or threshold effects)? Does the model incorporate the expected rela- tionships between variables (e.g., patterns of substitutability and complementnrity)?
Model Calibration
Can the model be calibrated by using data from managerial judgment or historical data or through experimentation?
Model Validity and Val~re
Does the level of detail in the model match that in the available data? Does the model reproduce the current market environment reasonably accurately? Does the model provide value-in-use to the user? Does the model represent the phenomenon of interest accurately and completely?

248 ANALYSIS AND MODELING
Model Usability
Is the model easy to use? (Is it simple, does it
convey results in an understandable manner, and does it permit users to control its operation?) Is the model, ns implemented, easy to understand? Does the model give managers guidance that makes sense?
When we select a model, we can summarize these criteria in one question: "Does this model make sense for tbis situation?'That is, does the model have the tight form, can it be calibrated, is i t valid, and is it useful? If the answers are all yes, then the model is appropriate.
Marketing engineering succeeds because of sophisticated managers, not: because of sophis- ticated models. Such managers recognize that decisions affect many stakeholders and that people resist change and will not embrace deci- sion processes they do not understand or deci- sions not favorable to their interests. Therefore, developing good decisions is only half the chal- lenge. It is just as important to make those deci- sions acceptable to stakeholders within a firm, recalling that model users and decision makers rnay be dL€ferent. Models can also help people understand and accept decisions: Models improve communications among the stakeholders.
By clearly stating model assumptions and understanding the results, managers can replace positions with principles: Instead of saying "Let's do X," one might say '7 believe that our objective should be A, and based on the model, X is a good way to achieve that objective." If the process of articulating model assumptions is orchestrated well, discussion will focus on the merits of those assumptions rather than on the appropriateness or validity of the model out- put. Models ace particularly useful when they help change mental models by challenging the assumptions or beliefs underlying those mental models. A model also provides an explicit mechanism for including stakeholders in the decision process. For example, at Syntex Labs,
I the stakeholders participated by providing
I inputs to the model and by helping Implement model results (Lodish et ai., 1988). Managers i are more lrkely to accept decisions resulting i from a model if they know their Inputs and 1 judgmenls are part of the process. The following tips and suggestions should help to increase i the likelihood of your achieving success wtlh ; marketing engineering. I
I
Tips and Suggestions I
Be Opportunistic
Select problems or issues that have a good chance of rapid and demonstrable success. i
Start Slmple, and Keep It Simple
It is best to start with problems that x e understandable and familiar to the stakeholders.
Work Backward-Begin With the End Goal of the Modeling in Mind
Start with an understanding of the goal of the modeling effort. For example, is it to pro- vide justification for a course of action? Is it to '
resolve an issue for which judgment seems to be '
madequate? Is it to facilitate a team decision?
Sc01-e Inexpensive Vctories
Look for areas in which the costs of model development are low compared with potential ,,
benefits.
Develop a Program, Not Just Projects
One-off projects, though useful, do not have the same impact as a programmatic engagement in marketing engineering
A Look Ahead
To improve their performance and future .
prospects, firms are investing heavily in infor- mation technology infrastructures Linked to com- munication networks. The marketing function is also undergoing fundamental transformations
Marketing Decision Support Modek 249
because of these technologies: The marketing operatloris of direct mail frrrns depend on toll- f e e telephone systems for sales and support;
keep in touch with customers and headquarters using laptop computers; large retailers cannot survive without online price- jookup systems. Firms today install computers and software everywhere, not just in their back offices. Yet many marketing managers continue to make decisions in the traditional, old- fashioned way, withour using the information and decision-aiding technologies that are already available. Some firms have recognized that one of their most important assets is relevant infor- mation whose business implications decision makers can interpret in a timely manner. To take advantage of the data and information already available to them, firms are integrating decision- aiding technologies into the fabric of their day-to-day operations and decisions. Many fmrns now use sophisticated marketing analytics for several types of decisions, including fine-tuning of their direct marketing campaigns, profiling their users/nonusers on an ongoing basis, replen- ishing their inventories in real time, or identify- ing cross-sell oppartuni ties. Examples described in the public domain include Wal-Marl ("9111 Timeline," 2002), Travelocity (Klebnikov, 2001), and Harbor Freight, Inc. (Kitts, Vrieze, & Freed, 2005).
We expect that during the next decade, the major developments in technologies to support marketing decisions will be geared to helping lnanagers process the information that is already available to them: to filter the relevant from the irrelevant and to draw out lnsights from infor- mation. Many large firms are putting together a new corporate activity called Marketing Infor- mation Systems (MKIS) to support and enhance enterprise-wide performance using marketing information. Although the concept of MKIS has existed for a number of years (see, e.g., Gtler, 1966), the scope and potential value of the present-day MKlS is far greater than was envisioned in those early days, MKIS, typically located within the market-
ing department, is charged with harnessing marketing-related information and distributing and Facilitating its use within the firm. Even as the marketing function seems to be in decline, the marketing concept itself appears to be
gaining wider acceptance i n firms (Doyle, 1995). Marketing is becoming an enterprise- wide activity rather than the exclusive domain of a specific department. Firms see M S as a way to use marketing information to make everyone i n the firm realize that they must be more responsive to customer needs and wants and to the competitive environment.
Historically, a major function of information systems has been to provide timely access to information. MKIS can now integrate end-user decision models with traditional information systems to enhance the firm's ability to use mar- keting engineering. Seven current trends favor this integration of information. Firms are
1. investing in the infrastructure they need to develop and maintain extensive corporate databases (also called data warehouses);
2, using online analytical processing (OLAP) to integrate data retrieval and modeling capabili- ties with databases;
3. exploring the application service provider (ASP) mode1 to increase the value and flexibil- ity of their data and models by making them more widely accessible (on an as-needed basis) among employees, as well as among vendors and strategic partners;
4. deploying intelligent systems to automate some modeling tasks;
5. developing computer simulations for decision training and for e x p I o ~ g multiple decision options;
6. installing groupware systems, such as Lotus Notes, to support group decision making; and
7, enhancing user interfaces to make it easier to deploy even complex models more widely.
We focus on Development 3 below; for detailed discussion of the others, see Lilien and Rangaswarny (2004).
Application Service PI-oviders for Analytics
An exciting new development that will greatly expand OLAP capabilities is the erner- gence of ASPS (Application Service Providers) that offer onl.ine access to various types of

250 ANALYSIS AND MODELING
- 1 hltp: Request
Browser for a Model Client Server
(Model (Model
User) http: ~esponse
AcliveX control RPc/ wC\ (user it-ilerface)
Application Server Sewer (Model (Data
Procedure Call)
Figure 12.8 Implementing the ASP Approach for Market Enginering
Nore: Thc figure outlines one way to implemeot b e Application Service Provider (ASP) appmoch for marketing engineering. Models, data, and user interfaces, which are combined together in traditional marketing models, are decoupled in a Web environment. This enables any Internel user LO have more flexibility in conducting marketing analyses and interpretations nnywhere, anytime.
knowledge resources (software, data. content, and models). ASPS convert knowledge resources into services (e.g., analytics, process control) accessible over the Web, instead of being pack- aged as products and systems. For example, salesforce.com is attempting to create a viable ASP model for sales force automation by offer- ing such online services as contact management, forecasting, e-mail communications, customiz- able reports, and synchronization with wireless devices. These services are made possible by dynamically linking data retrieval and analysis software to various databases. Figure 12.8 shows one way to implement an ASP for andyt- ical support. With these developments, there is an emerging capability for offering marketing analy tics to anyone, anytime, anywhere. Lilien and Rangaswamy (2000) discuss in more detail the value and implications of these develop- ments for marketing modeling.
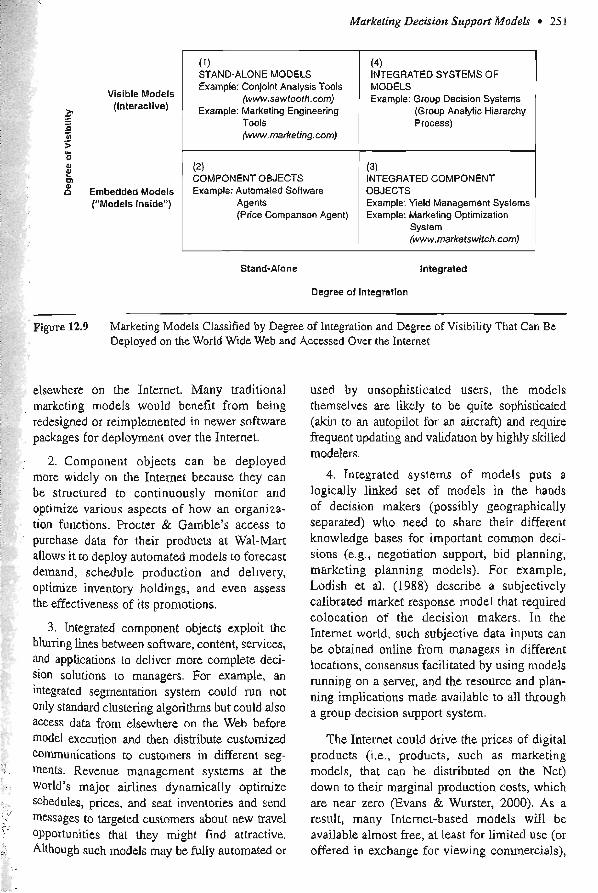
Figure 12.9 summarizes our beliefs about how the Internet and ASPS wiU influence marketing modeling in the years ahead. We classify market- ing models along two dimensions: On the hori- zontal axis (degree of integration), we distinguish between stand-alone models (e.g., supporting a single user for a single task) on one extreme and those that are integrated with organizational processes, databases, and other aspects of the decision environment at the other extreme (e.g., single user, multiple tasks; multiple users, single
task). On the vertical axis (degree of visibility), we distinguish between models that are embed- ded inside systems (i.e., a "black-box model" that works in the background) requiring few inputs or interactions with the user and those that are highly interactive and whose structures are visi- ble. We discuss below four categories of models that fall at the extremes of these two dimensions and indicate how the emerging necworked econ- omy will encourage their use:
1. Visible stand-alone models can be put on application servers (several ASPS already do this--e.g., www.marketswitch.com) and accessed by client browsers. In such an environment, software renditions of marketing models can be maintained i n central locations, minimizing costs of updates and distribution. Model users also benefit because they will always have access to the latest versions of the sohare . Visible models with user interactions can also become more valuable online. For example, applications ranging from simple computa- tional devices, such as mortgage calculators (www.jeacle.ie/rnortgage), to sophisticated programs, such as conjoint analysis (WWW
.marketingIQ.com), are available on a 2417 basis. These applications are supported with online technical help (as we11 as live support), improved content (help files, tutorials, etc.), and linked to related applications that are available
. -<
Marketi~tg Decision Support Modek 25 1
Visible Models
Q 2 m $ Embedded Models
("Models Inside")
(1) STAND-ALONE MODELS Example: Conjolnt Analysis Tools
@wv.sawtooth.com) Example: Marketing Engineering
Tools (wwwmarketing. corn)
(4) INTEGRATED SYSTEMS OF MODELS Example: Group Decision Systems
(Group Analytic Hierarchy Process)
(2) COMPONENT OBJECTS Example: Automated Sofhvare
Agents (Price Cornpanson Agent)
(3) INTEGRATED COMPONENT OBJECTS Example: Yield Management Systems Example: Marketing Optimization
System (www.marketswitch.com)
Stand-Alane Integrated
Degree of lntegratlon
Figure 12.9 Marketing Models Classified by Degree of Integration and Degree of Visibility That Can Be Deployed on the World Wide Web and Accessed Over the Internet
elsewhere on the Internet. Many traditional marketing models would benefit from being redesigned or reimplemented in newer software packages for deployment over the Internet,
2. Component objects can be deployed more widely an the Internet because they can be structured to continuously monitor and optimize various aspects of how an organiza- tion functions. Procter & Gamble's access to purchase data for their products at Wal-Mart allows it to deploy automated models to forecast demand, schedule production and delivery, optimize inventory holdings, and even assess the effectiveness of its promotions.
3. htegrated component objects expIoit the blulrjng lines between software, content, services, md applications to deliver more complete deci- sion solutions to managers. For example, an integrated segmentation system could run not only standard clustering algorithms but could also access data from elsewhere on the Web before model execution and then distribute customized communications to customers in different seg- ments. Revenue management systems at the world's major airlines dynamically optimize schedules, prices, and seat inventories and send messages to targeted customers about new travel Opportunities that they might find attractive. Akhough such models may be fully automated or
used by unsophisticated users, the models themselves are likely to be quite sophisticated (akin to an autopilot for an aircraft) and require frequent updating and validation by highly skilled modelers.
4. Integrated systems of models puts a logically Iinked set of models in the hands of decision makers (possibly geographically separated) who need to share their different knowledge bases for important common deci- sions (e.g., negotiation support, bid planning, marketing planning models). For example, Lodish et al. (1988) describe a subjectively calibrated market response model that required colocation of the decision makers. In the Internet world, such subjective data inputs can be obtained online from managers in different locations, consensus facilitated by using models running on a server, and the resource and plan- ning implications made available to all through a group decision support system.
The Internet could drive the prices of digital products (i.e., products, such as marketing models, that can be distributed on the Net) down to their marginal production costs, which are near zero (Evans & Wurster, 2000). As a result, many Internet-based models will be available almost free, at least for limited use (or offered in exchange for viewing commercials),

252 0 ANALYSTS AND MODELING
Modeling technology
decision models
are plus decision models
Markellng O U P plus \ dec Ion models
Marketmg Engineering tomorrow
aenerbl p u y a a s s i s tools fe.n. SPSS, L ackasesl
Model / / ., &-* user
/ * "",",";,";::?' lineering)
Ik- /
"/ 0 *f a? % %*
Q! *,
Declsion B s u p "".y
tasks 4
Figure 12.10 An Overview of the Evolution of Marketing Engineering to Support a Wider Range of Users and Decision Tasks Using Emerging Technologies
making them even more attractive for analysts and managerial users alike. Thus, over the next decade, we expect an explosion in the avail- abiIity of customizable, scalable, and (possibly) embedded decision models on the Internet, available anytime. anywhere, for anyone.
To conclude, Figure 12.10 summarizes our vision of the evolution of marketing engineering along three dimensions: (1) the type of user who uses models, (2) the type of decision tasks supported, and (3) the modeling technologies that enhance marketing engineering. Until the mid- 1980s, marketing engineering was carried out primarily by analysts who submitted reports to managers. Those analysts used general- purpose analysis programs running on mainframe
computers (e.g., statistical packages such as SPSS and linear programming packages) to generate forecasts and develop plans for opti- mally deploying organizational resources. The growth of personal computers has put man- agers in direct control (e.g., through spread- sheet models focused on specific decision areas), permitting richer manager-model inter- actions (e.g., simulations based on what-if analyses). Ln the future, marketing engineering will support a broadening range of users (e.g., customer service representatives) using a wider range of technologies (e.g., OLAP, intelli- gent systems, groupware systems) to enhance decision making by richer means (e.g., using simulation to explain market events).
Marlcefittg Decision Support Models 253
While the marketing function in companies may decline in importance in the years to come,
as a discipline can only increase i n importance. Years ago, Peter Drucker pointed out that marketing is too important to be left to marketers; that statement is even more true today. Marketing engineering, a bridge between conceptual marketing and disciplined, system- atic marketing, is poised to take its place among the critical management took for the successful 21 st-century fum.
postscript
To keep up to date about the concepts, tools, and models discussed in this chapter, visit www.mktgeng.com and www.marketing 1Q.com. More detail on the concepts and access to a full suite of marketing engineering soft- ware is available in Lilien and Rangaswamy (2004).
-- -
Assad, A. A., Wasil, E. A., & Lilien, G. L. (Eds.). (1992). Excellence in management science prac- tice. Englewood Cliffs, NJ: Prentice Hall.
Bazexman, M. (1998). Judgment in managerial deci- sion making. New York: John Wiley.
Blattberg, R. C., & Hoch, S. J. (1990). Database mod- els and managerial intuition: 50 percent mode! and 50 percent manager. Management Science, 36(8), 887-899.
Bucklin, R. E., Lehman, D. R., & Little, J. D. C. (1998). From decision support to decision automation: A 2020 vision. Marketing Letters, 9(3), 235-246.
Burke, R. R., Rangaswamy, A., Wind. J., & Eliashberg, J. (1990). A knowledge-based sys- tem for advertising design. Marketing Science, 9(3), 2 12-229.
Cooper. R. G. (1993). Winning at new products (2nd ed.). Reading, MA: Addison-Wesley.
Dolan, R. J., & Simon, H. (1996). Power pricing. New York: Free Press.
Doyle, P. (1995). Marketing in the new millennium. Ellropean Journal of Marketing, 29(13), 23-41..
Elsner, R., Krafft, M., & Huchzermeier, A. (2004). Optimizing Rhenania's direct marketing business
through dynamic multilevel modeling (DMLM) in a multicatalog-brand environment. Marketing Science, 23(2), 192-206.
Evans, P., & Wurster, T. S. (2000). Blown to bits: How the new econontics of information transforms strategy. Boston: Harvard Business School Press.
Gensch, D. H., Aversa, N., & Moore, S. P. (1990). A choice-modeling market information system that enabled ABB Electric to expand its market share. Interfaces, 20(1), 6-25.
Hogarth, R. M. (1987). Judgment and choice (2nd ed.). New York: John Wiley.
IDC. (2005). World wide marketing automation applications 2005-2009 forecast. Retrieved October 20,2005, from www.idc.com
Keeney, R. L., & Raiffa, H. (1 976). Decisions with mrrltiple objectives: Preferences and value tradeoffs. New York: John Wiley.
Kitts, B., Vrieze, M., & Freed, D. (2005, June). Product targeting from rare events: Five yews of one to one marketing at CPI. Paper pre- sented at the Marketing Science conference, Atlanta, GA.
Klebnikov, P. (2001, July 9). The resurrection of the NCR. Forbes, p. 70.
Kotler, P. (1966). A design for the ftrm's marketing nerve center. Business Horizons, 9(3), 63-74.
Lilien, G. L., Kotler, P., & Moorthy, K. S. (1992). Marketing models. Englewood Cliffs, NJ: Prentice Hall.
Lilien, G. L., & Rangaswamy, A. (2000). Modeled to bits: Decision models for the digital, networked economy. International Journal of Research in Marketing, 17, 227-235.
Lilien, G. L., & Rangaswamy, A. (Eds.). (2001). Marketing engineering [Special issue]. Inter- faces, 31(3, Part 2 of 2).
Lilien, G. L., & Rangaswamy, A. (2004). Marketing engineering: Computer-assisted marketing analysis and planning (Rev. 2nd ed.) . Victoria, British Columbia: TraFford Press.
Little, J. D. C. (1970). Models and managers: The concept of a decision calculus. Management Science, 16(8), B466-B485.
Lodish, L. M., Curtis, E., Ness, M., & Simpson, M. K. (1988). Sales force sizing and deployment using a decision calculus model at Syntex Laboratories. Intetfaces, 18(1). 5-20.
9/11 timeline. Christian Science Monitor. (2002, March 1 1 ) .

254 ANALYSIS AND MODELLNG
Ragsdale, C. T. (2000). Spreadsheet modeling and decision analysis (3rd ed.). Cincinnati, OH: Course Technology, South-Western.
Russo, J. E., & Shoemaker, P. J. H. (1989). Decision traps. New York: Simon & Schuster.
Saunders, 1. (1987). The specification of aggregate market models. European Jorirnal of Marketing, 21(2), 1-47.
Schmitz, J. D., Acmsuong, G. D., & Little, J. D. C. (1990). Coverstory: Automated news finding in marketing. In L. Bolino (Ed.), DSS transacrions
@p. 46-54). Providence, RI: TIMS College on Information Systems.
Staelin, R. (Ed.). (1999). Managerial decision making [Special issue]. Marketing Science, 18(3).
Wierenga, B. , & Van Bruggen, G. H. (2000). Mar- keting management support systems: P~-it~ciples, tools and imple~nentation. Boston: Rluwer.
Wind, J.. Green, P. E., Shifflet, D., & Scarbrough, M. (1989). Courtyard by Marriott: Designing a , hotel facility with consurner-based marketing . models. Inteq'aces, 19(1), 25-47.